Abstract
Air and seawater samples were collected in 2022–2023 and analyzed through a common DNA extraction, purification, and Next-Generation Sequencing protocol. The study targeted bacteria, archaea, fungi, and plant-associated taxa to compare community structure across both milieus. Given the scarcity of data on environmental microbiomes in Greece, we aimed to investigate further the diversity and variability of these microbiomes for the first time, using barcoding to provide data on microbial signatures in the air and seawater. Sequencing data revealed significant spatial and seasonal variability and a high diversity and richness of microbiome communities in both habitats. After quality filtering, we detected 21 phyla and 345 genera of bacteria and archaea, 3 phyla and 149 genera of fungi, and 17 Viridiplantae orders in the urban air. At the same time, in the recreational waters, we isolated 20 phyla and 420 genera of bacteria and archaea, 2 phyla, and 53 genera of fungi and 19 orders of Viridiplantae. Many of the fungal and bacterial taxa detected in this study can be potentially pathogenic. These findings highlight the potential of DNA barcoding as a reliable tool for integrative environmental monitoring, offering insights into the composition of environmental microbiomes. Microbiome monitoring is valuable for the environment and health, and it will be more efficient by integrating DNA analysis with the development of open databases and artificial intelligence.
Keywords:
bioaerosols; marine microbiome; bacteria; fungi; DNA barcoding; pathogens; microbial diversity; Greece 1. Introduction
Bioaerosols, including airborne bacteria and fungi are significant pollutants affecting both indoor and outdoor air quality, with implications for human health. Bioaerosols refer to airborne particles suspended in the air and may contain (i) intact living or dead microorganisms; (ii) microbial spores (resistant reproductive structures produced by many fungi and some bacteria); and (iii) fragments of microorganisms and larger organisms (e.g., skin scales, pollen, and plant fragments). Bioaerosols also serve as vectors for pathogenic agents and allergens [1].
All four of the major classes of fungi are represented in the sea, and marine bacteria include photosynthetic and chemosynthetic species, as well as aerobic and anaerobic heterotrophs. Thus, there is little, apart from their ecology, to distinguish marine microorganisms from those of terrestrial habitats [2]. Fungi in the marine habitat are increasingly recognized for their ecological significance and diversity [3]. Planktonic marine fungi, such as members of the Ascomycota, Basidiomycota phyla, have been identified in every major oceanographic region and are hypothesized to contribute to carbon turnover through parasitism of phytoplankton [4].
Some studies described the important biogeochemical role that planktonic fungi (i.e., free-floating fungi) and marine bacteria play in the cycling of carbon, nitrogen, and phosphorus in coastal ecosystems [5]. Nitrates and organics from aerosol deposition influence microbiome composition and diatom growth rates in the oceanic environment [6].
Given the increasing human reliance on coastal zones for fisheries, aquaculture, waste disposal, and recreation, the role of ocean ecosystems as a source of airborne pathogens warrants further investigation [7].
It is well established that valuable marine resources, such as bivalves, crustacea, fish, and others, are vulnerable to pathogenic agents that could be transferred (vibrios, Cryptosporidia, viruses, etc.) via air [7], navigation, alien species, etc. As an example, due to such influence, several marine populations have declined along the Greek coastline.
In Greek coastal waters, filamentous fungi and yeasts—particularly Candida, Penicillium, Altenaria, and Aspergillus, [8,9]—have been isolated from recreational beaches and shown to correlate with levels of Escherichia coli and Enterococcus species. These two fecal species are related to water quality biomarkers of regular monitoring of water contamination and potential health risks for swimmers [8]. Papadakis et al. (1997) suggested that water and sand non-fecal pathogens should be added as water quality indicators [9]. Thus, monitoring marine microbiomes on recreational beaches is of great importance.
Despite this important interaction between the marine and airborne biological communities [6,10], integrative studies assessing microbial presence and diversity in both atmospheric and marine compartments using standardized molecular tools remain limited.
Environmental DNA is a biomarker for the detection of an organism without any other observation. Bioaerosols and marine microbiomes are sources of DNA collected via air and water samples. This DNA, derived from organisms or fragments of them, is extracted and sequenced to detect their presence/ diversity. These molecular methods are a novel application of non-invasive genetic sampling in which DNA from organisms is detected via air or water sampling for detection and taxonomy of specific species in the samples [11,12]. The development of high-throughput DNA metabarcoding [13,14] has facilitated the investigation of the taxonomy of airborne or aquatic microbiomes [15]. Compared to conventional approaches and biomonitoring techniques, DNA metabarcoding technology (eMT) has many advantages, such as accuracy, lower cost and quick analysis, and thus is widely used in ecological and environmental monitoring, including oceans [16].
To address this lack of information, we combined air and water sampling with a unified DNA barcoding approach targeting the ITS region for fungi and 16S rRNA gene for prokaryotes; to characterize microbial communities in near-surface air in Attica and nearby coastal waters, a southeastern region of Greece. Specifically, we analyzed the airborne microbiome in Drafi and N. Smirni, while subsurface coastal waters were analyzed at Lutsa beach and Karystos bay in the same region (Figure 1). Overall, our goal was to enrich the data on broad taxonomic diversity of air and marine microbiomes and fill the information gap about the aerial and marine microbiome in Greece by (i) characterizing the composition, diversity, and temporal variability of the airborne and marine microbiome; (ii) assessing spatial and temporal concentration and microbial diversity trends using low-cost air samplers, small-volume water sampling, and barcoded amplicon sequencing; and (iii) evaluating the potential for impact of key pathogenic genera detected in their respective habitats.
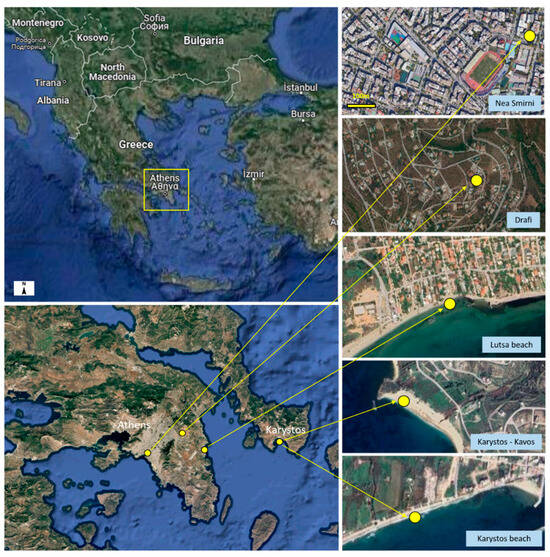
Figure 1.
Map of sampling sites of air (Drafi and N. Smirni) and of sea water in Attica (Lutsa beach) and Karystos Bay (Karystos kavos and Karystos beach).
2. Materials and Methods
General study design. Using a combination of active and passive air sampling, small-volume water sampling, and DNA barcoding, this study examined the taxonomy, diversity, and variability of biogenic particles in the air (airborne microbiome) and marine coastal waters (marine microbiome). Specifically, we isolated and identified bacteria, archaea, fungi, and plant material in the air and marine waters in Greece. The same sample processing protocol (i.e., elution, isolation, purification, and Next-Generation Sequencing (NGS)) was used for both air and water samples.
2.1. Air Sampling
Air sampling using active and passive bioaerosol samplers was performed in 2022–2023, in Attica, a region where almost half of the country’s population live, as described in our earlier publications [17,18]. The air sampling details are provided in Table 1, and sampling locations are illustrated in Figure 1. Passive sampling was performed using the Rutgers Electrostatic Passive Sampler (REPS) [19], which uses a combination of electrostatic and gravitational techniques to capture airborne microorganisms. This sampler was estimated to have an equivalent sampling flowrate of 0.64 ± 0.54 L/min for culturable fungi and 4.86 ± 4.90 L/min for culturable bacteria in a field study lasting up to 21 days [20]. Active samplers included an active REPS (aREPS), a Button sampler (SKC Inc.), and a reusable autoclaved filter holder attached to a pump. Active REPS (or aREPS) has the same core design as passive REPS, where one end of the REPS cylinder is open to air; however, in aREPS, another end is also open and connected to a pump [21]. In essence, aREPS acts as a cylindrical electrostatic sampler, but there is no additional particle charging, and the electrostatic field is provided not by a power supply but by a permanently polarized film inside aREPS. Button sampler was equipped with 25 mm diameter, sterile GF Grade 6 microfiber filters (CHMLAB) prebaked at 250 °C for 120 min. Filter holders were loaded with sterile 47 mm diameter, 0.22 μm porosity PTFE membrane (FS) filters. All active samplers were operated at 3.5 L/min provided by SKC Deluxe pumps, which were connected to an electrical outlet to ensure long-term operation.

Table 1.
Sampling period, Location, air sampler, meteorological conditions, PM10 concentration, abundance (N) and richness (S taxa) of bioaerosol genera in air samples. The presented values are averages over each sampling period.
The details of particular samplers used in each campaign are given in Table 1. Due to technical and analytical issues, not all data from all samplers from each location are available.
Negative controls (blanks) per sampling included two REPS, one blank GF, and one blank PTFE filter. All blanks were processed in the same way as the actual samples; except they did not sample air. All samplers were co-located and operated continuously during each campaign for 5–15 days (Table 1). Air sampling was done near National Observatory of Athens (N.O.A) meteorological stations, which provided meteorological data. The meteorological parameters for each site were collected regularly by Institute of Environmental Research and Sustainable Development IERSD of N.O.A (https://data.climpact.gr/en/dataset/2f5bbe2a-7e27-40e7-9ff6-1dcc08c507fa, accessed on 5 April 2025) and www.meteo.gr/ meteosearch. PM10 concentration data were collected by the Ministry of Environment (https://ypen.gov.gr/perivallon/poiotita-tis-atmosfairas/dedomena-metriseon-atmosfairikis-rypansis, accessed on 5 April 2025). The Ministry’s PM10 station was located ~8.5 km from our sampling site in Drafi and N.O.A. meteorological station.
Average and high wind speeds (daily values), average wind direction, average rain amount, average and high temperature, and average PM10 concentration for each sampling period are presented in Table 1.
2.2. Water Sampling
Seawater samples (SW) for biogenic particle analysis were collected in 2022 and 2023 using 1 L sterile glass bottles that were prebaked at 250 °C for 120 min. This small-volume sampling is a common method in seawater ecology [22,23] (Table 2). We chose the closest beach to Drafi (e.g., Lutsa beach in Artemida (37.99 Ν, 24.02 Ε) and two beaches in Karystos Bay on the opposite side of the Euboean peninsula. The sampling locations in Karystos Bay included Karystos Kavos beach (37.99 N, 24.46 E) and Karystos beach (38.01 N, 24.40 E). Three water subsamples were collected each time per location, and a total of twelve water samples were collected. Some samples shown in Table 2 were pooled just before NGS analysis for fungal presence, specifically samples 1 and 3; 5 and 6; and 11 and 12. Some samples were lost or contaminated during analysis, e.g., Karystos samples from 2023 and Lutsa sample from January 2023, and are not presented in Table 2. The collected water samples were kept at 4 °C in the dark and filtered through Millipore filters (1.2 μm pore size) under aseptic conditions. Then the filters were stored at −20 °C until further analysis, along with the filters from air sampling. For each water sampling, 1 clean Millipore filter was used as blank. Once in the lab, the DNA was extracted and purified, using exactly the same protocols as for air filters. After isolation and purification of DNA, the isolated DNA from 3 subsamples of each sampling site was pooled and stored at −20 °C. The pooled DNA was found suitable for all downstream applications, including PCR and Next-Generation Sequencing (NGS) analysis.
Table 2.
Sampling day, location, marine bacterial and fungal abundance and richness at the genus level in water samples.
2.3. Sample Elution and Extraction
DNA from environmental samples was extracted within 24 h of each sampling campaign. Filters containing material from air and seawater sampling were processed as previously described [17,18]; DNA extraction, isolation and purification were performed under aseptic conditions inside a laminar flow cabinet (TWO-30, Faster), using the Dneasy PowerSoil Kit (Qiagen, Santa Clarita, CA, USA) along with protocol modifications to enhance extraction efficiency (cell lysis), due to the low biomass nature of air samples. Briefly, after adding the lysis buffer, bead tubes were vortexed for 10 min. Cell lysis was amended by adding 10 μL lysozyme 100 mg mL−1 (Applichem GmbH, Darmstadt, Germany) followed by incubation at 37 °C for 30 min. Lysis was continued by adding 5 μL of proteinase K 20 mg mL−1 (Applichem GmbH, Darmstadt, Germany) and incubating at 56 °C for 1 h. Henceforth, DNA extraction proceeded according to the kit manufacturer’s instructions. The quantity and purity of eluted DNA were measured using a microdrop plate (Thermo Scientific, Waltham, MA, USA) based on the absorbance readings at 260, 280, and 230 nm.
2.4. DNA Barcoded Amplicon Sequencing Analysis
The isolated DNA was suitable for all downstream applications, including PCR and Next-Generation Sequencing (NGS) analysis. Diversity assays of the fungal ITS region and 16S rRNA gene were performed by a commercial laboratory (Molecular Research L.P., also known as MrDNA, Shallowater, TX, USA) using a barcoded amplicon sequencing method under the trademark service (bTEFAP®). Samples were processed by amplifying the ITS1 region using the primer pair ITS1F forward primer CTTGGTCATTTAGAGGAAGTAA and ITS2 reverse primer GCTGCGTTCTTCATCGATGC, and by amplifying the ITS2 region using the primer pair ITS3 forward primer GCATCGATGAAGAACGCAG and ITS4 reverse primer TCCTCCGCTTATTGATATGC. Diversity assays for prokaryotes (archaea and bacteria) were performed by targeting the V4 region of the 16S SSU rRNA, and the primers 515F-926R (515F GTGYCAGCMGCCGCGGTAA and CCGYCAATTYMTTTRAGTTT). Pooled and purified PCR products were used to prepare an Illumina DNA library. Barcoded amplicon sequencing was performed by Mr. DNA’s lab (Molecular Research LP, Shallowater, TX, USA) using his method of amplicon sequencing (bTEFAP®), Illumina platform, and it produced zOTUs (zero-radius OTUs). Demultiplexed datasets were stripped of forward and reverse primer sequences. Quality control/data filtering: zOTUs observed in negative controls as well as zOTUs with low identity (<98%) of sequencing, bitscore <350 and e-value > e−30, and/or low number < 5 in total were rejected. All air data were expressed as zOTUs/m3 and sea water (SW) data as zOTUs/L. All isolated zOTUs were manually verified by BLASTn searches against the NCBI GenBank database (www.ncbi.nlm.nih.gov, accessed to 28 March 2025 and 6 February 2025) for high similarity matches (query cover > 98%) in taxonomic assignments.
2.5. Data Analysis
Data analysis (Spearman’s rank correlation) was performed by IBM SPSS 20 statistics software to investigate associations between meteorological data, PM10, and microbial diversity indices. Bacterial and fungal abundance, as counts of different zOTUs (N), and richness (S taxa), as the number of different taxa per sample at the genus level, are presented in Table 1 and Table 2 for air and marine water samples, respectively. For air samples, fungal and bacterial diversity were determined based on the zOTU matrix (number of zOTUs of each taxon per cubic meter). For seawater, we calculated the corresponding diversity indices (abundance and richness) per liter of seawater. The final values for each sampling were calculated as the average values of diversity indices from all sampler types in the air and the average values of three subsamples per site/sampling of seawater.
3. Results
3.1. Sampling Time, Sites, and Conditions
The sampling g sites, sampling periods, meteorological conditions (temperature, rain amount, etc.) and microbial diversity indices (abundance and richness) for air samples in Drafi (a remote city area) and N. Smirni (an urban area), of Attica area, which is the most densely populated area in the country, often affected by big fires and pollution, as well sites and dates for seawater samples are shown in Table 1 and Table 2 and Figure 1 (map). The marine sampling sites are very popular and tourist-frequented beaches for swimmers near Athens or Attica. They feature typical coastal land uses—such as nearshore housing, aquaculture farms, and hotels—and sandy surfaces, much like most recreational beaches found throughout Greece. Fungal analysis in both milieus was done selectively for specific samplings, as shown in Table 1 and Table 2. Also, the values in Table 1 and Table 2 are the average values over each sampling period.
3.2. Microbiome Taxonomy, Richness, and Abundance
3.2.1. Air
We detected 21 different aerial bacterial phyla across all samplings: 8 in 2022 and 18 in 2023 (Figure 2). The top phyla were Acidobacteriota, Actinobacteria, Actinomycetota, and Bacillota. Chloroflexi, Deinococcus Thermus, and Thermomicrobiota were unique to air samples.
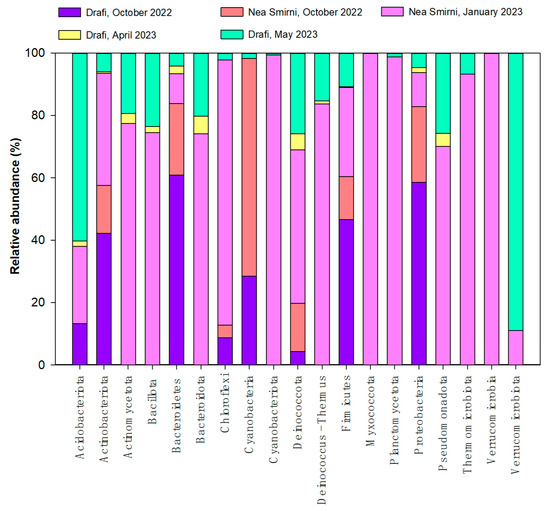
Figure 2.
Elative abundance of airborne bacterial phyla in Drafi (D) and N. Smirni (NS) in 2022 and 2023.
In 2022, in both sites (N. Smirni and Drafi), we detected 280 different aerial bacterial genera, while in 2023, 124 genera were detected. In all samples across both years, we detected 345 different genera with an abundance ≥2 zOTUs /m3. The sample richness ranged from 68 to 226 bacterial genera (Table 1).
The average relative abundance of the top 75 bacterial genera in 2022 and 2023 is presented in Figure S1 (Relative abundance of top 75 airborne bacterial genera in Drafi (D) and N. Smirni (NS), in 2022 (A) and 2023 (B), in Supplemental Materials). Massilia, Shigella, Microvirga, Burkholderia, Blastococcus, Bacillus and Nocardioides were dominant in October 2022. Paracoccus, Kocuria, Massilia, Planomicrobium, Sphingomonas, Blastococcus and Nocardioides were dominant in 2023, when we observed a lower abundance of zOTUs, especially in April, possibly due to much longer storage time of isolated DNA before NGS.
In 2023, we detected 3 fungal phyla—Ascomycota (84%), Basidiomycota (15%), and Mucoromycota (1%)—and 149 different fungal genera. The richness of samples ranged from 13 to 79 fungal genera (Table 1). The top fungal genera were Aspergillus, Cladosporium, Malassezia, Alternaria, Debaryomyces, and Golovinomyces. The 75 most abundant airborne fungal genera in Drafi (D) and N. Smirni (NS) in 2022 and 2023 are shown in Figure 3, separately for each year. In 2022, the top genera were Alternaria, Cladosporium, Inonotus, and Aureobasidium, while in 2023, the top genera were Aspergillus, Cladosporium, Malassezia, Alternaria, Cryptococcus, Epicocum, and Debaryomyces. Data on fungal zOTUs in 2022 were available from a previous study [18], and we re-analyzed the data alongside the sequences obtained later in 2023.
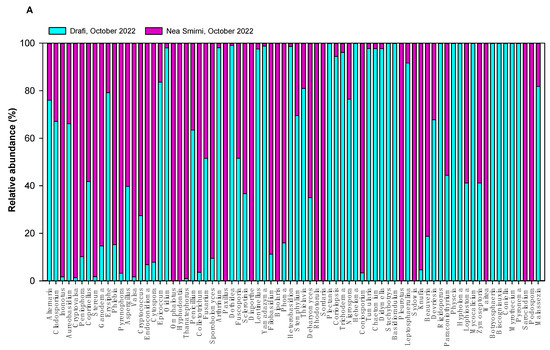
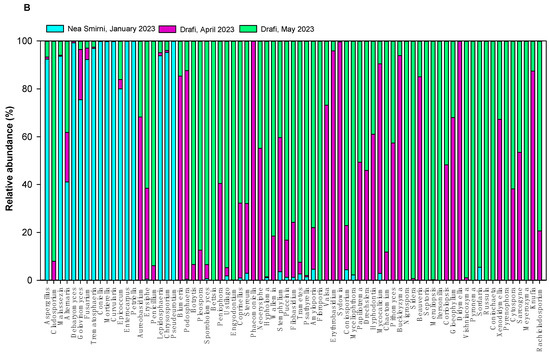
Figure 3.
Relative abundance of top 75 airborne fungal genera in Drafi (D) and N. Smirni (NS) in 2022 (A) and 2023 (Β).
In 2022 and 2023, we detected 1046 different Viridiplantae’s zOTUS as non-target taxa, belonging to Chlorophyta (3.10%) and Streptophyta (96.90%). We detected 17 Viridiplantae’s orders (Figure 4A), with “Other” (8%) encompassing the Orthotrichales, Cupressales, Funariales, Trebouxiophyceae, Ericales, and Liliales. These samples yielded 20 Viridiplantae genera (Figure 4B), with “Other” including Lotus, Paris, Bryum, Physcomitrella, Trebouxia, Salvia, Oenothera, Cupressus, and others. From 17 Viridiplantae orders, 4 orders (e.g., Pottiales, Orthotrichales, Funariales, and Hypnales) and the genera Chlorella, Trebouxia, and Micromonas belong to Division Chlorophyta (Figure 4).
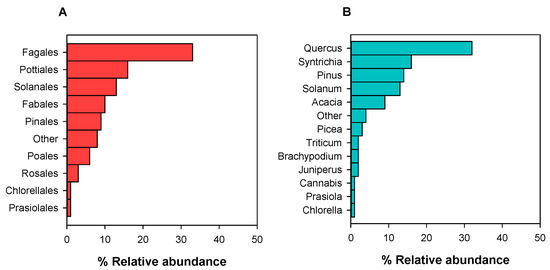
Figure 4.
Relative abundance (RA, %) of Viridiplantae orders (A) and genera (B) detected in the air of Drafi and N. Smirni in 2022 and 2023.
3.2.2. Coastal Waters
In water samples from 2022 and 2023, we isolated 18 and 20 different prokaryotic phyla, respectively. Pseudomonadota, Bacteroidota, Proteobacteria, Bacillota, Cyanobacteriota, Actinobacteria, Bacteroidetes, Actinobacteria, Actinomycetota, Cyanobacteria, Deinococcota, Firmicutes, and Fusobacteriota were marine bacterial phyla detected in all samplings (Figure 5A). Phyla Thaumarchaeota, Thermodesulfobacteriota, Lentisphaerota and Euryarchaeota were found only in sea water, and not in the air. We also detected two phyla of the kingdom of Archaea—Euryarchaeota and Thaumarchaeota—and 4 archaeal genera: Candidatus nitrosoarchaeum, Methanosarcina, Candidatus nitrososphaera and Nitrosopumilus as rare (i.e., relative abundance (RA) of ~0.2–0.6%) or very rare (e.g., relative abundance of ~0.1%). Archaea were isolated in all samples, except in sample KJn2022. Nitrosopumilus was rare in many samples and abundant (e.g., counts are >200/L) only in LJn2022 with N = 1900 zOTUs/L, and N = 221 zOTUs/L in KkJn2022.
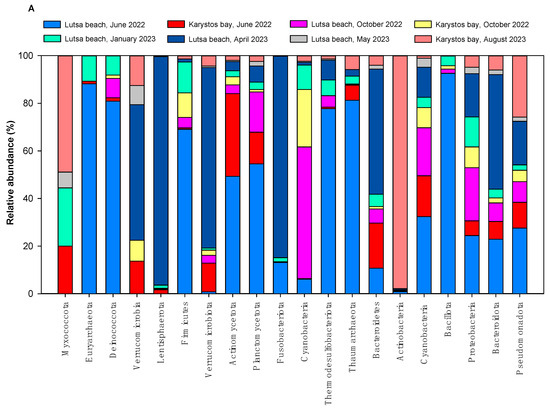
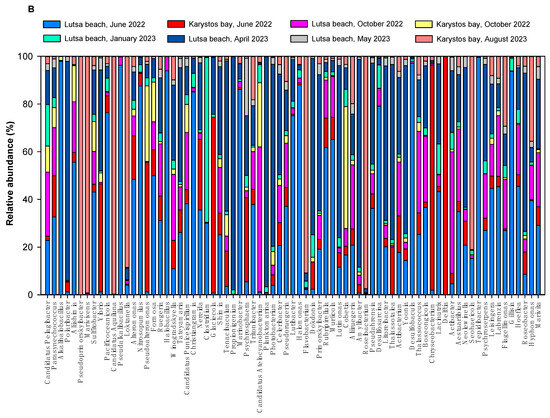
Figure 5.
(A) Relative abundance of marine bacterial phyla in Lutsa beach (L) and Karystos Bay (K) in 2022 and 2023. (B) Relative abundance of top 75 marine bacterial genera in Lutsa beach (L) and Karystos Bay (K) in 2022 and 2023.
In Lutsa beach and Karystos bay, we detected 420 different prokaryotic zOTUs at the genus level across both years. These belonged to bacteria (99%) and archaea (1%). The 75 dominant marine bacterial genera are shown in Figure 5B. Top genera (N = 4 × 10³–15 × 103 zOTUs/L) were Candidatus pelagibacter, Pseudoprimorskyibacter, Parasynechococcus, Alkalihalobacillus, Polaribacter, and Aliishimia.
We also isolated fungal zOTUs belonging to 53 different genera. At the phylum level, the vast majority of ITS1-2 reads were assigned to Ascomycota (76%) and Basidiomycota (24%). The top genera by counts were Alternaria, Ascophyta, Aspergillus, and Aureobasidium (Figure 6).
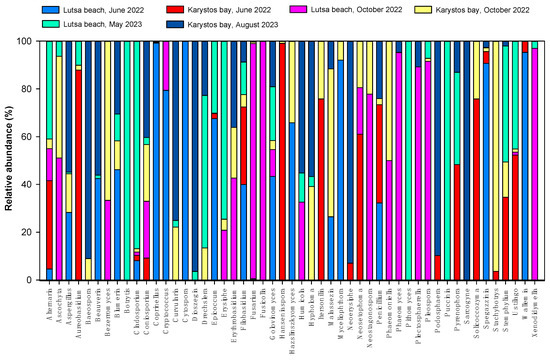
Figure 6.
Relative abundance of marine fungal genera (%) in Lutsa beach (L) and Karystos Bay (K) in 2022 and 2023.
In coastal waters, due to cross-reactions of ITS primers, in several samples, we also saw zOTUs of the kingdom Metazoa classified in the phyla Arthropoda, Ciliophora, and Cnidaria. In Lutsa, in May 2023, we detected zOTUs belonging to Arthropoda of the genus Triconia with a high abundance (1540 zOTUs/L). In all other samples, this organism was in lower abundance (~10 zOTU/L). Also, in all samples, Arthropoda of the genus Oncaea were isolated as rare (RA: ~0.1%). In one sample from Karystos (June 2022) we detected the presence of zOTUs of the phylum Cnidaria, genus Sagartia, which is a sea anemone, and Ciliophora of the genera Eutintinnus and Amphorides, two primary consumers in the sea.
The relative abundance (RA, %) of Viridiplantae orders and genera detected in SW at both sites, as an average of all samplings, is presented in Figure 7. Furthermore, in the kingdom of Viridiplantae, we saw 30 different zOTUS at the order level, 19 of which had an average abundance of more than 0.1 zOTUs/L (Figure 7A), belonging to Chlorophyta (38% of Viridiplantae zOTUs) and Streptophyta (62%). The “Other” category includes Prasiolales, Brassicales, Ericales, and Microthamniales, (Figure 7A). We also detected 50 genera with an average abundance of more than 0.1 zOTUS /L. The genera in the “Other” category are Chlorococcum, Chlorella, Pistacia, Stichococcus, Parietaria, Pectinodesmus, and Trebouxia. (Figure 7B). Moreover, BLAST indicated many unidentified eukaryotic sequences.
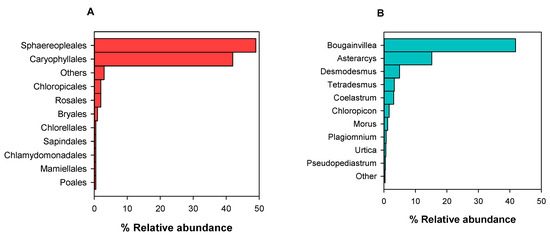
Figure 7.
Relative abundance (RA%) of viridiplantae orders (A) and genera (B) detected in Lutsa beach and Karystos Bay sea water (SW) in 2022 and 2023.
3.2.3. Spearman’s Rank Correlations (Spearman’s Rho)
The results of the correlation analysis are provided in Table 3. Significant positive correlations were observed between bacterial and fungal abundance (Spearman’s rho = 0.918, p < 0.001, two-tailed). Bacterial abundance in aerosol phase was also strongly and statistically significantly associated with meteorological parameters, specifically with wind speed and temperature, with the highest and positive correlation observed between bacterial abundance and temperature (Spearman’s rho = 0.819, p < 0.001, two-tailed). Bacterial richness also showed positive correlations and statistically significant associations with the same parameters, albeit with slightly lower rho values.
Table 3.
Spearman’s rho correlations at the genus level. Correlations that are significant at the 0.01 level (2-tailed) are in bold.
Fungal abundance also demonstrated positive correlations with meteorological parameters. A strong association was found between fungal abundance and temperature (Spearman’s rho = 0.89, p < 0.001, two-tailed). This association was stronger than the one for bacterial abundance and temperature (Spearman’s rho = 0.82, p < 0.01, two-tailed). In contrast, negative and statistically significant correlations (p < 0.01, two-tailed) were detected between PM10 levels and the richness of collected bacterial taxa (Spearman’s rho = −0.66), bacterial abundance (Spearman’s rho = −0.71), and fungal abundance (Spearman’s rho = −0.81). However, fungal richness showed no significant correlations with any other parameter.
4. Discussion
DNA barcoding technology is a sensitive tool for monitoring changes in biodiversity, serving as an indicator of environmental stability and restoration, minimizing environmental disturbance and flora and fauna loss. Metabarcoding extends DNA-based species identification to communities consisting of individuals that belong to many different phyla or kingdoms living in different habitats. However, this technique faces some challenges, such as the PCR step generating amplification biases [13], the DNA extraction, primer design and selection, and library preparation are still laborious and costly [24]. There is potential for bias in the annotation of OTUs [16], and DNA degradation in samples [16]. Moreover, there is a lack of standardized protocols so that they can be implemented in diverse locations of a particular habitat type for comparable results. The generated data should be properly mined, and the mined data should be analyzed and checked by specialists [25].
In this study, we used the bacterial 16S rRNA gene for prokaryotes and ITS 1/ITS 2 for fungi. The data showed the presence of a high number of different taxa of target bacterial and fungal groups and a non-target group of Viridiplantae in both air and seawater. We analyzed both microbiomes and the possible pathogenicity of their components because the people in Greece could be and are affected by both microbiomes. The direct and immediate connection (quantitative and qualitative) between air and marine microbiomes was not the goal of our study.
Microbiome studies like this are very expensive for long-term monitoring and need a lot of effort for collection of samples, extraction and isolation of DNA from bulk environmental samples, and data processing. NGS was performed in the USA, and we faced delays due to SARS-CoV-2 restrictions and long shipping times for 2023 data analysis.
4.1. Marine Microbiome Diversity and Public Health Relevance
Fungi in marine ecosystems play a crucial role as saprotrophs, parasites, pathogens, commensals, and symbionts [26]. In coastal waters, we detected a high variety of fungal zOTUS, belonging to 2 phyla with a ratio (Ascomycota 76% and Basidiomycota 24%) almost the same as a global study (72% and 28%) [27] and 64 genera in total, with a richness of marine fungal genera ranging from 18 to 34 (Table 2) per sample, whereas several of them were pathogenic or opportunistic pathogens.
From 64, only 3 fungal genera, the saprotrophic Baeospora (a rare genus) and Fusicolla (a marine genus) [28] were detected in 2020; Spegazzinia [29] were detected only in marine samples. These fungi are often related to decaying plant material.
A study from 2020 reported marine fungi belonging to 1257 species in 538 genera, 168 families, and 74 orders [28]. As different marine habitats and substrates are examined, the number of detected fungal species continues to increase over time. A prominent fungus-host association has emerged within the genus Aspergillus, abundant in coastal waters, and the genus Malassezia, [26]. These two genera were detected in our marine water samples (Figure 6). Malassezia lipophilic fungi are nearly always detected in marine habitats when using DNA-based techniques, and it is a known plant-pathogenic fungus, often associated with the human skin microbiome [26].
The fungi isolated in this study, such as Alternaria, Penicillium, Epicoccum, Cryptococcus, Fusarium, and Aspergillus (Figure 6), were also detected in many marine habitats explored in other studies [8]. The genera Alternaria, Aspergillus, Aureobasidium, Cladosporium, Debaryomyces (or Candida), Epicoccum, Malassezia and Filobasidium are related to public health issues; other genera, like Beauveria, Fusarium, Stachybotrys, Stemphylium, and Wallemia, contain potential pathogens [28,29,30,31]. Lately, as more individuals with underlying chronic diseases and immunosuppression engage in recreational activities in the sea, they are exposed to potential pathogens such as fungi or bacteria that raise a risk of diseases for the ear, eye, and skin [8,9,32]. Therefore, almost all filamentous fungi and yeasts could be considered potential pathogens [8] and the examination of recreational waters for their fungal diversity is important for public health and marine resources management. The DNA barcoding from bulk environmental samples is a useful tool for this task. Bacteria and archaea provide an enormous marine biomass (~1029 cells) [31], and are essential components in biogeochemical cycles. Recent advancements in NGS technologies have helped uncover the broad taxonomic and metabolic diversity of marine microbiomes. Publicly available marine metagenomes currently include 43,191 bacterial and archaeal genomes, encompassing a wide range of diversity with 138 distinct phyla [31].
Many bacterial phyla detected in our sampling sites were also mentioned in the global marine microbial diversity study [31]. However, in a study of Chen et al. (2024), the different taxa (orders, phyla, and kingdoms) were not described separately, which made their Figure 1d less comprehensive [31]. A study in Qatar reported that Proteobacteria, Bacteroidetes, Cyanobacteria, Firmicutes, Actinobacteria, and Fusobacteria made up the top sixteen phyla [32], and all these phyla are also reported in our study (Figure 5A).
Eutrophication has been recognized as one of the major threats to marine ecosystem sustainability and productivity [33], and Euboikos Bay and other Greek bays are characterized now as eutrophic and hypoxic areas [34]. In the past, Greek marine waters were all oligotrophic [35]. Eutrophication is induced by pollution and nutrient fluxes in the sea [33], caused by population increase in the coastal zone, aquaculture cage farms, wastewater facilities, fertilizers and atmospheric deposition of N and P [34,35] in the sea. Eutrophication accelerates the proliferation of microbes and harmful algae, resulting in harmful algal blooms in coastal areas and hypoxia, caused mainly by Cyanobacteria and eukaryotes (diatoms and dinoflagellates) [33,34,36]. Cyanobacteria were isolated in all our samples (Figure 5A). Opposite to fungal diversity, bacterial microbiome was much richer in our marine samples (Table S1) than in air samples and also much more abundant. Bacterial abundance was up to 34,582 zOTUs /L in the sea and up to 8609 zOTUs /m3 in the air (Table 1 and 2). In eutrophic waters, like the water at our sampling sites, there is an increase in organic nutrients, which stimulates bacterial and microbial production and activity that can be harmful and lead to the spread of disease-associated bacteria and changes in associated microbial communities [34].
In marine samples, we also isolated 23 orders of Viridiplantae, and the 10 most abundant orders are shown in Figure 7A, while the 15 most abundant genera are shown in Figure 7B. Ten of the detected orders belonged to the phylum Chlorophyta, and the most abundant genera of them were Chlorella, Chloropicon, Asterarcys, Tetradesmus, Coelastrum, Ulva, and Trebouxia. Most of these genera, like Trebouxia, are marine or freshwater and lichen symbionts, according to Guiry & Guiry, 2025 AlgaeBase and the database of Marine Species of the British Isles and Adjacent Seas [37]. We also identified orders and genera from the phylum Streptophyta, being mainly of terrestrial origin.
4.2. Airborne Microbiome and Public Health Relevance
In 2023, in the air, the phylum Ascomycota (84%) dominates over Basidiomycota (15%), which is consistent with the conclusion that the species richness of fungi is dominated by BMC in continental air masses and by AMC in marine air masses [27]. Also, we detected 149 fungal genera. The fungal richness in air samples ranged from 13 to 79 (Table 1), which was higher than in marine samples. Alternaria, Aspergillus, Aureobasidium, Cladosporium, Debaryomyces (or Candida), Epicoccum, Malassezia, Fusarium, and Filobasidium were among the top dominant genera of fungal aerosols. Many of the fungal aerosols detected in N. Smirni and Drafi are related to public health issues and plant diseases [18]. Bacterial genera Anaerococcus and Finegoldia were detected only in air samples, and they are part of the commensal human microbiota and opportunistic pathogens [17,38].
4.3. Shared Taxa Across Ecosystems
Although the sampling locations for air and water samples were not the same, and the duration of sampling varied from several days for air sampling to only a few minutes for water sampling, we found many common taxa shared by the two habitats.
Fungal genera were present in both air and water samples, except for 3 genera found only in the sea. There were 6 common bacterial phyla in both air and sea (e.g., Actinobacteria, Bacteroidetes, Cyanobacteria, Deinococcota, Firmicutes, and Proteobacteria) in 2022 and 14 (e.g., Actinobacteria, Actinomycetota, Bacillota, Bacteroidetes, Bacteroidota, Cyanobacteriota, Deinococcota, Firmicutes, Myxococcota, Proteobacteria, and Pseudomonadota) in 2023. Many bacteria detected in both habitats (Table S1, Supplemental Materials) are related to public health issues, such as the genera Staphylococcus and Streptococcus, which are among the main pathogens for people and other mammals. The genera Pseudomonas and Acinetobacter were found in both media and are often isolated from animal facilities and can carry human diseases [17]. Neisseria is closely associated with humans and is an abundant, multi-habitat, diverse genus containing two pathogenic species [39]. Nocardioides have been isolated from various sources, including soil, marine sediment, plants, and animals, and have been detected in both habitats, and are known to cause human disease.
On the other hand, more than 100 bacterial genera were detected only in sea water, e.g., Alkalihalobacillus, Aureicoccus, Polaribacter, Aliiroseovarius, Colwellia, Arenibacterium, Rubritalea, Stieleria, Cocleimonas, Thalassospira, Blastomonas, Marimonas, Marivivens, Pacificitalea, Candidatus Pelagibacter, Parasynechococcus, Ulvibacter, Enterovibrio, Vibrio, Candidatus Aquiluna, Pseudalkalibacillus, and Loktanella. Many of them, including Vibrio, Enterovibrio, Aeromonas, and others, contain potentially pathogenic agents to humans or marine organisms [7,40].
Therefore, the regular surveillance and enumeration of bacteria and fungi in coastal waters and bioaerosols could be of great importance for the economy, public health, or conservation of marine life, even though the exact correlation between numbers of indicators (microbes) and overall pathogenicity is still under exploration [8,9].
4.4. Environmental and Meteorological Influences
We examined the impact of various meteorological parameters and PM10 concentration on bioaerosol abundance and richness (N and S taxa) by using Spearman Rho correlations (Table 3). Among the meteorological factors, the strongest correlation was observed between bioaerosol abundances and air temperature. Bioaerosol diversity indices and wind velocity also had a strong positive correlation, but PM10 was negatively correlated with airborne bacterial and fungal abundance.
According to Zhong et al. (2016), the factors that influence the abundance of microbial activity are very complex and may include meteorological parameters, source type and strength, and geographical environment [41]. Because of the great variation in air quality conditions, methodology, and meteorological factors, the most important factors that influence bioaerosols are not always the same at different time points or locations [41]. Thus, the relationship between PM and bioaerosol concentrations is complex [10,42].
Wind speed (WS) is clearly associated with the release and dispersal of spores, although its effect varies depending on the height at which WS is recorded. High wind speeds that exceed a certain threshold value will accelerate the process of releasing microbes from soil, fields or animal and plant surfaces by suspending microbes in the air [10]. Generally, wind has been confirmed to have an effect on bioaerosol presence, but its effect varies according to speed, season and direction. Local airborne bioaerosol concentrations are directly related to emission sources and emission amount, meteorological and pollution conditions during the sampling period, and special weather events (e.g., sandstorms, fog, and dust) [10]. Therefore, differences in emission sources and amounts under different conditions are important reasons for variability in bioaerosol concentrations, and these factors vary among different studies.
5. Conclusions
Our study investigated the microbiome in the air of Attica and nearby coastal waters in Greece, using a low-cost sampling methodology followed by isolation and purification of environmental DNA and NGS. Due to the increasing anthropogenic impact on the environment, future airborne and marine microbiome studies are necessary for improving predictions of ecosystem responses to pollution and eutrophication, and for the protection of public health as it relates to air and recreational water quality, which is a matter of major concern in popular tourist areas. Although the high cost and current limitations of molecular techniques like DNA barcoding, ecological monitoring is needed for sustainable development. The future integration of DNA analysis with the increasing application of big data, open databases, and technology like AI, remote sensing, etc., will provide strong support for the protection of ecosystems. Further microbiome studies will continue this surveillance using more frequent sampling and a larger geographical area.
Supplementary Materials
The following supporting information can be downloaded at https://www.mdpi.com/article/10.3390/atmos16091082/s1, Figure S1: Relative abundance of top 75 airborne bacterial genera in Drafi (D) and N. Smirni (NS), in 2022 (A) and 2023 (B).; Table S1: Common bacterial genera and unique genera in the air and sea water.
Author Contributions
Conceptualization, A.M.; methodology, A.M. and D.G.; validation, A.M. and G.M.; investigation, A.M.; resources, A.M., D.G.H., and G.M.; writing—original draft preparation, A.M., D.G.; writing—review and editing, A.M., D.G.H. and G.M.; funding acquisition, A.M. All authors have read and agreed to the published version of the manuscript.
Funding
This research received no external funding.
Institutional Review Board Statement
Not applicable.
Informed Consent Statement
Not applicable.
Data Availability Statements
The original Eukaryotic Nuclear rRNA/ITS sequence data presented in this study are available on request from the corresponding author. Prokaryotic 16S rRNA sequences have been deposited under the accession number KJIG00000000. The version described in this paper is the first version, KJIG01000000 (accessed on September 8th 2025).
Acknowledgments
The authors gratefully acknowledge Myriokefalitakis Stelios, for his support. We also thank S. Grogan for preparing REPSs, Jason Grigoratos for advice and K. Romios for his assistance with the formalities and the logistics of this work.
Conflicts of Interest
The authors declare no conflicts of interest.
Correction Statement
This article has been republished with a minor correction to the Data Availability Statement. This change does not affect the scientific content of the article.
References
- Brągoszewska, E.; Mainka, A. Bacterial Aerosol in Ambient Air—A Review Study. Appl. Sci. 2024, 14, 8250. [Google Scholar] [CrossRef]
- Bacteria and Fungi in the Sea. In The Biology of Marine Plants; Dring, M.J., Ed.; Cambridge University Press: Cambridge, UK, 1991; pp. 170–177. ISBN 978-0-521-42765-4. [Google Scholar]
- Peng, X.; Amend, A.S.; Baltar, F.; Blanco-Bercial, L.; Breyer, E.; Burgaud, G.; Cunliffe, M.; Edgcomb, V.P.; Grossart, H.-P.; Mara, P.; et al. Planktonic Marine Fungi: A Review. ESS Open Arch. 2023. [Google Scholar] [CrossRef]
- Hassett, B.T.; Vonnahme, T.R.; Peng, X.; Jones, E.B.G.; Heuzé, C. Global Diversity and Geography of Planktonic Marine Fungi. Bot. Mar. 2020, 63, 121–139. [Google Scholar] [CrossRef]
- Peng, X.; Amend, A.S.; Baltar, F.; Blanco-Bercial, L.; Breyer, E.; Burgaud, G.; Cunliffe, M.; Edgcomb, V.P.; Grossart, H.-P.; Mara, P.; et al. Planktonic Marine Fungi: A Review. J. Geophys. Res. Biogeosci. 2024, 129, e2023JG007887. [Google Scholar] [CrossRef]
- Maki, T.; Lee, K.C.; Pointing, S.B.; Watanabe, K.; Aoki, K.; Archer, S.D.J.; Lacap-Bugler, D.C.; Ishikawa, A. Desert and Anthropogenic Mixing Dust Deposition Influences Microbial Communities in Surface Waters of the Western Pacific Ocean. Sci. Total Environ. 2021, 791, 148026. [Google Scholar] [CrossRef] [PubMed]
- Belkin, S.; Colwell, R.R. (Eds.) Oceans and Health: Pathogens in the Marine Environment; Springer Science + Business Media: New York, NY, USA, 2006; ISBN 978-0-387-23708-4. [Google Scholar]
- Arvanitidou, M.; Kanellou, K.; Katsouyannopoulos, V.; Tsakris, A. Occurrence and Densities of Fungi from Northern Greek Coastal Bathing Waters and Their Relation with Faecal Pollution Indicators. Water Res. 2002, 36, 5127–5131. [Google Scholar] [CrossRef] [PubMed]
- Papadakis, J.A.; Mavridou, A.; Richardson, S.C.; Lampiri, M.; Marcelou, U. Bather-Related Microbial and Yeast Populations in Sand and Seawater. Water Res. 1997, 31, 799–804. [Google Scholar] [CrossRef]
- Huang, Z.; Yu, X.; Liu, Q.; Maki, T.; Alam, K.; Wang, Y.; Xue, F.; Tang, S.; Du, P.; Dong, Q.; et al. Bioaerosols in the Atmosphere: A Comprehensive Review on Detection Methods, Concentration and Influencing Factors. Sci. Total Environ. 2024, 912, 168818. [Google Scholar] [CrossRef]
- Olson, Z.H.; Briggler, J.T.; Williams, R.N. An eDNA Approach to Detect Eastern Hellbenders (Cryptobranchus a. alleganiensis) Using Samples of Water. Wildl. Res. 2012, 39, 629–636. [Google Scholar] [CrossRef]
- Grydaki, N.; Colbeck, I.; Mendes, L.; Eleftheriadis, K.; Whitby, C. Bioaerosols in the Athens Metro: Metagenetic Insights into the PM10 Microbiome in a Naturally Ventilated Subway Station. Environ. Int. 2021, 146, 106186. [Google Scholar] [CrossRef]
- Cristescu, M.E. From Barcoding Single Individuals to Metabarcoding Biological Communities: Towards an Integrative Approach to the Study of Global Biodiversity. Trends Ecol. Evol. 2014, 29, 566–571. [Google Scholar] [CrossRef]
- Ruppert, K.M.; Kline, R.J.; Rahman, M.S. Past, Present, and Future Perspectives of Environmental DNA (eDNA) Metabarcoding: A Systematic Review in Methods, Monitoring, and Applications of Global eDNA. Glob. Ecol. Conserv. 2019, 17, e00547. [Google Scholar] [CrossRef]
- Tzafesta, E.; Saccomanno, B.; Zangaro, F.; Vadrucci, M.R.; Specchia, V.; Pinna, M. DNA Barcode Gap Analysis for Multiple Marker Genes for Phytoplankton Species Biodiversity in Mediterranean Aquatic Ecosystems. Biology 2022, 11, 1277. [Google Scholar] [CrossRef]
- Liang, X.; Yang, X.; Sha, N.; Wang, J.; Qiu, G.; Chang, M. Application of eDNA Metabarcoding Technology to Monitor the Health of Aquatic Ecosystems. Water 2025, 17, 1109. [Google Scholar] [CrossRef]
- Metaxatos, A.; Georgiadou, D.; Hatzinikolaou, D.; Mainelis, G. The Diversity, Richness, and Potential Health and Ecological Role of the Fungal Aerosols in Attica, Greece. Aerosol Air Qual. Res. 2024, 24, 240170. [Google Scholar] [CrossRef]
- Metaxatos, A.; Manibusan, S.; Mainelis, G. Investigation of Sources, Diversity, and Variability of Bacterial Aerosols in Athens, Greece: A Pilot Study. Atmosphere 2022, 13, 45. [Google Scholar] [CrossRef]
- Therkorn, J.; Thomas, N.; Calderón, L.; Scheinbeim, J.; Mainelis, G. Design and Development of a Passive Bioaerosol Sampler Using Polarized Ferroelectric Polymer Film. J. Aerosol Sci. 2017, 105, 128–144. [Google Scholar] [CrossRef]
- Grogan, S.N.C.M.; Mainelis, G. Effect of Sampling Duration on Culturable and Viable Bioaerosol Determination When Using Rutgers Electrostatic Passive Sampler (REPS). J. Aerosol Sci. 2022, 166, 106066. [Google Scholar] [CrossRef]
- Grogan, S.N.C.M.; Han, T.T.; Mainelis, G. Development and Initial Testing of an Active Low-Power, Ferroelectric Film-Based Bioaerosol Sampler. Aerosol Sci. Technol. 2022, 56, 1132–1145. [Google Scholar] [CrossRef] [PubMed]
- Friligos, N.; Gotsis-Skretas, O. Relationships of Phytoplankton with Certain Environmental Factors in the South Euboikos Gulf (Greece). Mar. Ecol. 1987, 8, 59–73. [Google Scholar] [CrossRef]
- Metaxatos, A. Population Dynamics of the Venerid Bivalve Callista chione (L.) in a Coastal Area of the Eastern Mediterranean. J. Sea Res. 2004, 52, 293–305. [Google Scholar] [CrossRef]
- Ushio, M.; Furukawa, S.; Murakami, H.; Masuda, R.; Nagano, A.J. An Efficient Early-Pooling Protocol for Environmental DNA Metabarcoding. Environ. DNA 2022, 4, 1212–1228. [Google Scholar] [CrossRef]
- Hassan, S.; Sabreena; Poczai, P.; Ganai, B.A.; Almalki, W.H.; Gafur, A.; Sayyed, R.Z. Environmental DNA Metabarcoding: A Novel Contrivance for Documenting Terrestrial Biodiversity. Biology 2022, 11, 1297. [Google Scholar] [CrossRef] [PubMed]
- Amend, A.; Burgaud, G.; Cunliffe, M.; Edgcomb, V.P.; Ettinger, C.L.; Gutiérrez, M.H.; Heitman, J.; Hom, E.F.Y.; Ianiri, G.; Jones, A.C.; et al. Fungi in the Marine Environment: Open Questions and Unsolved Problems. mBio 2019, 10, 10–1128. [Google Scholar] [CrossRef]
- Frohlich-Nowoisky, J.; Burrows, S.M.; Xie, Z.; Engling, G.; Solomon, P.A.; Fraser, M.P.; Mayol-Bracero, O.L.; Artaxo, P.; Begerow, D.; Conrad, R.; et al. Biogeography in the Air: Fungal Diversity over Land and Oceans. Biogeosciences 2012, 9, 1125–1136. [Google Scholar] [CrossRef]
- Jones, E.G.; Devadatha, B.; Abdel-Wahab, M.A.; Dayarathne, M.C.; Zhang, S.N.; Hyde, K.D.; Liu, J.-K.; Bahkali, A.H.; Sarma, V.V.; Tibell, S.; et al. Phylogeny of New Marine Dothideomycetes and Sordariomycetes from Mangroves and Deep-Sea Sediments. Bot. Mar. 2020, 63, 155–181. [Google Scholar] [CrossRef]
- Tennakoon, D.; Thambugala, K.; de Silva, N.; Suwannarach, N.; Lumyong, S. A Taxonomic Assessment of Novel and Remarkable Fungal Species in Didymosphaeriaceae (Pleosporales, Dothideomycetes) from Plant Litter. Front. Microbiol. 2022, 13, 1016285. [Google Scholar] [CrossRef]
- Jones, E.B.G. Fifty Years of Marine Mycology. Fungal Divers. 2011, 50, 73–112. [Google Scholar] [CrossRef]
- Chen, J.; Jia, Y.; Sun, Y.; Liu, K.; Zhou, C.; Liu, C.; Li, D.; Liu, G.; Zhang, C.; Yang, T.; et al. Global Marine Microbial Diversity and Its Potential in Bioprospecting. Nature 2024, 633, 371–379. [Google Scholar] [CrossRef]
- El-Malah, S.S.; Rasool, K.; Jabbar, K.A.; Sohail, M.U.; Baalousha, H.M.; Mahmoud, K.A. Marine Bacterial Community Structures of Selected Coastal Seawater and Sediment Sites in Qatar. Microorganisms 2023, 11, 2827. [Google Scholar] [CrossRef]
- Akinnawo, S.O. Eutrophication: Causes, Consequences, Physical, Chemical and Biological Techniques for Mitigation Strategies. Environ. Chall. 2023, 12, 100733. [Google Scholar] [CrossRef]
- Jessen, C.; Bednarz, V.; Rix, L.; Teichberg, M.; Wild, C. Marine Eutrophication. In Environmental Indicators; Springer: Dordrecht, The Netherlands, 2015; p. 27. ISBN 978-94-017-9498-5. [Google Scholar]
- Ignatiades, L.; Gotsis-Skretas, O. A Review on Toxic and Harmful Algae in Greek Coastal Waters (E. Mediterranean Sea). Toxins 2010, 2, 1019–1037. [Google Scholar] [CrossRef] [PubMed]
- Genitsaris, S. Review of Harmful Algal Blooms in the Coastal Mediterranean Sea, with a Focus on Greek Waters. Diversity 2021, 13, 396. [Google Scholar] [CrossRef]
- Marine Species of the British Isles and Adjacent Seas (MSBIAS)—Cryptophyta. Available online: https://www.marinespecies.org/Msbias/aphia.php?p=taxdetails&id=17638 (accessed on 24 July 2025).
- Gonzalez-Martin, C. Airborne Infectious Microorganisms. Encycl. Microbiol. 2019, 52, 52–60. [Google Scholar] [CrossRef]
- Liu, G.; Tang, C.M.; Exley, R.M. Non-Pathogenic Neisseria: Members of an Abundant, Multi-Habitat, Diverse Genus. Microbiology 2015, 161, 1297–1312. [Google Scholar] [CrossRef]
- Romalde, J.L.; Dieguez, A.L.; Lasa, A.; Balboa, S. New Vibrio Species Associated to Molluscan Microbiota: A Review. Front. Microbiol. 2014, 4, 413. [Google Scholar] [CrossRef]
- Zhong, X.; Qi, J.; Li, H.; Dong, L.; Gao, D. Seasonal Distribution of Microbial Activity in Bioaerosols in the Outdoor Environment of the Qingdao Coastal Region. Atmos. Environ. 2016, 140, 506–513. [Google Scholar] [CrossRef]
- Adhikari, A.; Reponen, T.; Grinshpun, S.A.; Martuzevicius, D.; LeMasters, G. Correlation of Ambient Inhalable Bioaerosols with Particulate Matter and Ozone: A Two-Year Study. Environ. Pollut. 2006, 140, 16–28. [Google Scholar] [CrossRef]
Disclaimer/Publisher’s Note: The statements, opinions and data contained in all publications are solely those of the individual author(s) and contributor(s) and not of MDPI and/or the editor(s). MDPI and/or the editor(s) disclaim responsibility for any injury to people or property resulting from any ideas, methods, instructions or products referred to in the content. |
© 2025 by the authors. Licensee MDPI, Basel, Switzerland. This article is an open access article distributed under the terms and conditions of the Creative Commons Attribution (CC BY) license (https://creativecommons.org/licenses/by/4.0/).