Article

Effect of Friction Material on Vehicle Brake Particle Emissions

by
Marie Hoff
1,2,*,
Yan-Ming Chen
3,
Laurent Meunier
4,
Christophe Bressot
4 and
Martin Morgeneyer
1
1
UTC-ESCOM, Laboratoire Transformations Intégrées de la Matière Renouvelable (TIMR, EA 4297), 60203 Compiègne, France
2
MAT Friction Noyon SAS, 205 rue de l’Europe, 60400 Noyon, France
3
Centre Technique des Industries Mécaniques (CETIM), Pôle MMS, 52 Av. Félix Louat, 60300 Senlis, France
4
Institut National de L’environnement Industriel et des Risques (INERIS), Rue Jacques Taffanel, 60550 Verneuil-en-Halatte, France
*
Author to whom correspondence should be addressed.
Atmosphere 2025, 16(9), 1075; https://doi.org/10.3390/atmos16091075
Submission received: 5 August 2025 / Revised: 28 August 2025 / Accepted: 4 September 2025 / Published: 11 September 2025

Abstract

This study focuses on the influence of different brake pad formulations on the emission of particulate matter coming from car braking systems. The brake particles were characterised using a pin-on-disc bench and some particle measuring devices such as CPC, APS, SMPS and a PM10 sampling unit. Seven samples of brake pad materials of different compositions (1 NAO and 6 Low Steel) were tested against grey cast iron discs. The results presented in this work show differences in particle number concentration and PM10 emission factor between the different friction materials tested. Three friction materials, LS04, LS06 and NAO01, reduce particle number emissions by up to 71% and PM10 emissions by up to 57%. On the other hand, this reduction in particulate emissions goes along with a reduction of 20% to 27% in the coefficient of friction. The microscopic analyses carried out on the test parts (pins and discs) show differences between the most emissive and the least emissive friction pairs, which may explain the differences observed in particle emissions. Correlations between the emission of particles and the concentration of iron of the PM10, as well as the steel fibre content in the formulas, were found.

1. Introduction

Many solutions are being considered to reduce automotive brake wear emissions and to comply with the PM10 emission thresholds required by the Euro 7 standard. The main solutions are vehicle lightweighting; using chemically and thermally treated brake discs [1,2,3], coated brake discs [3,4,5,6,7,8,9,10], and particle collection systems [11,12,13]; and the modification of friction materials. In Europe, two families of friction materials are mainly used for the brakes of vehicles in the M1 and N1 categories, defined in the Euro 7 standards: the Low Steel (LS) material family and the NAO (Non-Asbestos Organic) material family. The Low Steel family is a family whose formulations have a low content of steel fibres, generally less than 30% by volume [14,15,16]. The NAO family is a family whose formulations traditionally do not have steel fibres, unlike Low Steel materials. The emission of particles is different according to the friction material family. Some studies performed on a dynamometer bench [1,17] or pin-on-disc bench [18] showed that NAO materials emit fewer particles than Low Steel materials, both in number and mass. One author also highlighted this statement, in particular when the vehicle speed and the braking pressure are high [19]. Many authors have investigated the effect of some friction raw materials on the emission of particles [20,21,22,23,24,25,26]. The study of the effect of steel fibre content in brake pad formulations on emissions has also been studied. Using an OPS (0.3–10 µm particle optical size range), one author observed an increase in the emission of particles with optical sizes above 2 μm when the content of steel fibre increased [27]. Another author investigated the effect of the iron content in brake pads on emissions and suggested that the increase in the steel fibre content in brake pads leads to higher PM10 and PM2.5 concentrations [28]. However, none of the authors investigated the effect of steel fibre content on the emission factor of PM10. A part of this study will focus on this effect, especially because Low Steel materials containing steel fibres are economically cheaper than NAO materials which do not contain steel fibres.
This work has two objectives. The first objective is to study the influence of different compositions of Low Steel and NAO friction materials on particulate emissions (PM10, PN, and particle size) and to identify the raw materials involved in the particle emissions. The second objective is to understand the wear mechanisms that cause emissions based on a microscopic analysis of the test parts and a chemical analysis of the braking particles collected on PTFE filters during the tests.

2. Materials and Methods

2.1. Description of the Pin-on-Disc Bench and Particle Measuring Devices

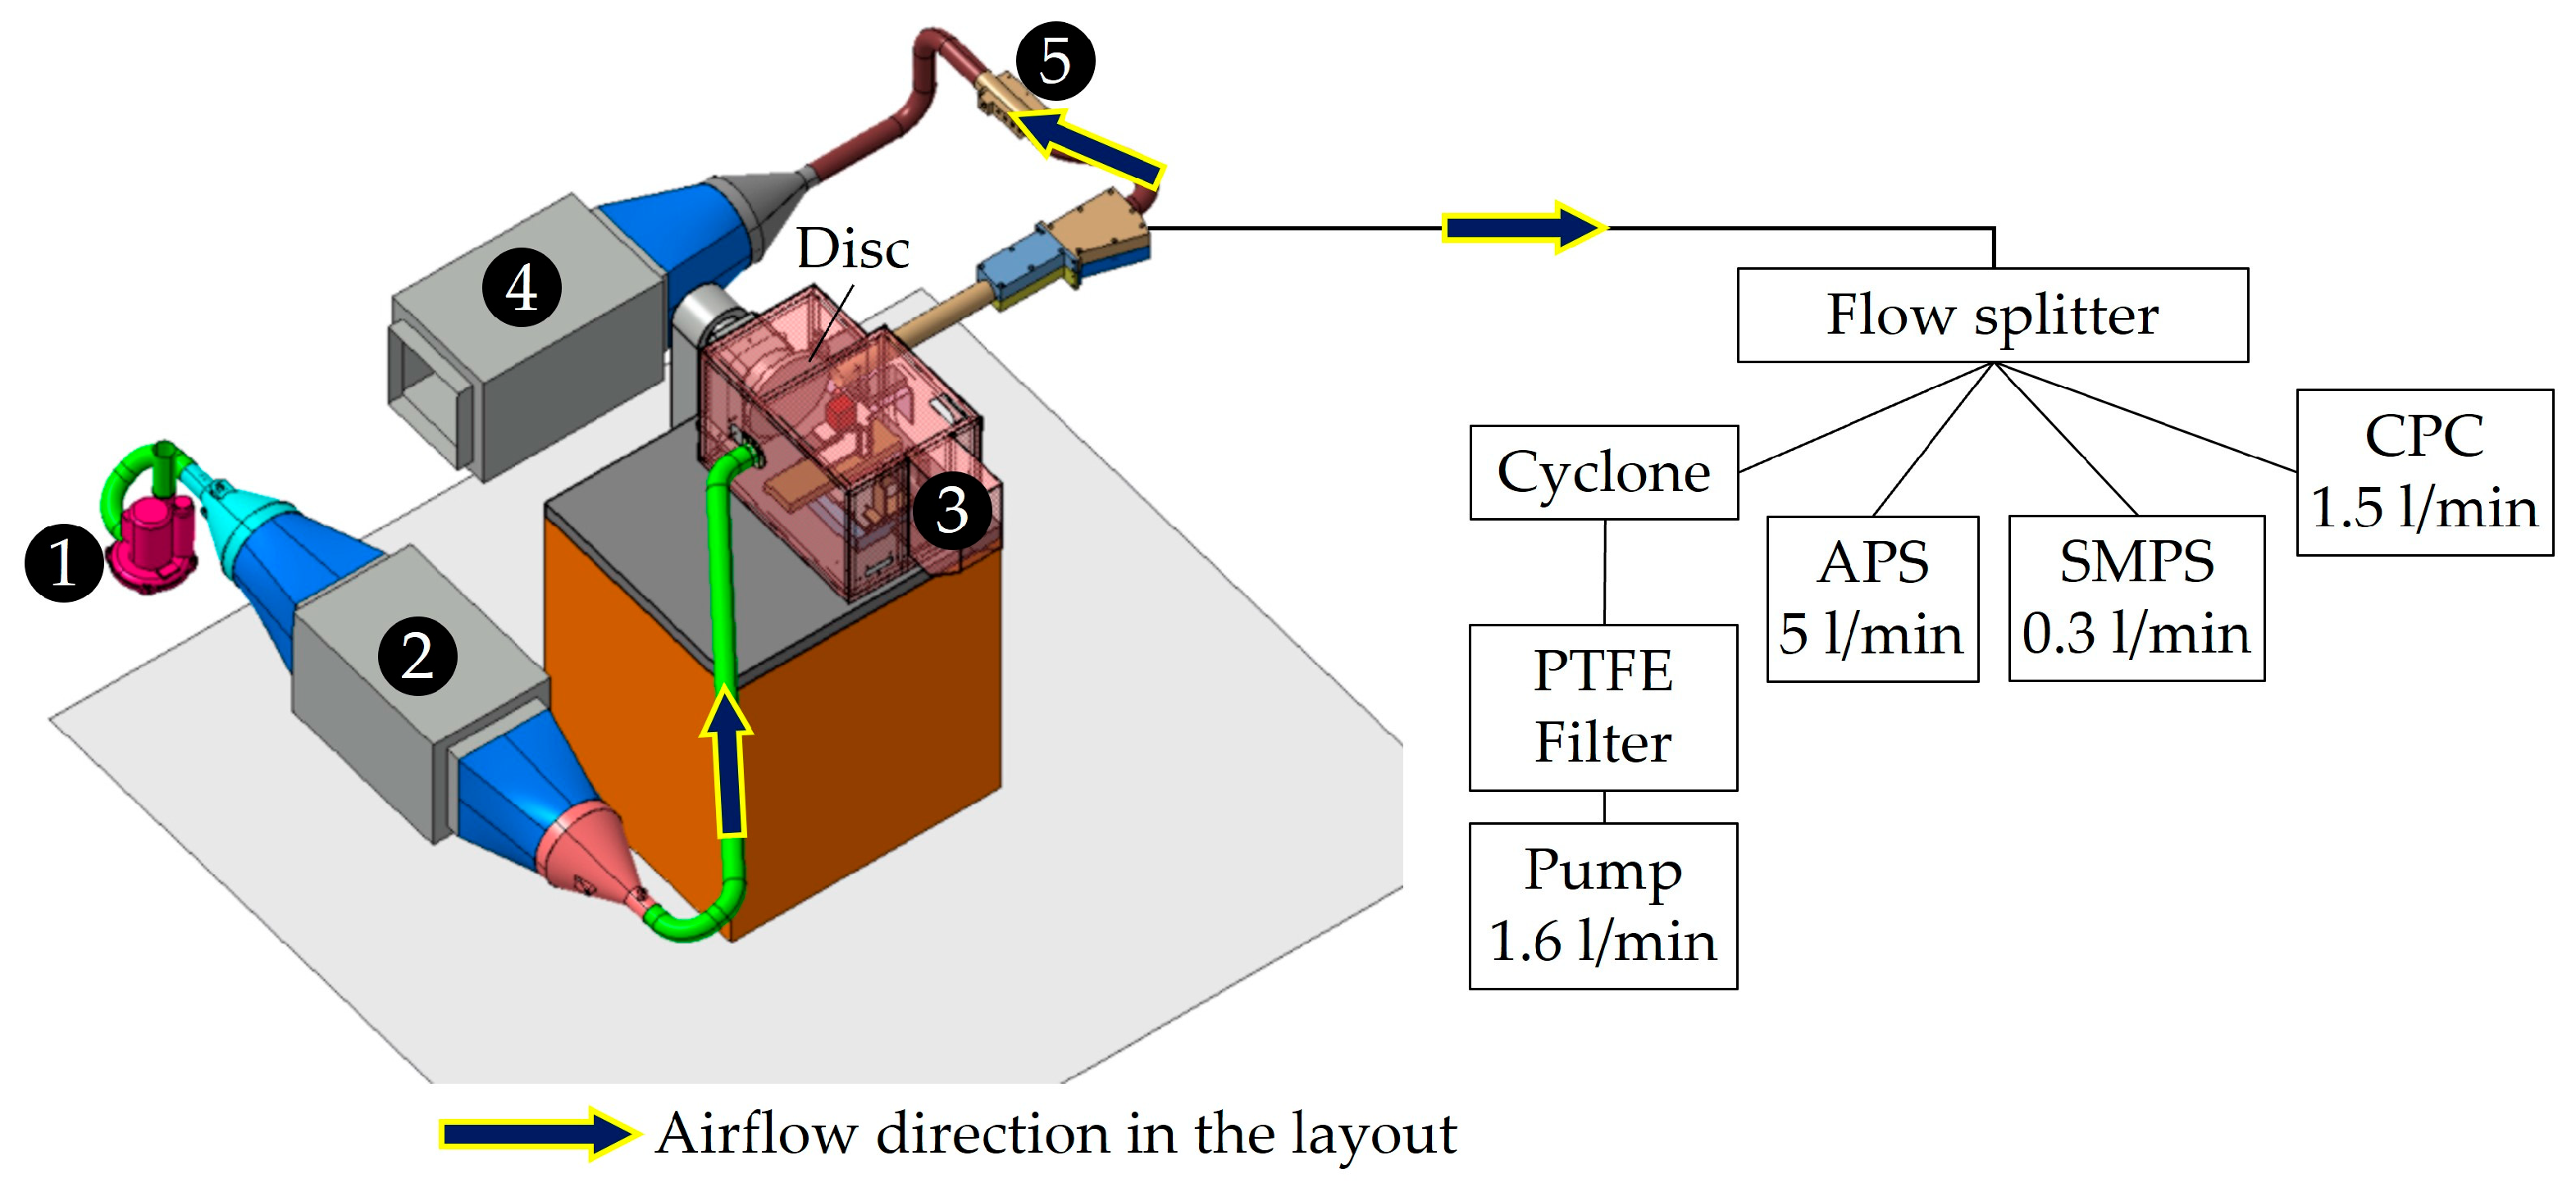
The measurement of braking particles must be controlled. Braking particles must not be mixed up with particles in the ambient air. Additionally, the sampling must be representative of real particle emissions. To achieve this, the mechanical part of the pin-on-disc bench was placed in a sealed enclosure (3). Figure 1 presents the set-up used in this work [29,30,31,32]. The enclosure was connected to two filter boxes, (2) and (4), each composed of two filters: one F7 type and one H13 type. This system made it possible to carry out tests with low particle background noise. In addition, the appropriate management of the air flow circulating in the set-up made it possible to carry out particle measurements under isokinetic conditions. The air sent into the set-up was taken by a positive progressive cavity pump (1) controlled by a controller. Furthermore, particle contamination inside the enclosure was prevented thanks to the installation of a positive progressive cavity pump at the inlet of the overall set-up, which created an overpressure throughout the set-up.
The characteristics of the measuring devices used to measure the number, size and mass of particles emitted are presented in Table 1. One CPC (Condensation Particle Counter) (TSI Inc., Shoreview, MN, USA) was used to count the number of particles. One SMPS (Scanning Mobility Particle Sizer) (TSI Inc., Shoreview, MN, USA) combined with one APS (Aerodynamic Particle Sizer) (TSI Inc., Shoreview, MN, USA) was also used to measure the size of the particles over a wide measuring range, between 14 nm and 20 μm, to accurately characterise brake wear emissions down to a few nanometres. The APS is an interesting metrological solution to measure aerosols because it allows the measurement of aerosols of lower concentrations while maintaining an excellent temporal resolution to process evolving aerosols.
The mass of particles emitted by the seven friction pairs were collected on PTFE filters (FALP03700: 1.0 μm pore size, hydrophobic PTFE, 37 mm diameter) placed in filter holders (cassettes). To sample particles with a size < 10 μm (PM10), a cyclone (GK 2.69SS (37 mm), Mesa Labs, Lakewood, CO, USA) was placed upstream of the filter holder, and a pump set at a flow rate (qp) of 1.6 L/min was connected to the filter holder to create a cut at 10 μm. The emission factor (EFPM10) of each friction pair, expressed in μg/km, was calculated with Equation (1) using the amount of particulate matter emitted per kilometre travelled by the wheel of the car (d). The mass of particulate matter collected on the PTFE filter, expressed in microgramme, is the difference between the final mass of the PTFE filter (mff) after the test and the initial mass of the PTFE filter (mfi) before the test. The ratio of the mass collected on the PTFE filter to the distance travelled was multiplied by the ratio of the average flow rate (qm), expressed in l/min, measured during the test using the flowmeter ((5) on Figure 1), to the flow rate of the PTFE filter pump (qp).
E F P M 10 = m f f m f i d × q m q p
The seven pins were analysed with SEM-EDXS. The scanning electron microscope was a Sigma 300 VP (Zeiss, Oberkochen, Germany), and the energy-dispersive X-ray spectroscopy tool was a X-MaxN (Oxford Instruments, Abingdon, UK). The pins and the brake discs were also observed with a light microscope (KH-8700) (Hirox Europe, Limonest, France).
The PM10 particles were chemically analysed using both the ICP-MS (Inductively Coupled Plasma-Mass Spectrometry) method and ICP-OES (Inductively Coupled Plasma-Optical Emission Spectrometry) method to quantify chemical elements. In this study, the PTFE filters were nebulized in accordance with the NF-EN-14385 standard [33]. According to the NF-EN-17294-2 standard [34], the ICP-MS technique quantifies the chemical elements Ba, Co, Cr, Cu, K, Sn, Zn and Zr, whereas according to the NF-EN-17294-2 standard [34], the ICP-OES technique quantifies the chemical elements Al, Fe, Mg, Na and Ti.
The roughness values (Rp, Rv and Ra) of the seven brake discs was defined according to ISO 25178-1:2016 standard [35] using an interferometric profilometry (Bruker-Nano Contour GT-K Optical Profilometer) (Brucker, Billerica, MA, USA).

2.2. Friction Materials and Brake Disc

Six Low Steel materials (LS01, LS02, LS03, LS04, LS05 and LS06) and one NAO material (NAO01) were tested as a 5 mm diameter pin. The formulas used for this work are complex unlike some of the friction materials tested in the literature [21,23,26]. The formulas are also copper-free, unlike some which have been investigated elsewhere [1,26,36].
NAO01 material is a common NAO material among copper-free materials. It is a friction material that is asbestos-free, steel fibre-free and copper-free, and it has organic fibres, mineral fibres and a lot of carbon, as well as zirconium dioxide and barium sulphate. The six copper-free Low Steel materials have compositional differences. LS01 and LS02 are the closest in terms of composition, but LS02 has more abrasives (20% by volume in total). This modification of the LS02 material aims to increase the ‘cold’ friction coefficient (at low brake disc temperature) and usually causes more wear of the cast iron brake disc. LS03 material has fewer abrasives and a higher synthetic fibre content than LS01 and LS02. A study showed interesting behaviour for the reduction in particle emissions using organic fibres [25].
LS04, LS05 and LS06 friction materials have been formulated from the LS01 friction material formula with the aim of reducing brake particle emissions. LS05 is close to LS01, but aluminium oxide has been replaced by magnesium oxide, and both have another common abrasive. A study performed using different oxides as abrasives showed interesting behaviour for the reduction in particle emissions using magnesium oxide [24]. LS04 and LS06 have approximately 50% less steel fibres by volume (Table 2) and 50% more barium sulphate by volume than other Low Steel materials. Increasing the barium sulphate content was chosen because interesting behaviour for the reduction in emissions using this raw material has been observed [1,36,37]. LS06 is also the only Low Steel composed of an abrasive usually used for NAO material: zirconium dioxide.
Table 2 gives the chemical composition of the seven friction materials and the brake disc, as well as the steel fibre content of the friction materials. In this table, the weight percentage of iron found in LS01 (24.961 wt.%) is higher than the weight percentage of iron found in LS02 (17.396 wt.%), whereas they have the same content of steel fibre in volume percentage (16.50 vol.%) and nearly the same content of steel fibre by considering the weight percentage (37.64 wt.% for LS01 and 36.13 wt.% for LS02). The difference in steel fibre content in weight percentage in LS01 and LS02 is due to the difference in density of the friction material (LS01 has a lower density than LS02). The difference in iron content in weight percentage found in the XRF results is due to the fact that the friction materials are composed of other materials containing iron and because they have different densities.
An EDX-7000 model (SHIMADZU France, Noisiel, France) was used to determine the elemental composition by X-ray fluorescence (XRF) of the friction materials presented in Table 2.
The cast iron brake disc is a commercial disc with a size of 266 × 22 (disc diameter in mm; disc thickness in mm). The EMIA 920-V2 (Horiba, Palaiseau, France) was used to define by infrared detection the contents of carbon and sulphur of a brake disc. The contents of the other elements were defined by ICP-OES (Spectro ARCOS) (SPECTRO Analytical Instruments GmbH, Kleve, Germany).

2.3. Test Conditions

All friction materials were tested against a cast iron disc in new condition. The seven brake discs were prepared in the same way. The anti-corrosion layer of the discs, consisting of a coating mainly made of zinc and aluminium particles, was removed to prevent possible contamination of the air with zinc and aluminium particles. For this purpose, all brake discs were completely immersed in a bath of white vinegar (18 degrees acetic acid) for ten minutes. Then, the residues of the anti-corrosion layer were removed with a grade P#1000 sandpaper (grit 1000 μm). The discs were then washed with demineralised water and dried to prevent the formation of rust on the discs’ surfaces. Afterwards, the brake discs were manually bedded with P#120 grade sandpaper (grit 120 μm) for seven minutes at a disc rotational speed of 800 rpm. The purpose of this operation is to reduce the roughness of the discs to reduce the bedding time of the 5 mm diameter pins. The pin axle is located 109 mm from the disc axle.
Next on the pin-on-disc bench, the friction pairs were bedded for approximately an hour during the ‘bedding cycle’ before collecting the PM10 on the PTFE filters during the ‘emission cycle’ for another hour (Table 3). The emission cycle is composed of 50 loading sequences, and the three vehicle speeds (in km/h) used to create the ‘emission cycle’ were chosen using the standardised WLTP cycle (Worldwide Harmonised Light Vehicles Test Procedure). The protocol used to select the three test speeds is the following:
  • The values of the initial speeds of the 114 braking of the WLTP-Trip#10 were sorted by ascending order. WLTP-Trip#10 was chosen because it is the most energetic part of the whole WLTP cycle.
  • Speeds corresponding to 50%, 80% and 98% of cumulative brakings were chosen. These speeds correspond to initial speeds of 35 km/h, 50 km/h and 102 km/h.
  • Then, these three values were adapted to obtain rather different range of values which are representative to the real driving conditions. The speed of 35 km/h was kept because this value represents a good condition of urban driving in the city centres. So, 50% of the loading sequences of our ‘emission cycle’ were performed at a speed of 35 km/h, corresponding to 25 loadings. Then, instead of 50 km/h, a speed of 60 km/h was chosen because this value represents a good condition of driving on the outskirts of the city (between 50 km/h and 70 km/h generally). In the WLTP-Trip#10 cycle, 38% of the brakings are performed at an initial speed between 35 km/h and 60 km/h, corresponding to 19 loading sequences in our ‘emission cycle’. Finally, a speed of 110 km/h was chosen because this value represents a good condition of driving on expressways such as ring roads and motorways. In the WLTP-Trip#10 cycle, 12% of the brakings are performed at an initial speed higher than 60 km/h, corresponding to 6 loading sequences in our ‘emission cycle’.
The sliding velocities presented in Table 3 are equivalent to vehicle speeds of 80 km/h, 35 km/h, 60 km/h and 110 km/h by using the vehicle parameters presented in Table 4. The disc rotational speed does not vary with friction. The contact pressure applied was constant during the test and equals 1.2 MPa, which is equivalent to 23.6 hydraulic bar on the vehicle.
In terms of braking energy, considering the dissipated energy (in J) divided by the (dissipating) surface of two pads (9020 mm2), the total surface-specific dissipated energy during the WLTP cycle is around 1089 J/mm2 for our reference brake.
3. Results

3.1. Particle Number Emissions

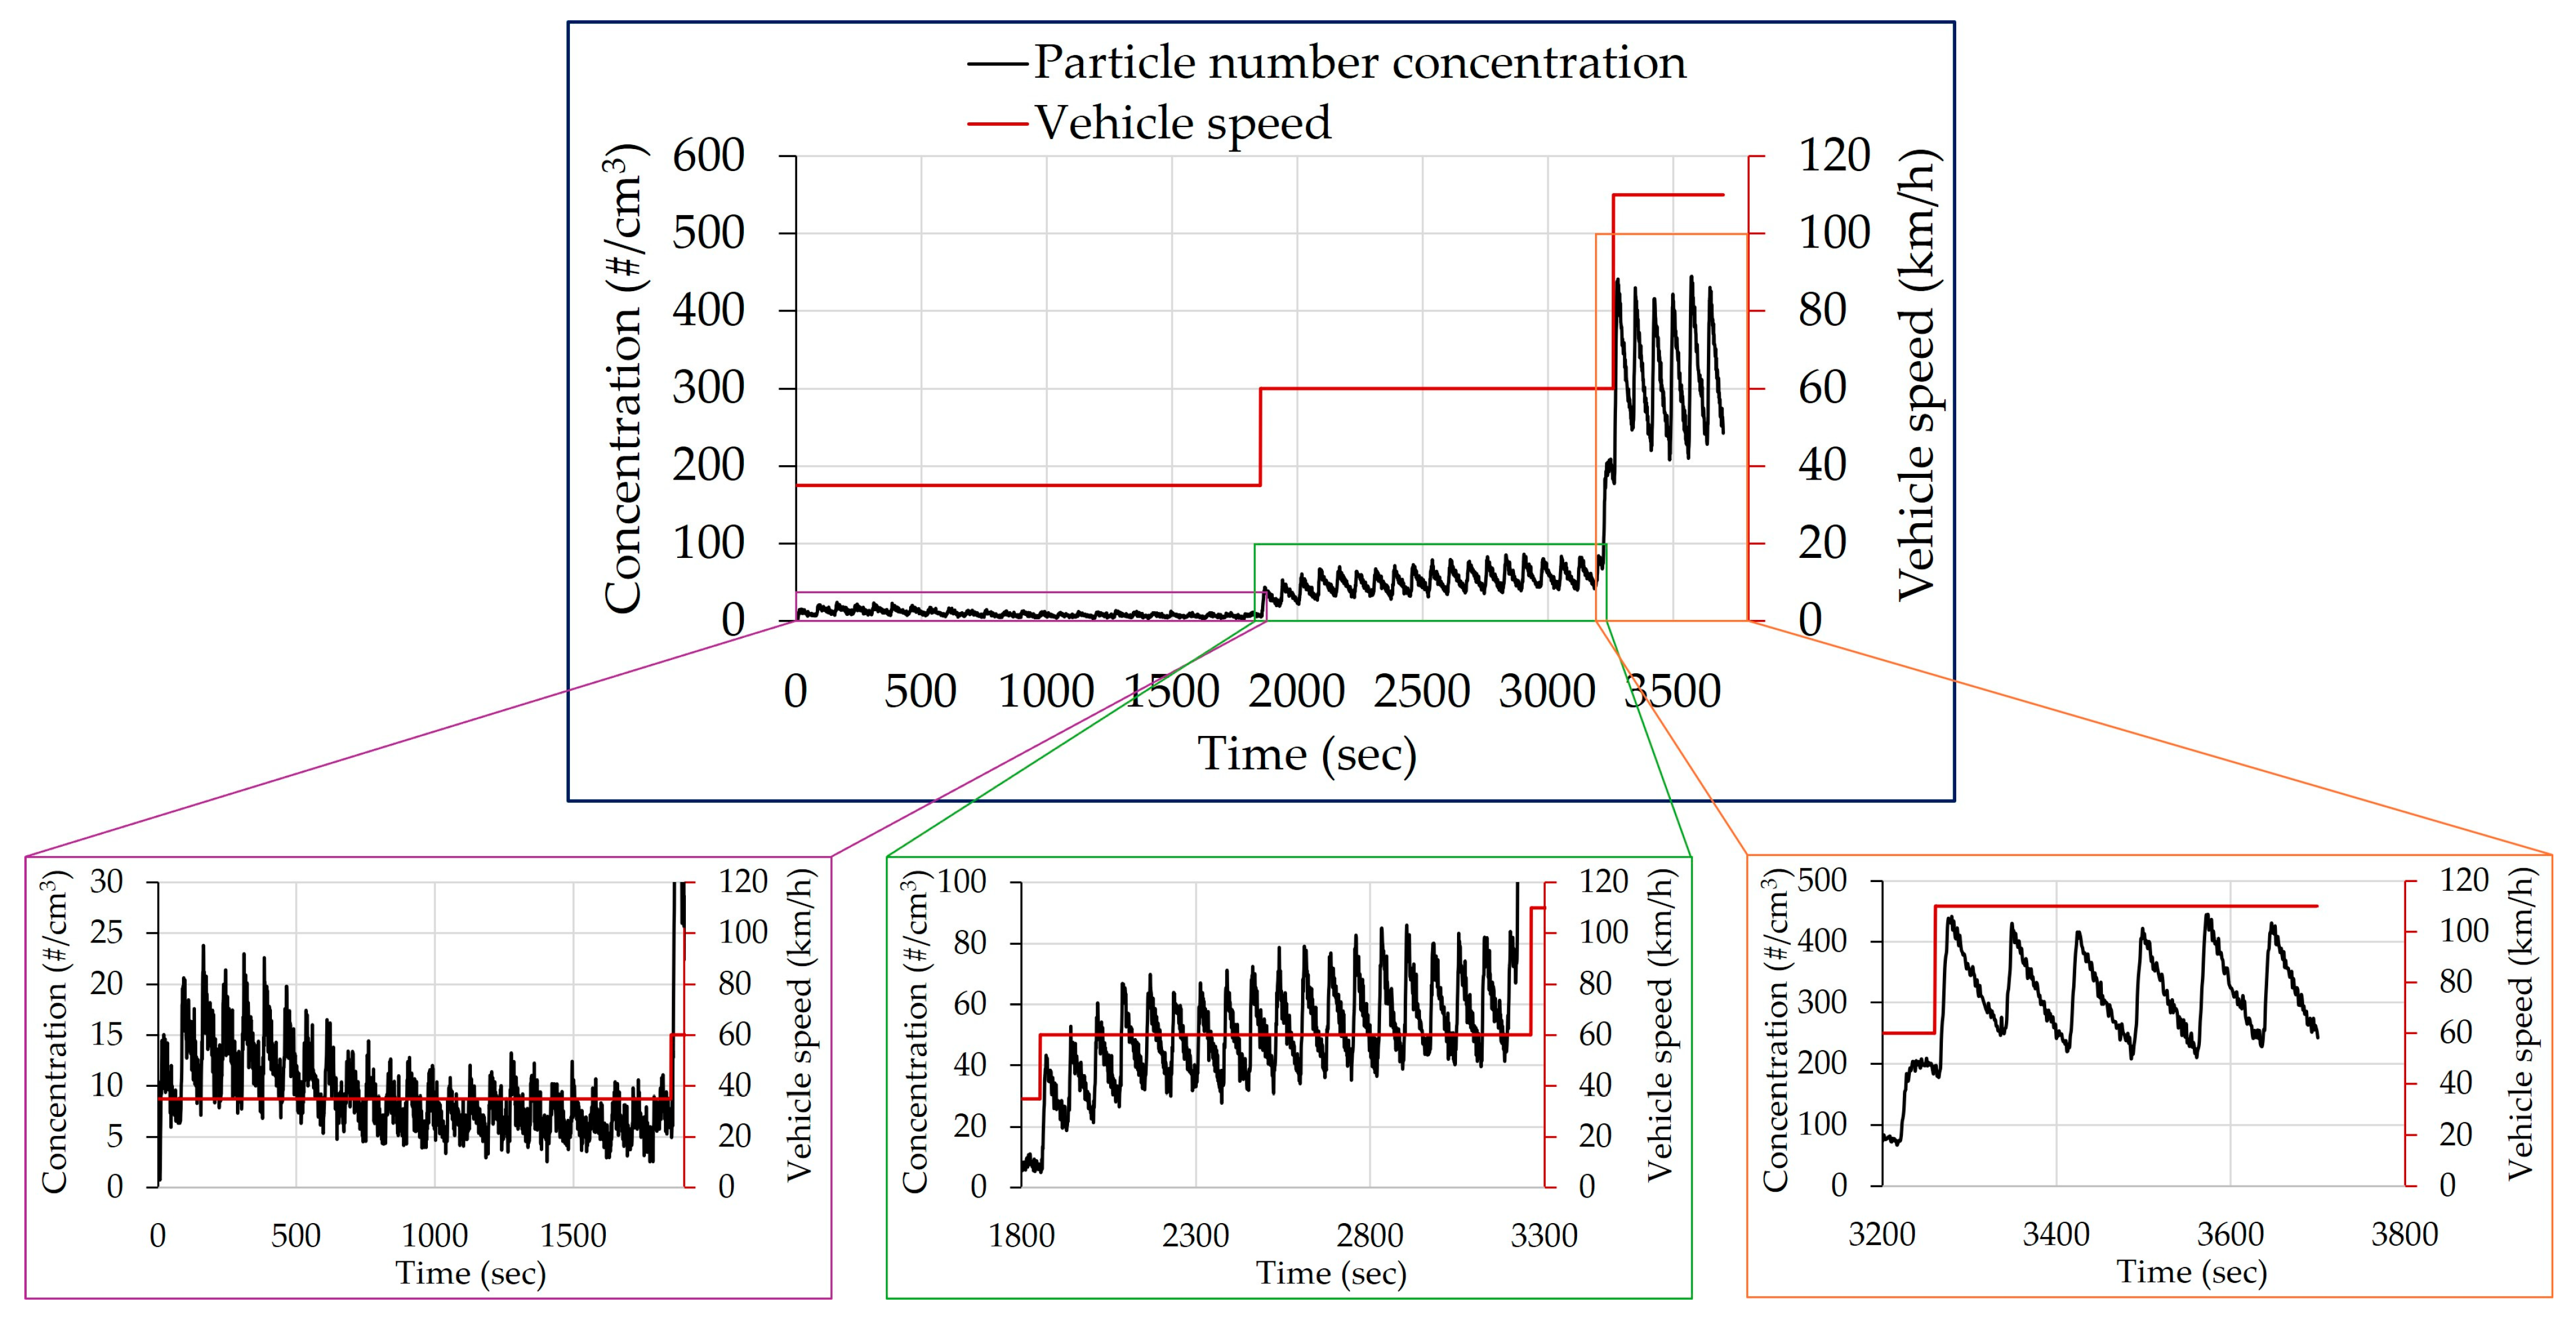
Figure 2 displays the particle number concentration over time of the friction pair tested with the LS01 material and measured with the CPC.
Variations in particle number concentration are observed, characterised by a succession of phases of increase and decrease in particle number concentration. This variation results from each loading sequence when contact pressure is applied on the disc surface, followed by an unloading phase. The evolution curve of LS01 material shows that the minimum values measured between successive loading sequences increase as the test speed increases. As seen in Figure 2, the minimum values of the loading sequences at 35 km/h are between 5 #/cm3 and 10 #/cm3, then between 20 #/cm3 and 40 #/cm3 at 60 km/h, and finally reach values between 210 #/cm3 and 240 #/cm3 at 110 km/h. Figure 2 also shows that the height of the emission peaks, the difference between the maximum and minimum values, is higher as the sliding velocity increases. Loading sequences carried out at 35 km/h generate an increase in the particle number concentration between 10 #/cm3 and 15#/cm3. An increase between 20 #/cm3 and 40 #/cm3 is observed during loading sequences carried out at 60 km/h. And an increase between 200 #/cm3 and 220 #/cm3 is observed during loading sequences carried out at 110 km/h.
In Figure 2, the curves also highlight that when the test conditions (sliding speed) change, the steady-state conditions are reached after several loading sequences. For example, at 35 km/h, the particle number concentration increases for three loading sequences and then decreases to reach a steady-state level. This is due to the change in test conditions between the end of the bedding cycle, performed at 80 km/h and the beginning of the emission cycle, performed at 35 km/h.
The evolution of the particle number concentration as a function of time of the seven friction pairs is presented in Figure 3. The seven curves look the same: the particle number concentration increases with the sliding velocity during the tests.
In Table 5, an average value of the particle number concentration was calculated for each test speed using the data presented in Figure 3. Furthermore, a weighted average was calculated, where the three weights used correspond to the percentage of loading sequences performed at each test speed in the test cycle: 50% at 35 km/h (25/50 loading sequences), 38% at 60 km/h (19/50 loading sequences), and 12% at 110 km/h (6/50 loading sequences). The weighted average concentrations (C) of the seven friction pairs are as follows: CLS01 ≈ CLS02 ≈ CLS05 ≈ CLS03 > CLS04 > CLS06 ≈ CNAO01. The weighted average concentrations of LS01, LS02, LS03 and LS05 are the highest and close to each other, with values of 63 #/cm3, 67 #/cm3, 62 #/cm3 and 68 #/cm3, respectively. The weighted average concentrations of the LS06 and NAO01 materials are the lowest and very close to each other, with values of 18 #/cm3 and 25 #/cm3, respectively. The weighted average concentration of the LS04 material is intermediate and is 48 #/cm3.
The three friction materials, LS04, LS06 and NAO01, thus significantly reduce the particle number emission, by 24%, 71% and 60%, respectively, compared to the reference friction material (LS01).

3.2. Coefficient of Friction

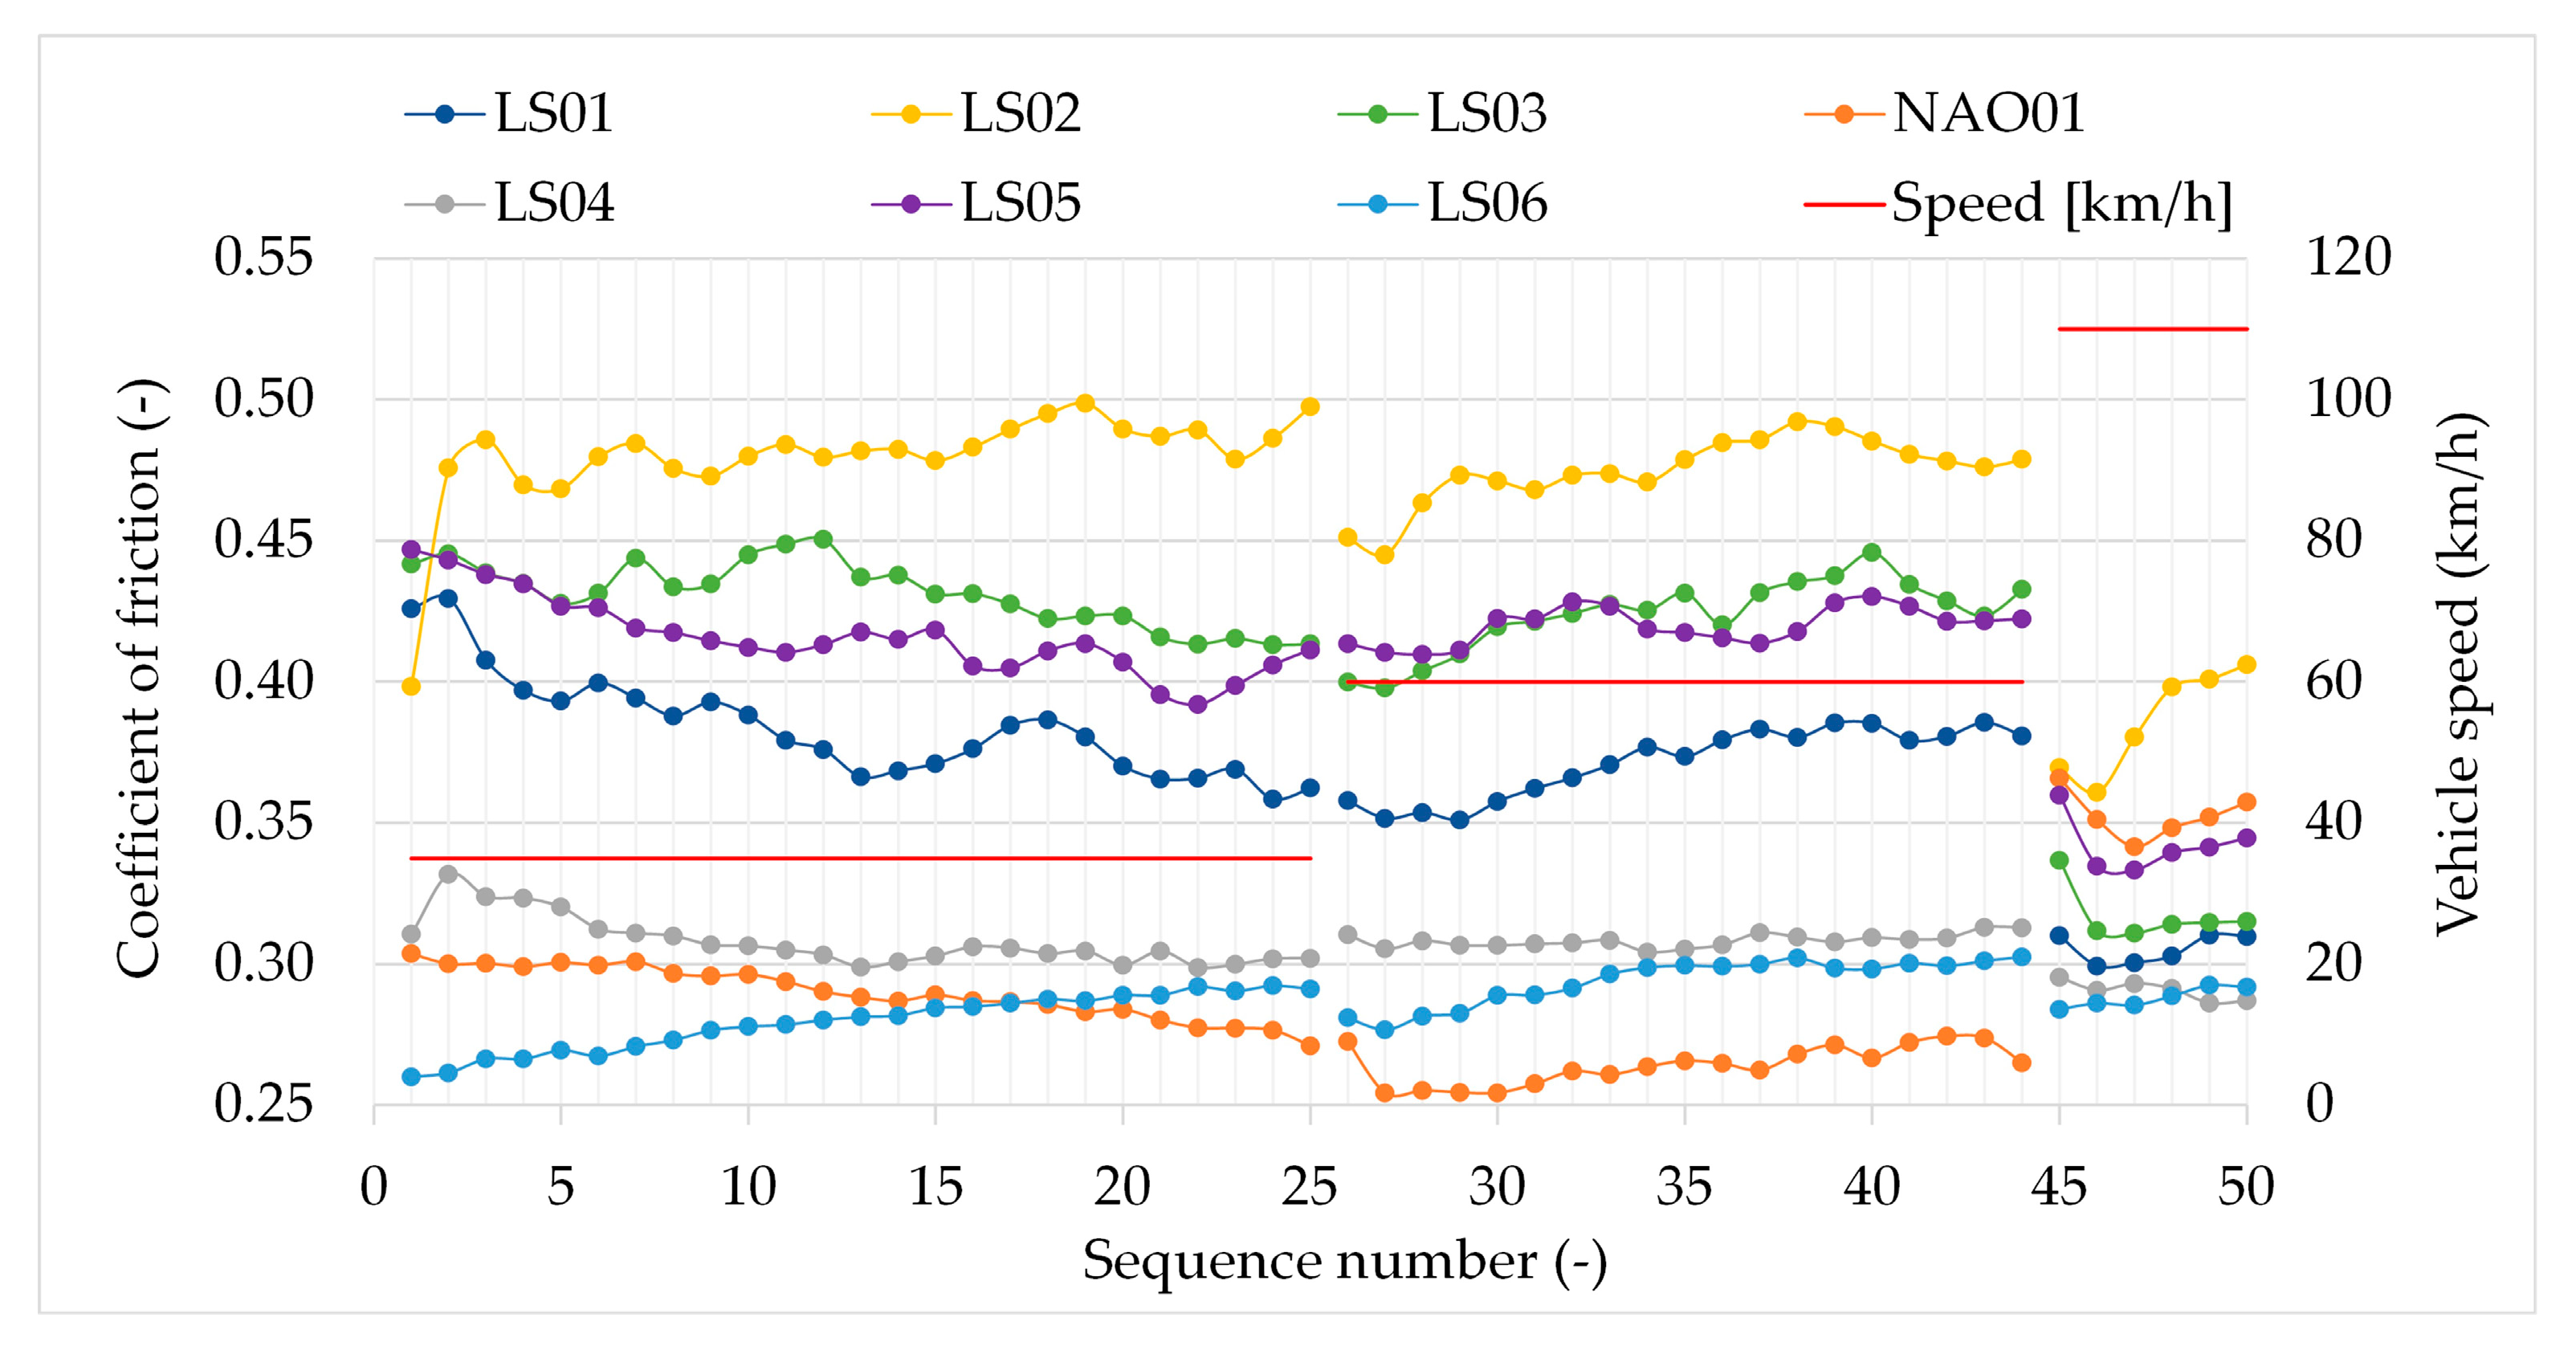
The coefficient of friction is a ratio between the normal force applied between the surfaces of the brake pad and the brake disc and the tangential resistance that opposes their relative sliding. Sensors to measure normal and tangential forces were used to calculate the coefficient of friction of the friction pairs while in contact. Figure 4 presents, for the seven friction pairs, the average coefficient of friction calculated for the 50 loading sequences of the test cycle. Table 6 shows the average coefficient of friction calculated for each test speed. The average coefficients of friction (μ) of the seven friction pairs are distributed as follows: μLS02 > μLS03 ≈ μLS05 > μLS01 > μLS04 > μLS06 ≈ μNAO01. The test speed seems to influence the coefficient of friction: the coefficient of friction of Low Steel materials decreases as the test speed increases. On the other hand, this is not observed with the NAO01 material.
The results show that the coefficient of friction of LS02 material is the highest regardless of the test speed (0.48 at 35 km/h, 0.47 at 60 km/h and 0.39 at 110 km/h). LS03 and LS05 materials have similar average coefficients of friction, namely 0.43 at 35 km/h, 0.42 at 60 km/h and 0.32 at 110 km/h for LS03 and 0.42 at 35 km/h, 0.42 at 60 km/h and 0.34 at 110 km/h for LS05. The average coefficient of friction of LS01 material is 0.38 at 35 km/h, 0.37 at 60 km/h and 0.31 at 110 km/h. These three values are slightly lower than the average coefficients of friction of LS03 and LS05 materials. The NAO01, LS04 and LS06 materials have the lowest average coefficients of friction. LS04 and LS06 materials have constant average coefficients of friction over time, ranging from 0.31 to 0.29 for LS04 and 0.28 to 0.29 for LS06. The coefficient of friction of NAO01 material varies with the test speed unlike LS04 and LS06 materials. Indeed, the average coefficient of friction of the NAO01 material changes from 0.29 at 35 km/h to 0.26 at 60 km/h and then increases to 0.35 at 110 km/h. The coefficient of friction of the NAO01 material at 110 km/h is different with the friction material on a dynamometer bench according to the SAE J2522 test (AK-Master). On the dynamometer bench, this friction material shows a slight decrease with respect to the coefficient of friction when the initial speed increases. Our work first aims to describe braking behaviour before any explanations, which is particularly difficult due to inhomogeneous materials like brake pads. It is a challenging question which will be investigated in a further article.
A decrease of between 17% and 29% in the coefficient of friction was observed at low speeds (35 km/h and 60 km/h) with LS04, LS06 and NAO01 materials compared to the reference material (LS01). Thus, the decrease in particle number emission with these three materials goes along with a decrease in the coefficient of friction.

3.3. Particle Size Distribution

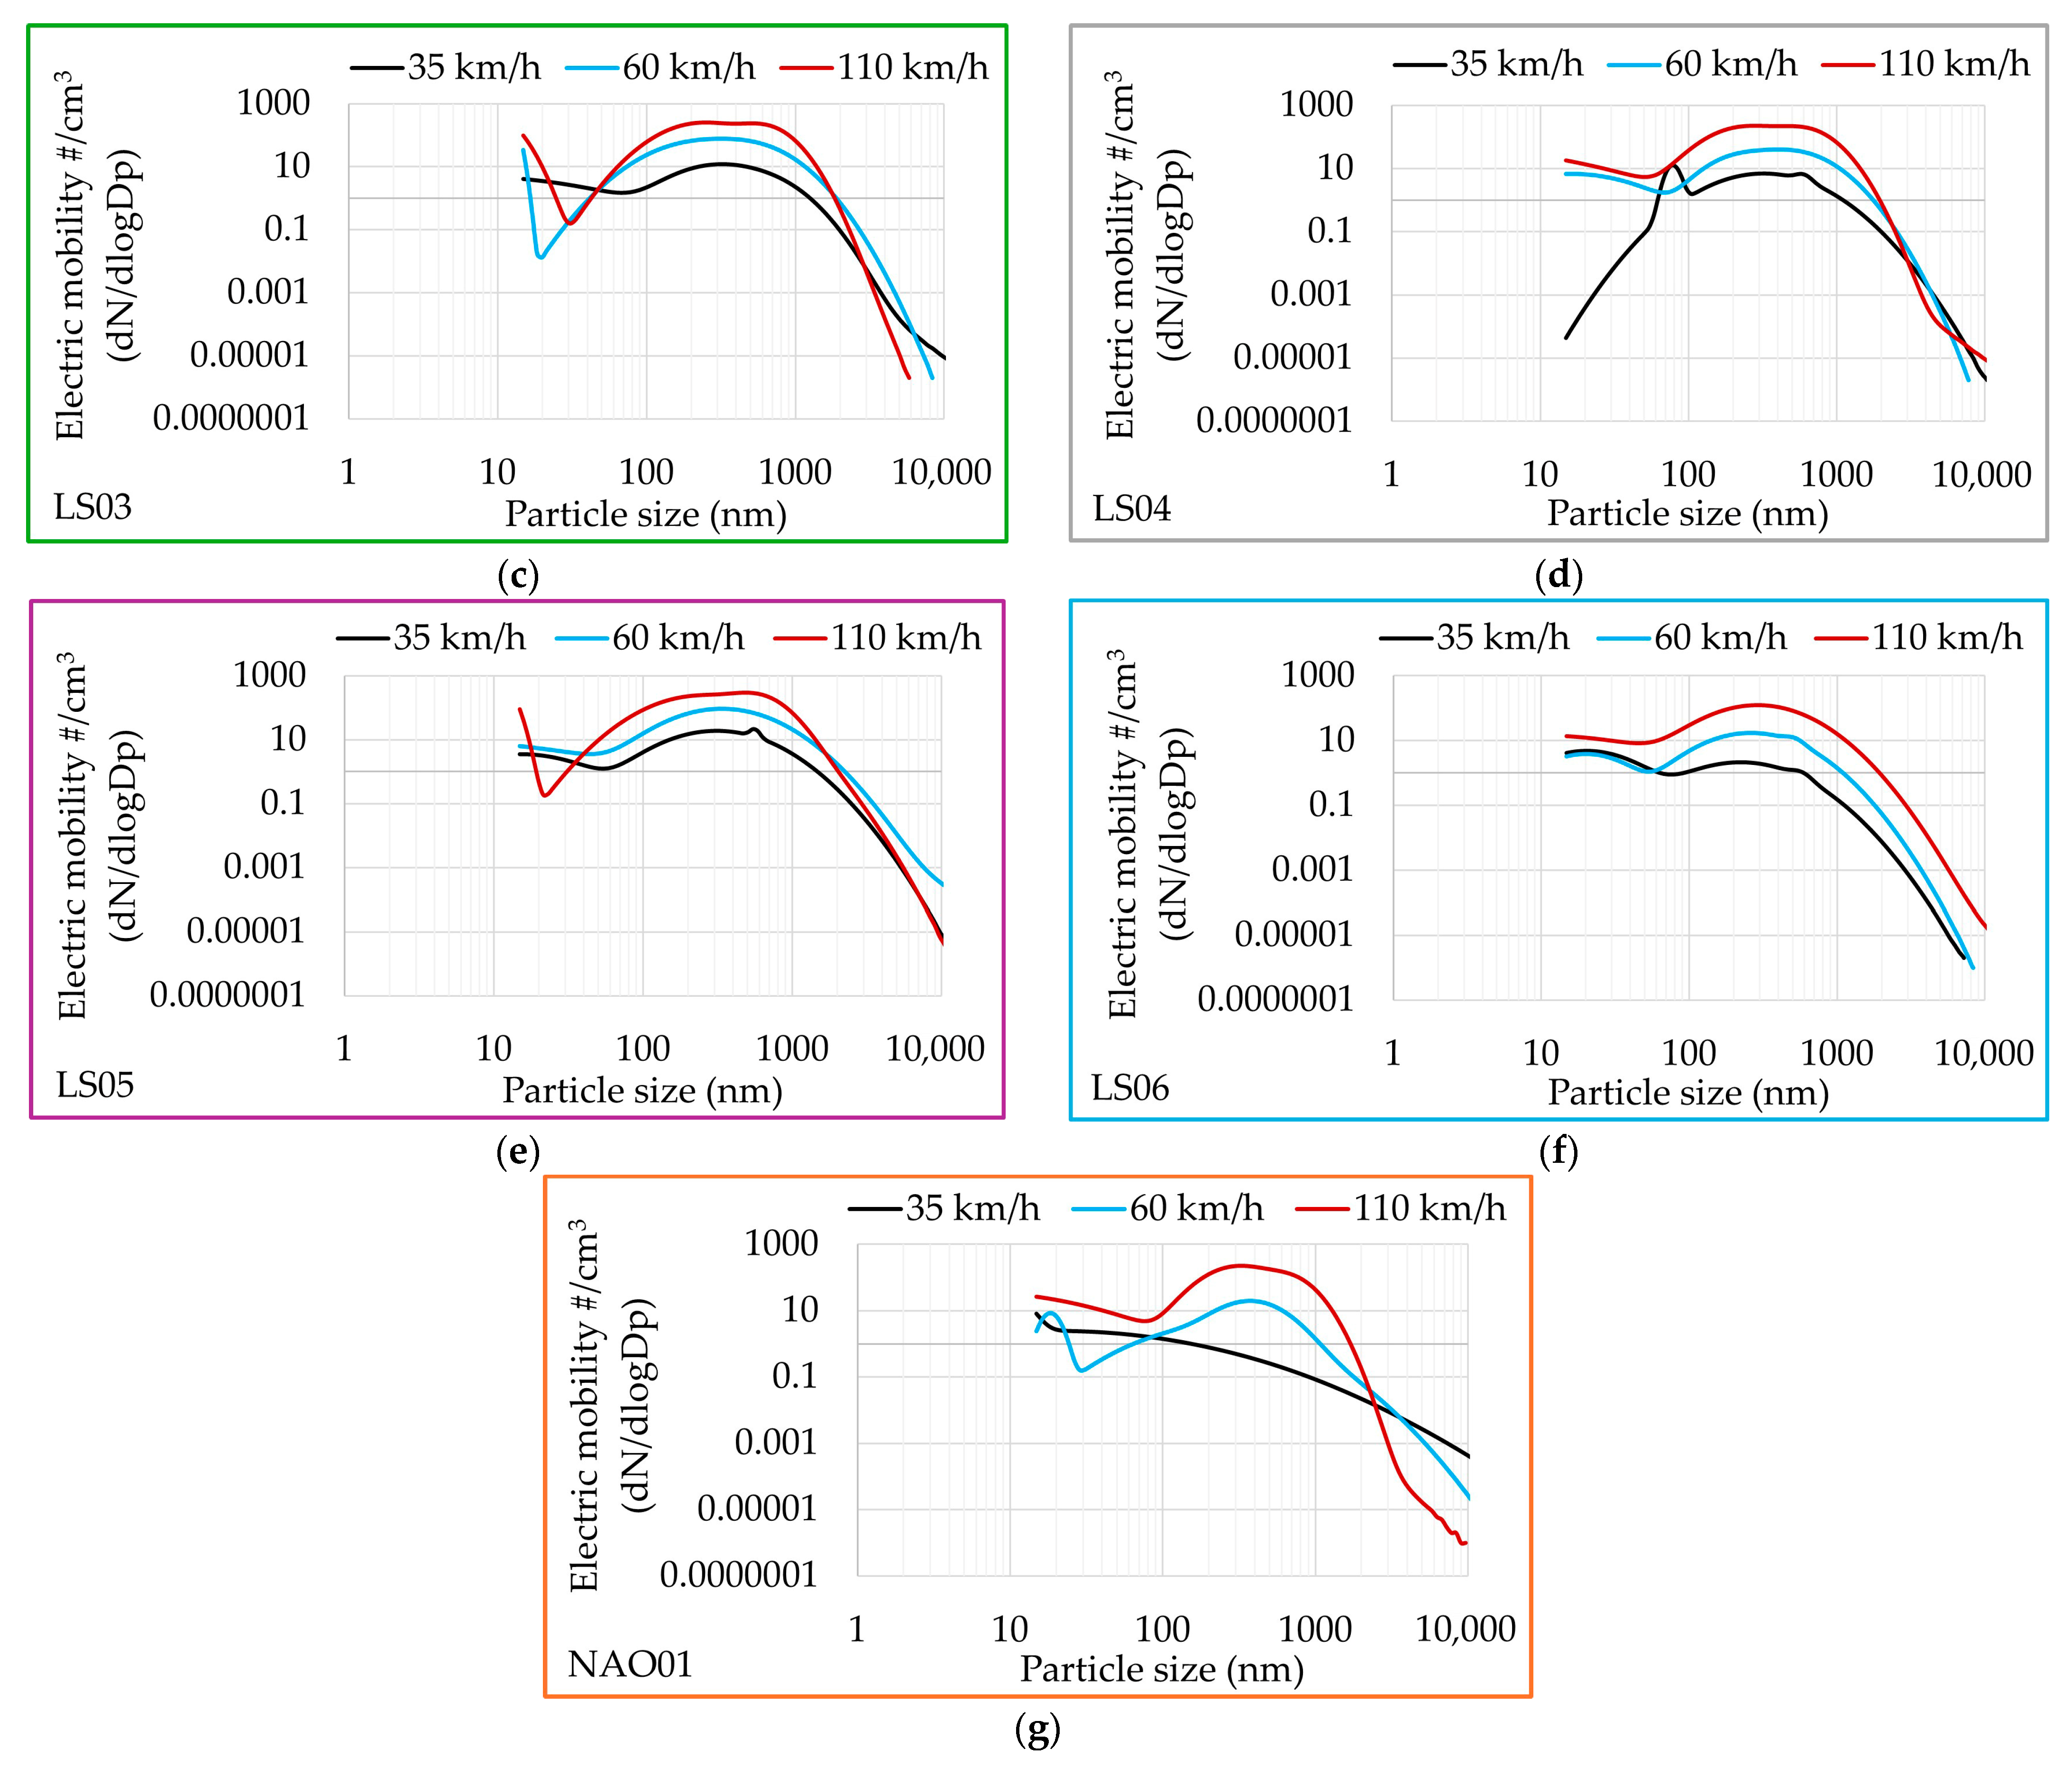
The Data Merge software (version 1.2.00, TSI Inc., Shoreview, MN, USA) was used to merge the raw data collected with the SMPS (TSI Inc., Shoreview, MN, USA) and APS (TSI Inc., Shoreview, MN, USA) devices to obtain particle size distribution curves over a large range of particle sizes (14 nm–20 µm), as presented in Figure 5. The measured particle sizes from our set-up are stable over time. This has been verified previously [32]. This was probably due to the testing approach which involved constant speed and normal pressure for each load. Furthermore, the comparison between the particle sizes shared with the two devices is consistent, which reinforces our conviction on the method.
The data averaged over the duration of the test cycle, presented In Figure 5, show the particle size distribution curve over the whole test, as well as the curves for each test speed, for each friction pair: 35 km/h, 60 km/h and 110 km/h. The particle size distribution in Figure 5 does not represent the immediate particle emissions but more precisely the long-term exposure.
These distributions are mainly submicron. LS01, LS02, LS03 and LS05 materials have a main mode between 300 nm and 550 nm at 35 km/h, while LS04 and LS06 materials have a main mode at 80 nm and 20 nm, respectively. These two materials also have a secondary mode between 300 nm and 550 nm. The NAO01 material does not show an identifiable distribution mode at 35 km/h (too low emissivity at 35 km/h). All materials have a main mode between 300 nm and 500 nm at 60 km/h. LS06 and NAO01 materials also exhibit a secondary mode at 20 nm. Main modes between 300 nm and 500 nm have been identified for all materials at 110 km/h. Furthermore, there is no emission of particles above 2 µm. Thus, even if the Euro 7 standard is focusing on the particulate matter mass emission, with this result, it makes possible to provide some correlations with the particle number concentration measurements, obtained with the TSI 3775 CPC (TSI Inc., Shoreview, MN, USA) (which has a measurement range between 4 nm et 3 µm).

3.4. Emission of PM10

The emission factor EFPM10 of the seven friction pairs, presented in Table 7, was calculated using Equation (1). A negative emission factor for the NAO01 material was found, with the final mass of the PTFE filter (mff) being smaller than the initial PTFE filter mass (mfi). The amount of particulate matter generated during the loading sequences between the NAO01 material and the cast iron disc, which was 1 µg, was too small and under the quantification limit of the measuring system, i.e., corresponding to a PM10 emission factor of 0.54 µg/km. An emission factor of −0.49 μg/km was calculated, but a value of < 0.54 μg/km was assigned for the NAO01 material in Table 7. The most emissive materials are LS02, LS03 and LS05 with emission factors of 7.06 μg/km, 6.76 μg/km and 6.88 μg/km, respectively. The emission factor of the LS01 reference material is 4.10 μg/km. LS04 and LS06 are the least emissive with NAO01 material, with emission factors of 3.15 μg/km and 1.75 μg/km, respectively. LS04 and LS06 reduce PM10 emissions by 23% and 57%, respectively, compared to the LS01 reference material.

3.5. Light Microscopy and Scanning Electron Microscopy

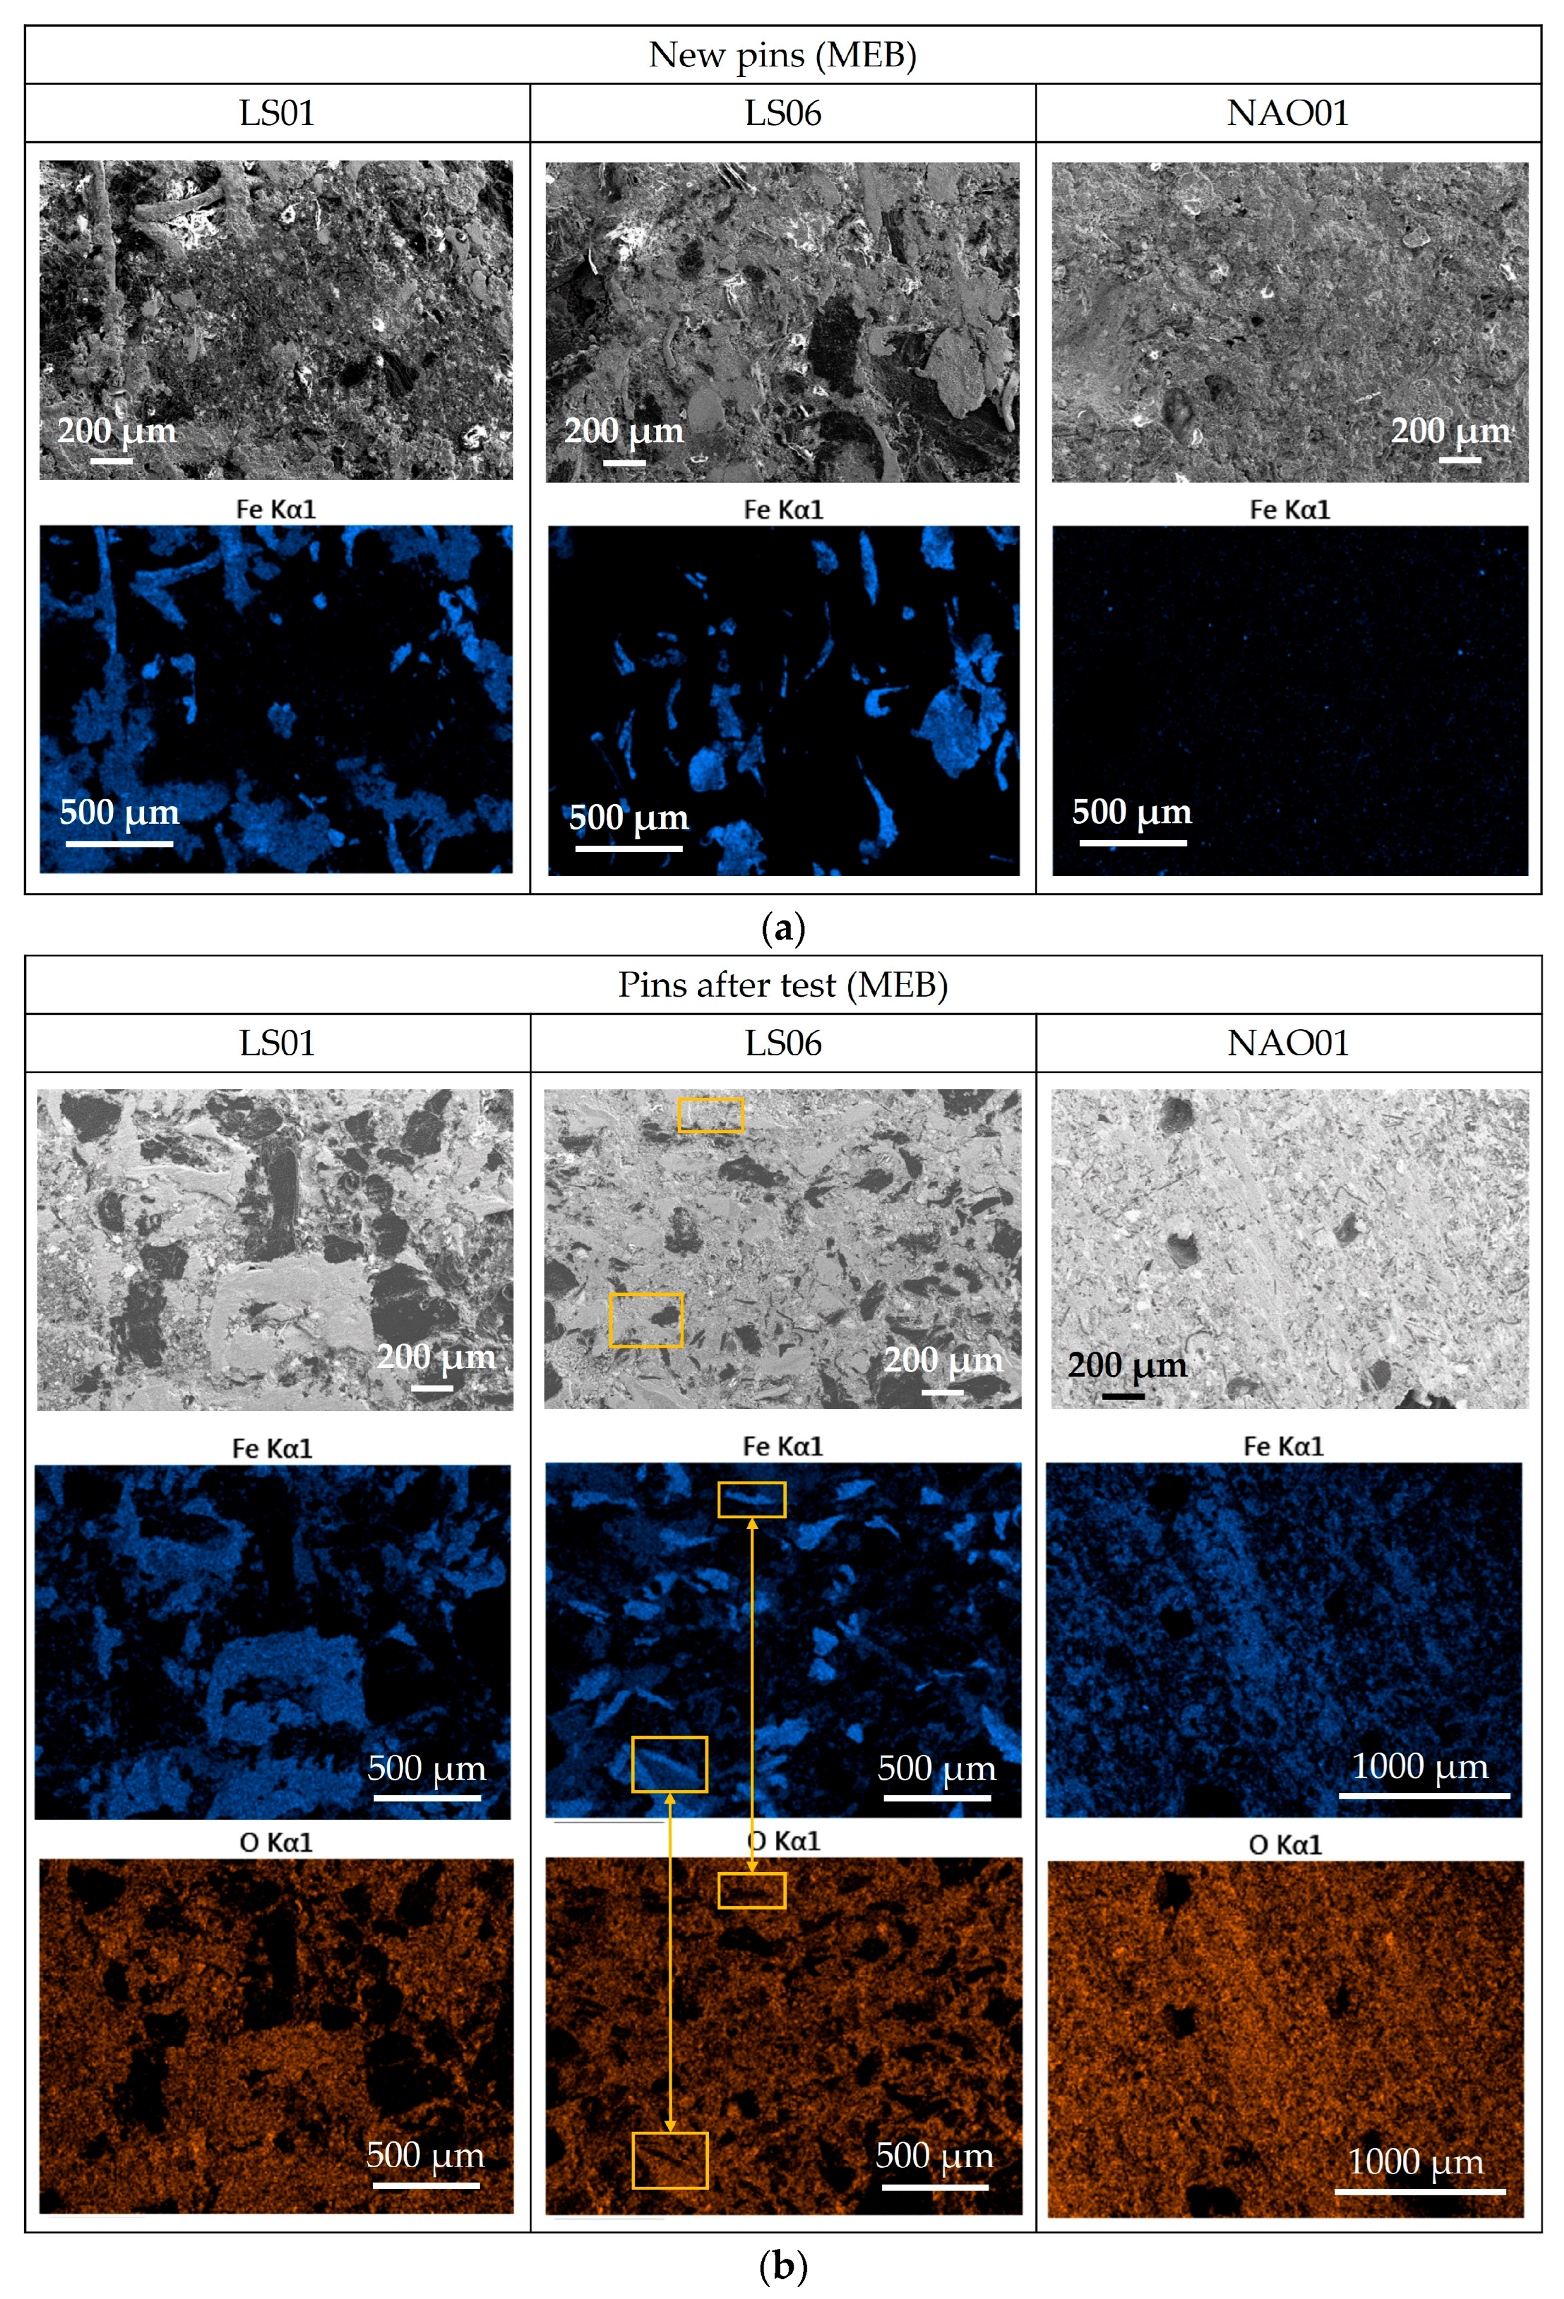
The seven pins and seven discs were analysed before and after the test using a light microscope (KH-8700) (Hirox Europe, Limonest, France) and a scanning electron microscope (Sigma 300 VP, Zeiss) combined with energy-dispersive X-ray spectroscopy (EDS X-MaxN (Oxford Instruments, Abingdon, UK).
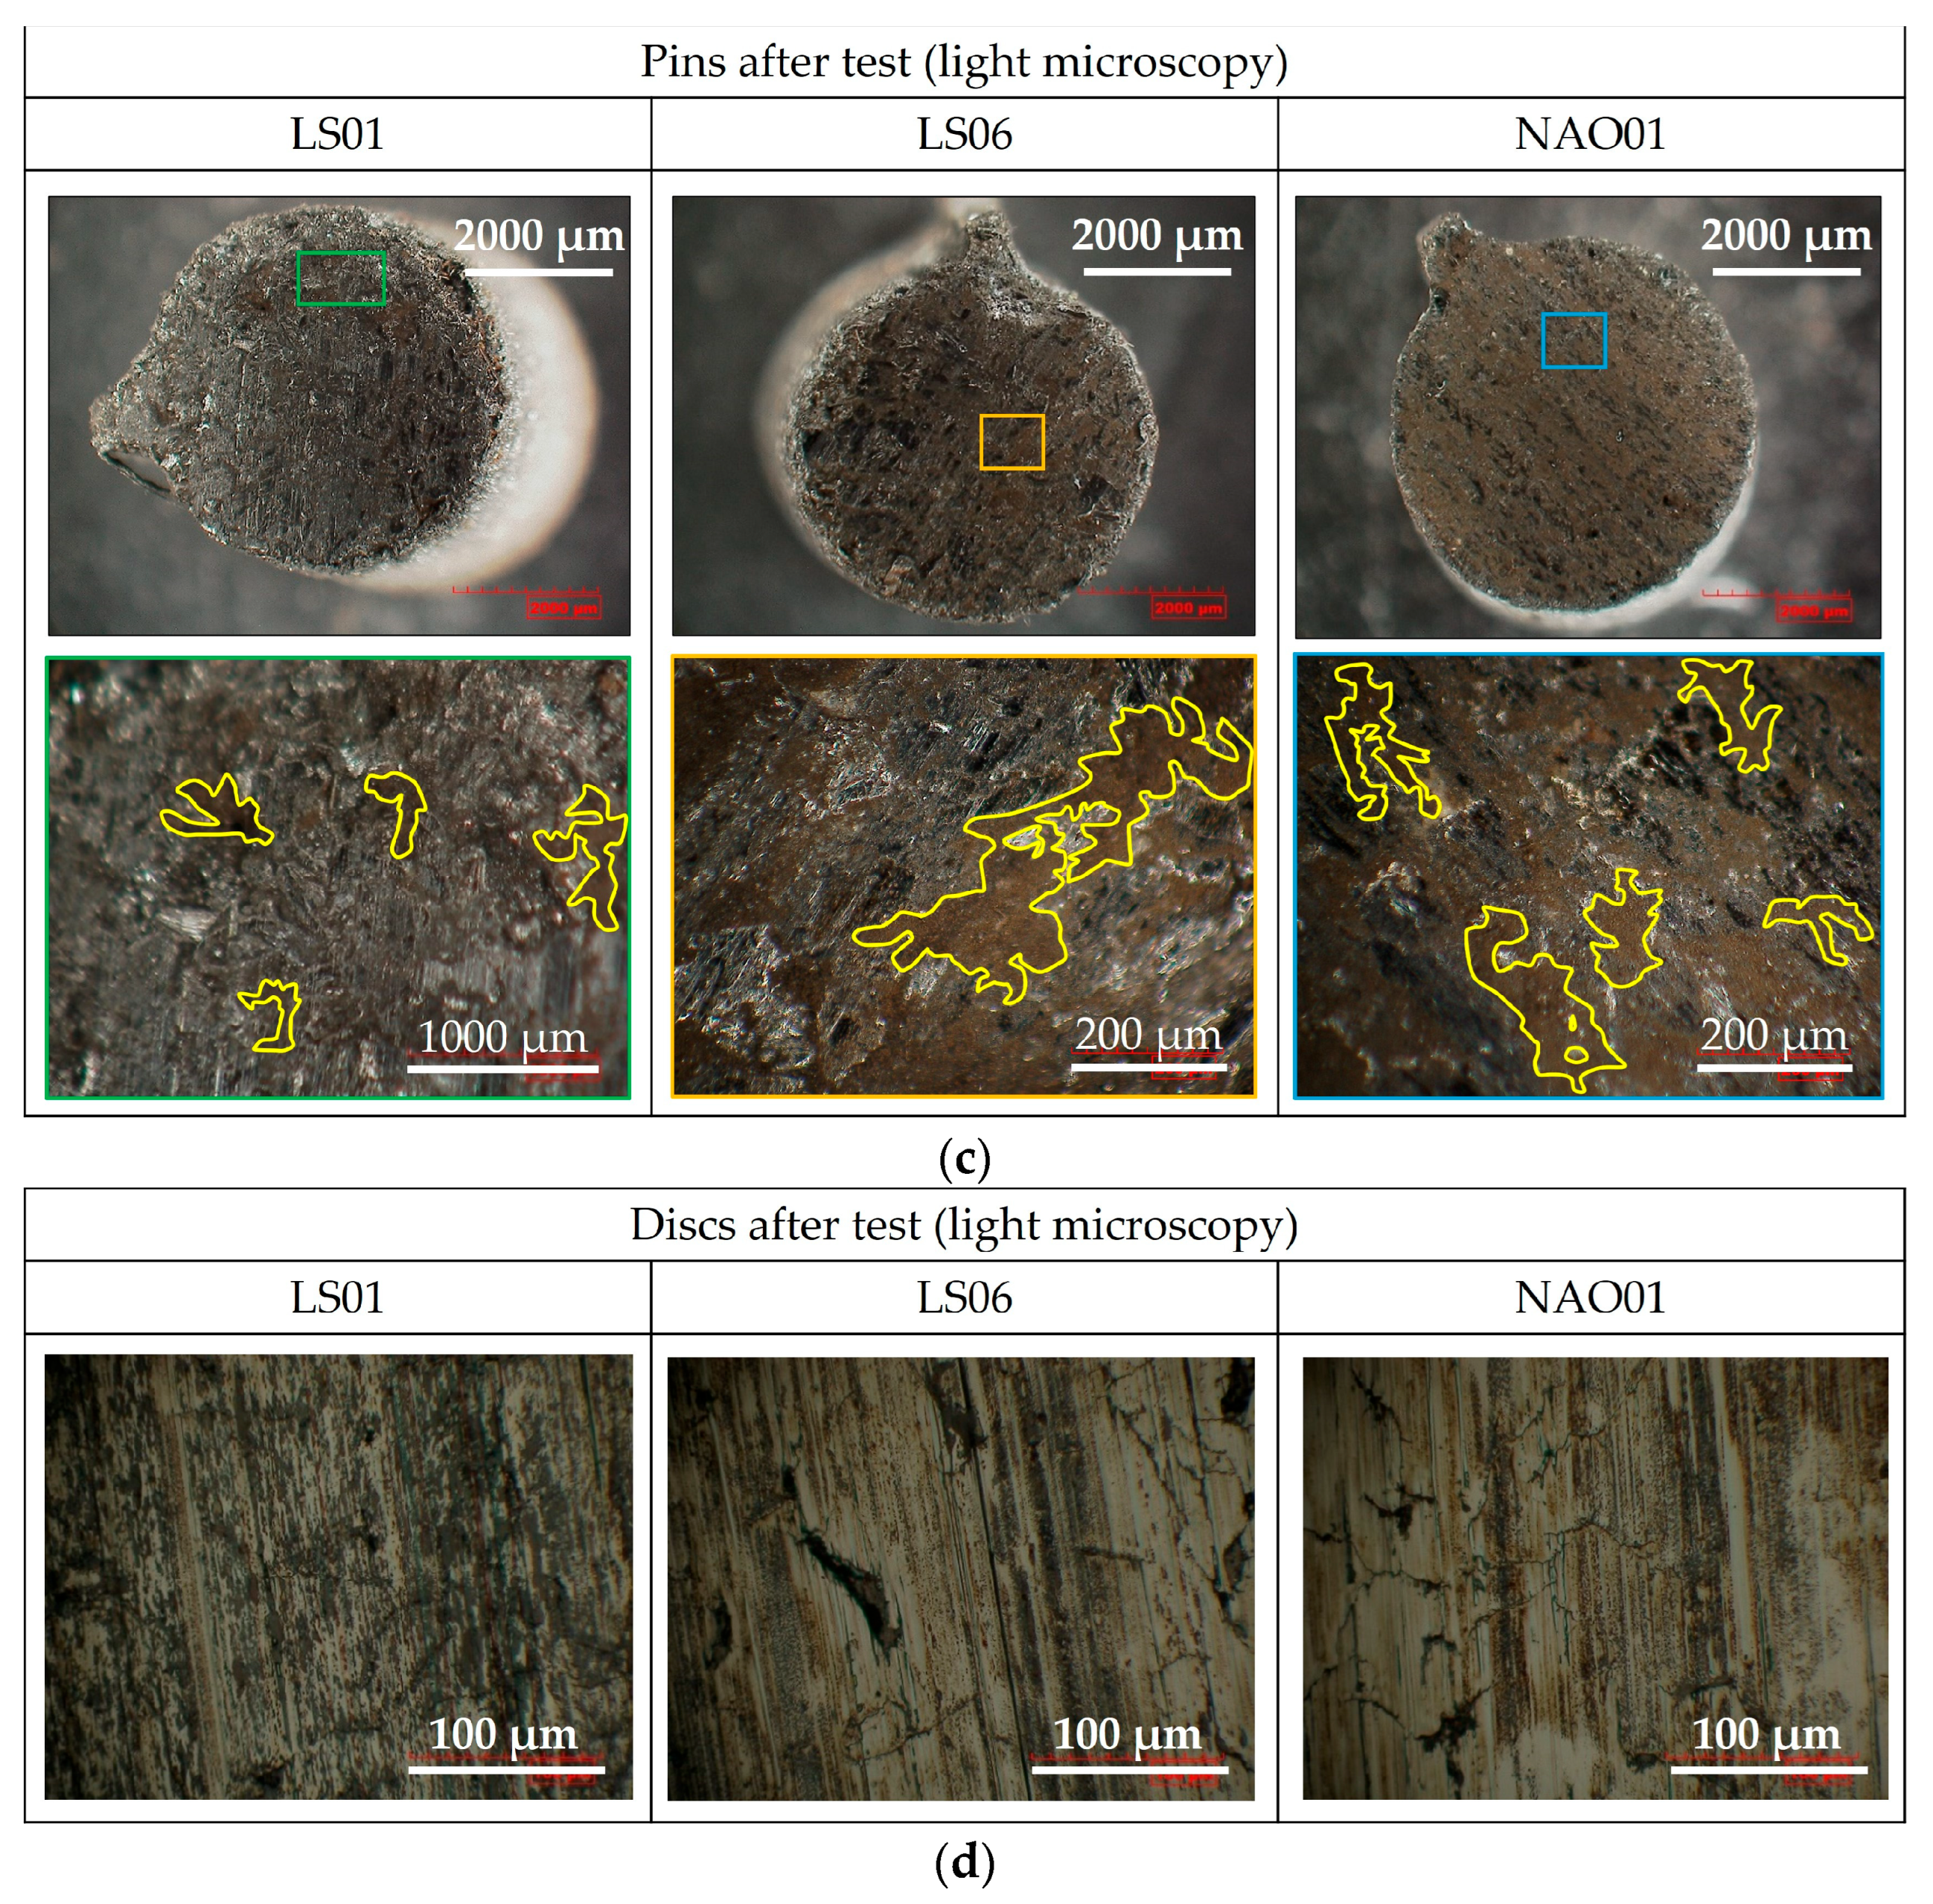
Optical microscope images show the presence of ‘brown deposits’ in Figure 6c. Some of the ‘brown deposits’ observed on the pins are surrounded in yellow in the following figures. This deposit covers the surface of the NAO01 pin in a homogeneous way, but it covers the surface of the LS01 pin in a heterogeneous way. The amount of deposit on the surface of the LS06 pin appears to be higher than that on the surface of the LS01 pin and is less homogeneous than the deposit on the surface of the NAO01 pion.
Brake discs were also observed under a light microscope (Figure 6). The white colour represents grey lamellar cast iron. Microcracks perpendicular to the direction of friction are also present. On the surface of the brake disc tested with LS01 material, thick and dark-coloured deposits are observed, while on the discs tested with LS06 and NAO01 materials, fine, light-coloured deposits are observed. Differences are therefore observed according to the composition of the brake pad, both on the surface of the pins and the discs.
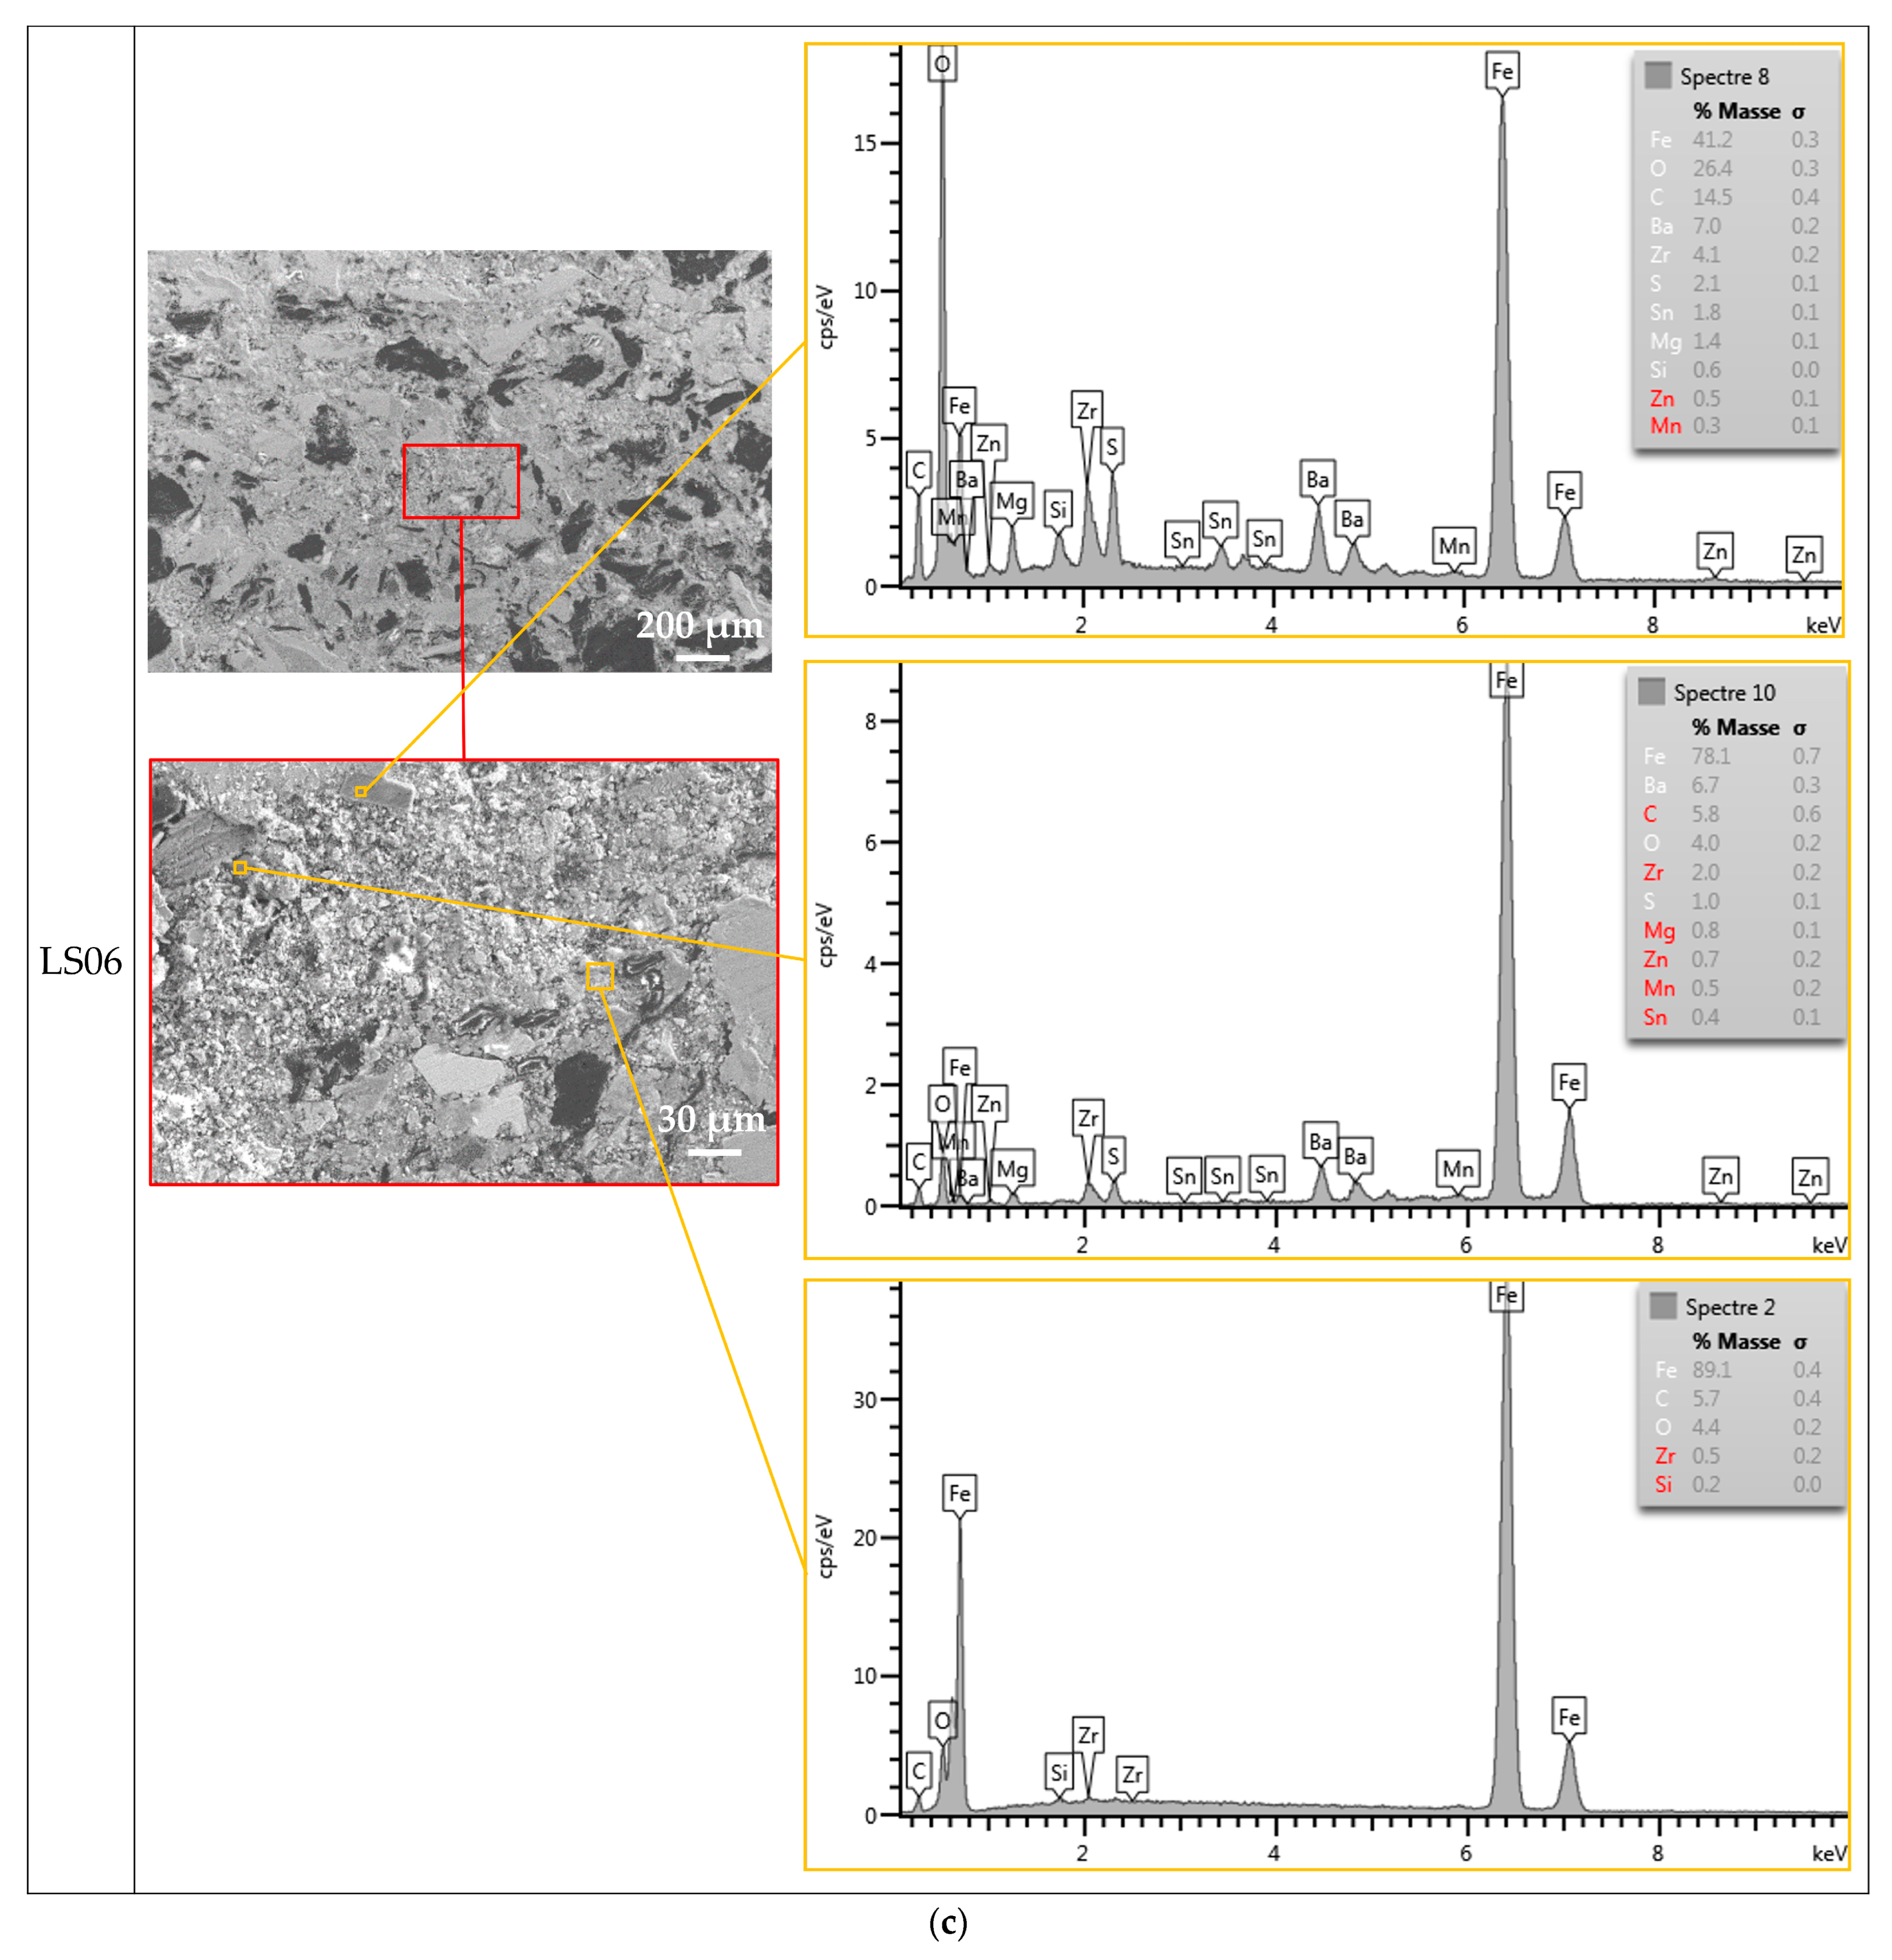
The SEM images of the pins show the formation of large plateaus, heterogeneously distributed on the surface of the LS01 pin (Figure 7). EDS analyses show similarities between the mappings of the iron and oxygen. The iron content on the surface of the pin is 20.0 ± 0.1 wt.%. On the surface of the LS06 pin, the presence of unoxidized iron, looking like steel fibres, is observed, indicated by orange arrows in Figure 6, in contrast to the results of a scientific study showing a reduction in emissions when the steel fibres were coated with a friction layer [37]. Small deposits of oxidised iron are also observed on the surface of the LS06 pin. The iron contents on the surface of the LS06 pin and LS04 pin are 17.0 ± 0.0 wt.% and 13.3 ± 0.0 wt.%, respectively, which are lower than that on the surface of the LS01 pin. Finally, on the surface of the NAO01 pin, the formation of a uniform iron oxide friction layer (film) was observed. EDS analyses show that the amount of iron on the surface of the NAO01 pin equals 11.9 ± 0.0 wt.%, which is also lower than the amount of iron on the surface of the LS01 pin.

3.6. Particle Chemistry (PM10)

The particles collected on the PTFE filters were analysed by ICP-MS or ICP-OES according to the chemical elements to be detected. The mass concentration of each chemical element found in the PM10 collected on the PTFE filters is presented in Table 8. In this table, the empty cells represent instances when the chemical element was detected below its limit of quantification. Iron is the chemical element mainly detected in the particles emitted, between 2.60 μg/m3 and 76.50 μg/m3 depending on the friction pairs. Most of the chemicals found in the brake pads are also found in PM10 [38]. The PM10 emissions obtained with LS04 have the highest content of barium, which is consistent with the chemical composition of the material. However, even if the LS06 and LS04 friction materials have the same content of barium sulphate in their formula, PM10 emissions from LS06 friction material presents a lower amount of barium than the PM10 generated by LS04 friction material. In fact, LS06 and LS04 friction materials contain different abrasives. LS06 contains zirconium dioxide and magnesium oxide, whereas LS04 contains chromite and magnesium oxides. Barium can only be found in the friction materials. LS06 friction material generates less emissions than the LS04 friction material. Thus, the lower content of barium found in the PM10 generated by the LS06 friction material is consistent with its composition. Finally, the low barium emissions observed in the PM10 assessment could be attributed to the low emissions observed with the LS06 friction material.

3.7. Roughness of the Brake Discs After Test

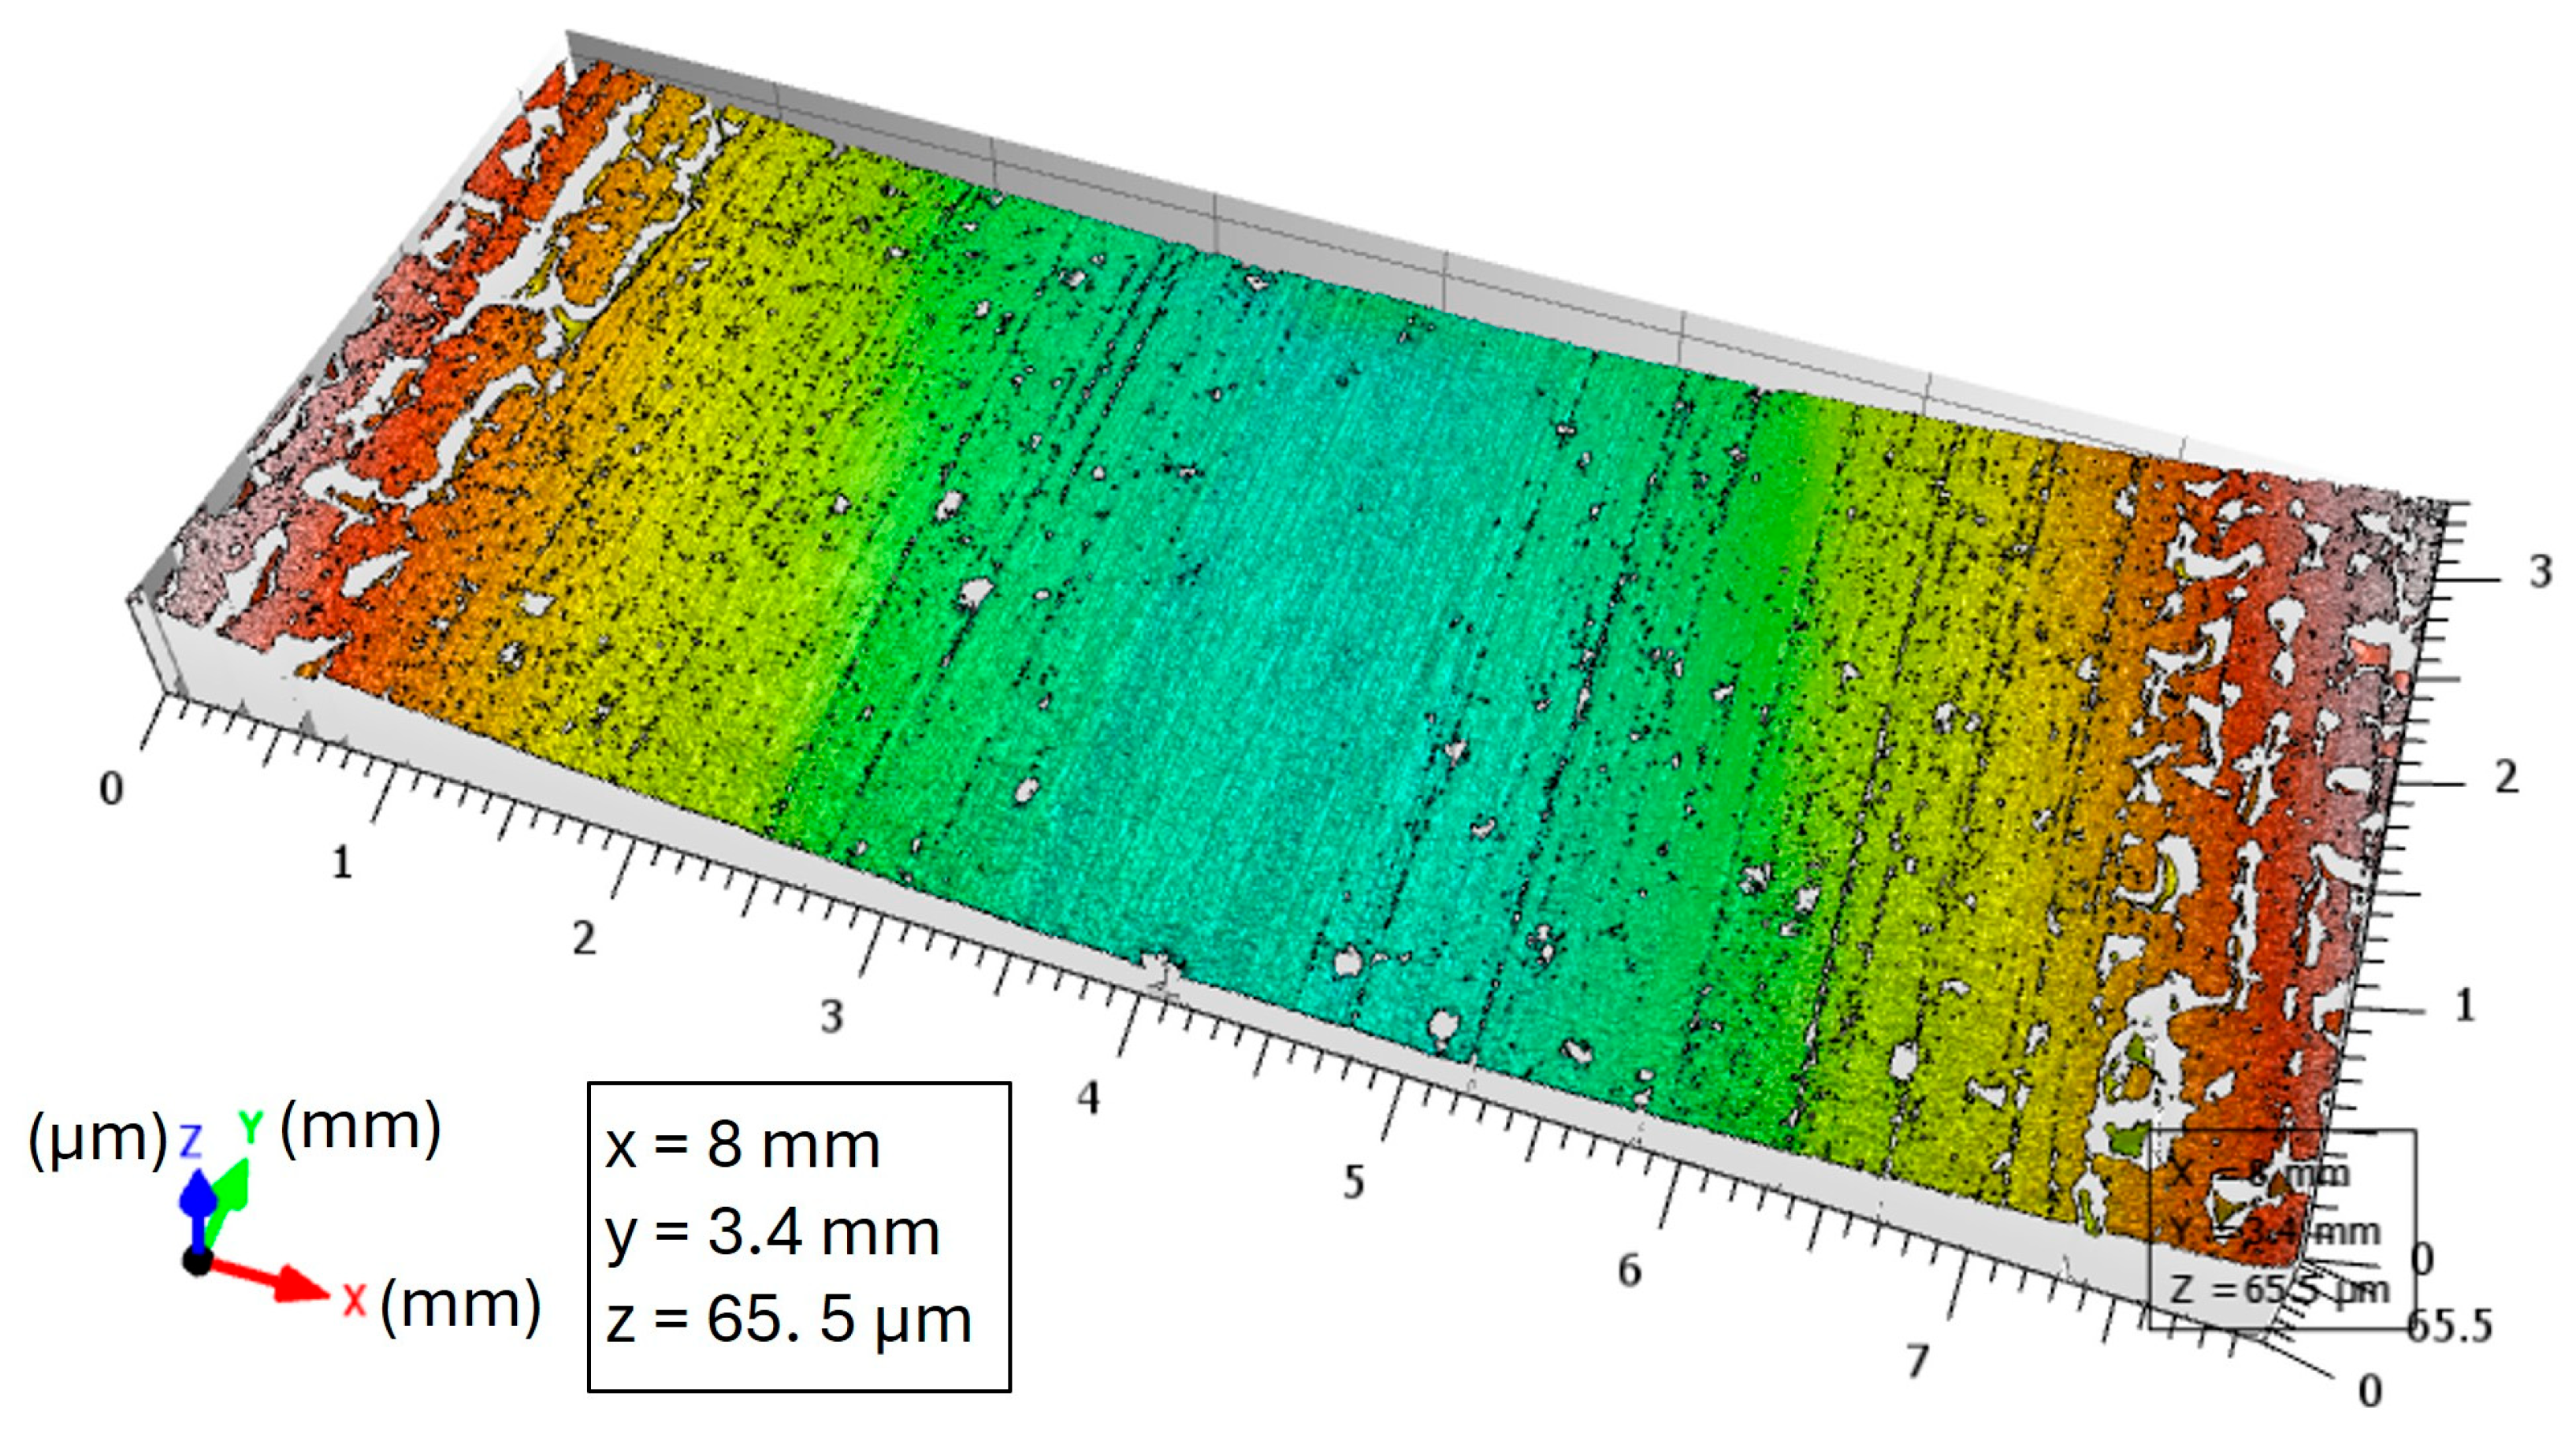
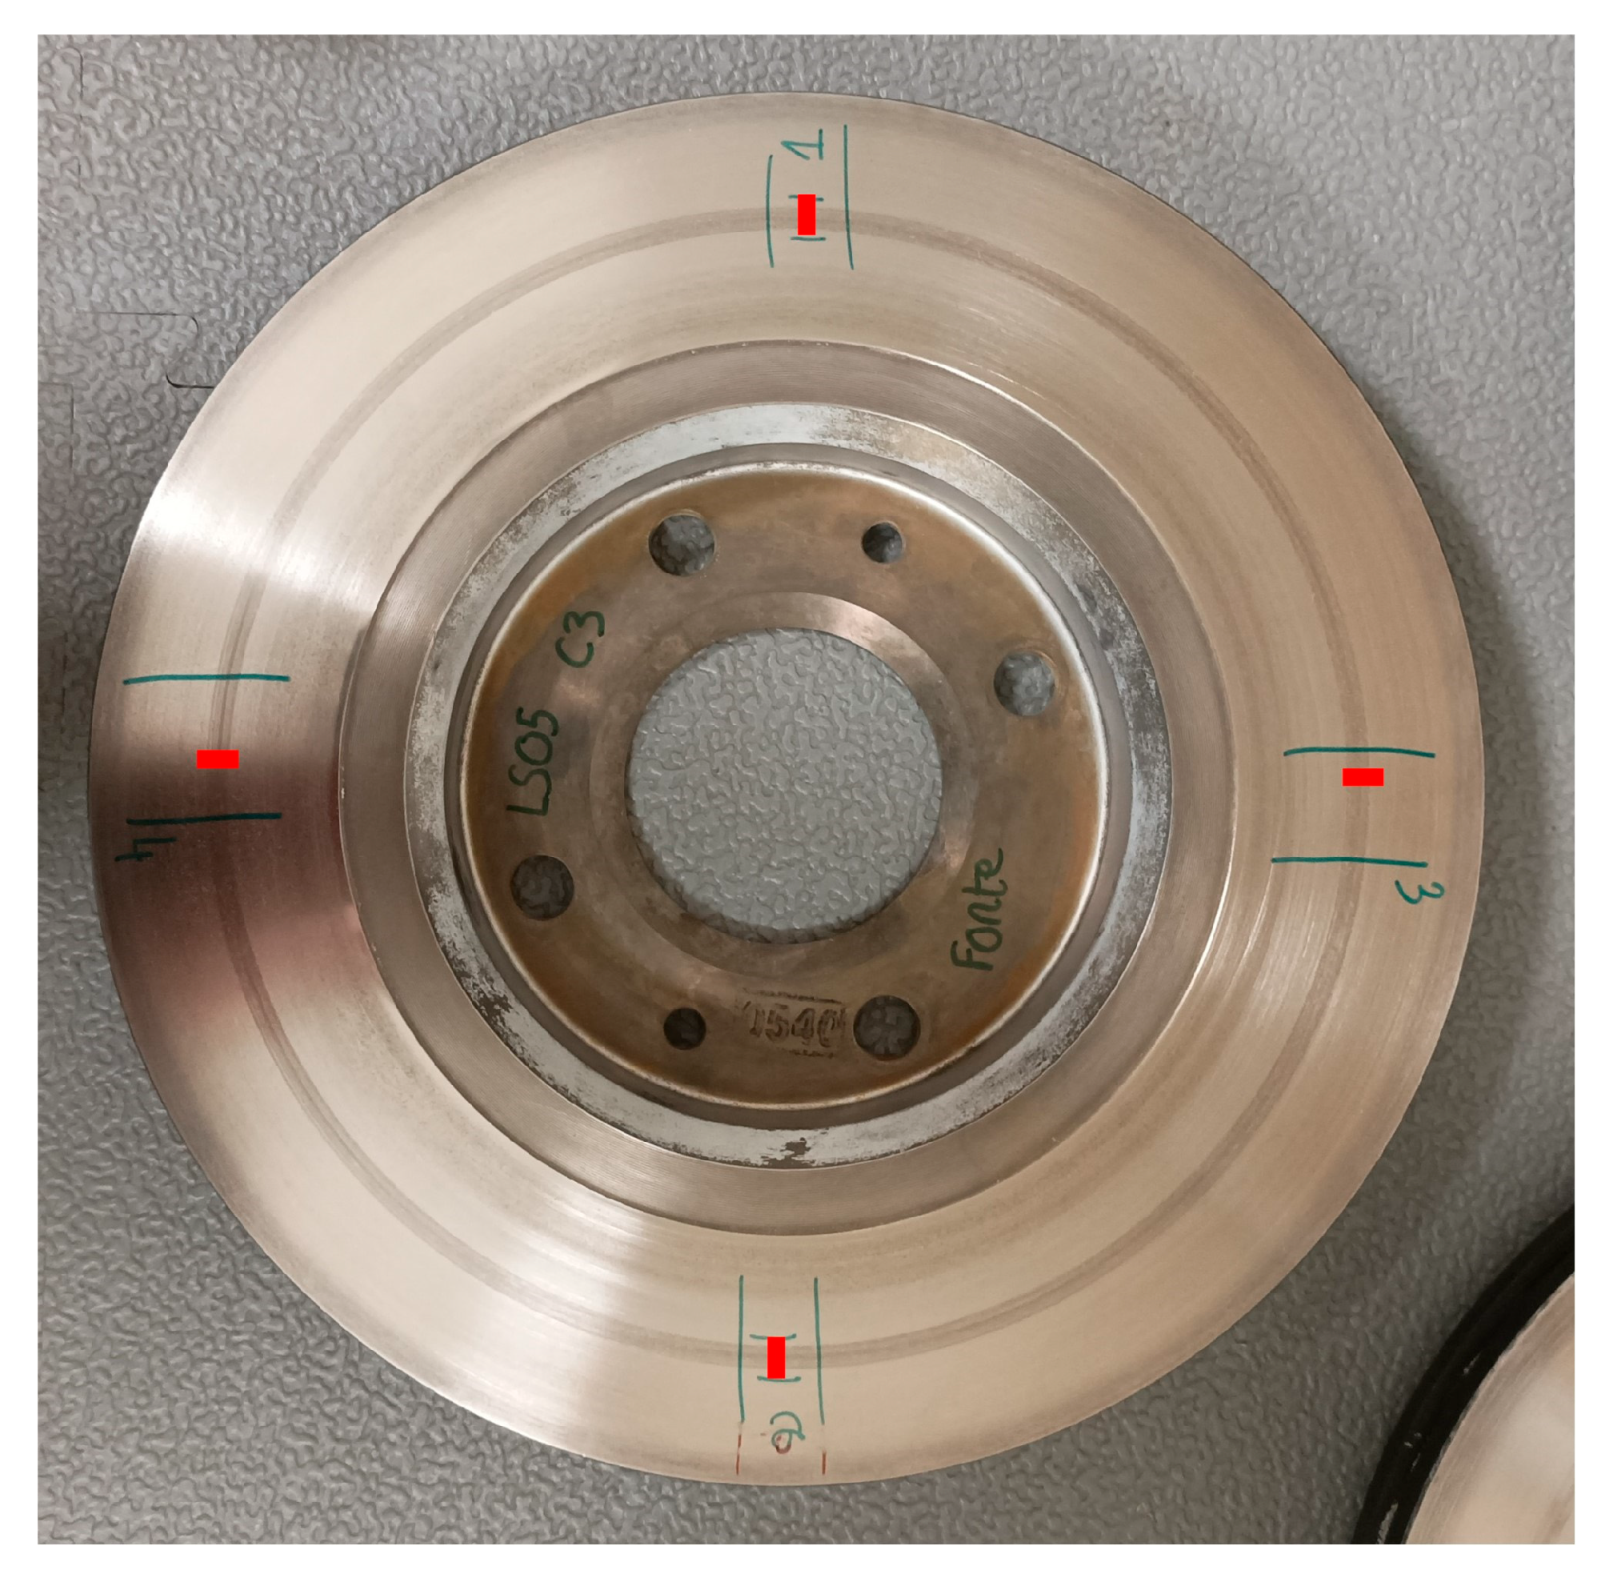
The roughness values (Rp, Rv and Ra) of the seven brake discs was measured to try to understand whether a relationship exists between the final roughness of the discs and the particle emission. The samples used for the roughness analyses are 8 mm long and 3.5 mm wide (Figure 8). Four samples, spaced 90° apart, are analysed per disc (Figure 9). Then, during analysis, each sample is scanned 480 times in the plane (XZ), i.e., in the radial direction of the disc. The 480 surface conditions profiles are overlaid in the plane (XZ) and are shown in grey on Figure 10. The blue profile drawn on Figure 10 represents profile no.1/480.
The average roughness values of the seven brake discs are summarised in Table 9. After the test, the brake disc used with NAO01 material had a lower roughness than the other rotors tested with Low Steel materials. On the other hand, no correlation was found between the roughness of the disc after the test and the emission of particles (neither particle number concentration nor PM10), unlike another scientific study [37]. The disc roughness after testing depends on the disc surface and the deposits (friction layers) produced by the solicitation and is highly dependent on the friction material itself and many other parameters. These parameters are the capacity to fill the disc surface interstices, the production of different sizes of debris, the hardness of the debris, etc. As a result, the final disc roughness is difficult to predict. Thus, the absence of correlation between surface roughness and PM10 emissions for LS pads is probably caused by the multiplication of divergent parameters which alter the roughness in different manners.

4. Discussion

This work was performed to understand the influence of the friction materials, especially their raw materials, on particle emissions, as well as the wear mechanisms involved in the emissions of particles. Six Low Steel materials and one NAO material were tested, and three materials can significantly reduce the particle number and mass emissions: LS04, LS06 and NAO01 [18,19].

4.1. Particle Number Emissions

Several correlations were identified with the average particle number concentration. This work was performed with data on LS01 material. Correlations were observed for all friction materials, except where otherwise stated.
The frictional power generated during each loading sequence was calculated with Equation (2), where the frictional power depends on the friction coefficient, µ; the normal force, FN; (in N) and the sliding velocity, v (in m/s). The friction coefficient is the ratio of the normal force, FN (in N), and the tangential force, FT (in N), as mentioned in Equation (2).
P = µ F N v   ;   µ = a b s F T F N
Figure 11 presents the average particle number concentration calculated for each loading sequence, for a total of 50 sequences, plotted as a function of the corresponding frictional power (in Watt). A correlation between the particle number emission and the frictional power is observed: the particle number concentration increases with frictional power according to a power law [19,29,39]. Using the frictional power, the total surface-specific dissipated energy during the test could be calculated. Considering a friction duration of 10 s per loading sequence and a pin of 5 mm in diameter, the total surface-specific dissipated energy during this test is around 1151 J/mm2. The difference with the theoretical value with a real brake tested on a dynamometer bench is thus around 5.7%. As this value seems acceptable, we can consider that our ‘emission cycle’ and the test parameters used for the tests on the pin-on-disc bench are representative of real-life conditions.
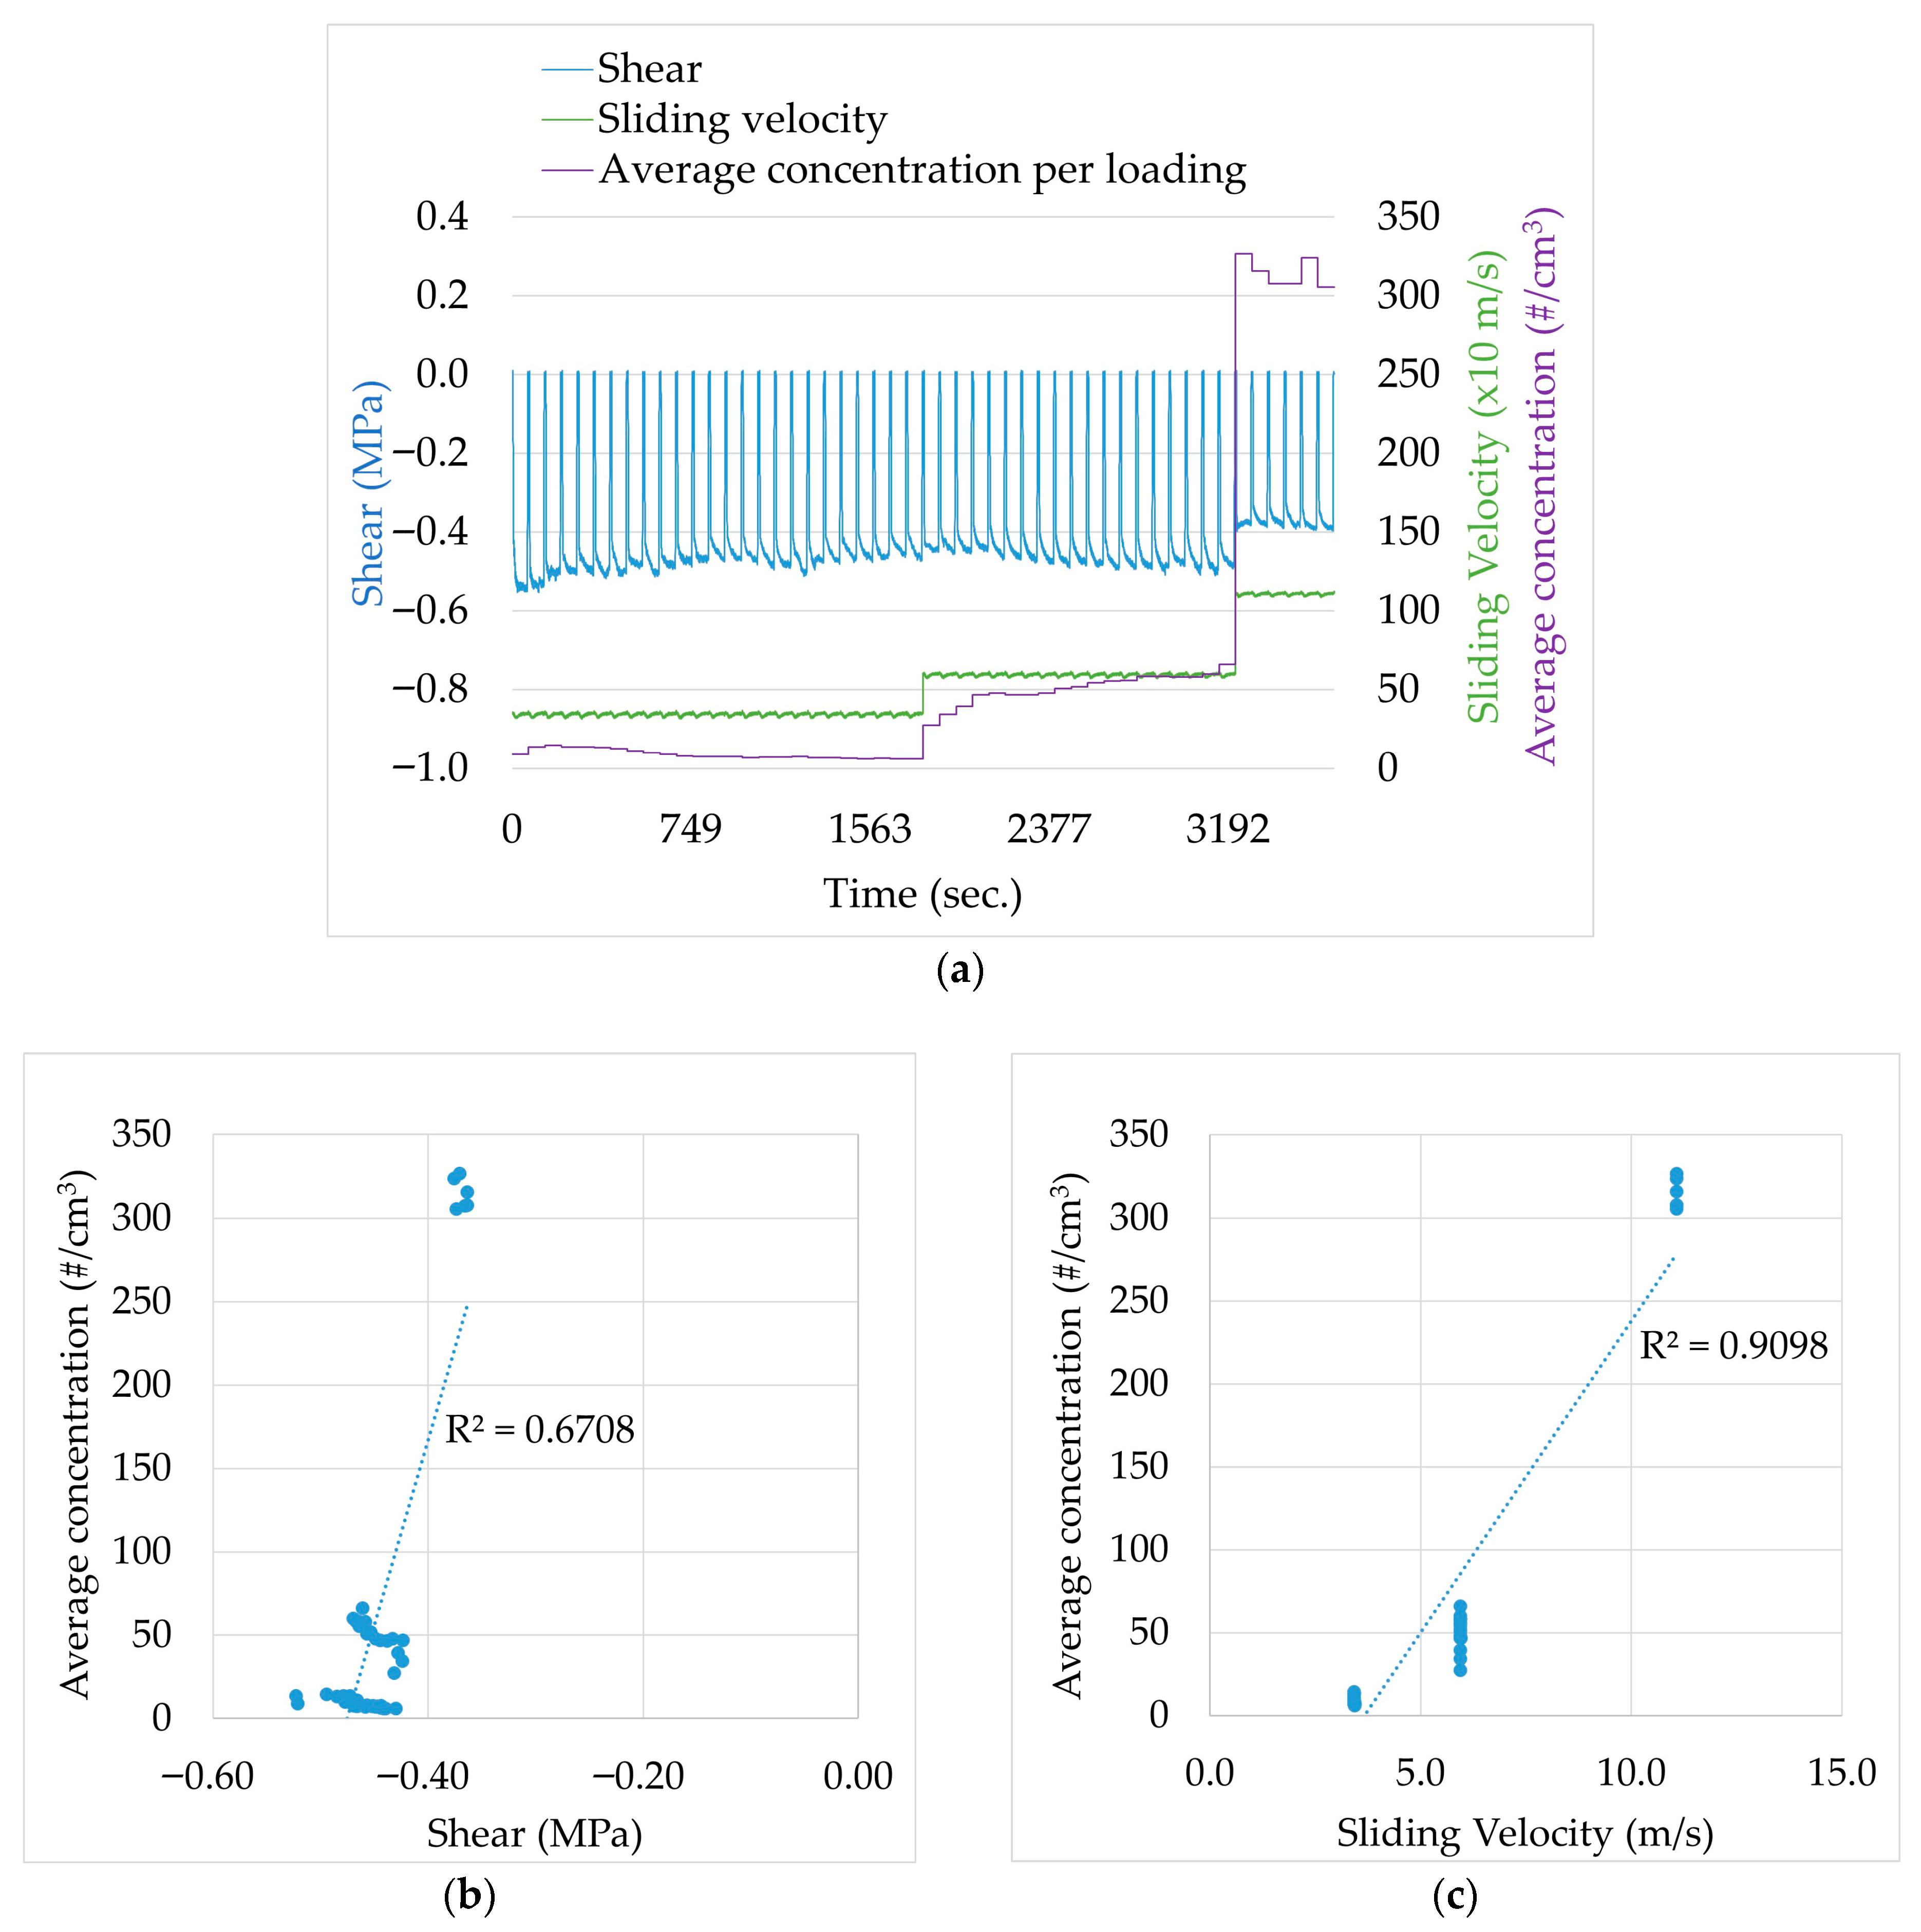
For each loading sequence, the shear stress (the ratio of the tangential force to the surface of the pin) was compared to the sliding velocity and to the average particle number concentration. Figure 12a shows the sliding velocity and shear stress data at a frequency of 100 Hz, and the raw data of the particle number concentration are recorded at a frequency of 1 Hz. The particle number concentration values shown in Figure 12a are average values calculated over a duration of 70 s, including 10 s of loading and the 60 s period after loading (unloading phase). The sliding velocity and shear stress curves shown in Figure 12a do not consider the 60 s period after loading.
This analysis shows the correlation between the sliding velocity and the particle number emission: the higher the sliding velocity, the higher the average particle number concentration (Figure 12c) [19,39,40]. In addition, the shear stress, expressed in MPa, changes with the sliding velocity (Figure 12a): as the sliding velocity increases, the average absolute value of the tangential force (and the coefficient of friction) decreases. This correlation is not observed with the NAO01 material.
In addition, the existence of a correlation between the average shear stress values (and coefficient of friction) and the average particle number concentration (Figure 12b) does not appear clearly.
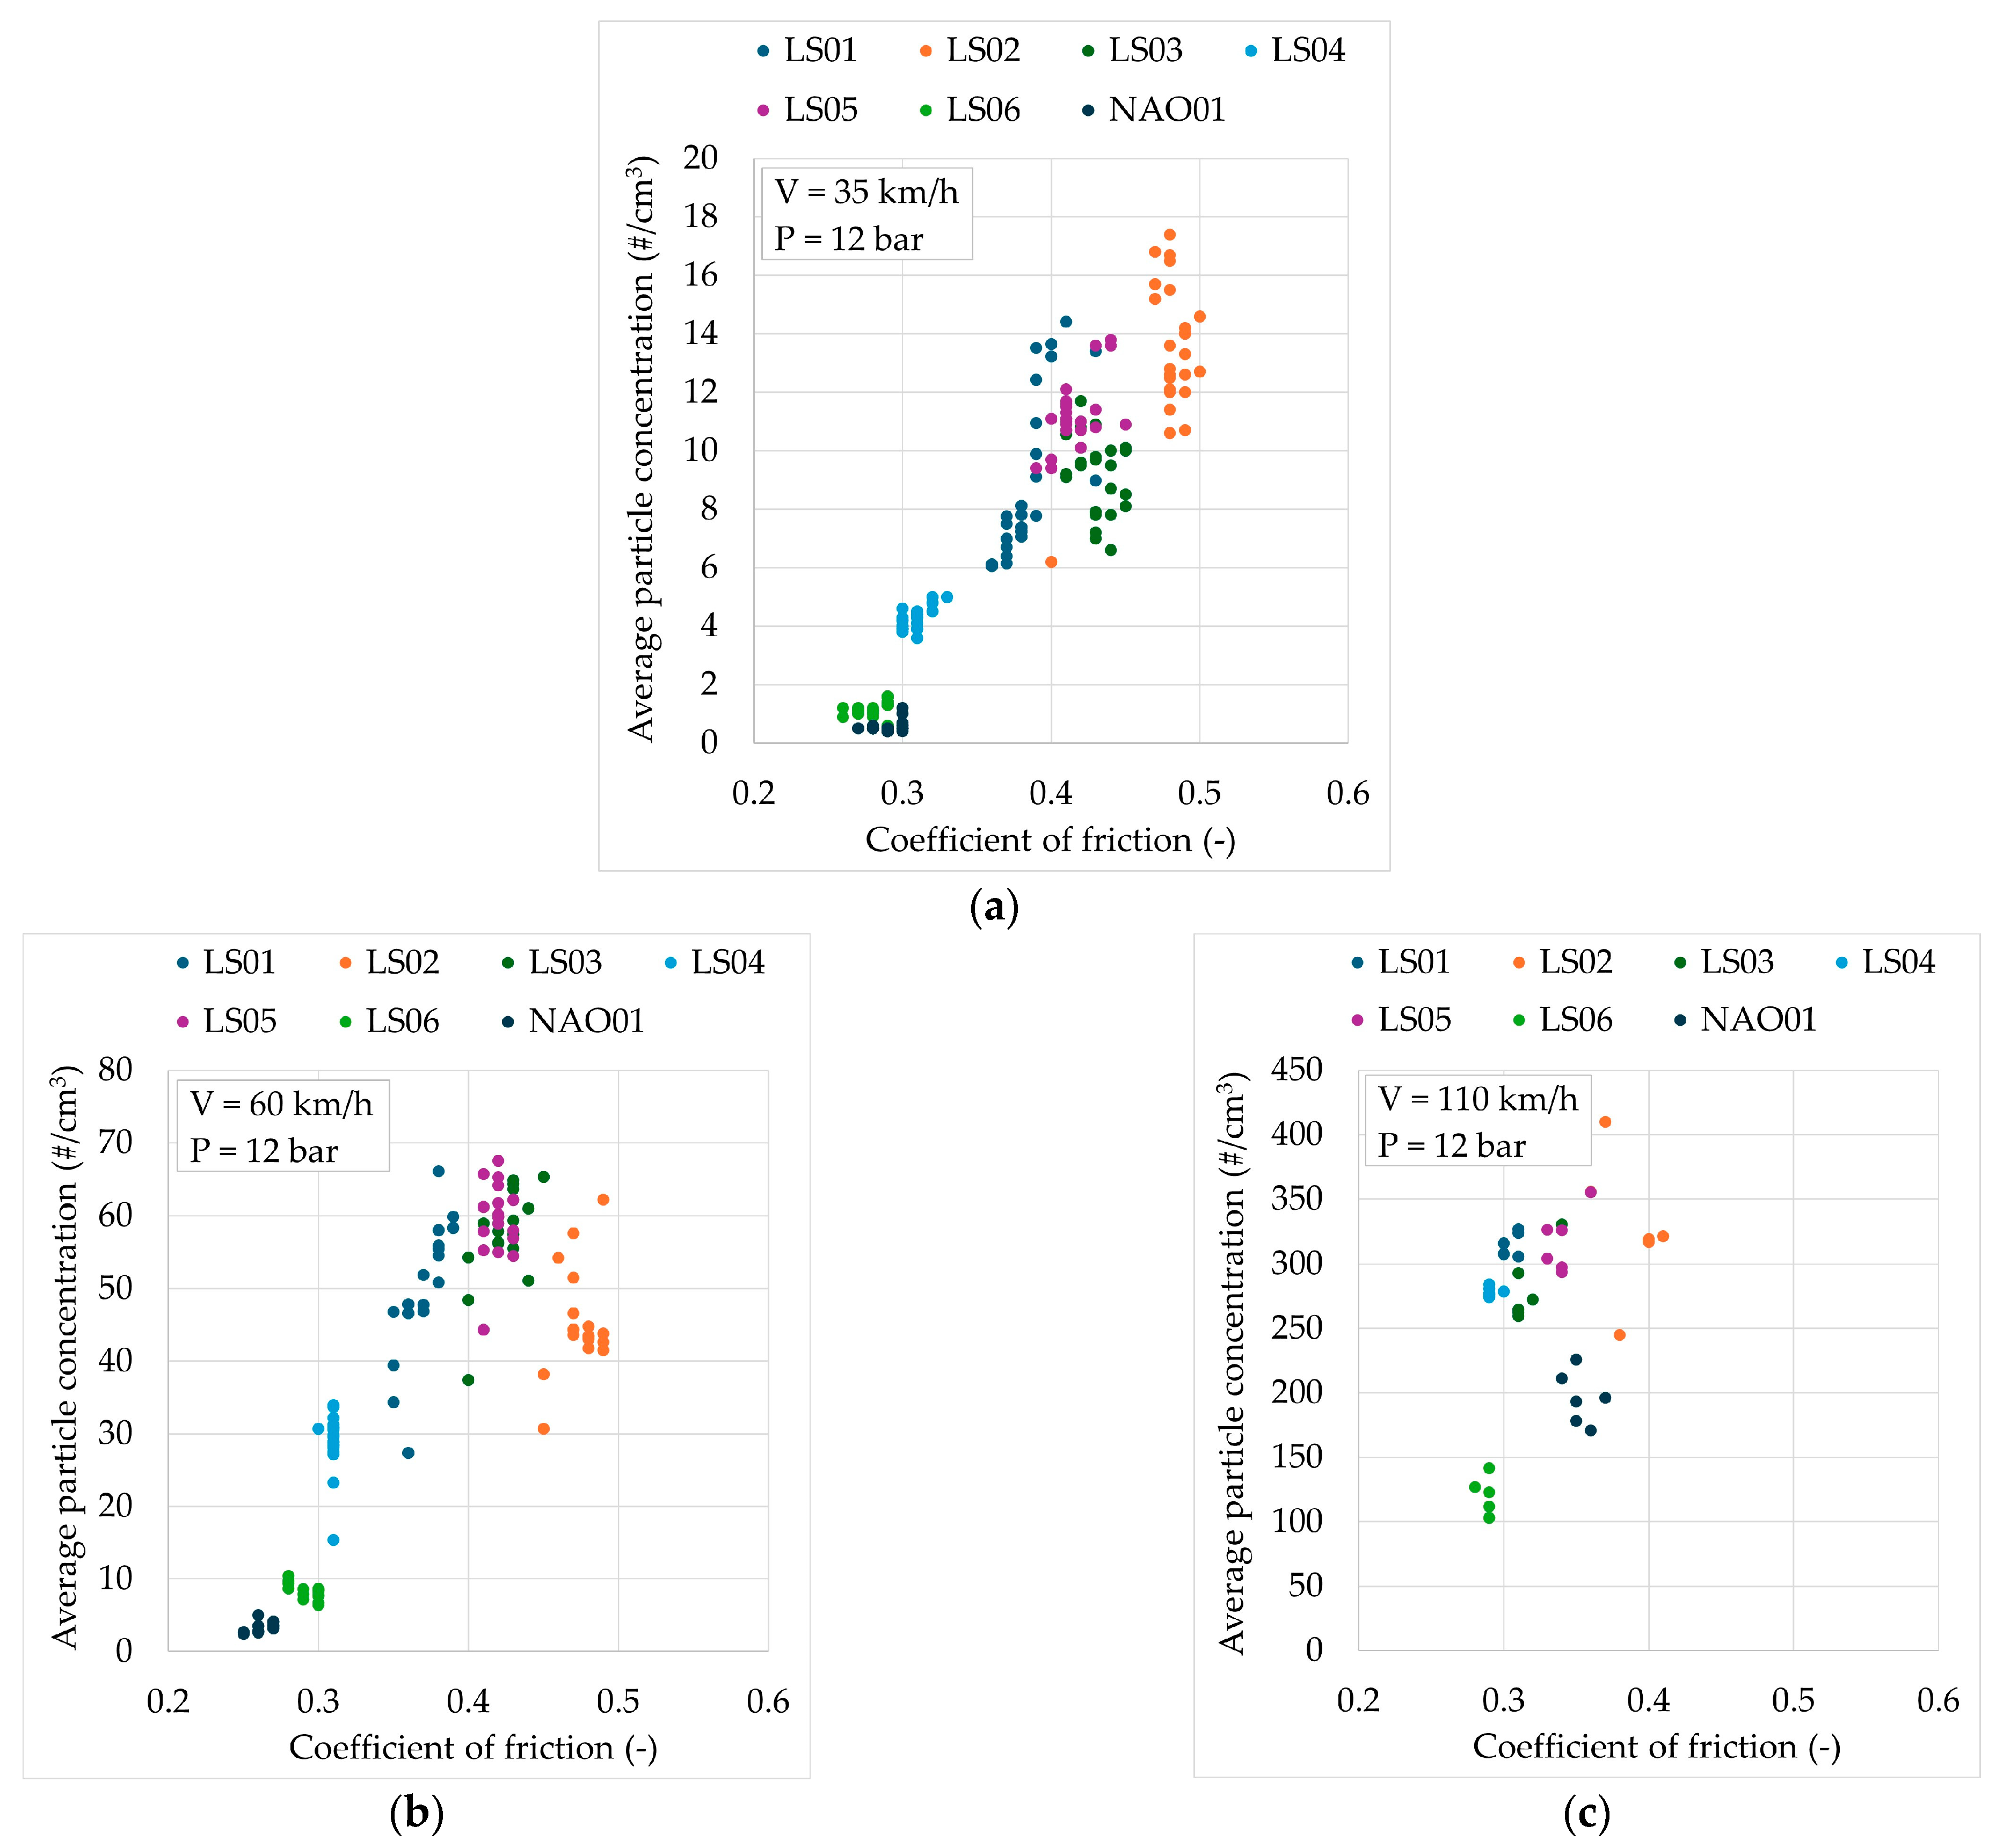
Figure 13 presents, for each test speed, the values of the average particle number concentration as a function of the average coefficient of friction measured during each loading sequence. Data on the seven friction materials are presented in this figure. Figure 13 shows a correlation of the particle number emission and the coefficient of friction when the test conditions applied are identical (same contact pressure and same sliding velocity): the particle number emission is higher when the measured coefficient of friction is higher. This correlation is observable for test speeds of 35 km/h (Figure 13a) and 60 km/h (Figure 13b) with linear regression coefficients (R2) of 0.8632 and 0.7410, respectively. At 110 km/h, no correlation appears clearly.

4.2. Emission Factor EFPM10

In this study, particles with a size < 10 µm were collected to determine an emission factor of PM10 in µg/km travelled. As for particle number emission, LS04, LS06 and NAO01 showed the lowest emission factor. Some authors found that their NAO material emits 45% less PM10 than the highest emissions of the Low Steel materials tested [1].
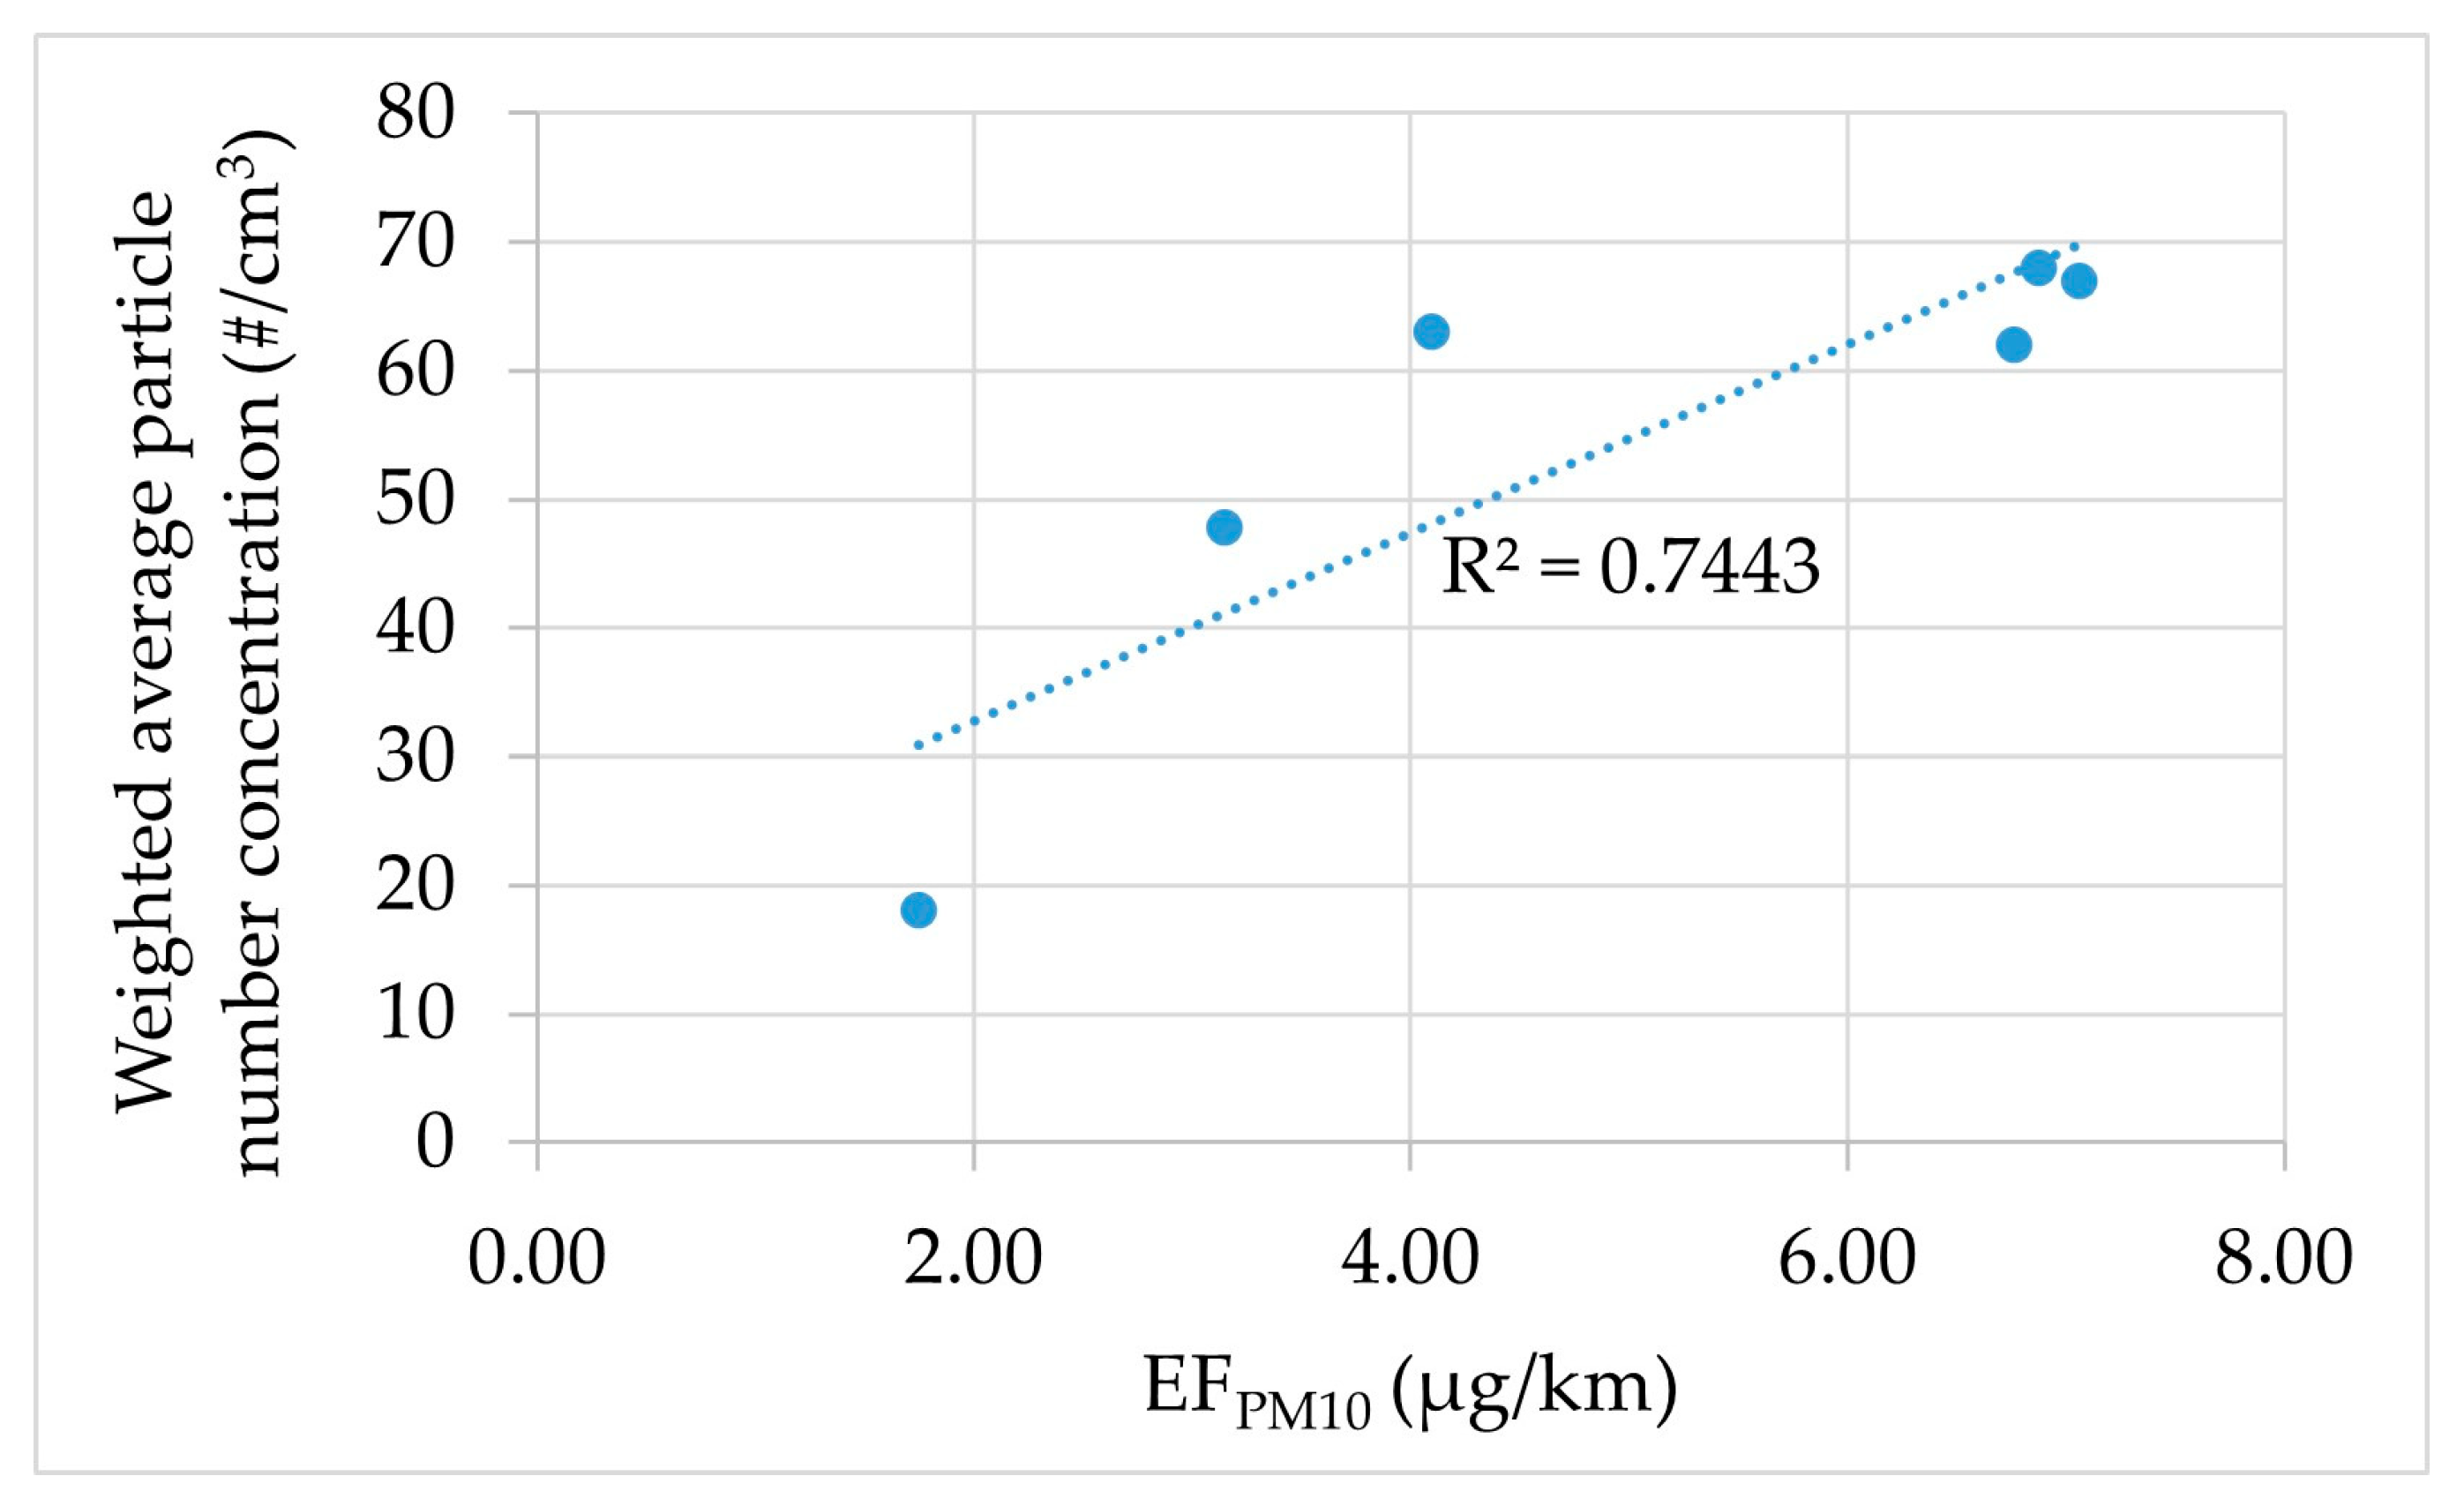
Furthermore, the test results show a correlation between the average particle number concentration and the emission factor measured for each friction pair (Figure 14): the particle number emission increases with the emission in mass of particles. The emission factor of NAO01 is not presented in this figure since its value is under the quantification limit of 0.54 µg/km.

4.3. Chemical Composition of PM10

The chemical analysis of the PM10 collected during the tests showed that iron was the main chemical element detected [25,38,41].
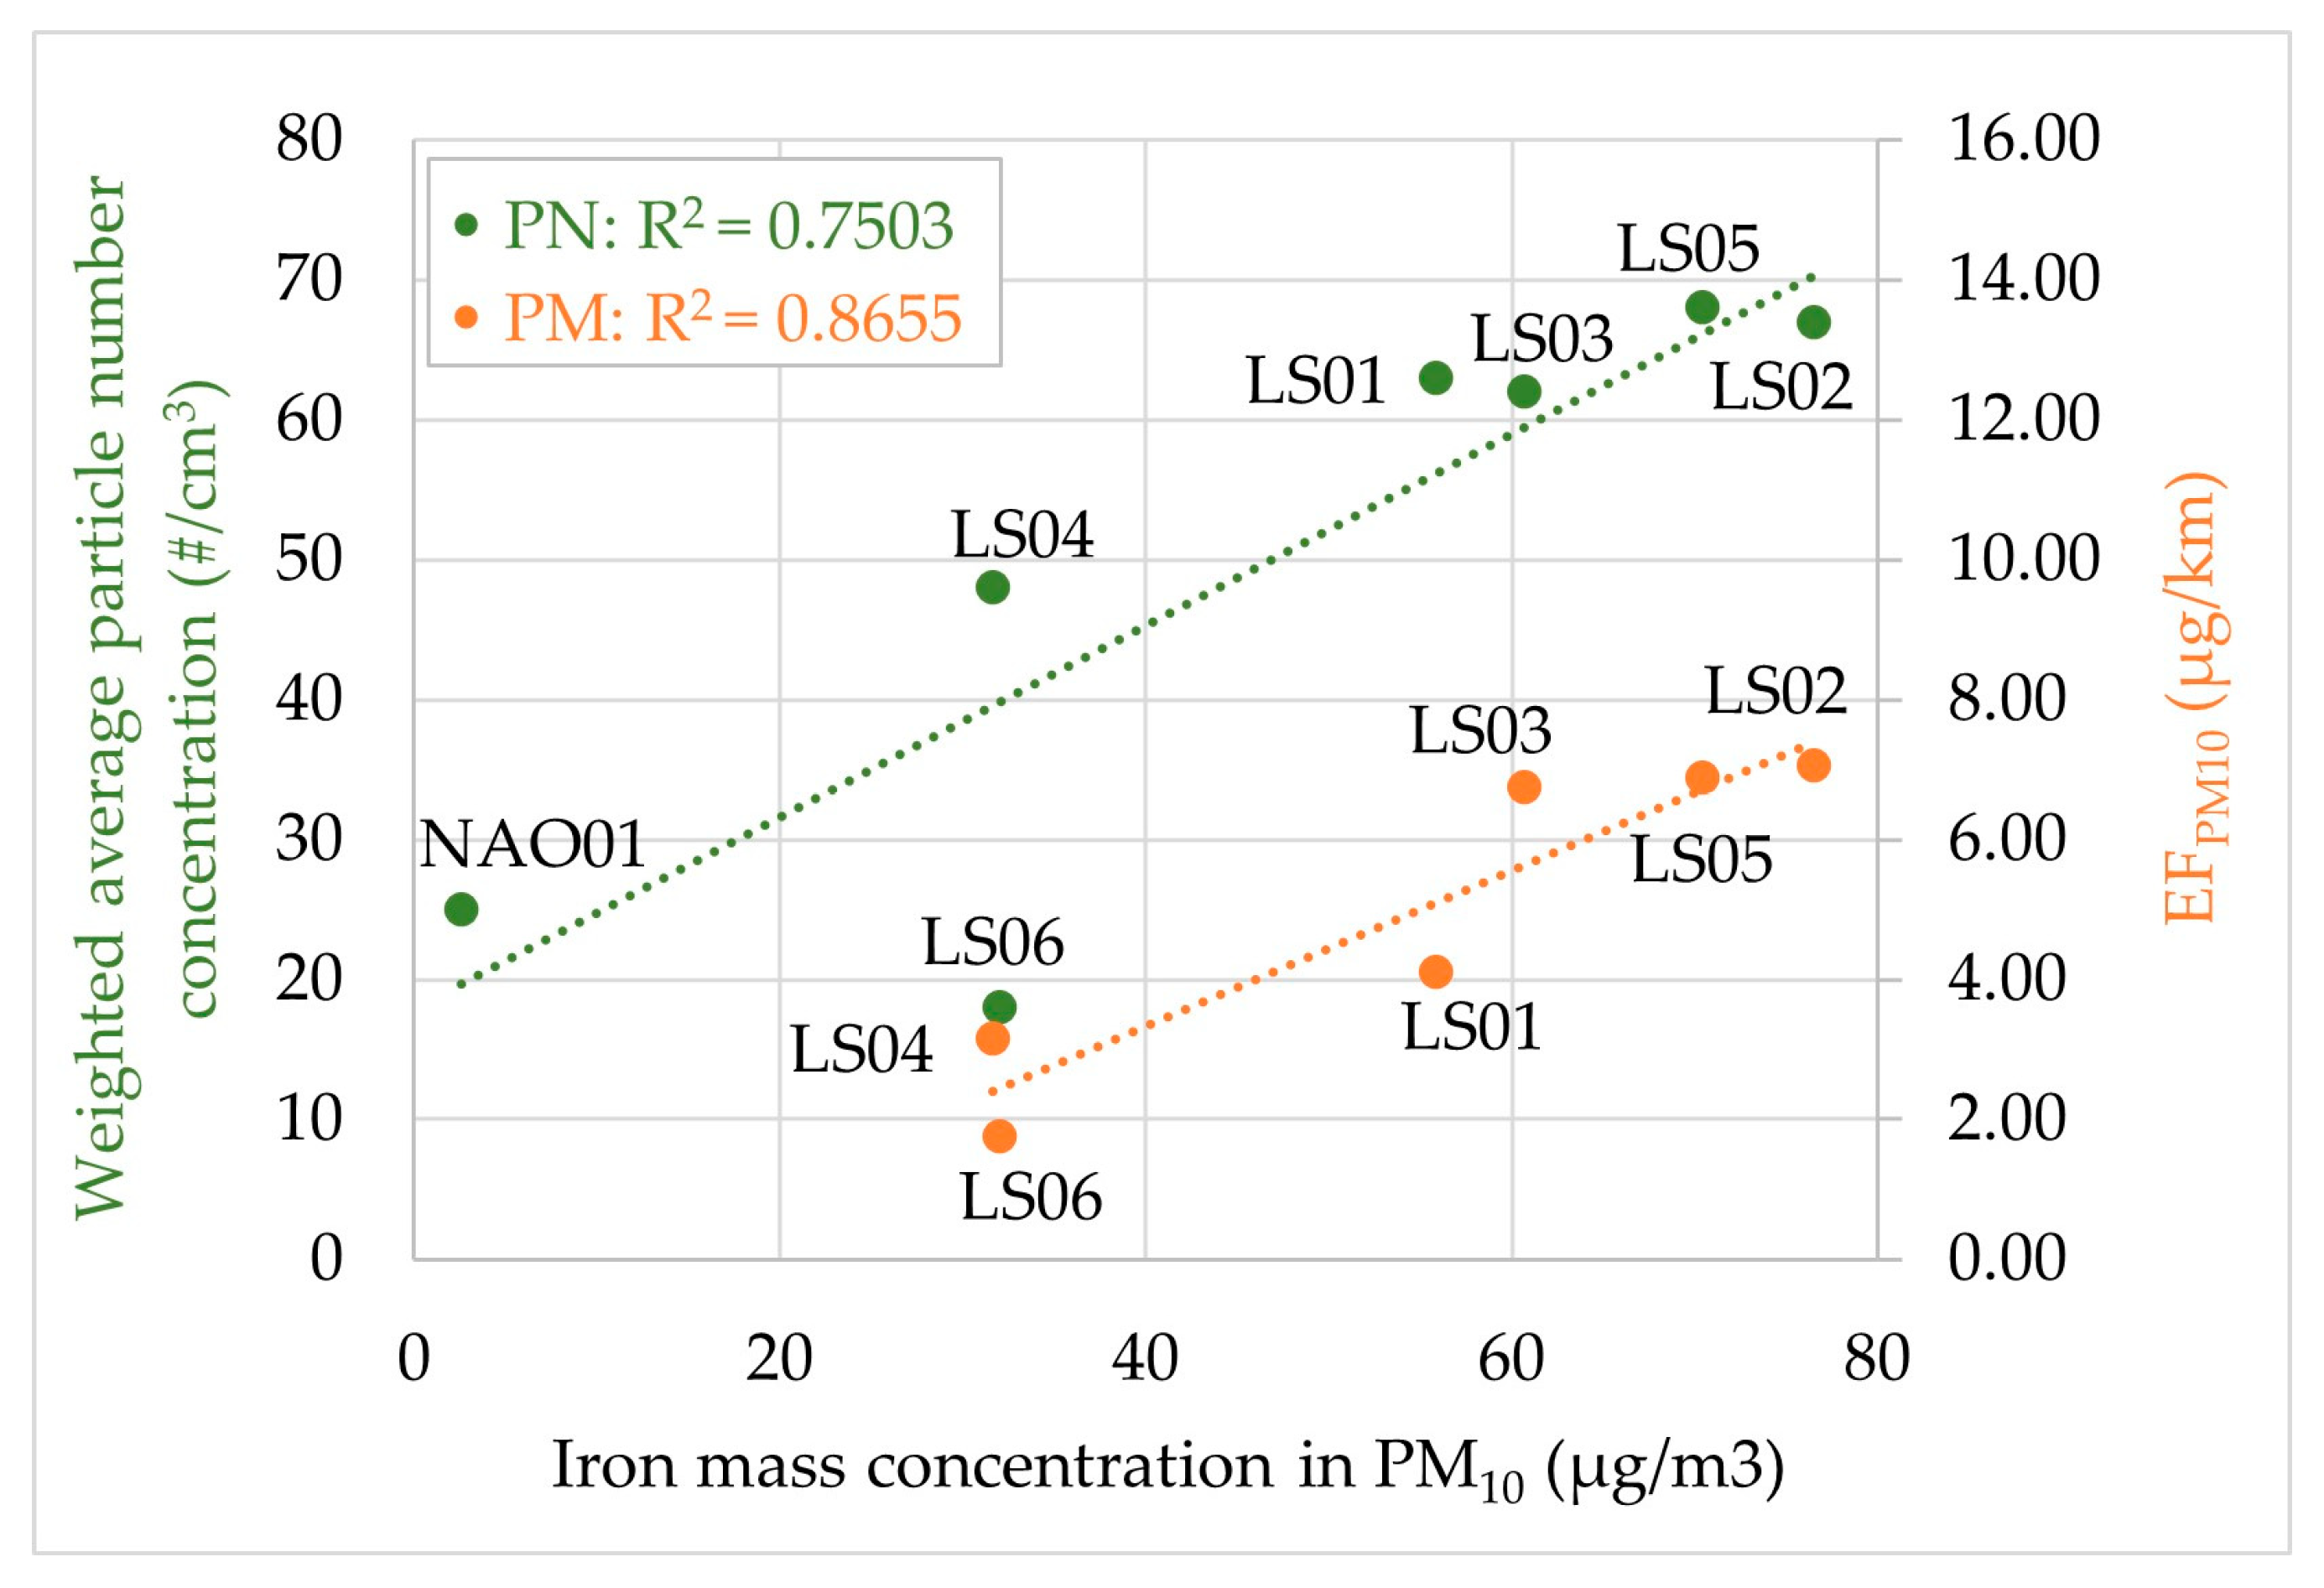
Furthermore, a correlation between the emission factor EFPM10 and the iron mass concentration of PM10 was observed. A correlation was also observed between the mean particle number concentration and the mass concentration of iron of PM10 (Figure 15). The emission factor of NAO01 is not presented in this figure since its value is under the quantification limit of 0.54 µg/km. Thus, the higher the iron content in PM10, the higher the emissions in number and mass [22,37].

4.4. Relationship Between Particle Emission and Raw Materials

The objective of this work is to study the influence of friction materials on particle emissions and ultimately to find a relationship between the raw materials composing the friction materials and particle emissions.
A correlation was observed between the particle number and mass emissions, which is related to the steel fibre content (vol.%) in the brake pads (Figure 16). The emission factor of NAO01 is not plotted in this figure since its value is under the quantification limit of 0.54 µg/km. The higher the content of steel fibres in the brake pads, the higher the particle number and mass emissions.
A second correlation was observed between the iron mass concentration of PM10 and the steel fibre content by volume in the brake pads (Figure 17). The iron content in PM10 increases when the steel fibre content in the brake pads increases.
The correlations observed in Figure 16 and Figure 17 between particulate emissions, particle composition and the steel fibre content of brake pads could thus explain the reduction in particle number and mass emissions. The reduction in particulate emissions achieved with LS06 material can be attributed to its composition, which is close to that of NAO material (although it is composed of steel fibres). Indeed, LS06 has 50 vol.% fewer steel fibres than the most emissive Low Steel materials (LS01, LS02, LS03 and LS05), and it also has zirconium dioxide, an abrasive usually found in NAO materials. LS04 also has 50 vol.% fewer steel fibres than the highest emissive Low Steel materials but has the same types of abrasives as these materials. Nevertheless, the observed correlations between particulate emissions and the steel fibre content of friction materials need to be further investigated to understand the relationship between the steel fibre content and the iron content of PM10, as well as to ultimately understand whether the iron measured in PM10 comes more from the brake disc or brake pads. These studies are necessary because the results of this study do not allow us to affirm (in the case of Low Steel materials) that the iron measured in PM10 comes from the brake pads.
Furthermore, as previously mentioned, the correlation between the iron mass concentration of PM10 and the steel fibre content by volume in the brake pads is high when the steel fibre content of the friction materials is changed. The differences in emission between LS01, LS02 and LS05 friction materials, which contain 16.50 vol.% of steel fibres, may not be due to the content of steel fibres in the formulas. The higher emission of the LS05 friction material compared to the LS01 friction material can be due to the higher content of magnesium oxides and the reduction in aluminium oxides in the formula. As for the LS02 friction material, it has a higher content of hard abrasives compared to the LS01 friction material, which can explain the high emissions observed with the LS02 material.
In this study, no more correlations were observed between other raw materials and particle emissions, such as organic fibres, magnesium oxide or barium sulphate. LS03 material, which contains more organic fibres than the other Low Steel materials, does not present a lower PM10 emissions factor unlike the literature [25]. LS05 material, which contains more magnesium oxide than LS01, has a higher emission factor unlike the literature [24]. LS04, which contains 50 vol.% more barium sulphate and 50 vol.% less steel fibres than LS01 material, is less emissive than LS01. However, the effect of barium sulphate on emissions cannot be analysed in this study since we have shown that the PM10 emission factor is related to the steel fibre content.

4.5. Understanding the Wear Mechanisms

The low emissivity of the three materials, LS04, LS06 and NAO01, could be explained by the physicochemical characteristics of the friction layers observed on their surfaces, which are different from the physicochemical characteristics observed on the surfaces of the most emissive materials which present large plateaus mainly composed of iron and oxygen, suggesting the formation of plateaus composed of iron oxide. Thus, compared to the most emissive friction materials, the reduction in particulate emission can be correlated with three observations. First is the presence of smaller plateaus made of iron oxide, observed by SEM on the surface of the LS06 material. Second is the presence of a homogeneous layer made of iron oxide on the surface of the NAO01 material. And third, there is a lower iron content on the surfaces of the LS06 and NAO01 materials. A higher iron content of secondary plateaus observed on the surfaces of the Low Steel pads than that observed on the surfaces of the NAO pads was noted in a scientific study [19]. The low iron content on the surfaces of the LS06 and NAO01 pins suggests that the friction layers are thinner than on the surfaces of the most emissive materials, such as LS01.
These observations are in agreement with the theory on the formation of tribological surfaces [42]. When a cast iron disc slides against a material made of steel fibres, primary and secondary plateaus form and then degrade. Primary plateaus are composed of wear-resistant elements such as metal fibres and other hard components of the friction material such as abrasives [42,43]. Secondary plateaus are composed of wear particles and debris, accumulating and compacting against primary plateaus [42,43,44,45]. The wear debris forming the secondary plateaus comes from both the disc and the brake pads: the wear debris from the disc comes from the adhesion and abrasion mechanisms between the cast iron disc and the metal fibres and other hard components of the brake pads that take place during friction [45,46], while the wear debris from the pad is mainly composed of oxides such as iron oxide, as well as soft components of the brake pad such as solid lubricants (Table 8). The wear debris are emitted into the air because they are mechanically weaker than the hard elements that make up the primary plateaus [43,45]. The secondary plateaus that form on the brake pad surface are degraded according to different wear mechanisms [42]:
  • When the primary plateaus are worn, the secondary plateaus no longer have support and degrade;
  • Abrasion by the brake disc occurs due to defects in the surface of the disc;
  • Third body abrasion occurs when the coarse wear particles between the disc and the pads are ground during friction and degrade the secondary plateaus.
As LS04 and LS06 materials have 50 vol.% fewer steel fibres than other Low Steel materials, the number of contact areas between the cast iron of the disc and the steel fibres of the brake pad is reduced, thus limiting the adhesion mechanisms of cast iron/steel fibres. In addition, the number of primary plateaus is reduced, which may explain the reduction in particle emissions. Cast iron/steel fibres adhesion is not possible with NAO01 material since it does not have steel fibres. Instead, a homogeneous layer of iron oxide, composed of iron oxide whose iron comes from the brake disc, as well as abraded elements from the pin, could be observed on the surface of the NAO01 pin and can thus explain the low emissivity of the material, as observed in [44].
This study also highlights the correlation between the EFPM10 emission factor and the mass concentration of iron of PM10 collected from the PTFE filters. This result corroborates previous observations and emphasises the hypothesis that disc wear is higher with a more aggressive friction material, such as LS01.

4.6. Coefficient of Friction

This study highlights that the least emissive friction materials have the lowest coefficient of friction. In the literature, some studies highlighted that both the coefficient of friction and particle emissions were lower with NAO materials (steel fibre-free) than with Low Steel materials [18,25], whereas others noted opposite results [19].
The emission test cycle, based on the WLTP standard cycle, is divided into three phases: the first one consists of 25 sequences at a vehicle speed of 35 km/h, the second one consists of 19 sequences carried out at 60 km/h and the third one consists of 6 sequences carried out at 110 km/h (Table 3). The stability of the evolution curves of the particle number concentration shows that the bedding time (bedding cycle, Table 3) is suitable for particulate emission measurements in these tests. A decrease in the coefficient of friction with LS01, LS02, LS03 and LS05 materials was observed with increasing test speed, attributed to the evolution of tribological surfaces during friction [19,47]. The contact surface between the disc and the brake pads changes during the successive phases of deterioration and formation of the primary and secondary plateaus. At high speeds, secondary plateaus degrade more easily, reducing the contact area between the disc and the brake pads and therefore the adhesion between the cast iron of the disc and the steel fibres of the brake pads [19,47]. This could explain the increase in brake wear emissions and the decrease in the coefficient of friction with test speed. Some thermal effects could explain these observations, showing that the temperature of the disc needs to be measured.
The low coefficient of friction values of LS04, LS06 and NAO01 materials are due to the reduction in or absence of steel fibres in the brake pads. Indeed, the adhesion between the steel fibres of the brake pads and the cast iron of the brake disc is reduced or even non-existent in the case of NAO01 material. The high coefficient of friction of LS02 material may be due to the high content of abrasives in the formula, confirming our hypothesis.

4.7. Particle Size Distribution

All materials have at least one mode of distribution (primary or secondary mode) between 300 nm and 550 nm. The composition of the pin therefore does not significantly influence the size distribution of the particles emitted [18,25,37]. In contrast, LS04 and LS06 have a primary mode of distribution < 100 nm at 35 km/h, and LS06 and NAO01 have a secondary mode at 20 nm at 60 km/h. The proportion of ultrafine particles (<100 nm) has therefore increased with these three materials [44]. The presence of these distribution modes can be explained by the chemical composition of the three materials. This is because the two Low Steel materials, LS04 and LS06, have a 50% lower steel fibre volume content compared to other Low Steel materials, while the NAO01 material has no steel fibres.
Furthermore, as the LS04 and LS06 materials contain fewer steel fibres, it is supposed that they conduct less heat through the pins. Therefore, the organic components of the friction materials could be more degraded by the heat generated during the friction between the pin and the disc, generating more ultrafine particles, as mentioned in the literature [48,49,50,51]. The instrumentation of temperature on the pin-on-disc bench is necessary.

5. Conclusions

As automotive braking is a major source of air pollution, the improvement of the friction material composition is an interesting avenue for reducing the emissions of PM10 into the environment. The aim of this study was to study the influence of the composition of seven brake pads on the particle number and mass emissions, as well as on particle size, tested against cast iron discs. It also aimed to provide an understanding of the wear mechanisms involved in brake wear emissions. Three friction materials (LS04, LS06 and NAO01) significantly reduced the particle number emission by 24%, 71% and 60%, respectively, compared to the reference friction material (LS01). LS04 and LS06 materials reduced PM10 emissions by 23% and 57%, respectively, compared to the LS01 reference material. The emission of PM10 of the NAO01 material was too low and under the quantification limit of the measuring system (<0.54 µg/km).
In this study, we found two Low Steel materials (LS04 and LS06) which have a behaviour similar to NAO01 behaviour: low emission, coefficient of friction of the same order of magnitude and particle size distribution modes in the same range of particle size (one mode between 300 nm and 550 nm, and one mode < 100 nm). The chemical composition in iron on the surface of the LS04 and LS06 pins after the test is lower than the other Low Steel materials, and the quantity of iron is in the same range as the NAO01 material. The SEM-EDXS images of the LS06 pin show that the iron present on its surface (in form of steel fibres) is also less oxidised than the iron present at the surface of the other Low Steel materials, which are more emissive and present larger plateaus made of iron oxides. In the case of the NAO01 material, the presence of a homogeneous layer of iron oxide on the surface of the pin is observed, and it seems to protect the pin against wear and reduce the emission of particles when sliding against the disc. Thus, the microscopy analysis confirmed that the wear mechanisms are distinct according to the composition of the brake pad.
Several correlations were highlighted due to the work. For example, some correlations could be identified between the particle number concentration (#/cm3) measured by CPC:
  • The EFPM10 emission factor;
  • The steel fibre content in friction materials;
  • The iron composition of the emitted particles;
  • The frictional power;
  • The sliding velocity;
  • The coefficient of friction when the test conditions applied are identical (same contact pressure of 1.2 MPa and sliding velocity of 3.5 m/s or 6.0 m/s).
Other correlations have also been found between the emission factor EFPM10 (µg/km) and
  • The steel fibre composition in friction materials;
  • The iron composition of the emitted particles.
This study therefore shows that the brake particles emitted are mainly composed of iron and that the steel fibre content in the brake pads plays an important role in the emission of brake wear particles. A correlation between the iron content of PM10 and the steel fibre content was also found. However, no correlation between the number and mass emissions and the other raw materials could be identified.
All the correlations pointed out in this work can be used as tools to predict the emission of a friction pair. Reliability and repeatability are deeply established in the metrological approach we follow. As an example, testing involves 50 sequences, including 25 loadings at 35 km/h, 19 loadings at 35 km/h and 6 loadings at 110 km/h. Furthermore, all the tests were preceded by adjustment to strengthen the repeatability of the measurements.
The challenge in the future would be to develop Low Steel materials with the same behaviour as LS04 and LS06 but with a higher coefficient of friction, since these friction materials cost 30% less than NAO01 materials. To achieve this, the other raw materials of the formulas must be investigated, such as fillers or solid lubricants, which were not investigated in this study. Furthermore, among the avenues for further study of this work, temperature instrumentation, as well as the development of an adapted procedure for varying the test temperatures at controlled levels, could make it possible to discriminate thermal effects for the following three reasons: It seems crucial to better understand the role of the temperature in the degradation of the friction surfaces during our tests. Also, it is important to try to understand whether the temperature is involved in the differences in particle size distributions observed during our tests as organic components in friction materials degrade at lower temperatures. Finally, as a minor point, the size of the pin could favour convection cooling compared to brake pads, which could be verified in a future study.

Author Contributions

Conceptualization, M.H., Y.-M.C., M.M. and C.B.; methodology, M.H., Y.-M.C., M.M. and C.B.; validation, M.H. and Y.-M.C.; formal analysis, M.H.; investigation, M.H. and L.M.; resources, M.H., Y.-M.C., M.M., L.M. and C.B.; data curation, M.H.; writing—original draft preparation, M.H.; writing—review and editing, M.H., Y.-M.C., M.M. and C.B.; visualisation, M.H.; supervision, Y.-M.C., M.M. and C.B.; project administration, M.M.; funding acquisition, Y.-M.C., M.M. and C.B. All authors have read and agreed to the published version of the manuscript.

Funding

This research was supported by the French Agency for Ecological Transition (ADEME), grant number [2166D0017], and by the National Association of Research and Technology (ANRT), grant number [2022/0336]. The APC was funded by MAT Friction Noyon SAS.

Institutional Review Board Statement

Not applicable.

Informed Consent Statement

Not applicable.

Data Availability Statement

The original contributions presented in this study are included in the article. Further inquiries can be directed to the corresponding author.

Acknowledgments

The authors acknowledge the support for the publication costs provided by the Open Access Publication fund of MAT Friction Noyon SAS. The authors acknowledge their institutions for making this project possible. The authors also acknowledge their funders, the French Agency for Ecological Transition (ADEME) funding AQACIA project D-brake [2166D0017] and the National Association of Research and Technology. The authors would like to thank David Cazé (Cetim, Senlis) and Laurent Meunier (Ineris) for helping in the realisation of the pin-on-disc tests.

Conflicts of Interest

Author Marie Hoff was employed by the company MAT Friction Noyon SAS. The remaining authors declare that the research was conducted in the absence of any commercial or financial relationships that could be construed as a potential conflict of interest.

References

  1. Perricone, G.; Matějka, V.; Alemani, M.; Valota, G.; Bonfanti, A.; Ciotti, A.; Olofsson, U.; Söderberg, A.; Wahlström, J.; Nosko, O.; et al. A concept for reducing PM 10 emissions for car brakes by 50%. Wear 2018, 396–397, 135–145. [Google Scholar] [CrossRef]
  2. Seo, H.; Joo, B.; Park, J.; Kim, Y.C.; Lee, J.J.; Jang, H. Effect of disc material on particulate matter emissions during high-temperature braking. Tribol. Int. 2021, 154, 106713. [Google Scholar] [CrossRef]
  3. Wahlström, J.; Lyu, Y.; Matjeka, V.; Söderberg, A. A pin-on-disc tribometer study of disc brake contact pairs with respect to wear and airborne particle emissions. Wear 2017, 384–385, 124–130. [Google Scholar] [CrossRef]
  4. Cai, R.; Zhang, J.; Nie, X.; Tjong, J.; Matthews, D.T.A. Wear mechanism evolution on brake discs for reduced wear and particulate emissions. Wear 2020, 452–453, 203283. [Google Scholar] [CrossRef]
  5. Dizdar, S.; Lyu, Y.; Lampa, C.; Olofsson, U. Grey Cast Iron Brake Discs Laser Cladded with Nickel-Tungsten Carbide—Friction, Wear and Airborne Wear Particle Emission. Atmosphere 2020, 11, 621. [Google Scholar] [CrossRef]
  6. Dridi, B.; Hjelm, R.; Lattanzi, L.; Awe, S.; Pagels, J.; Wahlström, J.; Lyu, Y. On the influence of carbides in laser-cladded coating on friction, wear, and airborne particle emissions of disc brakes. Wear 2025, 576–577, 206107. [Google Scholar] [CrossRef]
  7. Federici, M.; Menapace, C.; Moscatelli, A.; Gialanella, S.; Straffelini, G. Pin-on-disc study of a friction material dry sliding against HVOF coated discs at room temperature and 300 °C. Tribol. Int. 2017, 115, 89–99. [Google Scholar] [CrossRef]
  8. Hesse, D.; Hamatschek, C.; Augsburg, K.; Weigelt, T.; Prahst, A.; Gramstat, S. Testing of Alternative Disc Brakes and Friction Materials Regarding Brake Wear Particle Emissions and Temperature Behavior. Atmosphere 2021, 12, 436. [Google Scholar] [CrossRef]
  9. Lyu, Y.; Sinha, A.; Olofsson, U.; Gialanella, S.; Wahlström, J. Characterization of ultrafine particles from hardfacing coated brake rotors. Friction 2022, 11, 125–140. [Google Scholar] [CrossRef]
  10. Mutlu, İ.; GÜNey, B.; Erkurt, İ. Investigation of the effect of Cr2O3-2 % TiO2 coating on braking performance. Int. J. Automot. Eng. Technol. 2020, 9, 29–41. [Google Scholar] [CrossRef]
  11. Hascoët, M.; Adamczak, L. At source brake dust collection system. Results Eng. 2020, 5, 100083. [Google Scholar] [CrossRef]
  12. Hwang, I.S.; Park, J.-T.; Lee, Y.L. Feasibility of a Porous Ceramic Filter for Collecting Brake Fine Dust. Int. J. Automot. Technol. 2022, 23, 521–527. [Google Scholar] [CrossRef]
  13. Keller, F.; Krupa, L.; Beck, A.; Wörz, T.; Weller, B.; Kohn, K.; Pfannkuch, S.; Jessberger, T.; Lehmann, M.; Ashish, S. Development of a Modeling Approach to Numerically Predict Filtration Efficiencies of Brake Dust Particle Filters; SAE Technical Paper Series; SAE: Warrendale, PA, USA, 2021. [Google Scholar]
  14. Dante, R.C. Handbook of Friction Materials and Their Applications; Woodhead Publishing: Witney, UK, 2016. [Google Scholar]
  15. Grigoratos, T.; Martini, G. Brake wear particle emissions: A review. Environ. Sci. Pollut. Res. Int. 2015, 22, 2491–2504. [Google Scholar] [CrossRef]
  16. Kim, S.J.; Jang, H. Friction characteristics of non-asbestos organic (NAO) and low-steel friction materials: The comparative study. KSTLE Int. J. 2000, 1, 1–7. [Google Scholar]
  17. Sanders, P.G.; Xu, N.; Dalka, T.M.; Maricq, M.M. Airborne brake wear debris: Size distributions, composition, and a comparison of dynamometer and vehicle tests. Environ. Sci. Technol. 2003, 37, 4060–4069. [Google Scholar] [CrossRef]
  18. Wahlström, J.; Söderberg, A.; Olander, L.; Jansson, A.; Olofsson, U. A pin-on-disc simulation of airborne wear particles from disc brakes. Wear 2010, 268, 763–769. [Google Scholar] [CrossRef]
  19. Candeo, S.; Leonardi, M.; Gialanella, S.; Straffelini, S. Influence of contact pressure and velocity on the brake behaviour and particulate matter emissions. Wear 2023, 514–515, 204579. [Google Scholar] [CrossRef]
  20. Joo, B.S.; Chang, Y.H.; Seo, H.J.; Jang, H. Effects of binder resin on tribological properties and particle emission of brake linings. Wear 2019, 434–435, 202995. [Google Scholar] [CrossRef]
  21. Joo, B.S.; Jara, D.C.; Seo, H.J.; Jang, H. Influences of the average molecular weight of phenolic resin and potassium titanate morphology on particulate emissions from brake linings. Wear 2020, 450–451, 203243. [Google Scholar] [CrossRef]
  22. Park, J.; Song, W.; Gweon, J.; Seo, H.; Lee, J.J.; Jang, H. Size effect of zircon particles in brake pads on the composition and size distribution of emitted particulate matter. Tribol. Int. 2021, 160, 106995. [Google Scholar] [CrossRef]
  23. Shin, M.W.; Kim, J.W.; Joo, B.S.; Jang, H. Wear and Friction-Induced Vibration of Brake Friction Materials with Different Weight Average Molar Mass Phenolic Resins. Tribol. Lett. 2015, 58. [Google Scholar] [CrossRef]
  24. Song, W.; Gweon, J.; Park, J.; Kwon, S.-U.; Lee, J.J.; Kim, Y.C.; Jang, H. Effects of abrasive particles on the particulate matter emission of brake friction composites. Wear 2022, 504–505, 204436. [Google Scholar] [CrossRef]
  25. Song, W.; Park, J.; Choi, J.; Lee, J.J.; Jang, H. Effects of reinforcing fibers on airborne particle emissions from brake pads. Wear 2021, 484–485, 203996. [Google Scholar] [CrossRef]
  26. Wei, L.; Choy, Y.S.; Cheung, C.S.; Chu, H.K. Comparison of tribology performance, particle emissions and brake squeal noise between Cu-containing and Cu-free brake materials. Wear 2021, 466–467, 203577. [Google Scholar] [CrossRef]
  27. Tsybrii, Y.; Zglobicka, I.; Kuciej, M.; Nosko, O.; Golak, K. Airborne wear particle emission from train brake friction materials with different contents of steel and copper fibres. Wear 2022, 504–505, 204424. [Google Scholar] [CrossRef]
  28. Hagino, H. Brake Wear and Airborne Particle Mass Emissions from Passenger Car Brakes in Dynamometer Experiments Based on the Worldwide Harmonized Light-Duty Vehicle Test Procedure Brake Cycle. Lubricants 2024, 12, 206. [Google Scholar] [CrossRef]
  29. Philippe, F. Measure and Characterization of Braking Particles Emitted from Cars on a Pin-in-Disc Bench. Ph.D. Thesis, Université de Technologie de Compiègne, Compiègne, France, 2021. [Google Scholar]
  30. Philippe, F.; Morgeneyer, M.; Xiang, M.; Manokaran, M.; Berthelot, B.; Chen, Y.-m.; Charles, P.; Guingand, F.; Bressot, C. Representativeness of airborne brake wear emission for the automotive industry: A review. Proc. Inst. Mech. Eng. Part D J. Automob. Eng. 2021, 235, 2651–2666. [Google Scholar] [CrossRef]
  31. Philippe, F.; Xiang, M.; Bressot, C.; Chen, Y.; Guingand, F.; Charles, P.; Loigerot, J.; Morgeneyer, M. Relevance of pin-on-disc and inertia dynamometer bench experiments for braking emission studies. J. Phys. Conf. Ser. 2019, 1323, 012025. [Google Scholar] [CrossRef]
  32. Philippe, F.; Xiang, M.; Morgeneyer, M.; Chen, Y.-M.; Charles, P.; Guingand, F.; Bressot, C. Emission rate assessment of airborne brake particles by characterization of the pad and disc surfaces from a pin-on-disc tribometer. Toxicol. Res. Appl. 2020, 4. [Google Scholar] [CrossRef]
  33. NF-EN-14385; Stationary Source Emissions—Determination of the Total Emission of As, Cd, Cr, Co, Cu, Mn, Ni, Pb, Sb, TI and V. Association Française de Normalisation: La Plaine Saint-Denis, France, 2024.
  34. NF-EN-17294-2; Water Quality—Application of Inductively Coupled Plasma Mass Spectrometry (ICP-MS)—Part 2: Determination of Selected Elements Including Uranium Isotopes. Association Française de Normalisation: La Plaine Saint-Denis, France, 2023.
  35. ISO 25178-1:2016; Geometrical Product Specifications (GPS)—Surface Texture: Areal—Part 1: Indication of Surface Texture. International Organization for Standardization: Geneva, Switzerland, 2016.
  36. Menapace, C.; Leonardi, M.; Matějka, V.; Gialanella, S.; Straffelini, G. Dry sliding behavior and friction layer formation in copper-free barite containing friction materials. Wear 2018, 398–399, 191–200. [Google Scholar] [CrossRef]
  37. Park, J.; Gweon, J.; Seo, H.; Song, W.; Lee, D.; Choi, J.; Kim, Y.C.; Jang, H. Effect of space fillers in brake friction composites on airborne particle emission: A case study with BaSO4, Ca(OH)2, and CaCO3. Tribol. Int. 2022, 165, 107334. [Google Scholar] [CrossRef]
  38. Neukirchen, C.; Saraji-Bozorgzad, M.R.; Mader, M.; Mudan, A.P.; Czasch, P.; Becker, J.; Di Bucchianico, S.; Trapp, C.; Zimmermann, R.; Adam, T. Comprehensive elemental and physical characterization of vehicle brake wear emissions from two different brake pads following the Global Technical Regulation methodology. J. Hazard. Mater. 2025, 482, 136609. [Google Scholar] [CrossRef] [PubMed]
  39. Alemani, M.; Wahlström, J.; Olofsson, U. On the influence of car brake system parameters on particulate matter emissions. Wear 2018, 396–397, 67–74. [Google Scholar] [CrossRef]
  40. Hagino, H.; Oyama, M.; Sasaki, S. Airborne brake wear particle emission due to braking and accelerating. Wear 2015, 334–335, 44–48. [Google Scholar] [CrossRef]
  41. Alemani, M.; Nosko, O.; Metinoz, I.; Olofsson, U. A Study on Emission of Airborne Wear Particles from Car Brake Friction Pairs. SAE Int. J. Mater. Manuf. 2015, 9, 147–157. [Google Scholar] [CrossRef]
  42. Eriksson, M.; Jacobson, S. Tribological surfaces of organic brake pads. Tribol. Int. 2000, 33, 817–827. [Google Scholar] [CrossRef]
  43. Candeo, S.; Nogueira, A.P.; Leonardi, M.; Straffelini, G. A study of friction, wear and particulate emissions during the bedding stage of a Cu-free friction material. Wear 2021, 486–487, 204095. [Google Scholar] [CrossRef]
  44. Park, J.; Joo, B.; Seo, H.; Song, W.; Lee, J.J.; Lee, W.K.; Jang, H. Analysis of wear induced particle emissions from brake pads during the worldwide harmonized light vehicles test procedure (WLTP). Wear 2021, 466–467, 203539. [Google Scholar] [CrossRef]
  45. Straffelini, G.; Gialanella, S. Airborne particulate matter from brake systems: An assessment of the relevant tribological formation mechanisms. Wear 2021, 478–479, 203883. [Google Scholar] [CrossRef]
  46. Kukutschová, J.; Roubíček, V.; Malachová, K.; Pavlíčková, Z.; Holuša, R.; Kubačková, J.; Mička, V.; MacCrimmon, D.; Filip, P. Wear mechanism in automotive brake materials, wear debris and its potential environmental impact. Wear 2009, 267, 807–817. [Google Scholar] [CrossRef]
  47. Kim, J.W.; Joo, B.S.; Jang, H. The effect of contact area on velocity weakening of the friction coefficient and friction instability: A case study on brake friction materials. Tribol. Int. 2019, 135, 38–45. [Google Scholar] [CrossRef]
  48. Kukutschova, J.; Moravec, P.; Tomasek, V.; Matejka, V.; Smolik, J.; Schwarz, J.; Seidlerova, J.; Safarova, K.; Filip, P. On airborne nano/micro-sized wear particles released from low-metallic automotive brakes. Environ. Pollut. 2011, 159, 998–1006. [Google Scholar] [CrossRef] [PubMed]
  49. Nosko, O.; Alemani, M.; Olofsson, U. Temperature effect on emission of airborne wear particles from car brakes. In Proceedings of the EuroBrake 2015, Dresden, Germany, 4–6 May 2015. [Google Scholar]
  50. Nosko, O.; Olofsson, U. Effective density of airborne wear particles from car brake materials. J. Aerosol Sci. 2017, 107, 94–106. [Google Scholar] [CrossRef]
  51. Nosko, O.; Vanhanen, J.; Olofsson, U. Emission of 1.3–10 nm airborne particles from brake materials. Aerosol Sci. Technol. 2016, 51, 91–96. [Google Scholar] [CrossRef]
Figure 1. Scheme of the pin-on-disc bench into the enclosure and of the particle measurement system. (1) The positive progressive cavity pump; (2) the F7 filter and HEPA 13 filter; (3) the brake enclosure; (4) the F7 filter and HEPA 13 filter; (5) the flowmeter.
Atmosphere 16 01075 g001
Figure 2. Particle number concentration with LS01 friction pair.
Atmosphere 16 01075 g002
Figure 3. Particle number concentration of the 7 friction pairs over time: (a) LS01; (b) LS02; (c) LS03; (d) LS04; (e) LS05; (f) LS06; (g) NAO01.
Atmosphere 16 01075 g003aAtmosphere 16 01075 g003b
Figure 4. Average friction coefficient per test sequence.
Atmosphere 16 01075 g004
Figure 5. Particle size distribution of the 7 friction pairs for each test vehicle speed: (a) LS01; (b) LS02; (c) LS03; (d) LS04; (e) LS05; (f) LS06; (g) NAO01. The particle size distribution does not represent the immediate particle emissions but more precisely the long-term exposure.
Atmosphere 16 01075 g005aAtmosphere 16 01075 g005b
Figure 6. SEM images of (a) the new pins and (b) the pins after the test; optic microscopies of (c) the pins after the test and (d) the discs after the test.
Atmosphere 16 01075 g006aAtmosphere 16 01075 g006b
Figure 7. SEM images of the pins after the test: (a) LS04; (b) NAO01; (c) LS06.
Atmosphere 16 01075 g007aAtmosphere 16 01075 g007b
Figure 8. Surface topography of the disc tested with NAO01 (sample 4).
Atmosphere 16 01075 g008
Figure 9. The positions of the four samples (rectangles in red) for roughness measurements.
Atmosphere 16 01075 g009
Figure 10. Layering of the 480 profiles of the disc tested with NAO01 (sample 4).
Atmosphere 16 01075 g010
Figure 11. Effect of frictional power on particle number concentration per loading sequence (50 loadings) with LS01 friction pair.
Atmosphere 16 01075 g011
Figure 12. (a) Evolution of shear stress (in blue), sliding velocity (in green) and average particle concentration (in purple) while testing LS01; particle concentration as function of (b) shear stress and (c) sliding velocity.
Atmosphere 16 01075 g012
Figure 13. Average particle concentration as function of friction coefficient for contact pressure of 1.2 MPa and vehicle speeds of (a) 35 km/h, (b) 60 km/h and (c) 110 km/h.
Atmosphere 16 01075 g013
Figure 14. Weighted average particle number concentration vs. EFPM10.
Atmosphere 16 01075 g014
Figure 15. Average particle number concentration and emission factor vs. iron mass concentration in PM10 emissions measured using ICP-MS technique.
Atmosphere 16 01075 g015
Figure 16. Particle number and mass emissions vs. steel fibre content in volume percentage in brake pads.
Atmosphere 16 01075 g016
Figure 17. Iron mass concentration in PM10 emissions measured using ICP-OES technique vs. steel fibre content in volume percentage in brake pads.
Atmosphere 16 01075 g017
Table 1. The characteristics of the particle measuring devices.
InstrumentCPCSMPSAPSFilter
ModelTSI 3775TSI 3082TSI 3321
Measurable particle diameter range, nm4–300014–700520–20,000<10,000
Aerosol inlet flow rate, L/min1.50.35.01.6
Table 2. The chemical composition of the friction materials and grey cast iron rotor and the steel fibre content in the friction materials.
Weight Percentage (wt.%)
ElementLS01LS02LS03NAO01LS04LS05LS06Disc
Al21.71530.6539.6240.96321.8181.7060.338≤0.015
Ba9.0639.019 16.21818.5088.06616.892
C 3.370
Ca0.4680.4490.3434.3820.5930.5000.892
Cr4.2025.6691.188 4.3273.826 0.180
Cu0.0320.0210.019 0.0120.011 0.320
Fe *24.96117.39634.2770.69715.03622.68413.369Rest
K 2.322
Mg26.21422.83437.428 23.25951.04522.389≤0.010
Mn 0.720
Mo0.0820.0740.093 0.1060.081 0.016
Ni 0.047
S5.2454.8414.33810.5496.8144.9816.6260.065
Si0.3720.4340.4995.6360.9030.6730.8762.060
Sn3.7993.3653.8378.6334.8253.3544.4910.048
Ti 7.594 0.013
Zn3.2044.9307.6793.1273.1972.7002.951
Zr 0.01023.875 15.296
Other0.6490.3160.66416.0020.5930.37215.880
Steel fibre (vol.%)16.5016.5023.000.008.0016.508.00
Steel fibre (wt.%)37.6436.1351.720.0019.9337.9118.88
* Not restricted to steel fibre content.
Table 3. Test procedure.
Test PhasesCycle NameNumber of SequencesDuration of Each Loading Sequence (s)Break Between Each Loading Sequence
(s)
Contact Pressure (MPa)Sliding Velocity (m/s)Vehicle Speed (km/h)
1Bedding5010601.28.080
2Emission2510601.23.535
3Emission1910601.26.060
4Emission610601.211.1110
Table 4. Vehicle parameters.
Test Inertia (WLTP) (kg·m2)Rolling Radius (mm)Effective Radius (mm)Brake Piston Diameter (mm)Pad Surface (mm2)
55.68301108.5544510
Table 5. Particle concentration for each vehicle speed.
LS01LS02LS03LS04LS05LS06NAO01
Average particle concentration at 35 km/h, #/cm3913941111
Average particle concentration at 60 km/h, #/cm3545163326494
Average particle concentration at 110 km/h, #/cm3317341281279318118197
Weighted average particle concentration *, #/cm363676248681825
* Calculated with a weight of 50% at 35 km/h, 38% at 60 km/h and 12% at 110 km/h.
Table 6. Average coefficient of friction (CoF) per vehicle speed.
LS01LS02LS03LS04LS05LS06NAO01
Average CoF at 35 km/h0.380.480.430.310.420.280.29
Average CoF at 60 km/h0.370.470.420.310.420.290.26
Average CoF at 110 km/h0.310.390.320.290.340.290.35
Table 7. Emission factors of the 7 friction pairs.
Friction MaterialLS01LS02LS03NAO01LS04LS05LS06
EFPM10 (μg/km) 4.107.066.76<0.543.156.881.75
Table 8. Chemical composition of PM10 particles (using ICP techniques).
Mass Concentration (µg/m3)
BaCrCuFeSSnTiZnZrCa
Quantification limit 0.130.250.052.464.920.130.490.250.134.92
LS010.340.320.1755.889.310.22 0.32
LS020.24 0.1376.50 17.20
LS03 0.360.1360.70 0.25 0.37 25.90
LS040.960.270.0531.6018.620.23 2.04
LS050.500.620.1770.40 0.300.060.33 25.90
LS060.18 32.02
NAO010.68 0.052.60 0.350.37 0.7543.10
Table 9. Average roughness values over four measurement areas.
LS01LS02LS03LS04LS05LS06NAO01
Average Rp (µm)1.471.481.441.541.581.511.38
Average Rv (µm)2.272.112.171.992.292.241.79
Average Ra (µm)0.480.470.460.460.480.490.43
Disclaimer/Publisher’s Note: The statements, opinions and data contained in all publications are solely those of the individual author(s) and contributor(s) and not of MDPI and/or the editor(s). MDPI and/or the editor(s) disclaim responsibility for any injury to people or property resulting from any ideas, methods, instructions or products referred to in the content.