Article

Multi-Aspect Analysis of Wildfire Aerosols from the 2023 Hongseong Case: Physical, Optical, Chemical, and Source Characteristics

Global Atmospheric Watch and Research Division, National Institute of Meteorological Sciences, Seogwipo-si 63568, Jeju-do, Republic of Korea
*
Author to whom correspondence should be addressed.
Atmosphere 2025, 16(9), 1074; https://doi.org/10.3390/atmos16091074
Submission received: 7 August 2025 / Revised: 5 September 2025 / Accepted: 10 September 2025 / Published: 11 September 2025
(This article belongs to the Section Aerosols)

Abstract

This study characterized the aerosol changes during the April 2023 Hongseong wildfire in Chungcheongnam-do, Korea, using physical, optical, and chemical data from the Anmyeon-do Global Atmosphere Watch station. The observation period was divided into three distinct phases: immediately after the wildfire (Period I), during precipitation (Period II), and the re-entry of wildfire smoke after precipitation (Period III). During Periods I and III, the PM10 mass concentrations were 75.7 ± 31.2 and 98.2 ± 55.6 µg/m3, respectively, which were approximately 2.4 and 3.1 times higher than the 2023 annual average (31.8 µg/m3) at the Anmyeon-do site. Aerosol scattering coefficients increased by factors of 4.0 and 6.9, and absorption coefficients by 5.5 and 4.2, respectively. Source apportionment using real-time data from a Monitor for Aerosols and Gases in ambient Air (MARGA) instrument combined with PCA demonstrated that aerosol emissions during Periods I and III were predominantly influenced by biomass burning sources. Analysis of PM10 and PM2.5 filter samples showed biomass burning markers, such as K+ and C2O42−, increased by 5.5–31.4 times compared with those in Period II. Elevated levels of combustion-related elements, including S, K, V, and Pb, further confirmed the influence of wildfire smoke on air quality during the affected periods.

1. Introduction

Atmospheric aerosols comprise various components, including water-soluble ions, metal oxides, carbonaceous substances, and water. They also contain reactive chemical elements such as sulfur, nitrogen, and carbon [1]. Present as solid or liquid particles suspended in air, aerosols influence Earth’s climate both directly and indirectly by scattering and absorbing solar radiation on a global scale [2]. Some aerosols and air pollutants also act as cloud condensation nuclei, influencing cloud formation and ultimately altering the chemical composition of the atmosphere [3,4]. Aerosols can originate from natural sources, such as soil dust or sea salt, formed through mechanical processes near Earth’s surface. They can also be generated through chemical processes related to human activities, including photochemical reactions or biomass burning (BB) [1]. BB refers to the combustion of vegetation (e.g., crops), organic matter, forests, or grasslands caused by natural or human-triggered fires. Among these, wildfires are known to account for a large proportion of BB emissions [5].
In recent years, climate change driven by global warming has led to rising temperatures and altered precipitation patterns, resulting in drier conditions and increasing incidence of wildfires worldwide [6,7]. For instance, the wildfires in Siberia between 2019 and 2020 burned approximately 4.7 million ha of land [8], and those that occurred in southeastern Australia from September 2019 to January 2020 affected approximately 24.3 million ha, causing extensive property damage and endangering numerous animal species [9,10,11]. The Korean Peninsula has also experienced more frequent wildfires due to rising temperatures and drier conditions linked to climate change [6,12]. In March 2022, a wildfire in Uljin, North Gyeongsang Province, burned approximately 16,301 ha of land [13]. More recently, a wildfire in Uiseong in March 2025 caused damage covering an area of 45,157 ha, approximately 2.8 times the area burned in the Uljin fire [14]. These examples highlight the increasing frequency and severity of wildfires, both in terms of their occurrence and impact [13,15].
Wildfires emit large amounts of greenhouse gases (such as CO2 and CH4), along with organic and inorganic aerosols and various gaseous pollutants (including CO, NOₓ, and volatile organic compounds), significantly deteriorating the air quality in surrounding regions [16,17]. For example, the wildfire that occurred in March 2022 in Uljin and Gangneung was reported to have increased the concentrations of trace gases (CO and NOₓ) and both primary and secondary organic aerosols [3,18]. Similarly, the 2023 wildfire in Hongseong led to a notable rise in both light-scattering and light-absorbing aerosol components, with an increased contribution from brown carbon (BrC) [19]. Hence, understanding and analyzing wildfire-induced changes in air quality indicators is essential to better grasp the factors influencing climate change [18,20].
In Korea, aerosol-related studies have mostly focused on western coastal regions, such as Anmyeon-do and Gosan, aiming to identify local and long-range pollution sources [19,21]. However, research on the effect of wildfires on carbonaceous aerosols, including their physical, optical, and chemical properties, has been limited. In particular, no study has yet provided a real-time analysis of the chemical characteristics of aerosols resulting from the 2023 Hongseong wildfire. Therefore, the physical, optical, and chemical properties of aerosols during the 2023 Hongseong wildfire were studied based on data observed at the Anmyeon-do Global Atmospheric Watch (GAW) station.

2. Materials and Methods

The focus of this study was the 2023 wildfire that ravaged the county of Hongseong, located in south Chungcheong Province, South Korea. We employed aerosol observation data collected at the Anmyeon-do GAW station (Figure 1). The station is located in Anmyeon-eup, Taean-gun, Chungcheongnam-do, South Korea (36°53′ N, 126°32′ E; WMO/GAW station number 47132). Situated on the western coast of the Korean Peninsula, Anmyeon-do lies approximately 130 km southwest of Seoul. Within a 100 km radius, there are major industrial facilities, including a semiconductor complex and coal-fired power plants located approximately 35 km to the northeast and southeast. To the west and south, the station is bordered by tidal flat coastal zones [22].
The Hongseong wildfire, which occurred in Jung-ri, Seobu-myeon (36°56′ N, 126°52′ E), lasted approximately 53 h, from 11:00 A.M. on 2 April to 4:00 P.M. on 4 April 2023 [13]. It affected 1337 ha of land, accounting for approximately 7.1% of Hongseong’s total forest area. This event was the largest wildfire in the western coastal region and the first large-scale wildfire in Korea to have spread southwest due to a northeast wind since national records began [23,24]. During the first hour after ignition, the wildfire’s average wind speed was 4.3 m/s, which was not sufficiently strong to accelerate the spread [23]. However, over 54% of the forest in the affected area comprised highly flammable coniferous trees, which likely contributed to the extent of the damage [24].
The physical properties of the aerosols were assessed using two instruments. A particulate matter analyzer (PM10 β-ray, FH62C14, Thermo Fisher Scientific, Waltham, MA, USA), which provided PM10 mass concentration data, and an aerodynamic particle sizer (APS, TSI3321, TSI, Shoreview, MN, USA) to determine the size-resolved particle number concentrations at a 5 min resolution. These number concentrations were then converted to mass concentrations by assuming that the particles were spherical. The aerosol optical properties were measured using a nephelometer (TSI3563, TSI, USA) and an aethalometer (AE31, Aerosol d.o.o., Ljubljana, Slovenia). The nephelometer provided aerosol scattering coefficients at three wavelengths (450, 550, and 700 nm), while the aethalometer yielded absorption coefficients at seven wavelengths (370, 470, 520, 590, 660, 880, and 950 nm). Data post-processing, including correction for angular scattering errors, was conducted based on methodologies proposed in previous studies [25,26]. All the physical and optical measurements were adjusted to standard temperature and pressure conditions (273.15 K, 1013 hPa) before analysis.
The chemical components of the aerosols were analyzed using a Monitor for Aerosols and Gases in ambient Air (MARGA; 2060 MARGA, Metrohm, Herisau, Switzerland). MARGA data were collected at a 1 h resolution, yielding both gaseous precursors and water-soluble ions. A low-volume air sampler (PMS-104, APM Engineering, Bucheon-si, Republic of Korea) collected PM10 and PM2.5 samples over 24 h intervals. These samples were then examined using ion chromatography (IC, Metrohm, Switzerland) to quantify 13 ionic species, including both inorganic and organic compounds (NH4+, Na+, K+, Ca2+, Mg2+, SO42−, NO3, Cl, F, HCOO, CH3COO, CH3SO3, and C2O42−). Additionally, elemental composition was determined using an inductively coupled plasma-optical emission spectrometer (ICP-OES, PerkinElmer, Waltham, MA, USA) and an inductively coupled plasma-mass spectrometer (ICP-MS, PerkinElmer, USA), targeting 20 elemental species: S, Na, Al, Ca, K, Mg, Fe, Ba, Sr, V, Cr, Cu, Ni, Zn, Pb, Cd, Mo, Ti, Mn, and Co. The measurement parameters and analytical instruments employed in this study are summarized in Table 1.

3. Results and Discussion

3.1. Aerosol Characteristics by Observation Period

Figure 2 shows the delineation of three distinct observation periods for analyzing the physical, optical, and chemical aerosol characteristics affected by wildfire smoke: Period I (3 April, 03:00 KST to 4 April, 10:00 KST) immediately after the fire outbreak, Period II (4 April, 10:00 KST to 6 April, 00:00 KST) during precipitation, and Period III (6 April, 00:00 KST to 7 April, 07:00 KST) following precipitation, when wildfire smoke re-entered the site.
During Period I, the predominant wind direction was from the east, with speeds below 2.5 m/s. This indicated a direct influence from the fire, which was located east of the observation site. The average PM10 mass concentration during Period I was 75.7 ± 31.2 µg/m3 (Table 2), approximately 2.4 times higher than the 2023 annual mean at Anmyeon-do (31.8 µg/m3).
Scattering and absorption coefficients at 550 nm were significantly elevated, reaching 307 ± 189.6 Mm−1 and 21.9 ± 15.3 Mm−1, respectively. These values represent increases of 4.0 and 5.5 times compared with the Anmyeon-do annual means (77.1 and 4.0 Mm−1), which were derived from continuous measurements at the station from January to December 2023. Black carbon (BC) concentrations calculated using the aethalometer (880 nm) reached 2.3 ± 1.5 µg/m3, which were approximately 4.6 times higher than the site average of 0.5 µg/m3.
In Period III, weak wind conditions prevailed, and APS data revealed the dominance of fine particles in the early phase. From 6 April, 09:00 to 21:00, both fine and coarse particles influenced the site, with coarse particle influence increasing later. The PM10 concentration reached 98.2 ± 55.6 µg/m3, approximately 3.1 times higher than the annual mean. The scattering and absorption coefficients were 532.7 ± 391.6 Mm−1 and 16.8 ± 10.3 Mm−1, respectively, which were 6.9 and 4.2 times higher than the annual means. This indicated a significant enhancement in light-scattering and absorbing aerosols due to wildfire smoke.
MARGA data revealed elevated K+ concentrations during both Periods I and III, suggesting a strong influence from BB. K+ is a widely used tracer for dust and smoke from such events, as its concentration is known to increase during BB [4]. Period III also exhibited a sharp increase in secondary pollutants (NO3, SO42−, and NH4+) and combustion-related ions (K+ and Cl), indicating the influence of aged wildfire smoke. These findings confirm the strong influence of wildfire smoke on aerosol physical and optical properties at the Anmyeon-do site. However, the extent to which these changes affect regional air quality, visibility, and radiative forcing warrants further investigation.

3.2. Classification of Aerosol Types by Period

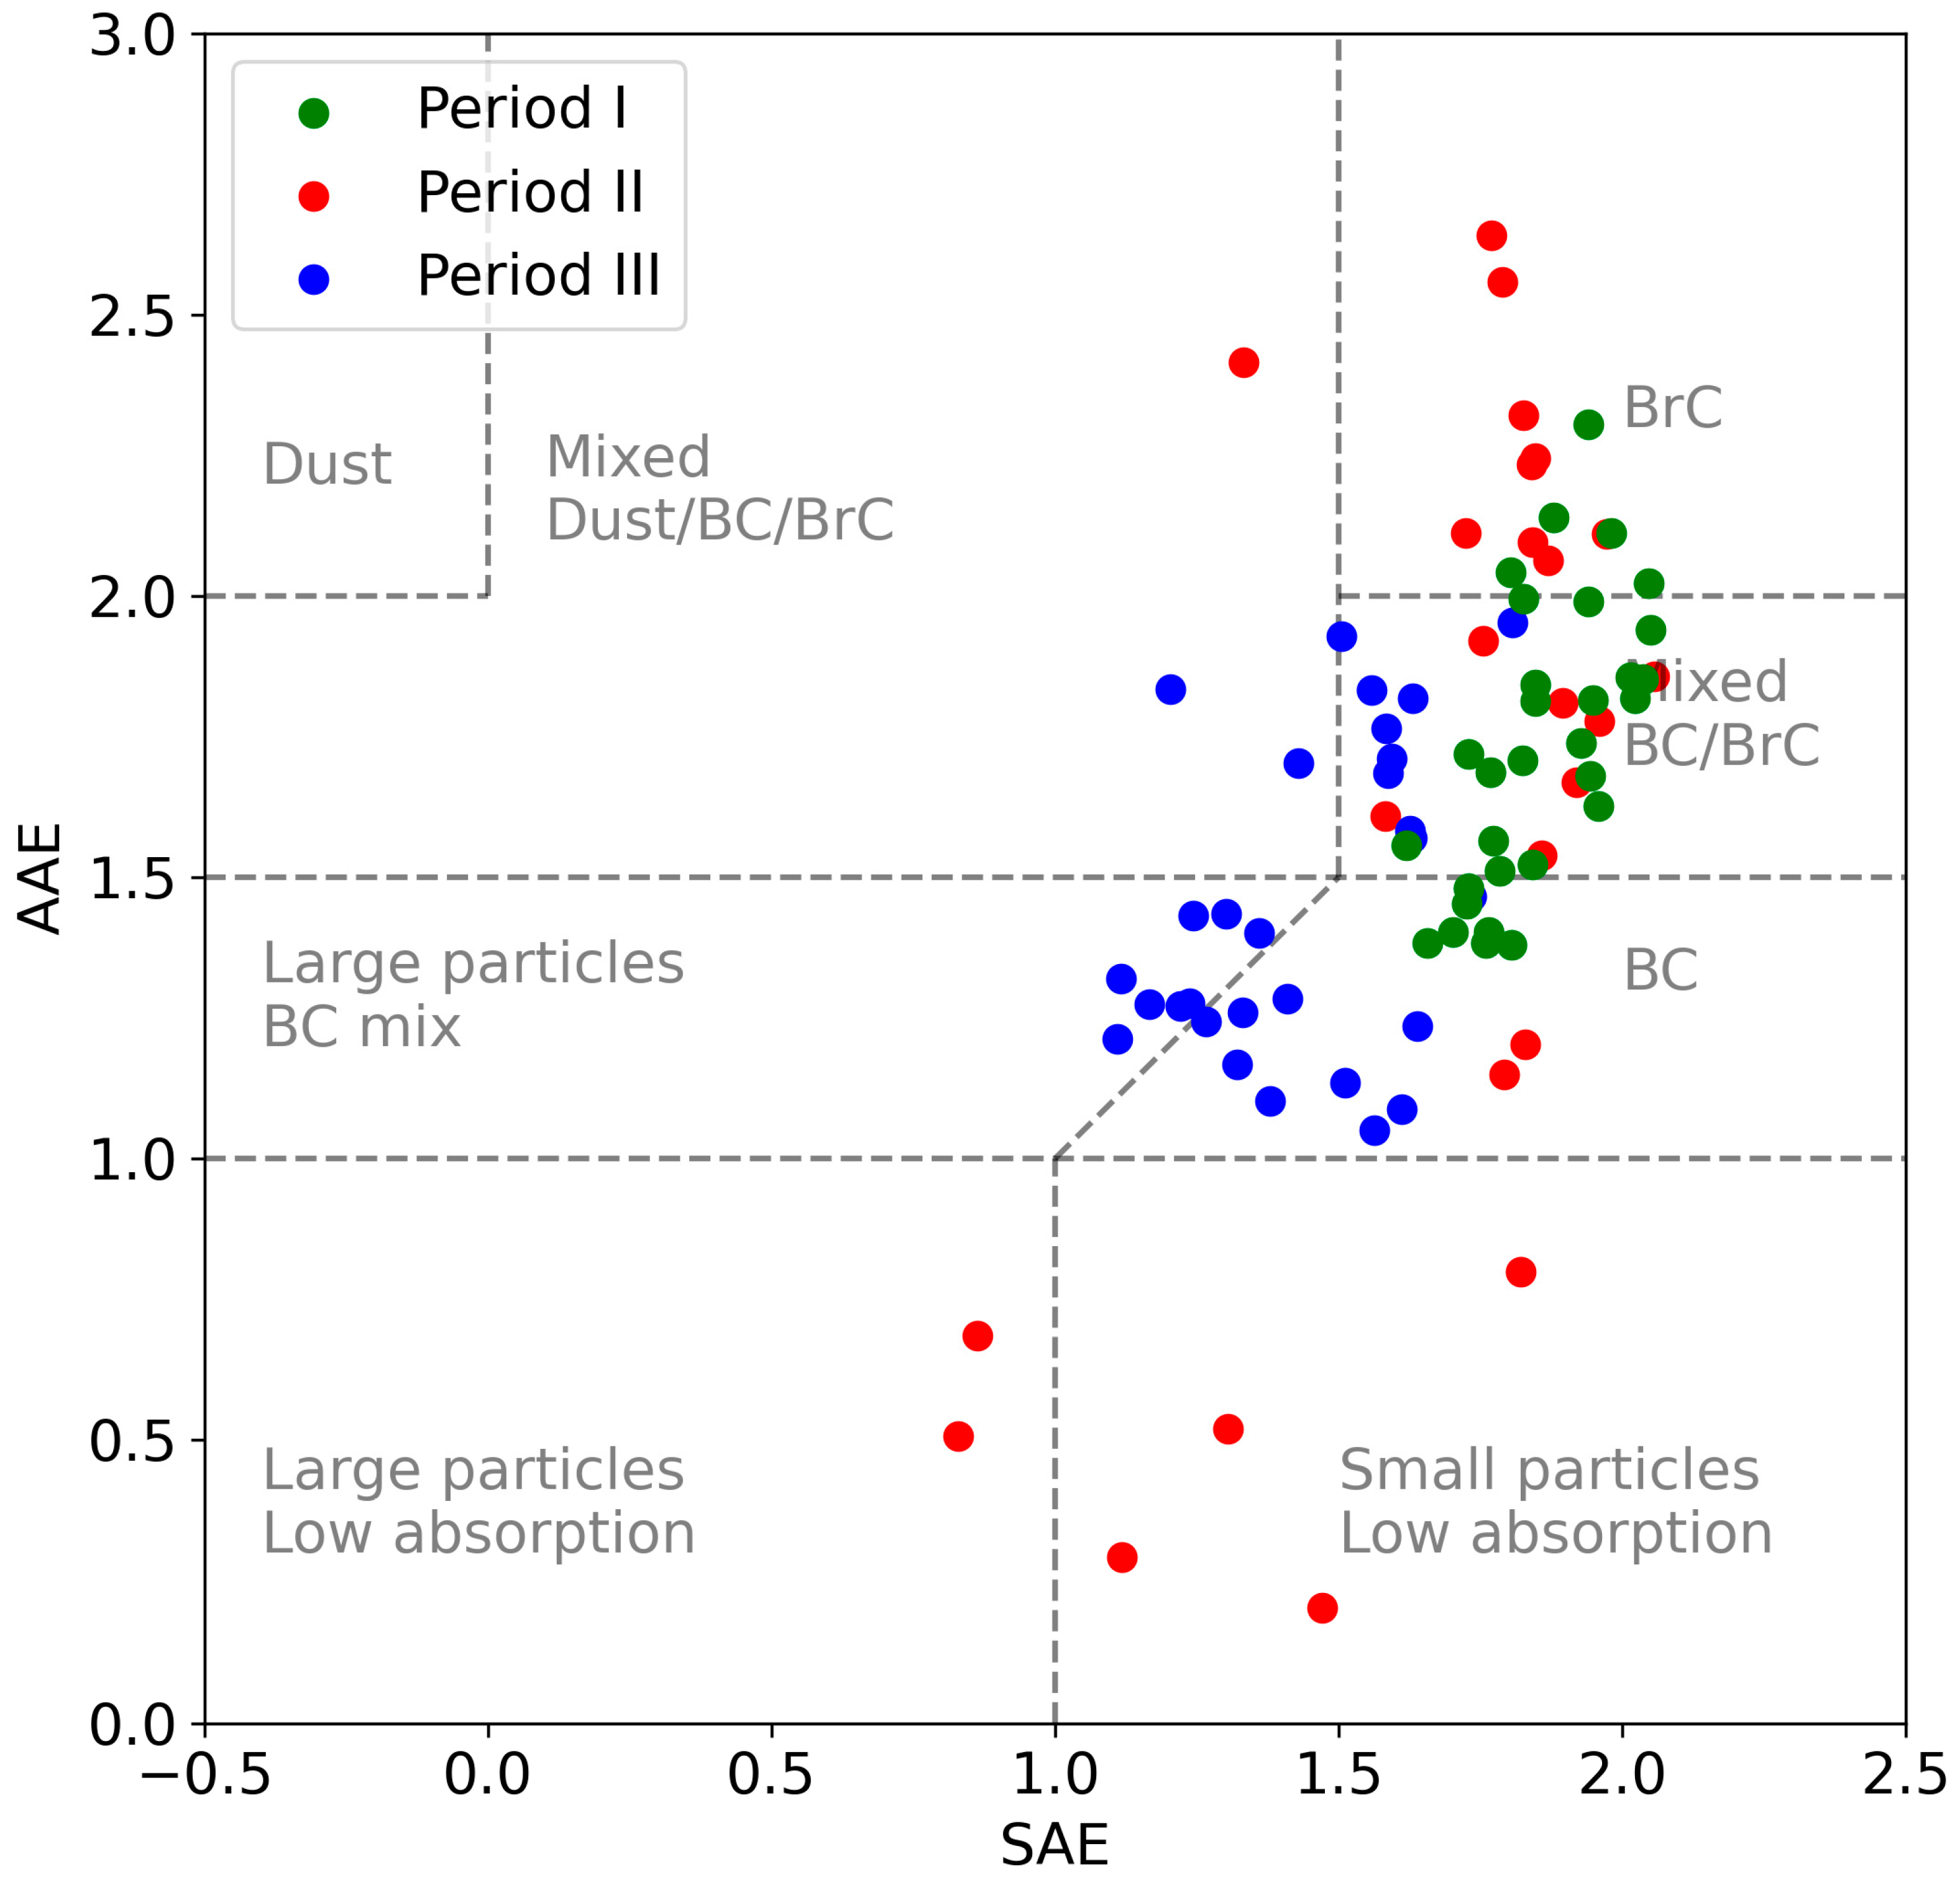
Figure 3 illustrates the classification of aerosol types using the scattering Ångström exponent (SÅE) and absorption Ångström exponent (AÅE), following the approach outlined in related studies [28].
The AÅE calculated over 470–700 nm was the highest in Period I (1.8), followed by Period III (1.4) and Period II (0.8). These results are consistent with previous findings [19], suggesting that elevated AÅE values during BB events are influenced by the presence of light-absorbing organic carbon, commonly referred to as BrC.
BrC is known to absorb solar radiation primarily in the ultraviolet and near-visible regions, typically exhibiting AÅE values in the range 1.5–3.0 [19,29,30]. During Period I, most aerosols were concentrated in regions characteristic of BrC or BrC/BC mixtures, indicating a substantial influence from carbonaceous aerosol emissions immediately following the wildfire. The increased concentration of combustion-related aerosols during this period was likely responsible for the observed optical features.
In Period II, which coincided with rainfall, the aerosol types were more broadly dispersed. This was attributed to the wet scavenging effect, which substantially reduced the aerosol concentrations and resulted in a less distinct classification during this period.
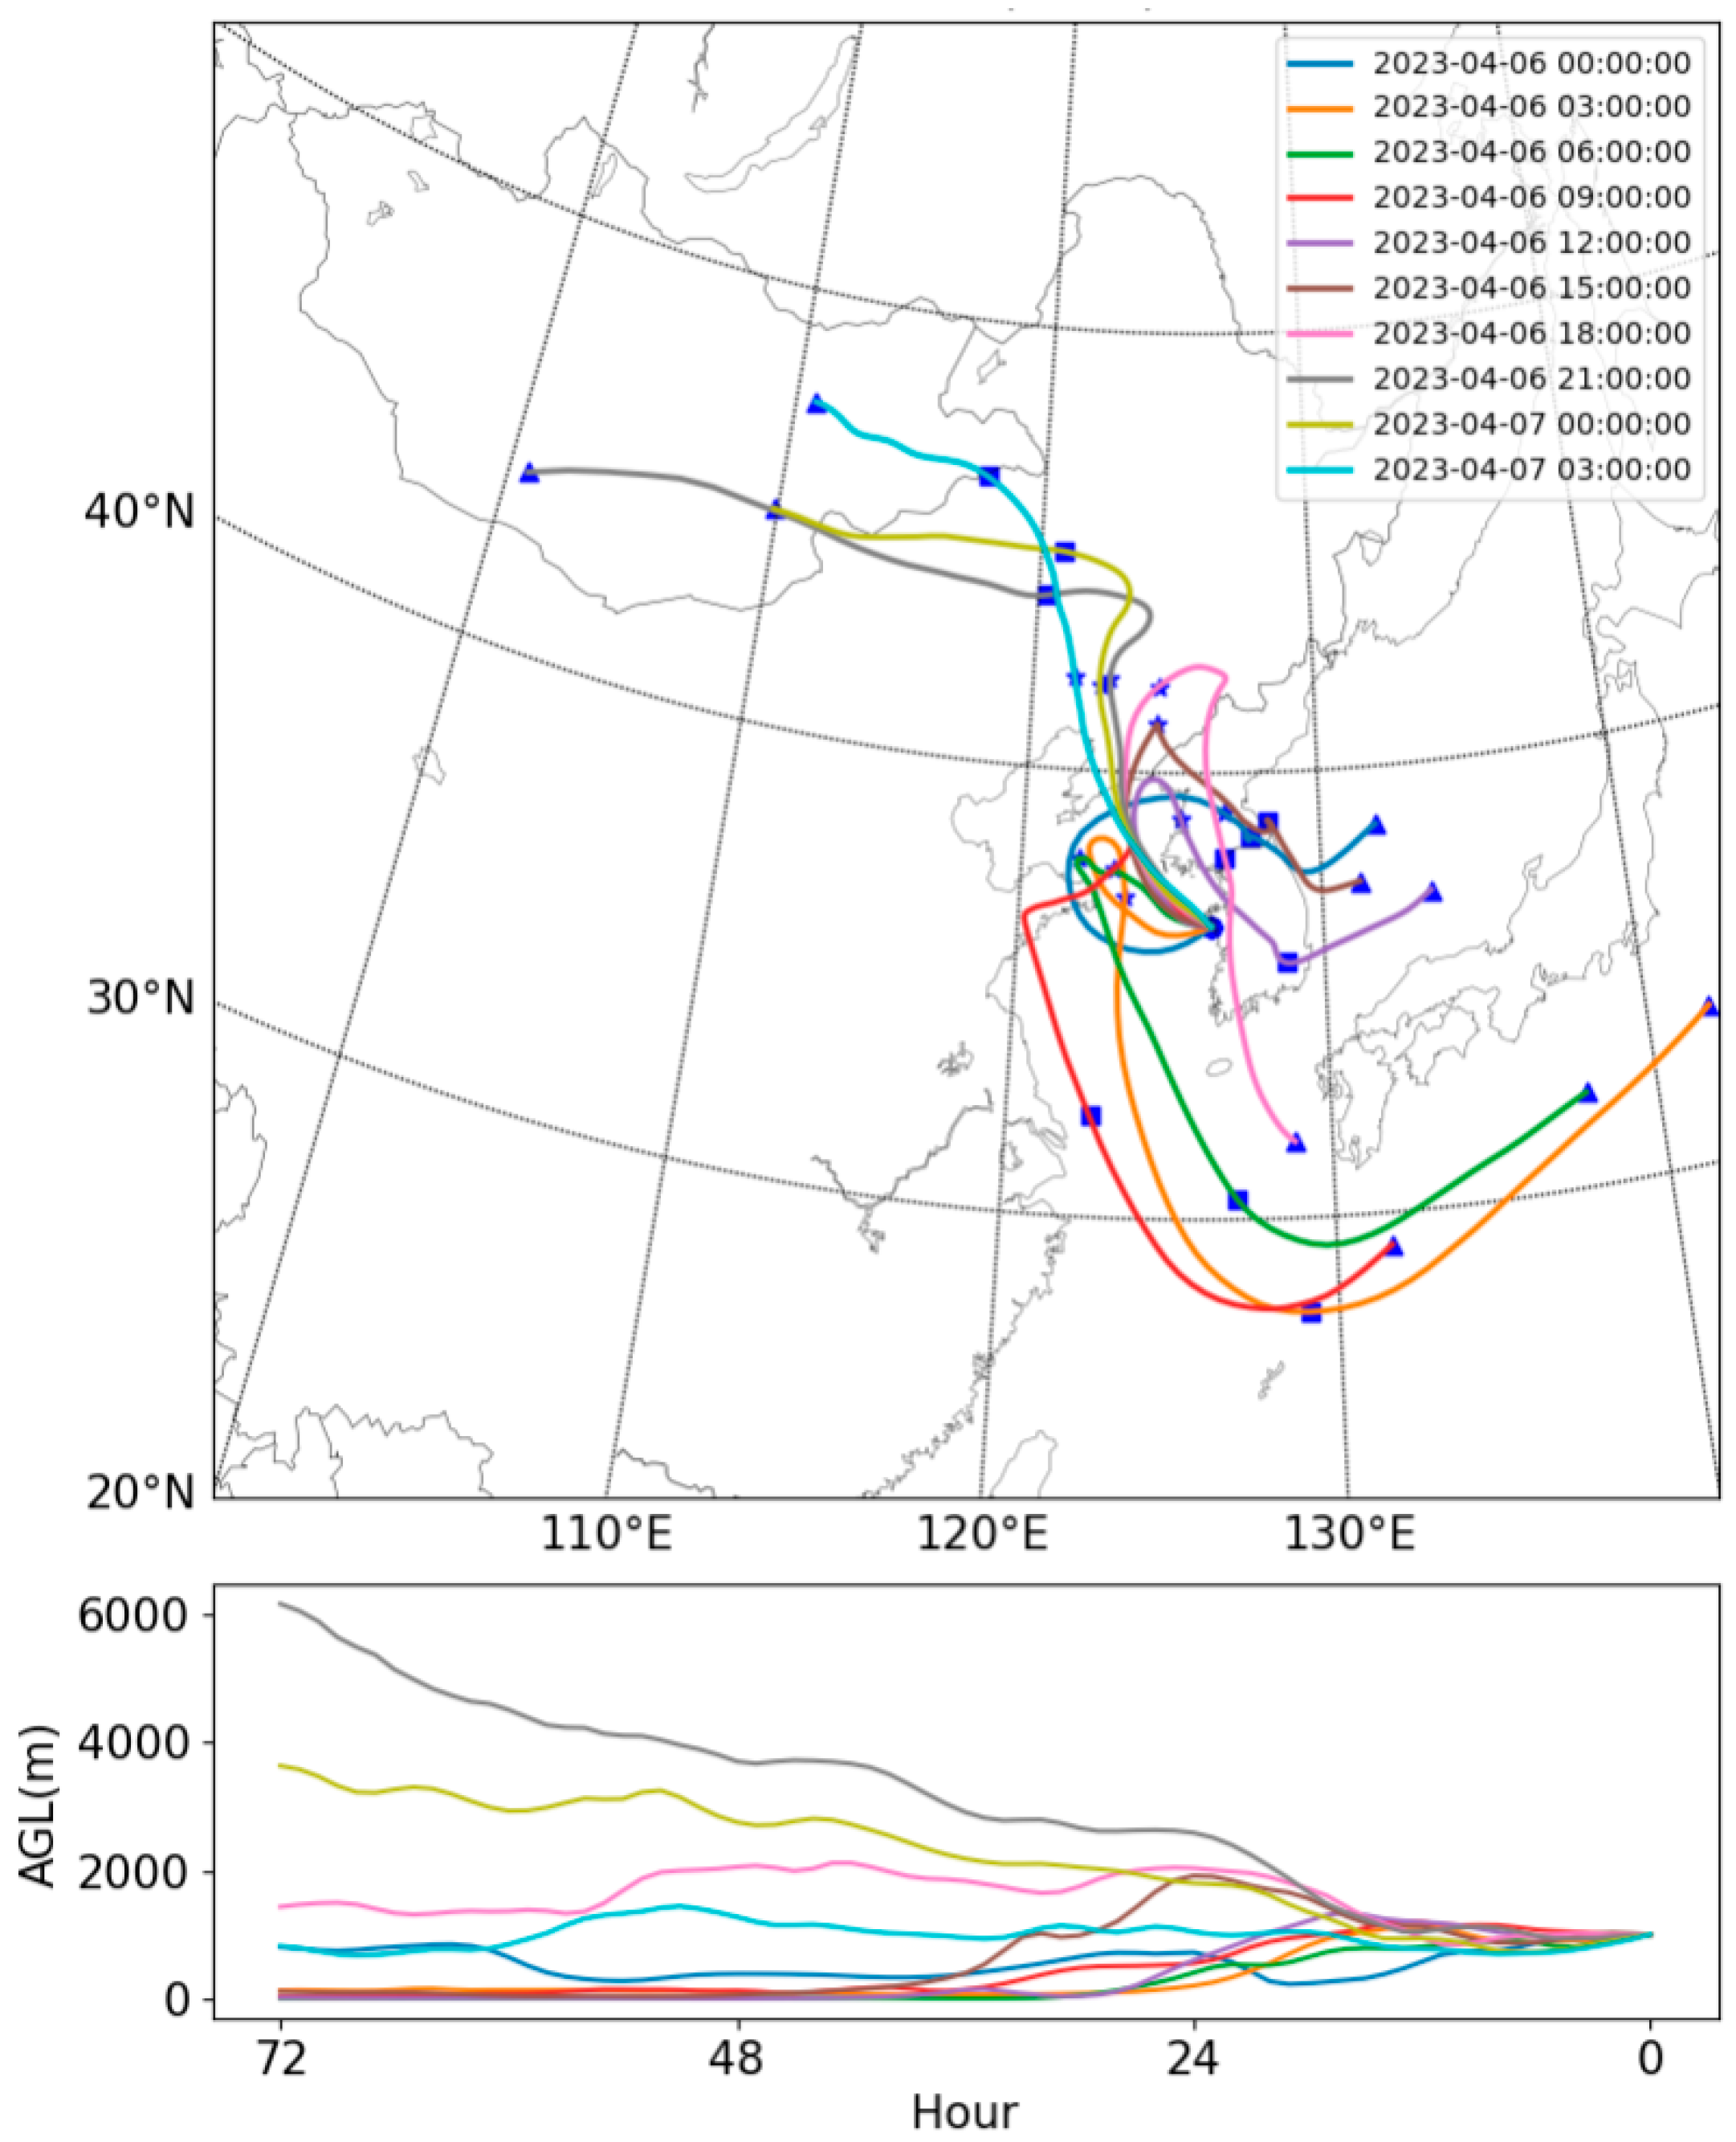
During Period III, the aerosols observed immediately after the rainfall were mainly composed of BC and BC/BrC mixtures, reflecting the influence of fine particles from wildfire smoke. However, as shown in Figure 2, a gradual increase in coarse particles was also observed, prompting further investigation through air mass trajectory analysis. Backward trajectories were calculated using the HYSPLIT model with GDAS 1° data for 72 h at 6 h intervals at an altitude of 500 m(Figure 4). The results indicated that after 21:00 on 6 April, air masses originated from Inner Mongolia and northern China. This inflow was consistent with the observed increase in coarse particles. These findings suggest that shortly after the rainfall, the re-entrainment of wildfire smoke enhanced fine particle concentrations, while the subsequent arrival of continental air masses contributed to elevated coarse particle levels.
The aforementioned results highlight the varying optical characteristics of wildfire-influenced aerosols and their dynamic evolution under changing atmospheric conditions such as precipitation and long-range transport. The prevalence of BrC and BC/BrC mixtures indicates the necessity for more targeted investigations into their specific radiative effects and atmospheric residence time.

3.3. Source Apportionment of Aerosols Based on Quasi-Real-Time Analysis

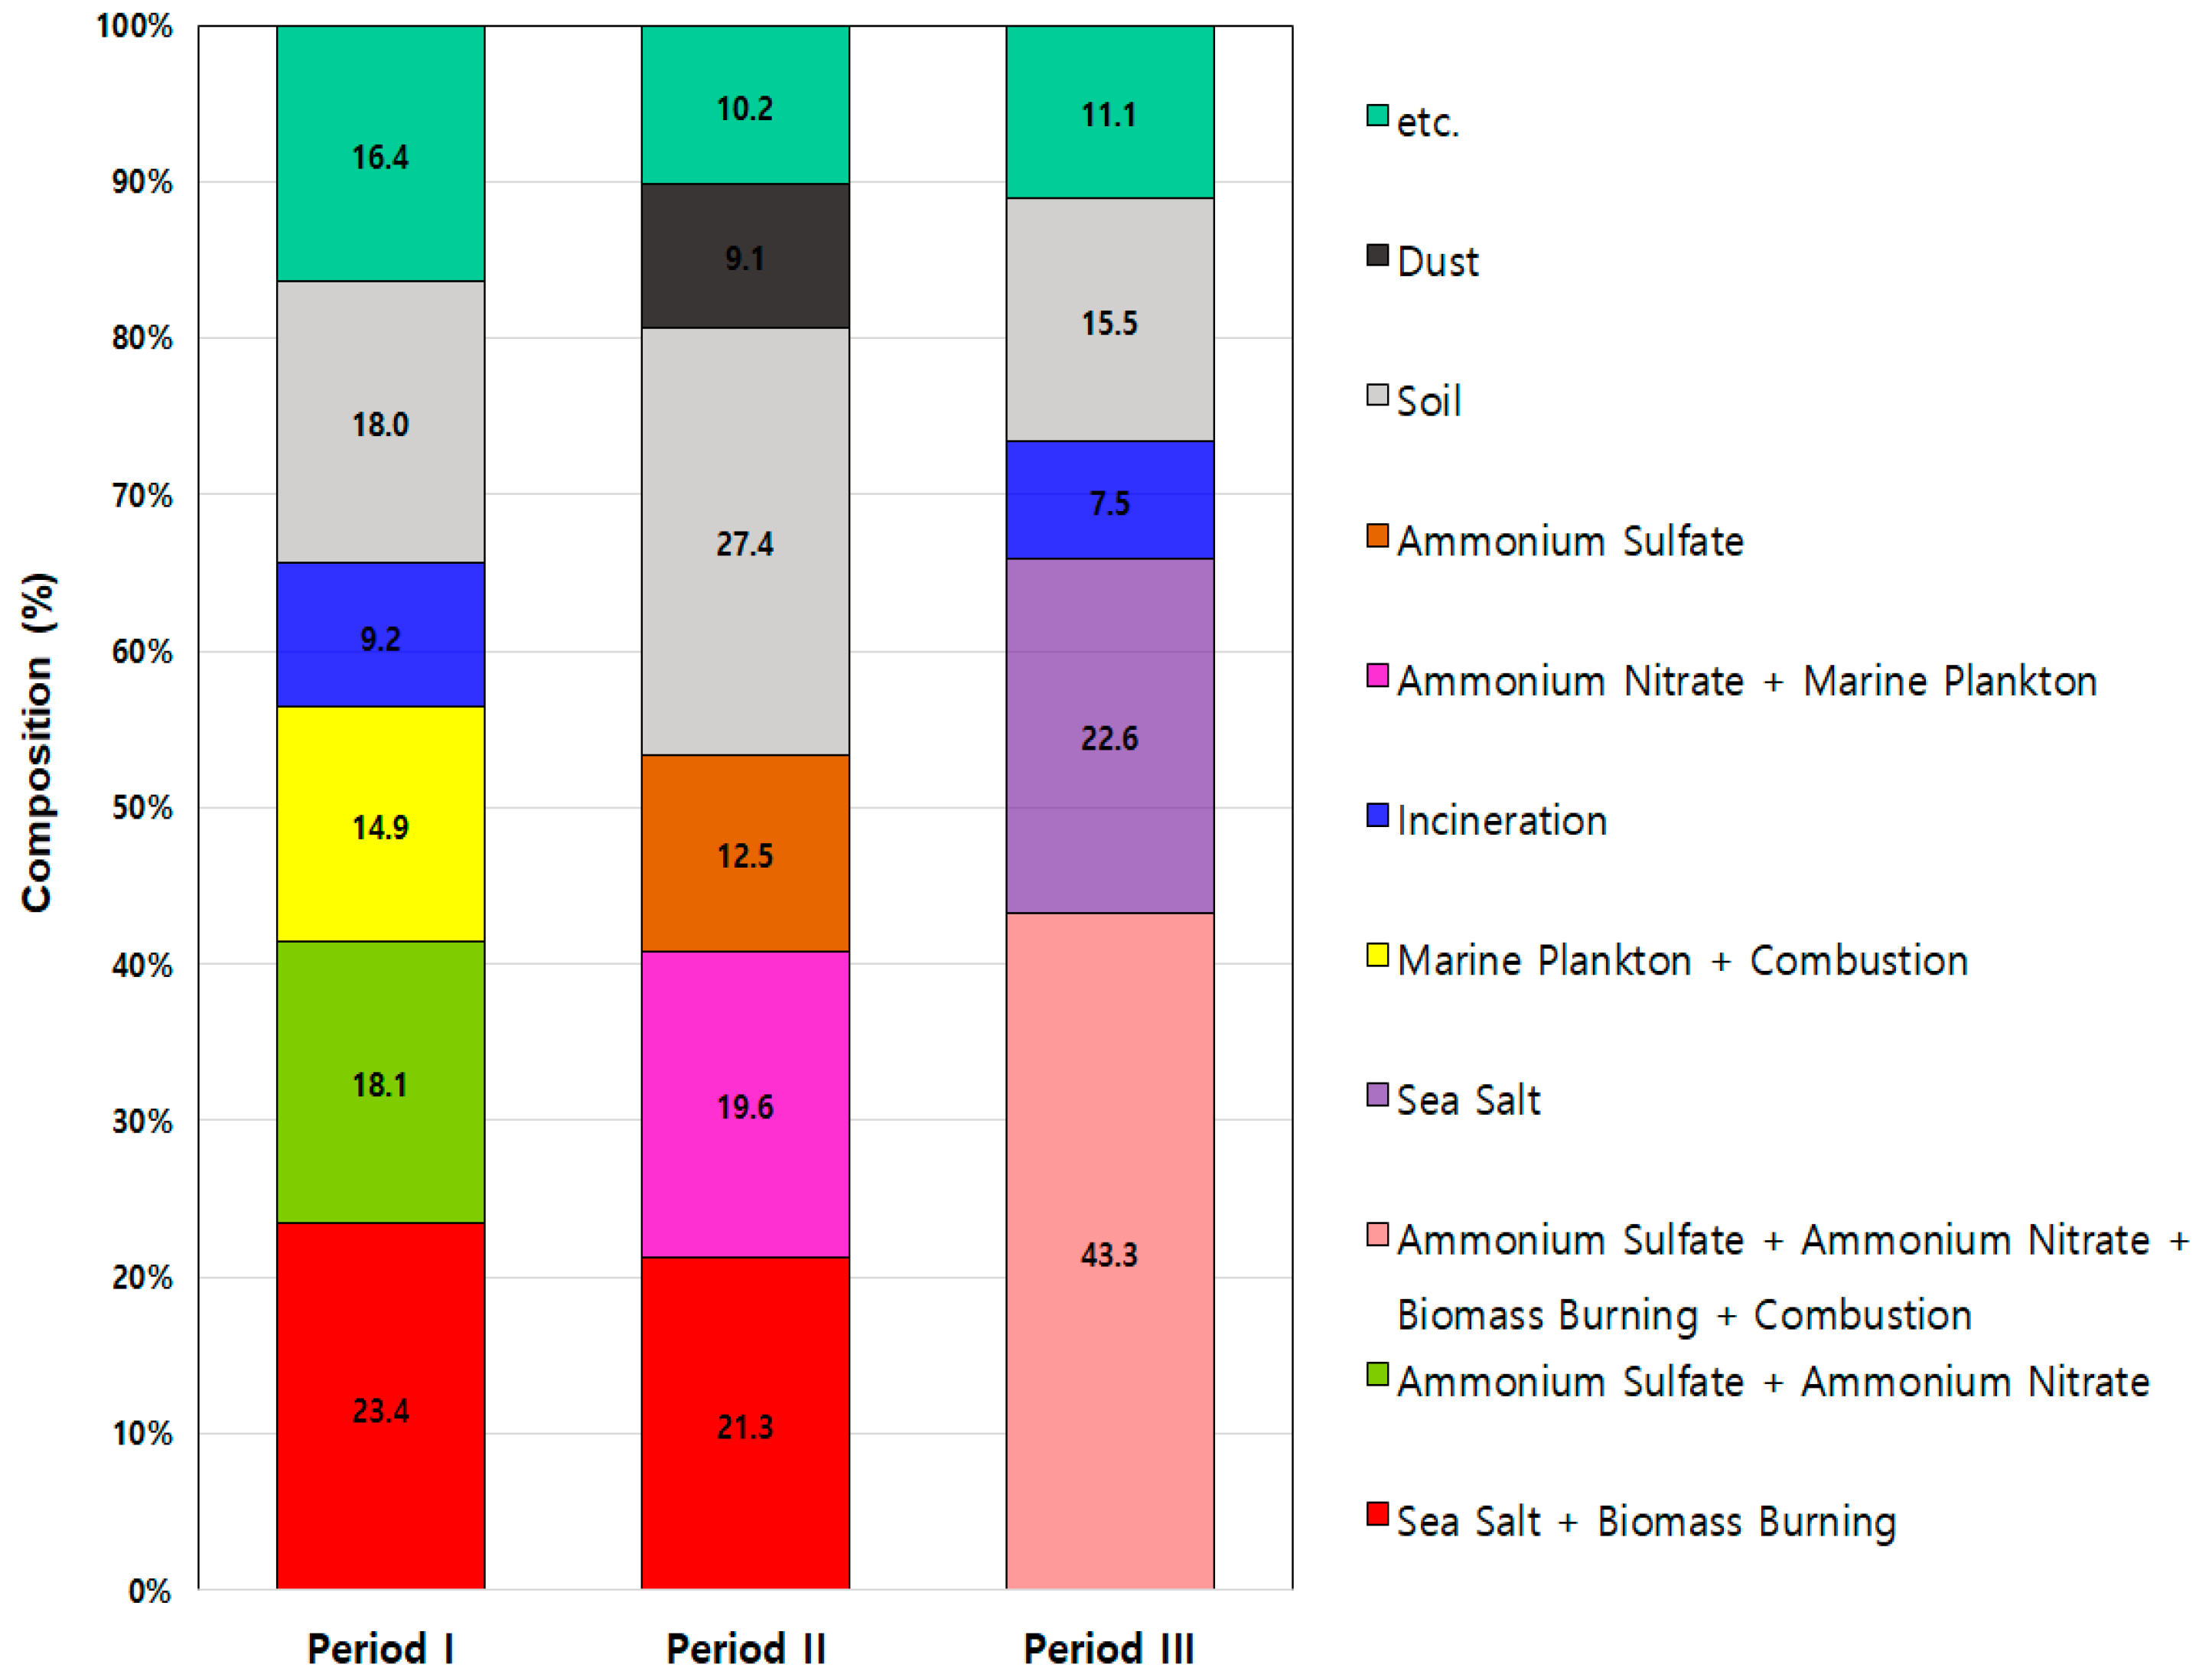
To identify the origins and emission characteristics of gaseous and particulate aerosols, a principal component analysis (PCA) was conducted for each observation period using MARGA data (Figure 5).
PCA is a widely used statistical method that reduces the dimensionality of correlated variables by grouping them based on shared variance. It is particularly useful in source apportionment studies on atmospheric particulate matter, where it helps infer the origins of various chemical components [1,31]. In this study, principal components with eigenvalues greater than one were retained, and a varimax rotation with Kaiser normalization was applied to enhance interpretability (Table 3).
In Period I, the PCA explained 83.6% of the total variance, with the first component accounting for 23.4%. This component was primarily associated with sea salt and BB markers, indicating a strong influence from direct wildfire emissions. Subsequent components were related to secondary aerosols, such as ammonium sulfate ((NH4)2SO4) and ammonium nitrate (NH4NO3), as well as sources like soil dust, marine plankton activity, and combustion/incineration. The results for Period I suggest that the observed aerosols were strongly influenced by freshly emitted particles from the wildfire.
In Period II, soil-related contributions dominated (27.4%), followed by sea salt, BB, marine biogenic sources, and fugitive dust. The relatively lower variance explained reflects the effect of precipitation scavenging, which reduced aerosol concentrations and made source separation less distinct.
During Period III, a combined influence from secondary inorganic aerosols, BB, and incineration accounted for 43.3% of the total variance. The enhanced contribution from these sources indicates that dense wildfire smoke re-entered the observation site following the cessation of rainfall, leading to strong signals from aged BB emissions and secondary reaction products.
Overall, the PCA results highlight temporal variability in dominant aerosol sources during the wildfire event, with direct BB influence peaking in Period I, soil-related emissions dominating Period II, and a mixture of aged smoke and secondary pollutants prevailing in Period III. These PCA results reveal temporal shifts in dominant aerosol sources in response to both wildfire activity and meteorological changes. The enhanced presence of secondary aerosols and BB markers during the smoke-affected periods further underscores the value of high-time-resolution chemical analysis in differentiating overlapping pollution sources under dynamic atmospheric conditions.

3.4. Chemical Characteristics of Aerosols During the Wildfire Period

BB emits substantial quantities of both gaseous and particulate matter. Among the gaseous components, CO and CO2 are typically the most abundant during wildfire events [32]. For particulate matter, species such as potassium (K+) and oxalate (C2O42−) are commonly enhanced. In particular, K+ concentrations are known to increase due to contributions from ash and smoke [33]. C2O42−, produced during oxidation in BB, is also associated with the formation of aromatic compounds [33,34]. Other studies have reported that fine particles generated from biomass combustion are rich in organic carbon (OC), Na+, NH4+, Cl, and NO3 [35].
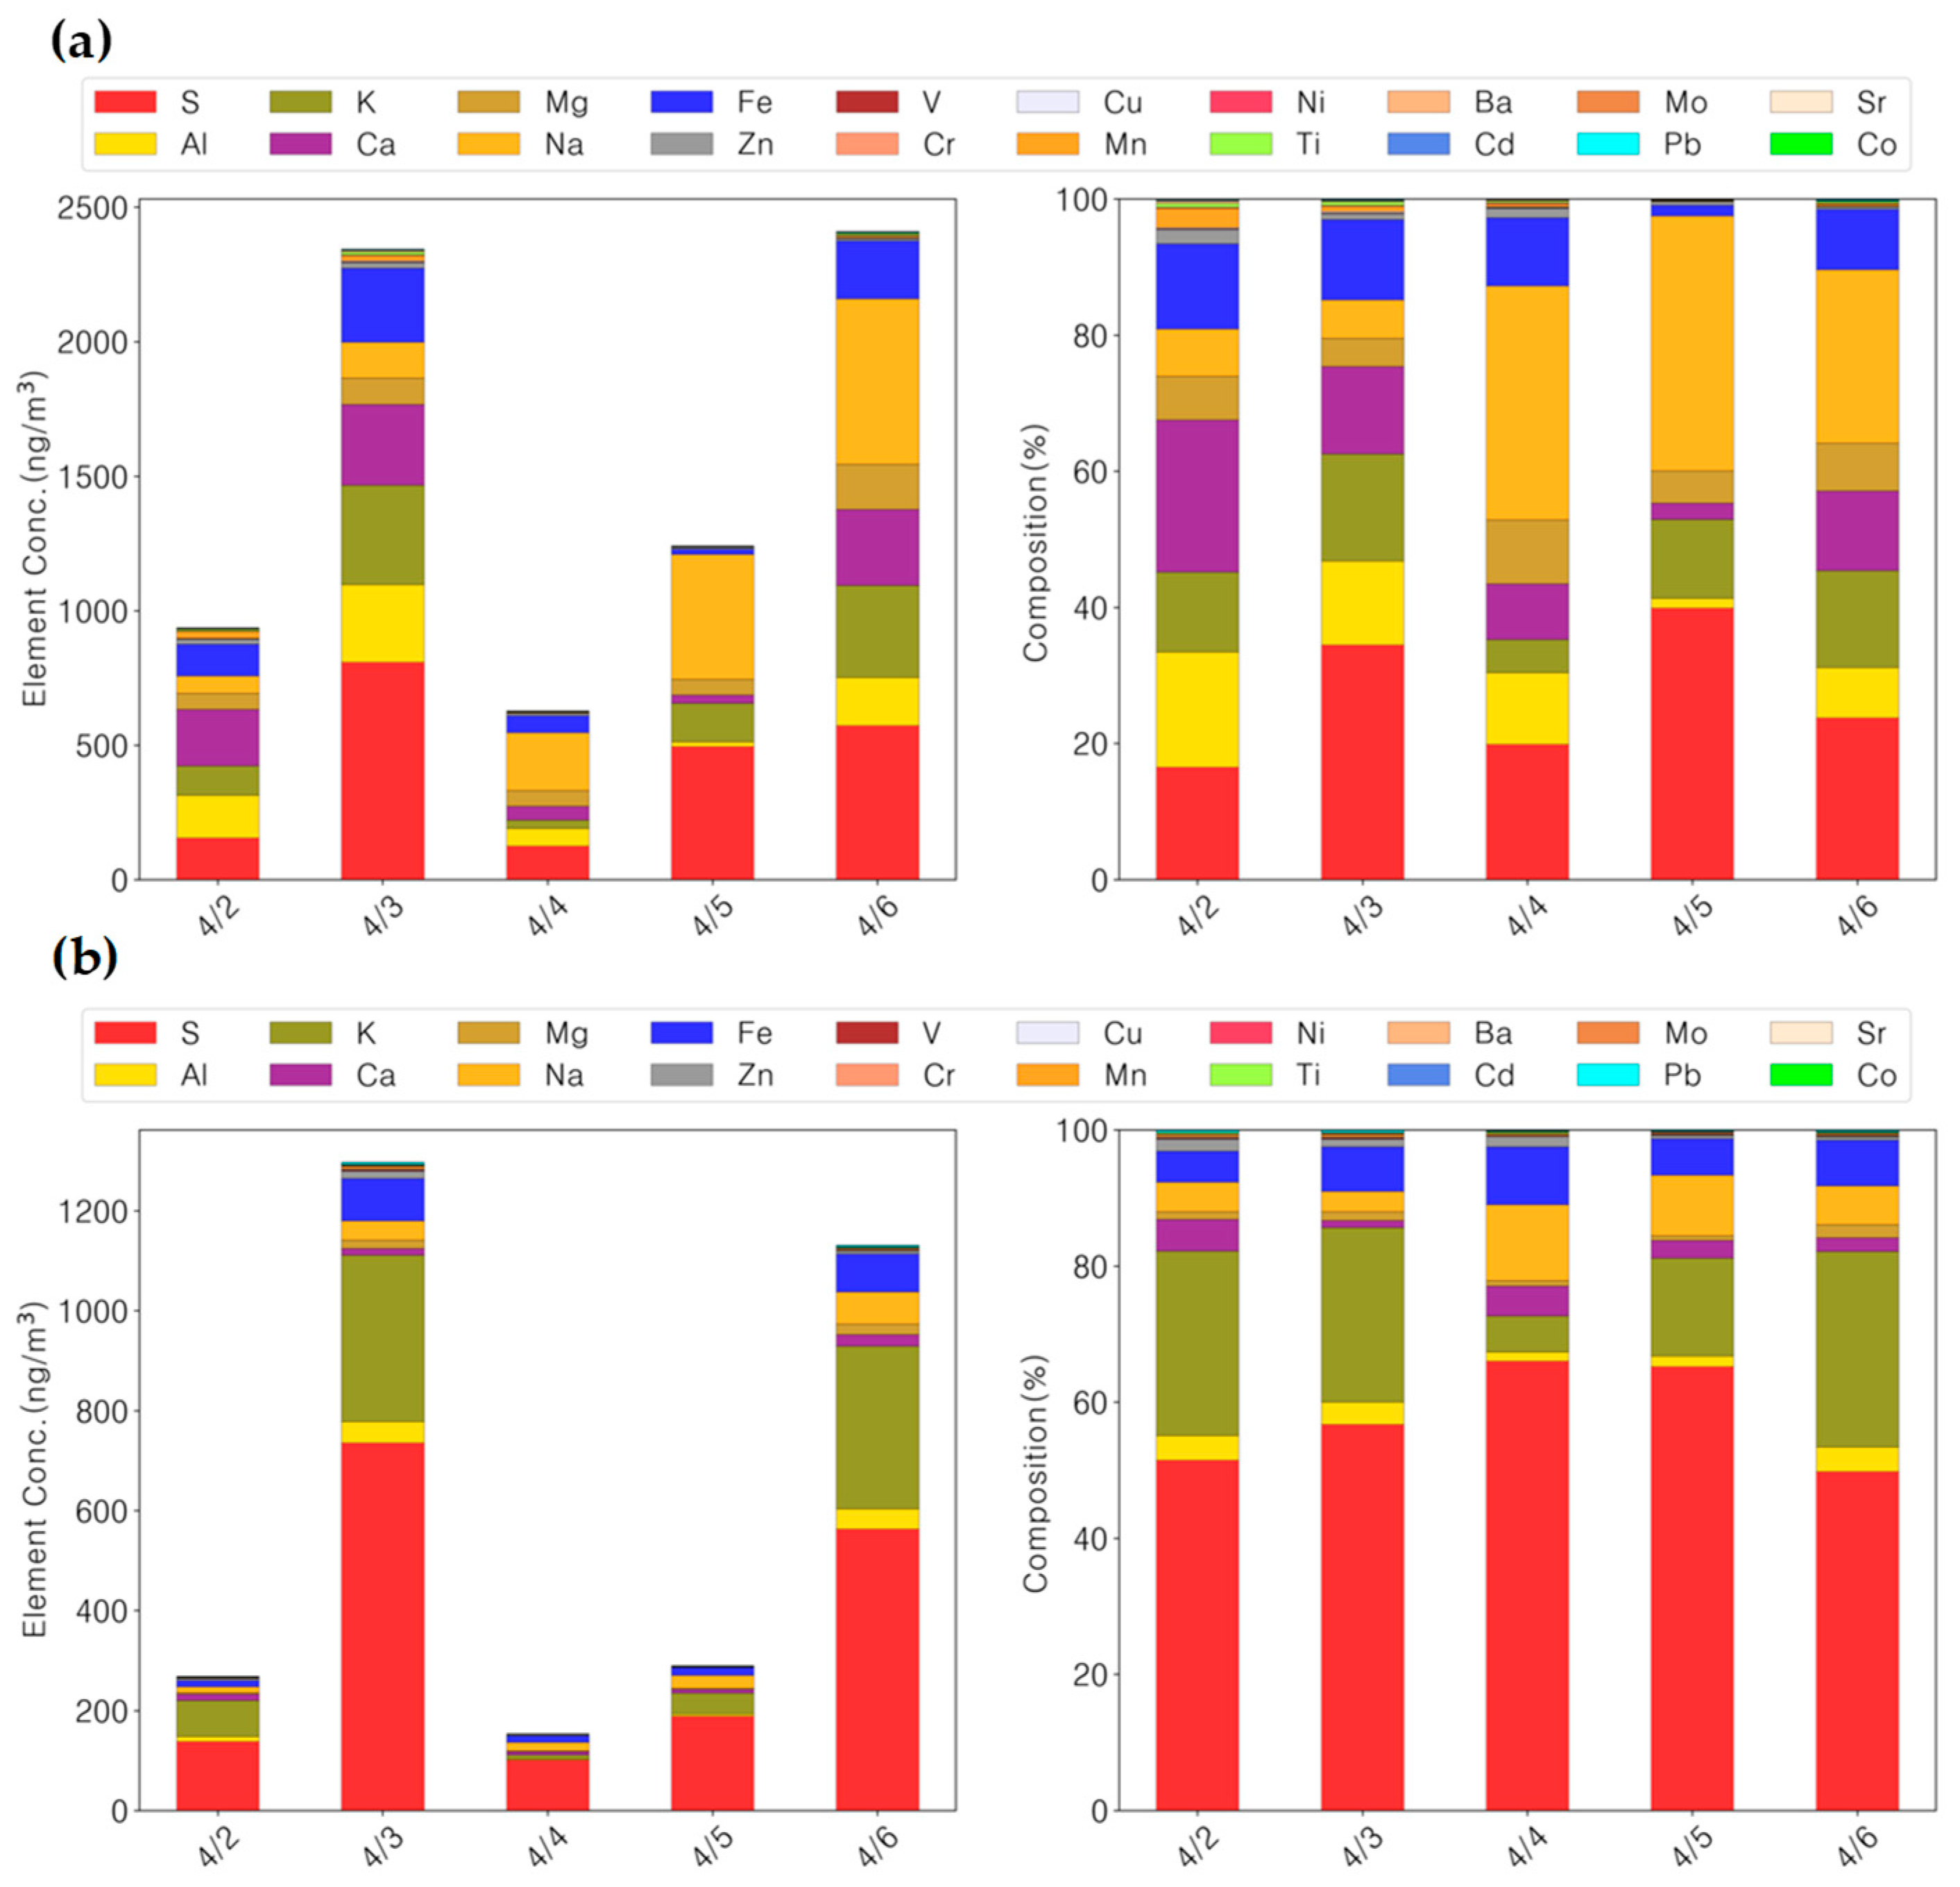
At the Anmyeon-do GAW station, ion and elemental compositions of PM10 and PM2.5 were analyzed from 2 to 6 April 2023 and classified according to the previously defined observation periods. Aerosol samples were collected using PTFE membrane filters on a 24 h basis, and their chemical compositions were examined to assess the influence of wildfire emissions (Figure 6 and Figure 7).
Elevated concentrations of combustion-related ionic species (Figure 6)—K+, NO3, Cl, and C2O42−—were observed during 2–3 April (immediately following the wildfire outbreak) and again during 5–6 April (post-rainfall re-entry of smoke). The total ion concentration also increased during these periods. Specifically, K+ and C2O42− were used to calculate the K+ biomass and C2O42− biomass concentrations based on standard formulae. These markers were found to be 9.4–31.4 times higher in PM10 and 5.5–25.9 times higher in PM2.5 compared with those on 4 April, when wet scavenging likely removed a significant portion of aerosols from the atmosphere. These increases were attributed to direct wildfire influence and subsequent smoke transport.
Cl concentrations in both PM10 and PM2.5 also increased significantly on 5 and 6 April. An analysis of non-sea salt chloride (nss-Cl) revealed a concentration range of 0.4–2.0 µg/m3, consistent with previous findings [36,37]. Although Cl in coastal regions, such as Anmyeon-do, is often influenced by sea salt, the observed increase in nss-Cl was attributed to combustion-related emissions during the wildfire event, consistent with results from international studies.
Formate (HCOO) and acetate (CH3COO), which are organic acids typically associated with vegetation processes, may also increase owing to the incomplete combustion of fossil fuels and biomass-derived fuels [38,39]. During 2–3 April (wildfire directly impacting the site) and 5–6 April (smoke re-entry), the HCOO and CH3COO concentrations were 1.9–6.8 and 1.8–7.1 times higher (in both PM10 and PM2.5), respectively, than those on 4 April, once again indicating the influence of BB.
The concentrations of several trace elements (Figure 7)—including S, K, V, and Pb—increased significantly on 2–3 and 5–6 April compared with those on 4 April. Enrichment factors ranged from 1.2 to 40.9, with K exhibiting over a 10-fold increase during both the direct fire event and post-rainfall smoke influence. These patterns suggest strong fire-related contributions.
Overall, both ionic and elemental composition data indicate that the air quality at Anmyeon-do was strongly affected by wildfire emissions during 2–3 and 5–6 April. Compared with those on 4 April, which were influenced by precipitation-related aerosol removal, the K+, NO3, C2O42−, K, and Pb levels were markedly elevated during the fire-influenced periods. These substantial increases provide evidence of combustion-related aerosol enrichment. Consistent with these findings, similar chemical patterns have been reported in previous international studies, particularly in Europe and North America, where aged wildfire plumes were found to contain elevated concentrations of K+, Cl, C2O42−, and various trace metals [35,37]. Such consistency across different regions supports the interpretation that BB significantly alters aerosol composition and plays a key role in regional air pollution events.
The results confirm the considerable chemical impact of direct fire emissions and transported wildfire smoke on regional aerosol composition. Based on the findings presented in Section 3.3 and Section 3.4, it is inferred that the Hongseong wildfire had a significant impact on the chemical characteristics of atmospheric aerosols observed at the Anmyeon-do site.

4. Conclusions

This study analyzed the atmospheric impacts of a large-scale wildfire that occurred in April 2023 in Hongseong, South Korea, based on multi-parameter measurements from the Anmyeon-do GAW station. By dividing the observation period into three distinct phases—Period I (immediate wildfire impact), Period II (during precipitation), and Period III (re-entry of wildfire smoke)—we comprehensively assessed the physical, optical, and chemical characteristics of wildfire-influenced aerosols.
During Periods I and III, the PM10 concentrations, scattering coefficients, and absorption coefficients all exhibited substantial increases compared with the site’s annual averages, confirming a marked deterioration in air quality associated with wildfire emissions. In particular, the enhanced scattering and absorption properties reflect the abundance of light-absorbing and fine-mode particles, such as BC and BrC, introduced by BB. To deepen this understanding, future studies should integrate meteorological analyses, satellite-derived products, and air mass trajectory modeling. Moreover, enhanced temporal monitoring of BrC and BC levels would help clarify their contributions to regional air quality and radiative balance.
PCA, using high-temporal-resolution MARGA data, supported these findings by revealing the dominant influence of BB sources during the wildfire-affected periods. The integrated analysis of chemical and optical properties demonstrated consistent patterns that link combustion-derived aerosols to changes in atmospheric composition and potential visibility degradation.
Filter-based chemical analysis further identified sharp increases in key combustion tracers (e.g., K+, C2O42−, HCOO, and CH3COO) and heavy metals (e.g., V and Pb), underscoring the complexity and intensity of the wildfire’s impact on aerosol composition.
The results of this study provide valuable scientific evidence of how wildfire events can alter atmospheric aerosol characteristics in coastal downwind regions of East Asia. These findings contribute to a more nuanced understanding of wildfire aerosol behavior and offer a robust observational basis for regional air quality evaluation and smoke event characterization.

Author Contributions

Conceptualization, J.-O.B. and H.-J.K.; methodology, J.-O.B. and H.-J.K.; software, S.-M.O.; validation, J.-O.B. and H.-J.K.; formal analysis, J.-O.B. and H.-J.K.; investigation, H.-J.Y.; writing—original draft preparation, J.-O.B.; writing—review and editing, J.-O.B., H.-J.K., H.-J.Y. and S.-M.O. All authors have read and agreed to the published version of the manuscript.

Funding

This study was supported by Korea Meteorological Administration Research and Development Program “Development of Asian Dust and Haze Monitoring and Prediction Technology” (Grant No. KMA2018-00521, Project Code 2360000154).

Institutional Review Board Statement

Not applicable.

Informed Consent Statement

Not applicable.

Data Availability Statement

The original contributions presented in this study are included in the article. Further inquiries can be directed to the corresponding author.

Conflicts of Interest

The authors declare no conflicts of interest.

Abbreviations

The following abbreviations are used in this manuscript:
MARGAMonitor for Aerosols and Gases in ambient Air
PTFEPolytetrafluoroethylene
GAWGlobal Atmospheric Watch
BBBiomass burning

References

  1. Bu, J.O. Long-Term Variation Characteristics of PM10 and PM2.5 Chemical Composition at Gosan Background Site in Jeju Island. Ph.D. Dissertation, Jeju National University, Jeju, Republic of Korea, 2019. [Google Scholar]
  2. Rastogi, N.; Singh, A.; Singh, D.; Sarin, M.M. Chemical characteristics of PM2.5 at a source region of biomass burning emissions: Evidence for secondary aerosol formation. Environ. Pollut. 2014, 184, 563–569. [Google Scholar] [CrossRef]
  3. Sun, D.H.; Song, S.K. Assessment of the impacts of a large-scale wildfire on aerosol composition changes and cloud condensation nuclei. J. Korean Soc. Atmos. Environ. 2024, 40, 689–703. [Google Scholar] [CrossRef]
  4. Song, J.; Zhao, Y.; Zhang, Y.; Fu, P.; Zheng, L.; Yuan, Q.; Wang, S.; Huang, X.; Xu, W.; Cao, Z.; et al. Influence of biomass burning on atmospheric aerosols over the western South China Sea: Insights from ions, carbonaceous fractions and stable carbon isotope ratios. Environ. Pollut. 2018, 242, 1800–1809. [Google Scholar] [CrossRef]
  5. Kim, D.Y. Analysis of Air Pollutants Emissions from Biomass Burning in Seoul Metropolitan Area; Gyeonggi Research Institute: Gyeonggi, Republic of Korea, 2011. [Google Scholar]
  6. Jain, P.; Castellanos-Acuna, D.; Coogan, S.C.P.; Abatzoglou, J.T.; Flannigan, M.D. Observed increases in extreme fire weather driven by atmospheric humidity and temperature. Nat. Clim. Change 2022, 12, 63–70. [Google Scholar] [CrossRef]
  7. Sokolik, I.N.; Soja, A.J.; Demott, P.J.; Winker, D. Progress and challenges in quantifying wildfire smoke emissions, their properties, transport, and atmospheric impacts. J. Geophys. Res. Atmos. 2019, 124, 13005–13025. [Google Scholar] [CrossRef]
  8. Descals, A.; Gaveau, D.L.A.; Verger, A.; Sheil, D.; Naito, D.; Peñuelas, J. Unprecedented fire activity above the Arctic circle linked to rising temperatures. Science 2022, 378, 532–537. [Google Scholar] [CrossRef]
  9. Prasanth, S.; Anand, N.; Manoj, M.R.; Arun, K.; Jose, S.; Satheesh, S.K.; Moorthy, K.K. A new perspective on the genesis of the 2019/2020 Australian bushfire and its atmospheric radiative impacts. J. Atmos. Sol. Terr. Phys. 2025, 274, 106558. [Google Scholar] [CrossRef]
  10. Deb, P.; Moradkhani, H.; Abbaszadeh, P.; Kiem, A.S.; Engström, J.; Keellings, D.; Sharma, A. Causes of the widespread 2019–2020 Australian bushfire season. Earth’s Future 2020, 8, e2020EF001671. [Google Scholar] [CrossRef]
  11. Nolan, R.H.; Boer, M.M.; Collins, L.; Resco de Dios, V.R.; Clarke, H.; Jenkins, M.; Kenny, B.; Bradstock, R.A. Causes and consequences of eastern Australia’s 2019–2020 season of mega-fires. Glob. Change Biol. 2020, 26, 1039–1041. [Google Scholar] [CrossRef]
  12. Chang, D.Y.; Jeong, S.; Park, C.E.; Park, H.; Shin, J.; Bae, Y.; Park, H.; Park, C.R. Unprecedented wildfires in Korea: Historical evidence of increasing wildfire activity due to climate change. Agric. For. Meteorol. 2024, 348, 109920. [Google Scholar] [CrossRef]
  13. National Institute of Forest Science (NIFOS). Statistical Yearbook of Forest Fire; National Institute of Forest Science (NIFOS): Seoul, Republic of Korea, 2023. Available online: https://forest.go.kr (accessed on 8 March 2024).
  14. Kim, I.S.; Lee, J.E.; Kim, S.J. The Monthly Environment; Ezengreen Co., Ltd.: Seoul, Republic of Korea, 2025; pp. 14–23. [Google Scholar]
  15. Sun, D.-H.; Song, S.-K.; Cho, S.-B.; Moon, S.-H. Long-term trend analysis in biomass burning emissions and their impacts on aerosols and CO concentrations in South Korea. J. Korean Soc. Atmos. Environ. 2023, 39, 351–371. [Google Scholar] [CrossRef]
  16. Kang, Y.; Jang, E.; Im, J.; Kwon, C. A deep learning model using geostationary satellite data for forest fire detection with reduced detection latency. GIScience Remote Sens. 2022, 59, 2019–2035. [Google Scholar] [CrossRef]
  17. Souri, A.H.; Choi, Y.; Jeon, W.; Kochanski, A.K.; Diao, L.; Mandel, J.; Bhave, P.V.; Pan, S. Quantifying the impact of biomass burning emissions on major inorganic aerosols and their precursors in the US. J. Geophys. Res. Atmos. 2017, 122, 12–20. [Google Scholar] [CrossRef]
  18. Kang, Y.; Choi, H.; Kim, Y.; Im, J. Understanding the impact of forest fire on ambient air quality. J. Korean Soc. Atmos. Environ. 2024, 40, 103–117. [Google Scholar] [CrossRef]
  19. Park, E.; Kim, M.-H.; Han, J.; Yoo, H.-J.; Yang, S.-H.; Kim, S.; Kim, Y.-A.; Won, D.; Kim, S.-W. Light-absorption properties of fresh biomass burning aerosols observed at the Anmyeondo Global Atmosphere Watch (GAW) Regional Station: A case study in April 2023. J. Korean Soc. Atmos. Environ. 2024, 40, 614–627. [Google Scholar] [CrossRef]
  20. Das, S.; Harshvardhan, H.; Bian, H.; Chin, M.; Curci, G.; Protonotariou, A.P.; Mielonen, T.; Zhang, K.; Wang, H.; Liu, X. Biomass burning aerosol transport and vertical distribution over the South African-Atlantic region. J. Geophys. Res. Atmos. 2017, 122, 6391–6415. [Google Scholar] [CrossRef]
  21. Park, D.H.; Kim, J.E.; Park, J.S.; Choi, J.S.; Kim, S.W. Impacts of the COVID-19 lockdown in China on new particle formation and particle number size distribution in three regional background sites in Asia continental outflow. Sci. Total Environ. 2023, 858, 159904. [Google Scholar] [CrossRef] [PubMed]
  22. Jeong, M.J.; Yoo, H.-J.; Seo, W.; Shin, D.; Ko, H.-J.; Oh, S.; Chung, C.-Y.; Kim, J.E. Analysis of aerosol characteristics through stereoscopic observation of the West Sea during 2019 YES-AQ campaign. J. Korean Soc. Atmos. Environ. 2022, 38, 823–835. [Google Scholar] [CrossRef]
  23. Hong, S.-H.; An, M.-Y.; Hwang, J.-S. Impact of road density and vegetation type on large-scale forest fire damage-A case study of the 2023 Hongseong forest fire. Korean J. Environ. Ecol. 2024, 38, 634–645. [Google Scholar] [CrossRef]
  24. Son, S.-Y.; Lim, S.-H. An analysis of health damage impacts on local residents by type of greenhouse gas caused by 2023 large-scale wildfire in Hongseong. Fire Sci. Eng. 2024, 5, 36–53. [Google Scholar] [CrossRef]
  25. Anderson, T.L.; Ogren, J.A. Determining aerosol radiative properties using the TSI 3563 integrating nephelometer. Aerosol Sci. Technol. 1998, 29, 57–69. [Google Scholar] [CrossRef]
  26. Hansen, A.D.A.; Rosen, H.; Novakov, T. The aethalometer—An instrument for the real-time measurement of optical absorption by aerosol particles. Sci. Total Environ. 1984, 36, 191–196. [Google Scholar] [CrossRef]
  27. National Institute of Meteorological Sciences (NIMS). Report of Global Atmosphere Watch 2023. 2024. Available online: https://nims.go.kr (accessed on 30 June 2024).
  28. Schmeisser, L.; Andrews, E.; Ogren, J.A.; Sheridan, P.; Jefferson, A.; Sharma, S.; Kim, J.E.; Sherman, J.P.; Sorribas, M.; Kalapov, I.; et al. Classifying aerosol type using in situ surface spectral aerosol optical properties. Atmos. Chem. Phys. 2017, 17, 12097–12120. [Google Scholar] [CrossRef]
  29. Park, S.; Han, S. Source apportionment of black carbon in PM2.5 observed using a real-time seven-wavelength aethalometer at an urban site of Gwangju. J. Korean Soc. Atmos. Environ. 2022, 38, 653–668. [Google Scholar] [CrossRef]
  30. Yan, J.; Wang, X.; Gong, P.; Wang, C.; Cong, Z. Review of brown carbon aerosols: Recent progress and perspectives. Sci. Total Environ. 2018, 634, 1475–1485. [Google Scholar] [CrossRef] [PubMed]
  31. Kang, C.-H.; Kim, W.-H.; Han, J.-S.; Sunwoo, Y.; Moon, K.-C. Pollution characteristics of PM2.5 fine particles collected at Gosan site in Jeju island during 1997~2001. J. Korean Soc. Atmos. Environ. 2003, 19, 263–273. [Google Scholar]
  32. Vicente, A.; Alves, C.; Calvo, A.I.; Fernandes, A.P.; Nunes, T.; Monteiro, C.; Almeida, S.M.; Pio, C. Emission factors and detailed chemical composition of smoke particles from the 2010 wildfire season. Atmos. Environ. 2013, 71, 295–303. [Google Scholar] [CrossRef]
  33. Reisen, F.; Meyer, C.P.; McCaw, L.; Powell, J.C.; Tolhurst, K.; Keywood, M.D.; Gras, J.L. Impact of smoke from biomass burning on air quality in rural communities in southern Australia. Atmos. Environ. 2011, 45, 3944–3953. [Google Scholar] [CrossRef]
  34. Kaskaoutis, D.G.; Petrinoli, K.; Grivas, G.; Kalkavouras, P.; Tsagkaraki, M.; Tavernaraki, K.; Papoutsidaki, K.; Stavroulas, I.; Paraskevopoulou, D.; Bougiatioti, A.; et al. Impact of peri-urban forest fires on air quality and aerosol optical and chemical properties: The case of the August 2021 wildfires in Athens, Greece. Sci. Total Environ. 2024, 907, 168028. [Google Scholar] [CrossRef]
  35. Oduber, F.; Calvo, A.I.; Castro, A.; Blanco-Alegre, C.; Alves, C.; Barata, J.; Nunes, T.; Lucarelli, F.; Nava, S.; Calzolai, G.; et al. Chemical composition of rainwater under two events of aerosol transport: A Saharan dust outbreak and wildfires. Sci. Total Environ. 2020, 734, 139202. [Google Scholar] [CrossRef]
  36. Peng, Y.; Suzuki, M.; Nguyen, L.K.; Zhang, X.; Aikawa, M. Presence and source attribution of airborne anthropogenic/non-sea-salt inorganic chloride determined by filter-pack method at eastern edge in East Asia. Water Air Soil Pollut. 2021, 232, 232–238. [Google Scholar] [CrossRef]
  37. Schlosser, J.S.; Braun, R.A.; Bradley, T.; Dadashazar, H.; MacDonald, A.B.; Aldhaif, A.A.; Aghdam, M.A.; Mardi, A.H.; Xian, P.; Sorooshian, A. Analysis of aerosol composition data for western United States wildfires between 2005 and 2015: Dust emissions, chloride depletion, and most enhanced aerosol constituents. J. Geophys. Res. Atmos. 2017, 122, 8951–8966. [Google Scholar] [CrossRef]
  38. Wang, Y.; Sun, M.; Li, P.; Li, Y.; Xue, L.; Wang, W. Variation of low molecular weight organic acids in precipitation and cloudwater at high elevation in South China. Atmos. Environ. 2011, 45, 6518–6525. [Google Scholar] [CrossRef]
  39. Willey, J.D.; Glinski, D.A.; Southwell, M.; Long, M.S.; Brooks Avery, G.B., Jr.; Kieber, R.J. Decadal variations of rainwater formic and acetic acid concentrations in Wilmington, NC, USA. Atmos. Environ. 2011, 45, 1010–1014. [Google Scholar] [CrossRef]
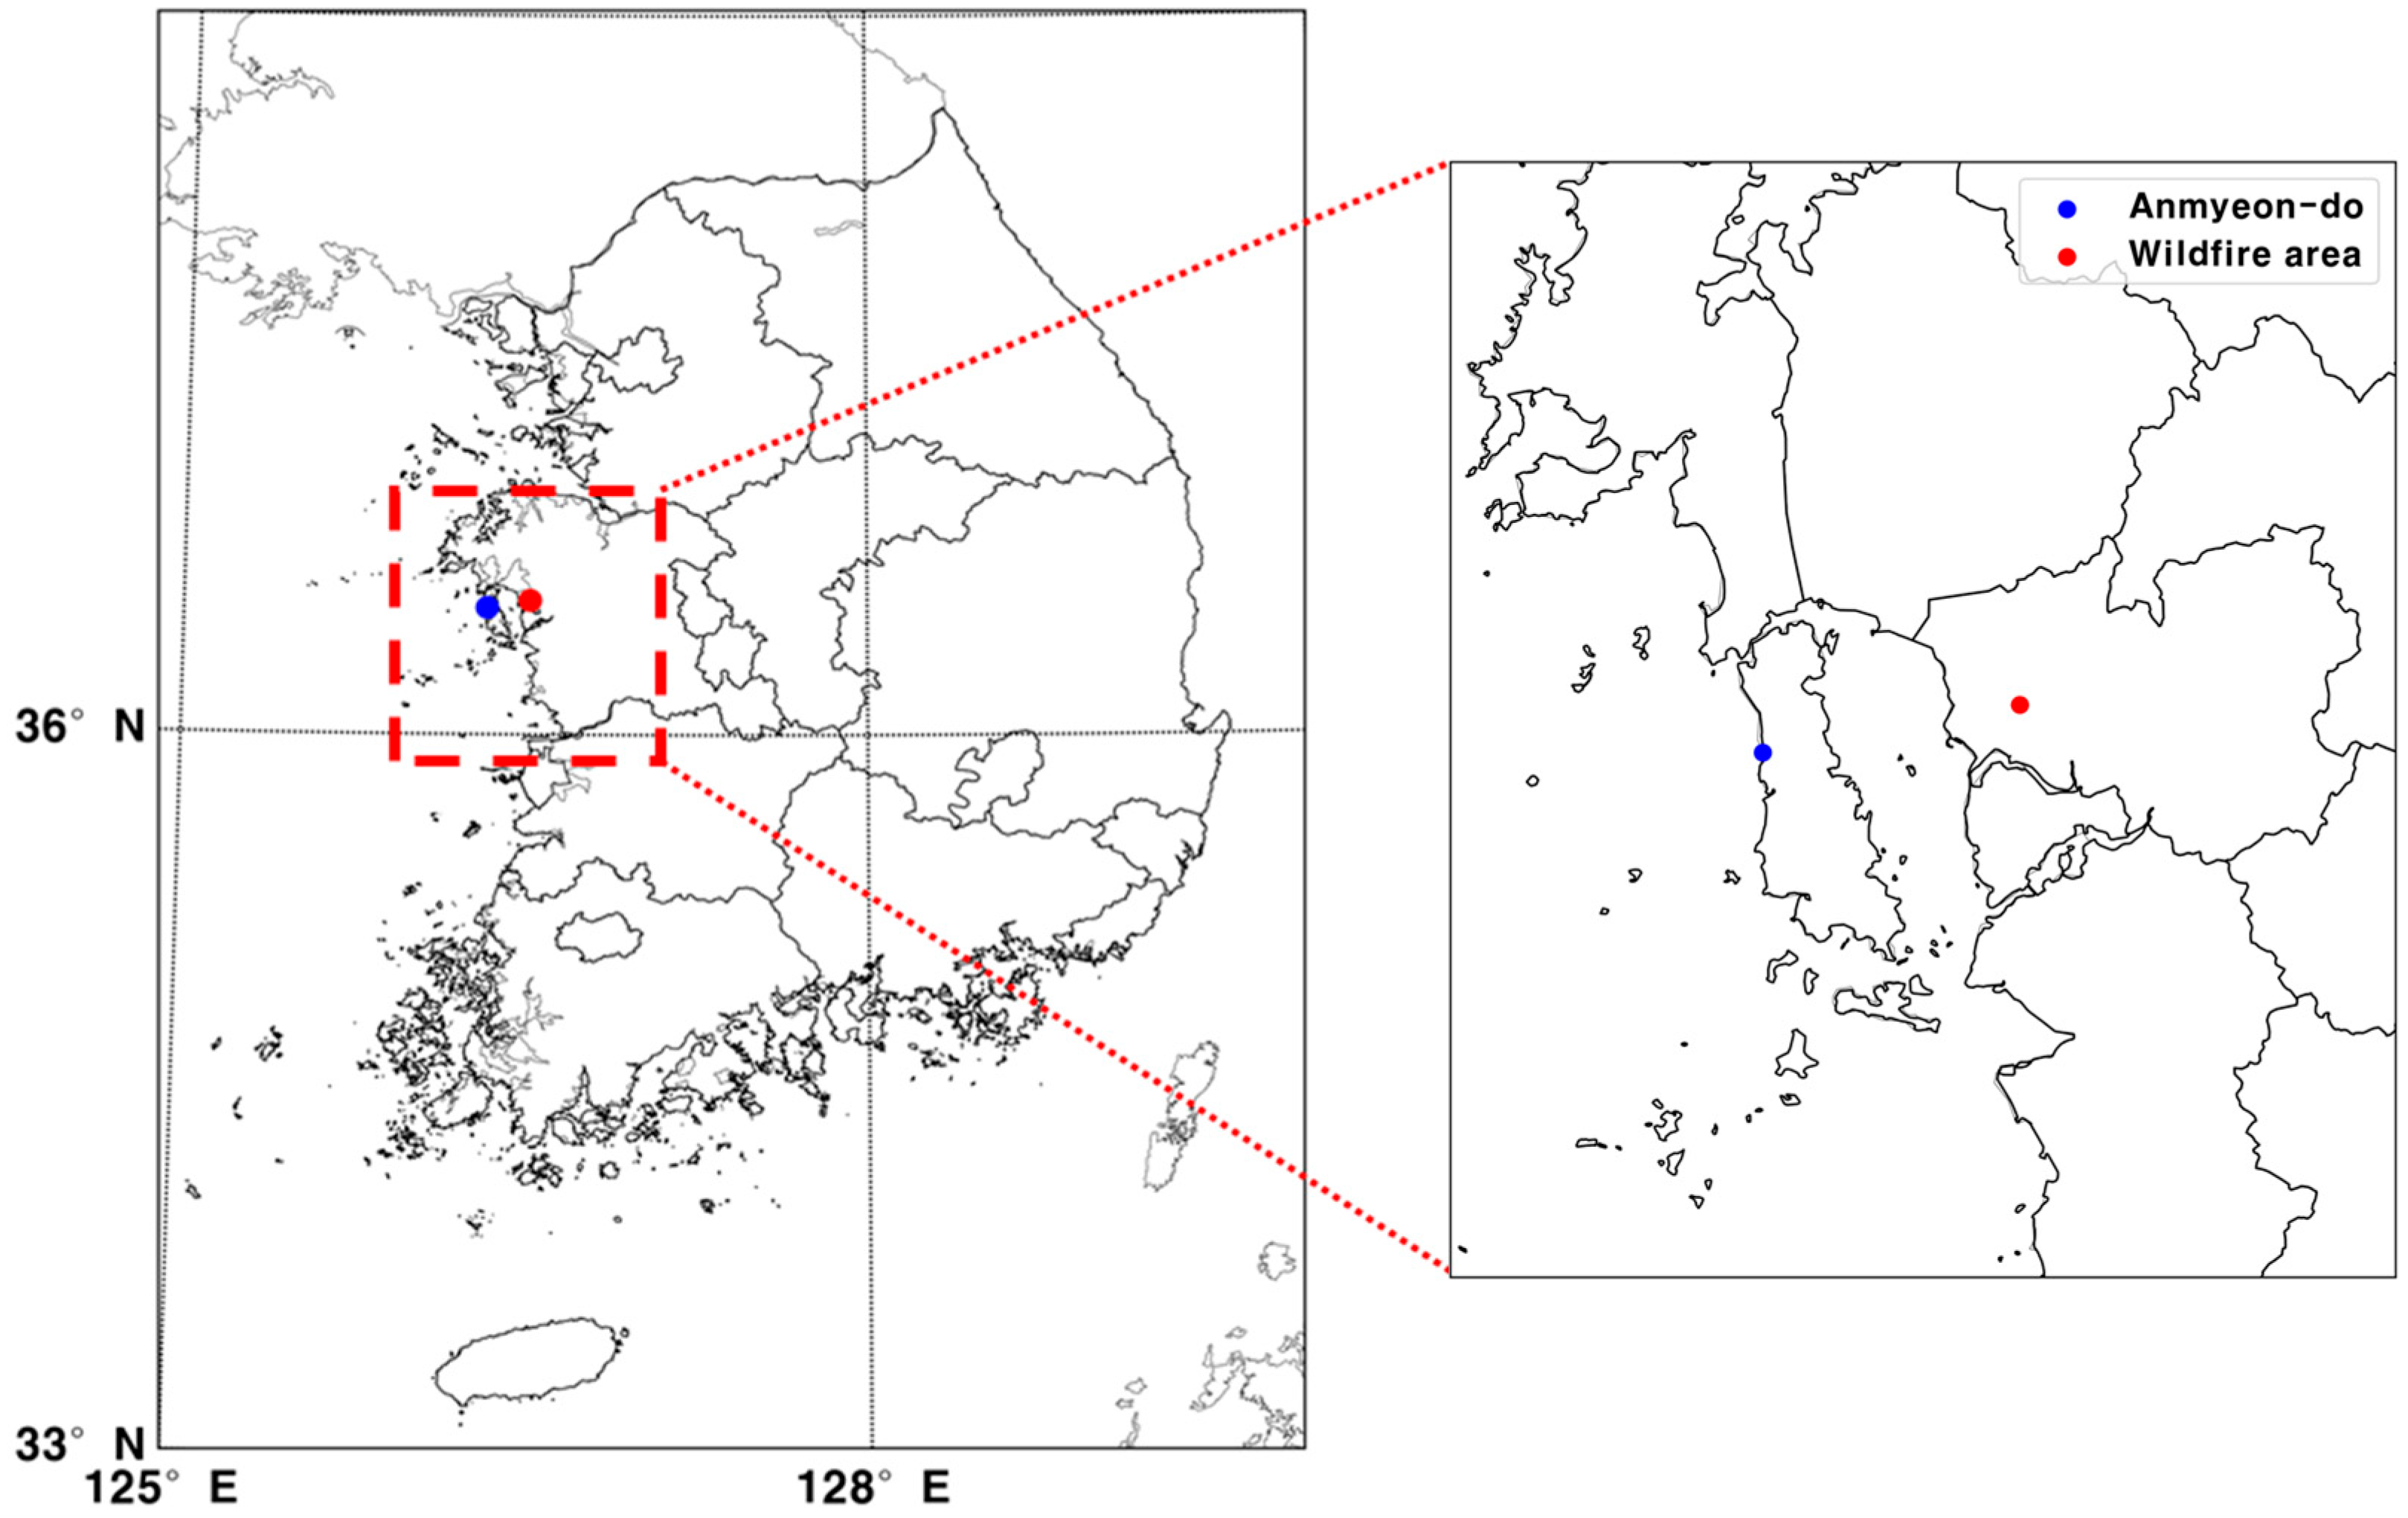
Figure 1. Map of the sampling site and wildfire area.
Atmosphere 16 01074 g001
Figure 2. Hourly variations in atmospheric parameters at the Anmyeon-do GAW station from 3 to 7 April 2023. Shown are wind speed (m/s), accumulated precipitation (12 h, mm), aerosol volume size distribution (dV/dlogD), PM10 mass concentration (µg/m3), aerosol scattering and absorption coefficients (at 550 nm), black carbon (BC) concentration (µg/m3), and CO (ppb) and ionic (µg/m3) concentrations. Three distinct periods are highlighted: Period I (immediately following the wildfire event), Period II (during the precipitation event), and Period III (post-precipitation influx of wildfire smoke).
Atmosphere 16 01074 g002
Figure 3. Aerosol type classification during Period I (green), Period II (red), and Period III (blue) based on the scattering Ångström exponent (SAE) and absorption Ångström exponent (AAE).
Atmosphere 16 01074 g003
Figure 4. Backward trajectories of 72 h generated using HYSPLIT for 6–7 April, showing long-range transport from northeastern China and Inner Mongolia that contributed to the dust and aged wildfire smoke observed during Period III.
Atmosphere 16 01074 g004
Figure 5. Source apportionment results for aerosols during each period, derived from MARGA data.
Atmosphere 16 01074 g005
Figure 6. Ionic species concentration (µg/m3, left) and composition (%, right) of (a) PM10 and (b) PM2.5 from 2 to 6 April.
Atmosphere 16 01074 g006
Figure 7. Elemental species concentration (ng/m3, left) and composition (%, right) of (a) PM10 and (b) PM2.5 from 2 to 6 April.
Atmosphere 16 01074 g007
Table 1. Measurement parameters and instruments at the Anmyeon-do GAW station.
PropertiesParameterInstrument
PhysicalPM10 mass concentrationβ-ray
Particle size distributionAPS (0.5–20 μm)
OpticalScattering coefficientNephelometer
Absorption coefficientAethalometer
ChemicalChemical componentsIC
MARGA
Trace elementsICP-OES
ICP-MS
Table 2. Aerosol physical and optical properties for each studied period.
ParameterPeriod IPeriod IIPeriod IIIAnmyeon-do * [27]
PM10 mass concentration (µg/m3)75.7 ± 31.219.6 ± 11.498.2 ± 55.631.8 ± 13.4
σSC (550 nm, Mm−1)307.1 ± 189.660.1 ± 46.1532.7 ± 391.677.1 ± 23.7
SÅE (450–700)1.9 ± 0.11.6 ± 0.31.4 ± 0.21.5 ± 0.5
σAC (550 nm, Mm−1)21.9 ± 15.33.6 ± 1.616.8 ± 10.34.0 ± 2.2
AÅE (470–700)1.8 ± 0.30.8 ± 0.51.4 ± 0.30.6 ± 0.4
CO concentration (ppb)420.7 ± 242.3174.6 ± 51.9452.2 ± 183.8232.4 ± 50.4
Black carbon (BC) concentration (µg/m3)2.3 ± 1.50.5 ± 0.32.0 ± 1.20.5 ± 0.5
* Report of Global Atmosphere Watch 2023 (2024): PM10 mass concentration, σSC, σAC, and CO concentration.
Table 3. Principal component analysis (PCA) results for gaseous and particulate species measured by MARGA across each observation period. Loadings > 0.7 are presented in bold. The analysis utilized varimax rotation with Kaiser normalization.
SpeciesPeriod IPeriod IIPeriod III
PC1PC2PC3PC4PC5PC1PC2PC3PC4PC5PC1PC2PC3PC4
HF0.009 0.538 0.5290.158 0.002 0.948
MSA (g)0.1290.328 0.742 0.703 0.1710.1960.543
HCl 0.2020.314 0.7820.8900.146 0.043 0.6790.3500.1350.221
HONO 0.453 0.7680.1080.293 0.407 0.485 0.563
HNO30.4690.2570.152 0.6850.8670.053 0.302 0.788 0.339
SO2 0.2520.4490.3830.0320.615 0.7750.1820.006
NH30.027 0.425 0.7970.9160.131 0.3900.2090.828
F 0.3030.4370.457 0.199 0.724 0.217
MSA0.0970.3350.1460.709 0.4790.769 0.911 0.174
Cl 0.0450.0430.927 0.6100.6470.0900.0730.9790.134 0.004
NO30.2140.871 0.1070.1270.0530.0360.978 0.0270.935 0.198
SO42−0.1550.8430.1420.163 0.070 0.0700.9570.0910.948
Na+0.9410.0720.187 0.128 0.899 0.216 0.9350.1010.193
NH4+ 0.911 0.1450.053 0.1410.8770.430 0.964 0.104
K+0.9690.1470.0650.091 0.1540.9230.2550.013 0.982 0.045
Mg2+0.139 0.902 0.161 0.357 0.0960.865 0.9630.1950.013
Ca2+0.619 0.7380.0610.1290.9440.082 0.0180.1440.0050.3470.9110.121
Eigenvalue6.34.94.94.02.57.45.75.33.42.411.76.14.22.0
Variance (%)23.418.118.014.99.227.421.319.612.59.043.322.615.57.5
Cumulative (%)23.441.559.574.483.627.448.768.380.889.843.365.981.488.9
Disclaimer/Publisher’s Note: The statements, opinions and data contained in all publications are solely those of the individual author(s) and contributor(s) and not of MDPI and/or the editor(s). MDPI and/or the editor(s) disclaim responsibility for any injury to people or property resulting from any ideas, methods, instructions or products referred to in the content.