Article

Submicron Particles and Micrometeorology in Highly Densified Urban Environments: Heavy-Tailed Probability Study

by
Patricio Pacheco Hernández
1,2,*,
Eduardo Mera Garrido
1,2,
Gustavo Navarro Ahumada
3,
Javier Wachter Chamblas
1,2 and
Steicy Polo Pizan
2
1
Departamento de Física, Facultad de Ciencias Naturales, Matemáticas y Medio Ambiente, Universidad Tecnológica Metropolitana, Las Palmeras 3360, Ñuñoa, Santiago 7750000, Chile
2
Research Laboratory in Environment and Learning, RLEL, Universidad Tecnológica Metropolitana, Underground Building M1, J. P. Alessandri 1242, Ñuñoa, Santiago 7750000, Chile
3
Departamento de Ciencias Exactas, Facultad de Ingeniería, Arquitectura y Diseño, Universidad de San Sebastián, Bellavista 7, Recoleta, Santiago 8420000, Chile
*
Author to whom correspondence should be addressed.
Atmosphere 2025, 16(9), 1044; https://doi.org/10.3390/atmos16091044
Submission received: 1 August 2025 / Revised: 23 August 2025 / Accepted: 29 August 2025 / Published: 2 September 2025
(This article belongs to the Section Air Quality and Health)

Abstract

Submicron particles (SPs), with diameters less than 1.0 μm, are a serious health risk, and urban meteorology variables (MVs), impacted by human activity, can support their sustainability. This study, in a city immersed in a basin geomorphology, is carried out during the summer period of high temperatures and variable relative humidity. An area of high urban density was selected, with the presence of high-rise buildings, urban canyons that favor heat islands, low forestation, intense vehicular traffic, and extreme conditions for MVs. Hourly measurements, in the form of time series, record the number of SPs (for diameters of 0.3, 0.5, and 1.0 μm) along with MVs (temperature (T), relative humidity (RH), and wind speed magnitude (WS)). The objective is to verify whether MVs (RH, T) promote the sustainability of SPs. For this purpose, Spearman’s analysis and a heavy-tailed probability function were used. The central tendency probability, a Gaussian distribution, was discarded since its probability does not discriminate extreme events. Spearman’s analysis yielded significant p-values and correlations between PM10, PM5.0, PM2.5, and SPs. However, this was not the case between MVs and SPs. By applying a heavy-tailed probability analysis to extreme events, the results show that MVs such as T and RH act in ways that can favor the accumulation and persistence of SP concentrations. This tendency could have been exacerbated during the measurement period by heat waves and a geographical environment under the influence of a prolonged drought resulting from climate change and global warming.

Graphical Abstract

1. Introduction

Fine particulate matter (PM2.5 or smaller) is an air pollutant composed of solid and liquid particles with diameters of 2.5 μm or less. It is considered highly hazardous to human health. Particles smaller than 2.5 µm can penetrate deep into the bronchial region and may reach the pulmonary alveoli, where they tend to accumulate over time due to the near impossibility of their removal by physiological mechanisms. This condition, in the long term, leads to serious health effects in exposed individuals, such as the worsening of asthma, increased incidence of cancer and cardiovascular diseases, and overall rises in both mortality and morbidity.
In 2021, a study [1] concluded that particles emitted by gases responsible for planetary warming are linked to 20% of global premature deaths. What chemical elements make up fine particulate matter? Regarding its composition, the primary constituents of fine particulate matter include chemical substances such as sulfate, nitrate, ammonium, hydrogen ion, particle-bound water, elemental carbon, a wide variety of organic compounds, and elements from the Earth’s crust [2,3]. Within this wide range should be included heavy metals (such as nickel, copper, mercury, and lead), volatile organic compounds (VOCs) (which include benzene and other compounds) and ultrafine particles < PM1, which are the most dangerous and harmful to health. Sources of particulate matter include construction activities, unpaved roads, agricultural burning, chimneys, wildfires, tobacco smoke, cooking, wood burning, candles, and incense.
To get an idea of the dimensions of the particulate matter that can be studied, let us consider that within 10 µm is a pollen particle and particulate matter, within 50 µm is the limit of vision and the tip of a pin, while the thickness of a hair is on the order of 100 µm; around 1 µm are bacteria, above 2.5 µm and less than the upper limit of 10 µm is coarse particulate matter, below 2.5 µm is fine particulate matter, in the middle are red blood cells, and close to the upper limit are cells; in dimensions smaller than 1.0 µm we find viruses of 0.1 µm, submicron particles (SPs), also called ultrafine particulate material, which can reach 0.01 µm (molecular dimensions).
Relative humidity can influence the concentration of fine particulate matter (PM2.5 or smaller). First, it is important to note that particulate matter (PM) is a mixture of solid and liquid particles suspended in the air. PM2.5 refers to particles with diameters smaller than 2.5 μm. Relative humidity measures the amount of water vapor present in the air compared to the maximum amount the air can hold at a given temperature. The concentration of PM2.5 tends to increase with relative humidity [4,5,6], which has significant health implications. PM can be inhaled and cause serious health issues. Particles smaller than 10 μm in diameter can reach deep into the lungs, and some may even enter the bloodstream. Prolonged exposure to PM2.5 has been associated with cardiopulmonary effects and increased mortality from lung cancer [7,8].

Micrometeorology, Global Warming, and Relative Humidity

Micrometeorology is a branch of meteorology that focuses on observations and processes occurring at small spatial and temporal scales [9]: approximately within 1 km and over periods of one hour or less. These processes are confined to the lower portion of the planetary boundary layer, known as the atmospheric boundary layer (ABL) [10]. Its physical principles are related to the exchange of energy, mass, and gases between the atmosphere and the surface layer, including water bodies, soil, and vegetation. The Earth’s surface greatly influences the atmosphere, particularly the air properties within the ABL. Here, surface friction and the thermal effects of surface heating and cooling generate significant flows that transport momentum, heat, moisture, and material [11].
The study of temperature and wind (turbulence), influenced by external factors such as buildings [12], vegetation, population, and terrain, is highly relevant. Observational data demonstrates the development, intensification, and expansion of the urban heat island (UHI) phenomenon. This effect is attributed to the disruption of heat exchange between the ground and the atmosphere due to changes in surface characteristics. It is estimated that nearly half of the observed changes in relative humidity may be attributed to reduced evapotranspiration resulting from the replacement of vegetation with concrete and asphalt [13,14,15].
Can atmospheric warming—which enhances climate change and increases the atmosphere’s capacity to retain water—promote the persistence of fine particulate matter?
Variables such as urban canyons, urban densification, high-rise construction, the use of high-albedo building materials, the intensive use of fossil fuels due to rising vehicle numbers, the inaccessibility of electromobility for much of the population, the expansion of cities into agricultural lands, the encasement and channeling of natural watercourses, the gradual loss of arboreal vegetation, and the continuous emission of pollutants into the atmosphere, all contribute to a cumulative polluting thermal flux into the atmosphere. This, in turn, enhances its capacity to retain moisture, which may support the sustainability and persistence of fine particulate matter.
Relative humidity (RH or Φ) is the ratio of the partial pressure of water vapor (pH2O) in the mixture to the equilibrium vapor pressure of water (p*H2O) at a given temperature [15]. The correspondence between the pressures on a flat surface of pure water at a given temperature is written as follows:
RH   =   Φ   =   p H 2 O / p H 2 O * ( ~ a c c o r d i n g   t o   i d e a l   g a s   l a w ~ n v n v p T ) ,
RH is usually expressed as a percentage; a higher percentage means that the air–water mixture is more humid. At 100% relative humidity, the air is saturated, cannot hold more vapor, and as noted, is at its dew point. The polluting system can cause a decrease in relative humidity, contributing to aridity in a basin geomorphology [16]. But due to conservation of mass, water vapor cannot disappear, the atmosphere retains more water, and its release becomes less predictable. The hydration of geographies and fragments of atmospheric layers become chaotic and unpredictable, and its irregular and overflowing emergence can generate high-risk events [16].
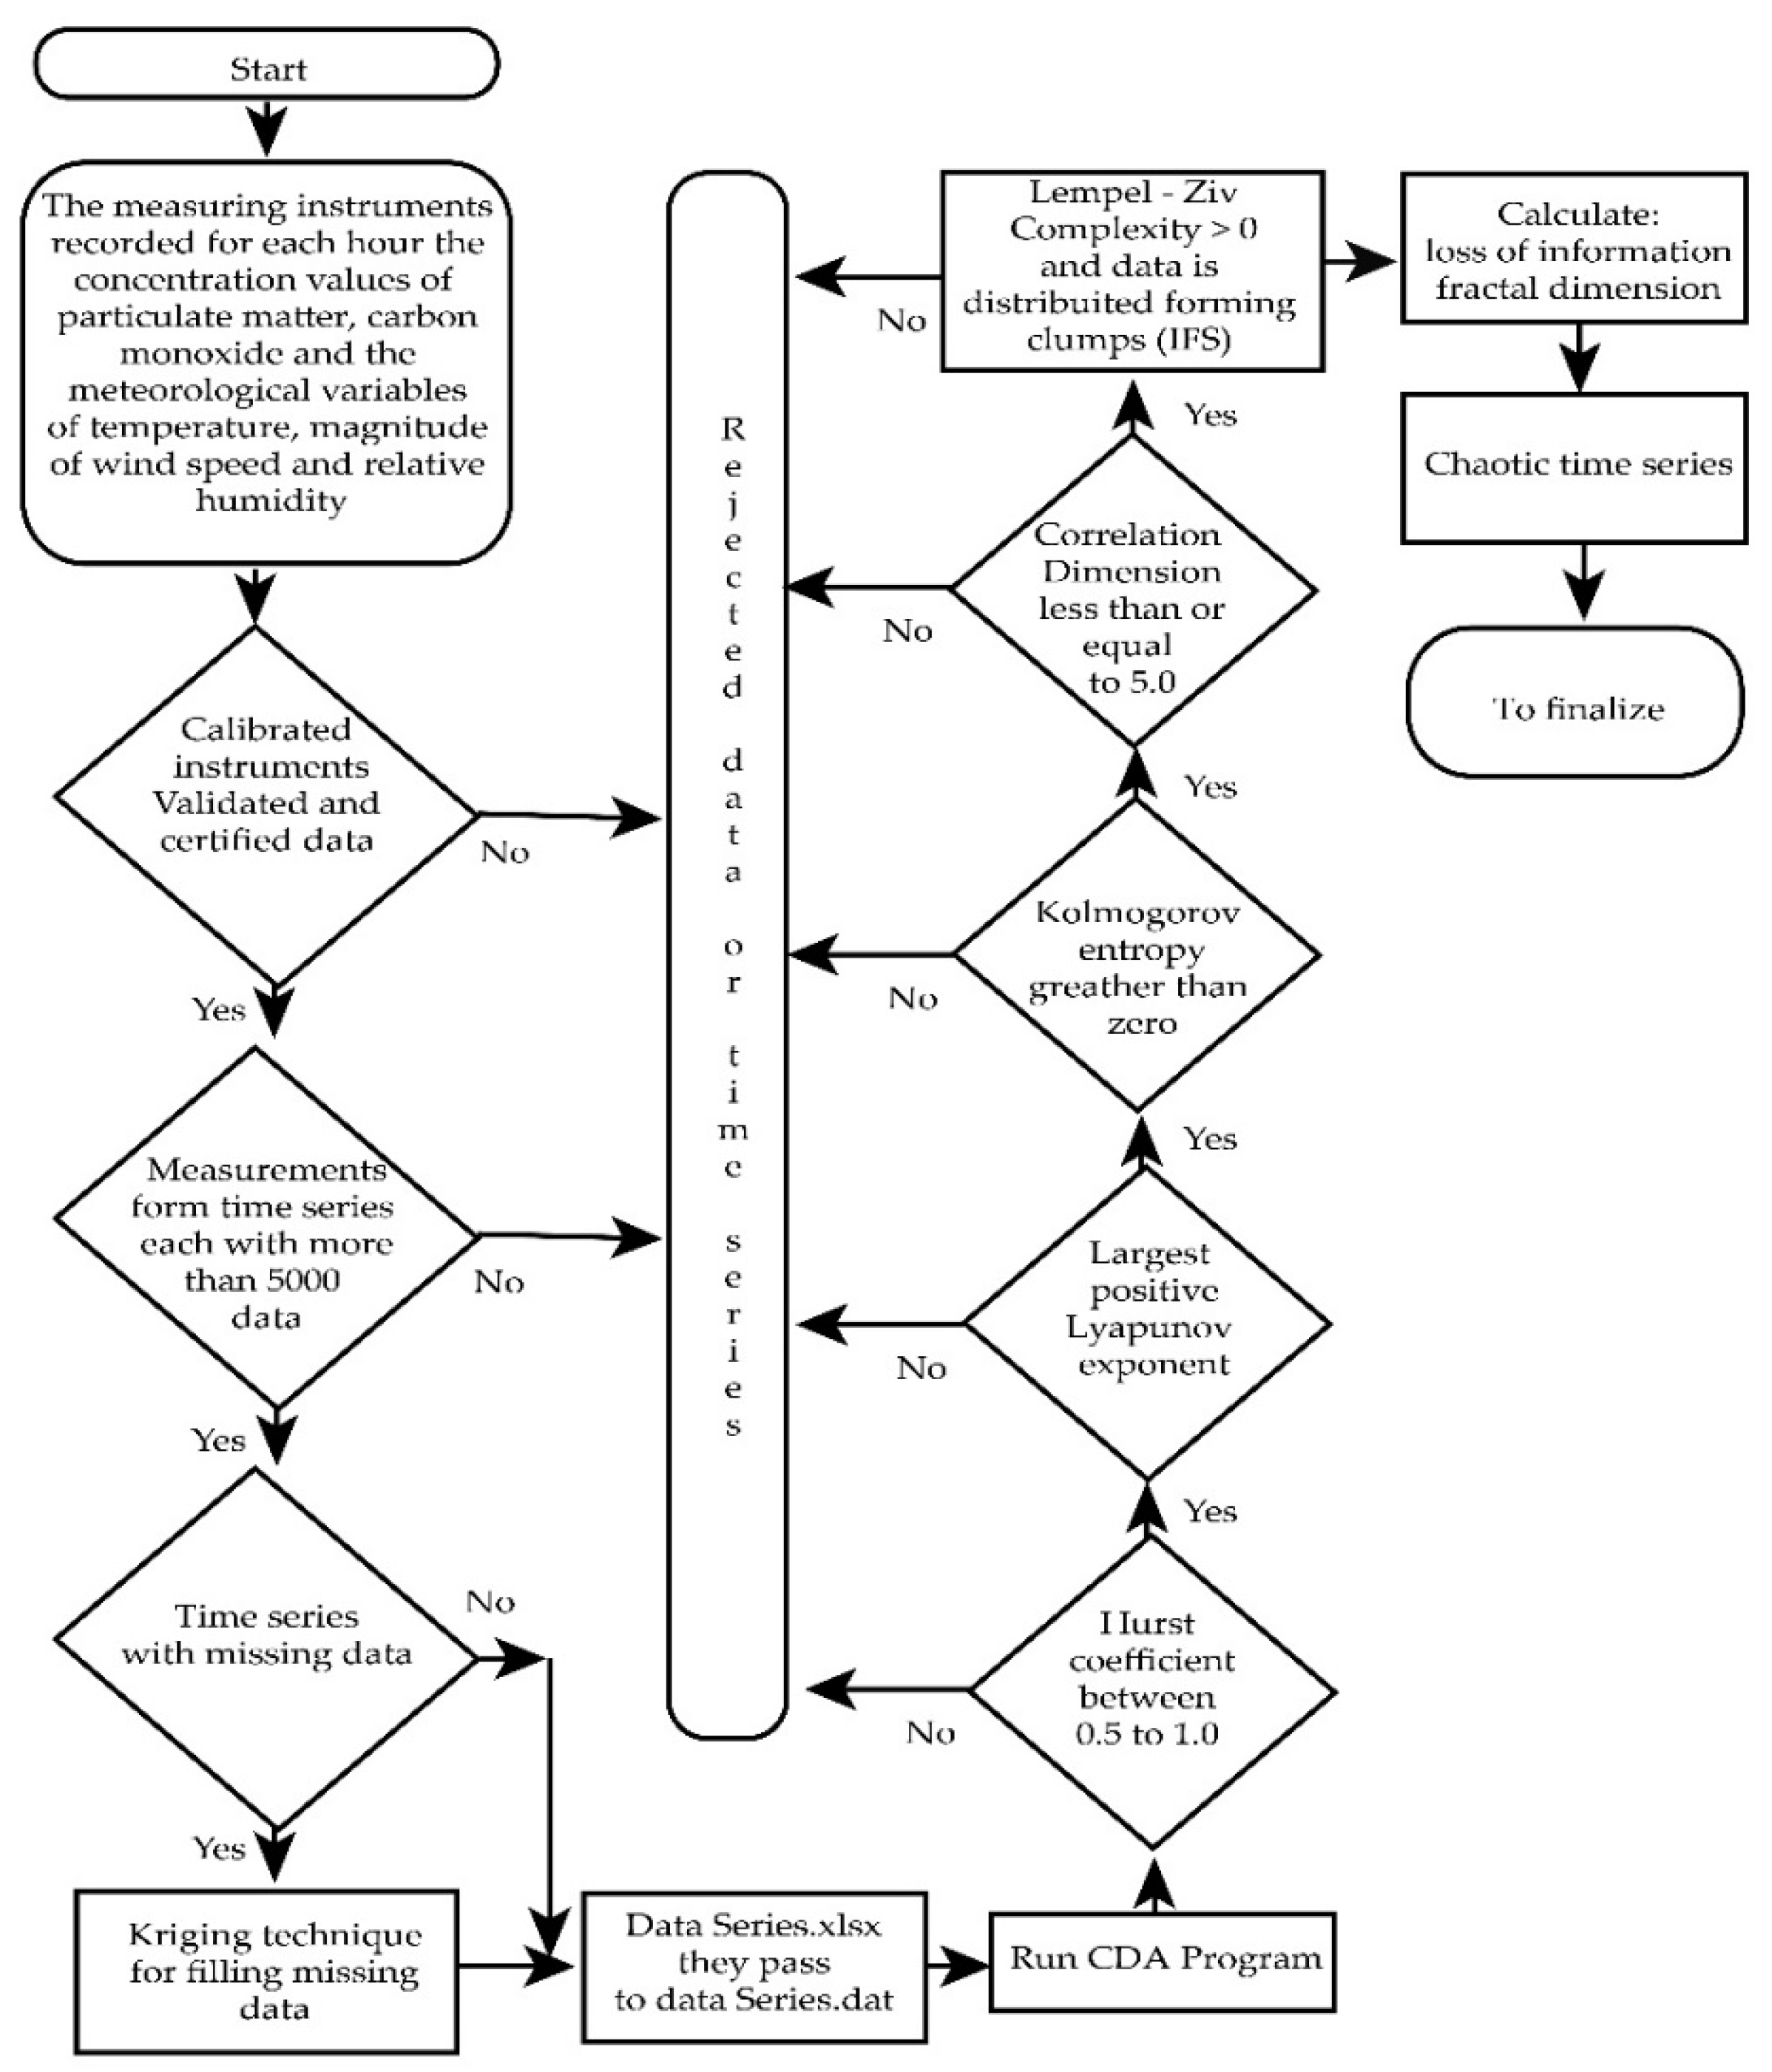
During the periods of 2010/2013, 2017/2020 and 2019/2022, urban meteorology (temperature (T), relative humidity (RH) and wind speed magnitude (WS)) and pollutant measurements (PM10, PM2.5 and CO) were carried out in the form of time series in six communes (spread over an area of 650 km2) in the city of Santiago de Chile (located in a basin geomorphology). Each time series consisted of 28,463 hourly punctual data, giving a total of 3,074,004 data points. The study of these measurements uses the assumptions that the urban meteorology system and the pollutant system are sensitive to initial conditions, have irreversible behaviors, are persistent (the past influences the future), and that pollution induces disorder in the atmosphere, making it unpredictable and highly complex, especially at the boundary layer level. Chaos theory is a mathematical formalism that meets these requirements [17]. A previous step before declaring a time series chaotic is that its chaotic parameters are in the appropriate ranges: maximum Lyapunov exponent (λ > 0), correlation dimension (DC < 5), maximum Kolmogorov entropy (SK > 0), Hurst exponent H must be in the range 0.5 < H < 1.0, and Lempel–Ziv complexity (LZ > 0). All series (108) analyzed with a software for time series of chaotic properties [17,18] satisfied the ranges (flowchart diagram, Appendix A). The representative entropies of urban meteorology and pollutants for each commune generate two entropic surfaces (one associated with urban meteorology (SMV(x,y,z)) and the other associated with pollutants (SP(x,y,z))). These surfaces or layers are interactive and highly dynamic when comparing the three periods [15,19,20]. The parameter CK, is defined as follows:
C ( x , y , z ) K , C O M M U N E = i = 1 N S K , M V i = 1 N S K , P C O M M U N E ,
The studies carried out reveal that the value of the parameter depends on the geomorphology: basin (CK < 1), mountain, and coast (CK > 1).
The entropic forces, defined as follows:
F = T S ( x , y , z ) K ,
arise naturally from this formulation. And the way they manifest is linked to each geomorphology. In the case of a geographic basin, the entropic forces associated with pollutants are dominant and are an agent of atmospheric disorder. They promote anomalous subdiffusion, establishing a regime of extreme events suitable for description by heavy-tail probabilities.
But do these considerations extend to SPs? Spearman’s analysis of the measured data says yes, at least with respect to coarse particulate matter in relation to sub-micron particles. However, it is ambiguous and poorly defined regarding the effect of urban meteorology on sub-micron particles. The heavy-tailed probability calculation using the measured data shows results that are consistent with the observations. (These considerations are discussed later in Section 3.3, Section 3.4 and Section 3.5)
The conformation of entropic surfaces [19,20], as a quotient of entropies between those of urban meteorology and those of pollutants, generates entropic forces in a basin geomorphology that contribute [19,20] to further increase high summer temperatures, which favors the retention of water by the atmosphere, affecting relative humidity, and promoting the sustainability of SPs in the boundary layer close to the ground. During the mornings, it is common to observe an increase in the concentration of SPs.
It is of interest in this study to verify this hypothesis by implementing the presented procedure. The emergence of extreme urban weather patterns favors the increase in diseases in the population, which is well documented [21,22,23,24]. In addition, a combination of other factors influences the sustainability of SPs:
Night-time temperature inversion: On clear nights, the ground surface cools, and the coldest layer of air remains near the surface. This produces a “layer” that traps polluted air, including SPs and fine particulate matter, close to the ground;
Increased vehicular activity: In the mornings, vehicular traffic increases significantly, especially during rush hour;
Emissions from industries, power plants, and factories, which operate during peak traffic hours.

2. Materials and Methods

2.1. Area of Study

The measurements were taken in the city of Santiago, Chile, which is located in a geomorphological basin. The building where the instruments were installed is 12 m high and is located at Almirante Latorre Street, 423, in the heart of the city, Figure 1. This is a highly dense urban area, with a large number of high-rise concrete buildings, urban canyons, narrow streets, low ventilation levels, heavy traffic, etc.

2.2. Measuring Instruments

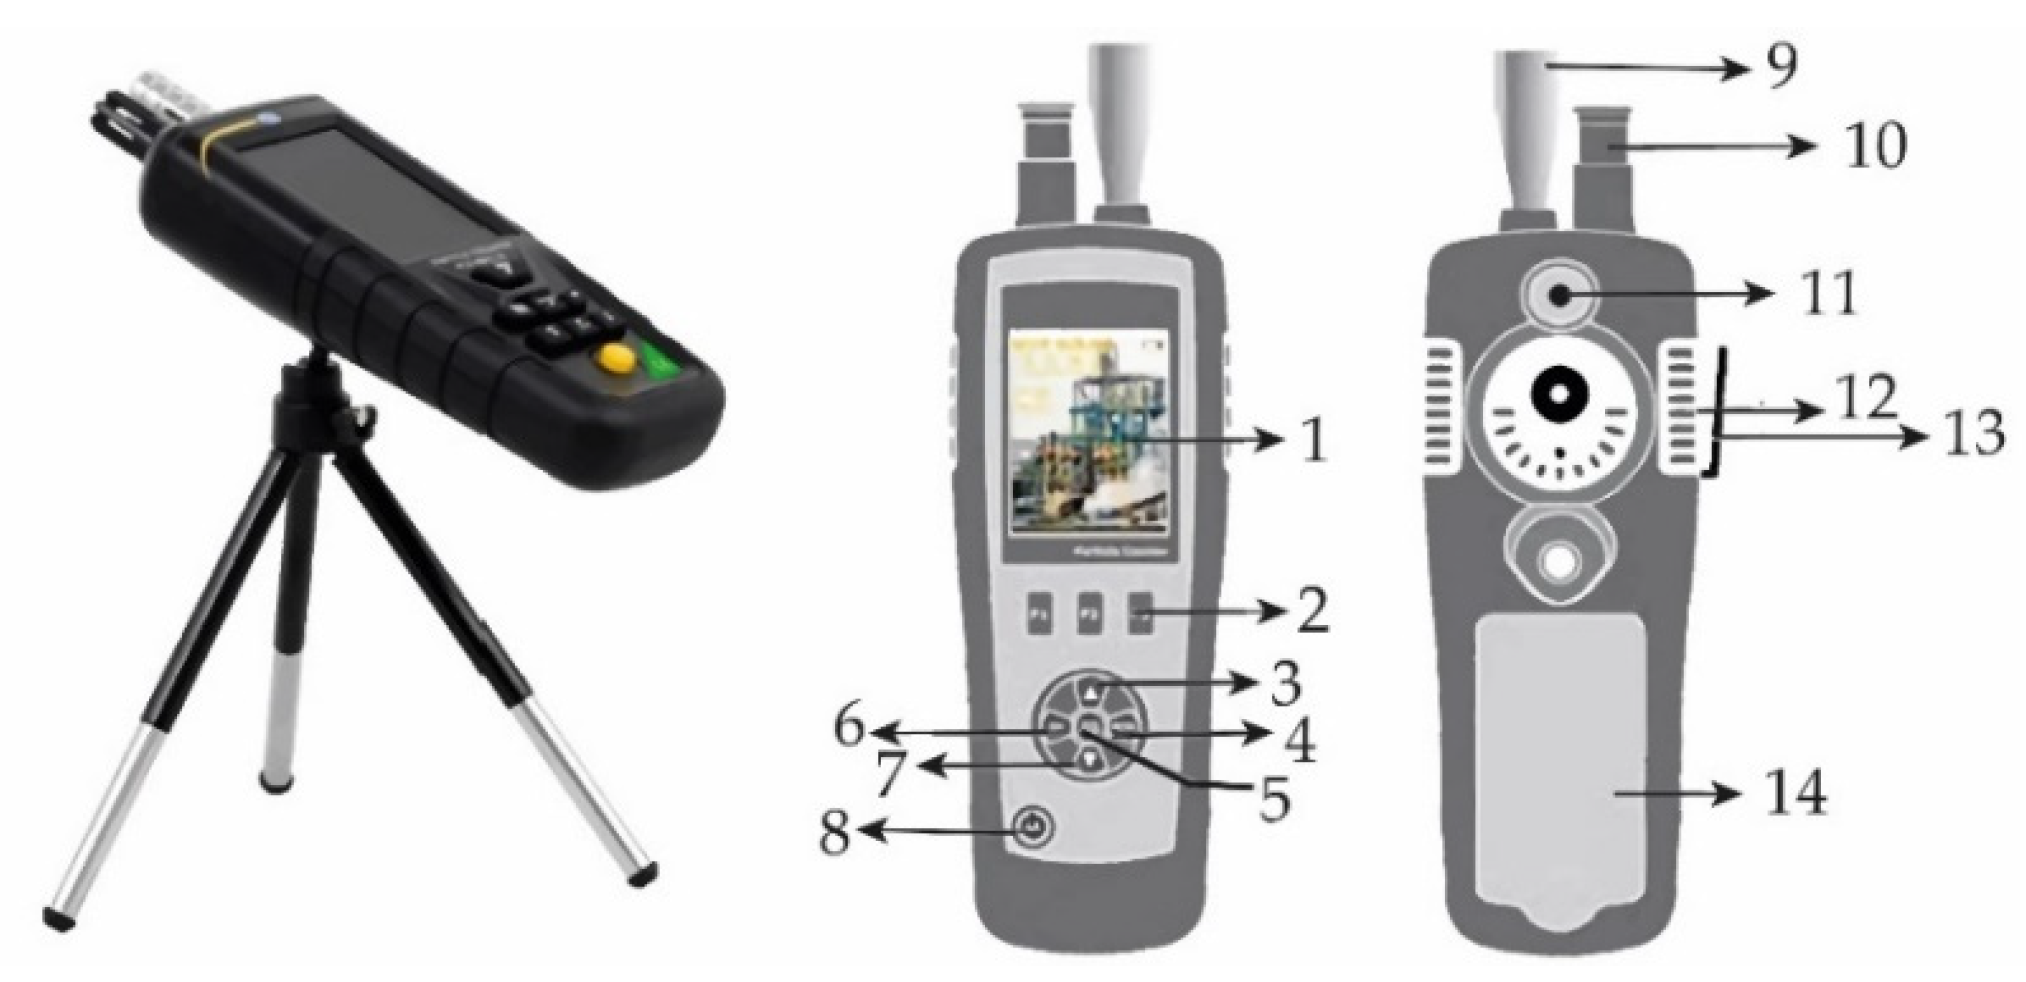
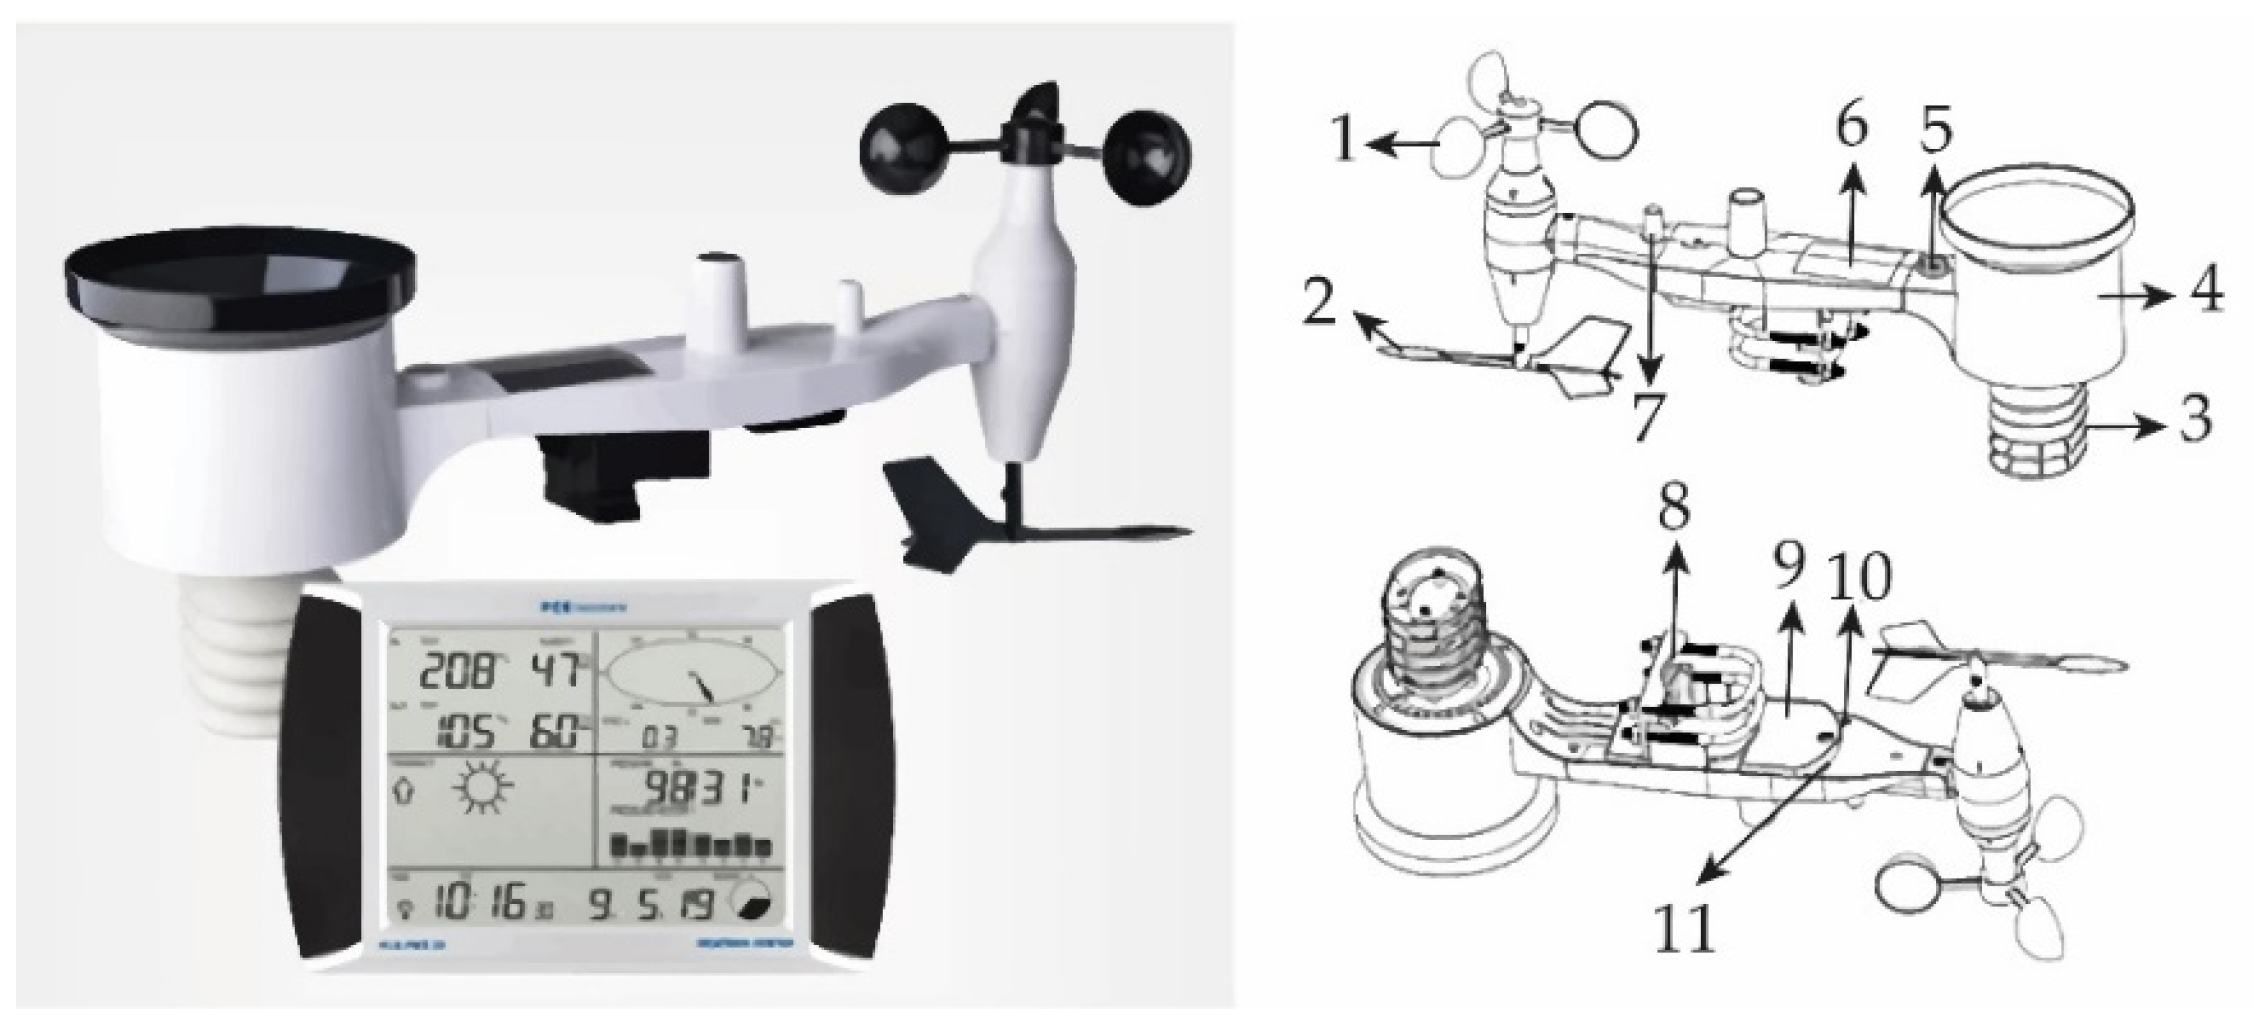
Measurements of particle count, particle size, temperature, and humidity were conducted using the PCE-PCO 2 sensor and Weather station and data display touch screen., as described in Appendix B.

2.3. Theoretical Framework

If the temperature of the saturated air increases, because of the thermal transfer of the same pollutants, its capacity to contain water vapor will increase and the relative humidity will decrease. From a dynamic perspective, if the entropic forces due to pollutants are greater than those of urban meteorology and RH in particular, they can favor an increase in environmental dryness. The forces of an entropic nature (2) originated by the entropy surface, S (x, y, z), are shown in Figure 2 [25,26,27,28]:
The pressure is p = F/A, so it is then possible to write using (3), following the notation of (1), and we obtain the following expression:
R H = p H 2 O P H 2 O * = F A H 2 O F A H 2 O * = S H 2 O S H 2 O * ,
an expression that creates a relationship between relative humidity and the gradient of the entropic surface. If the process occurs in a spherical volume, with the operator ∇ only having radial dependence (r), we obtain the following:
R H = p H 2 O P H 2 O * = F A H 2 O F A H 2 O * = S H 2 O r S r H 2 O * ~ S H 2 O S H 2 O * ~ S H 2 O t S H 2 O * t ~ S K , H 2 O S K , H 2 O * ,
which indicates for RH a dependence, considering the assumptions indicated, on the Kolmogorov-type entropies [19,29,30,31,32].
As a note, if we perform the calculation, we obtain the following:
S K , R H S K , P = S K , P S K , R H S K , R H S K , P S K , P 2 = T ¯ S K , R H S K , R H S K , P T ¯ S K , P T ¯ S K , P = F R H S K , R H S K , P F P T ¯ S K , P ,
and
T ¯ > 0 , S K , P > 0 = F R H S K , R H S K , P F P = < 0 , F P   is   greater = 0 , not   observed   > 0 , F R H   is   greater   ,
where F R H is the entropic force associated with relative humidity, and F P is the entropic force associated with pollutants.
When the contaminant system increasingly invades the boundary layer of the atmosphere with sufficient energy to affect it, the atmospheric air is more likely to expand, and there is more space to contain water vapor [16]. This phenomenon is not static in time, it is extremely dynamic; the entropic layers are very variable and very rough. The entropic force is very variable. This increases the low predictability of the events. What formula states is that an entropic force of urban meteorology is related to the entropic force of pollutants (and vice versa) and to CK [16,19]. Equilibrium has been lost and the systems which have entered irreversible processes are complex, connected and chaotic. Equation (5) is a very crude approximation of the current processes in the atmosphere. But it is possible to show from the entropy ratio the turbulence and disorder of the interactive systems.
If we analyze two systems (one polluting (P) and the other urban meteorology variables (MVs)) that evolve interactively and irreversibly, we have:
d S P = δ σ P + i = 1 M δ Q T S , i T T S , i P ,
δ σ P represents the entropy production by pollutants, and the sum refers to the N heat sources from which the system receives or transfers heat at the temperature of the ith source ( T F T i ). A similar expression applies to meteorological variables:
d S M V   =   δ σ P + i = 1 N δ Q T S , i T T S , i M V ,
Applying the quotient d S M V d S P and considering that C K < 1 in a basin geomorphology [18]:
d S M V d S P = d S M V d t d S P d t = C K = δ σ P + i = 1 N δ Q T S , i T T S , i M V δ σ P + i = 1 M δ Q T S , i T T S , i P < 1 ,
we get
δ σ P + i = 1 M δ Q T S , i T T S , i M V < δ σ P + i = 1 N δ Q T S , i T T S , i P ,
If we assume N = M sources generating entropy
i = 1 N δ σ P , M V , i + i = 1 N δ Q T S , i T T S , i M V < i = 1 N δ σ P , P , i + i = 1 N δ Q T S , i T T S , i P ,
δ σ P , M V , i + δ Q T S , i T T S , i M V < δ σ P , P , i + δ Q T S , i T T S , i P ,
ordering terms
δ σ P , M V , i δ σ P , P , i δ Q T S , i P + δ Q T S , i M V δ Q T S , i P T T S , i M V T T S , i P < 1 ,
making the change δ σ = δ σ P , M V , i δ σ P , P , i
δ Q T S , i M V δ Q T S , i P T T S , i P 1 δ σ δ Q T S , i P T T S , i P < T T . S , i M V ,
as a particular case it can be assumed that
δ σ δ Q T S , i P 1 δ Q T S , i M V δ Q T S , i P T T S , i P < T T . S , i M V ,
In the condition of basin geomorphology (CK < 1), the pollutants emitted by the i-th source contribute to increasing the temperature of the environment, where the temperature is measured of the i-th source that makes up the urban meteorology.
The approach to the dynamics of SPs will be carried out through comparative studies with the Kolmogorov entropy calculated for urban meteorology and pollutants in a defined period, and application of the Spearman probability and the heavy-tailed probability to the measurements, briefly describing these techniques in the results.

3. Results

3.1. Submicron Particles (SP) and Urban Meteorological Measurements

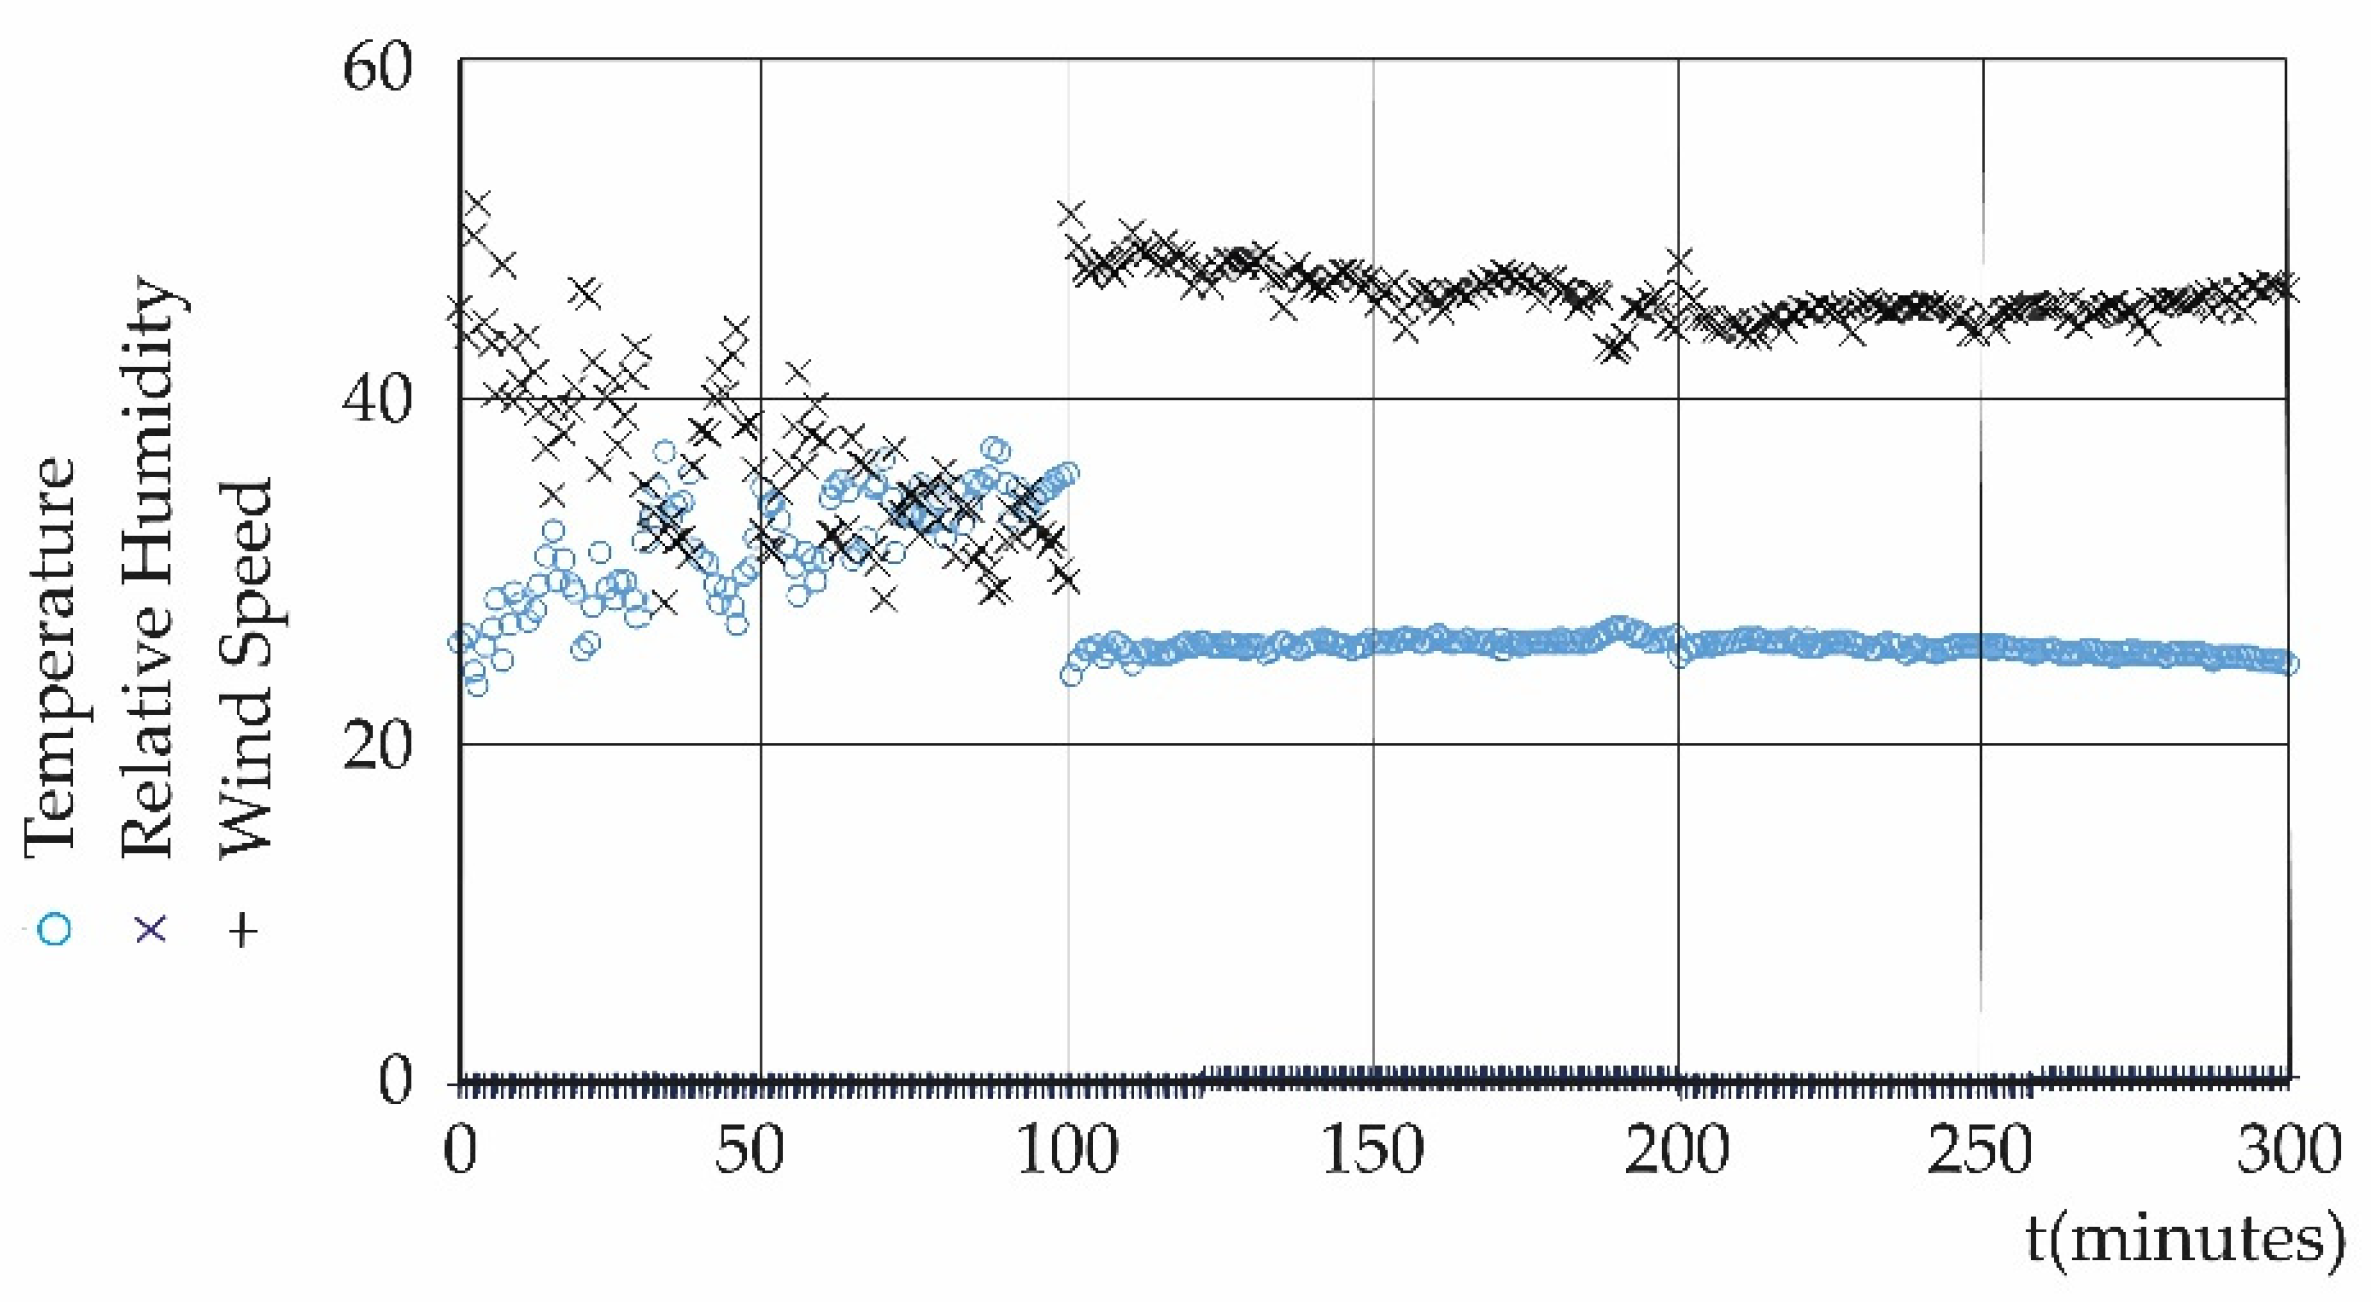
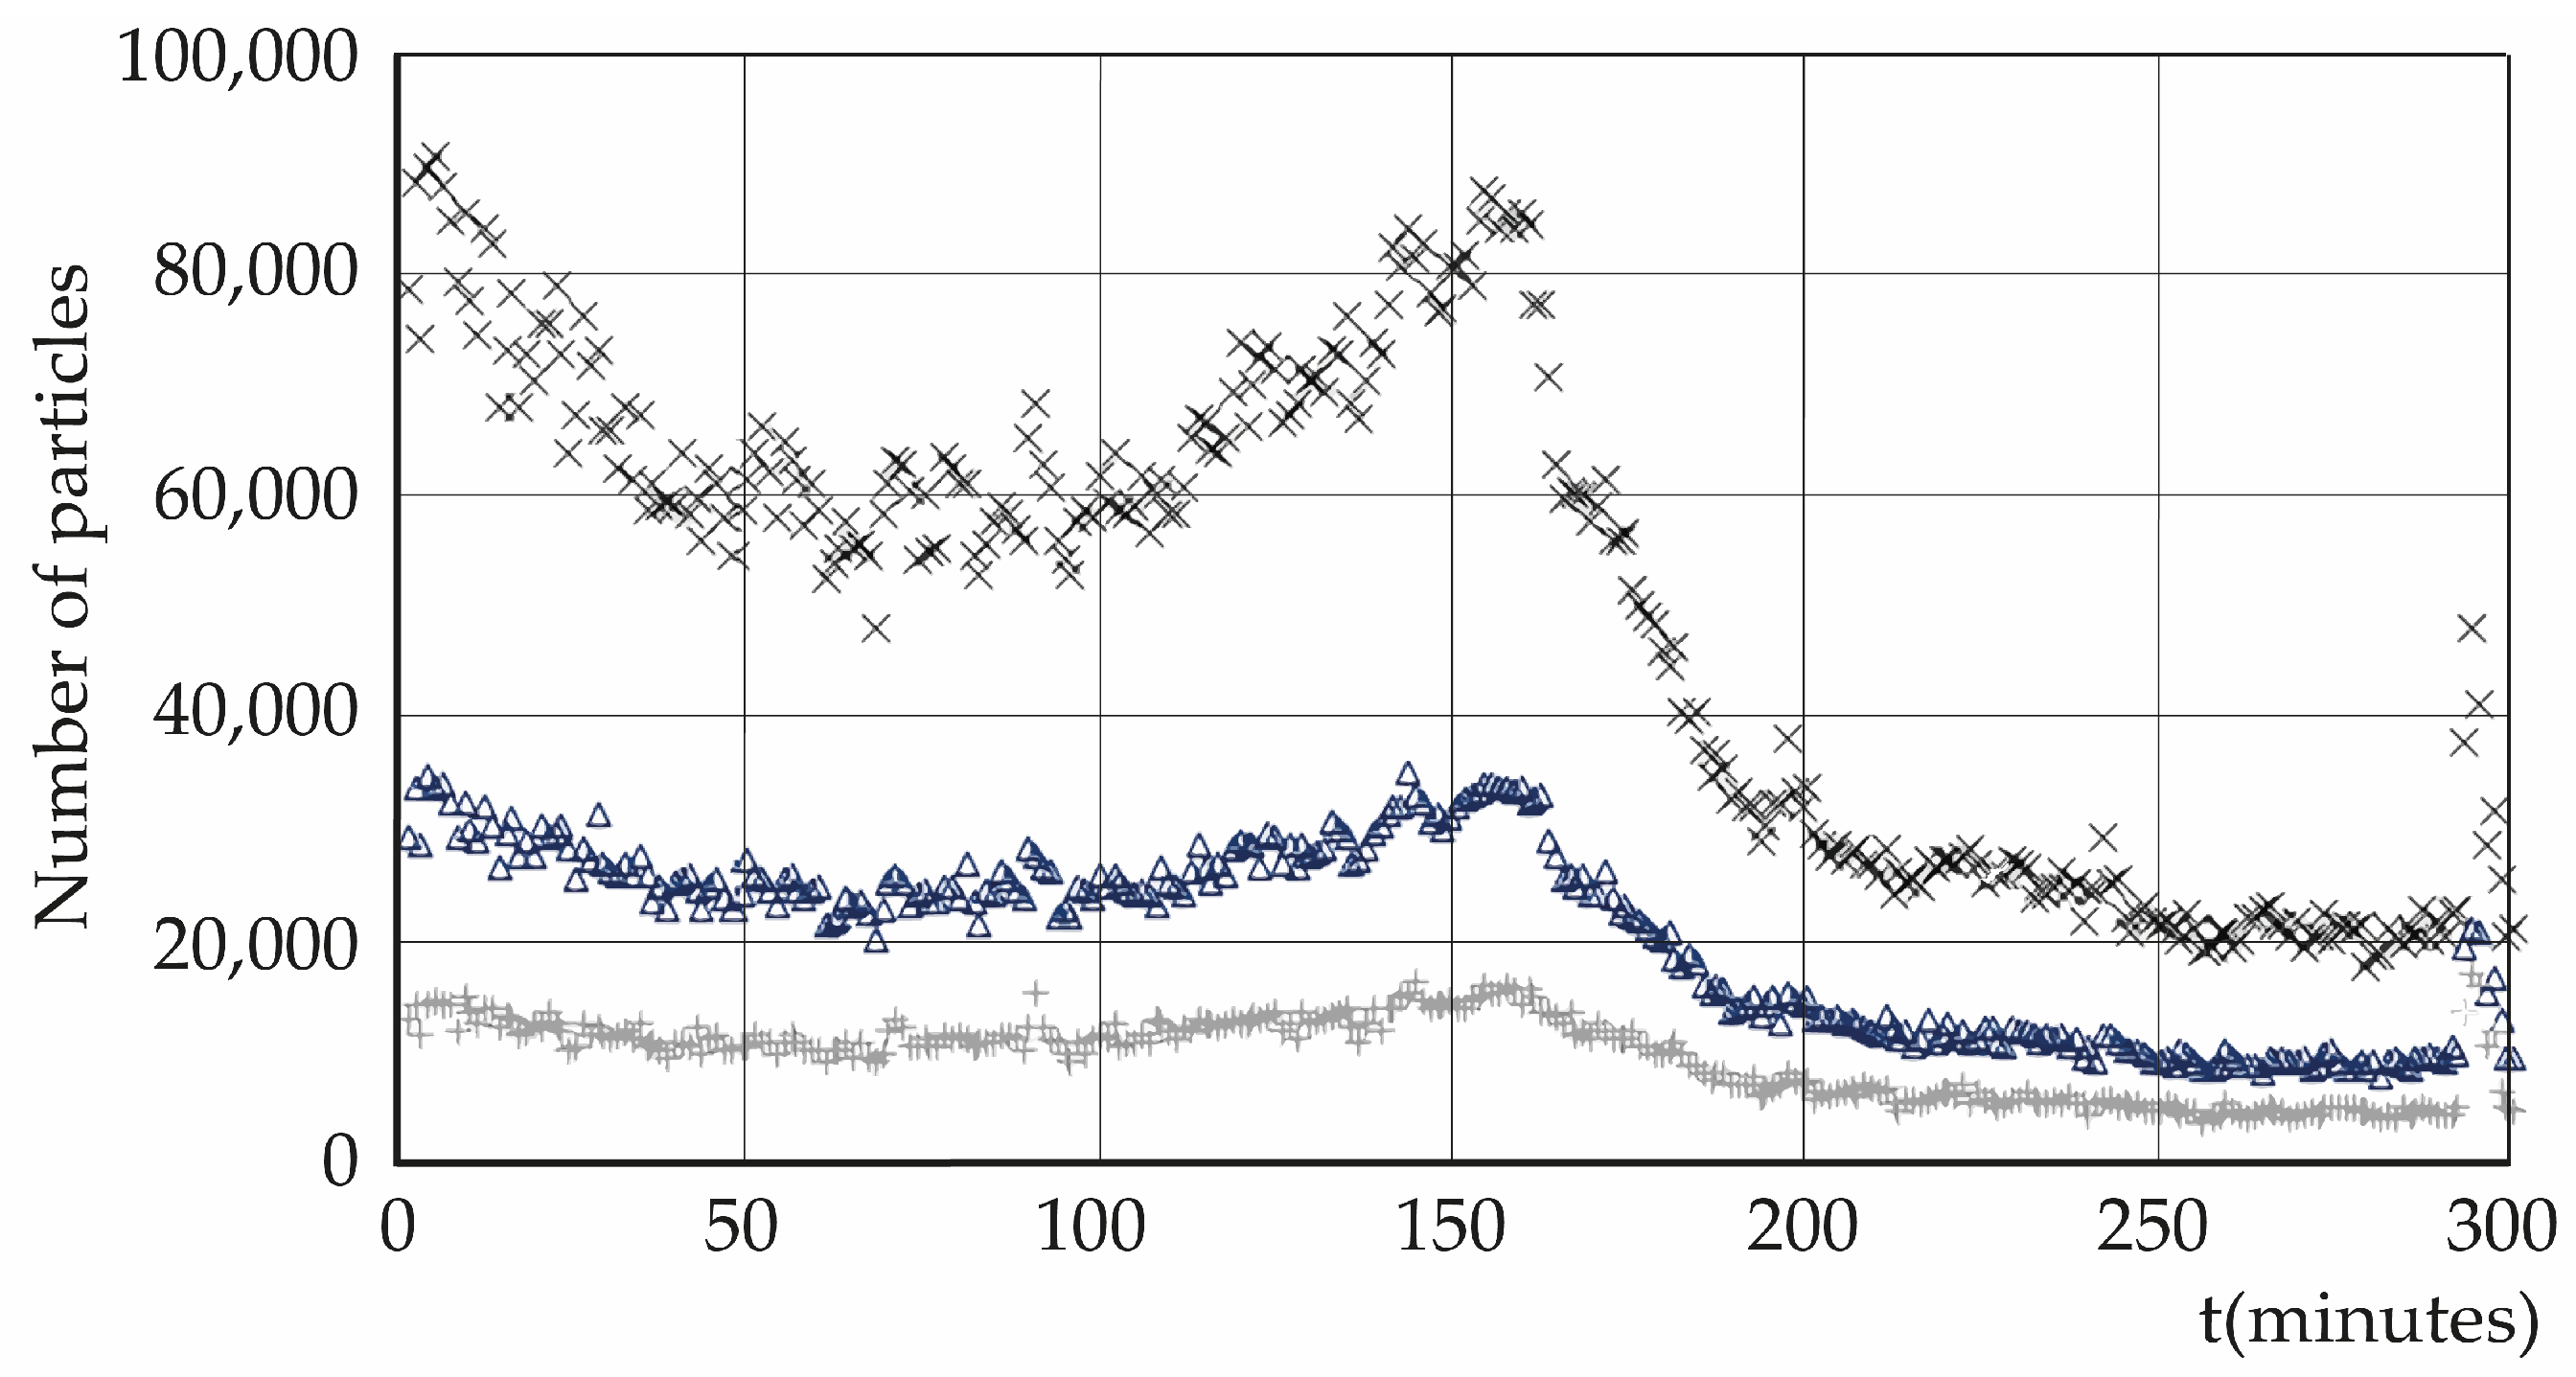
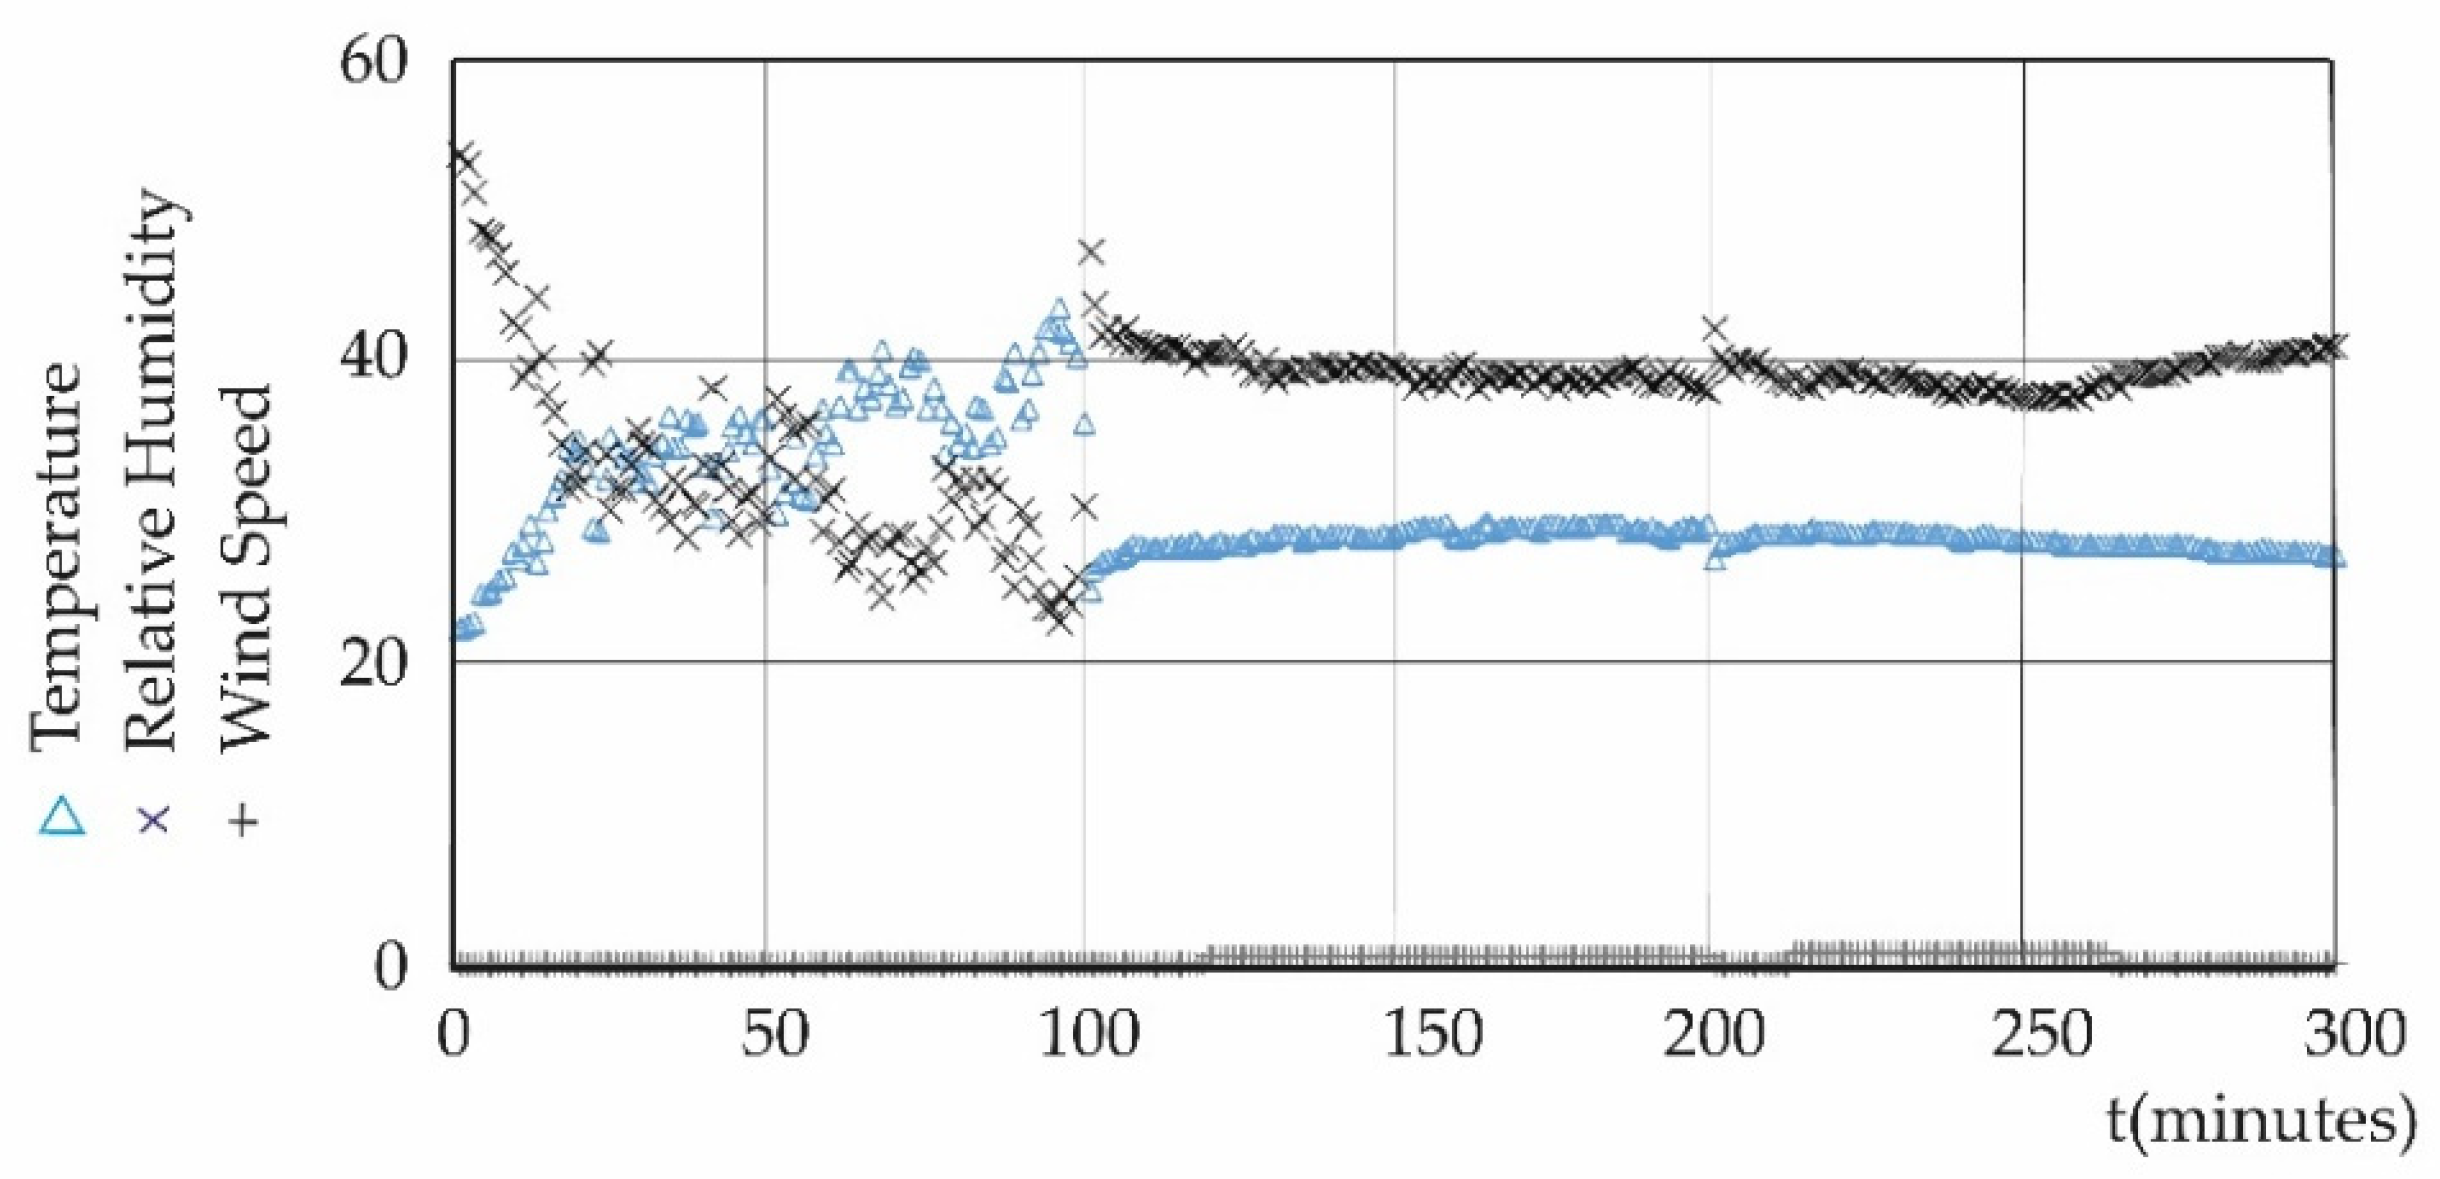
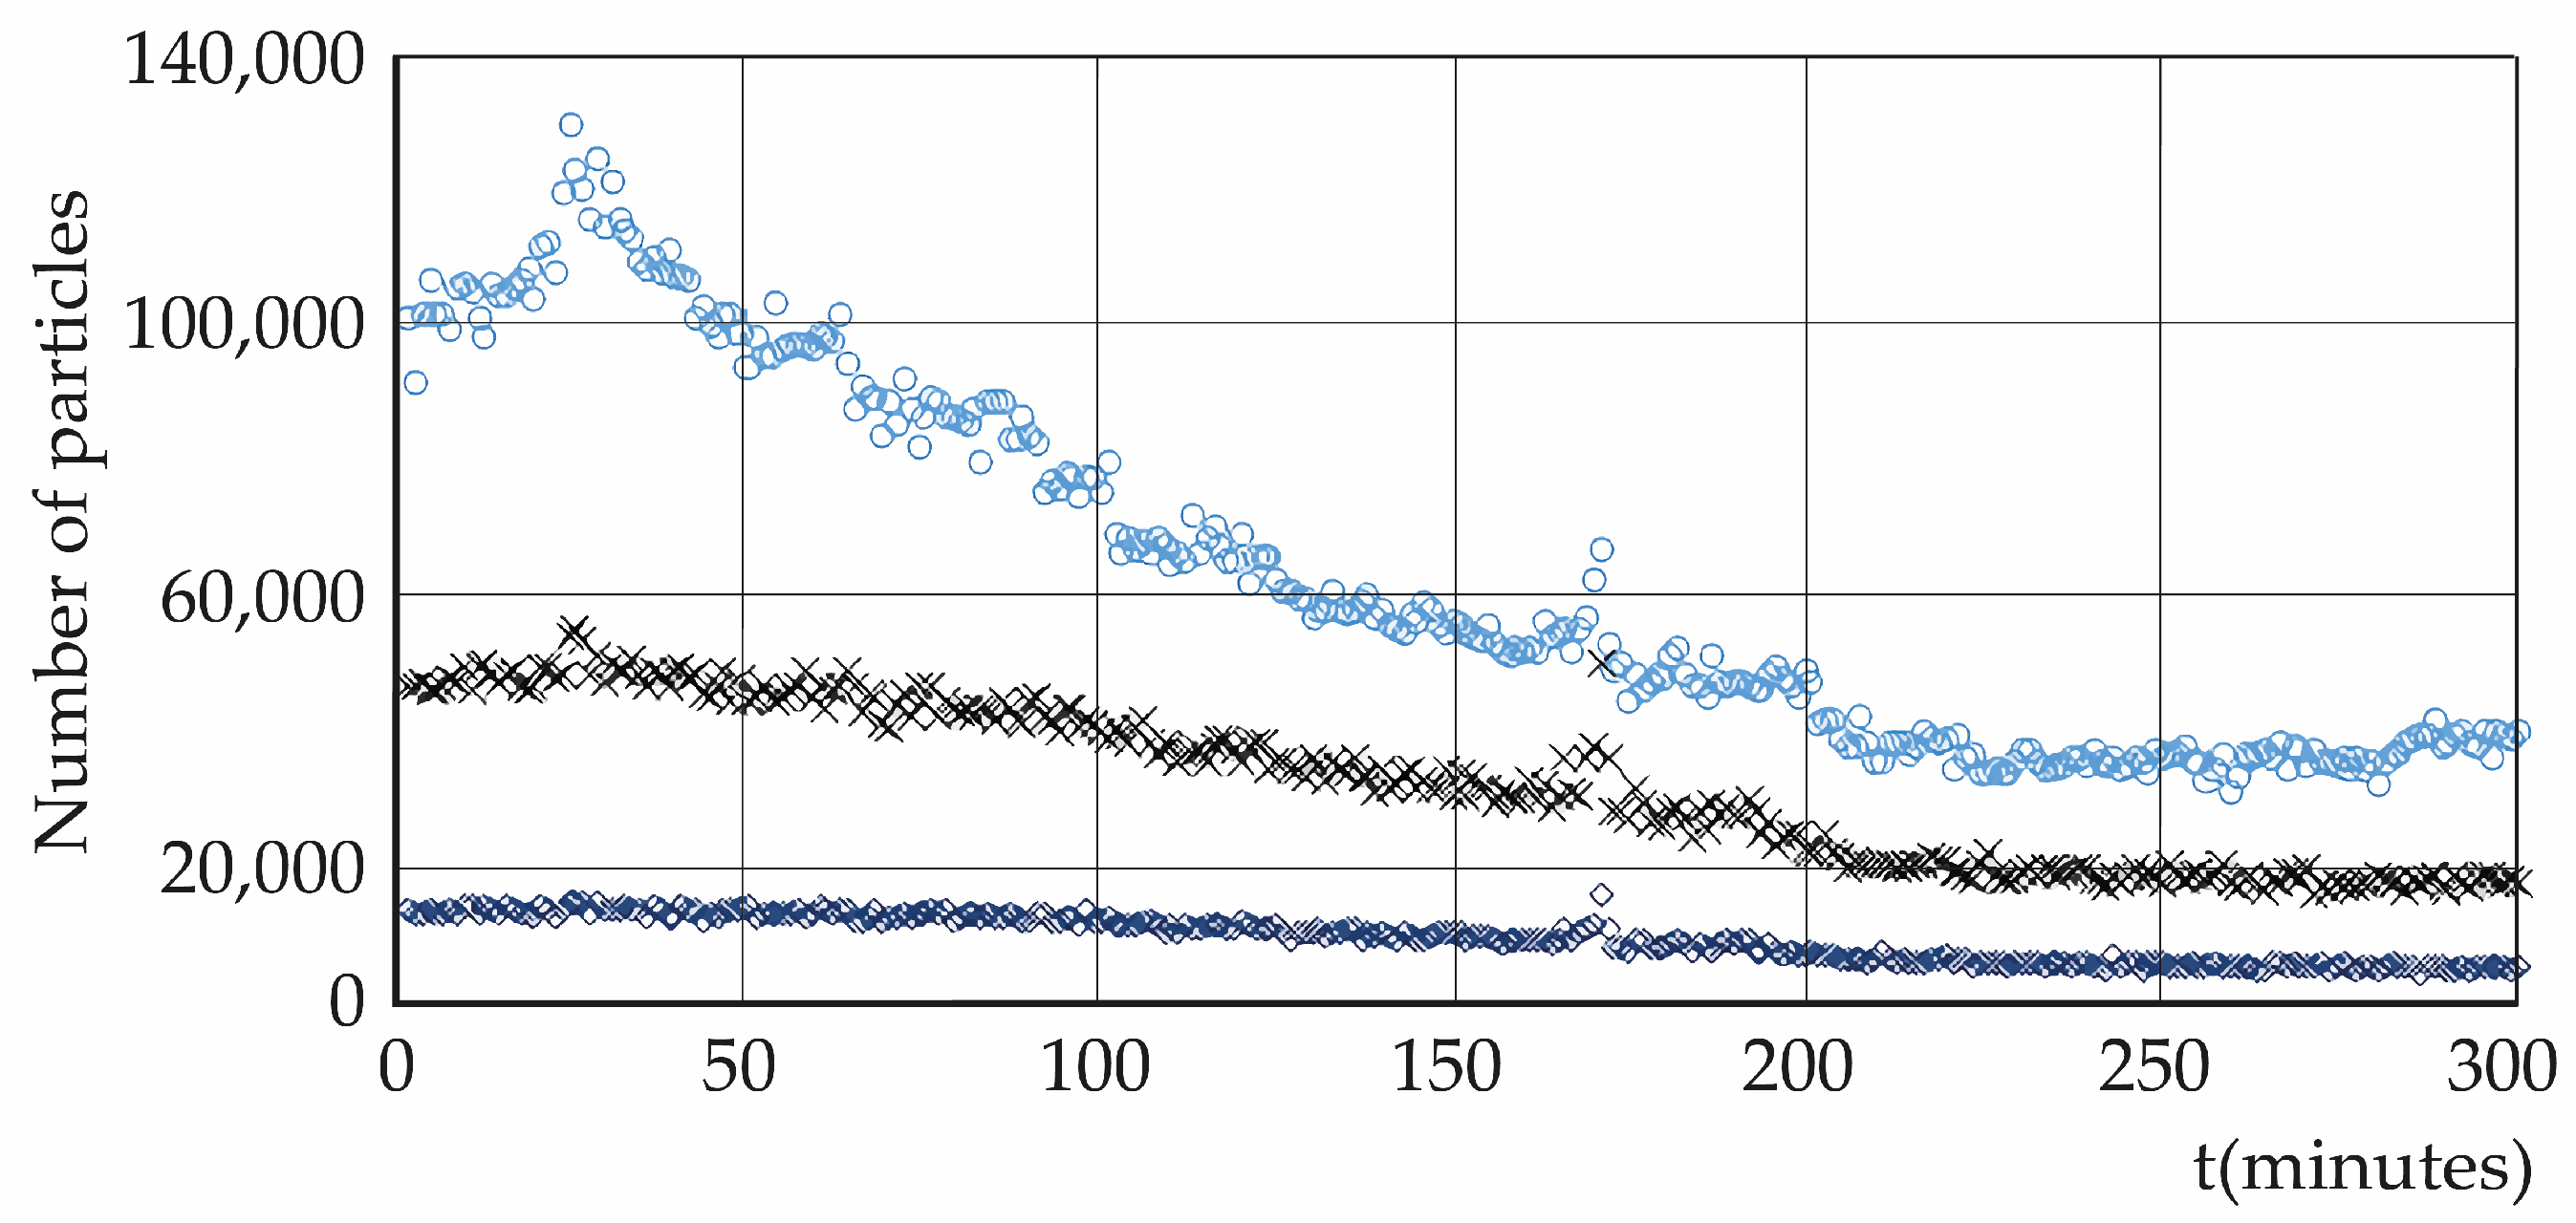
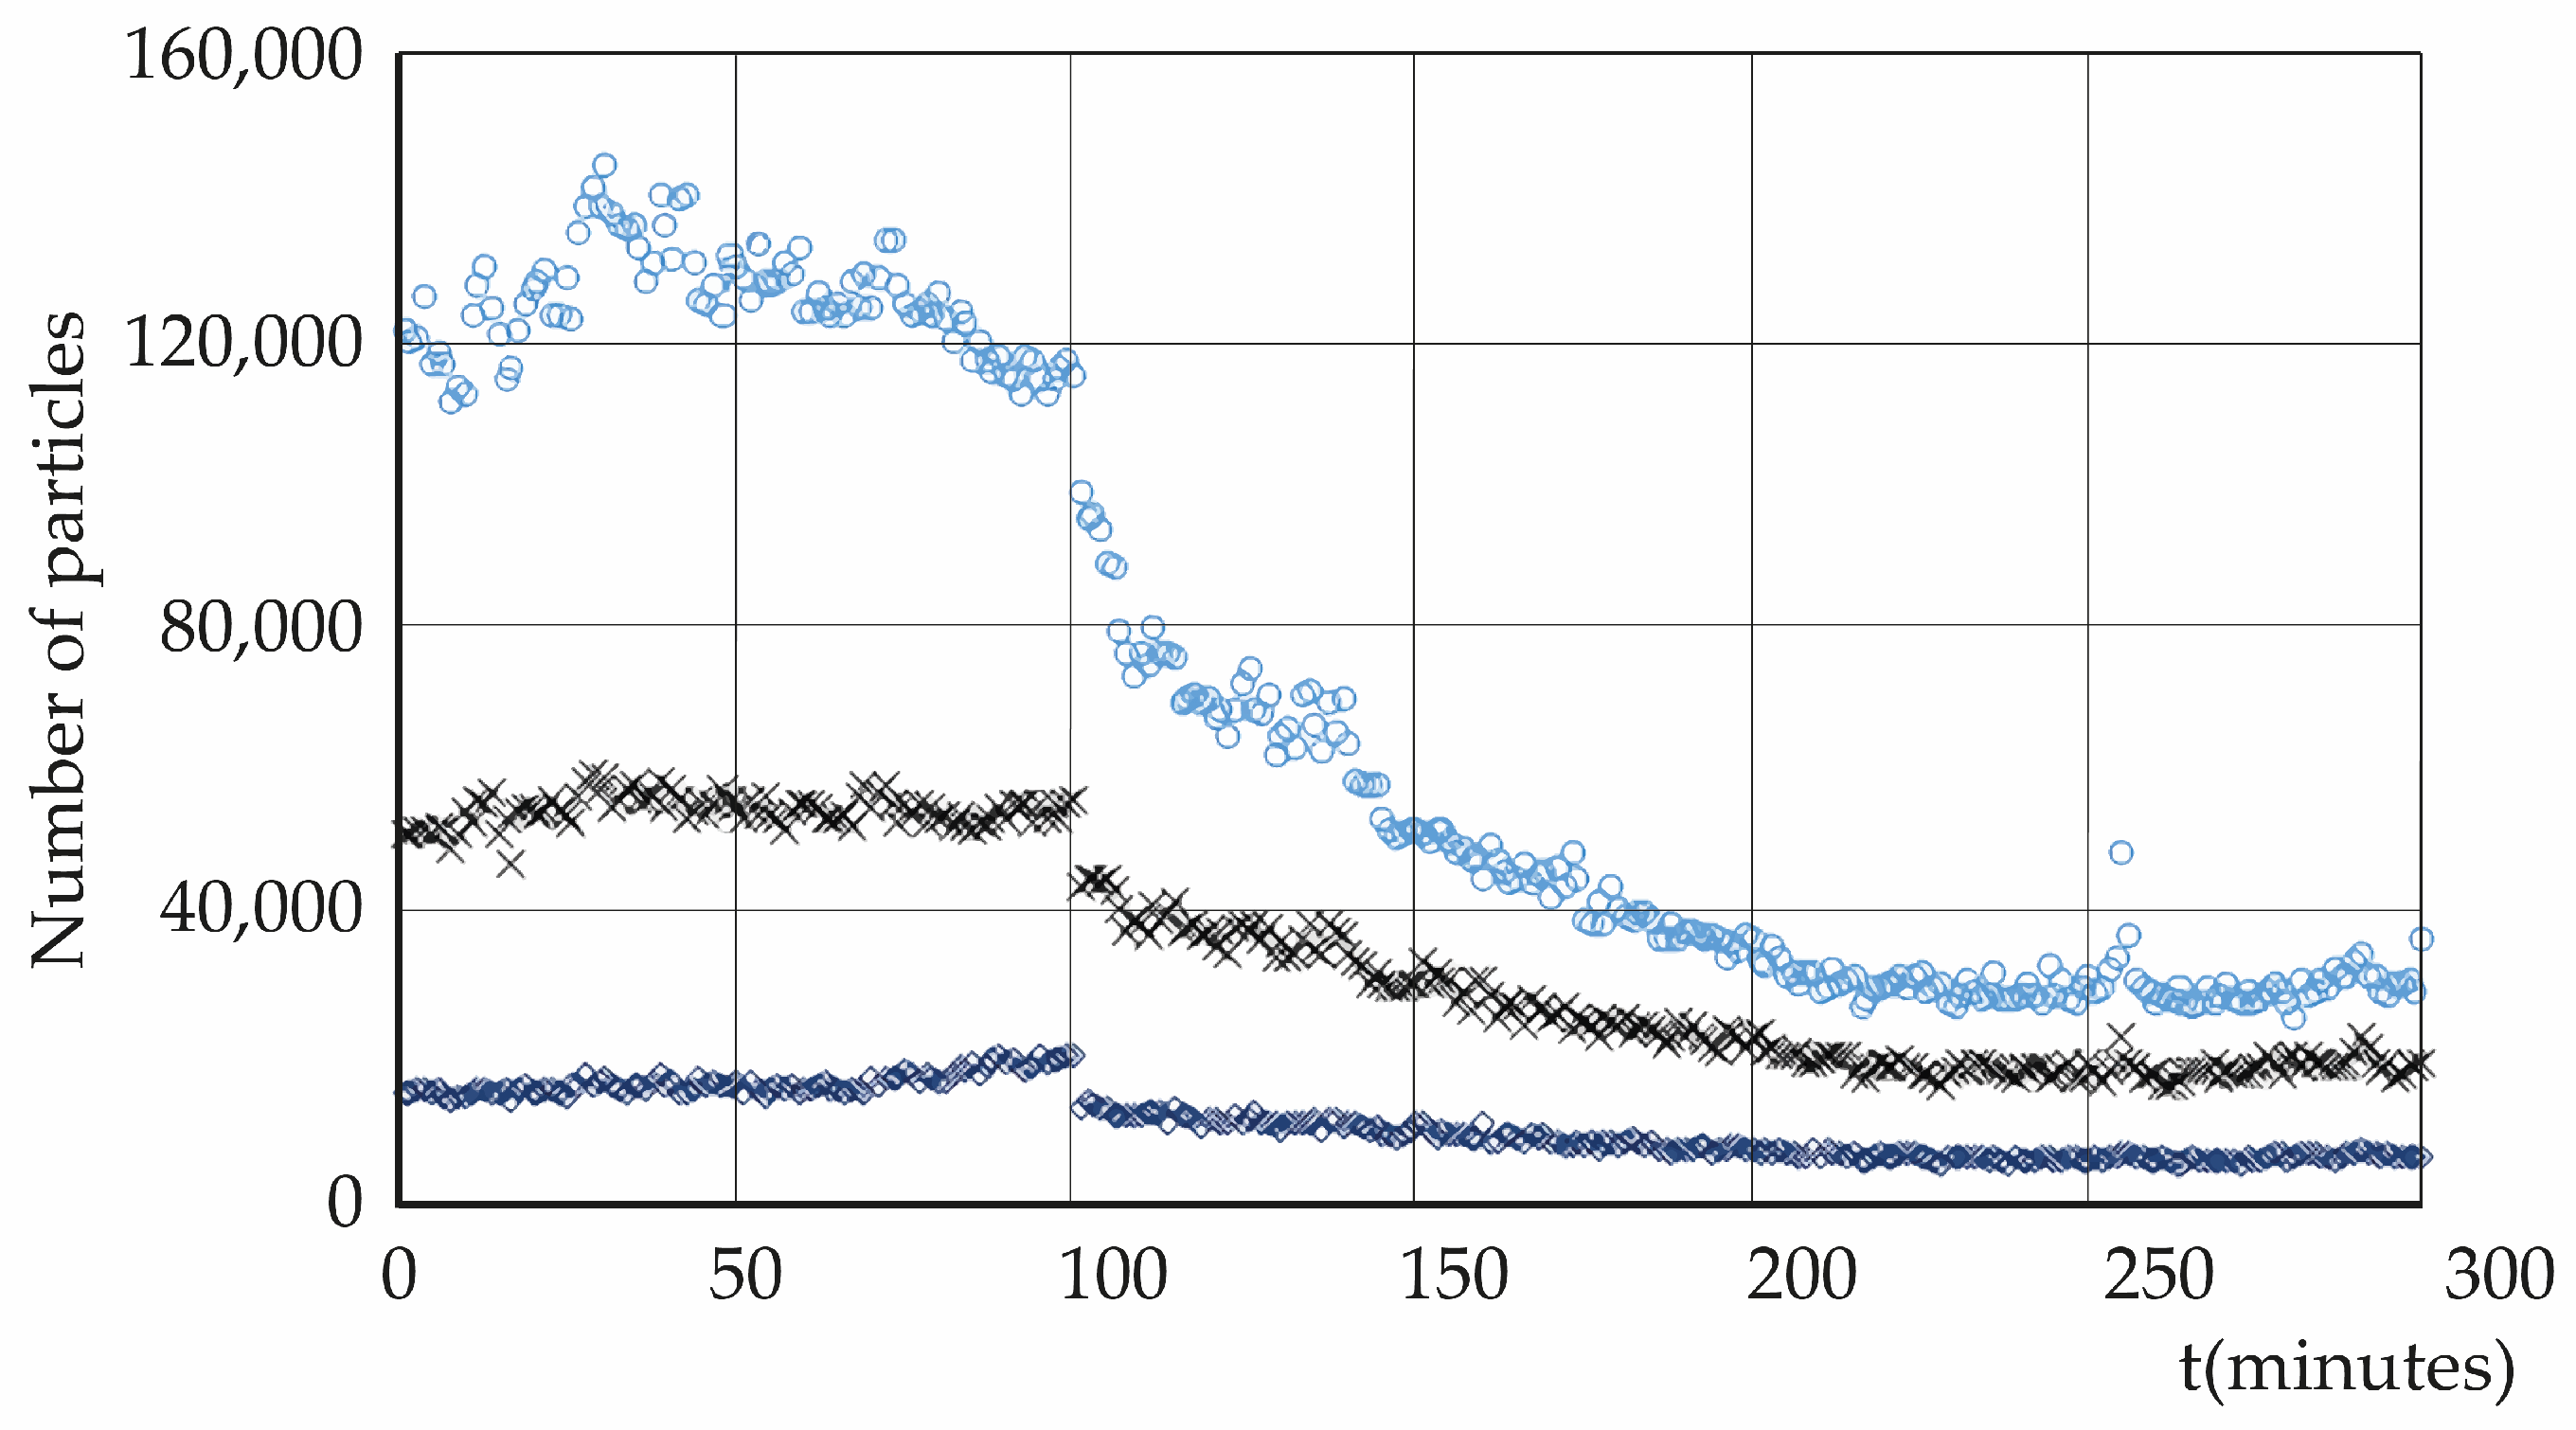
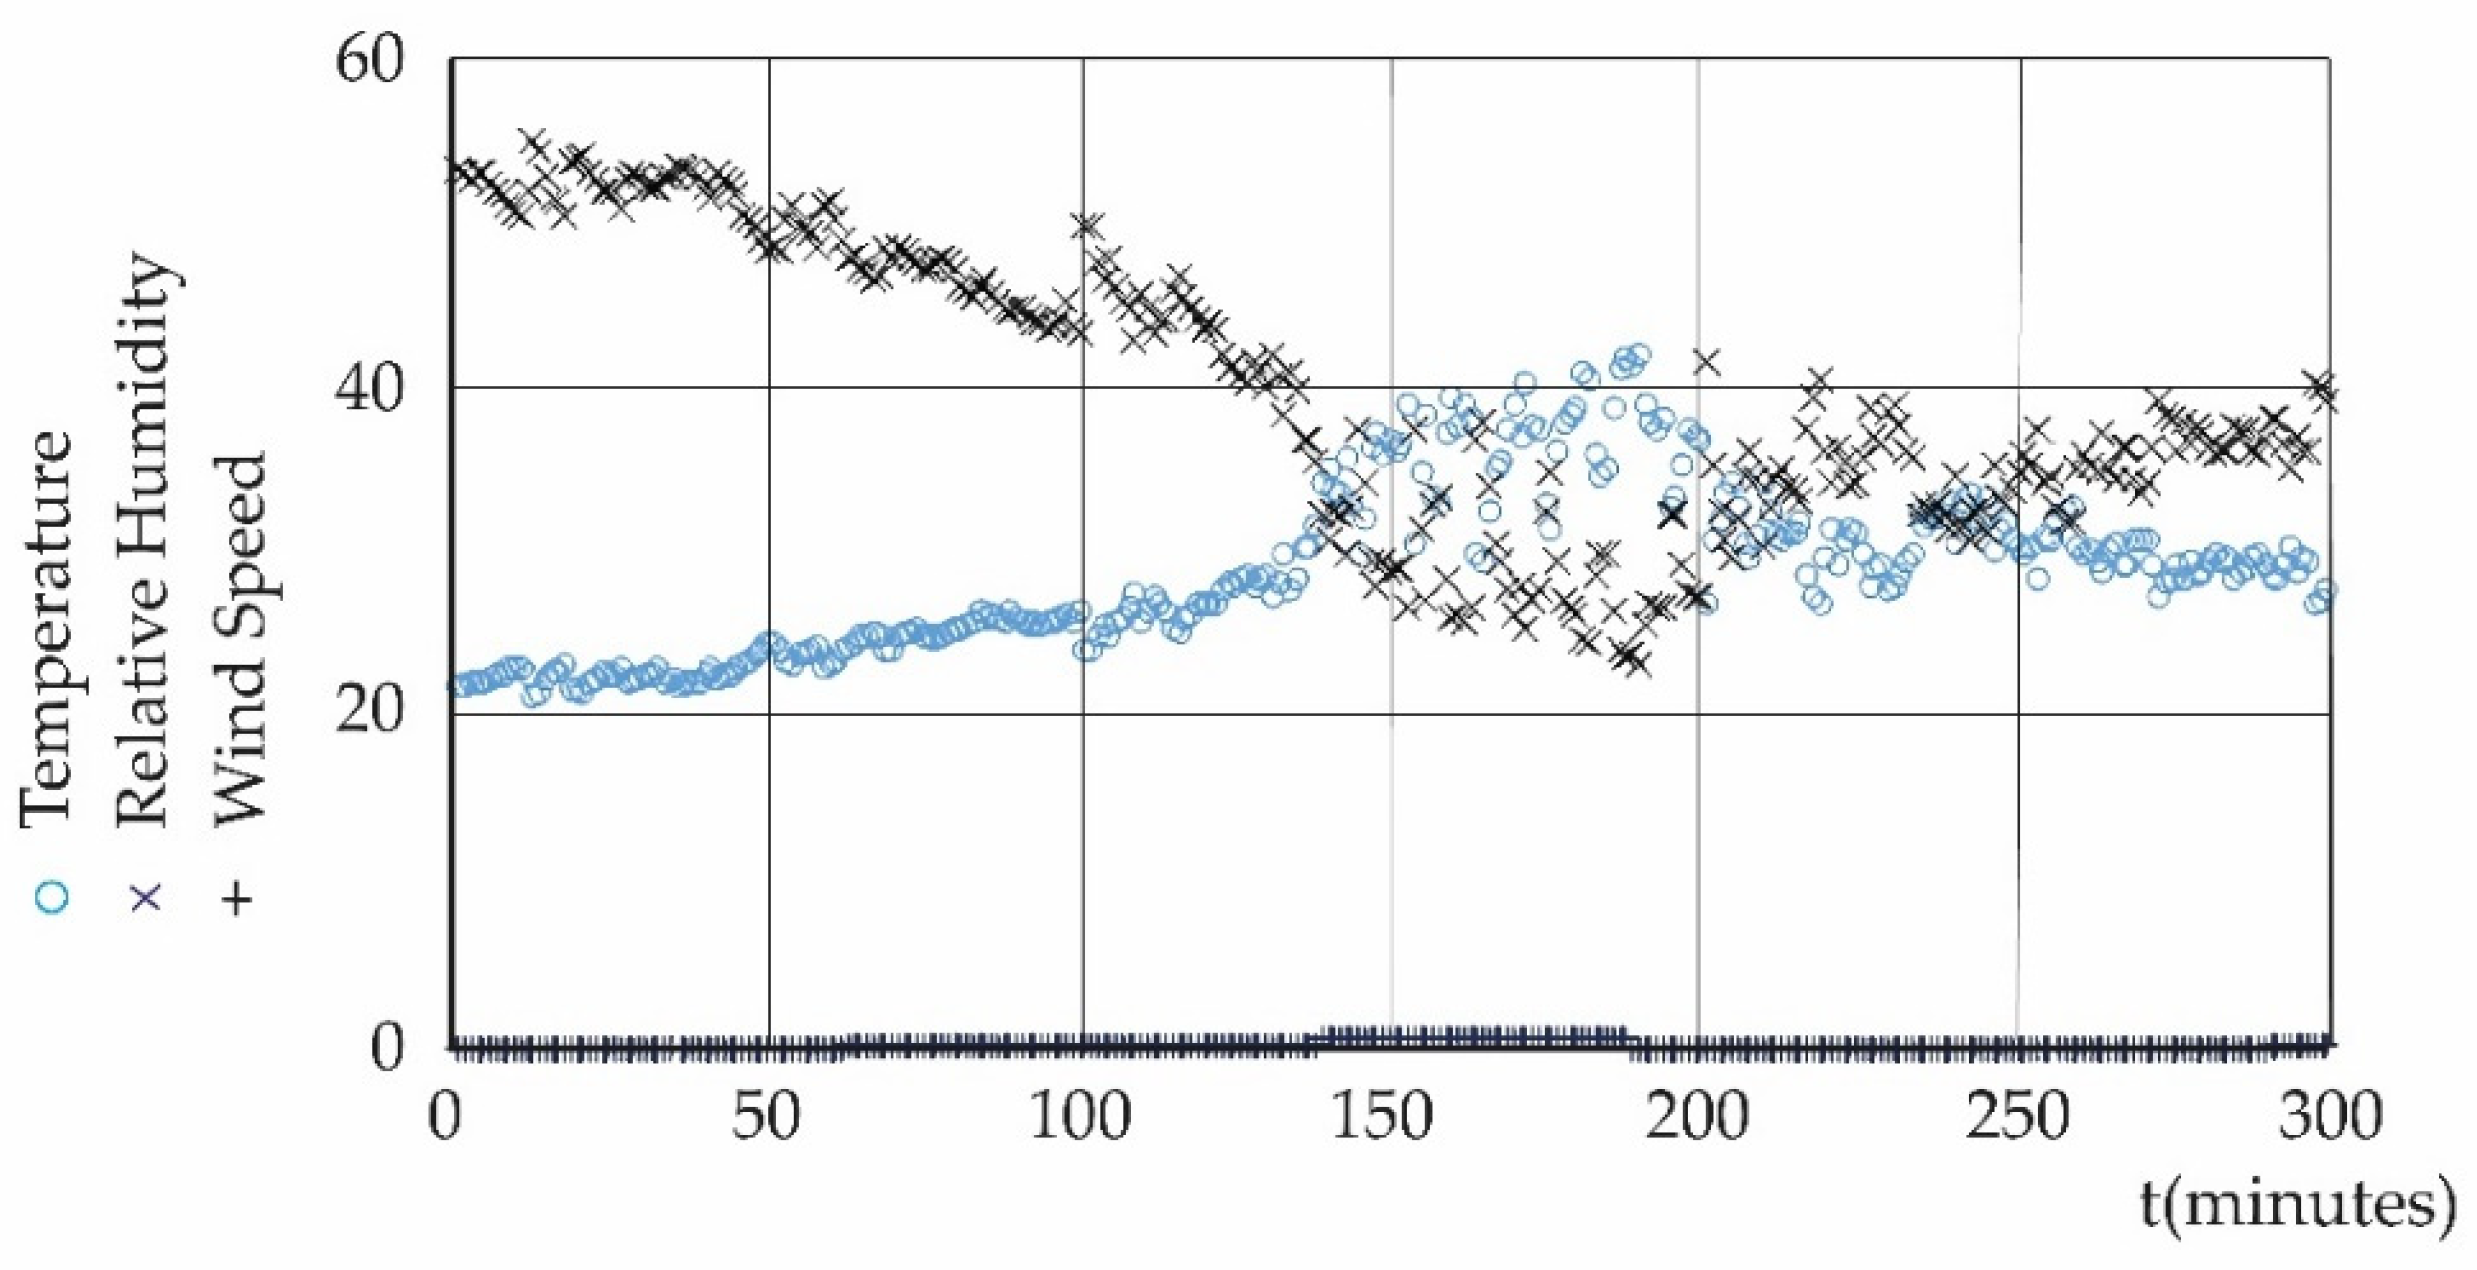
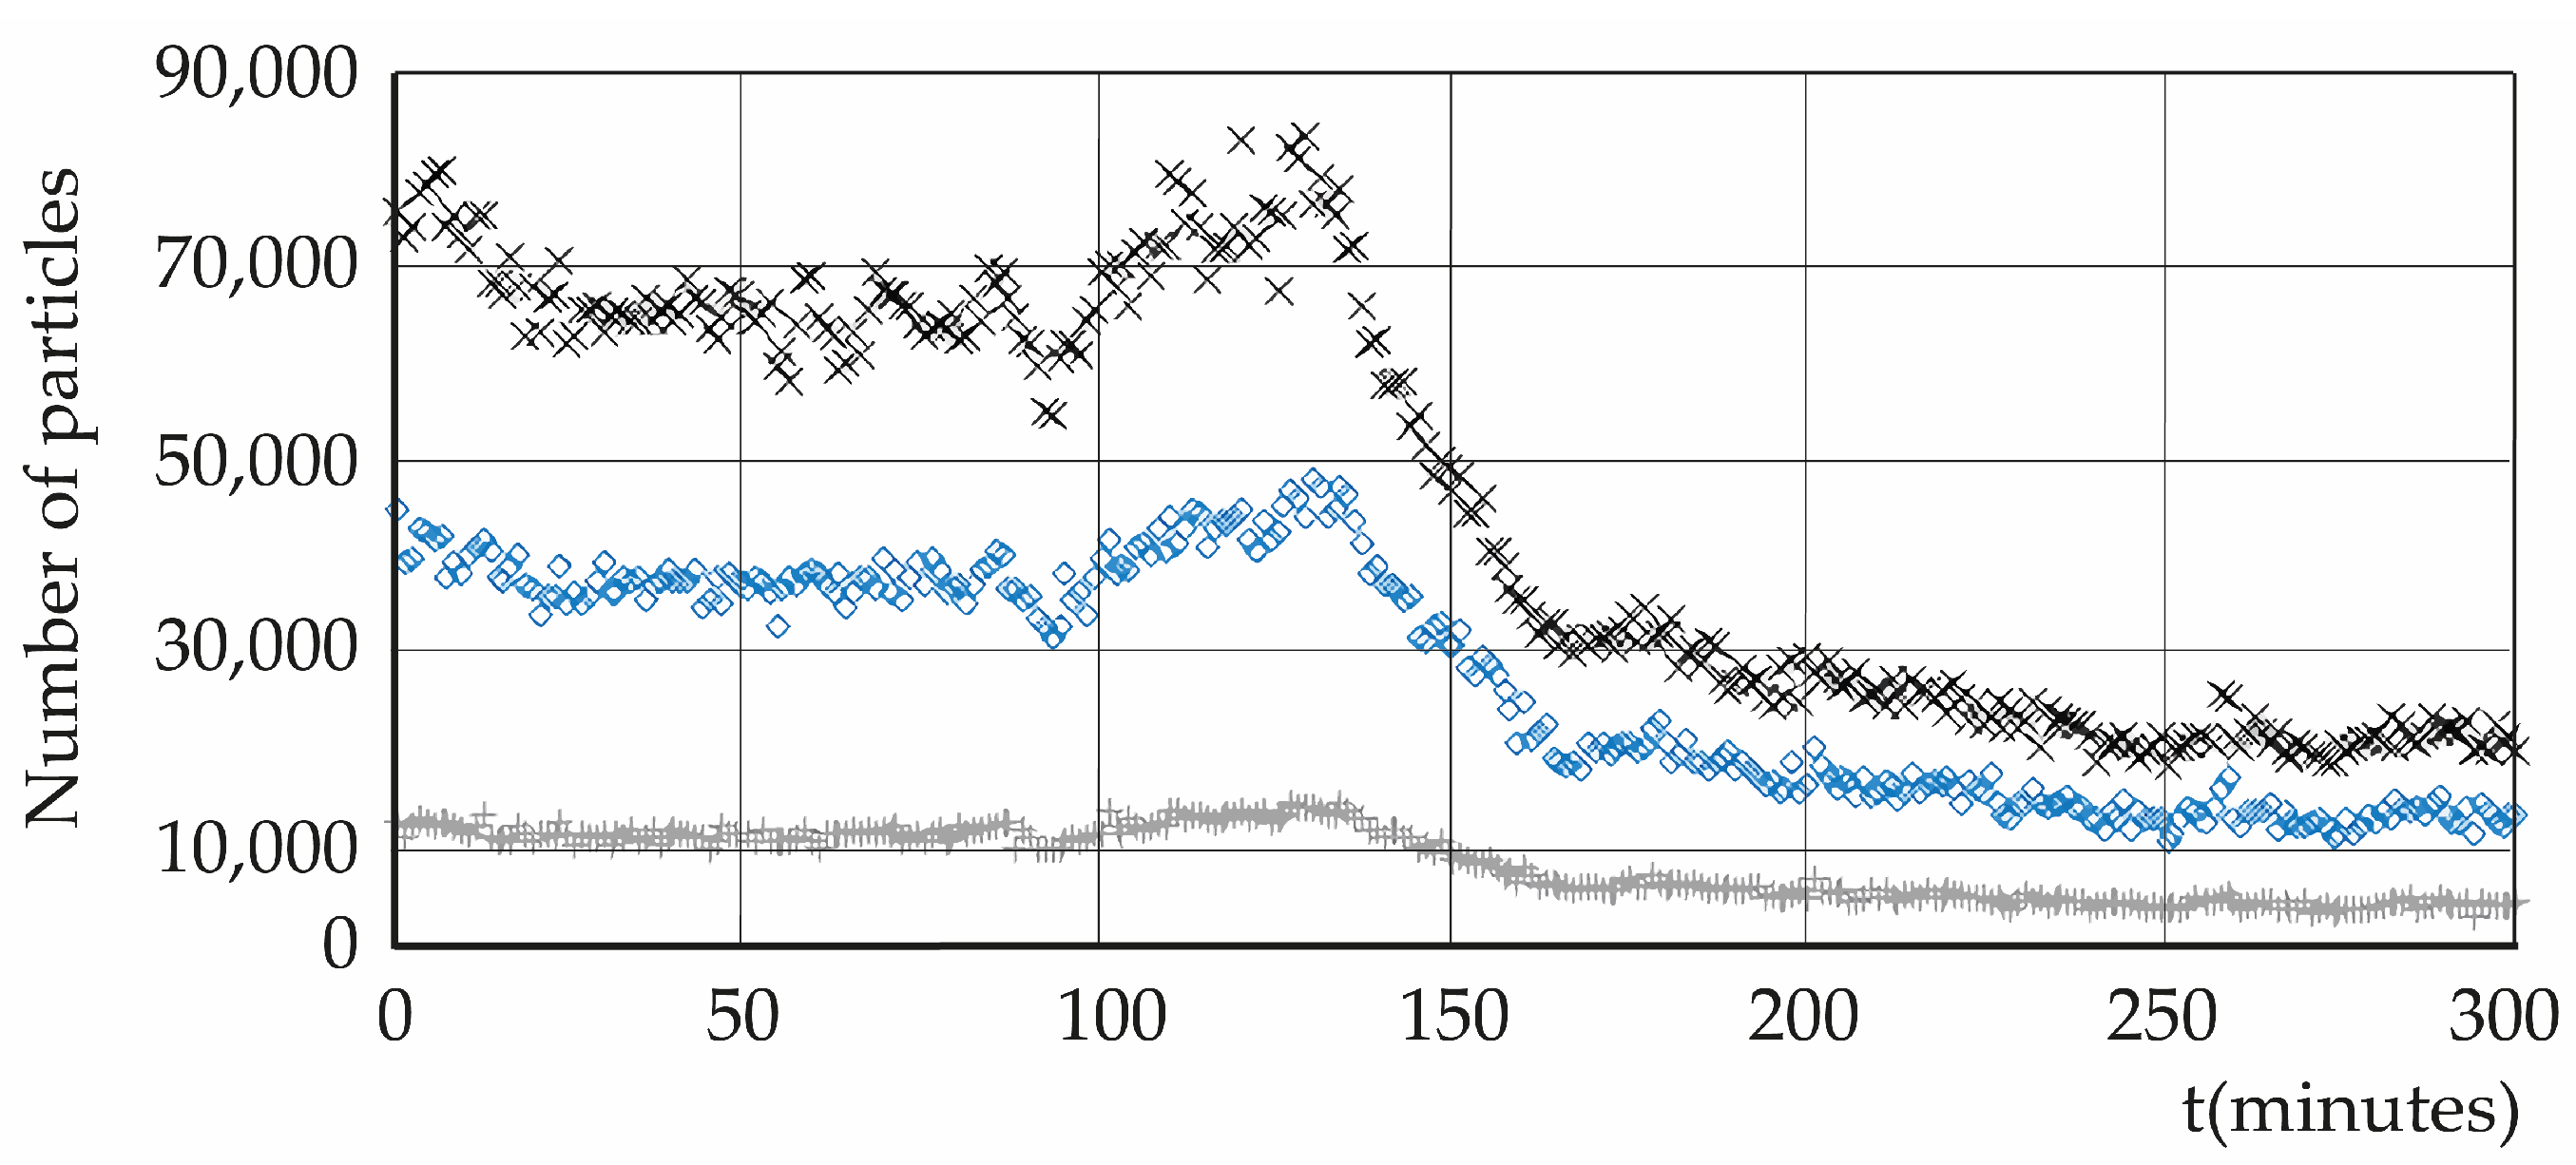
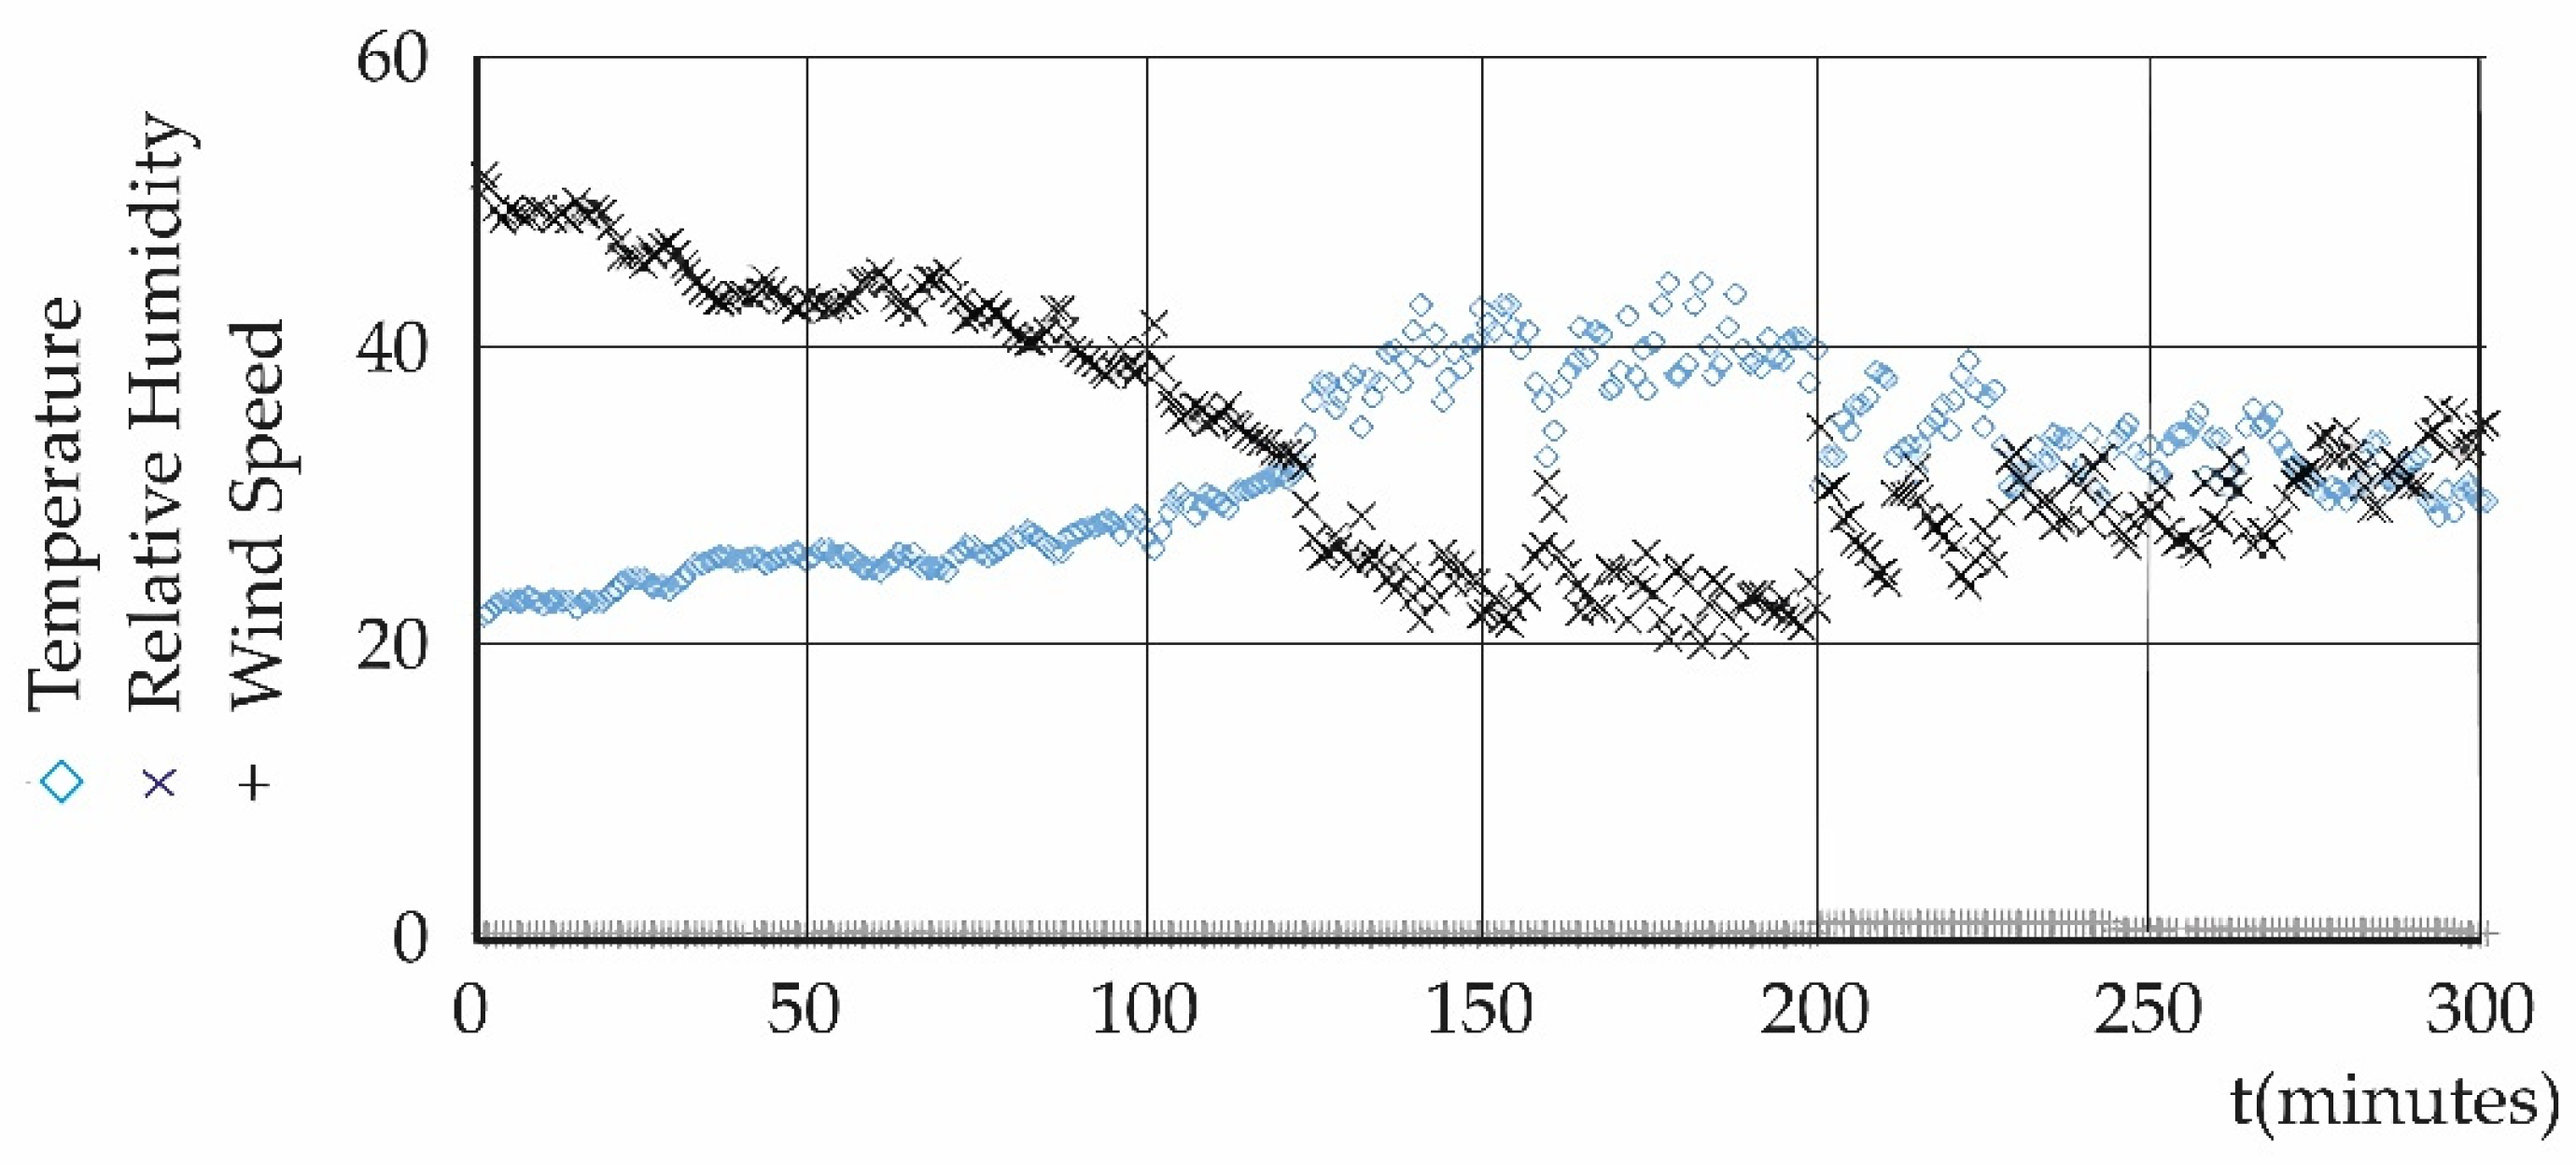
Figures are presented showing the measurements of SPs and urban micrometeorology carried out on 13, 14, 20, and 21 March 2025, in the vicinity of the exterior and interior faces of a 12 m-high building, located in a highly densified urban environment with tall buildings. Figure 3 and Figure 4 represent the measurements on the exterior face of the building, while Figure 5 and Figure 6 present the measurements on the interior face, both measurements were taken on 13 March 2025 (morning (10:52/12:52), noon (13:50/15:51), and afternoon (16:28/18:31)). The remaining figures, corresponding to other measurement days, are included in Appendix A.
A heatwave [32,33,34,35], as shown in Table 1 and Table 2 below, can manifest itself in a small, highly densified residential area with the presence of urban canyons and over exceptionally short time spans—such as 300 min or less. This brings forth a little-analyzed aspect: the temporal scale at which the phenomenon can occur, favored by a complex urban environment with virtually no tree vegetation. The above, along with the magnitude of the temperature increase during certain hours of the case under study—generally exceeding 10 °C relative to the average value—gives the heatwave event a singular and localized character. The results of urban meteorological data for temperature and relative humidity, measured over four randomly spaced days within a total of nine days during the summer season in basin-type geomorphology are presented in Table 1 and Table 2. The data were collected near the exterior and interior faces—at 9 m above ground level—of an old concrete building with plaster-covered masonry walls and a height of 12 m. In the case of the interior face, the phenomenon is associated with a weakening of RH.
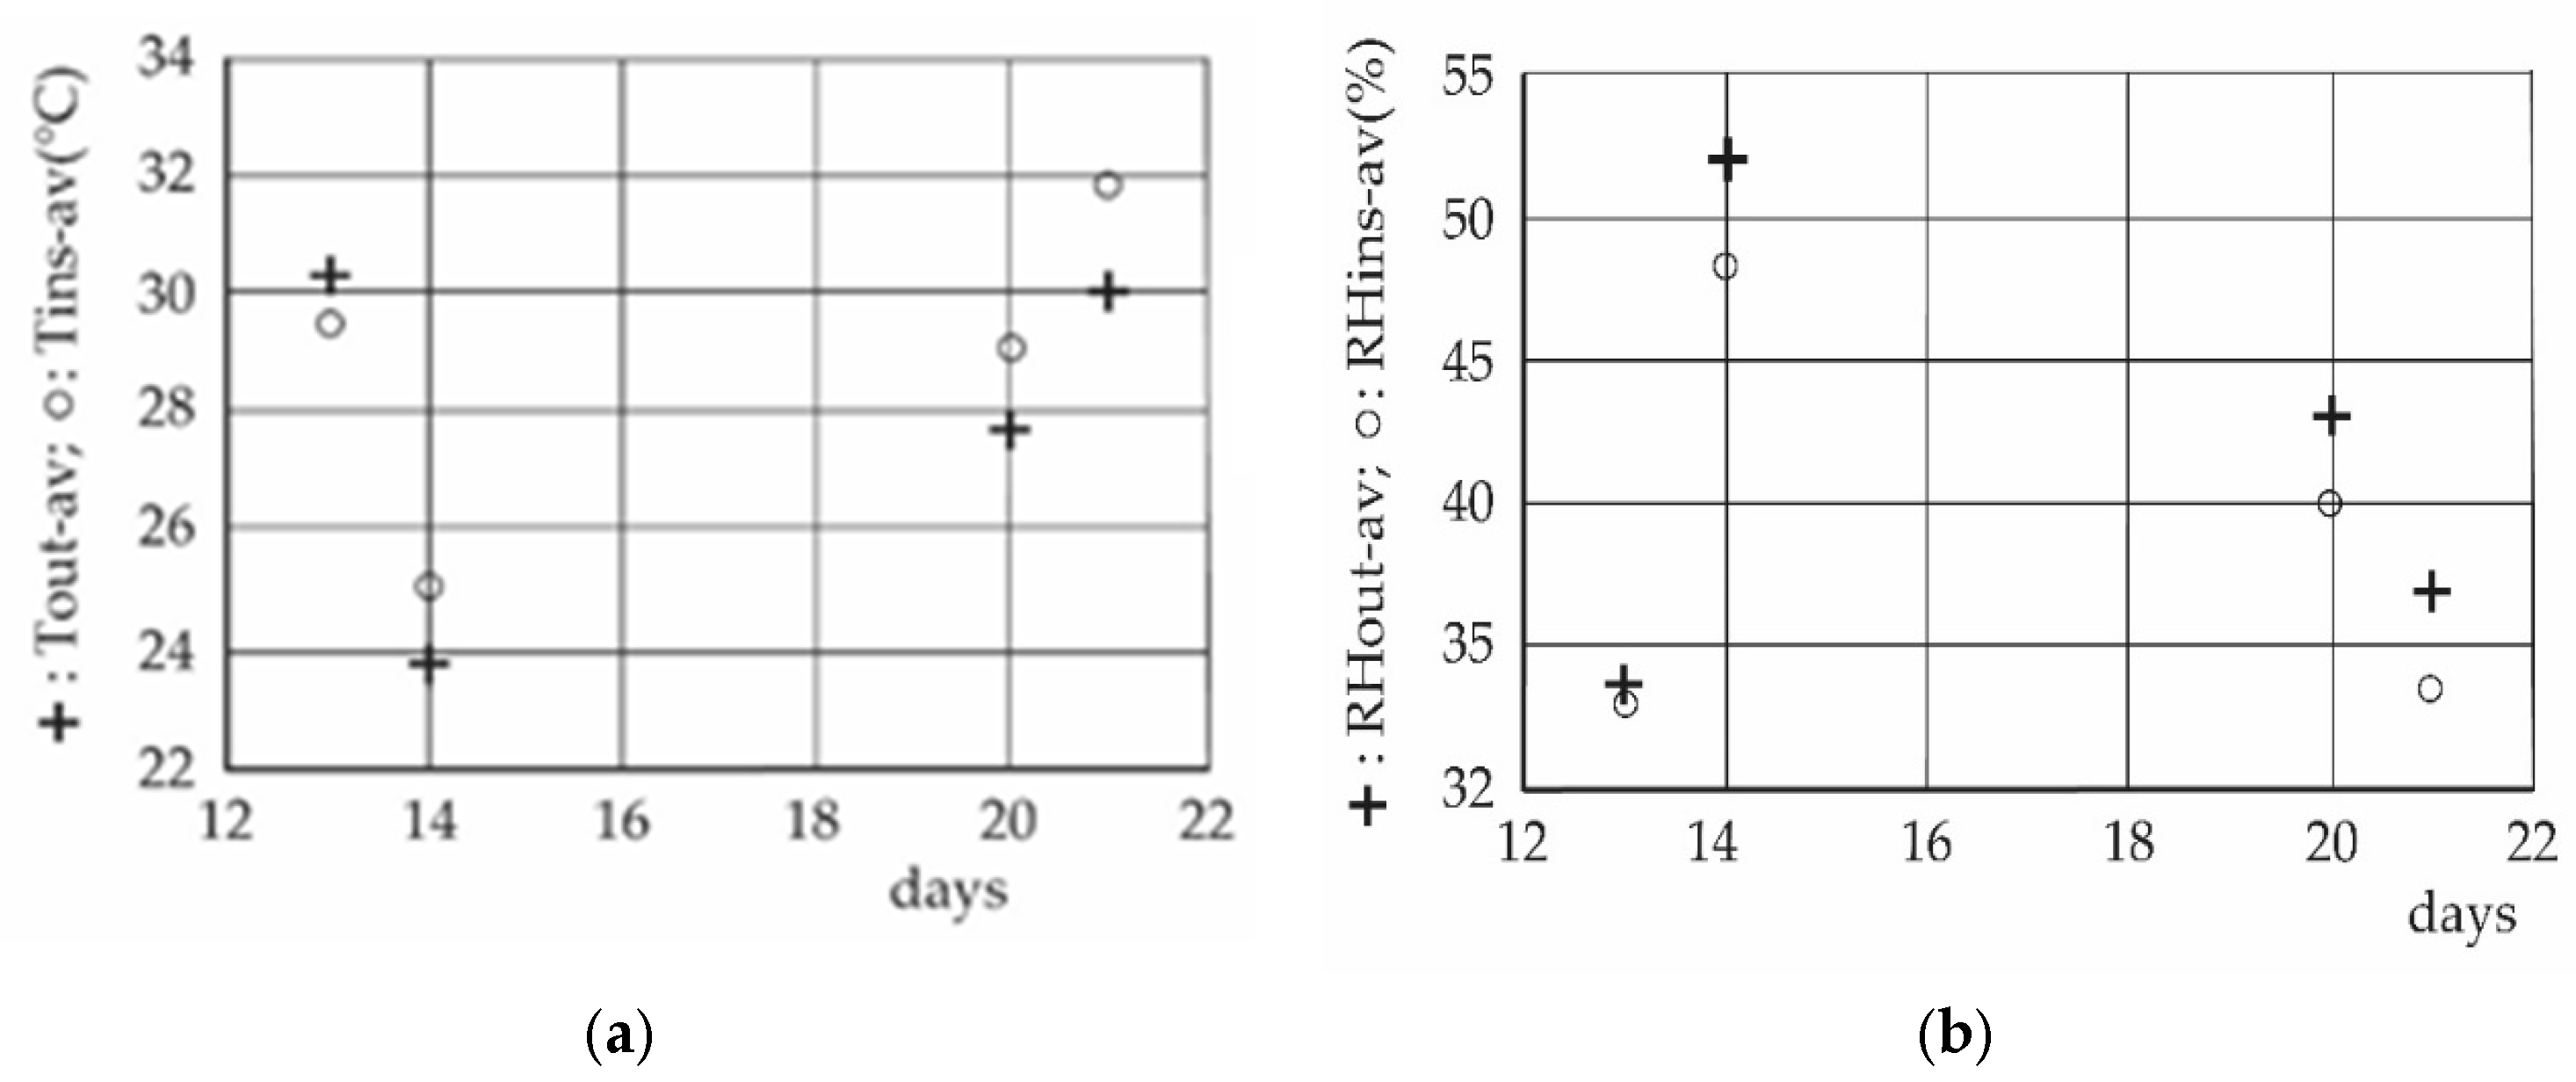
Figure 7 shows, comparatively, the differences in temperature and relative humidity (average) for the exterior and interior areas:

3.2. Historical and Periodic Temperature Measurements

On the other hand, Table 2 shows the variation in average temperature for the periods 2010/2013, 2017/2020, and 2019/2022. These average values were measured at different altitudes due to the natural roughness of the city’s basin-like geomorphology. The most interesting case is the 2019/2022 period, due to the temperature decrease, which disrupts the upward trend observed during the 2010/2013 and 2017/2019 periods. This change is attributed to the drastic reduction in activities in Santiago de Chile caused by the Coronavirus pandemic.
Figure 8 shows the distribution of temperatures: increasing in the pre-pandemic period, followed by stabilization and a slight decrease during the pandemic.

3.3. The Kolmogorov Entropies of Pollutants and Urban Meteorology During the 2019/2022 Period Influence the Entire Basin of Geomorphology

The evolution of the entropy ratio during the periods 2010/2013, 2017/2019, and 2019/2022 [19,20] allows for visualization of the degradation of urban meteorology. Figure 9 shows the municipalities with the highest and lowest resulting entropic flows due to urban meteorology (temperature, relative humidity, wind speed magnitude).
Figure 10 presents the sum of the partial entropies, by municipality, due to the pollutants considered in this study (PM10, PM2.5, CO) for the 2019/2022 period.
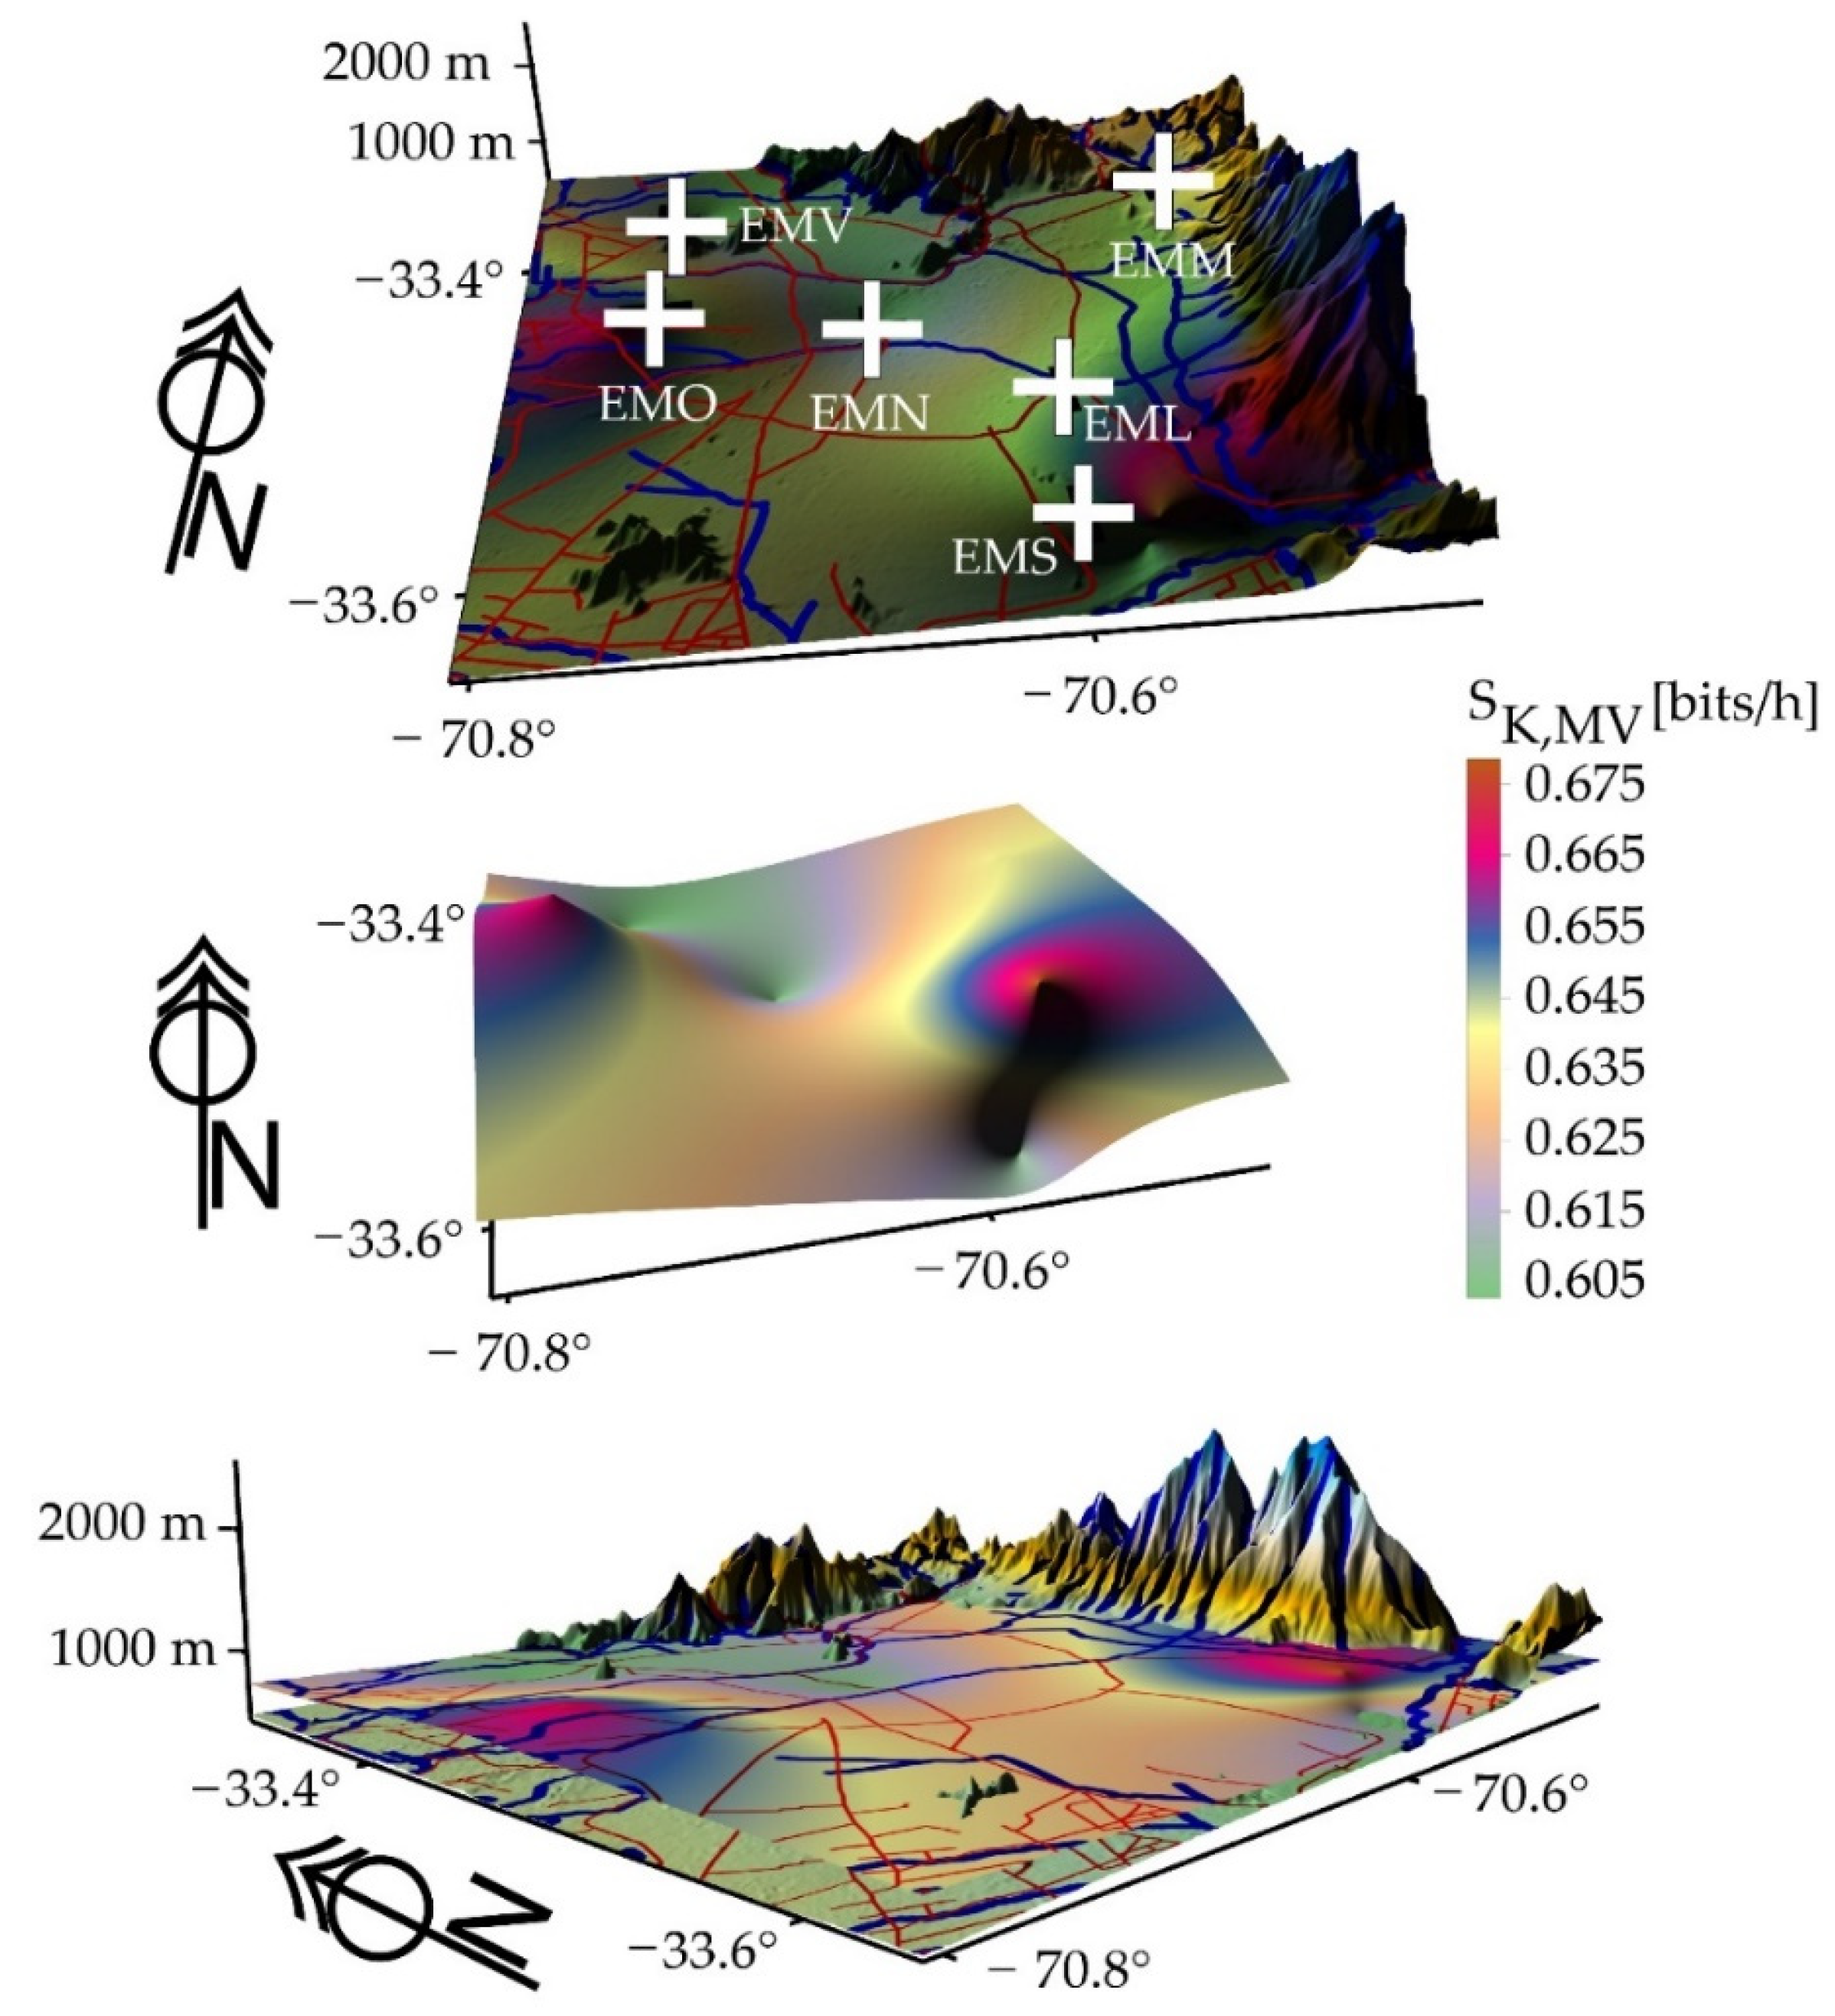
Equation (2) represents the result of the interaction between urban meteorological entropies and pollutant entropies, shown in Figure 11.

3.4. Spearman Correlation

The reason for presenting the previous three figures is to explore a possible link between submicron particles (SPs) and coarse particulate matter. The SP measurements conducted for this study are extremely localized and cover a short summer period (days of a month). For this investigation, the Spearman correlation [36]—also known as Spearman’s rho—will be applied. It is a statistical measure that assesses the strength and direction of the monotonic association between two variables, a relationship that does not need to be linear. These coefficients can be positive, negative, or zero, indicating a positive, negative, or no relationship, respectively.
Unlike Pearson’s correlation [37], which measures the linear relationship between two variables, Spearman’s correlation can detect monotonic relationships (where variables change in the same direction, though not necessarily at the same rate). This analysis allows us to determine whether particulate matter of 2.5 µm and 10 µm has a monotonic association with SPs of 0.3 µm, 0.5 µm, and 1.0 µm. If such a relationship exists, many properties attributed to coarse particulate matter could be extended to SPs: entropy calculation, entropic layers, entropic force, influence of meteorology on SP concentration, etc.
The dataset corresponds to measurements taken on both the exterior and interior faces of the building where the measurement equipment was installed. The results, according to the Spearman analysis [38], are presented in Table 3 and Table 4.
B.0.3, B.0.5, B.1, B.10, B.2.5, B.5, indicates that the relationship is calculated, in pairs, between (B) two variables, according to rows and columns, one of the variables being the diameters of the particulate material (0.3 µm, 0.5 µm, 1.0 µm, 10 µm, 2.5 µm). In the same way, B.R.H, B.T, B.WS: B indicates that the relationship is sought, in pairs, between (B) two variables, one of them being relative humidity (R.H), another is temperature (T), and another is the magnitude of the wind speed (WS), respectively. In addition, the Spearman’s rho value indicates the following: 0.00–0.19, very low correlation; 0.20–0.39, low correlation; 0.40–0.59, moderate correlation; 0.60–0.79, good correlation; and 0.80–1.00, very good correlation. They indicate the ranges of relationship between two systems of variables.
The Tables show a strong correspondence between the SPs and coarse types of particulate matter. It demonstrates that when the level of 2.5 µm particulate matter increases, the level of 0.3 µm particulate matter also rises. This is also confirmed with respect to the 0.5 µm and 1.0 µm data, which, although measured, are not the subject of analysis in this study.
The Spearman method applied to the database of this research (which considers particulate matter of 0.3 µm, 0.5 µm, 1.0 µm, 2.5 µm, 5 µm, and 10 µm, along with meteorological variables) shows low correspondence with urban meteorology (temperature (T), relative humidity (RH), and wind speed magnitude (WS)), which contradicts other studies [39,40,41,42,43] and numerous observations. The authors highlight the high correlation between temperature and relative humidity, confirming the results of a study carried out using entropy [16].
To seek an alternative solution, and considering that the measurement locality experienced a climatology of extremes [44,45] as shown in Table 1(a,b) (with days where temperature exceeded 40 °C), ratios were constructed based on the data measured in this study between SPs and urban meteorological variables temperature and relative humidity. Does the probability calculation of these ratios harmonize with the observations?

3.5. Heavy-Tailed Distribution

The SP data of 0.3 µm were normalized, for each measurement period, by the maximum value of that period, using the expression X = number of particles/maximum value of the measurement period. Relative humidity was normalized similarly, with y = relative humidity data/100, and temperature with z = temperature data/maximum temperature value of the period.
Finally, a dimensionless time series was constructed using the ratios X/y and X/z. The heavy-tail probability density of these quantities was then calculated using the Fréchet equation [45,46,47]:
f ( x ) = α x 1 α e x α ,   with   α > 0
This was carried out under the hypothesis of SP pollution occurring in an environment characterized by extreme conditions, such as overstressed urban micrometeorology due to heat islands, high human density, tall buildings, low presence of tree vegetation, extensive use of concrete, urban canyons, parallelepiped-type building geometry, narrow wind corridors, etc. The resulting probability distributions are shown in Figure 12, Figure 13, Figure 14, Figure 15, Figure 16 and Figure 17.
Morning:
For the exterior face measurement period from 11:00 to 12:58, the average number of 0.3 µm particles is 64,707, the average relative humidity is 32.5%, and the average temperature is 34.01 °C. For the interior face measurement period (inner courtyard) from 11:26 to 13:24, the average number of 0.3 µm particles is 66,307, the average relative humidity is 44.4%, and the average temperature is 25.3 °C. The heavy-tail probability for extreme events was calculated separately for each period.
The elevated relative humidity observed in case (b) favors the atmospheric persistence of 0.3 µm SPs. This is supported by Figure 13, which indicates that the higher temperature in case (a) contributes to a reduction in the concentration of 0.3 µm particles.
Noon:
For the exterior face measurement period from 13:36 to 15:34, the average number of 0.3 µm particles is 62,237, the average relative humidity is 40.0%, and the average temperature is 28.2 °C.
For the interior face measurement period from 14:12 to 16:10, the average number of 0.3 µm particles is 50,793, the average relative humidity is 26.5%, and the average temperature is 37.2 °C.
The heavy-tail probability for extreme events was calculated separately for each period:
In this time interval, as shown in the figures below, the record of 0.3 µm SPs and the relative humidity on the exterior (Figure 14a) indicate a higher probability of persistence of SPs, which is the opposite for the interior face of the building (Figure 14b). This is further confirmed by Figure 15a, which shows that the amount of SPs has a higher probability of persistence for the same range of the ratio X/z.
Afternoon:
For the measurement period on the exterior side from 16:43 to 18:42, the average value of the number of 0.3 µm particles is 24,135, the average relative humidity is 39.0%, and the average temperature is 27.8 °C.
For the measurement period on the interior side from 16:53 to 18:51, the average number of 0.3 µm particles is 22,670, the average relative humidity is 29.8%, and the average temperature is 33.0 °C.
The heavy-tailed probability for extreme events is calculated for each period, as shown in Figure 16.
In the evening hours, as indicated by the previous figures, the record of SPs of 0.3 µm and the relative humidity on the exterior side (Figure 16a) show a higher probability of SP sustainability, whereas the opposite occurs on the interior side of the building (Figure 16b). This is corroborated by Figure 17a, which shows that the number of SPs has a higher probability of sustainability within lower temperature ranges. Figure 17b indicates that very low temperature ranges, when combined with low relative humidity, lead to a decrease in the probability of SP sustainability.
The application of heavy-tail probability techniques to extreme events suggests that urban meteorological conditions provide a sustaining framework for SPs. The observed upward trend in SP concentration, coupled with the persistence afforded by urban micrometeorology, indicates a shift toward extreme environmental conditions. This evolution presents significant challenges for mitigation, as the scale and complexity of required control measures could have far-reaching impacts across human activities.

4. Discussion

In Chile, the current primary standard for respirable particulate matter PM10 is Supreme Decree No. 12/2022 [48] of the Ministry of the Environment, which, as stated, refers to coarse particulate matter (greater than 2.5 µm). The WHO (World Health Organization) does not have a specific definition for submicron particles, but the scientific community generally defines them within a restricted range from 0.01 to 1 µm. These particles are significant because their small size allows them to penetrate deep into the respiratory system, and they can be long-range transported in the atmosphere. There are no WHO regulations as rigorous as those for PM2.5 and PM10 for SPs, despite the growing number of studies warning of the greater risk that this range represents to human health.
An average human respiratory cycle includes inhalation (air entering the lungs) and exhalation (air leaving the lungs). Under normal conditions (low activity), the duration of one respiratory cycle is 4 s (s), consisting of approximately 1.5 s for inhalation and 2.5 s for exhalation.
Considering the measurements on the exterior face of the studied building, on 13 March 2025, during the hours 10:52 to 12:52 (100 min of measurements), and focusing on the morning period—when the highest average number of 0.3 µm SPs was observed—we have: 100 min = 6000 s, which corresponds to 1500 full inhalation-exhalation cycles. This implies 2250 s of inhalation, equivalent to 37.5 min.
Today, what reaches the lungs can be directly related to what a sensor measures, specifically in the context of pulmonary function testing and respiratory monitoring. Sensors can detect various parameters related to inhaled and exhaled air, as well as the state of the lung tissue itself, and these measurements can be used to assess lung health [49,50,51].
If the average number of 0.3 µm particles per minute is 57,357.27 particles/min, then, an approximate accumulated average of 2,150,898 particles would be inhaled over the 37.5 min—an enormous number of particles, whose size makes exhalation nearly impossible. The total accumulated count of particles, in very approximate form and under very favorable conditions, over the 100 min period is 5,735,727 particles, with a maximum of 75,852 and a minimum of 31,363.
During the measurement process, the instrument’s alarm was triggered several times, signaling that the particle count exceeded the normative threshold (Appendix C, Figure A14).
This investigation, despite covering a relatively short period, confirms the magnitude of SP presence in areas of high urban density with poor ventilation, and its high persistence in the morning hours. If we assume that the induced processes are of an irreversible and extreme nature, the heavy-tail probability model [45] provides plausible confirmation.
If we accept the strong Spearman correlation between coarse particulate matter and SPs, it becomes possible to extend properties of coarse particulate matter [19,20]—such as entropy, entropic forces, entropic surfaces, strong entropic interaction between particulate matter and urban meteorology, and geomorphology-dependent anomalous diffusion—to SPs as well.
It is worth highlighting that coarse particulate matter exhibits anomalous sub diffusion behavior with α < 1 [20] in basins, implying its settling and persistence in the geographic basin. The health effects of fine particulate matter on the population have been the subject of numerous studies [52,53,54,55,56]. It is necessary to carry out extended and intensive studies on the range of dimensions that involve SPs [57,58,59,60].
Considering that the area selected for these measurements is located within a geomorphological basin, and that the specific measurement site lies in the central part of the basin—characterized by high-rise buildings, urban planning that promotes poor ventilation, low tree cover, narrow and deep urban canyons, narrow streets, high population density, heavy vehicular flow, and intensive use of high-albedo concrete in construction, along with commercial spaces acting as attractors of human presence and interaction, which becomes even more complex under pandemic conditions, it is highly likely that many diseases may be exacerbated in such an artificial environment that favors the persistence of fine particulate matter and SPs, as suggested by the measurements carried out.
This research focused on short-term measurements, given the numerous studies demonstrating the serious consequences of environments with high concentrations of fine particles, now including SPs, on human health. This demonstrates that a combination of urban density, relative humidity, and temperature helps maintain, for a short period, the number of fine particulate matter and SPs at ground level (a level where 100% of the population travels, and, moreover, during a very dry summer period, optimal for facilitating measurements). Studies conducted during other seasonal periods, especially autumn and winter, may demonstrate mitigation of the health effects for the population, but would confirm the risks predicted by the summer records.

5. Conclusions

The analysis of the data obtained from the measurements confirms a very high presence of fine particulate matter during the summer period. The number of SPs is significantly higher in the morning hours. The representations in the figures of the variation in the number of SPs throughout the morning, midday, and afternoon indicate that relative humidity plays a key role during the morning, either increasing or maintaining the number of SPs, particularly the 0.3 µm particles. These results confirm the objectives set out in this study.
In summary, the following can be stated:
  • The behavior of SPs around 0.3 µm supports the hypothesis of an extreme condition environment, as its predictability aligns with a heavy-tail probability distribution.
  • Urban micrometeorology (at heights below 20 m), characterized by relative humidity and temperature, when exposed to strong thermal stress (urban heat islands, heat waves, and urban canyons), enhances the relevance of the heavy-tail probability model, which reflects the persistence of SPs and fine particulate matter.
  • The upper floors of tall buildings (such as those located 12 m above ground level) are not immune to the effects of concentration and persistence of SPs and fine particulate matter.
  • There are periods of the day (morning, midday, late afternoon–evening) during which the behavior of particulate matter shows similar heavy-tail probabilities across measurement intervals—regardless of whether the location is inside or outside a building. In this study, the morning period exhibited such behavior.
  • The behavioral model described, based on data collected during the summer period, was consistent across all measurements taken over a span of four weeks.
  • The behavior and properties of coarse particulate matter can, as a first approximation, be extended to fine particulate matter.
  • A highly densified urban environment significantly favors the presence (in both number and concentration) of SPs and fine particulate matter, substantially increasing the probability of severe health impacts on the population.

Author Contributions

Conceptualization, P.P.H.; methodology, P.P.H., E.M.G. and G.N.A.; software, P.P.H., E.M.G. and G.N.A.; validation, P.P.H., E.M.G., G.N.A., J.W.C. and S.P.P.; formal analysis, P.P.H.; investigation, P.P.H.; resources, P.P.H., E.M.G., G.N.A., J.W.C. and S.P.P.; data curation, P.P.H., E.M.G., G.N.A. and S.P.P.; writing—original draft preparation, P.P.H. and J.W.C.; writing—review and editing, P.P.H. and J.W.C.; visualization, P.P.H. and E.M.G.; supervision, P.P.H.; project administration, P.P.H.; funding acquisition, P.P.H., E.M.G. and G.N.A. All authors have read and agreed to the published version of the manuscript.

Funding

Project supported by the Competition for Research Regular Projects, year 2024, code LPR23-15, Universidad Tecnológica Metropolitana. This research received no external funding.

Institutional Review Board Statement

Not applicable.

Informed Consent Statement

Not applicable.

Data Availability Statement

Research Laboratory on Environment and Learning (RLEL), Underground Building M1, Universidad Tecnológica Metropolitana. https://www.researchgate.net/lab/Research-Laboratory-on-Environment-and-Learning-RLEL-Patricio-Pacheco (accessed on 4 June 2025). http://dx.doi.org/10.13140/RG.2.2.27313.70247. http://dx.doi.org/10.13140/RG.2.2.18925.09444.

Acknowledgments

To Felipe Igor Flores Valdebenito, Industry 4.0 Laboratory, Faculty of Engineering, University of San Sebastián, Bellavista 7 Campus, Santiago 8420000, Chile; felipe.flores@uss.cl. To Diana Donoso Pineda, Director of Environment and Operations, San Pablo 5959, IM Lo Prado, Santiago, Chile, ddonoso@loprado.cl To Rodrigo Vásquez, Environment, Department of Environment and Operations, San Pablo 5959, IM Lo Prado, Santiago, Chile, rvazquez@loprado.cl. The authors gratefully acknowledge the Direction for Research that funded this study through Project LPR23-15 and the Department of Physics, both part of Universidad Tecnológica Metropolitana.

Conflicts of Interest

The authors declare no conflicts of interest.

Appendix A

The flowchart shows, Figure A1, the procedure that allows us to conclude that a time series is chaotic. It considers that Lyapunov exponent λ > 0, Correlation dimension DC < 5, Kolmogorov entropy SK > 0, Hurst exponent H must be in the range 0.5 < H < 1.0, and Lempel–Ziv complexity LZ > 0.
Figure A1. Flowchart representing the process followed to declare a chaotic time series.
Atmosphere 16 01044 g0a1

Appendix B

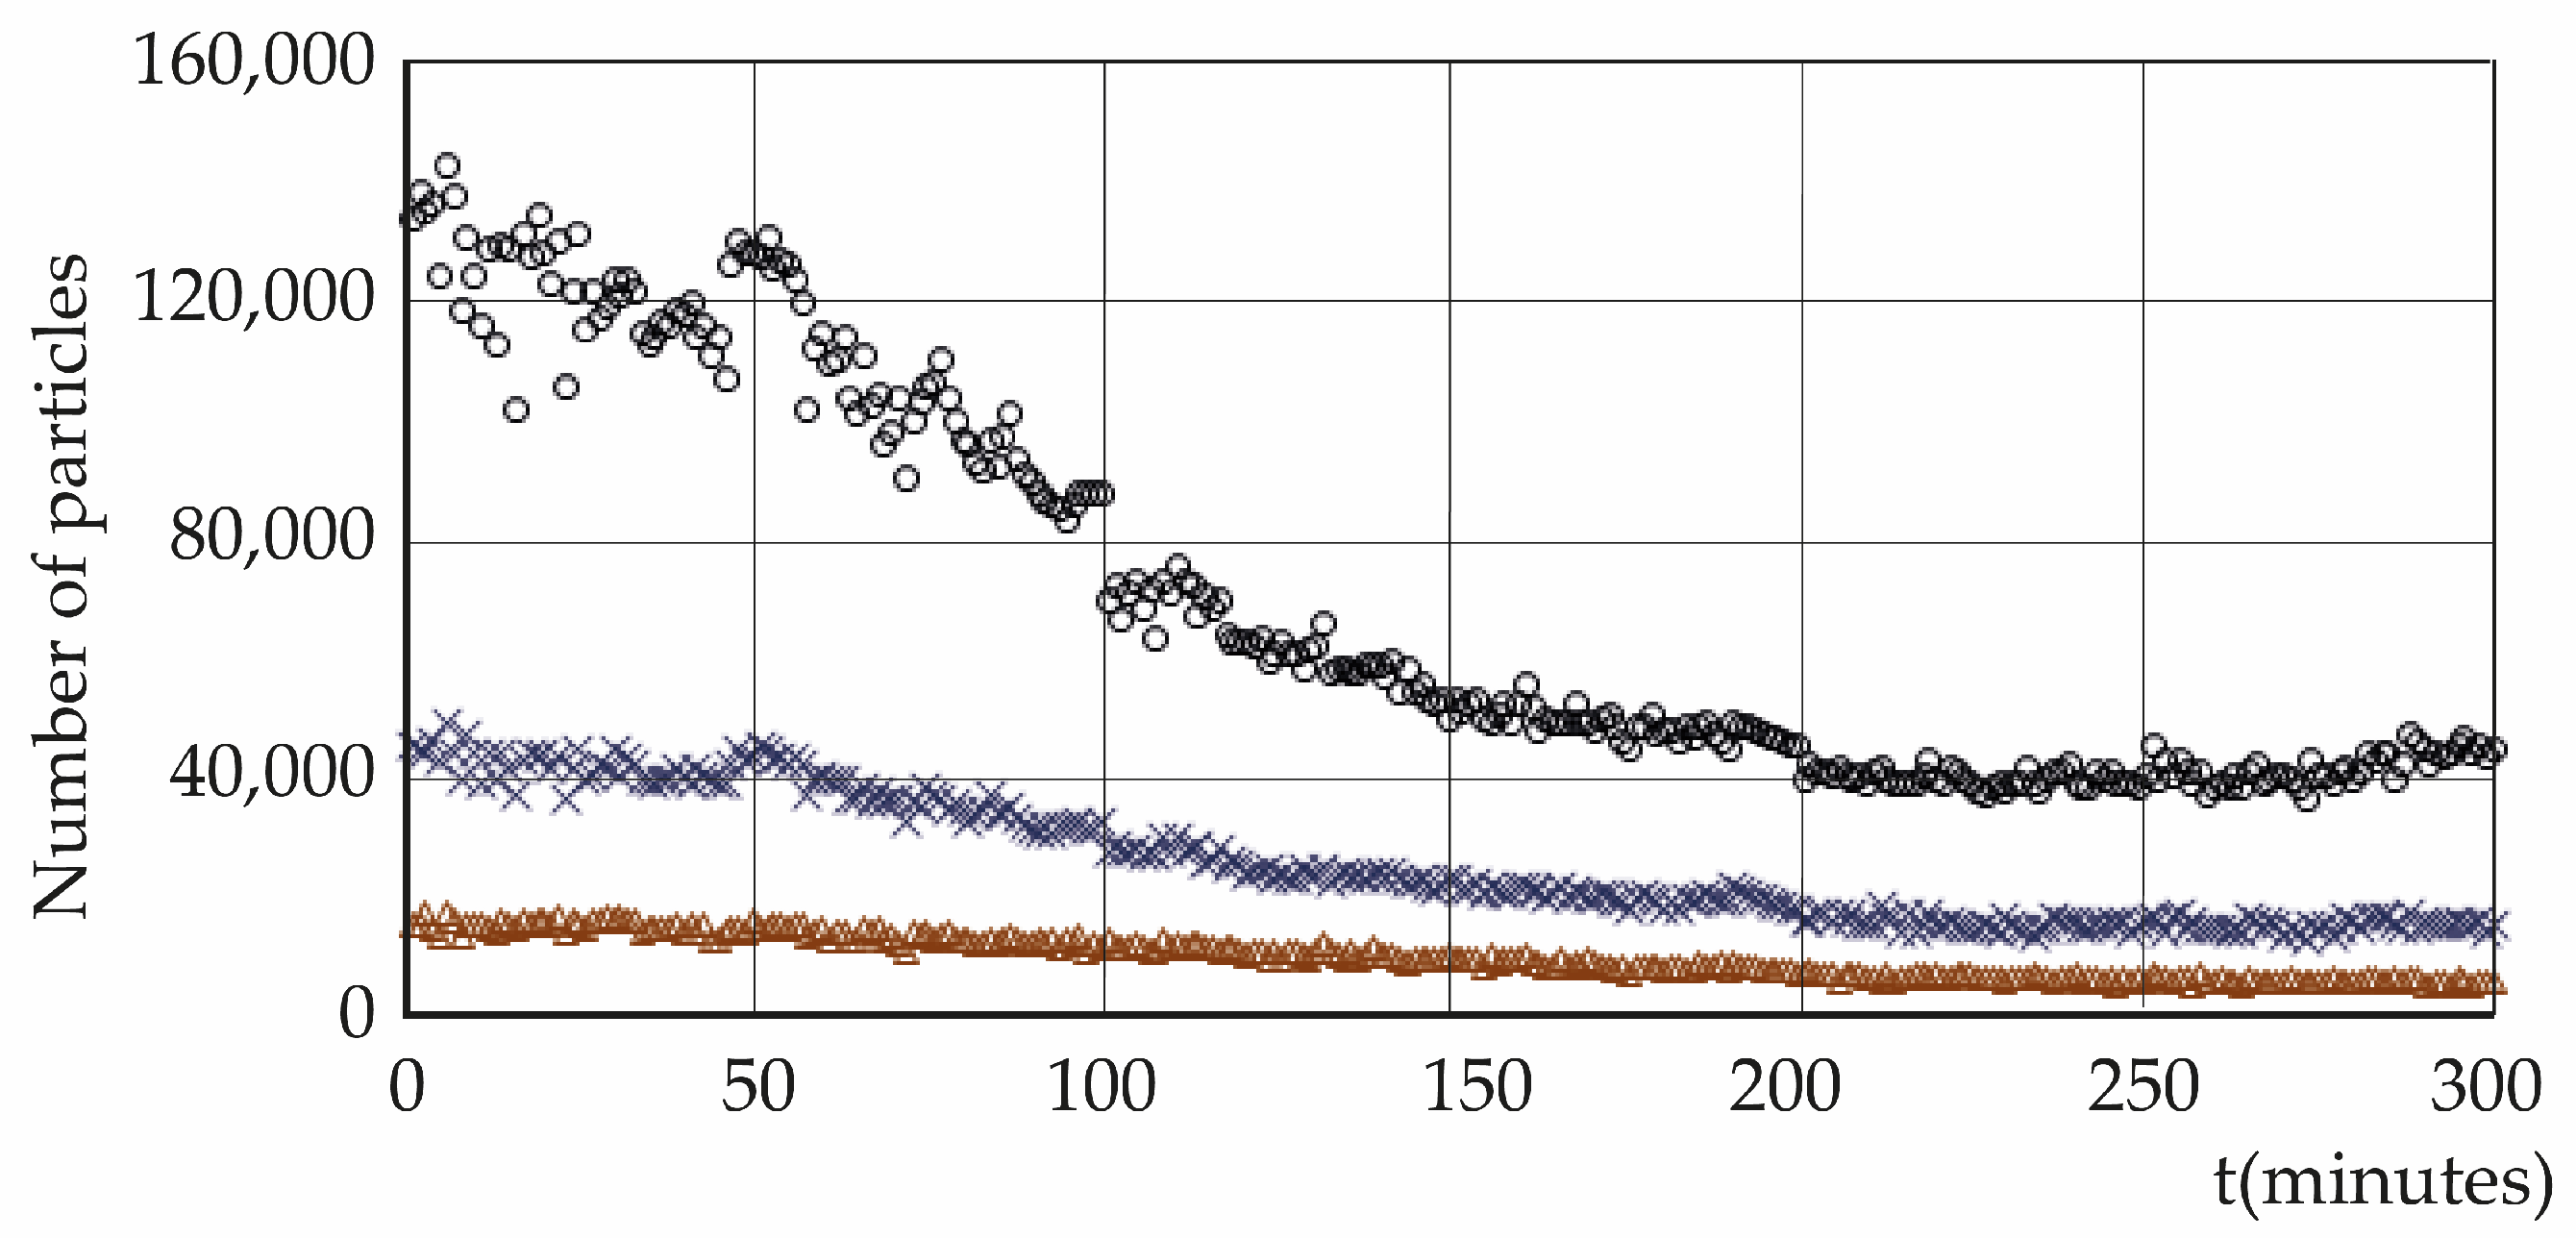
The figures below show the evolution of the number of 0.3 µm particles during a month of the summer season of 2025 (March).
Outer face
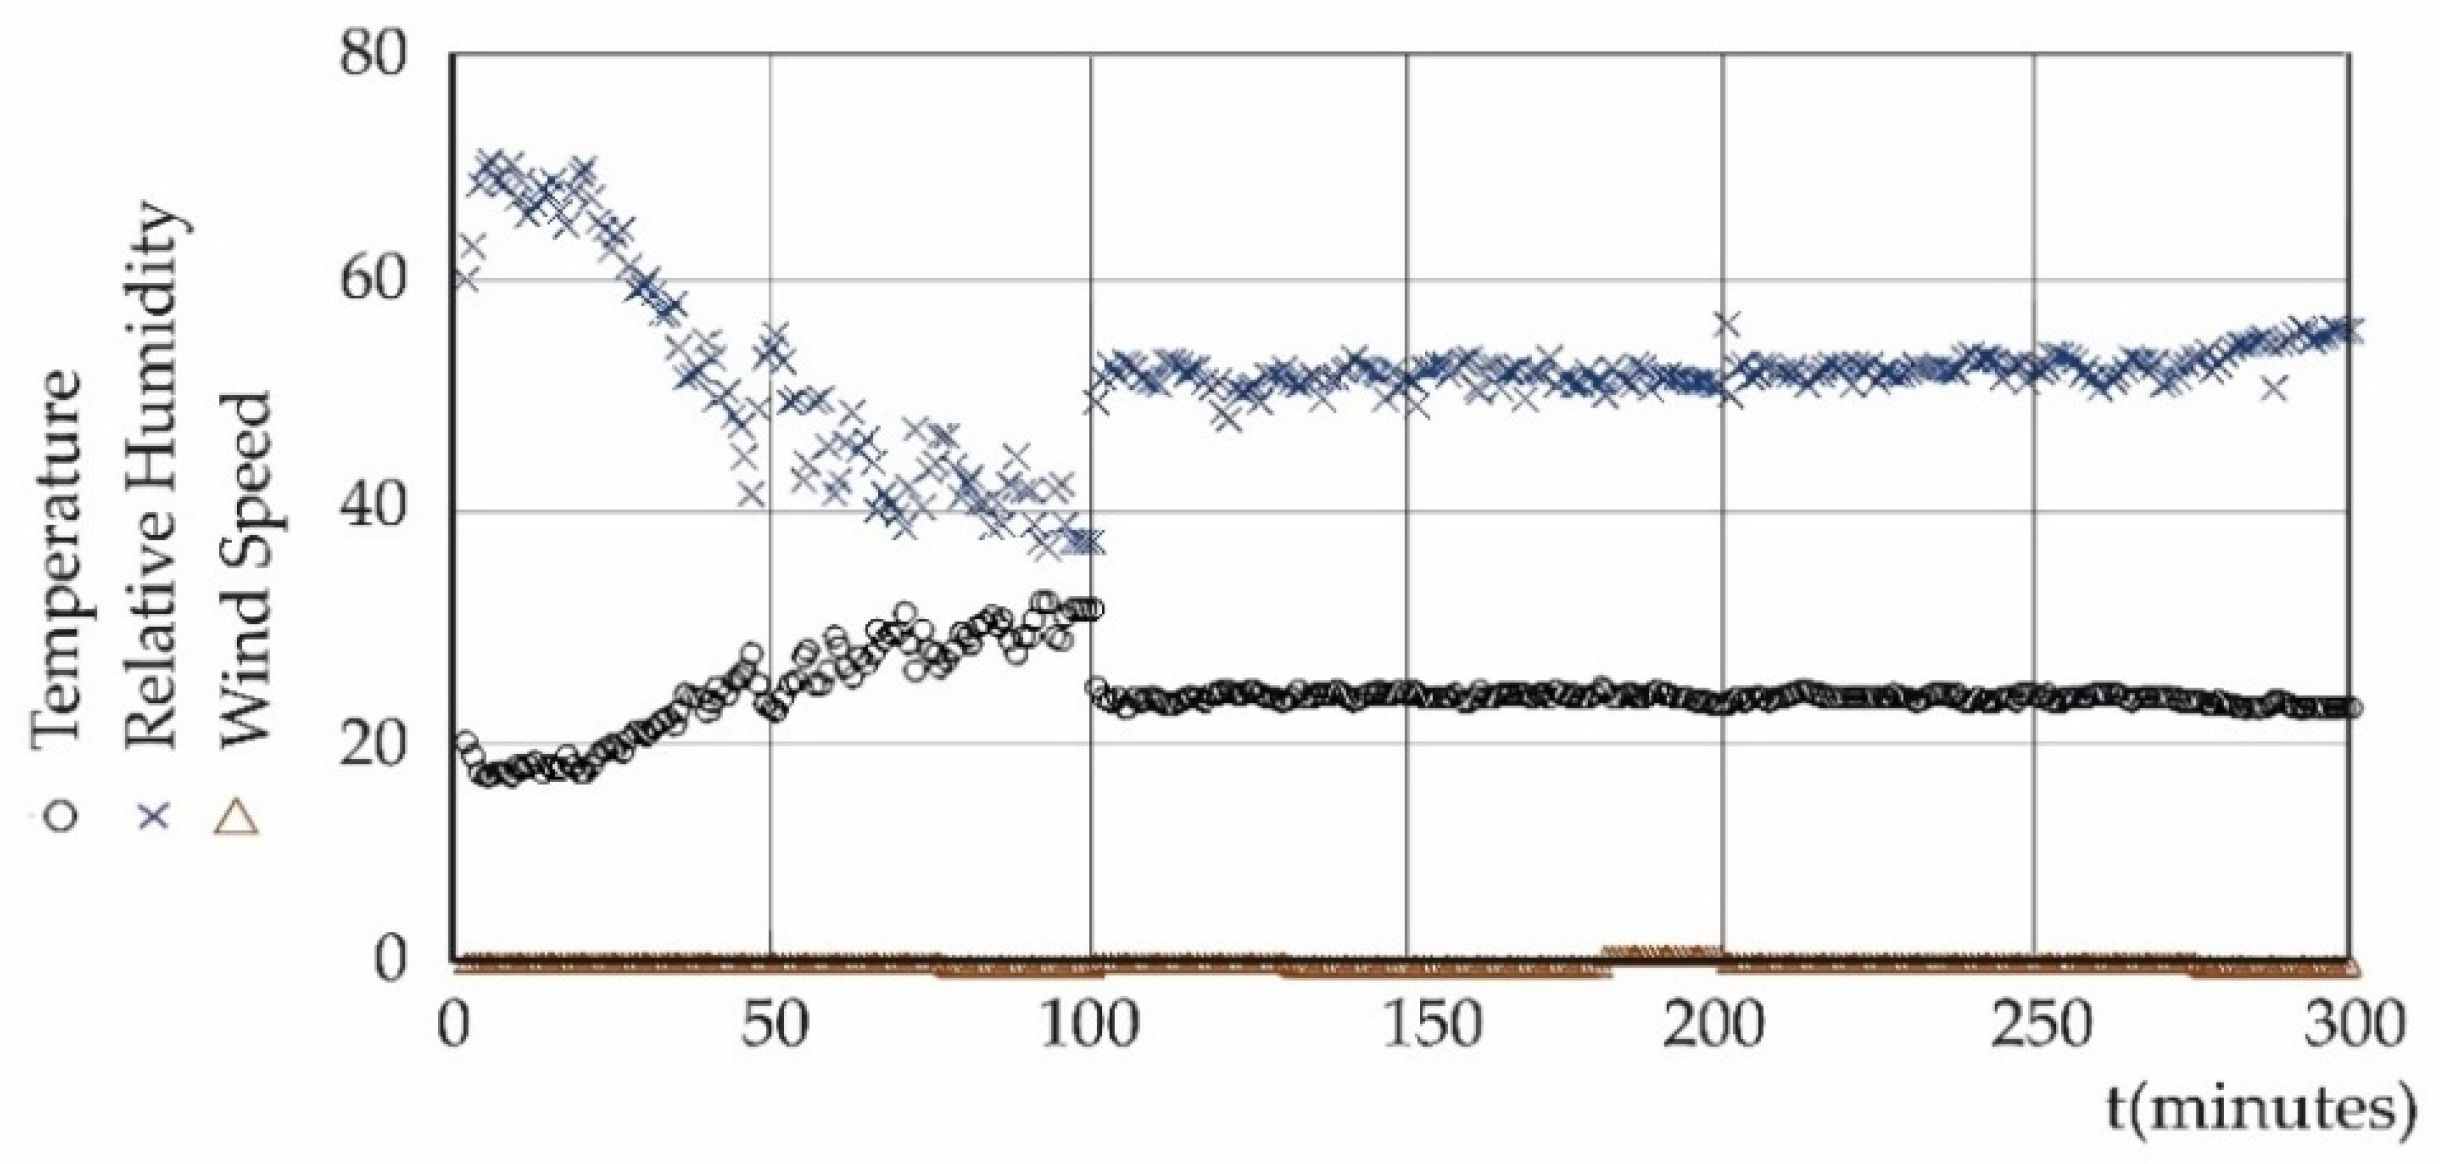
Figure A2 and Figure A3 correspond to the evolution of submicron particles and urban meteorological variables in the morning (10:27/12:28), noon (13:21/15:22), and after-noon (16:30/18:28) on 14 March 2025.
Figure A2. The figure represents the behavior of submicron material in the morning, midday, and afternoon, according to the symbolic notation: o: 0.3 µm; x: 0.5 µm; Δ: 1.0 µm.
Atmosphere 16 01044 g0a2
Micrometeorology outer face
Figure A3. o: temperature; x: RH: relative humidity; Δ: wind speed. The speed, temperature, and relative humidity scales are sized for comparative purposes.
Atmosphere 16 01044 g0a3
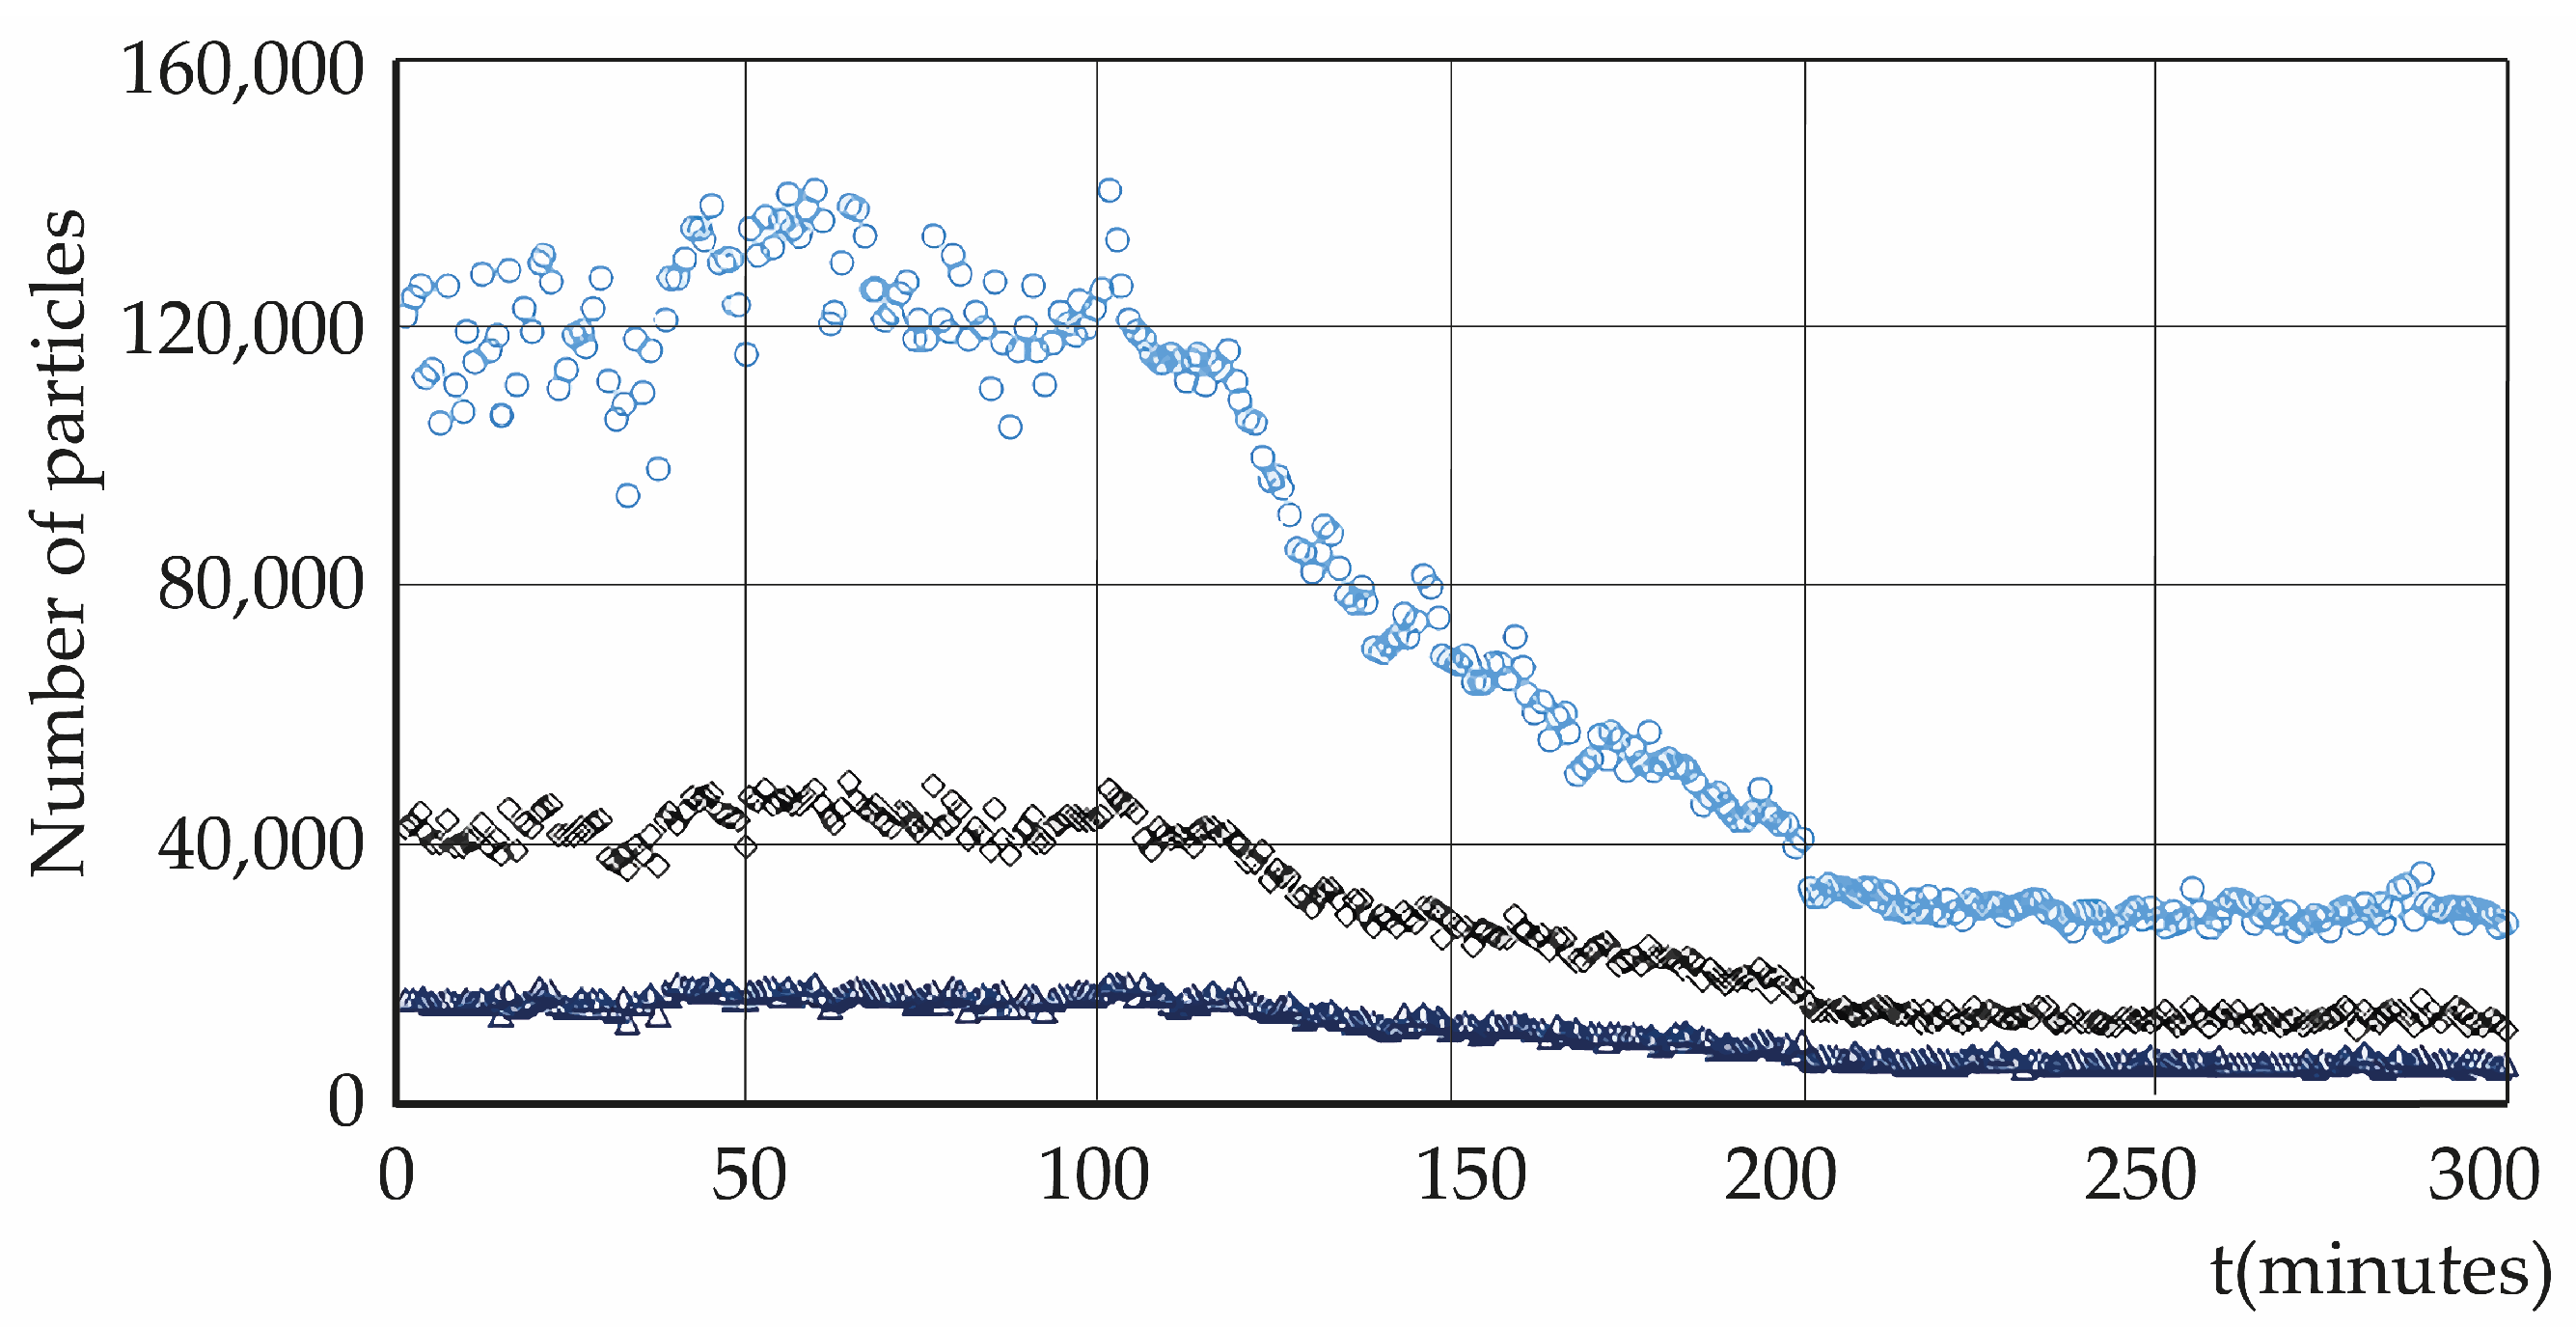
Figure A4 and Figure A5 correspond to the evolution of submicron particles and urban meteorological variables in the morning (11:05/13:04), noon (13:33/15:31), and after-noon (16:49/18:47) on 20 March 2025.
Figure A4. The figure represents the behavior of submicron material in the morning, midday, and afternoon, according to the symbolic notation: o: 0.3 µm; ◊: 0.5 µm; Δ: 1.0 µm.
Atmosphere 16 01044 g0a4
Micrometeorology outer face
Figure A5. o: temperature; x: RH: relative humidity; +: wind speed. The speed, temperature, and relative humidity scales are sized for comparative purposes.
Atmosphere 16 01044 g0a5
Figure A6 and Figure A7 correspond to the evolution of submicron particles and urban meteorological variables in the morning (11:00/12:58), noon (13:36/15:34), and after-noon (16:43/18:42) on 21 March 2025.
Figure A6. The figure represents the behavior of submicron material in the morning, midday, and afternoon, according to the symbolic notation: x: 0.3 µm; Δ: 0.5 µm; +: 1.0 µm.
Atmosphere 16 01044 g0a6
Micrometeorology outer face
Figure A7. Δ: T = temperature; x: RH = relative humidity; +: WS = wind speed. The speed, temperature, and relative humidity scales are sized for comparative purposes.
Atmosphere 16 01044 g0a7
Inner face
Figure A8 and Figure A9 correspond to the evolution of submicron particles and urban meteorological variables in the morning (11:02/13:01), noon (13:26/15:10), and after-noon (16:35/18:34) on 14 March 2025.
Figure A8. o: The figure represents the behavior of submicron material in the morning, midday, and afternoon, according to the symbolic notation: 0.3 µm; x: 0.5 µm; ◊: 1.0 µm.
Atmosphere 16 01044 g0a8
Micrometeorology inner face
Figure A9. o: T = temperature; x: RH = relative humidity; Δ: WS = wind speed. The speed, temperature, and relative humidity scales are sized for comparative purposes.
Atmosphere 16 01044 g0a9
Figure A10 and Figure A11 correspond to the evolution of submicron particles and urban meteorological variables in the morning (11:32/13:31), noon (14:01/16:00), and after-noon (16:59/18:57) on 20 March 2025.
Figure A10. The figure represents the behavior of submicron material in the morning, midday, and afternoon, according to the symbolic notation: o: 0.3 µm; x: 0.5 µm; ◊: 1.0 µm.
Atmosphere 16 01044 g0a10
Micro meteorology inner face
Figure A11. o: T = temperature; x: RH = relative humidity; +: WS = wind speed. The speed, temperature, and relative humidity scales are sized for comparative purposes.
Atmosphere 16 01044 g0a11
Figure A12 and Figure A13 correspond to the evolution of submicron particles and urban meteorological variables in the morning (11:26/13:24), noon (14:12/16:10), and after-noon (16:53/18:51) on 21 March 2025.
Figure A12. The figure represents the behavior of submicron material in the morning, midday, and afternoon, according to the symbolic notation: x: 0.3 µm; ◊: 0.5 µm; +: 1.0 µm.
Atmosphere 16 01044 g0a12
Figure A13. ◊ = temperature; x: RH = relative humidity; +: WS = wind speed. The speed, temperature, and relative humidity scales are sized for comparative purposes.
Atmosphere 16 01044 g0a13

Appendix C

Measurements of particle count, particle size, temperature, and humidity were conducted using the PCE-PCO 2 sensor and Weather station, as described in Figure A14 and Figure A15, respectively.
Figure A14. Particle counter with stand PCE-PCO2 capable of measuring six different particle sizes: 0.3/0.5/1.0/2.5/5.0 and 10 µm. Operates with an airflow rate of 2.83 L/min. Coincidence loss error: <2,000,000 particles/ft3. Description: 1. Display, 2. Function keys, 3. Up arrow key, 4. Enter key, 5. Start/stop key, 6. ESC key, 7. Down arrow key, 8. Power on/off key, 9. Particle sensor, 10. Temperature/humidity sensor, 11. Camera sensor, 12. USB interface, 13. AC/DC connection, 14. Battery compartment. Alarm: Particle number limit alarm for each channel according to ISO 14644 [61], Table A1.
Atmosphere 16 01044 g0a14
Table A1. Indicates the measurement ranges, according to the diameter of the particulate matter, that the instrument performs. The color scale, from green to red, indicates the number of particles considered a risk to human health.
ChanelGreenYellowRed
0.3 µm0–100,000100,001–250,000250,001–500,000
0.5 µm0–35,20032,501–87,50087,501–175,000
1.0 µm0–83208321–20,80020,801–41,600
2.5 µm0–545546–13621363–2724
5.0 µm0–193194–483484–966
10.0 µm0–6869–170170–340
Figure A15. Weather station and data display touch screen. Description: 1. Wind speed sensor, 2. Wind vane, 3. Temperature and humidity sensor, 4. Rain collector, 5. Spirit level, 6. Solar panel, 7. Antenna, 8. U-bolt, 9. Battery compartment, 10. Reset button, and 11. LED indicator: Light on for 4 s at startup.
Atmosphere 16 01044 g0a15

References

  1. Dominski, F.H.; Lorenzetti Branco, J.H.; Buonanno, G.; Stabile, L.; Gameiro da Silva, M.; Andrade, A. Effects of air pollution on health: A mapping review of systematic reviews and meta-analyses. Environ. Res. 2021, 201, 111487. [Google Scholar] [CrossRef]
  2. Li, B.; Ma, Y.; Zhou, Y.; Chai, E. Research progress of different components of PM2.5 and ischemic stroke. Sci. Rep. 2023, 13, 15965. [Google Scholar] [CrossRef] [PubMed]
  3. Lim, E.Y.; Kim, G.-D. Particulate Matter-Induced Emerging Health Effects Associated with Oxidative Stress and Inflammation. Antioxidants 2024, 13, 1256. [Google Scholar] [CrossRef] [PubMed]
  4. Li, W.; Ito, A.; Wang, G.; Zhi, M.; Xu, L.; Yuan, Q.; Zhang, J.; Liu, L.; Wu, F.; Laskin, A.; et al. Aqueous-phase secondary organic aerosol formation on mineral dust. Natl. Sci. Rev. 2025, 12, nwaf221. [Google Scholar] [CrossRef] [PubMed]
  5. Zender-Świercz, E.; Galiszewska, B.; Telejko, M.; Starzomska, M. The effect of temperature and humidity of air on the concentration of particulate matter—PM2.5 and PM10. Atmos. Res. 2024, 312, 107733. [Google Scholar] [CrossRef]
  6. Vaishali; Verma, G.; Das, R.M. Influence of Temperature and Relative Humidity on PM2.5 Concentration over Delhi. MAPAN 2023, 38, 759–769. [Google Scholar] [CrossRef]
  7. Chen, C.-C.; Wang, Y.-R.; Liu, J.-S.; Chang, H.-Y.; Chen, P.C. Associations between long-term ambient PM2.5 exposure and the incidence of cardiopulmonary diseases and diabetes, attributable years lived with disability, and policy implication. Ecotoxicol. Environ. Saf. 2024, 282, 116688. [Google Scholar] [CrossRef]
  8. Wang, M.; Kim, R.Y.; Kohonen-Corish, M.R.J.; Chen, H.; Donovan, C.; Oliver, B.G. Particulate matter air pollution as a cause of lung cancer: Epidemiological and experimental evidence. Br. J. Cancer 2025, 132, 986–996. [Google Scholar] [CrossRef]
  9. Mauree, D.; Coccolo, S.; Deschamps, L.; Loesch, P.; Becquelin, P.; Scartezzini, J.L. Mobile Urban Micrometeorological Monitoring (MUMiM). J. Phys. Conf. Ser. 2019, 1343, 012014. [Google Scholar] [CrossRef]
  10. Foken, T. Micrometeorology; Springer: Berlin/Heidelberg, Germany, 2008. [Google Scholar]
  11. Stull, R.B. Introduction to Boundary Layer Meteorology; Kluwer Academic: Dordrecht, The Netherlands, 1988; p. 666. [Google Scholar]
  12. Klausner, Z.; Ben-Efraim, M.; Arav, Y.; Tas, E.; Fattal, E. The Micrometeorology of the Haifa Bay Area and Mount Carmel during the summer. Atmosphere 2021, 12, 354. [Google Scholar] [CrossRef]
  13. Landsberg, H.E. Micrometeorological temperature differentiation through urbanization. In Urban Climates; Technical Note, No. 108; World Meteorological Organization: Geneva, Switzerland, 1970; pp. 129–136. [Google Scholar]
  14. Landsberg, H.E.; Maisel, T.N. Micrometeorological observations in an area of urban growth. Bound.-Layer. Meteorol. 1972, 2, 365–370. [Google Scholar] [CrossRef]
  15. Pacheco, P.; Mera, E.; Salini, G. Urban Densification Effect on Micrometeorology in Santiago, Chile: A Comparative Study Based on Chaos Theory. Sustainability 2022, 14, 2845. [Google Scholar] [CrossRef]
  16. Pacheco, P.; Mera, E.; Navarro, G.; Polo, S. Interaction Between Maximum Entropies of Urban Meteorology and Pollutants: Effects on Relative Humidity and Temperature in the Boundary Layer of a Basin Geomorphology. Atmosphere 2025, 16, 337. [Google Scholar] [CrossRef]
  17. Sprott, J.C. Chaos and Time-Series Analysis, 1st ed.; Oxford University Press: Oxford, UK, 2003. [Google Scholar]
  18. Sprott, J.C. Chaos Data Analyzer Software. 1995. Available online: http://sprott.physics.wisc.edu/cda.htm (accessed on 29 May 2025).
  19. Pacheco Hernández, P.; Mera Garrido, E.; Navarro Ahumada, G. Fractal Dimension Time Series and Interaction Between Entropic Surfaces of Urban Meteorology and Pollutants in a Geographic Basin: Dynamic Effects, Thermal Flows and Anomalous Diffusion. Fractal Fract. 2025, 9, 114. [Google Scholar] [CrossRef]
  20. Pacheco, P.; Mera, E.; Navarro, G.; Parodi, C. Urban Meteorology, Pollutants, Geomorphology, Fractality, and Anomalous Diffusion. Fractal Fract. 2024, 8, 204. [Google Scholar] [CrossRef]
  21. Wan Mahiyuddin, W.R.; Ismail, R.; Mohammad Sham, N.; Ahmad, N.I.; Nik Hassan, N.M.N. Cardiovascular and Respiratory Health Effects of Fine Particulate Matters (PM2.5): A Review on Time Series Studies. Atmosphere 2023, 14, 856. [Google Scholar] [CrossRef]
  22. Chauhan, B.V.S.; Corada, K.; Young, C.; Smallbone, K.L.; Wyche, K.P. Review on Sampling Methods and Health Impacts of Fine (PM2.5, ≤2.5 µm) and Ultrafine (UFP, PM0.1, ≤0.1 µm) Particles. Atmosphere 2024, 15, 572. [Google Scholar] [CrossRef]
  23. Pacheco, P.; Mera, E.; Navarro, G. The Effects of Lockdown, Urban Meteorology, Pollutants, and Anomalous Diffusion on the SARS-CoV-2 Pandemic in Santiago de Chile. Atmosphere 2024, 15, 414. [Google Scholar] [CrossRef]
  24. Pacheco, P.; Mera, E. Study of the Effect of Urban Densification and Micrometeorology on the Sustainability of a Coronavirus-Type Pandemic. Atmosphere 2022, 13, 1073. [Google Scholar] [CrossRef]
  25. Zeng, X.; Tao, W.-K.; Simpson, J. An Equation for Moist Entropy in a Precipitating and Icy Atmosphere. J. Atmos. Sci. 2005, 62, 4293–4309. [Google Scholar] [CrossRef]
  26. Pikeroen, Q.; Paillard, D.; Watrin, K. A radiative–convective model computing precipitation with the maximum entropy production hypothesis. Geosci. Model. Dev. 2024, 17, 3801–3814. [Google Scholar] [CrossRef]
  27. Li, J.; Chylek, P. Atmospheric Entropy. Part I: Climate Dissipation Structure. J. Clim. 2012, 25, 3173–3190. [Google Scholar] [CrossRef]
  28. Kleidon, A. Entropy Production by Evapotranspiration and its Geographic Variation. Soil. Water Res. 2008, 3, S89–S94. [Google Scholar] [CrossRef]
  29. Alahmer, A.; Omar, M.A.; Mayyas, A.; Dongri, S. Effect of relative humidity and temperature control on in-cabin thermal comfort state: Thermodynamic and psychometric analyses. Appl. Therm. Eng. 2011, 31, 2636–2644. [Google Scholar] [CrossRef]
  30. Boregowda, S.C.; Choate, R.E.; Handy, R. Entropy Generation Analysis of Human Thermal Stress Responses. Int. Sch. Res. Netw. ISRN Thermodyn. 2012, 2012, 830103. [Google Scholar] [CrossRef]
  31. Mendoza, V.; Pazos, M.; Garduño, R.; Mendoza, B. Thermodynamics of climate change between cloud cover, atmospheric temperature and humidity. Sci. Rep. 2021, 11, 21244. [Google Scholar] [CrossRef]
  32. London, J.A. Study of the Atmospheric Heat Balance; New York University: New York, NY, USA, 1957. [Google Scholar]
  33. Thompson, V.; Mitchell, D.; Hegerl, G.C.; Collins, M.; Leach, N.J.; Slingo, J.M. The most at-risk regions in the world for high-impact heatwaves. Nat. Commun. 2023, 14, 2152. [Google Scholar] [CrossRef]
  34. Abunyewah, M.; Gajendran, T.; Odei Erdiaw-Kwasie, M.; Baah, C.; Asare Okyere, S.; Kasun Sampath Udage Kankanamge, A. The multidimensional impacts of heatwaves on human ecosystems: A systematic literature review and future research direction. Environ. Sci. Policy 2025, 165, 104024. [Google Scholar] [CrossRef]
  35. Bejan, A. A Study of Entropy Generation in Fundamental Convective Heat Transfer. J. Heat Transfer. 1979, 101, 718–725. [Google Scholar] [CrossRef]
  36. Spearman, C. The Proof and Measurement of Association between Two Things. Am. J. Psychol. 1904, 15, 72–101. [Google Scholar] [CrossRef]
  37. Pearson, K. Notes on regression and inheritance in the case of two parents. Proc. R. Soc. Lond. 1895, 58, 240–242. [Google Scholar] [CrossRef]
  38. Statgraphics Technologies, Inc. STATGRAPHICS Centurion 19 (Release 19) [Statistical Analysis Software]. Available online: https://www.statgraphics.com (accessed on 22 May 2025).
  39. Adhikari, A.; Reponen, T.; Grinshpun, S.A.; Martuzevicius, D.; LeMasters, G. Correlation of ambient inhalable bioaerosols with particulate matter and ozone: A two-year study. Environ. Pollut. 2006, 140, 16e28. [Google Scholar] [CrossRef] [PubMed]
  40. Karimi, B.; Shokrinezhad, B. Spatial variation of ambient PM2.5 and PM10 in the industrial city of Arak, Iran: A land-use regression. Atmos. Pollut. Res. 2021, 12, 101235. [Google Scholar] [CrossRef]
  41. Li, D.; Xiong, J.; Cheng, G. Long-term exposure to ambient PM2.5 and its components on menarche timing among Chinese adolescents: Evidence from a representative nationwide cohort. BMC Public. Health 2024, 24, 707. [Google Scholar] [CrossRef]
  42. Reyna-Carranza, M.A.; Moreno-Flores, A.P.; López-Avitia, R. Acute respiratory infections and its Spearman correlation with meteorological and air pollutants data from Mexicali, BC, Mexico. In Proceedings of the Pan American Health Care Exchanges, Lima, Peru, 15–19 March 2010; p. 17. [Google Scholar] [CrossRef]
  43. Ni, W.; Stafoggia, M.; Zhang, S.; Ljungman, P.; Breitner, S.; de Bont, J.; Jernberg, T.; Atar, D.; Schneider, A.; Agewall, S. Short-term exposure to ambient temperature variability and myocardial infarction hospital admissions: A nationwide case-crossover study in Sweden. PLoS Med. 2025, 22, e1004607. [Google Scholar] [CrossRef]
  44. Fisher, R.A.; Tippett, L.H.C. Limiting forms of the frequency distribution of the largest or smallest member of a sample. Math. Proc. Camb. Philos. Soc. 1928, 24, 180–190. [Google Scholar] [CrossRef]
  45. Fréchet, M. Sur la loi de probabilité de l’écart maximum [On the probability distribution of the maximum deviation]. Ann. Pol. Math. 1927, 6, 93. [Google Scholar]
  46. Nair, J.; Wierman, A.; Zwart, B. The Fundamentals of Heavy Tails: Properties, Emergence, and Estimation; Cambridge Series in Statistical and Probabilistic Mathematics; Cambridge University Press: Cambridge, UK, 2022; pp. 240–248. [Google Scholar]
  47. Eliazar, I.; Klafter, J. Fractal probability laws. Phys. Rew. 2008, E77, 061125. [Google Scholar] [CrossRef] [PubMed]
  48. Decreto Supremo N° 12 del Ministerio del Medio Ambiente de Chile. Establishes Primary Environmental Quality Standard for Respirable Particulate Matter MP10. Available online: https://www.bcn.cl/leychile/navegar?idNorma=1176988 (accessed on 28 August 2025).
  49. Buszewski, B.; Kesy, M.; Ligor, T.; Amann, A. Human exhaled air analytics: Biomarkers of diseases. Biomed. Chromatogr. 2007, 21, 553–566. [Google Scholar] [CrossRef]
  50. Hashoul, D.; Haick, H. Sensors for detecting pulmonary diseases from exhaled breath. Eur. Respir. Rev. 2019, 28, 190011. [Google Scholar] [CrossRef] [PubMed]
  51. Ponce, M.C.; Sankari, A.; Sharma, S. Pulmonary Function Tests. National Library of Medicine. 2023. Available online: https://www.ncbi.nlm.nih.gov/books/NBK482339/ (accessed on 2 June 2025).
  52. Chen, S.-L.; Chang, S.-W.; Chen, Y.-J.; Chen, H.-L. Possible warming effect of fine particulate matter in the atmosphere. Commun. Earth Environ. 2021, 2, 208. [Google Scholar] [CrossRef]
  53. Xu, R.; Huang, S.; Shi, C.; Wang, R.; Liu, T.; Li, Y.; Zheng, Y.; Lv, Z.; Wei, J.; Sun, H.; et al. Extreme Temperature Events, Fine Particulate Matter, and Myocardial Infarction Mortality. Circulation 2023, 148, 312–323. [Google Scholar] [CrossRef] [PubMed]
  54. Stingone, J.A.; Luben, T.J.; Sheridan, S.C.; Langlois, P.H.; Shaw, G.M.; Reefhuis, J.; Romitti, P.A.; Feldkamp, M.L.; Nembhard, W.N.; Browne, M.L.; et al. Associations between fine particulate matter, extreme heat events, and congenital heart defects. Environ. Epidemiol. 2019, 3, e071. [Google Scholar] [CrossRef]
  55. Landguth, E.L.; Knudson, J.; Graham, J.; Orr, A.; Coyle, E.A.; Smith, P.; Semmens, E.O.; Noonan, C. Seasonal extreme temperatures and short-term fine particulate matter increases pediatric respiratory healthcare encounters in a sparsely populated region of the intermountain western United States. Environ. Health 2024, 23, 40. [Google Scholar] [CrossRef] [PubMed]
  56. Ke, L.; Zhang, Y.; Fu, Y.; Shen, X.; Zhang, Y.; Ma, X.; Di, Q. Short-term PM2.5 exposure and cognitive function: Association and neurophysiological mechanisms. Environ. Int. 2022, 170, 107593. [Google Scholar] [CrossRef]
  57. Gao, X.; Wang, P.; Hu, Y.; Cao, Y.; Yuan, W.; Luan, Y.; Quan, C.; Zhou, Z.; Zou, H. Exposure Concentrations and Inhalation Risk of Submicron Particles in a Gasoline Station—A Pilot Study. Sustainability 2023, 15, 9455. [Google Scholar] [CrossRef]
  58. Yu, A.; Lu, J.; Shen, X.; Hu, X.; Zhang, Y.; Liu, Q.; Tong, H.; Liang, L.; Liu, L.; Ma, Q.; et al. Determination of the deposition of urban submicron aerosols in the human respiratory tract considering hygroscopic growth. Atmos. Environ. 2025, 356, 121289. [Google Scholar] [CrossRef]
  59. Li, C.; Martin, R.V.; van Donkelaar, A.; Jimenez, J.L.; Zhang, Q.; Turner, J.R.; Liu, X.; Rowe, M.; Meng, J.; Yu, W.; et al. Estimates of submicron particulate matter (PM1) concentrations for 1998–2022 across the contiguous USA: Leveraging measurements of PM1 with nationwide PM2·5 component data. Lancet Planet. Health 2025, 9, e491–e502. [Google Scholar] [CrossRef]
  60. Moniruzzaman, M.; Hossain, K.; Saha, B.; Parvin, A.; Suchi, P.D.; Gulshan, J.-E.; Nawar, A.; Shahrukh, S.; Alam, S.; Ankhy, R.S.; et al. Multivariate toxicological assessments of inhaled fine-submicron particle-bound metals in school-aged children of Dhaka city. Atmos. Pollut. Res. 2025, 16, 102545. [Google Scholar] [CrossRef]
  61. ISO 14644-1:2015; Cleanrooms and Associated Controlled Environments—Part 1: Classification of Air Cleanliness by Particle Concentration. ISO—International Organization for Standardization: Geneva, Switzerland, 2015. Available online: https://www.iso.org/standard/53394.html (accessed on 29 May 2025).
Figure 1. Location: Almirante Latorre, 423, Santiago (building); (a) outside face; (b) inside face; and (c) map of measurement locations and sampling site Atmosphere 16 01044 i001.
Atmosphere 16 01044 g001
Figure 2. Entropy surface, S ( x , y , z ) which has the maximum entropy of the time series, which can be measurements of urban meteorological variables or of pollutants in different locations. From S ( x , y , z ) we can calculate the entropic force F E N T R O P I C (Equation (3)).
Atmosphere 16 01044 g002
Figure 3. Number of particles in external face vicinity (instrument 1 m from the wall and 8 m above the ground) (x) 0.3 µm, average number of particles: 57,357.27, (Δ) 0.5 µm, and (o) 1.0 µm.
Atmosphere 16 01044 g003
Figure 4. Micrometeorology outer face; (x) temperature, (o) relative humidity, (+) wind speed. Wind speed, temperature, and relative humidity are dimensionless for comparative effects.
Atmosphere 16 01044 g004
Figure 5. Number of particles by size in internal face vicinity (instrument at 1 m from the wall and 8 m above the ground): (Δ) 0.3 µm, (x) 0.5 µm and (o) 1.0 µm.
Atmosphere 16 01044 g005
Figure 6. Micrometeorology in inner face; (x) temperature, (o) relative humidity, (+) wind speed. Wind speed, temperature and relative humidity are dimensionless for comparative effects.
Atmosphere 16 01044 g006
Figure 7. (a) (+) Average ambient temperature in the vicinity of the external face of the building and (o) average ambient temperature in the vicinity of the internal face of the building; and (b) (+) average ambient relative humidity in the vicinity of the external face of the building and (o) average ambient relative humidity in the vicinity of the internal face of the building.
Atmosphere 16 01044 g007
Figure 8. (o) Series for the 2010/2013 period; (x) Series for the 2017/2020 period; (+) Series for the 2019/2022 period. This is consistent with the pre- and pandemic periods.
Atmosphere 16 01044 g008
Figure 9. Representation of the entropic surface due to urban meteorology for the period 2019–2022, with a maximum entropic thickness of 0.076. The red lines represent the main roads that run through the city. The blue lines represent natural water tributaries.
Atmosphere 16 01044 g009
Figure 10. Representation of the entropic surface due to pollutants for the period 2019–2022, with a maximum entropic thickness of 0.187. The red lines represent the main roads that run through the city. The blue lines represent natural water tributaries.
Atmosphere 16 01044 g010
Figure 11. The diagram shows the results of SK, P on SK, MV between 2019 and 2022. The color shades represent a spectrum ranging from green, with a weak impact of pollutants, to intense red, with a greater impact of pollutants. For the aforementioned period, there is continuity, dynamics, and transmission of pollution to new areas. The red color indicates the spread of pollution to areas that have increased urban densification, high-rise construction (EMN, EML), and population growth in a very short period (EMS).
Atmosphere 16 01044 g011
Figure 12. Relative humidity and persistence of SP of 0.3 μm, according to the time of day (a) 11:00/12:58 (out), and (b) 11:26/13:24 (int).
Atmosphere 16 01044 g012
Figure 13. Temperature and persistence of SPs of 0.3 μm during the measurement periods: (a) 11:00/12:58 (outside) and (b) 11:26/13:24 (interior).
Atmosphere 16 01044 g013
Figure 14. Relative humidity and persistence of SPs of 0.3 μm during the measurement periods: (a) 13:36/15:34 (outside) and (b) 14:12/16:10 (interior).
Atmosphere 16 01044 g014
Figure 15. Temperature and persistence of SPs of 0.3 μm during the measurement periods: (a) 13:36/15:34 (outside) and (b) 14:12/16:10 (interior).
Atmosphere 16 01044 g015
Figure 16. Relative humidity and persistence of SPs of 0.3 μm during the measurement periods: (a) 16:43/18:42 (exterior) and (b) 16:53/18:51 (interior).
Atmosphere 16 01044 g016
Figure 17. Temperature and persistence of SPs of 0.3 μm during the measurement periods: (a) 16:43/18:42 (outside) and (b) 16:53/18:51 (interior).
Atmosphere 16 01044 g017
Table 1. (a) Measurements of urban meteorology in the proximity of exterior face of 12 m tall building; and (b) meteorological measurements in the vicinity of the interior face of a 12 m high building (average = av).
(a) OUTSIDE (b) INSIDE
(STATION 3)March (STATION 1)March
HoursDaysTav (°C)RHav (%)Tmax (°C)RHmaxHoursDaysTav (°C)RHav (%)Tmax (°C)RHmax
10:52/12:521333.13630.23939.841.211:16/13:141323.84940.51127.346.7
13:50/15:511329.85434.87730.640.613:37/15:361332.76229.70439.835.8
16:28/18:311327.82335.27729.137.316:29/18:271331.75928.59236.232.5
av30.2733.46 av29.4632.94
10:27/12:281424.28851.56931.870.711:02/13:011419.81560.40422.869.8
13:21/15:221423.61251.62624.453.513:26/15:101426.54544.14436.253.8
16:30/18:281423.33552.9642456.216:35/18:341428.82440.33233.549.8
av23.7552.05 av25.0648.29
11:05/13:042031.7136.77537.451.811:31/13:312023.91549.70826.555.1
13:33/15:312025.91747.1426.951.214:01/16:002032.96334.57942.150
16:49/18:472025.56545.59326.348.416:59/18:572030.3235.52534.341.8
av27.7343.17 av29.0739.94
11:00/12:582134.06432.44643.253.411:26/13:242125.28344.34928.551.8
13:36/15:342128.18239.39929.146.914:12/16:102137.21826.51544.641.7
16:43/18:422127.83838.88428.741.916:53/18:512133.0129.78439.335.9
av30.0336.91 av31.8433.55
Table 2. Progressive increase in temperatures across six different locations from the period 2010–2013 to 2017–2020, and their decline during 2019–2022 due to the reduction in human activity caused by the coronavirus pandemic.
Height (msln)2010/20132017/20202019/2022
784 (EML)15.4016.1216.10
709 (EMM)15.8616.8514.70
520 (EMN)15.3416.1716.05
469 (EM0)16.7716.8015.31
698 (EMS)14.6915.5315.42
485 (EMV)15.7716.8515.50
Table 3. (a) Contains the Spearman analysis for the exterior face of the building, the resulting values are summed in absolute value; (b) shows the Spearman correlation, p-value, summary of summed values in absolute value; (c) contains the Spearman analysis for the exterior face of the building, the resulting values are summed without absolute value; and (d) shows the Spearman correlation, p-value, summary of summed values without absolute value.
(a) + (b)B 0.3 (µm)B 0.5 (µm)B 1 (µm)B 10 (µm)B 2.5 (µm)B 5 (µm)B RH (%)B T(°C)B WS (ms−1)
B 0.3 (µm) 0.97 0.95 0.75 0.93 0.77 0.32 0.43 0.36
p-value 0.000 0.000 0.000 0.000 0.000 0.035 0.141 0.234
B 0.5 (µm) 0.95 0.76 0.93 0.78 0.31 0.41 0.38
p-value 0.000 0.000 0.000 0.000 0.010 0.062 0.076
B 1 (µm) 0.77 0.94 0.78 0.29 0.40 0.39
p-value 0.000 0.000 0.000 0.005 0.030 0.025
B 10 (µm) 0.81 0.80 0.18 0.29 0.24
p-value 0.000 0.000 0.119 0.107 0.226
B 2.5 (µm) 0.81 0.24 0.35 0.36
p-value 0.000 0.004 0.029 0.017
B 5 (µm) 0.24 0.34 0.19
p-value 0.225 0.160 0.014
B RH (%) 0.87 0.27
p-value 0.000 0.036
B T (°C) 0.22
p-value 0.023
WS (ms−1)
p-value
(c) + (d)B 0.3 (µm)B 0.5 (µm)B 1 (µm)B 10 (µm)B 2.5 (µm)B 5 (µm)B RH (%)B T(°C)B WS (ms−1)
B 0.3 (µm) 0.97 0.95 0.75 0.93 0.77 −0.08 0.21 −0.35
p-value 0.000 0.000 0.000 0.000 0.000 0.035 0.141 0.234
B 0.5 (µm) 0.95 0.76 0.93 0.78 −0.10 0.22 −0.35
p-value 0.000 0.000 0.000 0.000 0.010 0.062 0.076
B 1 (µm) 0.77 0.94 0.78 −0.09 0.22 −0.34
p-value 0.000 0.000 0.000 0.005 0.030 0.025
B 10 (µm) 0.81 0.80 0.05 0.10 −0.16
p-value 0.000 0.000 0.119 0.107 0.226
B 2.5 (µm) 0.81 −0.11 0.25 −0.31
p-value 0.000 0.004 0.029 0.017
B 5 (µm) 0.11 0.02 −0.12
p-value 0.225 0.160 0.014
B RH (%) −0.87 0.16
p-value 0.000 0.036
B T (°C) −0.11
p-value 0.023
WS (ms−1)
p-value
Table 4. (a) Contains the Spearman analysis for the interior face of the building, the resulting values are summed in absolute value; (b) shows the Spearman Correlation, p-value, summary of summed values in absolute value; (c) contains the Spearman analysis for the interior face of the building, the resulting values are summed without absolute value; and (d) shows the Spearman correlation, p-value, summary of summed values without absolute value.
(a) + (b)B 0.3 (µm)B 0.5 (µm)B 1 (µm)B 10 (µm)B 2.5 (µm)B 5 (µm)B RH (%)B T(°C)B WS (ms−1)
B 0.3 (µm) 0.95 0.94 0.86 0.90 0.71 0.72 0.68 0.33
p-value 0.000 0.000 0.000 0.000 0.000 0.000 0.000 0.005
B 0.5 (µm) 0.96 0.89 0.94 0.74 0.68 0.65 0.37
p-value 0.000 0.000 0.000 0.000 0.000 0.000 0.001
B 1 (µm) 0.87 0.94 0.74 0.67 0.63 0.38
p-value 0.000 0.000 0.000 0.000 0.000 0.001
B 10 (µm) 0.91 0.73 0.62 0.59 0.32
p-value 0.000 0.000 0.000 0.000 0.104
B 2.5 (µm) 0.77 0.59 0.55 0.37
p-value 0.000 0.000 0.000 0.004
B 5 (µm) 0.59 0.57 0.17
p-value 0.000 0.000 0.142
B RH (%) 0.99 0.27
p-value 0.000 0.000
B T (°C) 0.24
p-value 0.000
WS (ms−1)
p-value
(c) + (d)B 0.3 (µm)B 0.5 (µm)B 1 (µm)B 10 (µm)B 2.5 (µm)B 5 (µm)B RH (%)B T(°C)B WS (ms−1)
B 0.3 (µm) 0.95 0.94 0.86 0.90 0.71 0.72 −0.68 −0.25
p-value 0.000 0.000 0.000 0.000 0.000 0.000 0.000 0.005
B 0.5 (µm) 0.96 0.89 0.94 0.74 0.68 −0.65 −0.28
p-value 0.000 0.000 0.000 0.000 0.000 0.000 0.001
B 1 (µm) 0.87 0.94 0.74 0.67 −0.63 −0.26
p-value 0.000 0.000 0.000 0.000 0.000 0.001
B 10 (µm) 0.91 0.73 0.62 −0.59 −0.30
p-value 0.000 0.000 0.000 0.000 0.104
B 2.5 (µm) 0.77 0.59 −0.55 0.26
p-value 0.000 0.000 0.000 0.004
B 5 (µm) −0.59 −0.57 −0.10
p-value 0.000 0.000 0.142
B RH (%) −0.99 −0.27
p-value 0.000 0.000
B T (°C) −0.24
p-value 0.000
WS (ms−1)
p-value
Disclaimer/Publisher’s Note: The statements, opinions and data contained in all publications are solely those of the individual author(s) and contributor(s) and not of MDPI and/or the editor(s). MDPI and/or the editor(s) disclaim responsibility for any injury to people or property resulting from any ideas, methods, instructions or products referred to in the content.