1. Introduction
Medicanes are hybrid weather systems occurring in the Mediterranean region that resemble tropical cyclones and can lead to severe impacts on human infrastructure. Their structural complexity, stemming from both tropical and extratropical characteristics, is thoroughly discussed in studies examining their formulation and development mechanisms, including the role of baroclinic processes and surface fluxes [
1,
2]. The potential risks they pose, particularly to coastal and urban environments, are emphasized in assessments of regional atmospheric hazards [
3,
4], which highlight the increasing concern around extreme weather events in the Mediterranean. Climate projections suggest that while the total number of medicanes may decline, their intensity and destructive potential could increase, especially under warming scenarios later in the century [
5]. Additionally, broader reviews underscore the mounting socio-economic impacts of these cyclones, stressing the importance of improved forecasting, readiness, and adaptive measures as climate trends evolve [
6]. Based on these and many subsequent references, there are several important meteorological and climatic factors that are necessary to generate medicanes and determine their intensification. While atmospheric instability permits warm, humid air to rise, leading to low-pressure areas, warm sea surface temperatures (SSTs) of approximately 26 °C to 28 °C provide the heat and moisture required to support convection. Cyclogenesis begins with pre-existing low-pressure systems or disturbances, which are frequently brought on by upper-level troughs or cut-off lows. Although the Coriolis force is important, it has a less pronounced, nevertheless significant, effect in the Mediterranean, resulting in smaller and less powerful storms than tropical cyclones. Low-level convergence and upper-level divergence sustain the upward motion required for storm development, while moderate wind shear allows the cyclonic features to stay organized. The resulting extensive and sustained convection is supported by high relative humidity, while the baroclinic instability can intensify storms by creating strong temperature differences.
Coastal terrain features enhance the effects of storms by interacting with them in different ways. Through orographic lifting, mountains and hills can increase the intensity of precipitation, while valleys and gaps can accelerate winds. Headlands, peninsulas, and estuaries are examples of coastal characteristics that can concentrate wind energy and intensify storm surges. Storms become more destructive when they hit land because of these interactions, which also cause localized floods, wind damage, and increased precipitation. These effects are particularly sensitive to the local characteristics of the affected areas and serve as an important motivation to study medicane Daniel using a very high resolution non-hydrostatic NWP model like ICON.
The wider area of Greece has been gravely affected by these systems, and consequently, substantial and widely extensive research attempts have been invested in the understanding of these systems. Recent scientific efforts cover virtually all major areas of atmospheric sciences, with key contributions in synoptic and climatological analyses based on numerical simulations [
7,
8,
9,
10,
11,
12,
13], remote sensing applications [
14,
15,
16,
17], and specialized studies employing numerical weather prediction (NWP) models [
18,
19,
20,
21,
22,
23,
24]. The volume of such research is expected to continue rising in response to the growing significance of the phenomenon. Such vigorous scientific activities lie in full compliance with the urgent needs for the development of effective policies regarding civil protection against the hazardous socio-economic impacts of medicanes and especially flooding. In particular, NWP models are arguably considered the most critical assets for forecasting the development of these cyclones. However, in these systems, the physical and dynamical processes are strongly intertwined. This characteristic imposes significant computational challenges, potentially limiting the direct usability of their products by both general users and professional forecasters.
In principle, global numerical weather prediction (NWP) models, primarily hydrostatic, form the backbone of weather forecasting. However, when dealing with extreme weather events, regional non-hydrostatic NWP models offer improved accuracy, particularly at the local scale. Storm Daniel stands out as a recent and critical example within this framework. According to Wikipedia [
25], storm Daniel is recognized as a catastrophic Mediterranean tropical-like cyclone, arguably the deadliest ever recorded in the region and among the costliest outside the North Atlantic Basin. This characterization is supported by multiple sources and analyses. The storm received its name from the Hellenic National Meteorological Service (HNMS) [
26], in collaboration with the meteorological services of Cyprus and Israel, as part of a regional naming protocol established by EUMETNET [
27]. A broader overview of weather system naming conventions in Europe is available in Wikipedia [
28]. A series of recent studies has investigated the disastrous flooding triggered by medicane Daniel. These include remote sensing evaluations of flood events in Central Greece [
29], post-event analyses highlighting the role of advanced water-monitoring infrastructure [
30], assessments of changes in soil chemistry using causal inference [
31], and examinations of flash flood erosion in Libya [
32]. Additionally, satellite-based analyses of rainfall patterns during the storm have provided further insight into its severity [
33]. Collectively, these findings underscore the devastating impact of storm Daniel across the Eastern Mediterranean. From a numerical weather prediction (NWP) standpoint, the storm’s dynamics and predictability have been analyzed through various approaches. These include the use of the Ensemble Prediction System (EPS) of the European Centre for Medium-Range Weather Forecasts (ECMWF) via the European Flood Awareness System (EFAS) [
34]. Additionally, sea surface temperature anomalies in the Mediterranean have been taken into account [
35], alongside a benchmark study that references the operational deterministic output of the ECMWF’s Integrated Forecast System (IFS) [
36]. In these works, the synoptic features of the medicane have been illustrated in detail, setting a most suitable framework to further investigate this exceptionally complicated weather system from the more quantitative and locally oriented perspectives of a regional NWP model.
In the present work, the endeavor associated with NWP works is advanced using the local version of the ICON (Icosahedral Non-Hydrostatic) model, a state-of-the-art numerical weather prediction model [
37,
38] that has been adopted operationally by all the meteorological services that are members of the Consortium for Small-scale Modeling (COSMO) [
39]. This is a very dynamic initiative, as the COSMO is an integral component for the partners and community involved in the development and application of the ICON model worldwide [
40,
41]. Launched operationally in 2015, the ICON model features a unique icosahedral–triangular grid structure that helps reduce computational errors common in traditional latitude–longitude grids [
37]. The model operates at multiple scales, from global to regional forecasting, and employs advanced physical parameterizations to simulate atmospheric processes [
38]. ICON has demonstrated particular strength in predicting severe weather events and has become an integral tool in European weather forecasting operations [
42].
Although ICON was developed initially as a global model by the German Weather Service (DWD) and Max Planck Institute for Meteorology, its architecture and, in particular, its intrinsic scalability by design mmakeade it highly adaptable for regional modeling through its limited-area model version (also denoted as ICON-LAM). From this perspective, the regional ICON model maintains a consistent modeling framework across all scales. Within this framework, it can be utilized independently by taking boundary conditions from a global model (in our case IFS) over nested high-resolution domains.
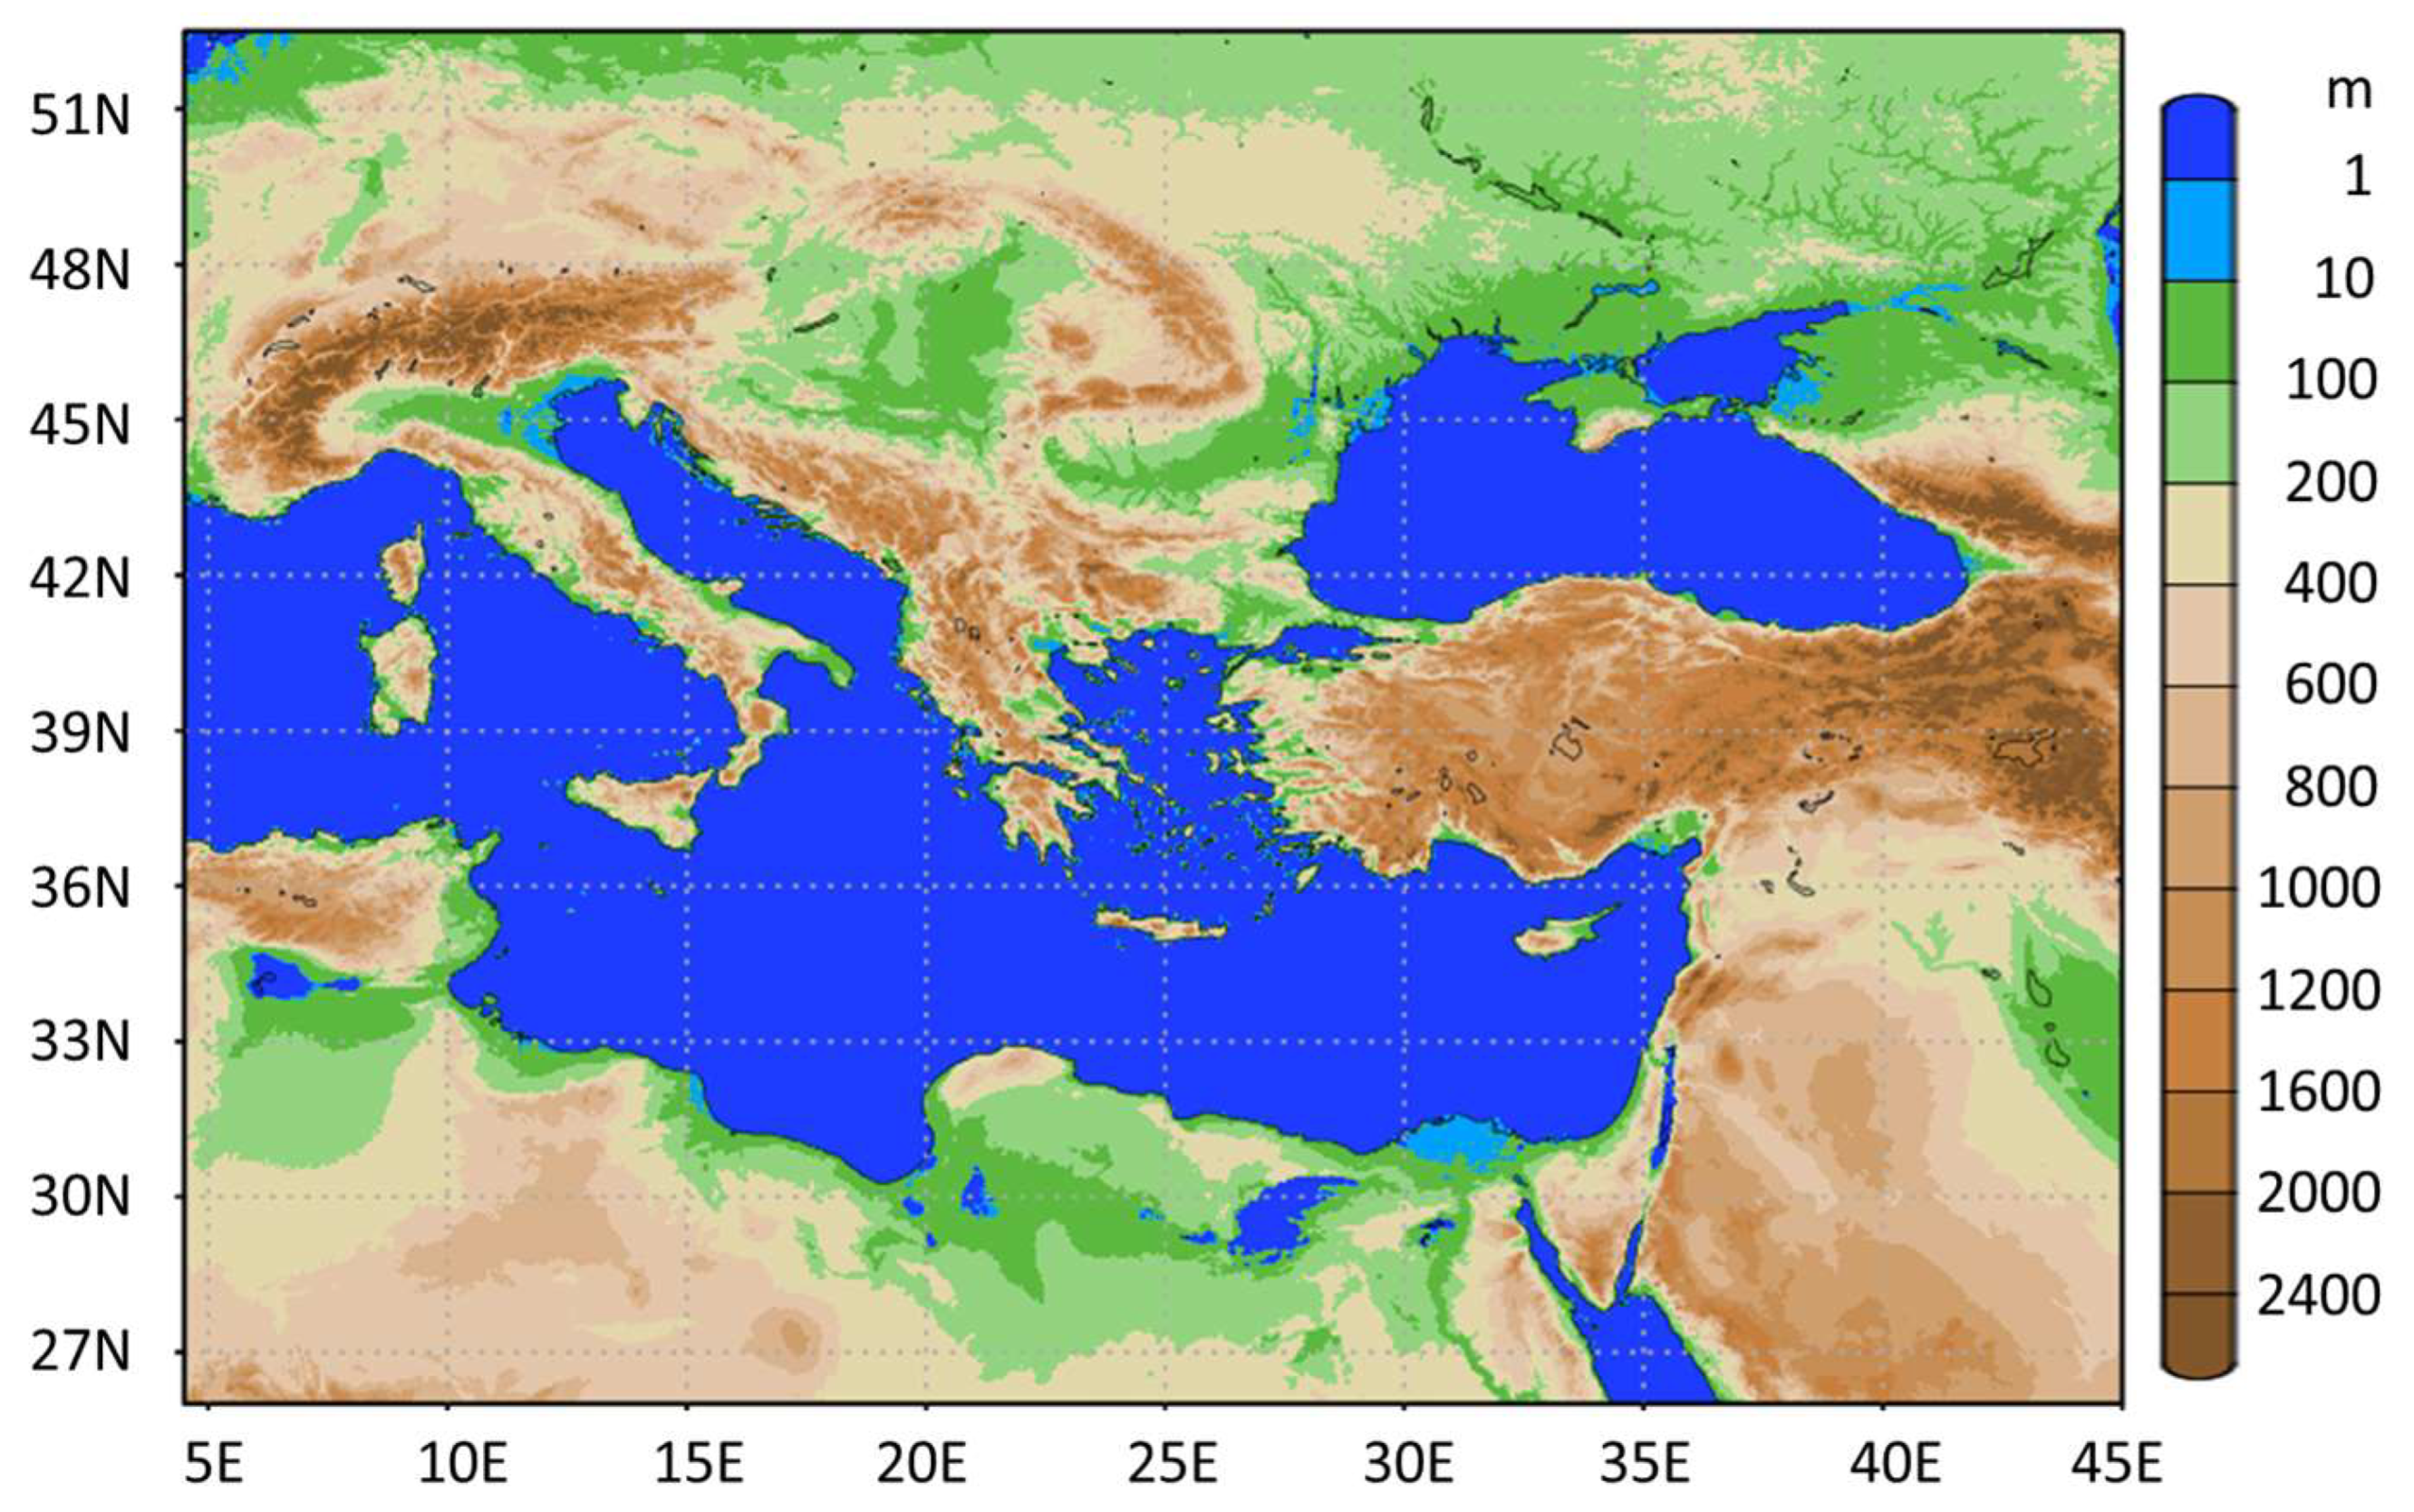
The ICON model version of the Israeli Meteorological Service (IMS) installed at the ECMWF [
43], known as ICON-LAM (Local Area Model), was considered a suitable choice with respect to the designated integration domain (
Figure 1), while the model parameter sensitivity has been benchmarked in the approximate area where storm Daniel developed, at least for the wider area of Greece [
44]. In this study, the ICON model is applied over the active period of the development of medicane Daniel (4–12 September 2023). The results are based on 48 h runs carried out by the ECMWF-IFS 3 h operational runs initialized at 00 UTC for every day of the period in order to maintain the short-range nature of the model forecast that is useful for operational purposes. The model’s performance is highlighted over the domain of medicane activity for several meteorological fields, especially regarding precipitation and the tracking of the medicane. Particular attention was given to the heavily affected area of Greece, especially Thessaly, in comparison to the accumulated precipitation values recorded by the available synoptic meteorological stations of the HNMS. In reference to the current NWP works and observations, the ICON model reasonably described the areas affected by storm Daniel, demonstrating competent standards for extreme weather systems at the local scale.
The IFS operational analysis (∼10 km grid spacing) served as a benchmark for evaluating the ICON regional model’s performance. The ICON model effectively forecasted intense rainfall over Greece and Libya under higher mean sea level pressure (MSLP) and lower 850 hPa temperatures (T850) relative to the IFS analysis, conditions typically considered less favorable for heavy precipitation. Due to the exceptional complexity associated with quantifying individual meteorological drivers such as mesoscale orographic forcing, moisture convergence, boundary-layer dynamics, and local thermodynamic instability, it was beyond the scope of this study to isolate their relative contributions. However, their combined influence most likely contributed to ICON’s skill as a state-of-the-art regional model. This study offers a distinct application of ICON-LAM over the eastern Mediterranean, focusing on short-range sequential NWP runs during a high-impact weather event and incorporating a relatively detailed validation against national observational data. The findings suggest that ICON is not only a viable supporting alternative to the IFS global model, but also a regional NWP model capable of capturing precipitation in dynamically complex terrain and under synoptic conditions that challenge conventional forecasting methods.
2. Materials and Methods
In this work, the extreme precipitation events in central Greece caused by storm Daniel are manifested via the overall performance of the ICON model during the most critical stage of the storm. Due to the available extensive coverage of all aspects of the ICON model [
36,
37,
38,
39,
40,
41], the specific model setup is given below.
The limited-area model version of ICON that was implemented follows the configuration established as a critical application at the ECMWF [
43] by the IMS. The integration domain (
Figure 1) includes the wider area of the central and eastern Mediterranean along with significant portions of the surrounding areas of Europe, Africa, and Asia stretching between 4.0° and 45.5° E, 25.5° and 53.0° N. According to the references associated with the tracking and the synoptic analysis of the medicane [
14,
25,
30,
34,
35], this domain can be considered a fitting choice to investigate the local features of the storm.
The model equations form a two-component system consisting of dry air and water in all three phases and are based on a compressible non-hydrostatic system. The terms defining vertical soundwave propagation are handled implicitly, while the time integration is carried out via an explicit two-time-level predictor–corrector technique [
36,
37]. The governing equations of the model are spatially discretized using an icosahedral triangular C grid. The abbreviation RnBk is used to identify each grid, which means that it is derived from an icosahedron whose edges were first split into n segments and then into k more edge bisections.
For visualization and post-processing, data from the above native ICON grid are interpolated onto a lat-lon projection without any essential loss of accuracy, as indicatively shown in
Figure 1 and the subsequent figures. Practically, in this work, the average horizontal spacing between grid points is as follows: each triangular cell in the mesh covers approximately 2.5 km, meaning that the center-to-center distance of neighboring grid cells is approximately 2.5 km. This resolution is quasi-uniform, but because the triangles are not perfectly regular and the Earth is only approximately spherical, the actual spacing can vary slightly. In this context, the model has a resolution of approximately 2.5 km (R2B10), comprising 1,783,780 triangular cells, and is implemented across 65 vertical levels, extending up to 23 km.
The ICON model is tuned by a large number of parameters that cover practically all areas regarding the tuning of an NWP model, i.e., turbulence, convection, cloud cover, sub-scale orography, grid-scale micro-physics, and land and sea processes. These parameters are referenced in detail in the ICON tutorial [
38], with their significance ranked and updated by the model experts [
45] in an effort to gauge their sensitivities, essentially in the area of medicane Daniel [
44] where they are catalogued in detail. Upon these considerations, the IMS has adjusted the ICON model configuration by taking into account the seasonal nature of the area [
46], where in this work the tuning for the period May to September was adopted. Within this context [
46], the most critical parameters tuned were associated with precipitation, 2 m temperature, 10 m wind speed, and low cloud cover. Regarding other parameters, the default values of [
45] were considered. More specifically regarding precipitation, there was specific tuning regarding the number and concentration of raindrops in microphysics schemes, the maximum allowed shallow convection depth, and the utilization of the shallow convection scheme to make the convection precipitation more realistic in the stochastic shallow convection scheme within the model.
This study relies on eight separate 48 h simulations, each initiated at 00 UTC daily, driven by the deterministic IFS of the ECMWF under initial conditions and 3 h boundary conditions, spanning the period from 4 September to 11 September 2023. The runs were performed over the course of the development of the medicane, placing a quantitative emphasis on the dates of extreme precipitation over Greece and, in particular, the Thessaly region. This approach is consistent with the short-range forecast value of a regional model for the assessment of several critical meteorological fields. The procedure followed throughout the period was to compare the model’s analysis of a meteorological field for each case with the corresponding 24 h forecast from the previous day. This approach was followed for the mean sea level pressure (MSLP), geopotential height at 500 hPa (GPH500), and temperature at 850 hPa (T850). A constraint in the model used was the fact that the sea surface temperature (SST) was updated only in the analysis of every 48 h case. Thus, in this context, the sequential analysis of sea surface temperature (SST) was effectively updated every 24 h, in line with the chronological order of the cases being considered. Although the main characteristics of the medicane are shown over a broader area covering its activity, this study focuses specifically on its hazardous precipitation impacts over Greece during the period from 4–7 September 2023.
Medicane tracking is based on the MSLP minimum at 6 h intervals of the first 24 h forecast for every case that is compared with those stemming from the analysis of the ECMWF. The MSLP tracking assessment over the complete 48 h model runs was performed by comparing the first 24 h of each run with the final 24 h of the run from the preceding day’s case.
The accumulated precipitation is presented in 24 h intervals in the forecast ranges 00–24 h following Hewson et al. [
36], as well as later lead times, i.e., 06–30 h and 18–42 h forecast ranges corresponding to the time intervals of the observations recorded by the HNMS synoptic stations. The observations were evaluated based on the model equitable threat scores (ETSs) [
24,
47] with respect to the available synoptic meteorological stations of the HNMS. Additionally, a direct comparison was made for the four most affected meteorological stations, namely Larisa, Skiathos, Aghialos (also referred to as Volos in various references), and Lamia [
48], with their locations shown in below.
3. Results
Medicane Daniel developed on 4 September 2023 and dissipated by 13 September 2023, affecting a broad geographical area spanning most of Greece to nearly the entire coastline of Libya. Consequently, it was necessary to adopt a numerical weather prediction approach that preserved the high spatial and temporal resolution of a short-range model while also accounting for the extreme precipitation and the challenges involved in tracking the storm’s evolution and movement over time. Our approach was developed within the framework of EUMETSAT [
14], where the medicane’s lifecycle was divided into two distinct phases: Phase 1 (4–7 September 2023), associated with the devastating floods in central Greece, and Phase 2 (8–11 September 2023), linked to the floods in Libya. These phases are referred to as Phase 1 and Phase 2, respectively, hereafter. In accordance with the synoptic situation associated with medicane Daniel that has been extensively analyzed by several studies [
14,
25,
30,
34,
35], our findings are presented for both phases on a comparative display of analysis at 00 UTC with the 24-h forecast. Initially, this procedure is addressed for the standard meteorological fields of T850 along with GPH500 (
Section 3.1). The development of the MSLP field, the most characteristic meteorological field associated with medicane development and tracking, follows in
Section 3.2 and
Section 3.3, respectively. In
Section 3.4, the accumulated precipitation is presented over the whole medicane area with a focus on Thessaly. The Results Section is concluded with the ETSs that stem from the observations of the available synoptic stations of the HNMS along with the direct comparisons of the model with the most affected stations of Larisa, Skiathos, Aghialos, and Lamia (
Section 3.5).
3.1. Development Temperature at 850 hPa (T850) and Geopotential at 500 hPa (GPH500)
The synoptic conditions associated with the formation and development of medicane Daniel have been extensively presented in current compelling efforts to interpret and validate this calamitous event [
29,
30,
31,
32,
33,
34,
35,
36,
48,
49]. As our effort is mainly focused on the features of a regional NWP model, we start our analysis by reviewing these synoptic conditions according to the European Cooperation in Science and Technology (COST) specific Action (CA19109) of the European network for Mediterranean cyclones in weather and climate (MEDCYCLONES), i.e., “… Storm Daniel originated with a Mediterranean depression in the Ionian Sea on Monday 4 September 2023. An omega-blocking pattern was in place over Europe, when a cut-off low formed in central Europe, along the eastern flank of the high-pressure system. This occurred through Rossby wave breaking (the irreversible undulation of the jet stream) and the cut-off low subsequently entered the Mediterranean, promoting cyclogenesis. …” [
48].
Accordingly, the 4th of September 2023 was considered the suitable date to start our analysis from the standard synoptic meteorological fields of T850 (°C) and GPH50 (m
−2 s
−2) in the two-block figure (
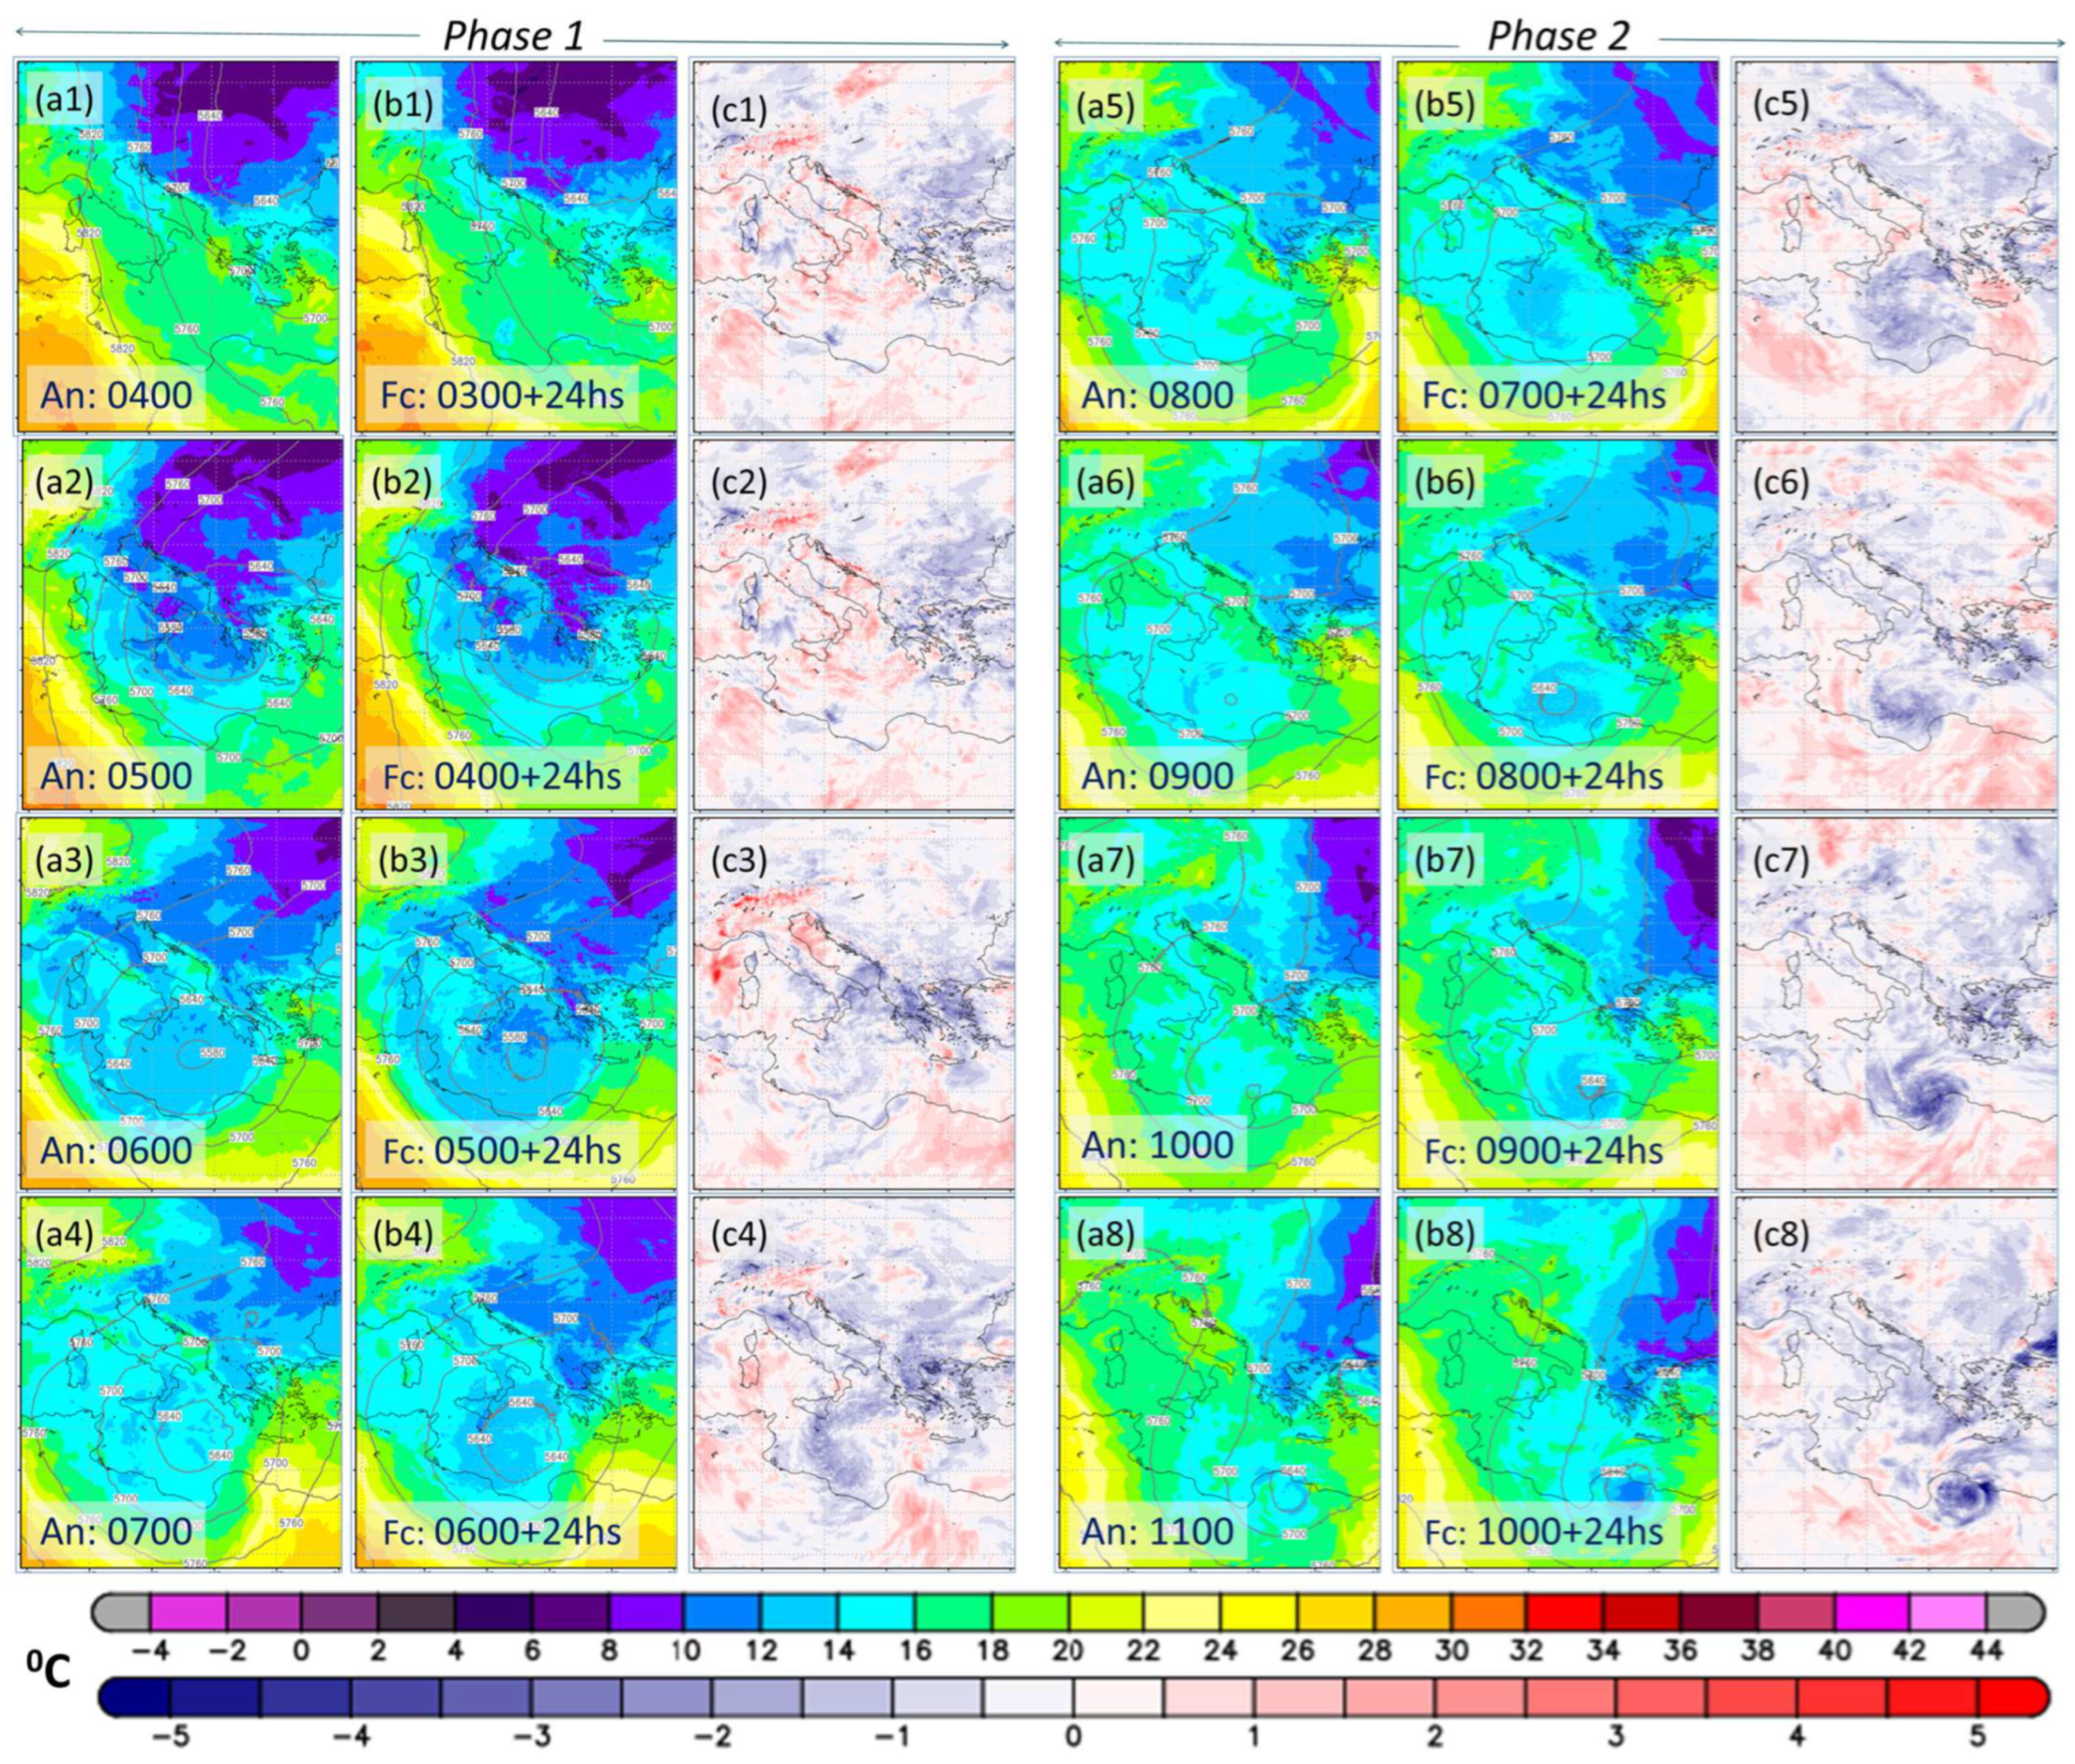
Figure 2) associated with Phase 1 and Phase 2 of medicane development. The same formulation is adopted in
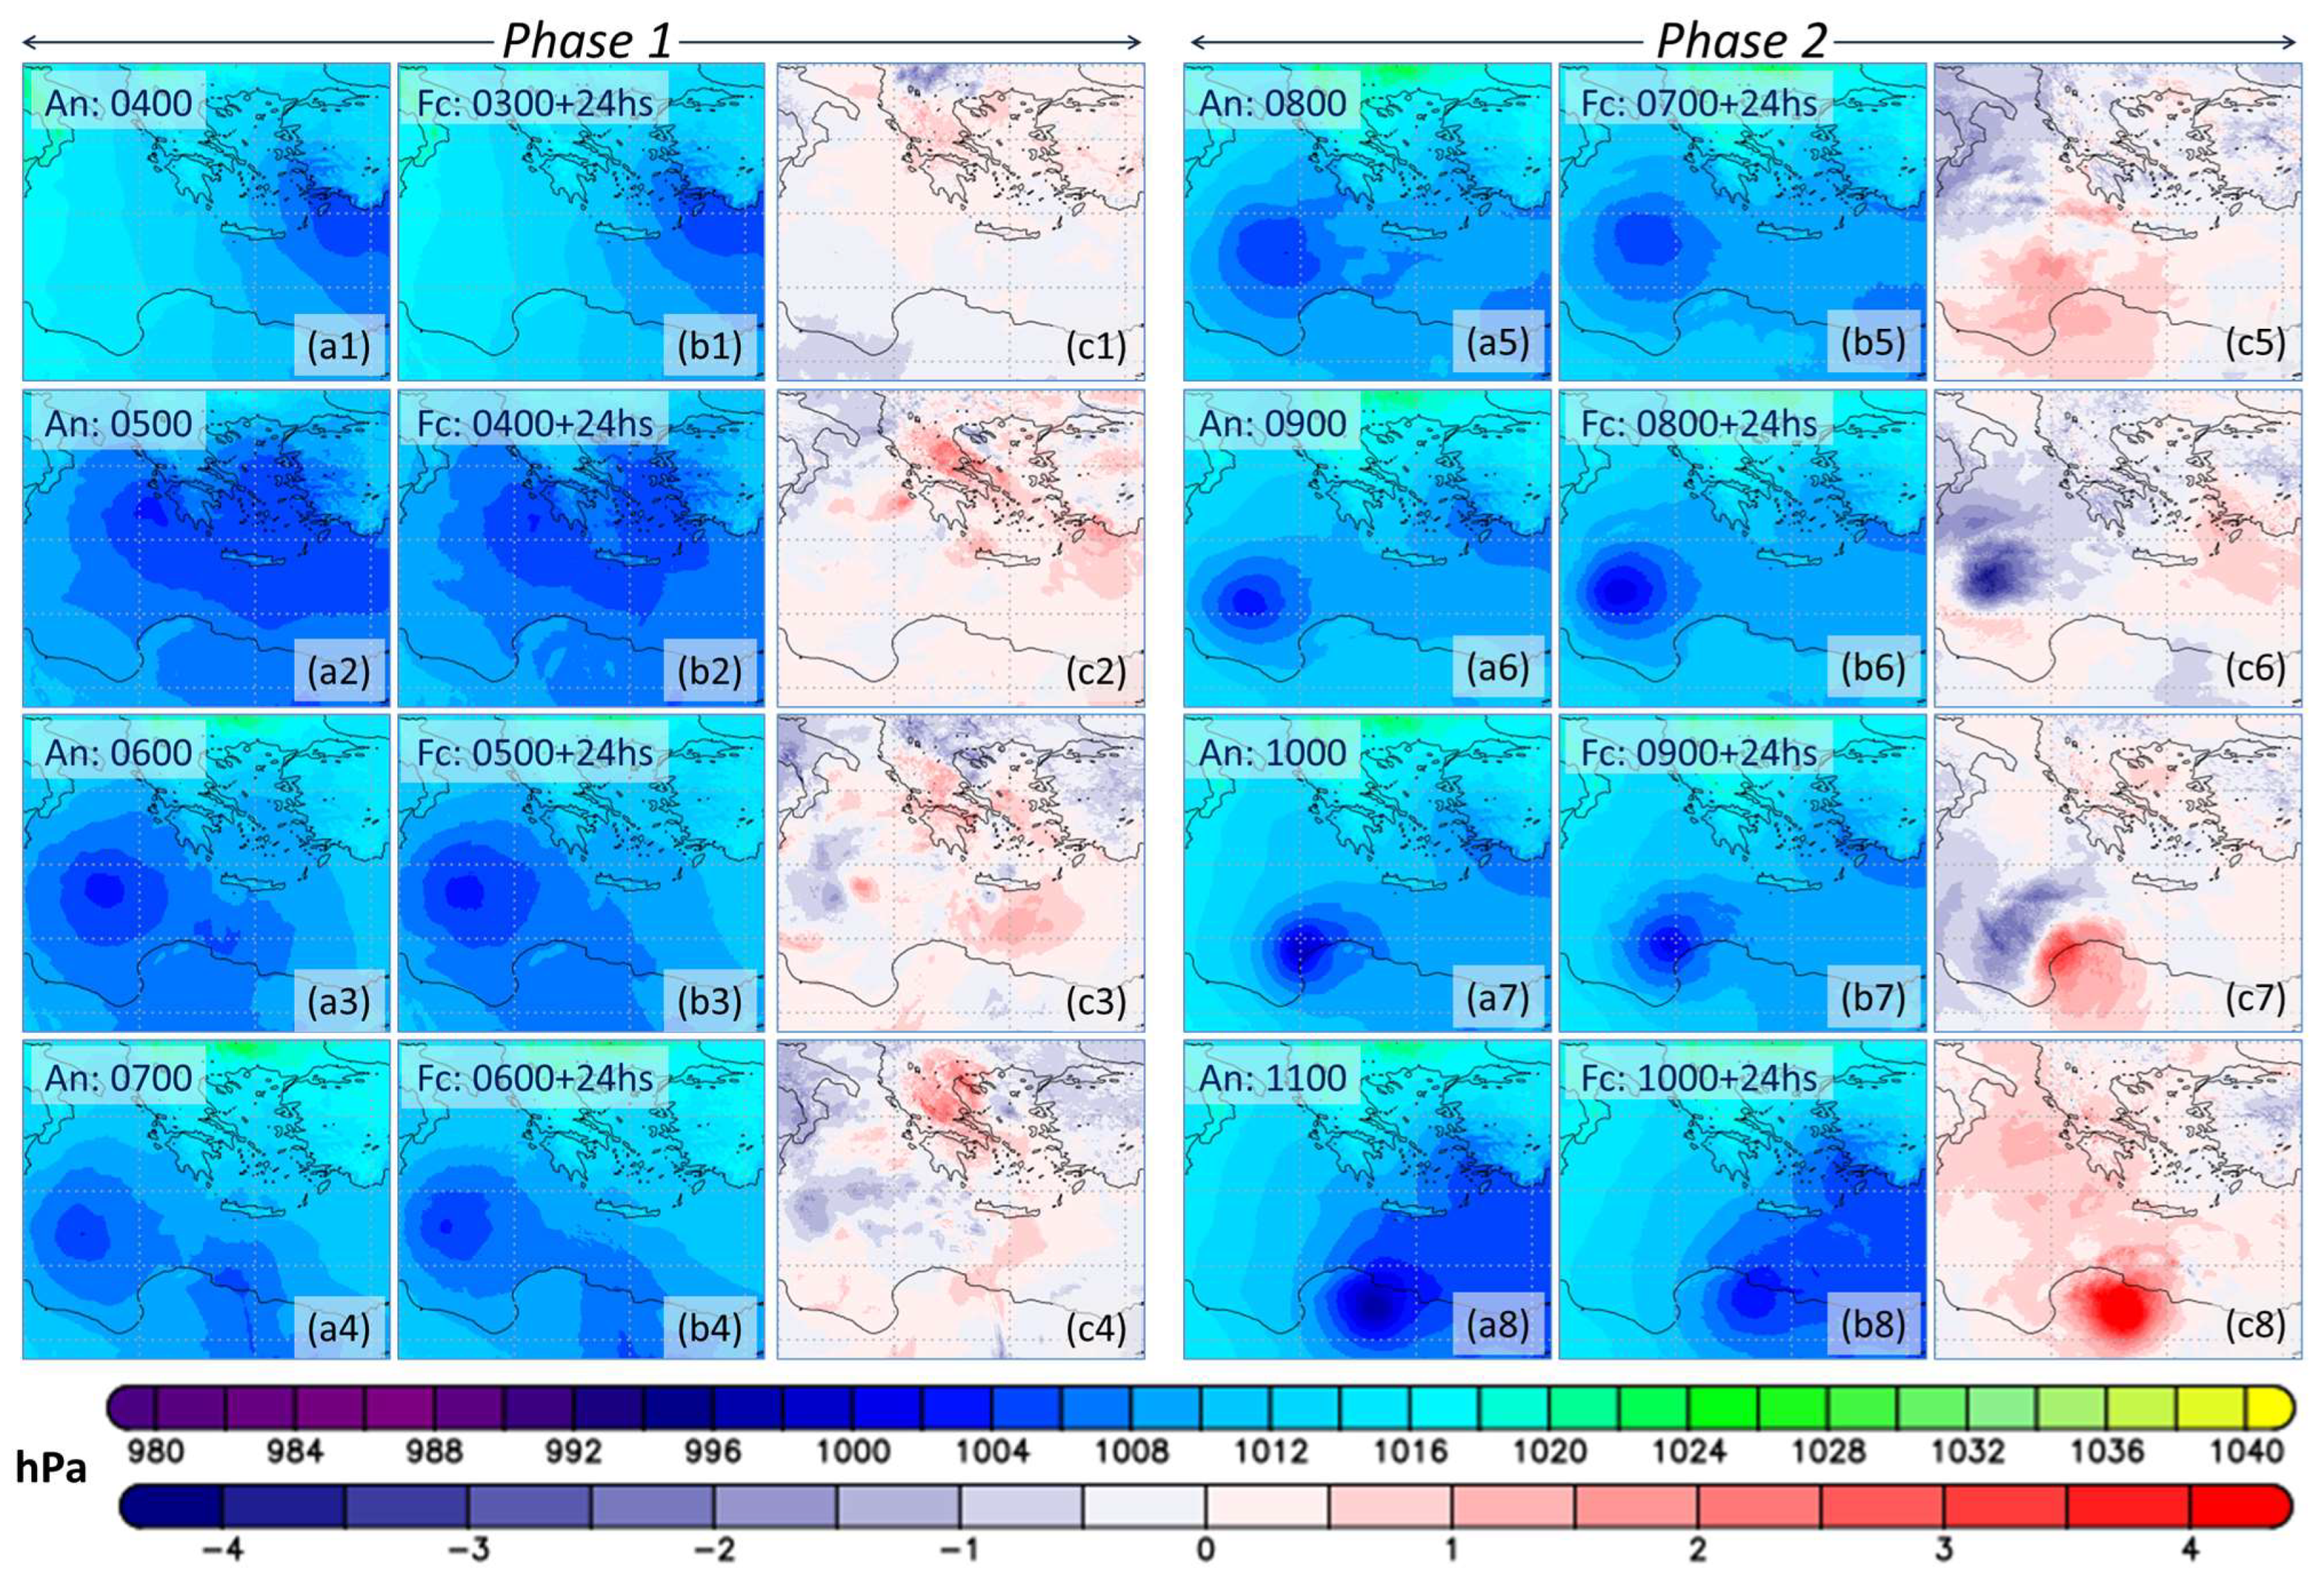
Figure 3 associated with the MSLP.
In the first column of the two-block figure,
Figure 2(a1–a8), the IFS analysis at 00 UTC is presented, interpolated to match the model’s horizontal grid resolution. In the second column (b1–b8), the corresponding model forecasts from the previous day’s run at 00 + 24 h are displayed for comparison. In the third column (c1–c8), the differences in the T850 forecast minus the analysis are given. The differences in T850 are quite significant, ranging between –4 and +4 °C, while the differences in GPH500 appear relatively modest, essentially maintaining the same mid-tropospheric airflow pattern. In Phase 1, we see the cut-off low clearly formed in the marine area southeast of Sicily, but also the warm flow in the central-eastern mainland part of Greece, in the central parts of the graphs, with an emphasis on the eastern and northeastern parts of the country. In Phase 2, the mid-tropospheric low is moving to the northern part of Libya. In both phases, extreme precipitation was forecasted by the model, as we shall see in
Section 3.4. It should be mentioned, however, that due to the lower T850 in both areas of Greece and Libya compared to analysis (
Figure 2(c1–c8)), more precipitation should have been expected than observed. However, in Phase 1, T850 drops for
both the warm and cold sector in the area where “Daniel” displayed the highest activity over Greece (
Figure 1(c1–c5)). Also, as we can see in
Figure 3, the forecasted MSLP was higher than the corresponding analysis in the critical areas regarding precipitation during both phases, in Thessaly and, in particular, in Libya during Phase 2. From a simplified perspective, these features are consistent with one another in representing the model’s precipitation forecasting performance. Thus, the areal distribution and height of the accumulated precipitation face challenges, which is the essential test of any regional model and will be focused on in Greece in
Section 3.5.
3.2. Mean Sea Level Pressure (MSLP) Development of Medicane “Daniel”
As mentioned above, the evolution of the storm was simulated with sequential 48 h model runs starting at 00 UTC every day over the period of 3–11 September 2023, carried out by the global model forecast of the ECMWF-IFS. The incentive behind this approach was to outline medicane evolution from the perspective of a forecaster who is consulting a short-range NWP model in daily practice.
Usually, the first 48 h of the local model runs are used operationally, especially in severe weather situations where the model’s output is changing critically between successive runs. In principle, these runs are updated operationally at least every 12 h. Nevertheless, for the purposes of this work regarding MSLP, runs every 24 h were considered a sufficient time slot to evaluate model performance.
At first, the MSLP graphs from the IFS analysis are compared to the model runs (
Figure 3) over the designated area of cyclone development (17°–35° E, 29°–42° N). In the first column, the analysis graphs are given (
Figure 3(a1–a8)) in 24 h intervals (4–11 September 2023 at 00 UTC) when the storm was most active. These graphs are opposed to the corresponding model forecasts of the 24th hour of the previous day (
Figure 3(b1–b8)). Indicatively,
Figure 2(b1) refers to the MSLP 24th forecast hour of the 48 h model run started on 3 September 2023 at 00 UTC. Although there is overall agreement between the analysis and forecast, notable discrepancies can be observed, especially in the vicinity of the minimum mean sea level pressure (MSLP) areas. The differences are noticeable in many areas and of varied magnitude reaching the order of 4 hPa. The most notable is reflected in the differences between
Figure 3(a7) versus
Figure 3(b7) and
Figure 3(a8) versus
Figure 3(b8) displayed in
Figure 3(c7,c8) of Phase 2, respectively, when the medicane was in the area of Lybia, where the MSLP minimum is visibly overestimated by the model. To a lesser extent, this feature is also realized in central Greece when the storm was most active, highlighted in
Figure 3(a1–a4) vs.
Figure 3(b1–b4), as shown in
Figure 3(c1–c4) of Phase 1. Notably, these differences are most distinct in the areas of extreme accumulated precipitation, a feature that is reflected in the corresponding figures of
Section 3.4, demonstrating the model’s potential to simulate the physical complexities over these extreme events.
3.3. Tracking of Medicane Daniel via MSLP Minimum
Looking at
Figure 3(a2,a3,b2,b3), the clear establishment of the cyclonic features of the minimum MSLP can be considered starting around the 5th of September 2023 at 00 UTC. This feature is in accordance with the references mentioned above, which provide the tracking of the medicane, and especially the work of Hewson et al. [
36] based on ECMWF products since the ICON model was developed by the ECMWF-IFS.
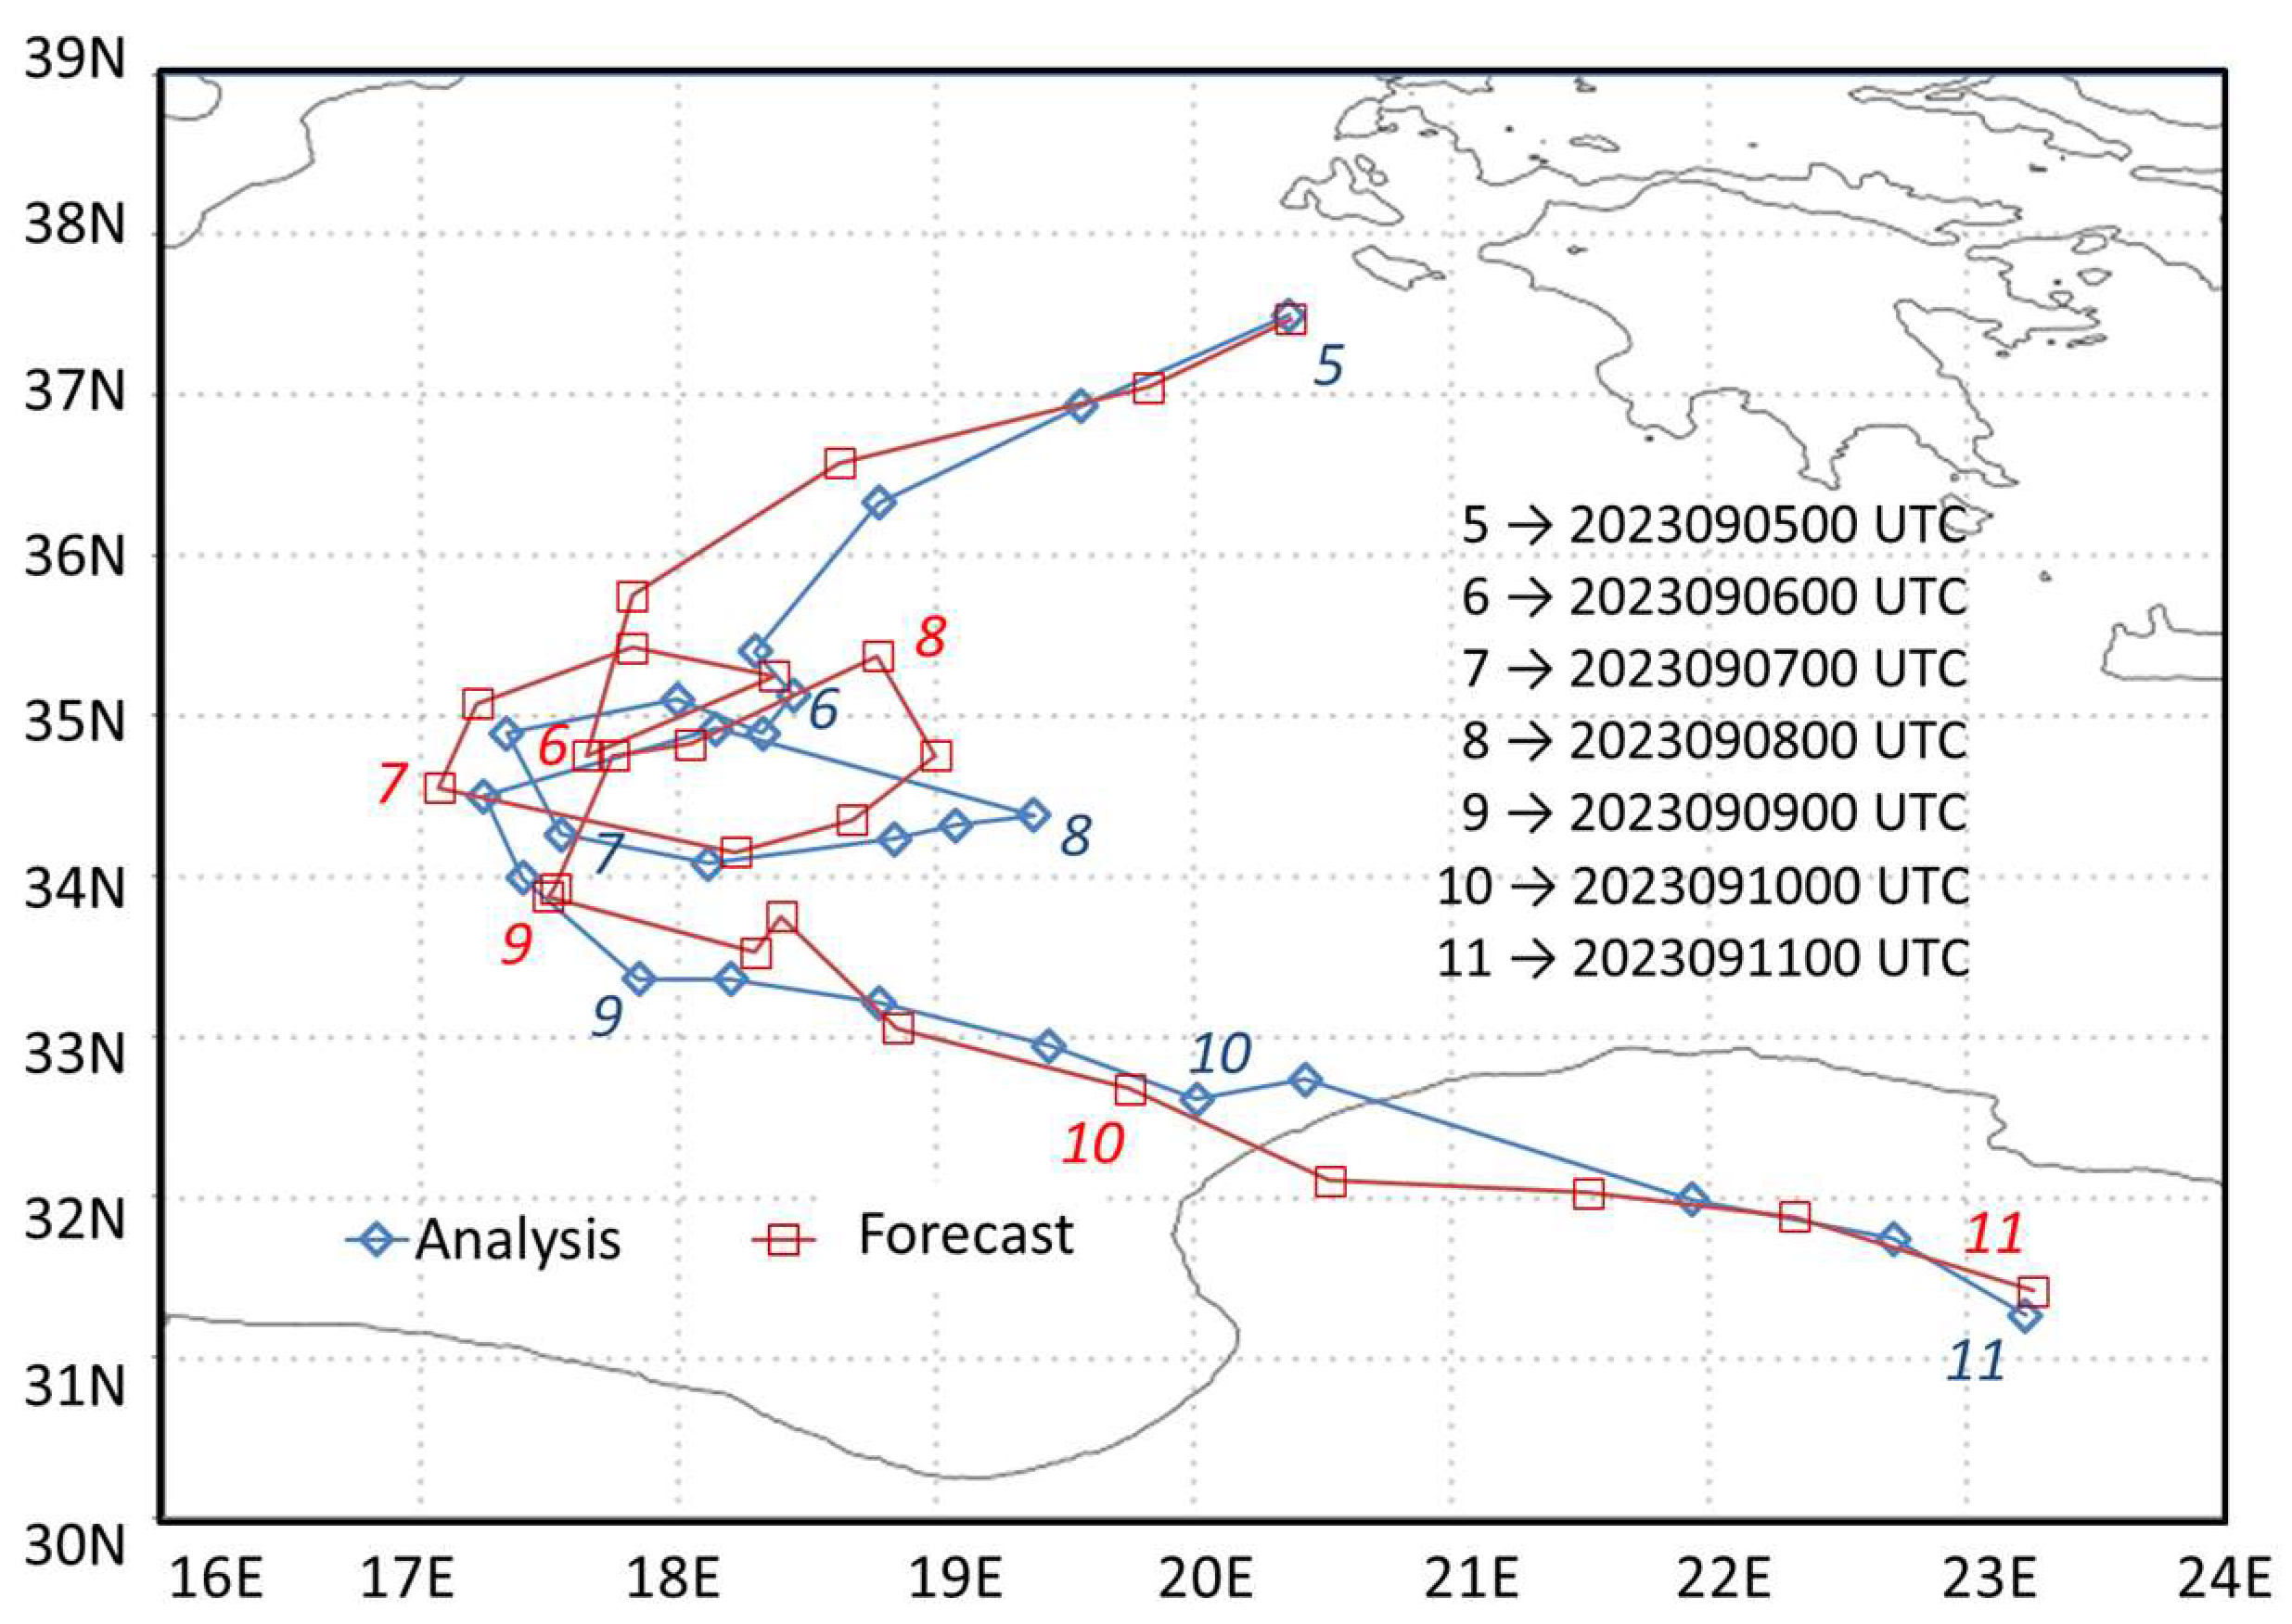
The tracking of medicane Daniel was based on the geographic position of the minimum MSLP over the first twenty-four hours of the sequential forty-eight-hour forecasts starting at 00 UTC from the 5–10 September 2023 and in six-hour intervals (
Figure 4). For example, the points close to number “6” refer to the 6th of September 2023 at 00 UTC, e.g., the legends around number 6 refer to the positions of the minimum MSLP on the 6th of September 2023 at 00 UTC. The blue diamonds refer to the geographical positions of the minimum MSLP from the analysis of the ECMWF in 6 h intervals and are very close to the referenced tracking point designated by other references [
13,
24,
29,
33,
34].
The red squares refer to the forecasted positions of the minimum MSLP from the model runs. For example, the red square close to number 6 refers to the minimum MSLP minimum at the forecast time 00 + 24 h of the run started on the 5th of September 2023 at 00 UTC. This approach of tracking the medicane highlights the performance of the limited-area model in the very short-range forecast of 00 + 6 το 00 + 24 h for every date of the considered period.
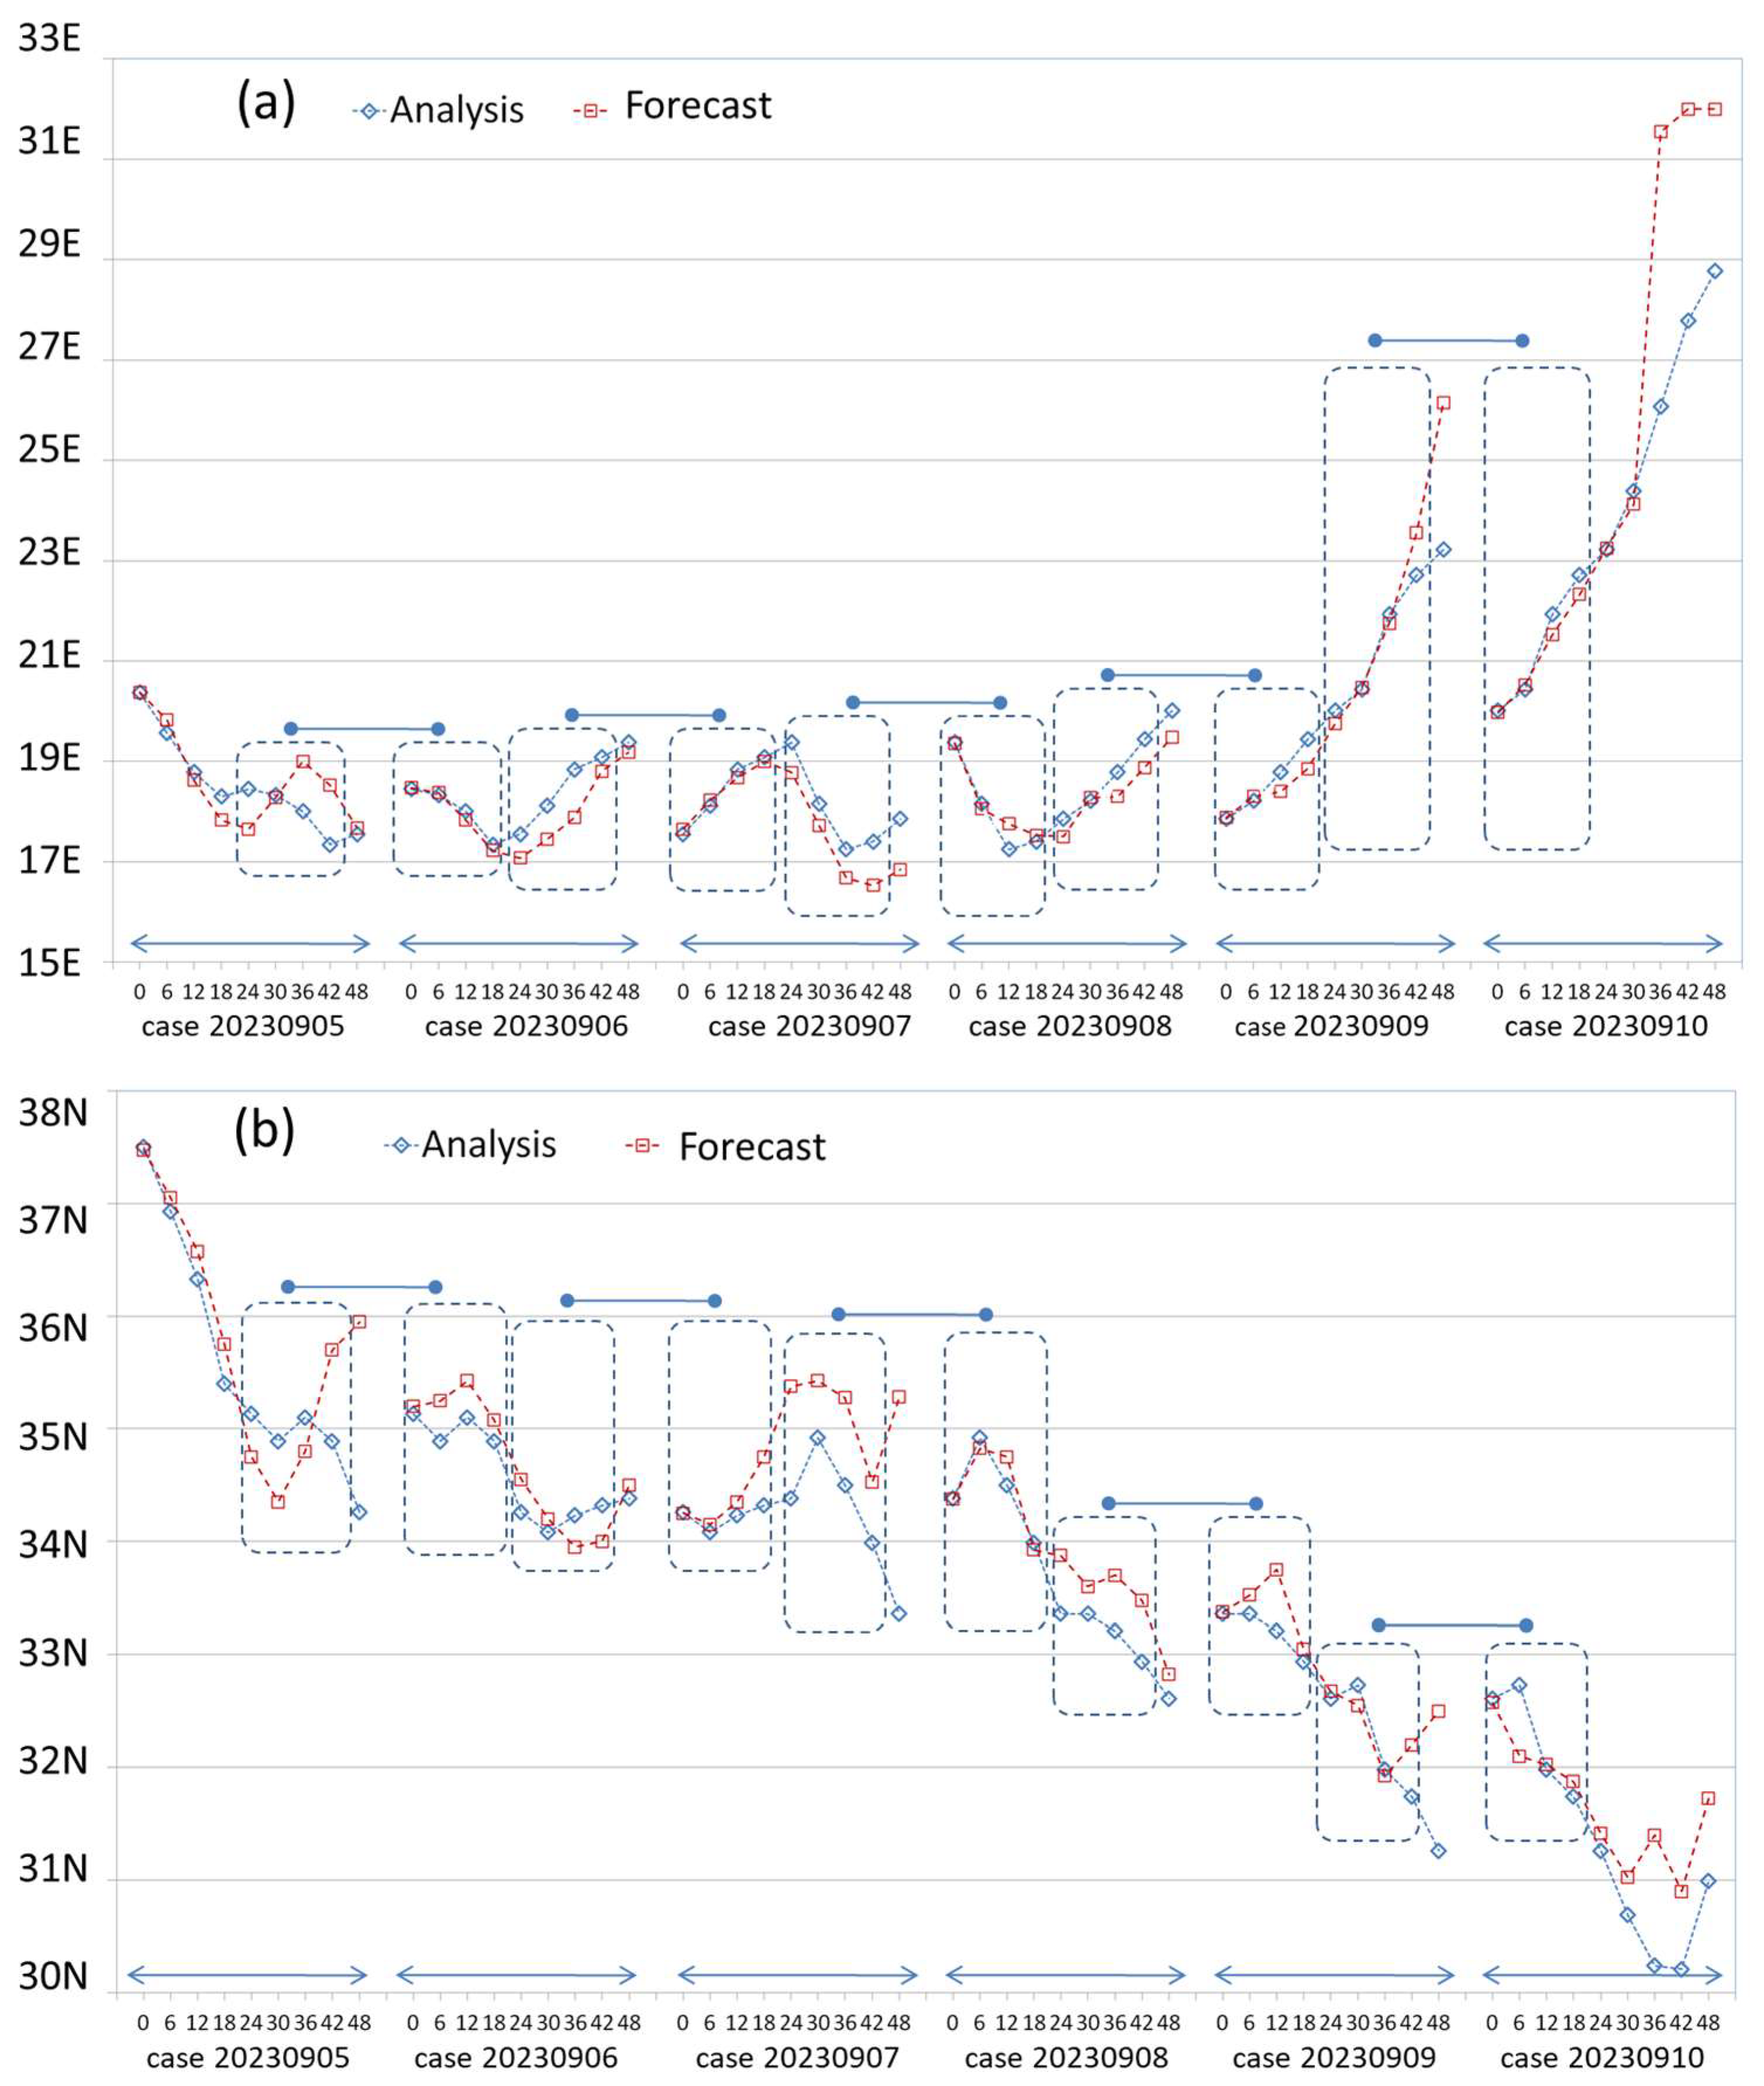
In
Figure 5a,b, the performance over the last 24 h forecast of the model runs is presented in reference to the first 24 h forecast for the geographical longitude and latitude of the minimum MSLP, respectively, and for the same calendar time period. The corresponding frames are denoted with a horizontal two-sided bulleted blue overbar. For example, in case 2023090600, the frame under the left bulleted end of the overbar refers to the last 24 h of the model run, while the frame under the right bulleted end of the overbar refers to the first 24 h of the model run for the case 2023090700, displayed on the horizontal axis. It should be noted that the geographical coordinates of the blue diamonds that refer to the analysis are the same for both frames and can be used as guides to visualize the model’s performance differences between the first and second 24 h forecast periods for the same calendar time period. In both figures, as expected, the model outputs (red squares) are closer to the analysis (blue diamonds) in all the right frames (referring to the 00–24 h forecast), compared to the left frames (referring to the 24–48 h forecast) located below the same bulleted bar. It is interesting to notice, however, that the geographical latitude of the minimum MSLP is overall better forecasted than the corresponding geographical longitude. Under the same framework, the forecasted minimum MSLP against the analysis is presented in
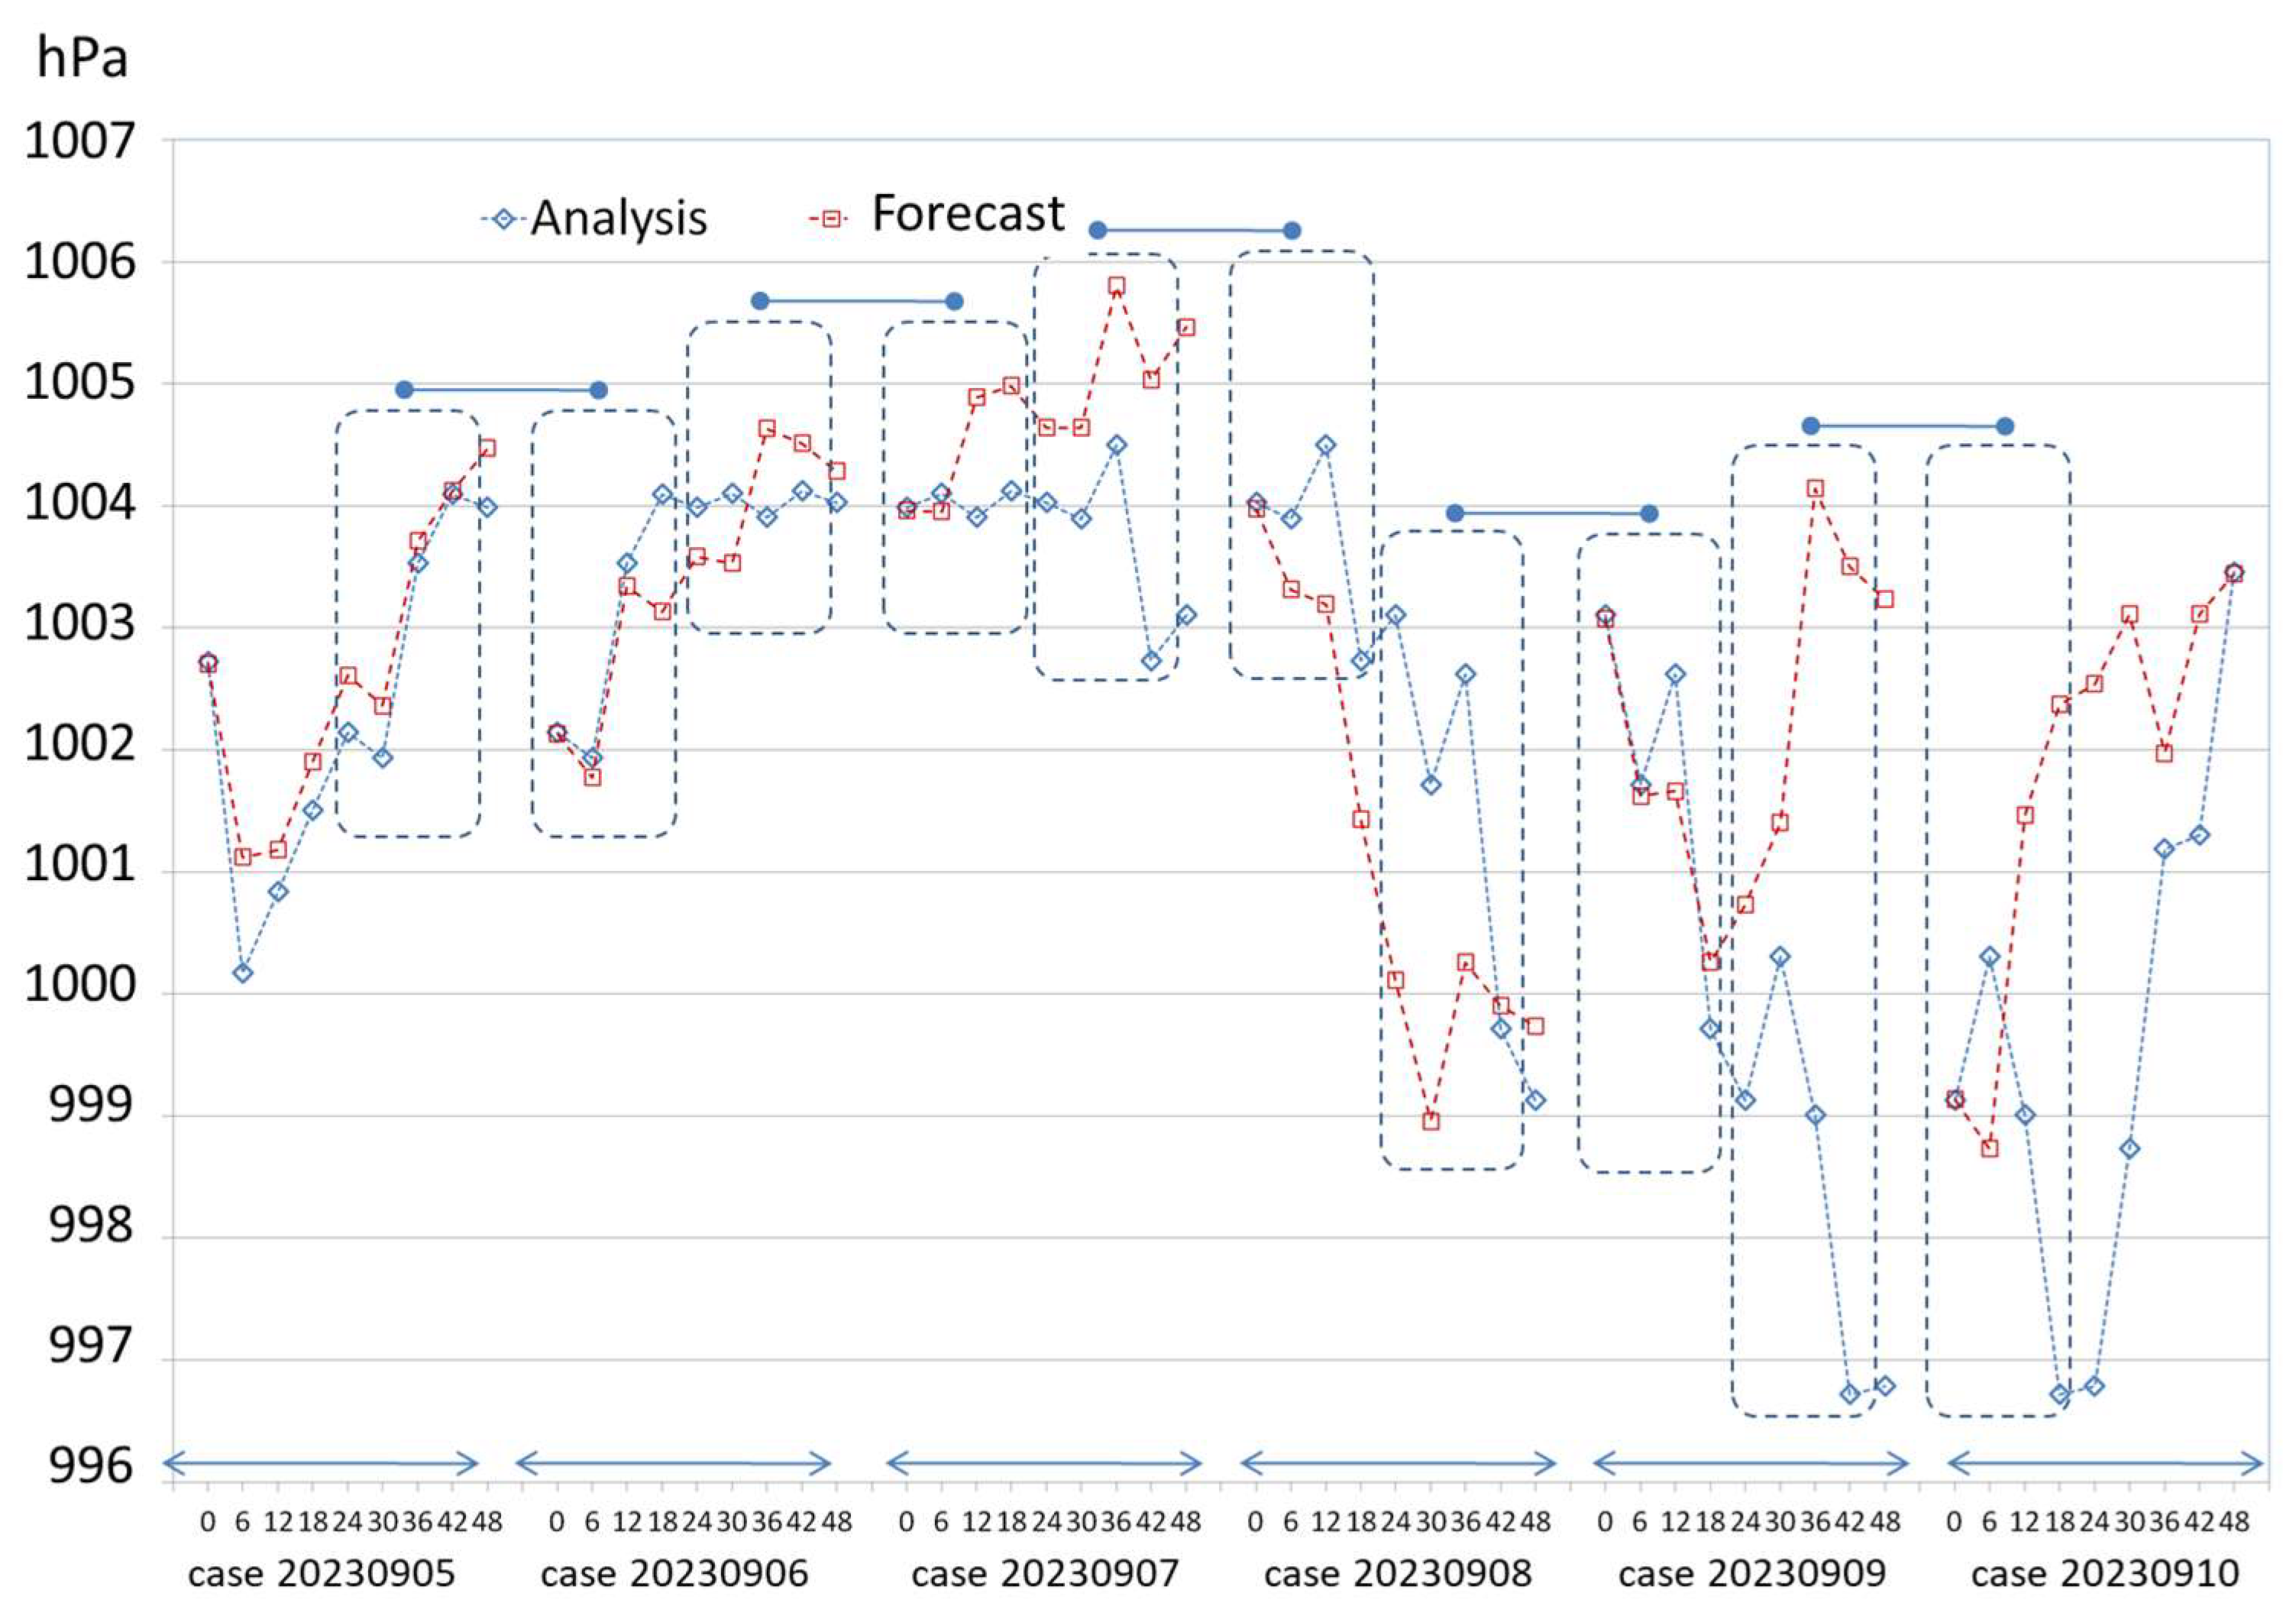
Figure 6. An important feature of this graph is the good agreement of the forecasted minimum MSLP up to case 20230907 when medicane Daniel caused the devastating floods in central Greece. However, this agreement worsens, leading to an overestimation to the order of 5 hPa for the rest of the cases when the storm reaches the lower subtropical areas of the coasts of Lybia.
3.4. Investigation of the ICON Model’s Forecast of Accumulated Precipitation
The accumulated precipitation of medicane Daniel is first overviewed through the sum of the corresponding 24 h model forecasts over the active period of the storm between 4 and 12 September 2023. This feature is realized in three forecast time intervals of the corresponding model runs, i.e., 0–24 h, 06–30 h, and 18–42 h (
Figure 7). The first period is in accordance with the work of Hewson et al. [
36] (
Figure 6), which is considered seminal in our analysis, and we kept the same precipitation scale for direct reference. The second and third periods are closer to the operational availability of the model by excluding the generally assumed possible spurious estimates due to the model spin-up time. Furthermore, these periods correspond to the intervals used in subsequent comparisons with the 12 h observational data from the HNMS synoptic stations, which commence daily at 06 UTC (refer to
Section 3.5).
Figure 7 presents the accumulated precipitation for eight forecast cases covering the period from 4 to 12 September 2023. Specifically,
Figure 7a illustrates the total precipitation from the first 24 h forecast window, labeled “202309_0400–1200 UTC”.
Figure 7b corresponds to the sum of the 6–30 h forecast range, denoted as “202309_0406–1206 UTC” while
Figure 7c represents the 18–42-h forecast range, referred to as “202309_0318–1118 UTC”. Despite minor timing discrepancies at the beginning and end of each forecast window, during which no substantial rainfall was predicted, all three figures consistently underscore the catastrophic impact of the storm across the central Mediterranean. This is especially evident in the highlighted regions of central Greece and northern Libya, where accumulated precipitation levels ranged from 300 mm to over 750 mm across expansive areas. Notably,
Figure 7a,b exhibit a high degree of similarity, emphasizing the effectiveness of ECMWF-IFS treatment during the spin-up period. Additionally, for the outlined region of Greece, the output from the ICON model closely aligns with that presented in
Figure 6 of reference [
36], further supporting the reliability of the forecast framework. Also of interest is the reduced precipitation displayed in
Figure 7c for both framed areas. As expected, this means that the model loses some skill when the forecast range (30–42 h) is 24 h later than the forecast range of 06–18 h. This feature will be evaluated for the Greek synoptic stations in
Section 3.5.
The forecasted precipitation of
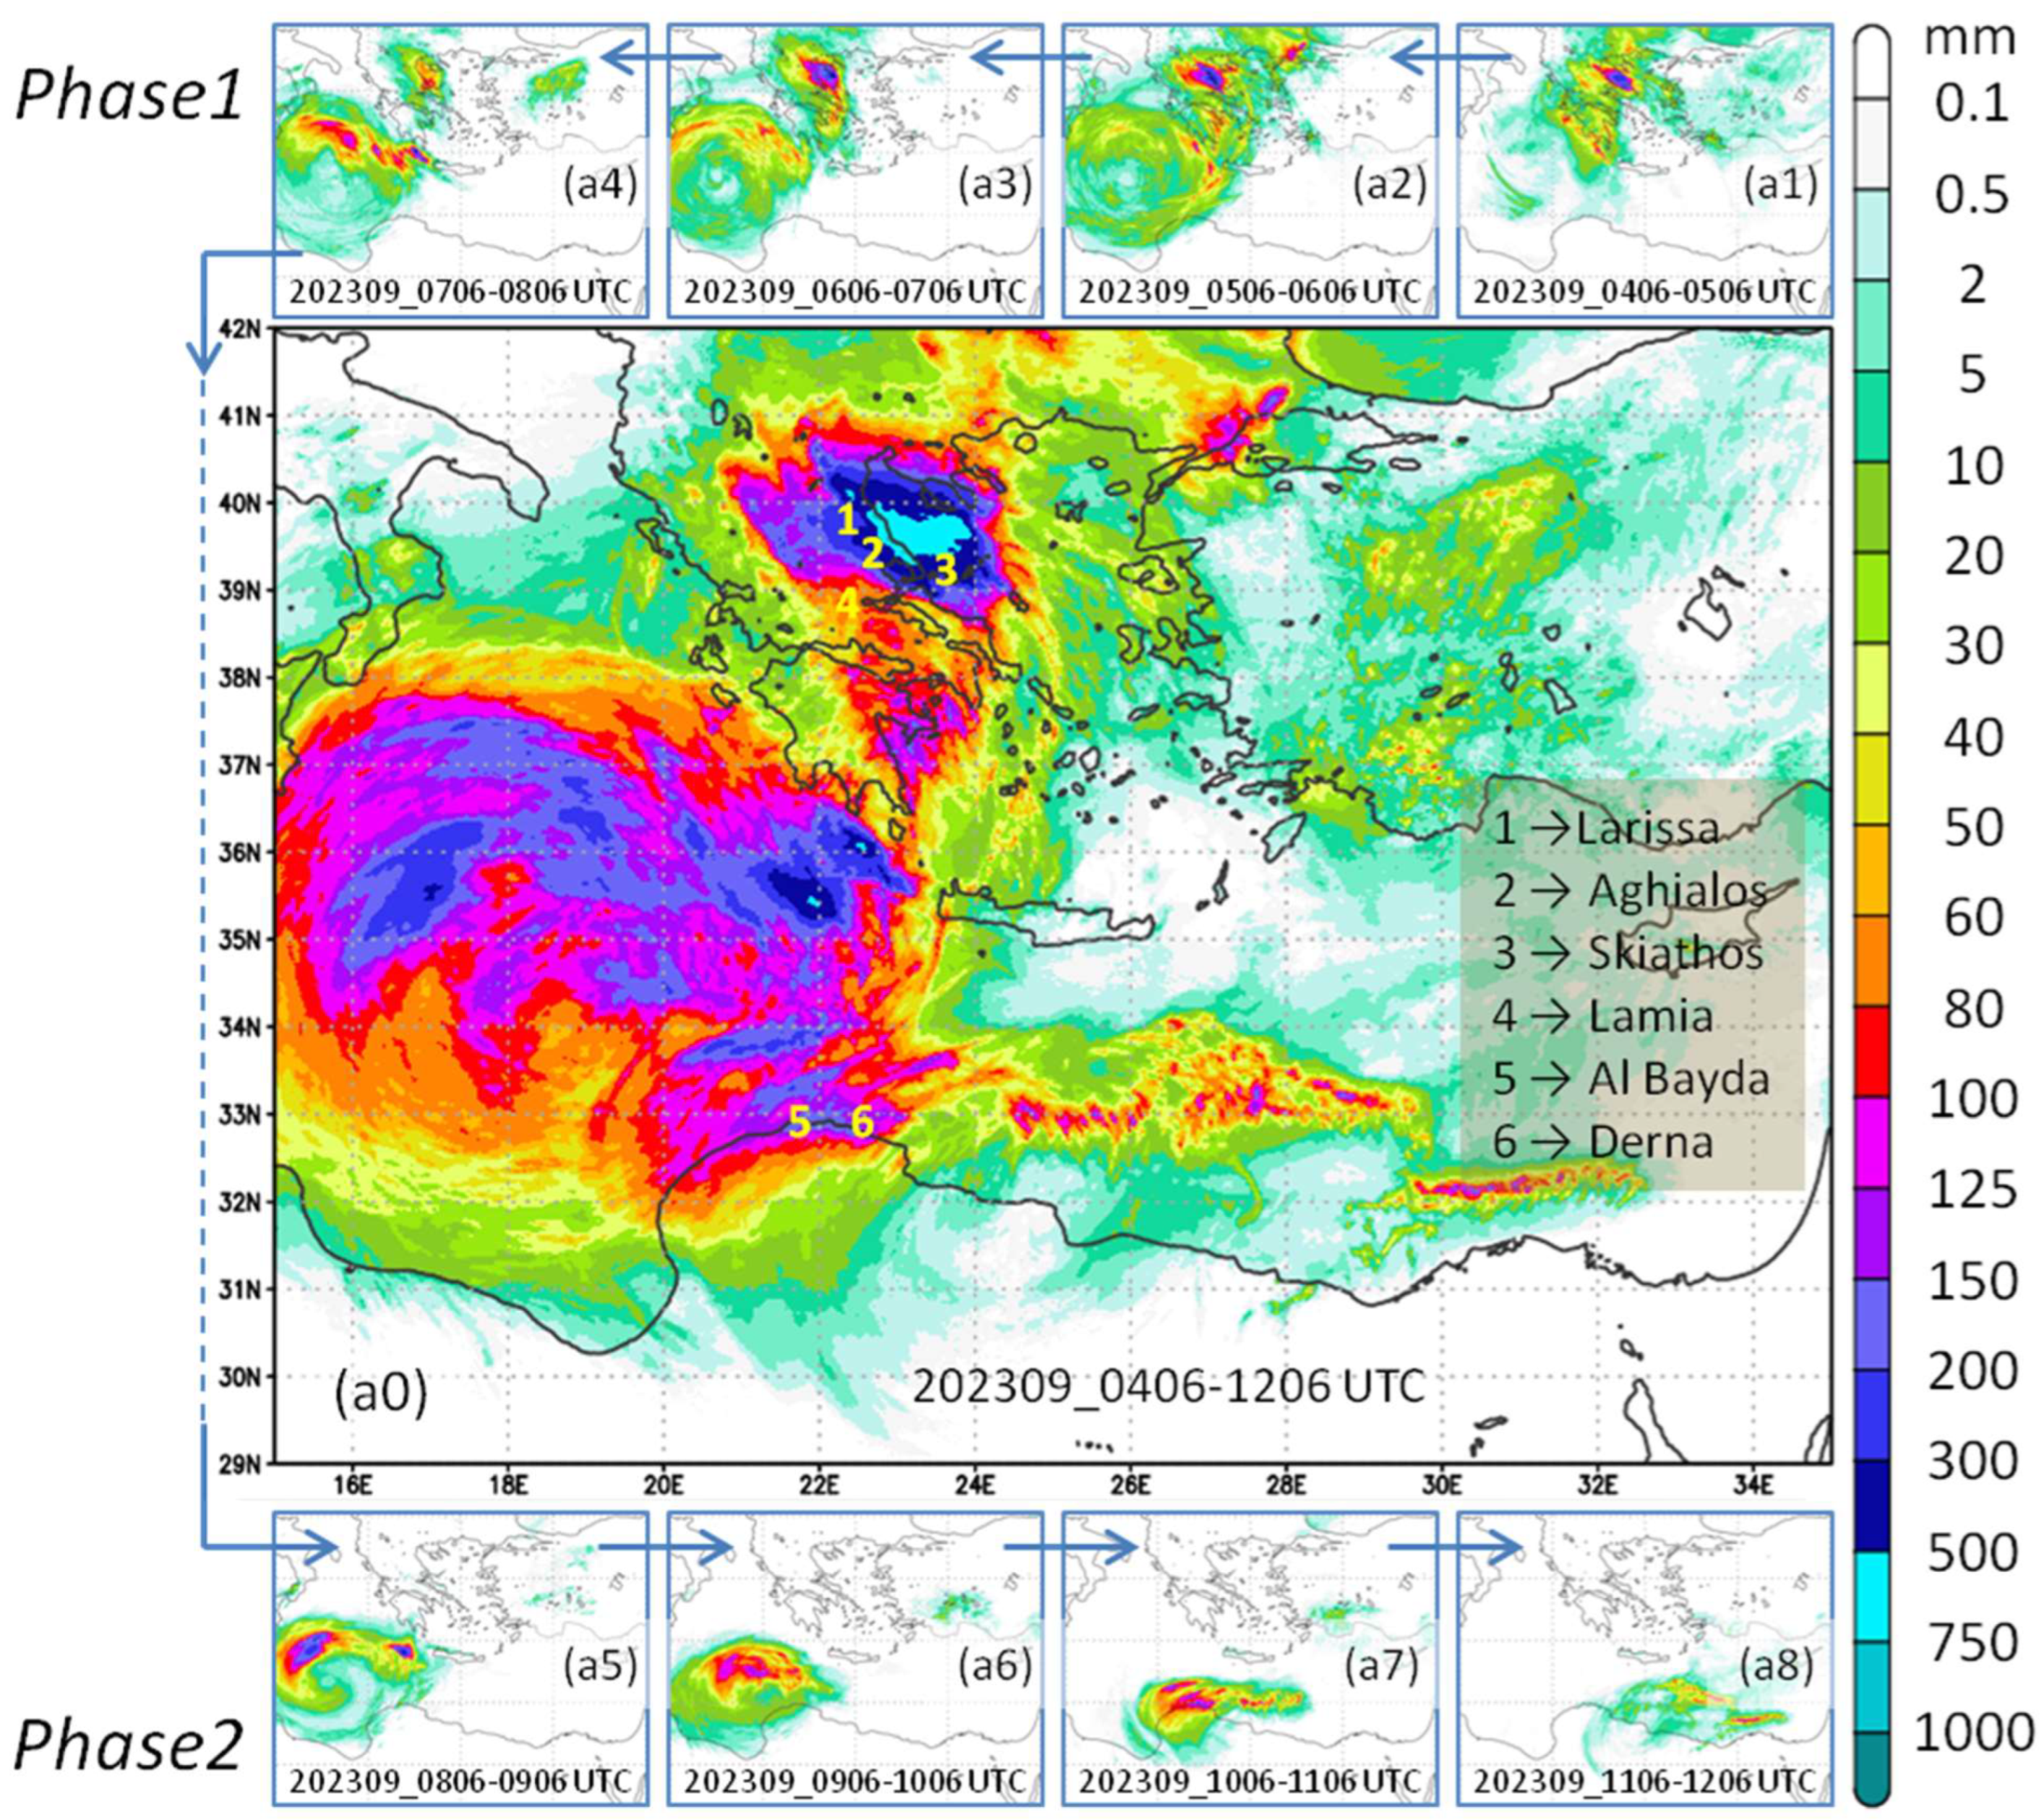
Figure 7b can be considered a proper balance between the restriction of the ICON model spin-up time and the forecast range closest to the analysis of 00 UTC, and is analyzed to gain further insight into the daily development of the medicane (
Figure 8). It is placed in the middle of the figure (
Figure 8(a0)) along with the positions of the most affected synoptic stations of Greece (Larissa, Aghialos, Skiathos, and Lamia) and the areas of Libya (Al Bayda and Derna). The accumulated precipitation of the 24 h intervals of the eight forecasted periods that are summed in
Figure 8(a0) are placed in the upper and lower rows in a counterclockwise order. They start from the 06–30 h accumulated precipitation of the model run referring to 4 September 2023 at 00 UTC denoted as “202309_0406-0506 UTC” (
Figure 8(a1)) and move sequentially to the other cases up to “202309_1106-1206 UTC” (
Figure 8(a8)). The upper row graphs (
Figure 8(a1–a4)) expand Phase 1 [
14], the development of the medicane that affected Greece hazardously, with forecasted accumulated precipitation reaching the scale of 300–500 mm and mounting to the scale of 500–750 mm in the coastal area of Thessaly and the northern Aegean (
Figure 8(a0)). The lower row graphs (
Figure 8(a5–a8)) expand Phase 2 [
14], the devastating development of the medicane in the coastline of Libya, with the 24 h forecasted accumulated precipitation reaching the scale of 300–500 mm in the marine area south of Sicily (
Figure 8(a5)) and mounting to the scale of 150–200 mm in the area defined by Al Bayda and Derna on the 10 September 2023 (
Figure 8(a0,a7)) when the medicane became fatal for this area.
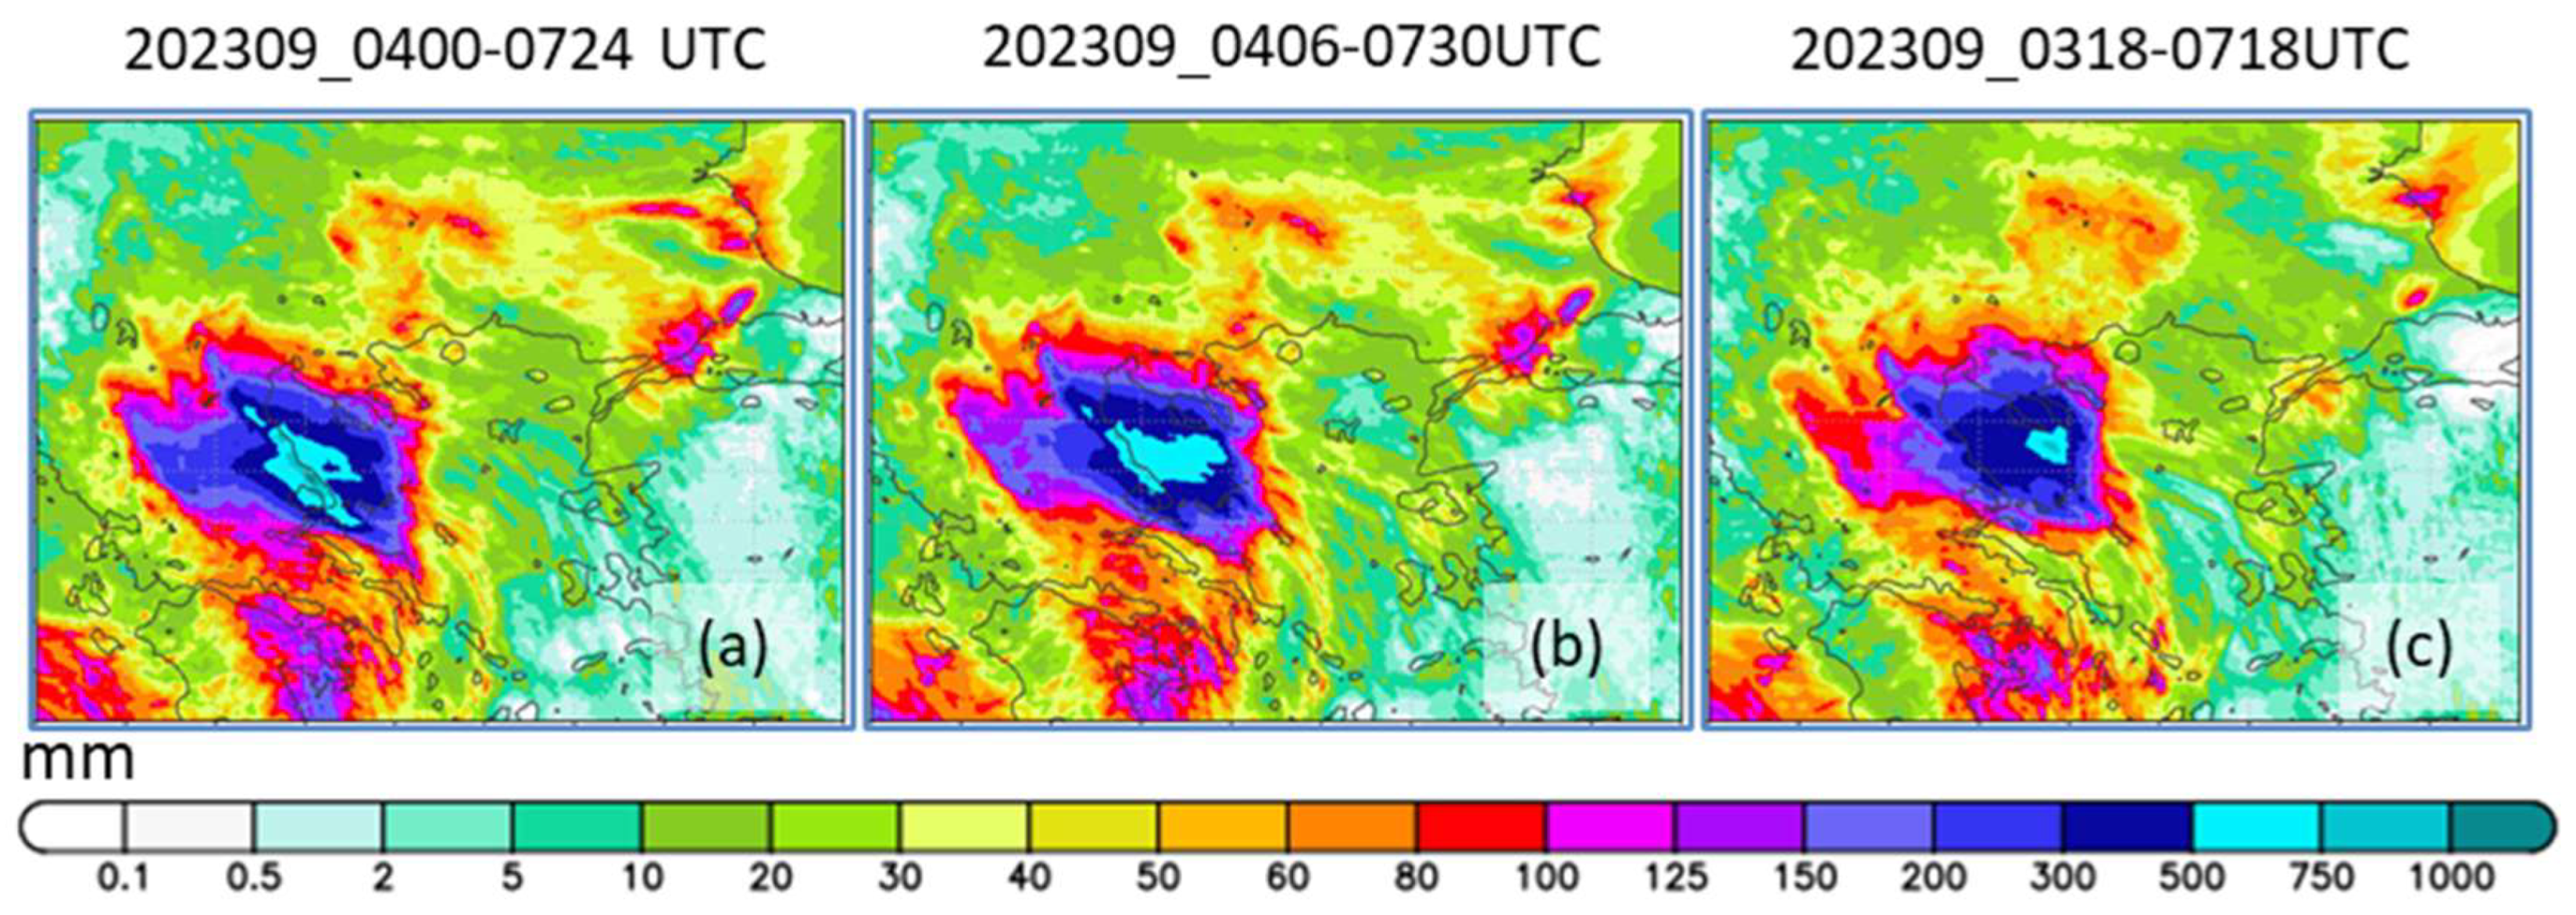
Based on the above analysis, the two-phase evolution of the medicane for the rather distinct climatological areas of Greece and Libya was reasonably represented by the sequential ICON model forecasts. Furthermore, the specific framework of the model’s performance for Phase 1 covering the period from the 4–7 September 2023 over central Greece is highlighted in
Figure 9 and is denoted as “202309_0400-0724 UTC”. Notably,
Figure 9a is in good analogy when contrasted to the one covering the same domain and the forecast range of the ECMWF-IFS run chosen by Hewson et al. ([
36] Figure 6). However, the area of the four-day accumulated precipitation maximum (500–750 mm) is significantly enlarged in the ICON runs probably due to differences in the treatment of the model’s spin-up time, physical parameterization, and non-hydrostatic nature. For the ICON model runs referring to the later lead times of 00 + 06 h (
Figure 9b) and 00 + 18 h (
Figure 9c) referred to as “202309_0406-0730 UTC” and “202309_0318-0718 UTC”, respectively, the above four-day accumulated precipitation maximum area is displaced eastwards to the marine area on the northwestern Aegean.
3.5. Comparisons of the ICON Model’s Accumulated Precipitation with Observations over Greece
The model’s performance is evaluated against the accumulated precipitation of the available HNMS synoptic stations over the 4-day period of 4–7 September 2023. The position network of the HNMS synoptic stations is displayed in
Figure 10, with special focus given to the stations of Larissa, Skiathos, Aghialos, and Lamia (bold yellow “X” marks) as the areas most affected by the medicane [
50]. The corresponding accumulated precipitation of this critical period is referenced in
Figure 9b,c as corresponding lead times lie in the forecast range coinciding with the available observations from the synoptic stations.
The equitable threat scores (ETSs) [
24,
47] from the available synoptic meteorological stations of the HNMS are given in
Figure 11a. According to the WMO convention followed, the accumulated precipitation is recorded in 12 h intervals, the first starting at 18 UTC of the previous day and concluding at 06 UTC of the next day and the second covering the period from 06 UTC to 18 UTC of the same day.
ETS is defined in reference to the number of observations
N as follows:
where
h refers to the number of hits (i.e., both the model and the observations are above the given threshold);
f to the number of “false alarms” (i.e., only the model or the observations are above the given threshold);
m to the number of misses (i.e., only the model or the observations forecast any precipitation); and −1/3 <
ETS < 1 (1 considered as best).
In this framework, three ETSs are given covering the above critical four-day period at seven thresholds of 0.1, 1, 5, 10, 20, 30, and 40 mm. The first ETS refers to the forecast period of 06–18 h from the four 48 h model runs (4–7 September) concerning the 191 available observations of the first 12 h interval. The second ETS refers to the forecast period of 18–30 h from the four 48 h model runs (4–7 September) for the 256 available observations of the second 12 h interval. The third ETS refers to the forecast period of 30–42 h from the four 48 h model runs (3–6 September) for the same 191 available observations of the first 12 h interval. Thus, the first and third ETS lead times differ by 24 h, providing an insight into the model’s performance difference on two sequential runs with lead times that differ by 24 h. All ETSs fall as the thresholds increase; however, the first ETS score of 06–18 h has the best performance, showing that the accumulated precipitation with the earliest lead time provides the better forecast, with no particular impact regarding the spin-up time after the 6th hour of the forecast.
The total accumulated precipitation of the three 12 h forecast periods is compared with the observations in
Figure 11b. As expected from
Figure 9b,c, the total forecasted precipitation is overestimated for the 06–18 h forecast (1573 vs. 1219 mm), slightly overestimated for the 18–30 h forecast (1157 vs. 1097 mm), and underestimated for the 30–32 h forecast (983 vs. 1219 mm). However, the agreement between the forecast and observations is at the level of 80% for the 06–18 h and 30–42 h forecasts and over 90% for the 18–30 h forecast, which could be considered very good to excellent for this extreme event.
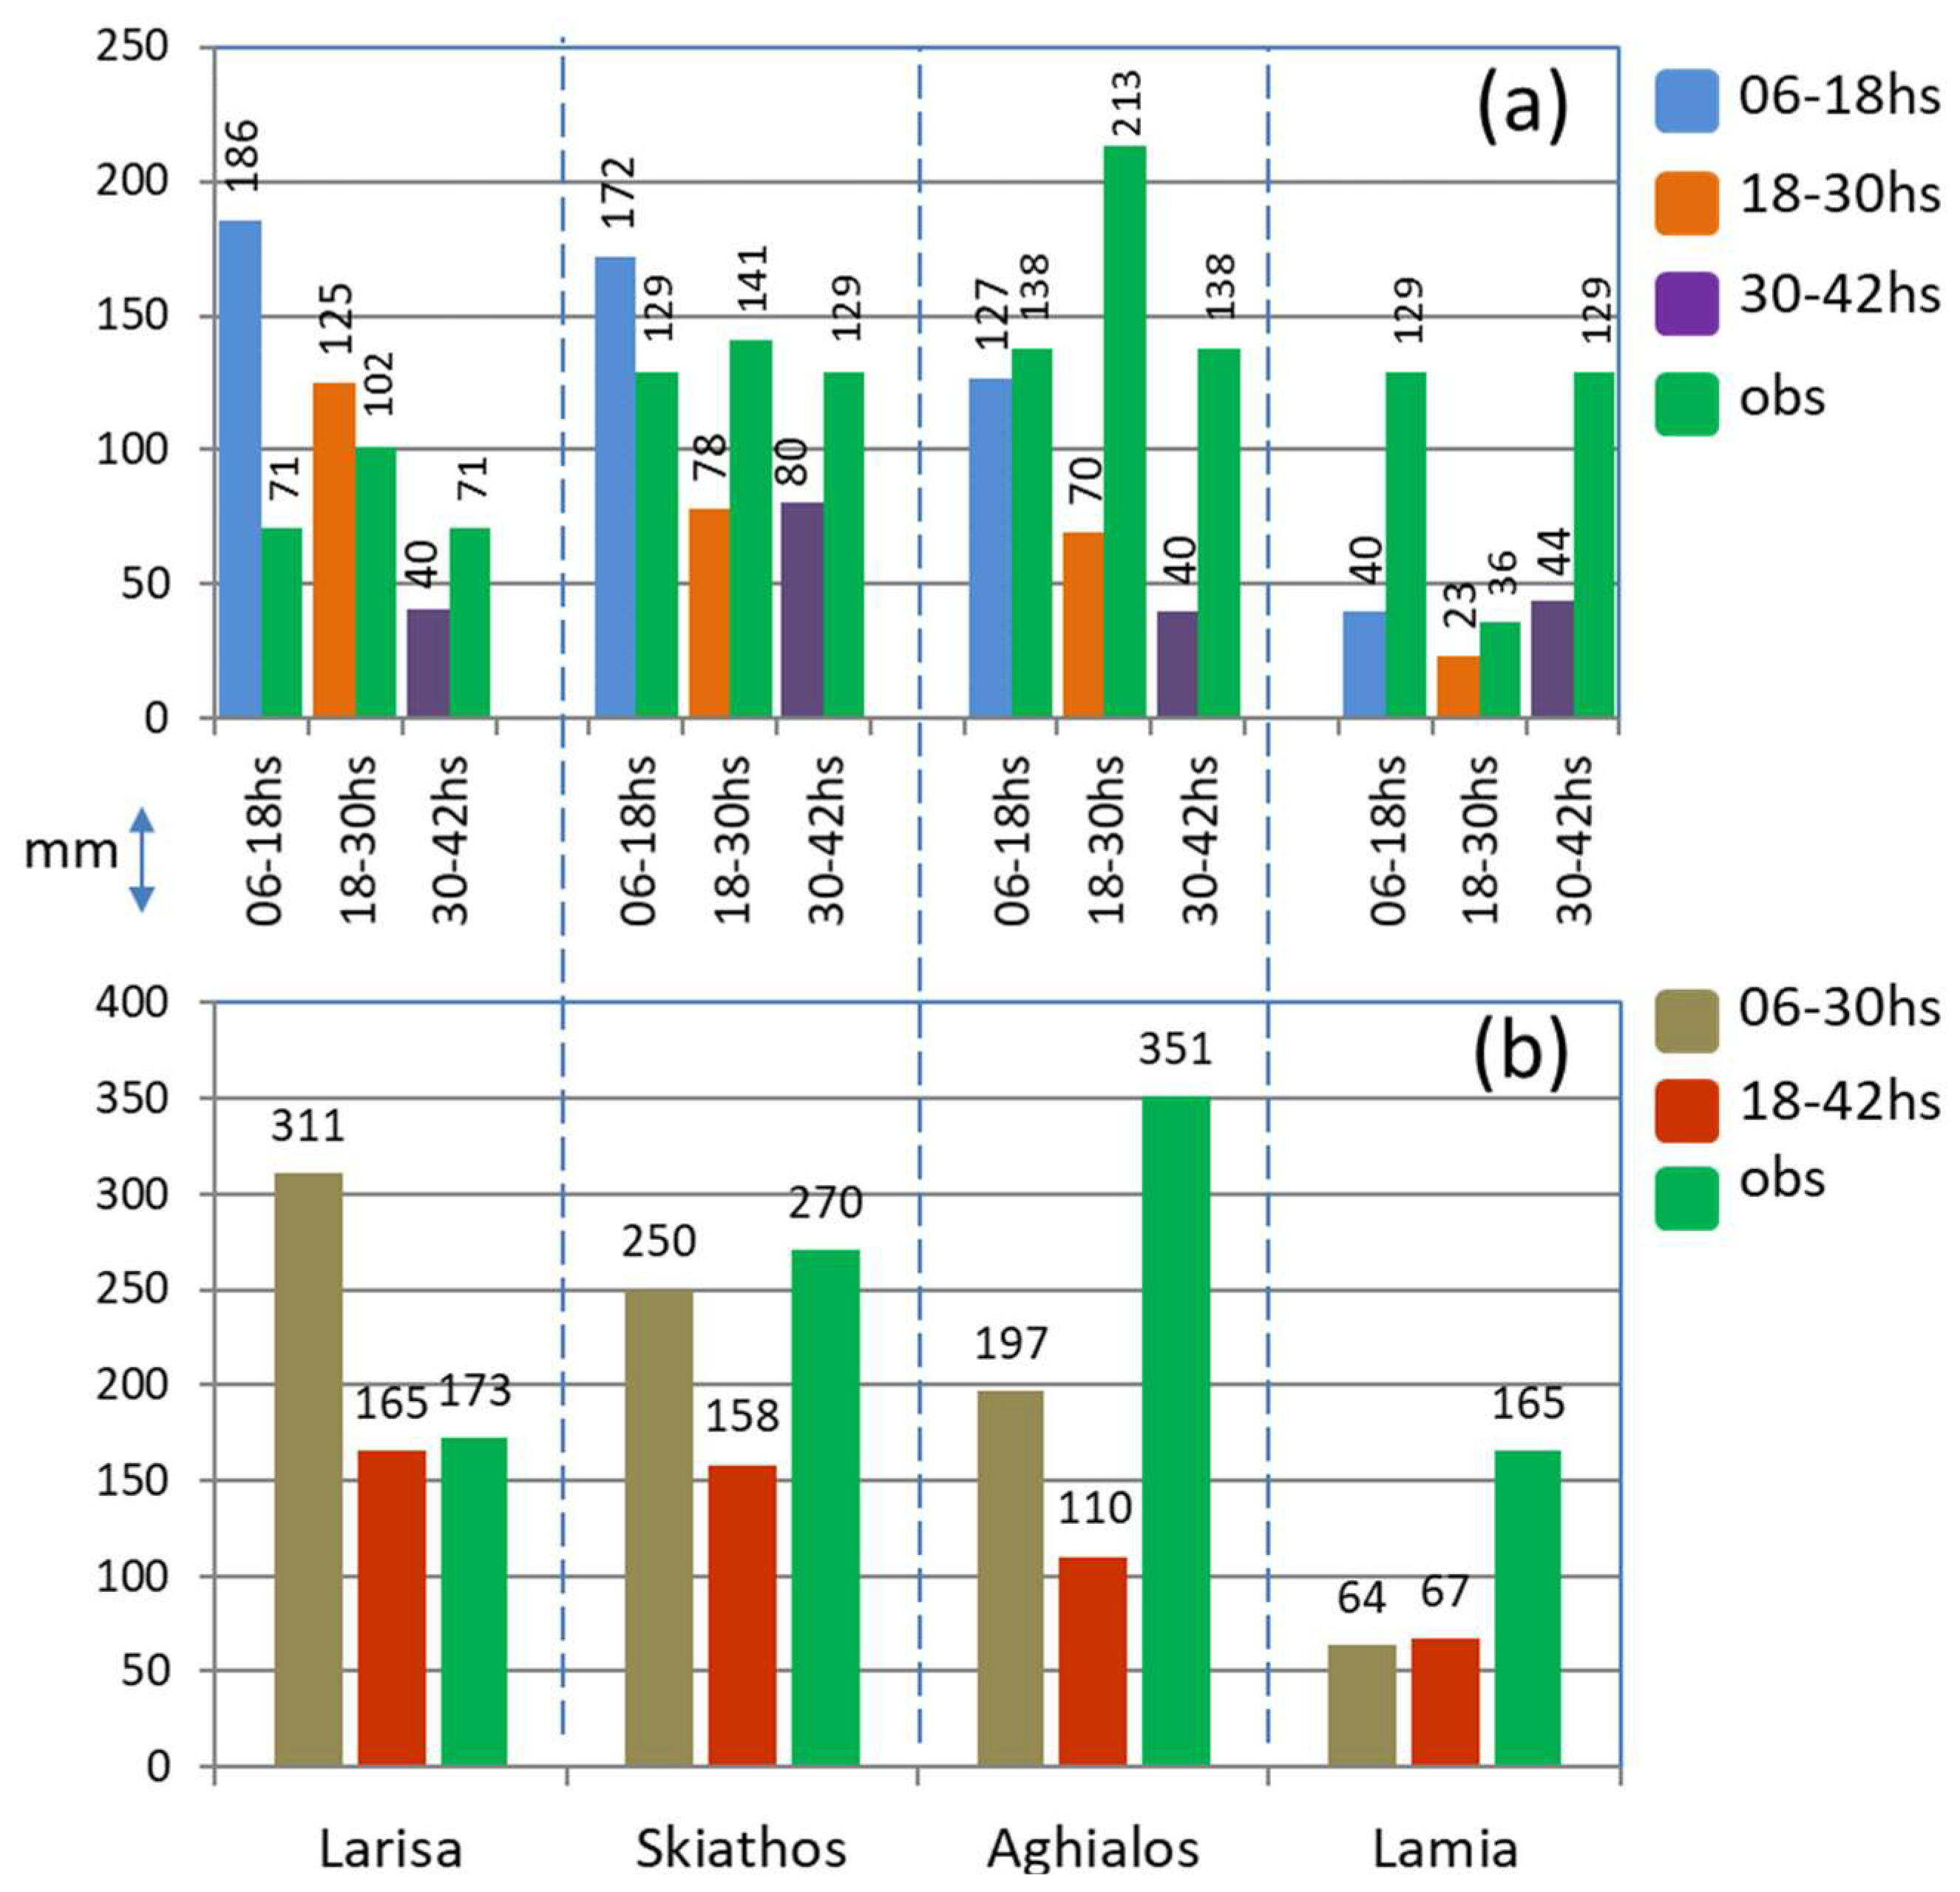
More specifically, comparisons of the model with observations for the most affected stations of Larisa, Skiathos, Aghialos, and Lamia for the period 4–7 of September 2023 are given for the 12 h and 24 h accumulated precipitation (
Figure 12a and
Figure 12b respectively). For the 12 h forecasted period of 06–18 h (
blue vs.
green paired columns of
Figure 12a), the accumulated precipitation is noticeably overestimated for Larissa (186 vs. 71 mm), clearly overestimated for Skiathos (172 vs. 129 mm), slightly underestimated for Aghialos (127 vs. 138 mm), and underestimated to a considerable extent for Lamia (40 vs. 129 mm coincidentally, the same value as the one observed for Skiathos). Notably, as these stations as representative of this critical area, the sum of these forecasted values is in an excellent ~90% agreement with the observations (525 vs. 467 mm). In a similar fashion, for the 12 h forecasted period of 18–30 h (
orange vs.
green paired columns of
Figure 12a), the accumulated precipitation is slightly overestimated for Larissa (125 vs. 102 mm), clearly underestimated for Skiathos (78 vs. 141 mm), significantly underestimated for Aghialos (70 vs. 213 mm), and modestly underestimated for Lamia (23 vs. 36 mm). For this period, the overall agreement drops to a fair to modest ~60% agreement with observations (296 vs. 492 mm). Also, for the 12 h forecasted period of 30–42 h (
purple vs.
green paired columns of
Figure 12a), the accumulated precipitation is clearly underestimated for Larissa (40 vs. 71 mm), clearly underestimated for Skiathos (80 vs. 129 mm), significantly underestimated for Aghialos (40 vs. 138 mm), and significantly underestimated for Lamia (44 vs. 129 mm). For this period, the overall agreement drops to a quite modest ~43% agreement with observations 204 vs. 467 mm).
The model’s performance can be characterized better if the 24 h accumulated precipitation forecasts are considered in compliance with the official report of the HNMS [
50]. This is achieved by simply adding the accumulated precipitation of the 18–30 h to the 06–18 h and 30–42 h period to obtain the 06–30 h period and 18–42 h period, respectively (
Figure 12b). For the 24 h forecasted period of 06–30 h (
gray vs.
green columns of
Figure 12b), the accumulated precipitation is noticeably overestimated for Larissa (311 vs. 173 mm), slightly underestimated for Skiathos (250 vs. 270 mm), clearly underestimated for Aghialos (197 vs. 351 mm), and markedly underestimated for Lamia (64 vs.165 mm). For the 24 h forecasted period of 18–42 h (
red vs.
green columns of
Figure 12b), the accumulated precipitation is very slightly underestimated for Larissa (165 vs. 173 mm), clearly underestimated for Skiathos (158 vs. 270 mm), and underestimated to a considerable extent for Aghialos (110 vs. 351 mm) and Lamia (67 vs.165 mm).
From the above analysis and considering the extraordinary precipitation totals, an agreement with observations over 50% might be considered a good model performance. From this perspective, the model gave relatively good performances for Larisa and Skiathos, good (especially for the 06–30 h period) to modest for Aghialos, and very modest to poor for Lamia, considering the underlying physical and numerical complexities associated with the model’s performance regarding the extreme precipitation observed.
4. Discussion
In this work, the hazardous nature of medicane “Daniel” associated with extreme precipitation over Greece was adopted as motivation to investigate the performance of a well-established version of the regional ICON model [
41]. Our investigation was based on a sequence of 48 h model runs starting at 00 UTC for the period from 3 to 11 September 2023 stemming from the ECMWF-IFS global model. AN overview of the synoptic situation was considered by comparing the 00 UTC analysis of the sequential model runs with the 24 h forecast of the previous day’s runs for GPH500, T850, and MSLP. The model’s performance was in very good agreement with GPH500, while T850 and MSLP were underestimated and overestimated, respectively, especially over the critical periods and in areas of central Greece and the coastline of Libya. The first 24 h of these runs were used in sequence to simulate the medicane tracking referenced to the critical minimum MSLP. It was found that the resulting tracking (
Figure 4) was in very good agreement with the analysis results of other works [
14,
25,
30,
34,
35]. The 48 h forecast range was also used to check the model’s performance via differences in the minimum MSLP between the first 24 h (00–24 h) period of a case run and the second 24 h period (24–48 h) of the case referring to the previous date (
Figure 5 and
Figure 6). A good performance was found, especially for the period 4–7 September 2023, the first phase of the medicane, as designated by EUMETSAT [
14], when it was most hazardous over Greece.
The forecasted precipitation was first investigated via the sums of the eight 24 h model forecasts covering the period of 4–12 September 2023 for the 00–24 h, 06–30 h, and 18–42 h periods (
Figure 7), with the model depicting the critical areas of Greece and Libya devastated by extreme precipitation. The two phases of medicane development [
14] were analytically presented via the sequential presentation of 06–30 h accumulated precipitation forecasts during the above period (
Figure 8). Both phases of the period were clearly shown regarding extreme precipitation over Greece and Libya.
The emphasis on the hazardously affected area of central Greece from 4 to 7 September 2023 was presented via the sum of accumulated precipitation during 00–24 h of the corresponding model runs (
Figure 9a). This result established good conformity with the work of Hewson et al. [
36] stemming from ECMWF-IFS resources, especially regarding the area associated with the highest amount of forecasted precipitation in the range of 500–750 mm. Also, the sums of accumulated precipitation for the 06–30 h and 18–42 h forecasts of the model runs were shown (
Figure 9b,c) where the area of highest precipitation progressively moved to the marine region. As a comparative validation, the 12 h accumulated precipitation of the available synoptic stations was considered via the ETSs for the forecast periods of 06–18 h, 18–30 h, and 30–42 h. For the same period, the ETS for 06–18 h preponderated, as expected, especially against the ETS for 30–42 h that included the same observations but at a lead time period advanced by 24 h. Of particular value is the very good agreement of the total forecasted precipitation summed over all available stations with the corresponding observations for all of the above 12 h periods. Regarding the specific observations for the most affected synoptic stations, the model’s performance was good for the stations of Larisa and Skiathos but quite modest for Aghialos and Lamia stations.
The results display an overall fair to good description of the extreme nature of the event throughout its 10-day development, despite the limitation of the fixed SST during the model runs, especially in connection to the subsequent air–sea coupling which is a current developing issue within the ICON community. It is acknowledged that this limitation may influence the representation of precipitation extremes. Future improvements could also involve the use of coupled ocean–atmosphere configurations and (or even more challenging
combined with) ensemble forecasting approaches to better capture variability and reduce potential biases. Also, the high-resolution grid mesh placed considerable strain on the model’s convection schemes, affecting the deterministic estimation of the nearly unparalleled precipitation levels in this region. This feature is expected to be further investigated regarding model tuning or even developments in the dynamics and physics of the precipitation schemes. Through this advancement, key options could be integrated into a high-resolution ensemble system built on the ICON model, improving its predictive capabilities in the style of the EPS, particularly through selected ensemble members [
36].
This work is expected to add a consistent approach regarding the operational application of NWP models, the regional ICON in particular, for the investigation of complicated extreme weather events. It is expected that the model’s performance will improve upon the development of an operational coupled version of the ICON-LAM NWP model in analogy to its climate version [
51] but also via special model parameter tuning, as in the case in the COSMO model, the predecessor of the regional ICON-LAM model [
47]. Also, it is expected to motivate researchers to test various NWP model physics implementations in extreme weather conditions with the aim of further understanding the prevailing physical processes, an exceptionally complex and rewarding subject. From the perspective of the COSMO, of special interest is expected to be the implementation of this model with different aerosol climatologies using ICON under the Clouds and Aerosols Improvements in ICON Radiation Scheme (CAIIR) priority project of the COSMO [
52], which is the supporting framework for further development of this work. The straightforward display of the results associated with the extreme precipitation and the subsequent flooding in the Thessaly region is expected to foster and justify the current research by the operational weather forecasting centers and research institutes, as well as the associated civil protection authorities, in support of their continuously expanding needs for critical and genuine decision making. Nevertheless, although regional NWP models are excellent operational tools, especially regarding short-range weather forecasting, for cases of that scale of devastation, they are expected to act complementary to deterministic global models or ensemble systems. However, they may provide valuable insights into the location of the areas most at risk, especially in light of the possibility of combining such models with artificial intelligence or deep learning algorithms.
