Submicron Particles and Micrometeorology in Highly Densified Urban Environments: Heavy-Tailed Probability Study
Abstract
1. Introduction
Micrometeorology, Global Warming, and Relative Humidity
2. Materials and Methods
2.1. Area of Study
2.2. Measuring Instruments
2.3. Theoretical Framework
3. Results
3.1. Submicron Particles (SP) and Urban Meteorological Measurements
3.2. Historical and Periodic Temperature Measurements
3.3. The Kolmogorov Entropies of Pollutants and Urban Meteorology During the 2019/2022 Period Influence the Entire Basin of Geomorphology
3.4. Spearman Correlation
3.5. Heavy-Tailed Distribution
4. Discussion
5. Conclusions
- The behavior of SPs around 0.3 µm supports the hypothesis of an extreme condition environment, as its predictability aligns with a heavy-tail probability distribution.
- Urban micrometeorology (at heights below 20 m), characterized by relative humidity and temperature, when exposed to strong thermal stress (urban heat islands, heat waves, and urban canyons), enhances the relevance of the heavy-tail probability model, which reflects the persistence of SPs and fine particulate matter.
- The upper floors of tall buildings (such as those located 12 m above ground level) are not immune to the effects of concentration and persistence of SPs and fine particulate matter.
- There are periods of the day (morning, midday, late afternoon–evening) during which the behavior of particulate matter shows similar heavy-tail probabilities across measurement intervals—regardless of whether the location is inside or outside a building. In this study, the morning period exhibited such behavior.
- The behavioral model described, based on data collected during the summer period, was consistent across all measurements taken over a span of four weeks.
- The behavior and properties of coarse particulate matter can, as a first approximation, be extended to fine particulate matter.
- A highly densified urban environment significantly favors the presence (in both number and concentration) of SPs and fine particulate matter, substantially increasing the probability of severe health impacts on the population.
Author Contributions
Funding
Institutional Review Board Statement
Informed Consent Statement
Data Availability Statement
Acknowledgments
Conflicts of Interest
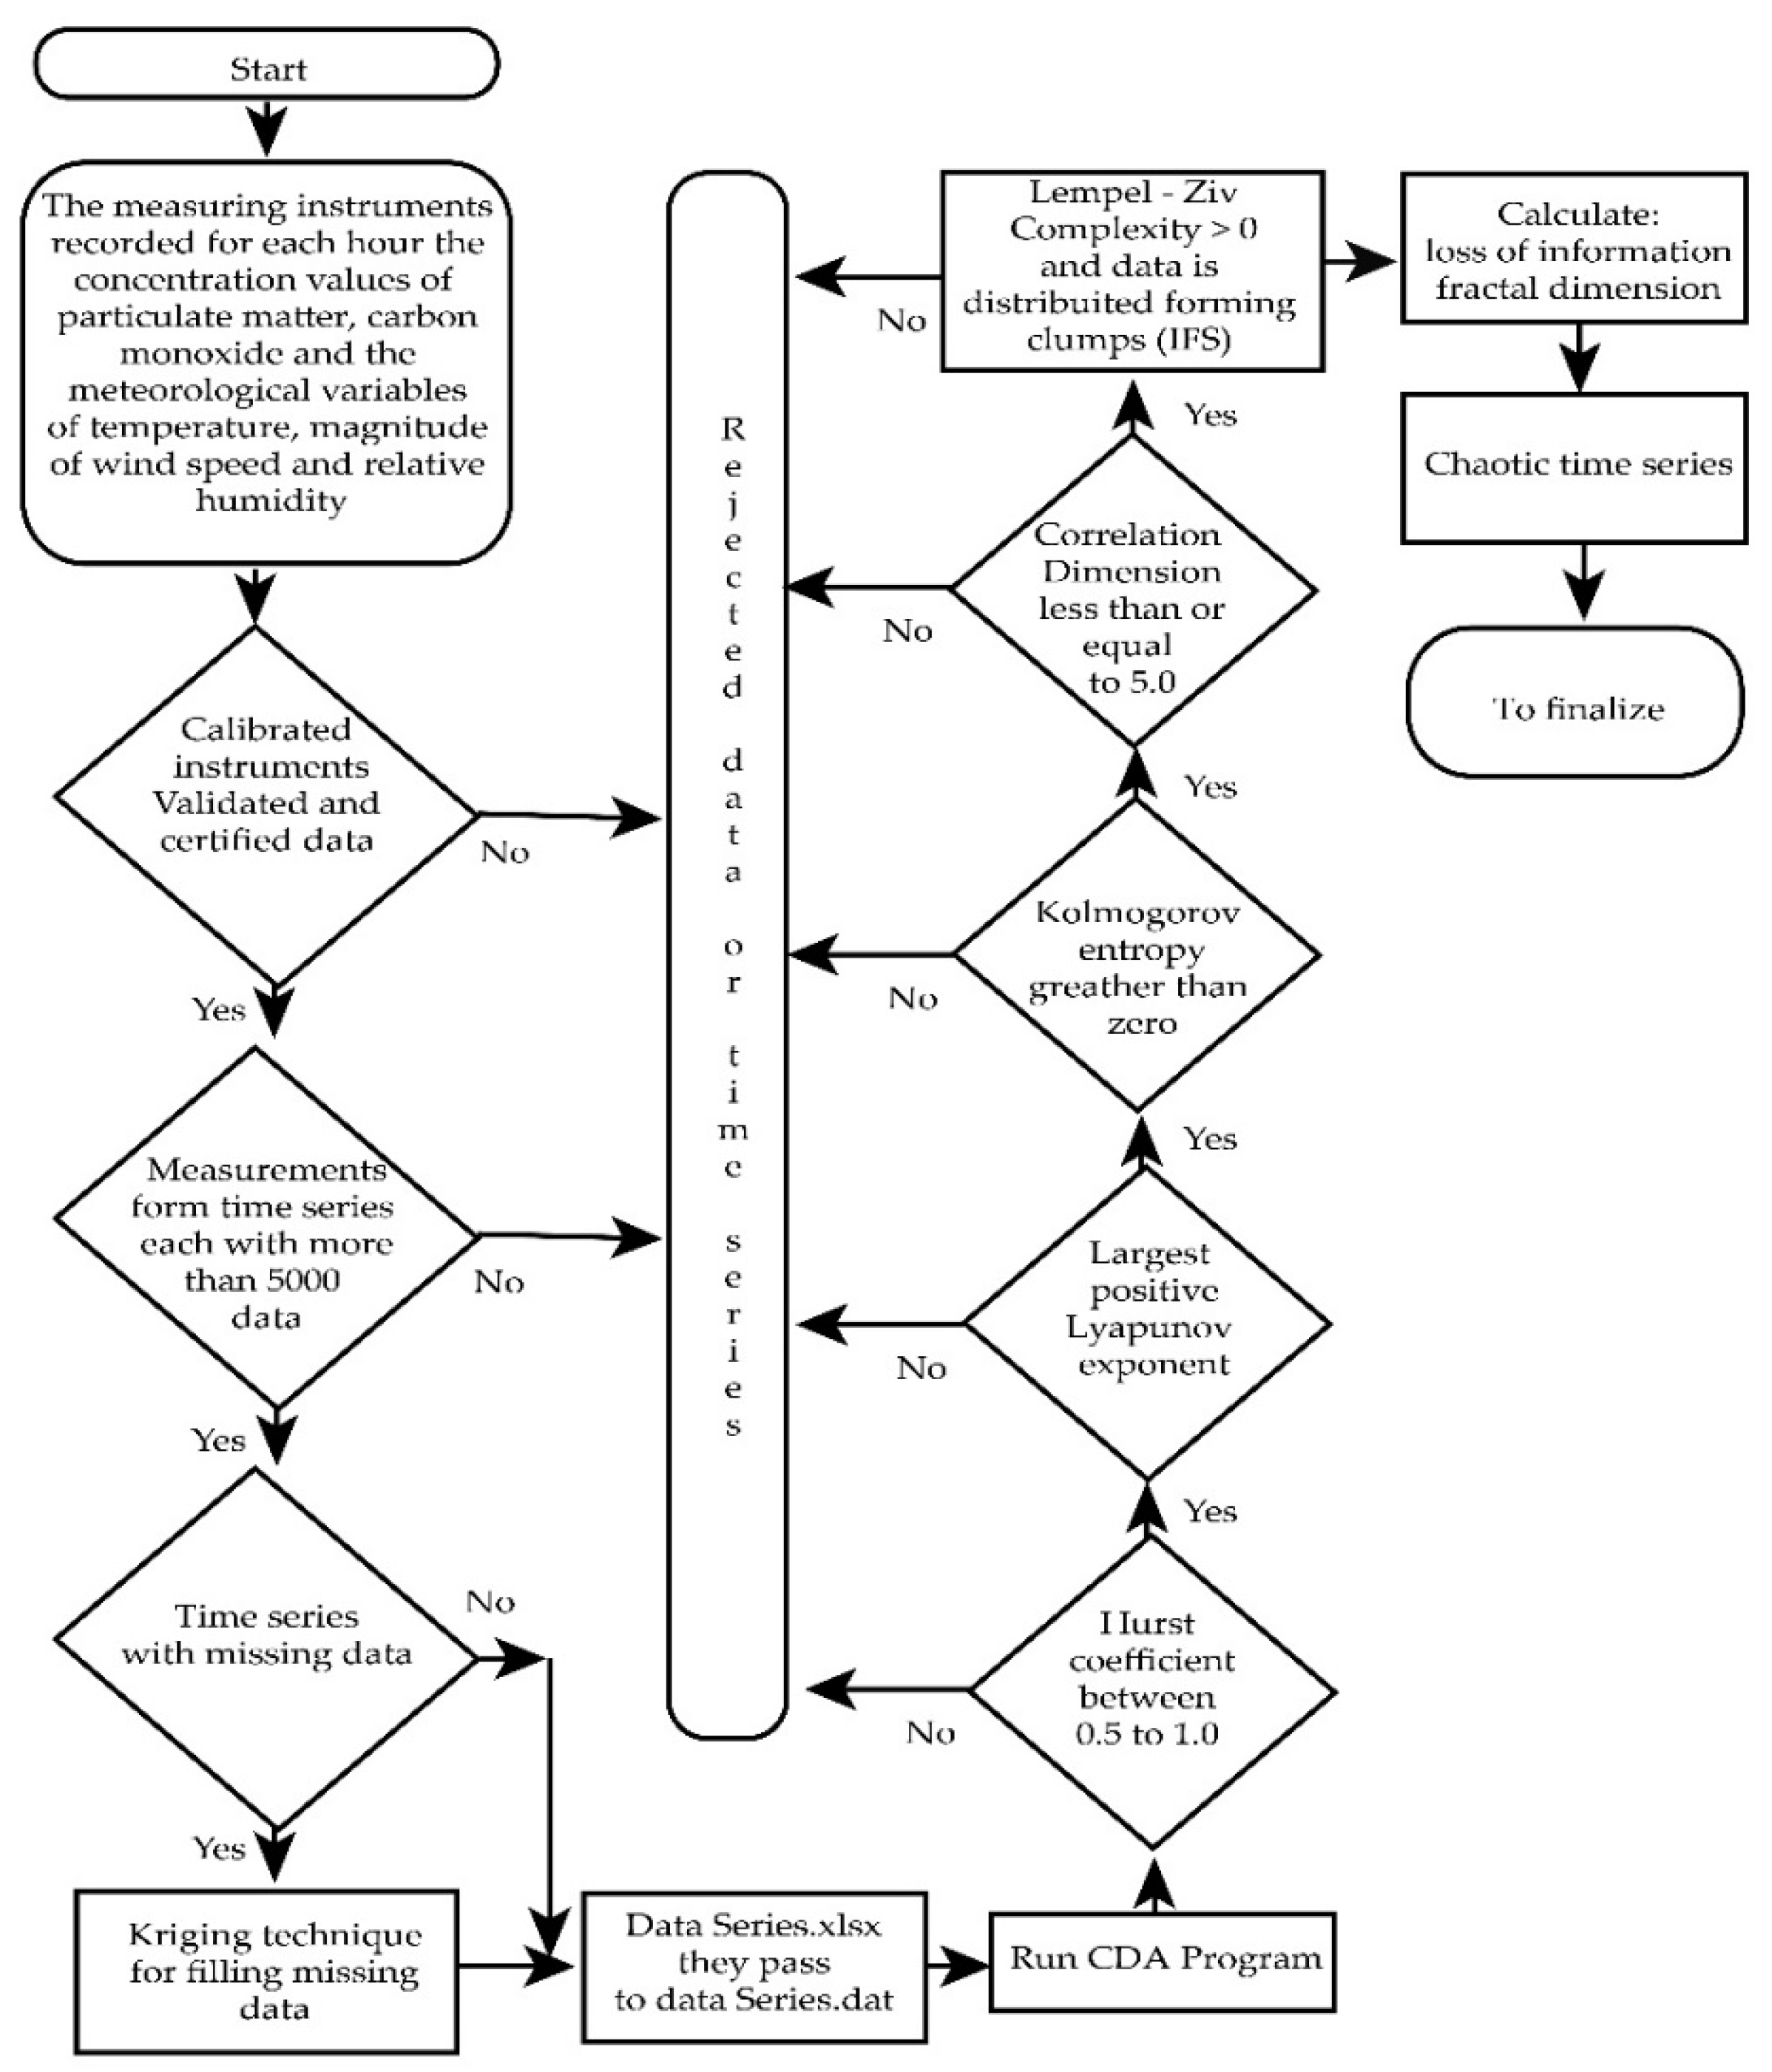
Appendix A
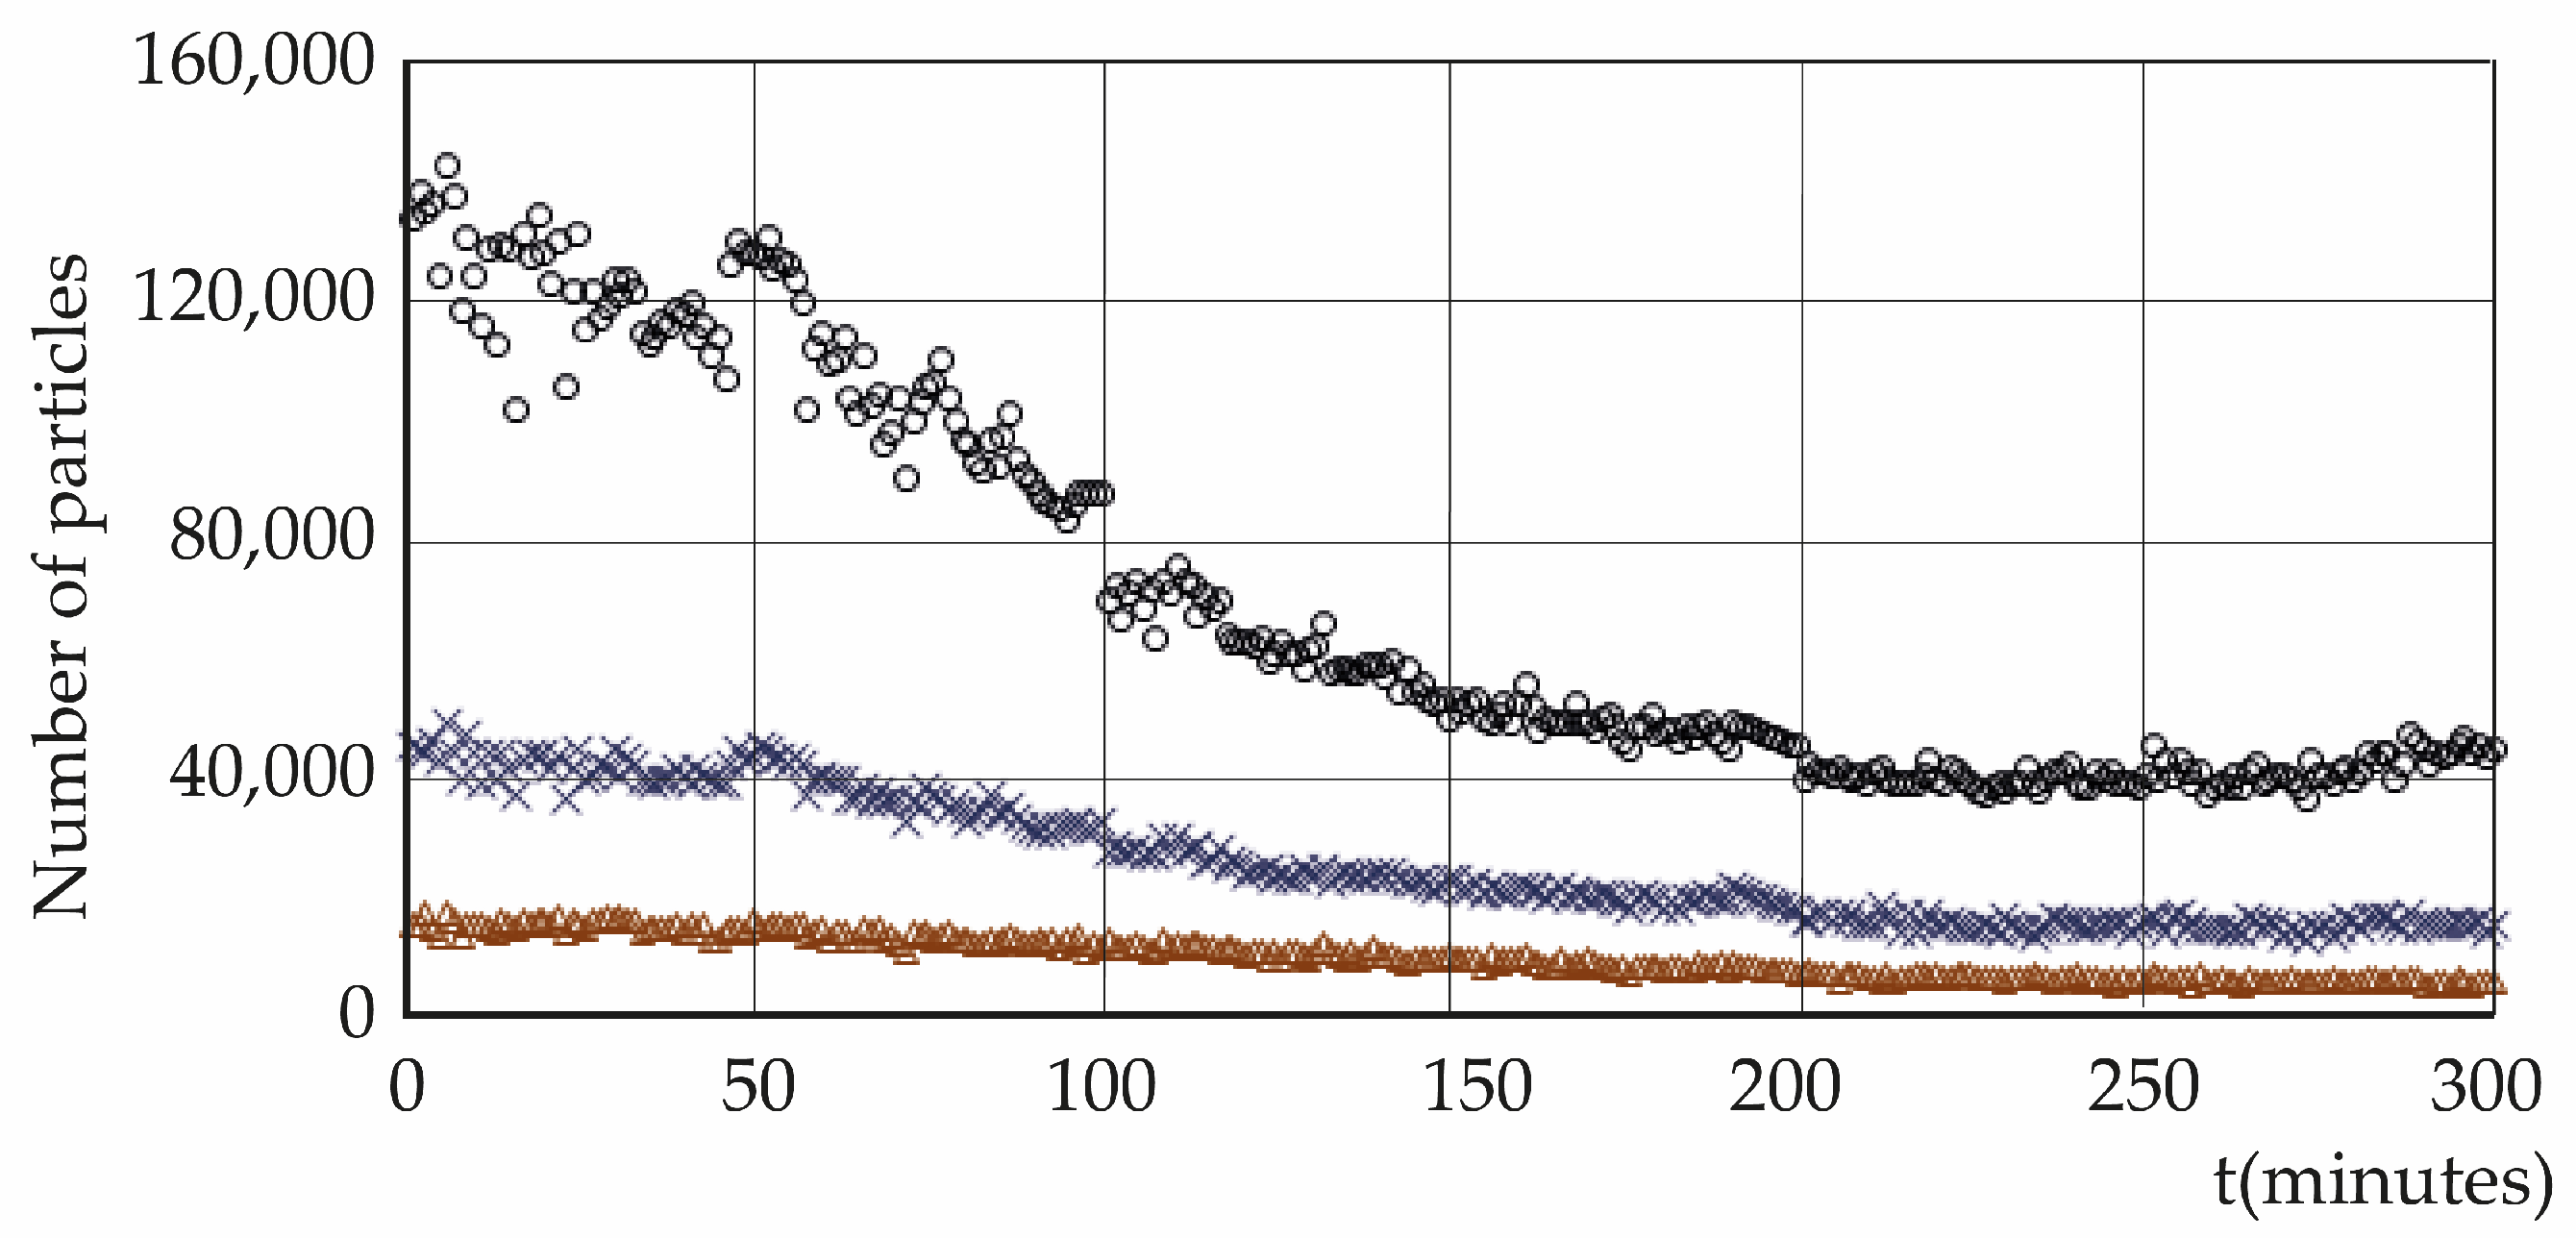
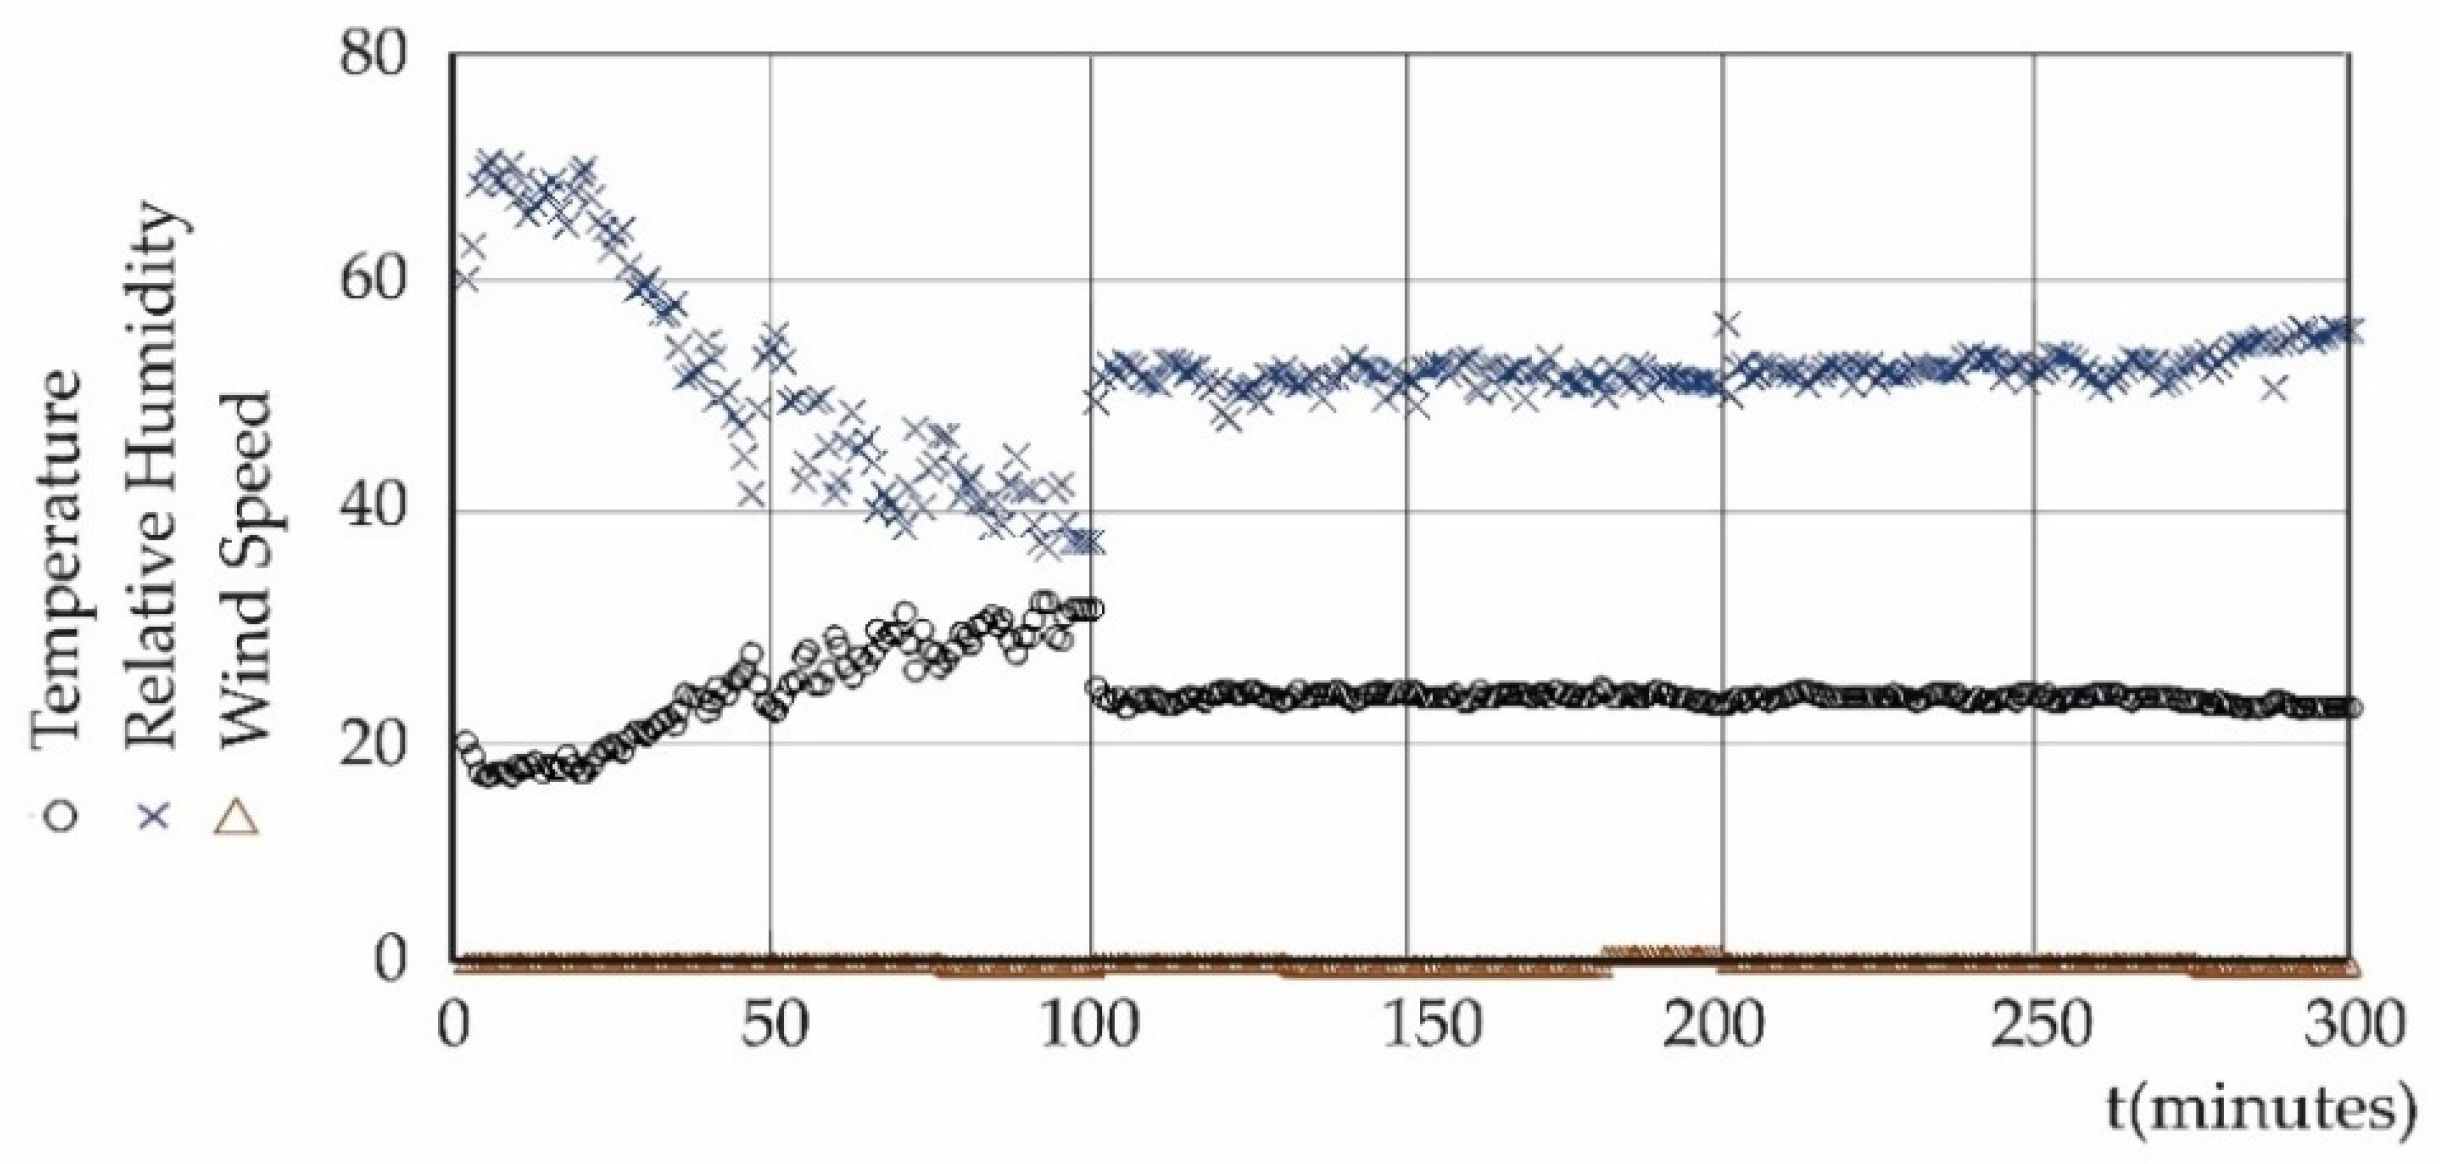
Appendix B
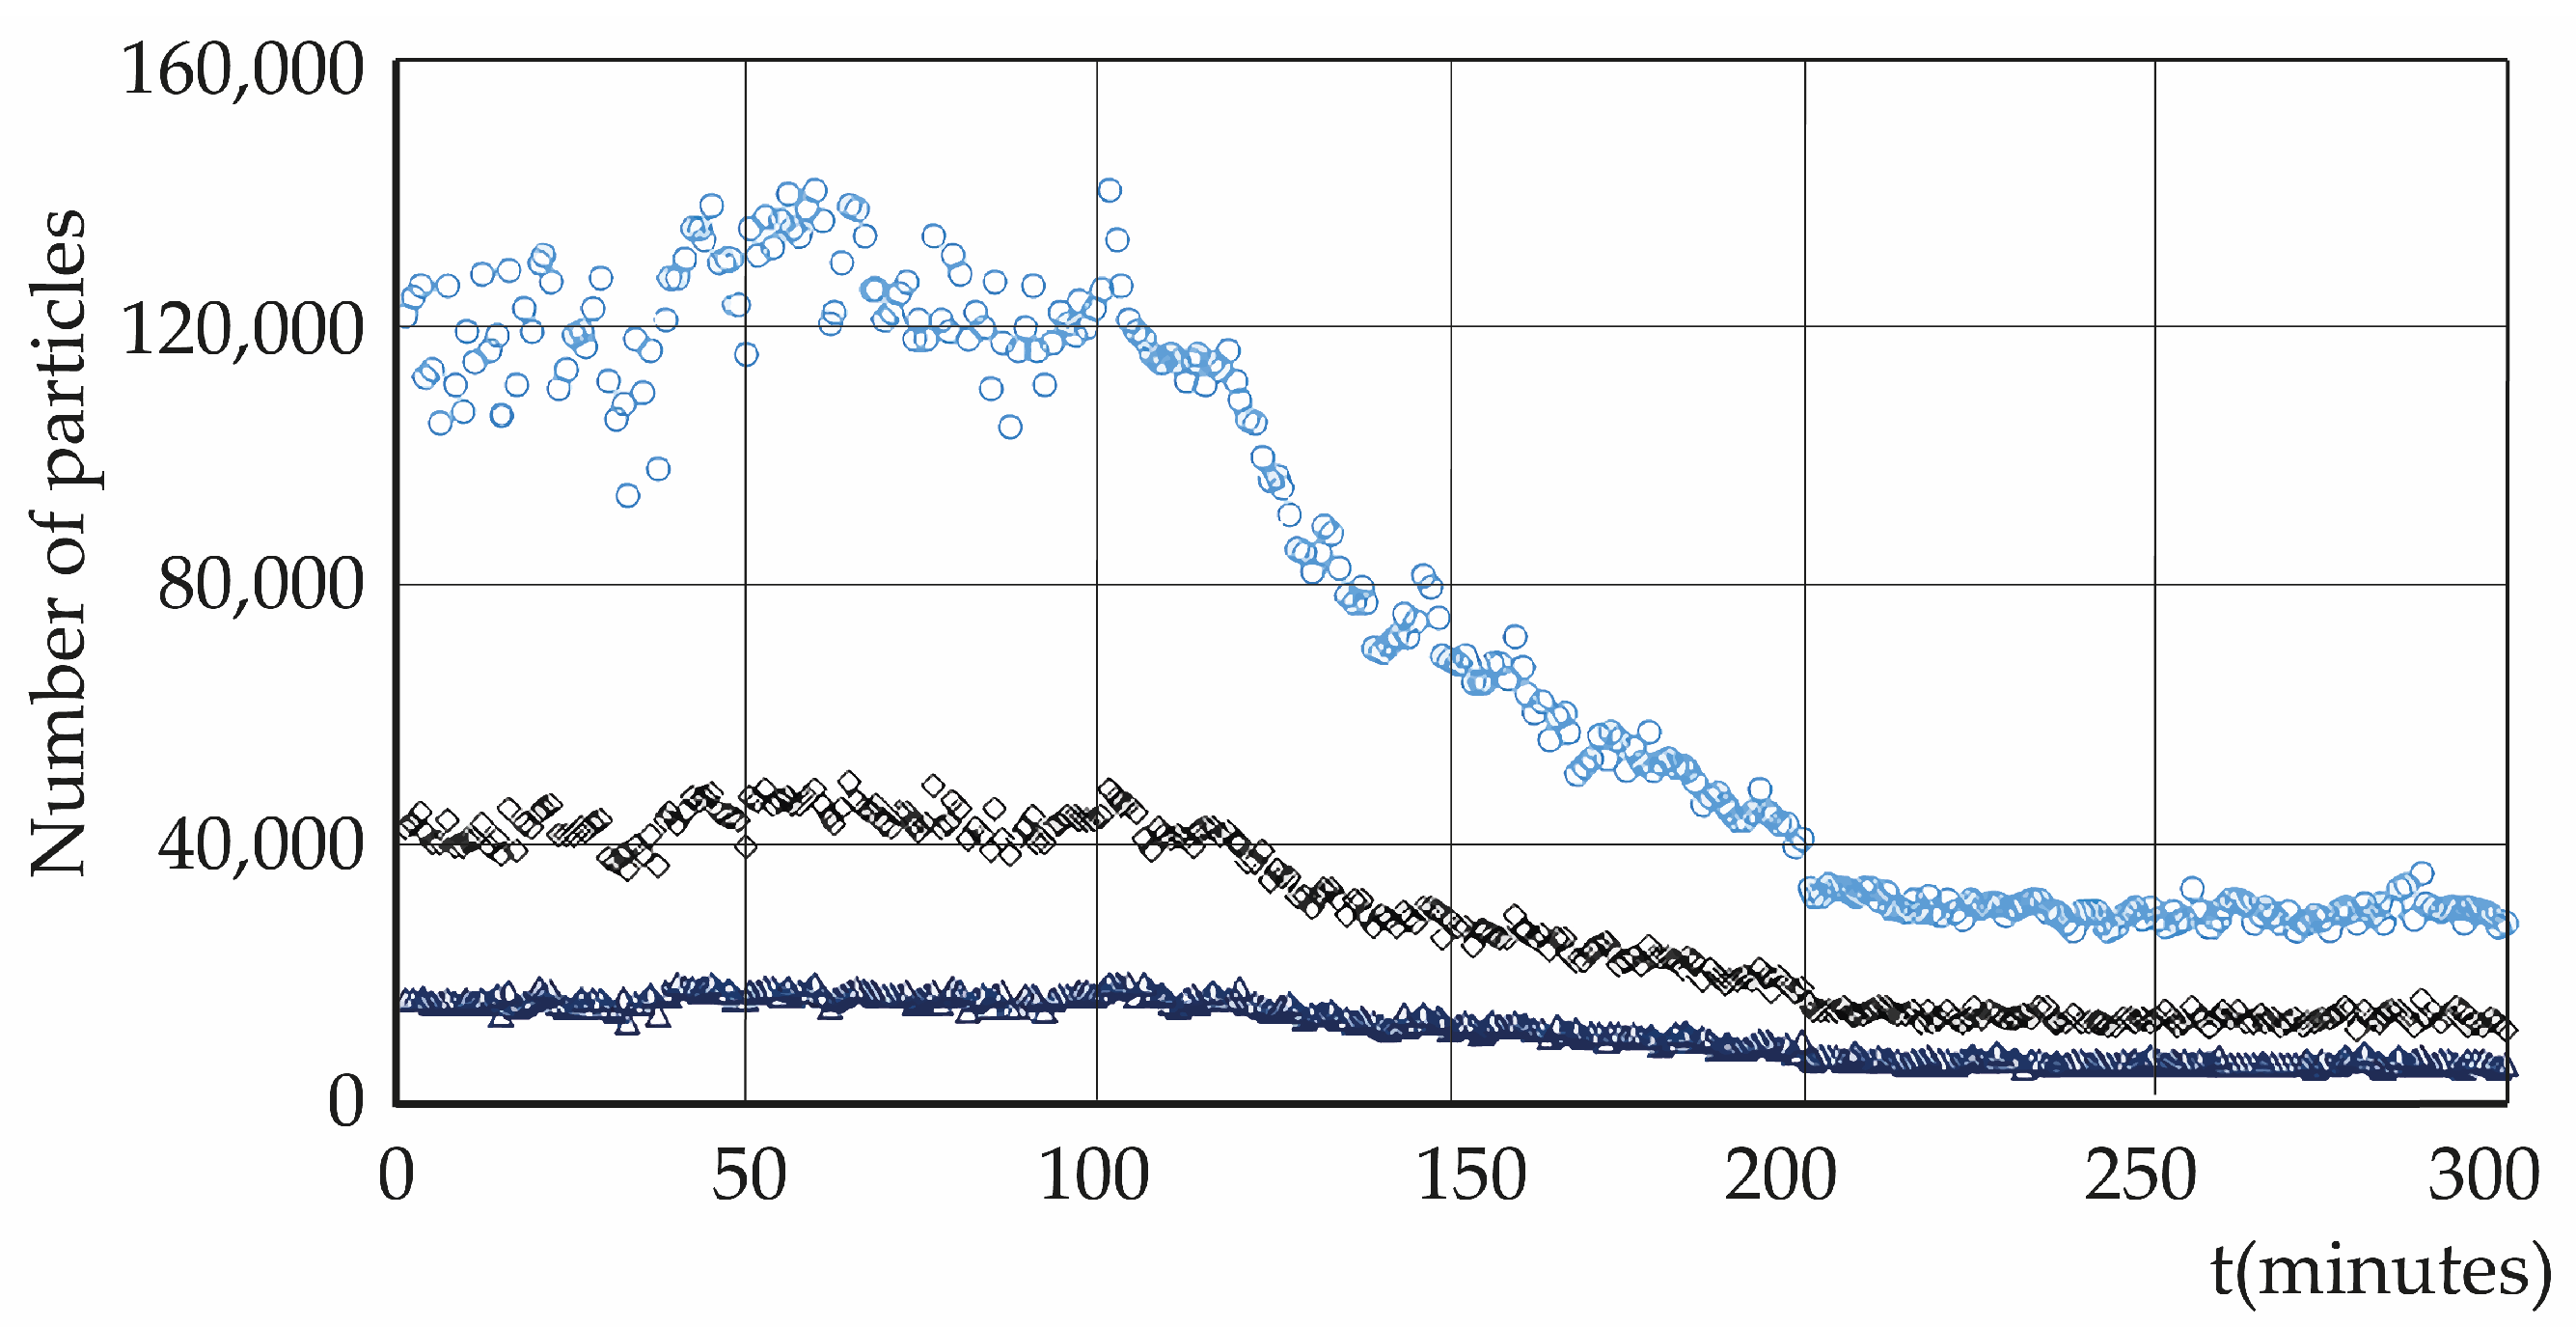
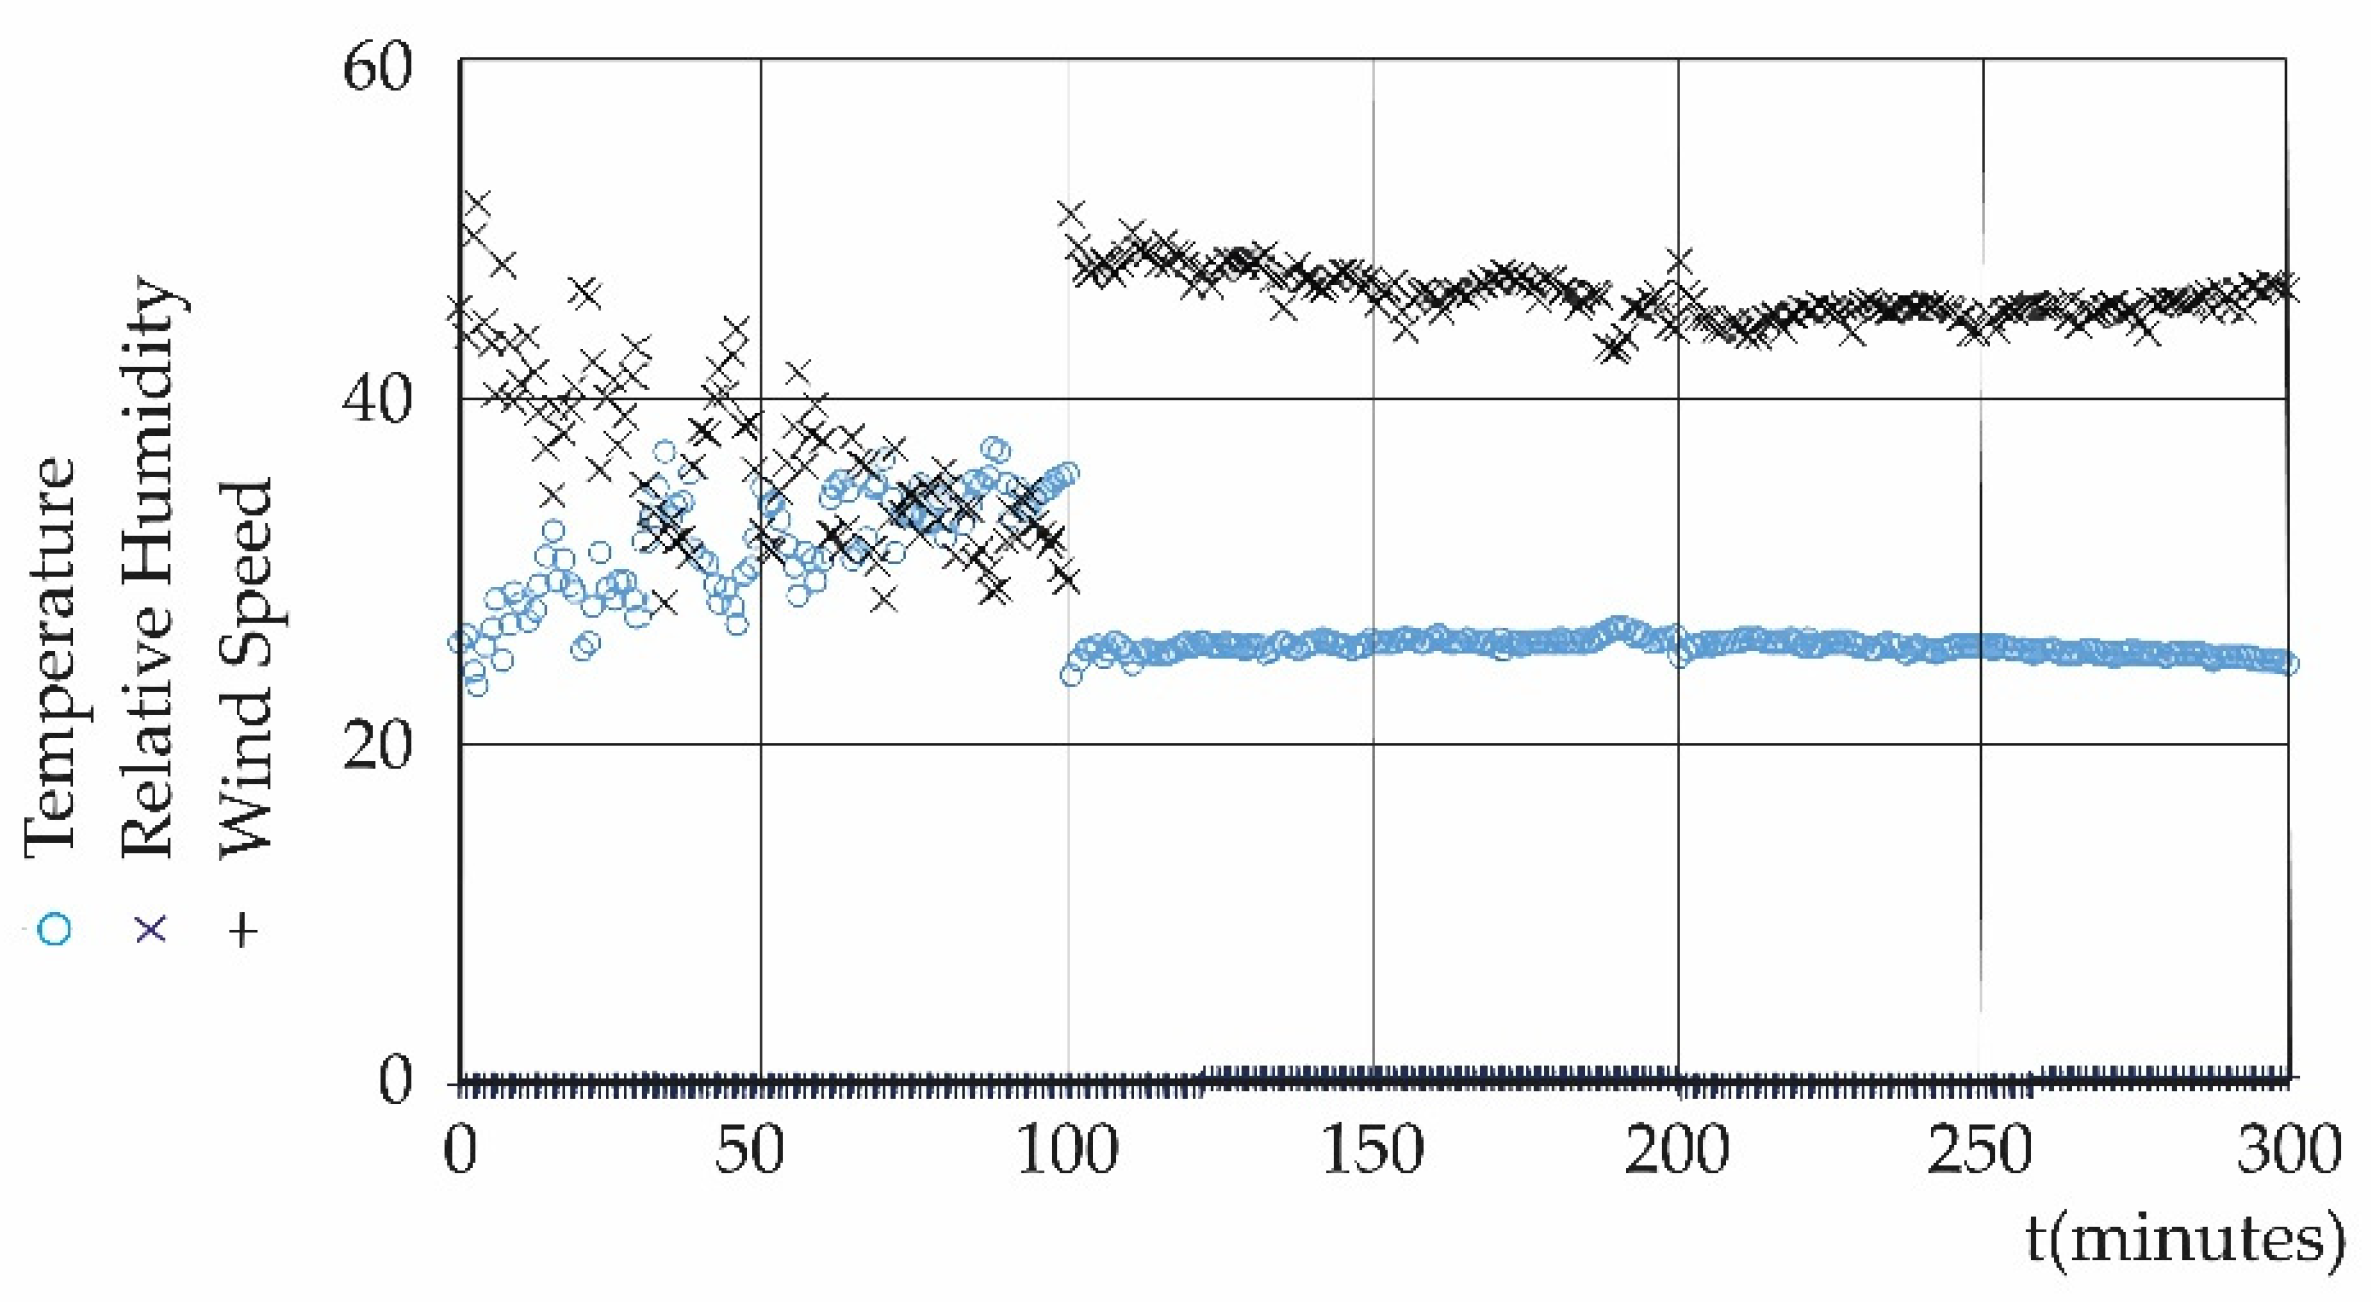
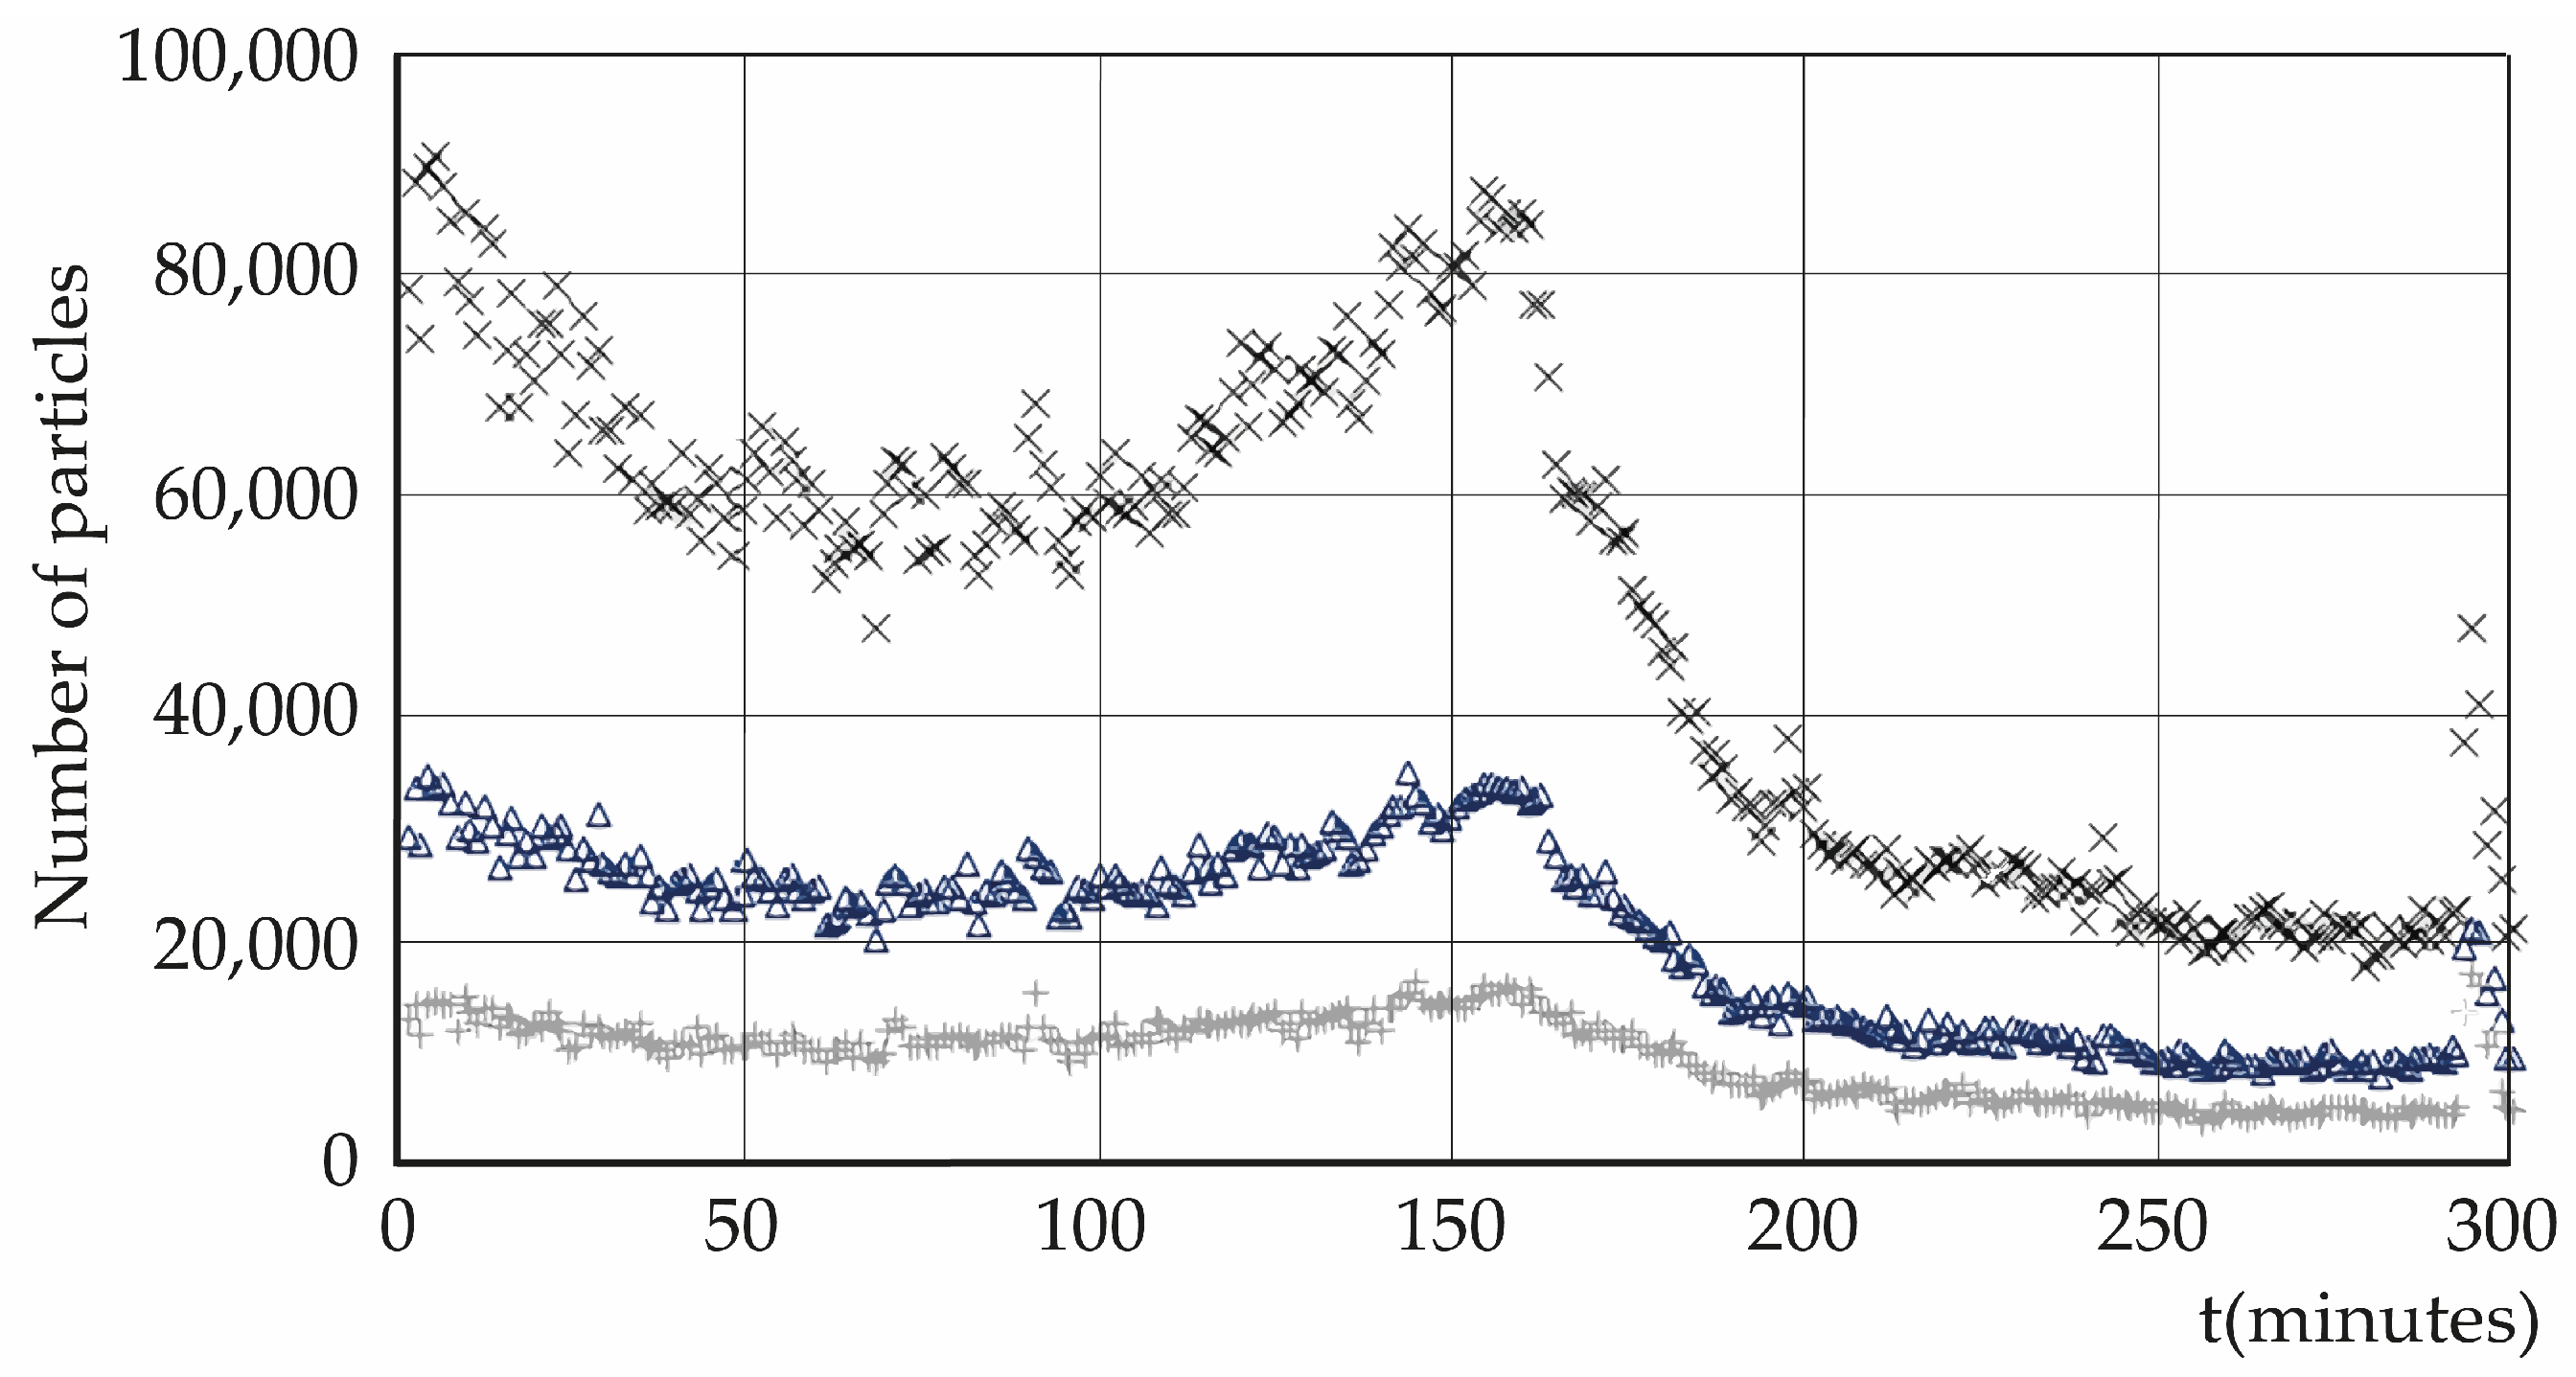
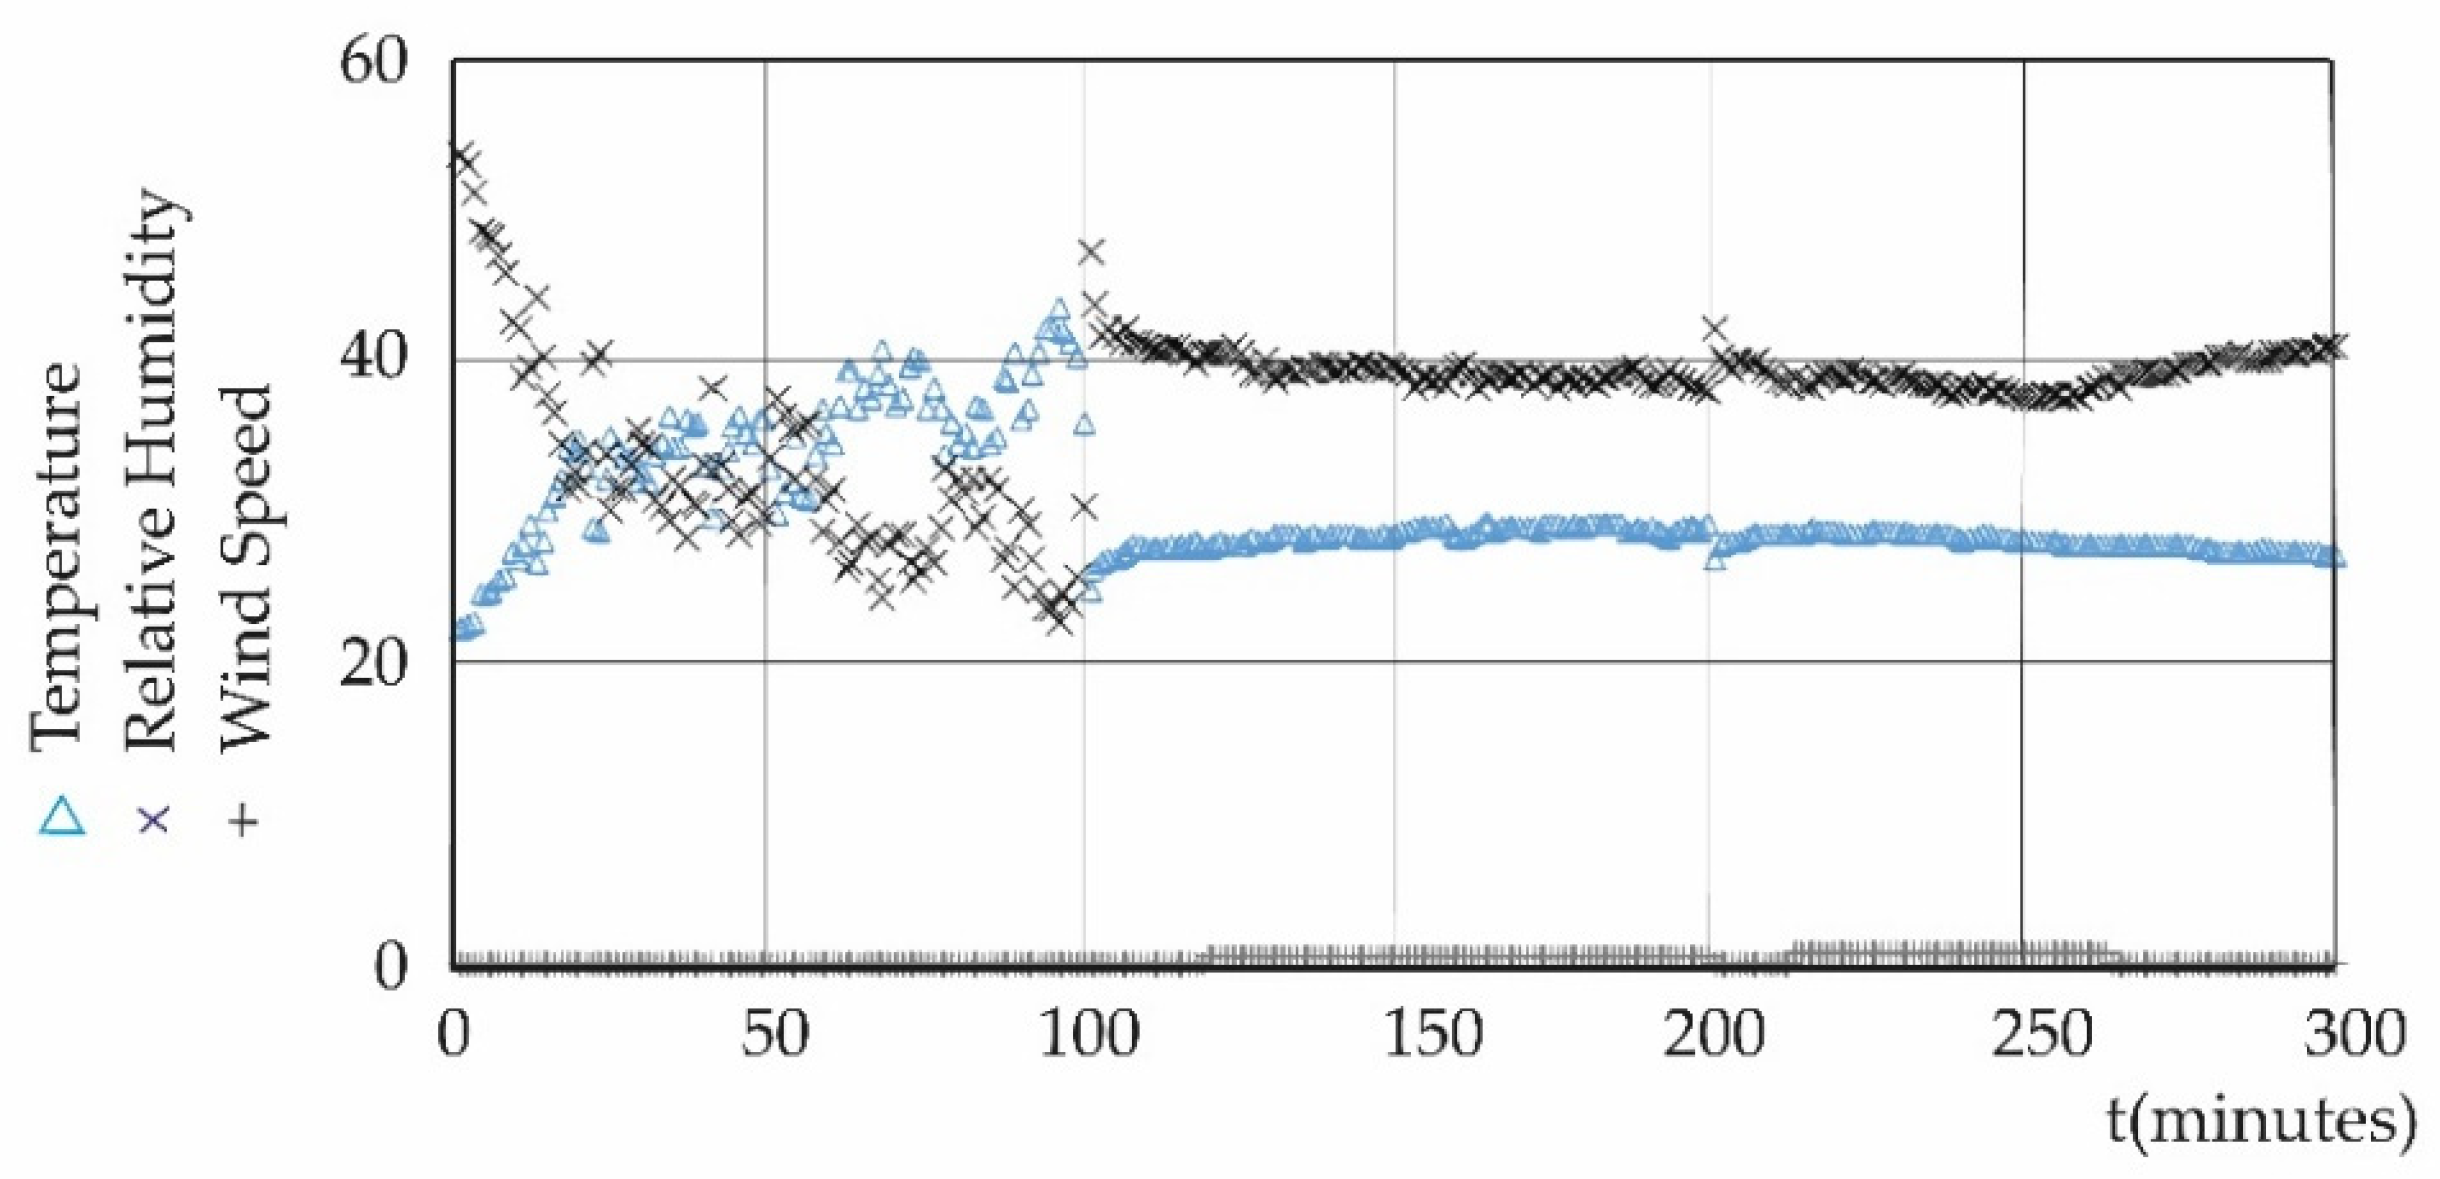
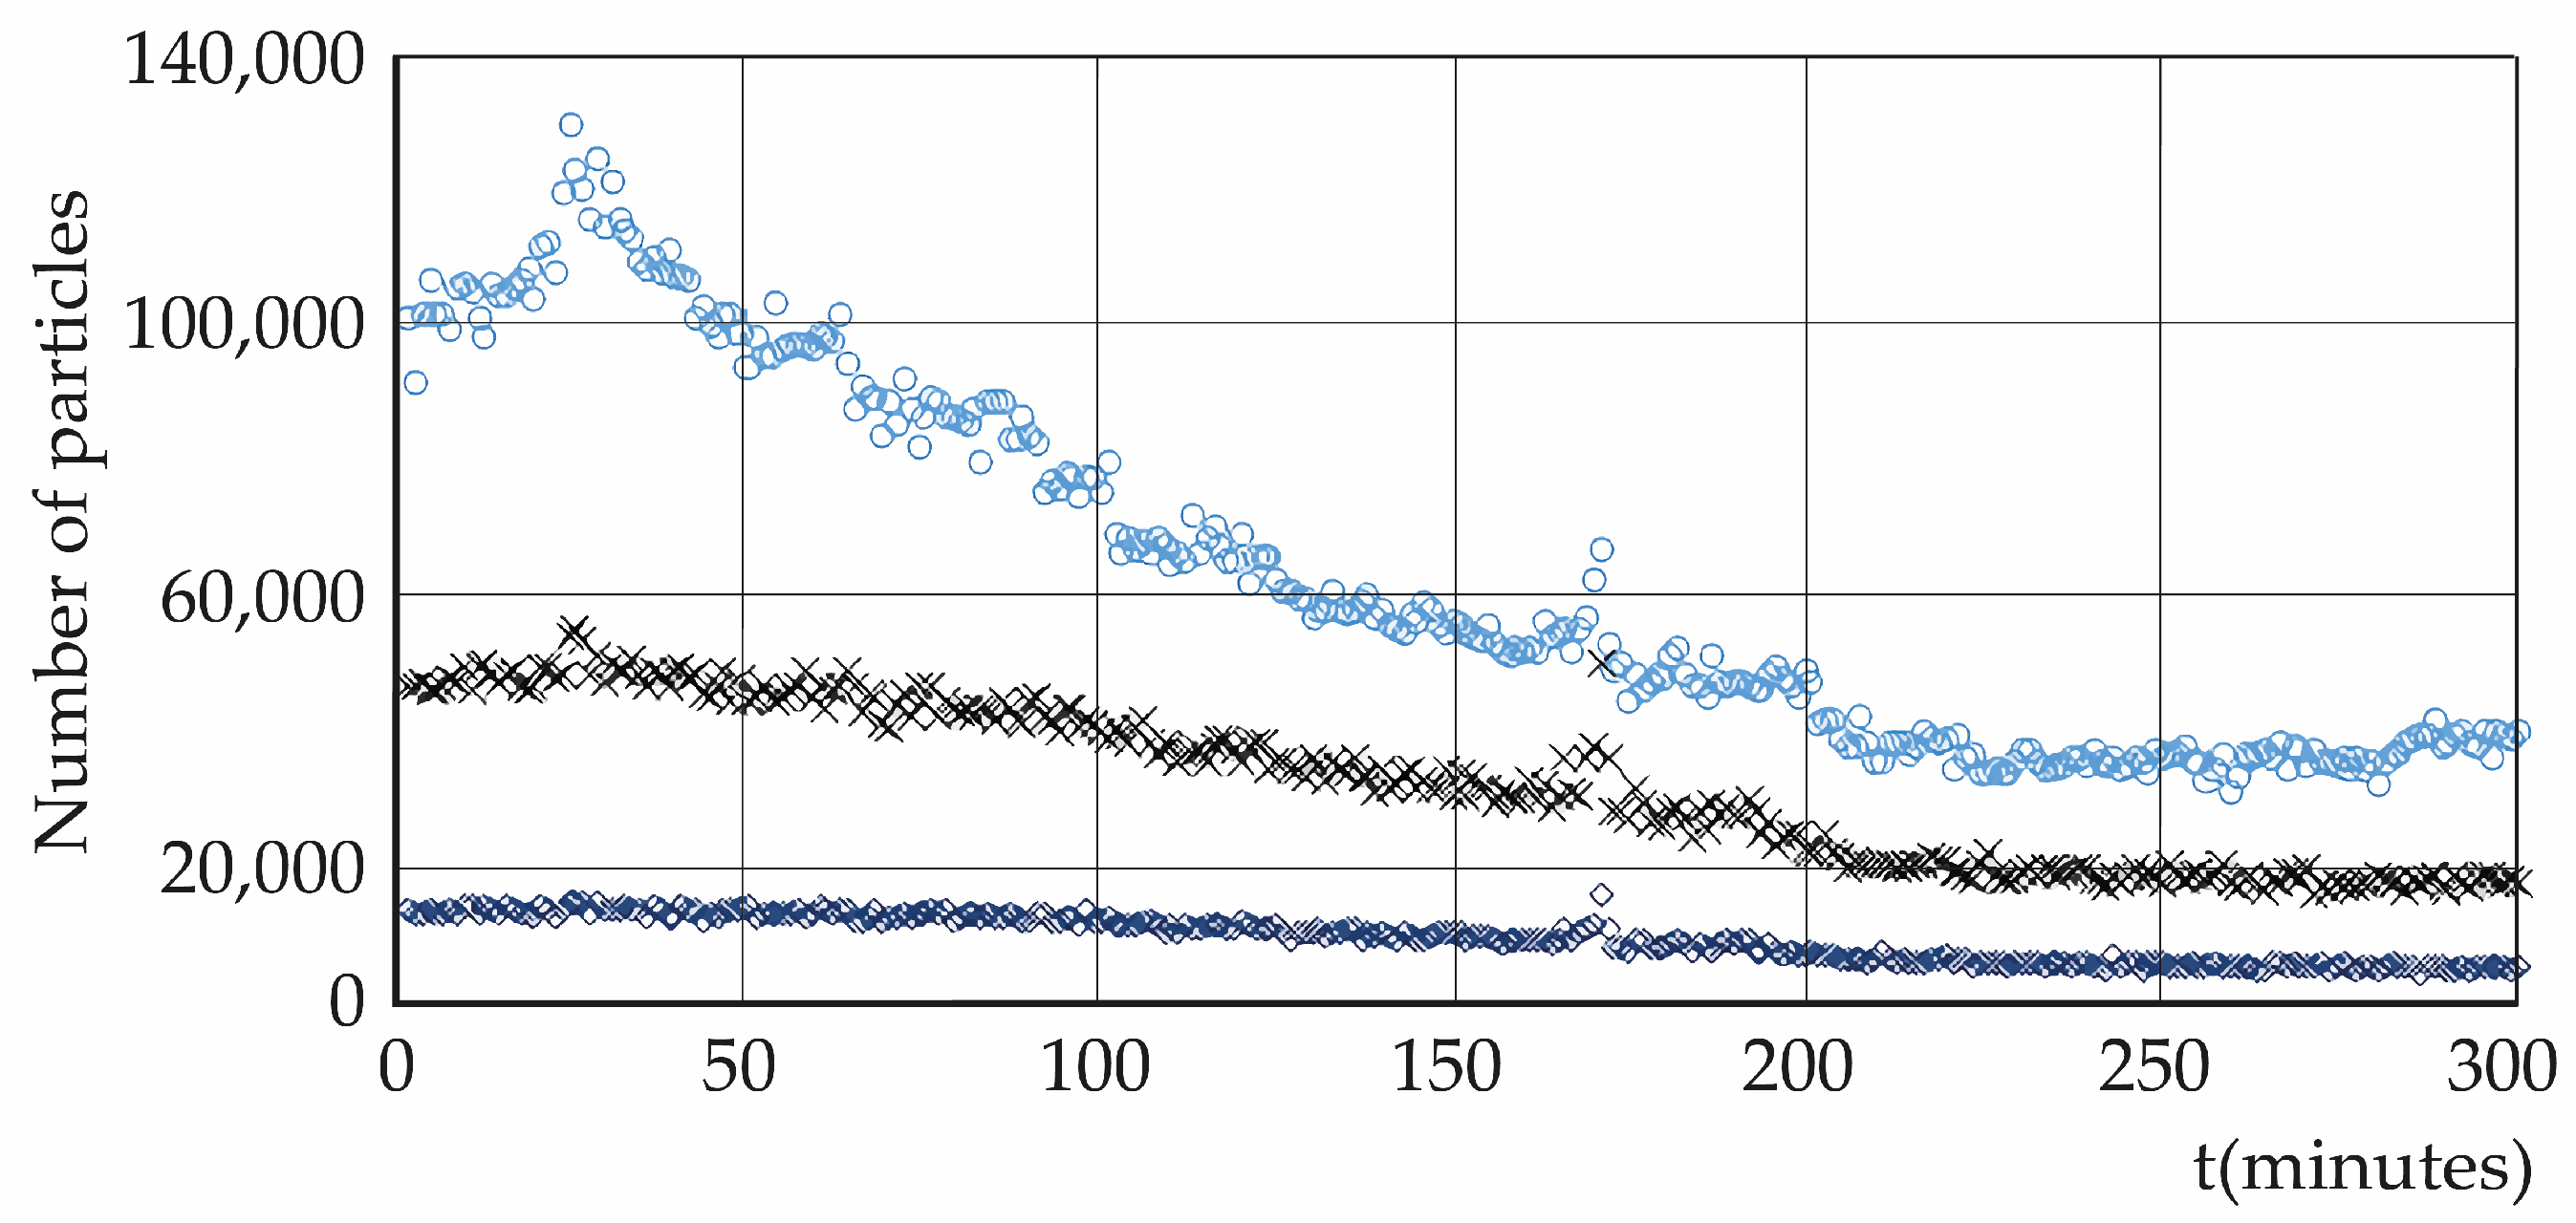

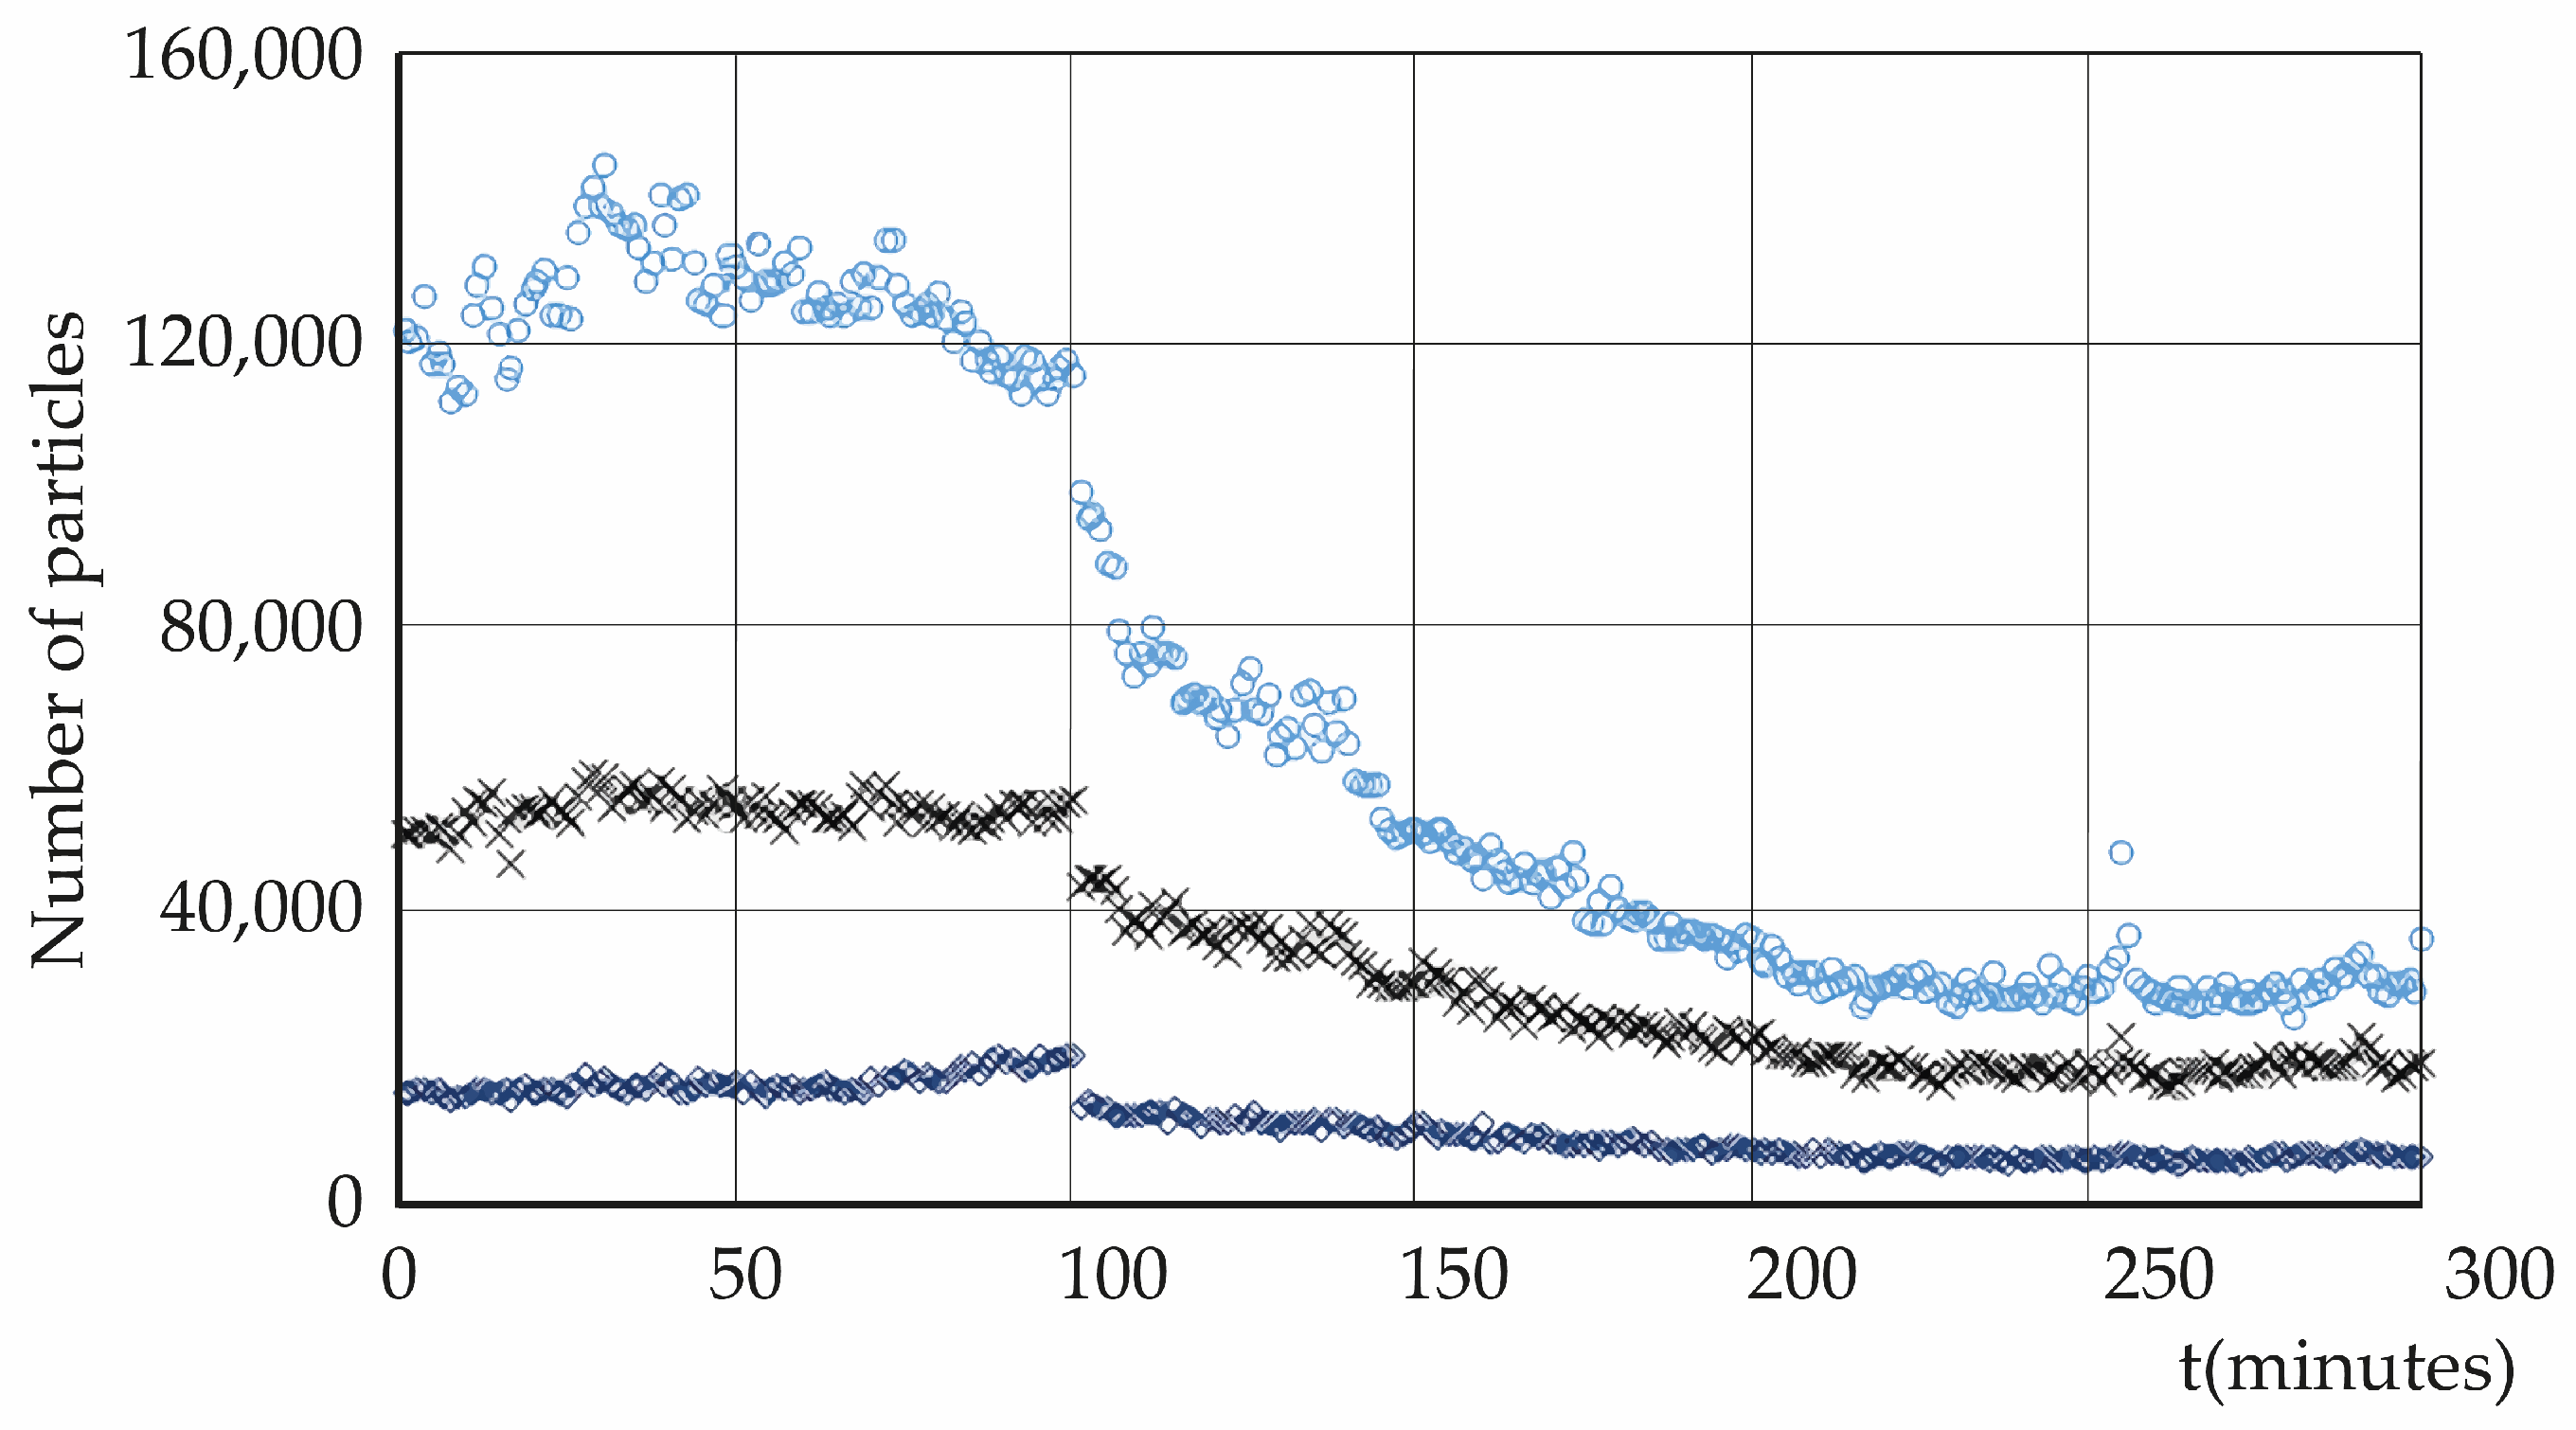
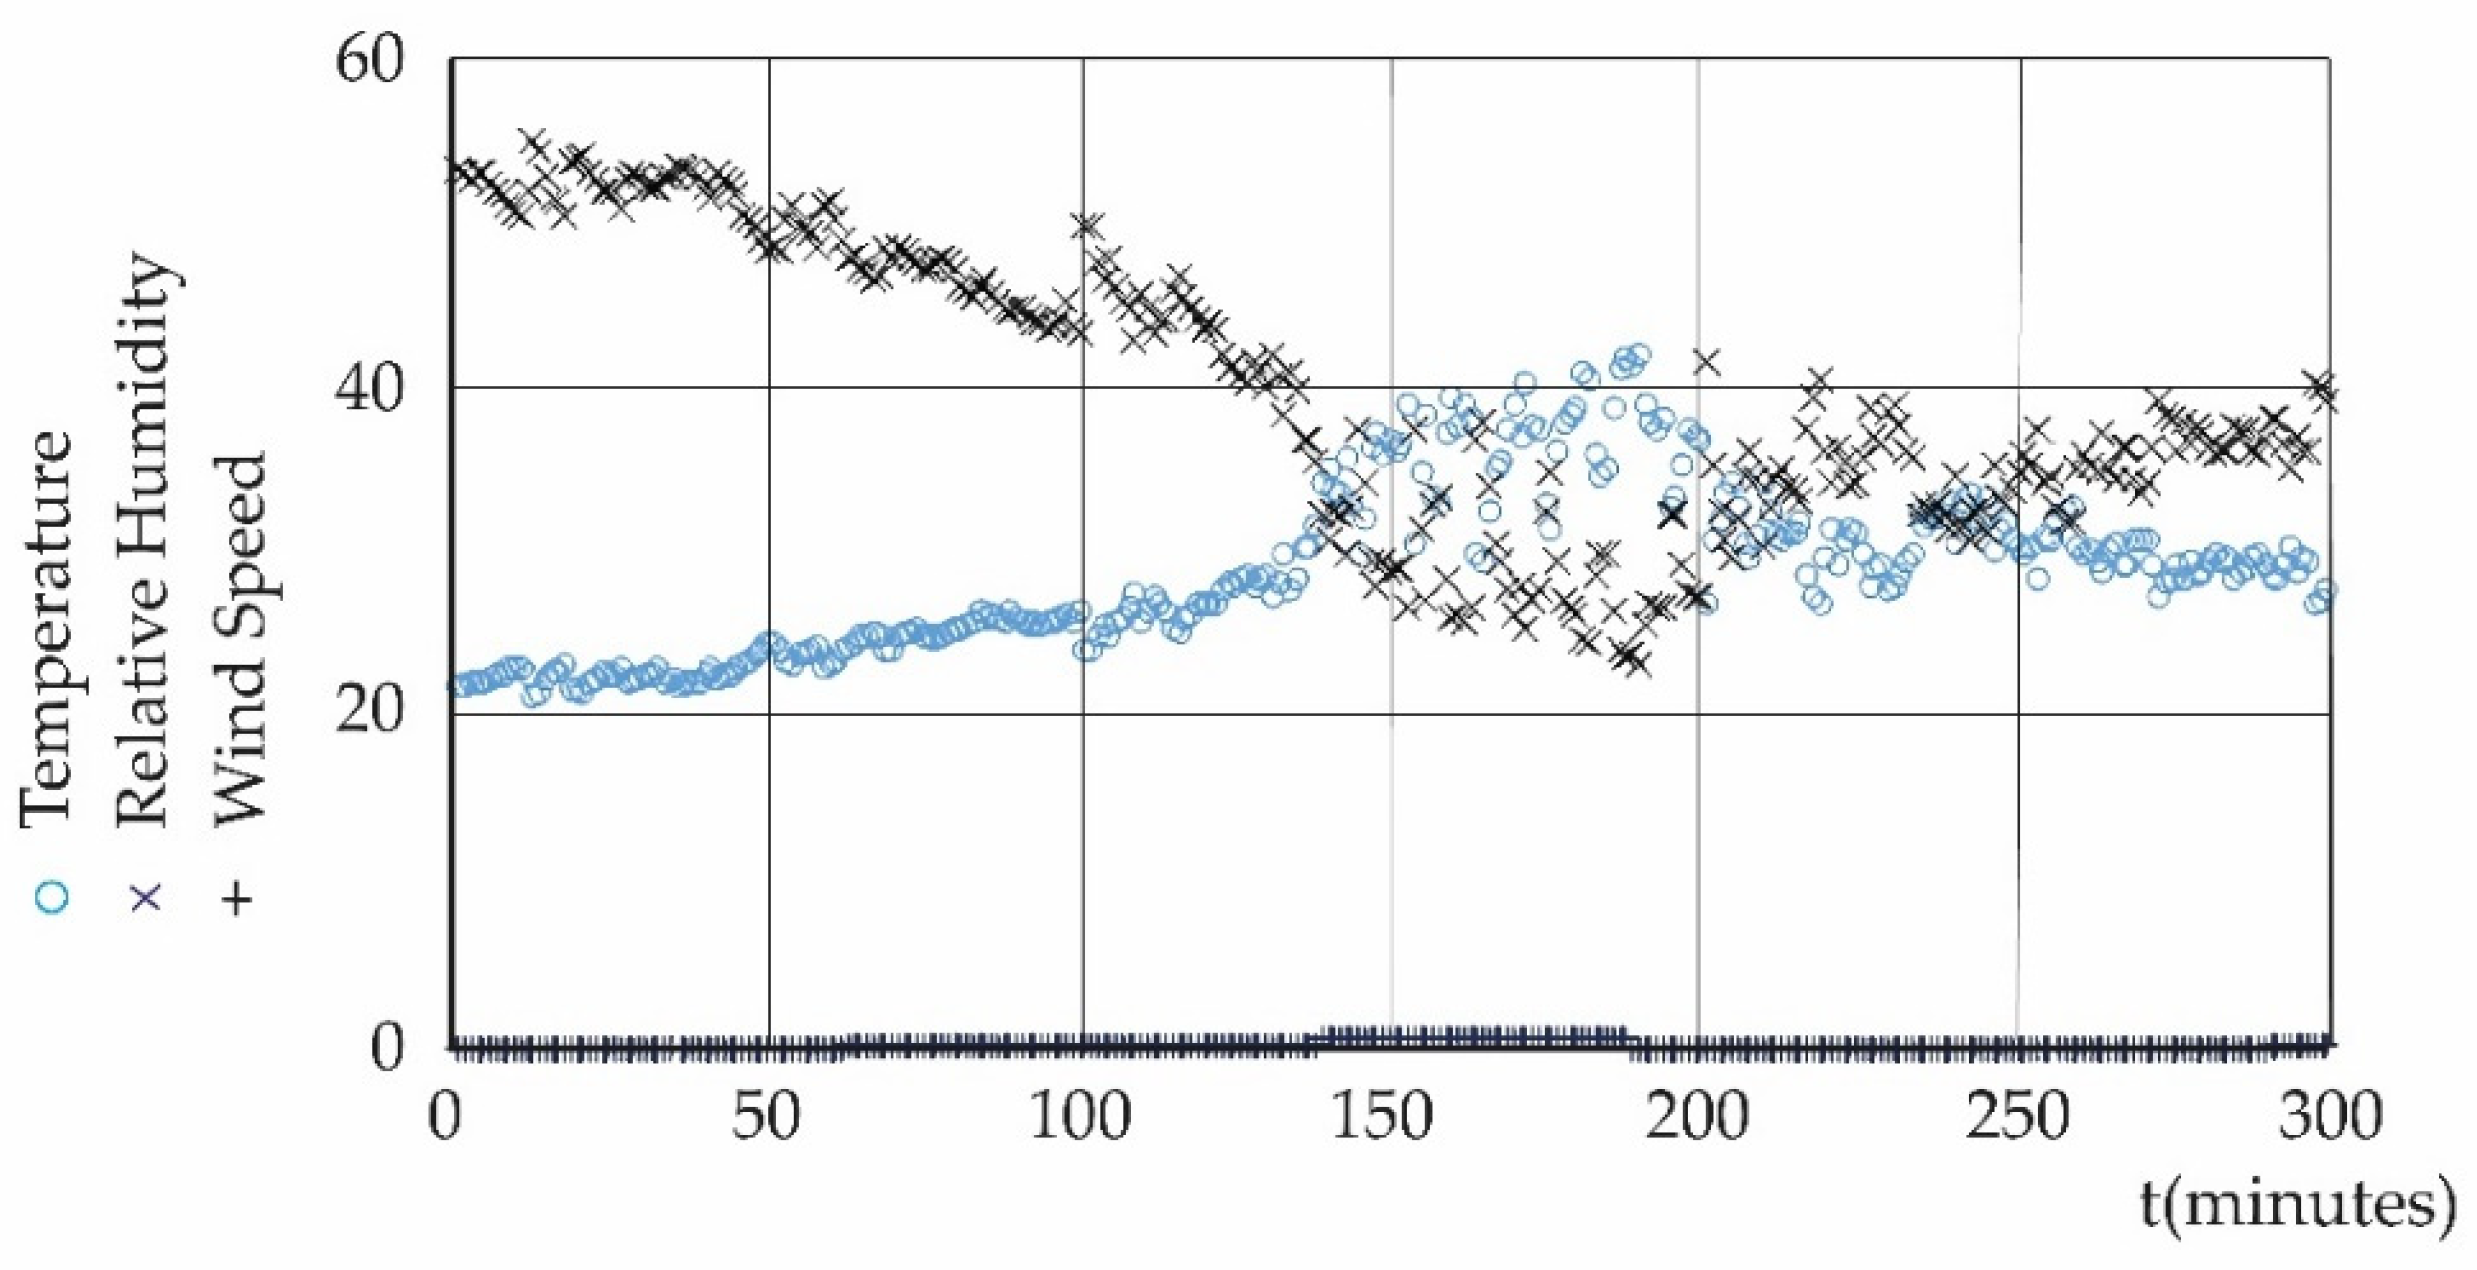
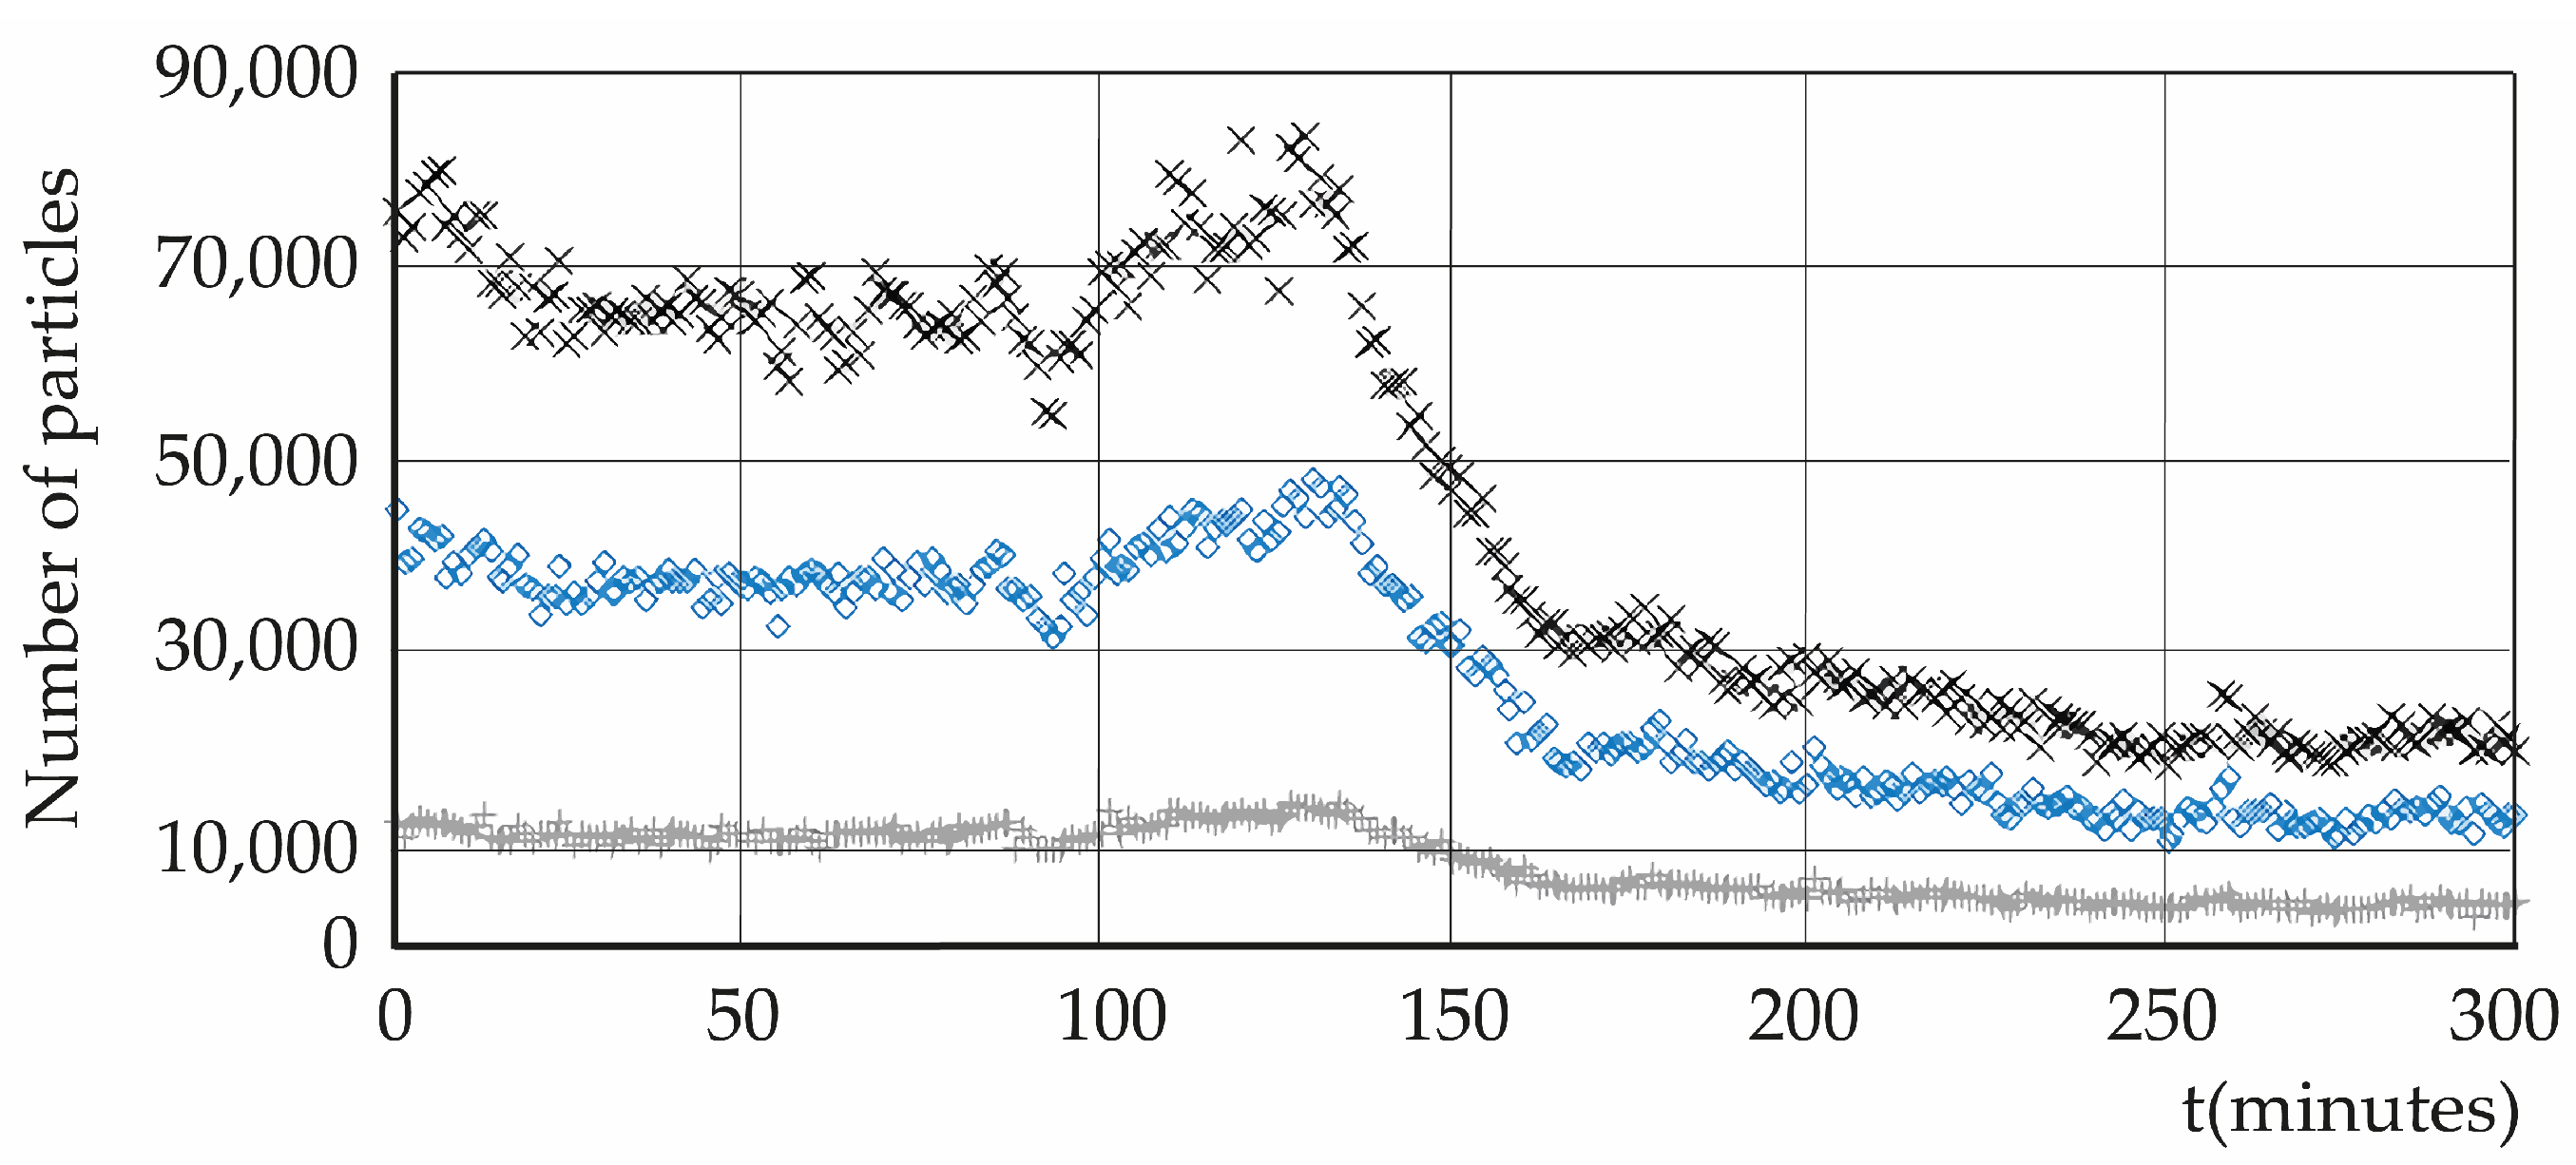
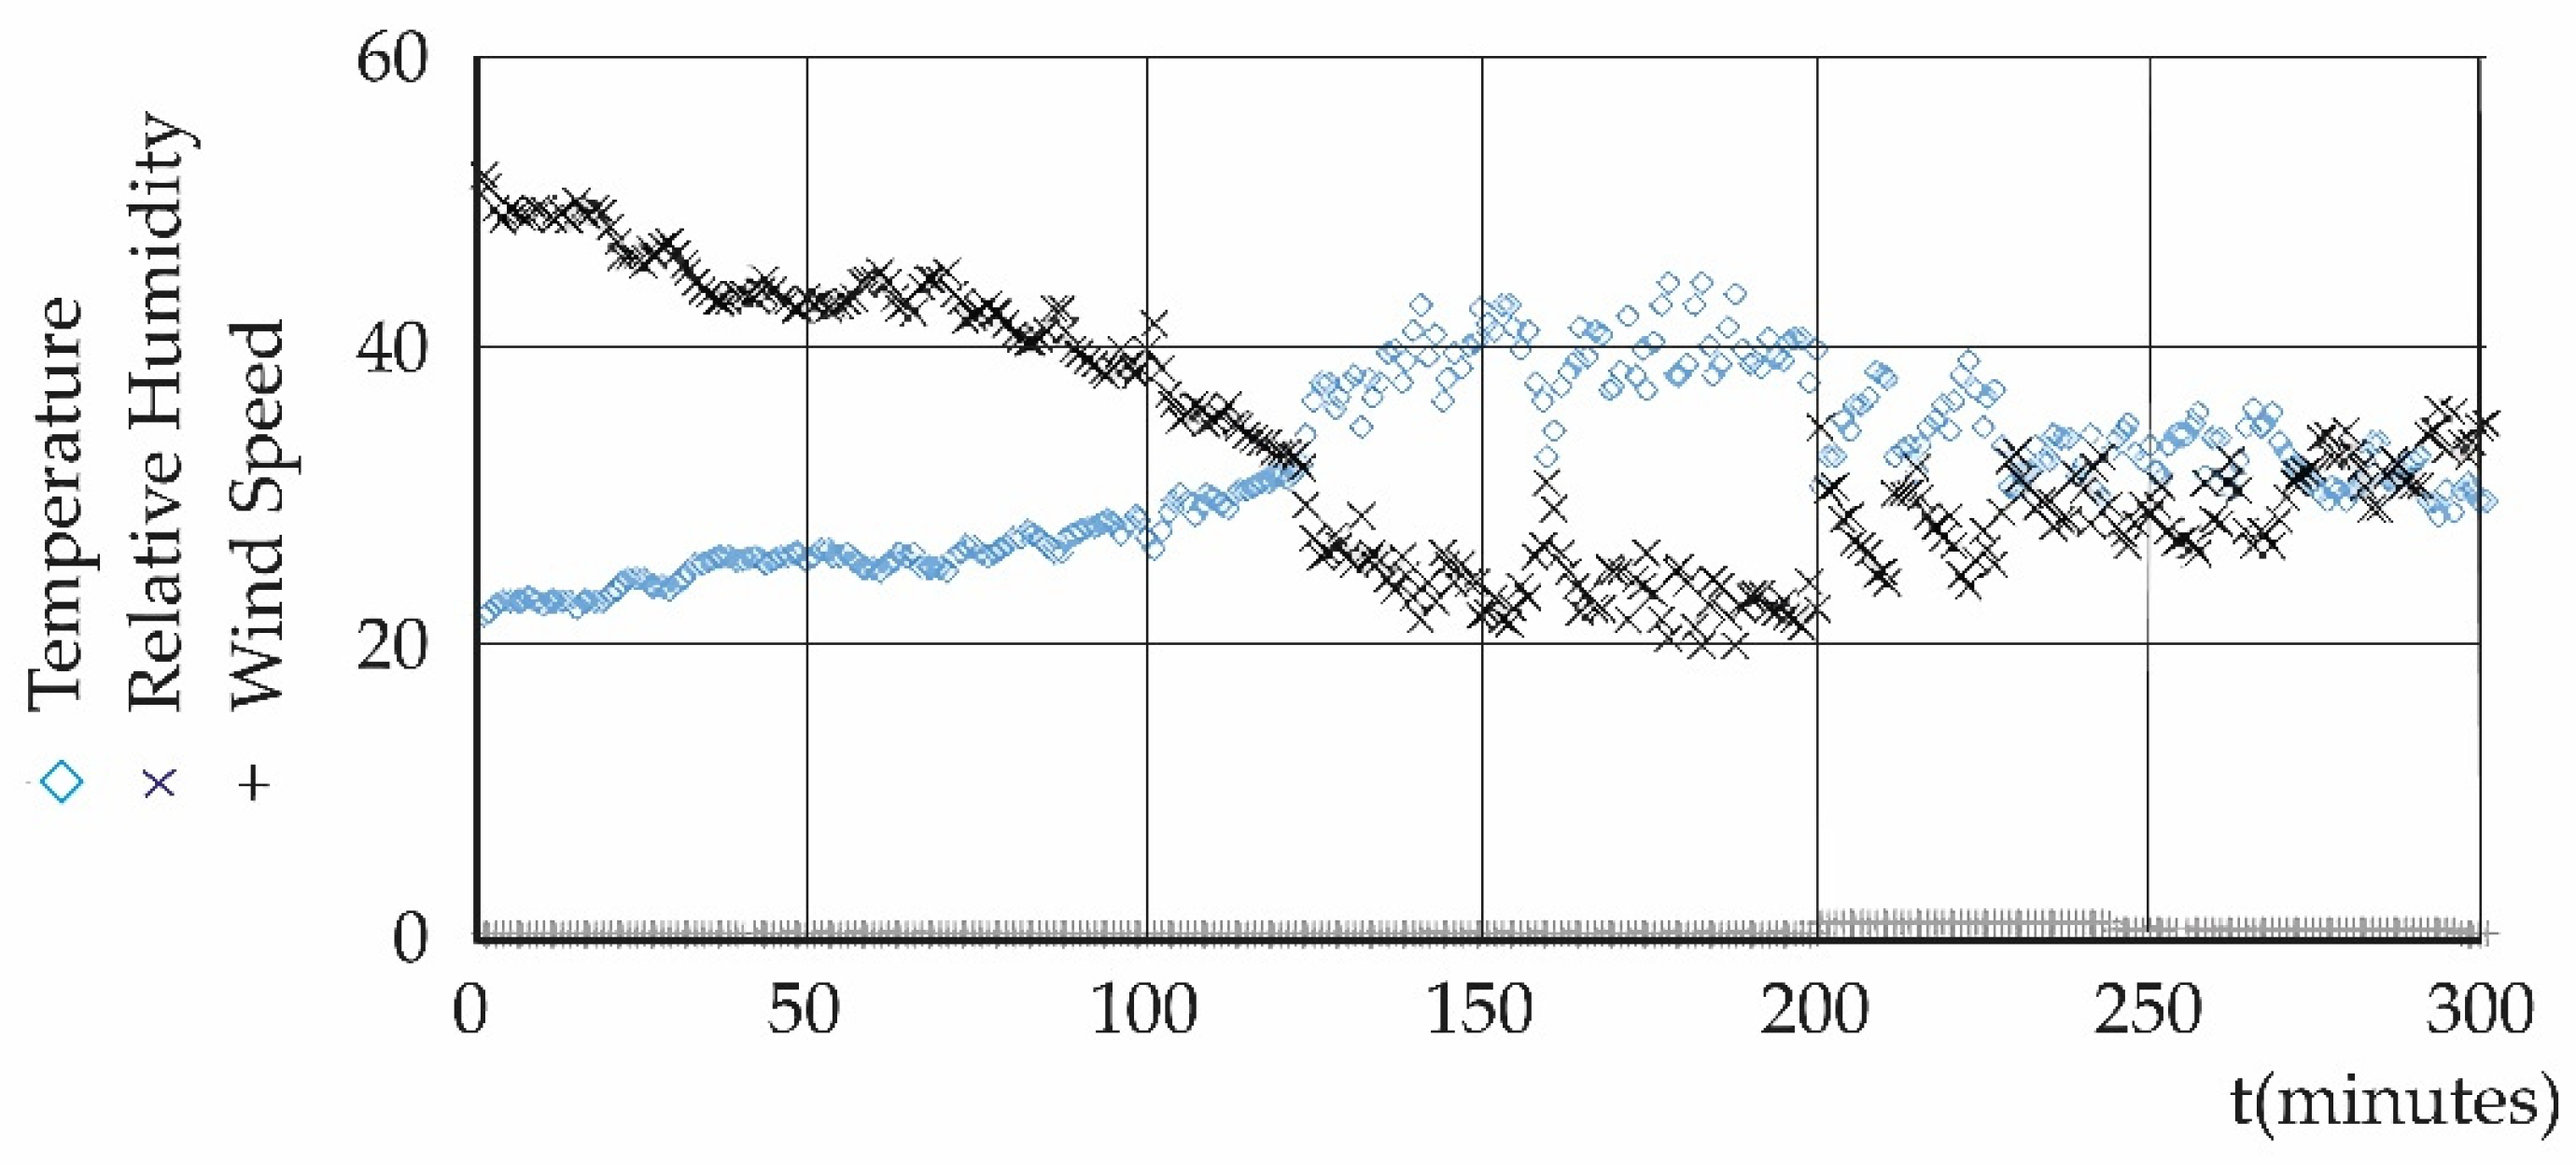
Appendix C
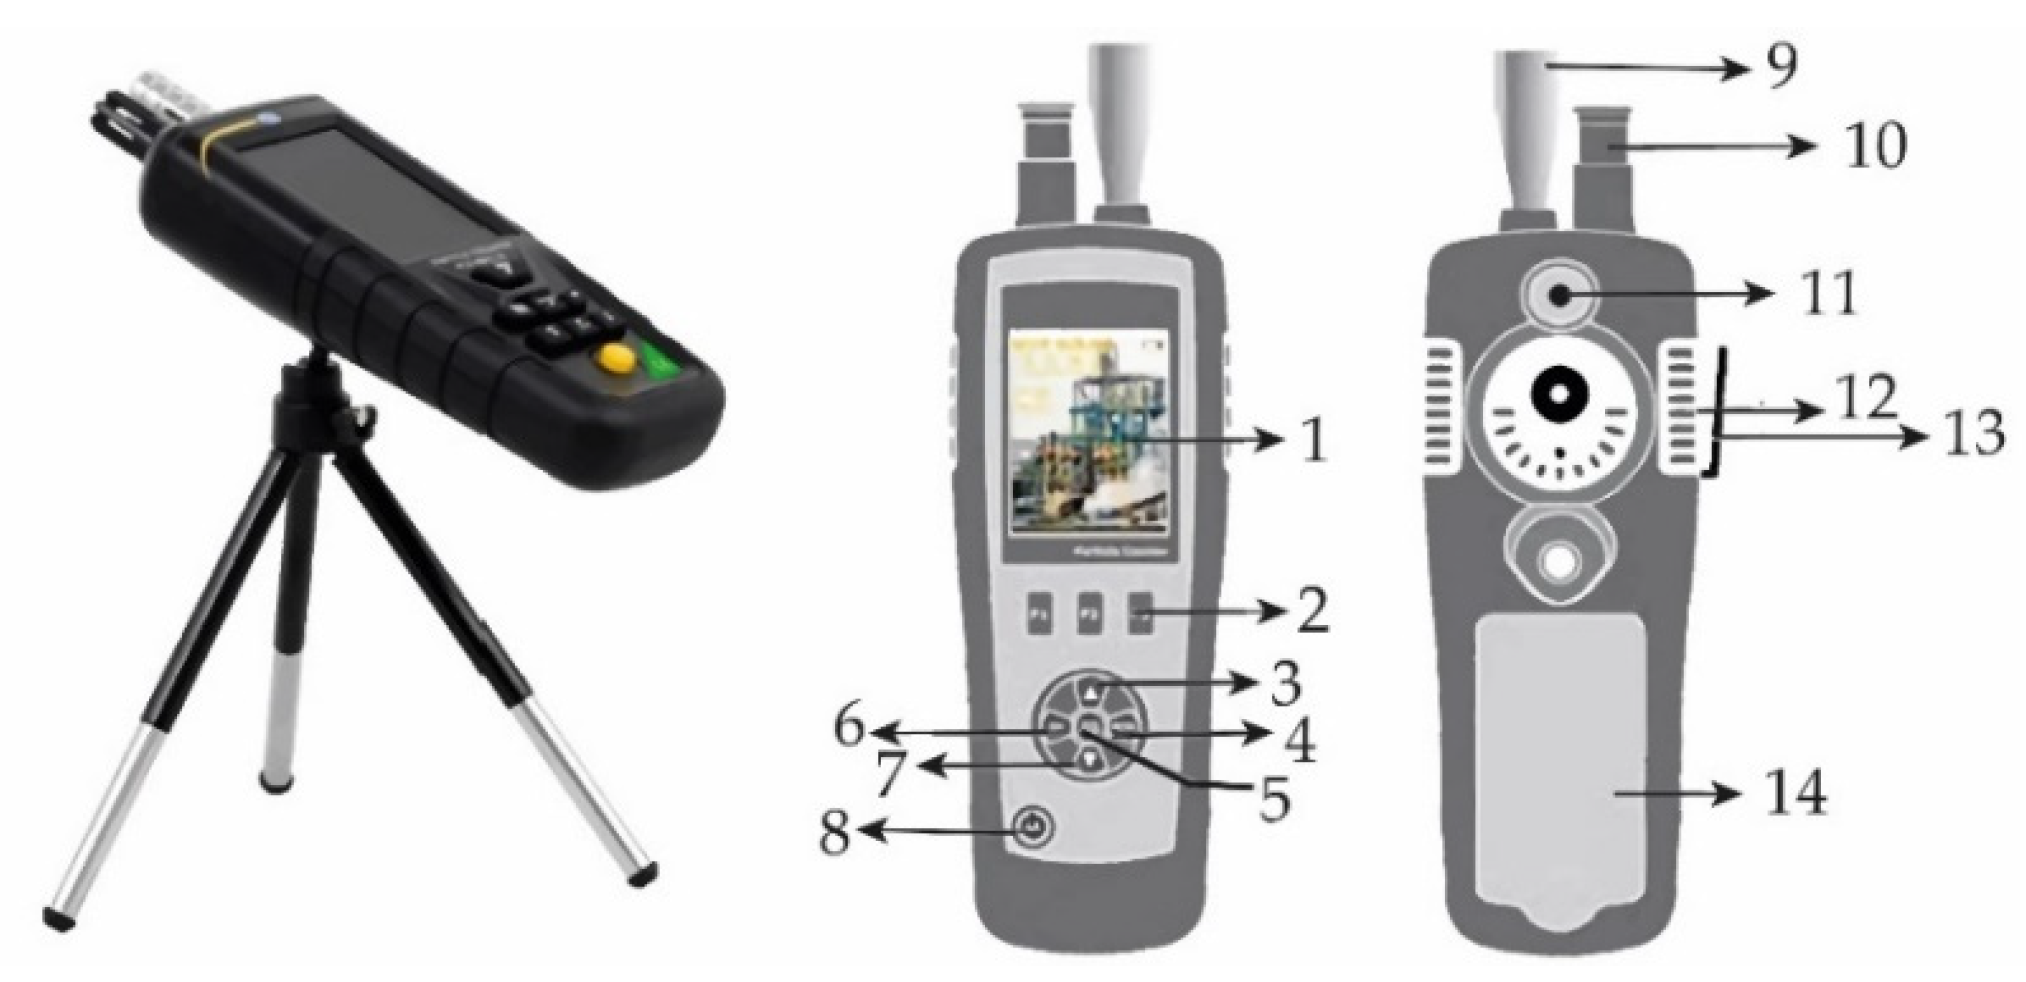
| Chanel | Green | Yellow | Red |
|---|---|---|---|
| 0.3 µm | 0–100,000 | 100,001–250,000 | 250,001–500,000 |
| 0.5 µm | 0–35,200 | 32,501–87,500 | 87,501–175,000 |
| 1.0 µm | 0–8320 | 8321–20,800 | 20,801–41,600 |
| 2.5 µm | 0–545 | 546–1362 | 1363–2724 |
| 5.0 µm | 0–193 | 194–483 | 484–966 |
| 10.0 µm | 0–68 | 69–170 | 170–340 |
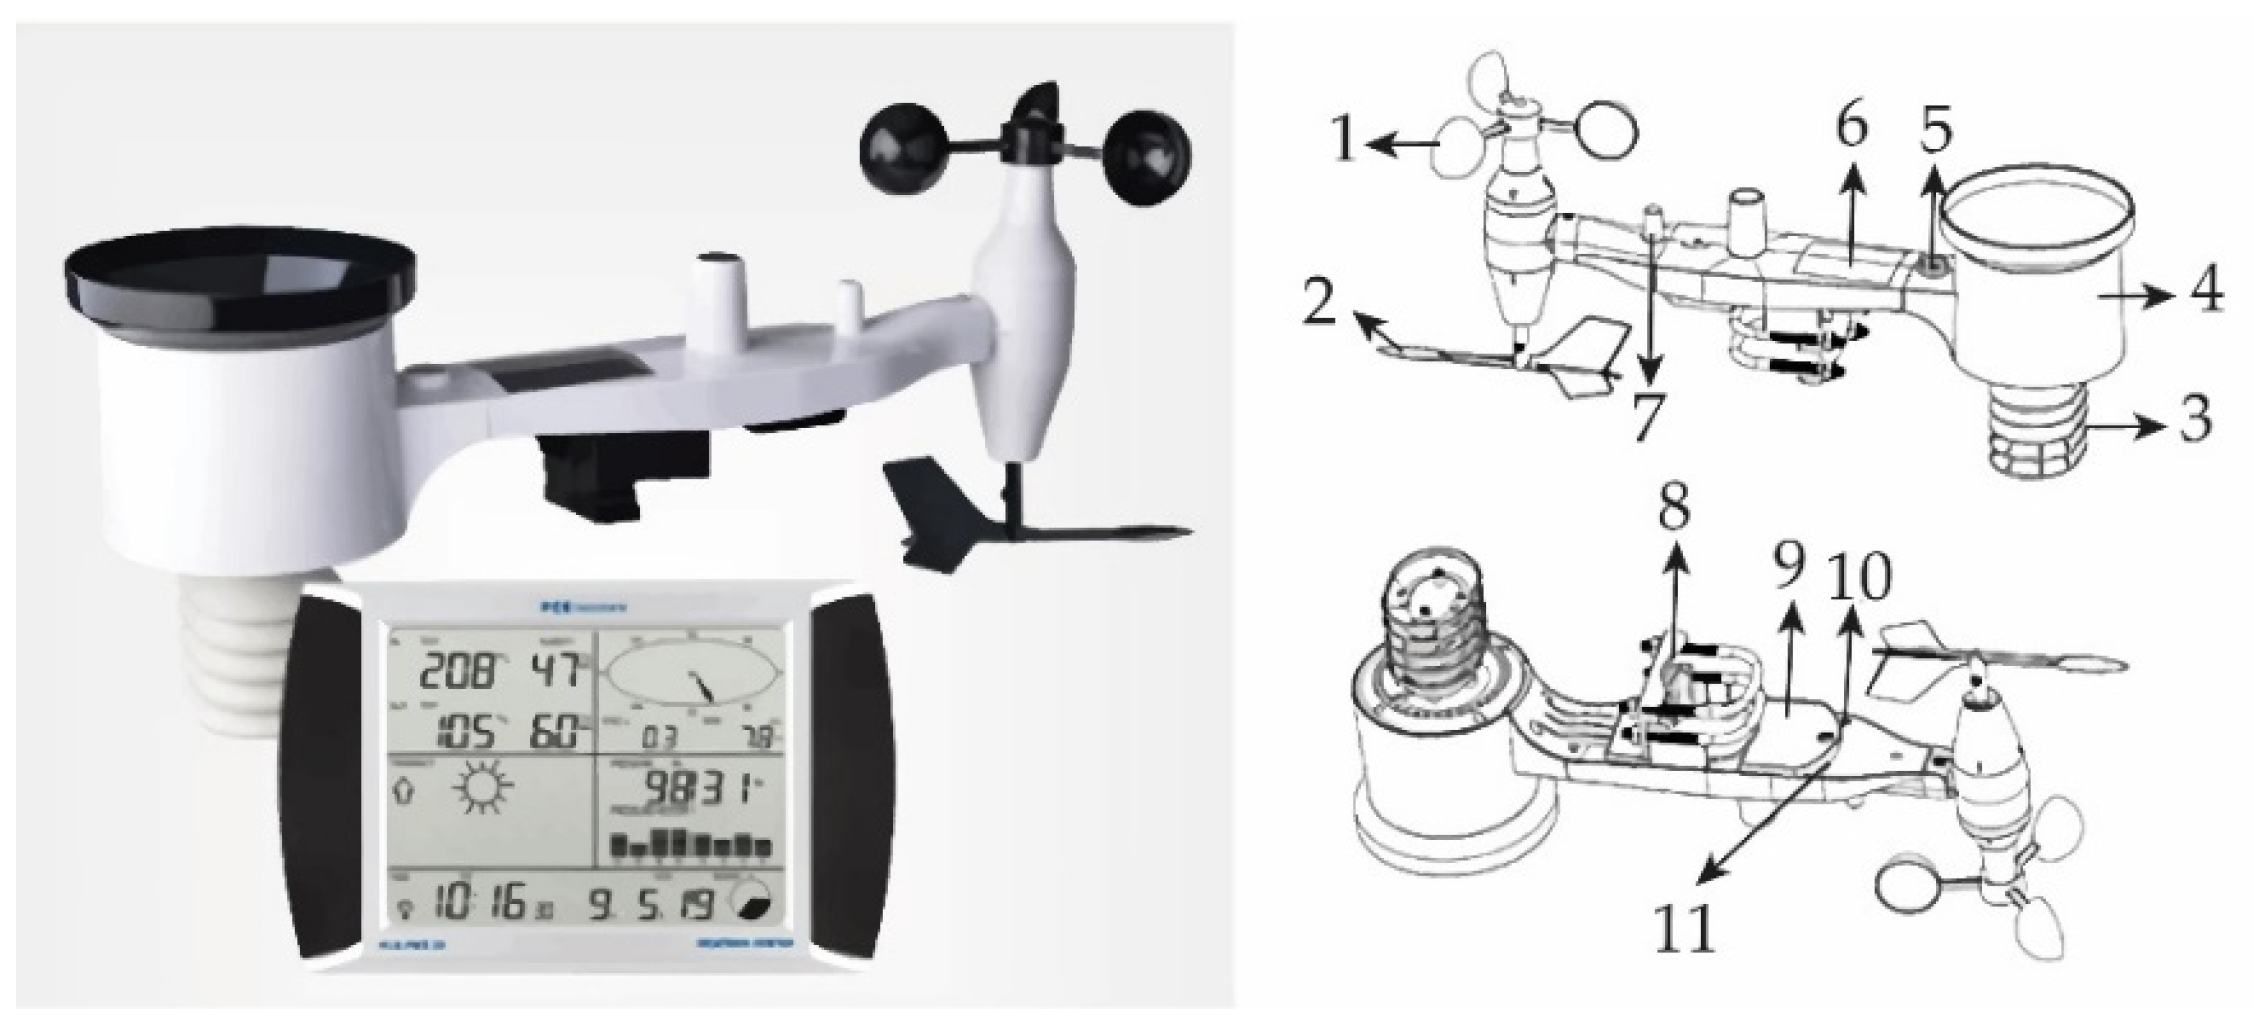
References
- Dominski, F.H.; Lorenzetti Branco, J.H.; Buonanno, G.; Stabile, L.; Gameiro da Silva, M.; Andrade, A. Effects of air pollution on health: A mapping review of systematic reviews and meta-analyses. Environ. Res. 2021, 201, 111487. [Google Scholar] [CrossRef]
- Li, B.; Ma, Y.; Zhou, Y.; Chai, E. Research progress of different components of PM2.5 and ischemic stroke. Sci. Rep. 2023, 13, 15965. [Google Scholar] [CrossRef] [PubMed]
- Lim, E.Y.; Kim, G.-D. Particulate Matter-Induced Emerging Health Effects Associated with Oxidative Stress and Inflammation. Antioxidants 2024, 13, 1256. [Google Scholar] [CrossRef] [PubMed]
- Li, W.; Ito, A.; Wang, G.; Zhi, M.; Xu, L.; Yuan, Q.; Zhang, J.; Liu, L.; Wu, F.; Laskin, A.; et al. Aqueous-phase secondary organic aerosol formation on mineral dust. Natl. Sci. Rev. 2025, 12, nwaf221. [Google Scholar] [CrossRef] [PubMed]
- Zender-Świercz, E.; Galiszewska, B.; Telejko, M.; Starzomska, M. The effect of temperature and humidity of air on the concentration of particulate matter—PM2.5 and PM10. Atmos. Res. 2024, 312, 107733. [Google Scholar] [CrossRef]
- Vaishali; Verma, G.; Das, R.M. Influence of Temperature and Relative Humidity on PM2.5 Concentration over Delhi. MAPAN 2023, 38, 759–769. [Google Scholar] [CrossRef]
- Chen, C.-C.; Wang, Y.-R.; Liu, J.-S.; Chang, H.-Y.; Chen, P.C. Associations between long-term ambient PM2.5 exposure and the incidence of cardiopulmonary diseases and diabetes, attributable years lived with disability, and policy implication. Ecotoxicol. Environ. Saf. 2024, 282, 116688. [Google Scholar] [CrossRef]
- Wang, M.; Kim, R.Y.; Kohonen-Corish, M.R.J.; Chen, H.; Donovan, C.; Oliver, B.G. Particulate matter air pollution as a cause of lung cancer: Epidemiological and experimental evidence. Br. J. Cancer 2025, 132, 986–996. [Google Scholar] [CrossRef]
- Mauree, D.; Coccolo, S.; Deschamps, L.; Loesch, P.; Becquelin, P.; Scartezzini, J.L. Mobile Urban Micrometeorological Monitoring (MUMiM). J. Phys. Conf. Ser. 2019, 1343, 012014. [Google Scholar] [CrossRef]
- Foken, T. Micrometeorology; Springer: Berlin/Heidelberg, Germany, 2008. [Google Scholar]
- Stull, R.B. Introduction to Boundary Layer Meteorology; Kluwer Academic: Dordrecht, The Netherlands, 1988; p. 666. [Google Scholar]
- Klausner, Z.; Ben-Efraim, M.; Arav, Y.; Tas, E.; Fattal, E. The Micrometeorology of the Haifa Bay Area and Mount Carmel during the summer. Atmosphere 2021, 12, 354. [Google Scholar] [CrossRef]
- Landsberg, H.E. Micrometeorological temperature differentiation through urbanization. In Urban Climates; Technical Note, No. 108; World Meteorological Organization: Geneva, Switzerland, 1970; pp. 129–136. [Google Scholar]
- Landsberg, H.E.; Maisel, T.N. Micrometeorological observations in an area of urban growth. Bound.-Layer. Meteorol. 1972, 2, 365–370. [Google Scholar] [CrossRef]
- Pacheco, P.; Mera, E.; Salini, G. Urban Densification Effect on Micrometeorology in Santiago, Chile: A Comparative Study Based on Chaos Theory. Sustainability 2022, 14, 2845. [Google Scholar] [CrossRef]
- Pacheco, P.; Mera, E.; Navarro, G.; Polo, S. Interaction Between Maximum Entropies of Urban Meteorology and Pollutants: Effects on Relative Humidity and Temperature in the Boundary Layer of a Basin Geomorphology. Atmosphere 2025, 16, 337. [Google Scholar] [CrossRef]
- Sprott, J.C. Chaos and Time-Series Analysis, 1st ed.; Oxford University Press: Oxford, UK, 2003. [Google Scholar]
- Sprott, J.C. Chaos Data Analyzer Software. 1995. Available online: http://sprott.physics.wisc.edu/cda.htm (accessed on 29 May 2025).
- Pacheco Hernández, P.; Mera Garrido, E.; Navarro Ahumada, G. Fractal Dimension Time Series and Interaction Between Entropic Surfaces of Urban Meteorology and Pollutants in a Geographic Basin: Dynamic Effects, Thermal Flows and Anomalous Diffusion. Fractal Fract. 2025, 9, 114. [Google Scholar] [CrossRef]
- Pacheco, P.; Mera, E.; Navarro, G.; Parodi, C. Urban Meteorology, Pollutants, Geomorphology, Fractality, and Anomalous Diffusion. Fractal Fract. 2024, 8, 204. [Google Scholar] [CrossRef]
- Wan Mahiyuddin, W.R.; Ismail, R.; Mohammad Sham, N.; Ahmad, N.I.; Nik Hassan, N.M.N. Cardiovascular and Respiratory Health Effects of Fine Particulate Matters (PM2.5): A Review on Time Series Studies. Atmosphere 2023, 14, 856. [Google Scholar] [CrossRef]
- Chauhan, B.V.S.; Corada, K.; Young, C.; Smallbone, K.L.; Wyche, K.P. Review on Sampling Methods and Health Impacts of Fine (PM2.5, ≤2.5 µm) and Ultrafine (UFP, PM0.1, ≤0.1 µm) Particles. Atmosphere 2024, 15, 572. [Google Scholar] [CrossRef]
- Pacheco, P.; Mera, E.; Navarro, G. The Effects of Lockdown, Urban Meteorology, Pollutants, and Anomalous Diffusion on the SARS-CoV-2 Pandemic in Santiago de Chile. Atmosphere 2024, 15, 414. [Google Scholar] [CrossRef]
- Pacheco, P.; Mera, E. Study of the Effect of Urban Densification and Micrometeorology on the Sustainability of a Coronavirus-Type Pandemic. Atmosphere 2022, 13, 1073. [Google Scholar] [CrossRef]
- Zeng, X.; Tao, W.-K.; Simpson, J. An Equation for Moist Entropy in a Precipitating and Icy Atmosphere. J. Atmos. Sci. 2005, 62, 4293–4309. [Google Scholar] [CrossRef]
- Pikeroen, Q.; Paillard, D.; Watrin, K. A radiative–convective model computing precipitation with the maximum entropy production hypothesis. Geosci. Model. Dev. 2024, 17, 3801–3814. [Google Scholar] [CrossRef]
- Li, J.; Chylek, P. Atmospheric Entropy. Part I: Climate Dissipation Structure. J. Clim. 2012, 25, 3173–3190. [Google Scholar] [CrossRef]
- Kleidon, A. Entropy Production by Evapotranspiration and its Geographic Variation. Soil. Water Res. 2008, 3, S89–S94. [Google Scholar] [CrossRef]
- Alahmer, A.; Omar, M.A.; Mayyas, A.; Dongri, S. Effect of relative humidity and temperature control on in-cabin thermal comfort state: Thermodynamic and psychometric analyses. Appl. Therm. Eng. 2011, 31, 2636–2644. [Google Scholar] [CrossRef]
- Boregowda, S.C.; Choate, R.E.; Handy, R. Entropy Generation Analysis of Human Thermal Stress Responses. Int. Sch. Res. Netw. ISRN Thermodyn. 2012, 2012, 830103. [Google Scholar] [CrossRef]
- Mendoza, V.; Pazos, M.; Garduño, R.; Mendoza, B. Thermodynamics of climate change between cloud cover, atmospheric temperature and humidity. Sci. Rep. 2021, 11, 21244. [Google Scholar] [CrossRef]
- London, J.A. Study of the Atmospheric Heat Balance; New York University: New York, NY, USA, 1957. [Google Scholar]
- Thompson, V.; Mitchell, D.; Hegerl, G.C.; Collins, M.; Leach, N.J.; Slingo, J.M. The most at-risk regions in the world for high-impact heatwaves. Nat. Commun. 2023, 14, 2152. [Google Scholar] [CrossRef]
- Abunyewah, M.; Gajendran, T.; Odei Erdiaw-Kwasie, M.; Baah, C.; Asare Okyere, S.; Kasun Sampath Udage Kankanamge, A. The multidimensional impacts of heatwaves on human ecosystems: A systematic literature review and future research direction. Environ. Sci. Policy 2025, 165, 104024. [Google Scholar] [CrossRef]
- Bejan, A. A Study of Entropy Generation in Fundamental Convective Heat Transfer. J. Heat Transfer. 1979, 101, 718–725. [Google Scholar] [CrossRef]
- Spearman, C. The Proof and Measurement of Association between Two Things. Am. J. Psychol. 1904, 15, 72–101. [Google Scholar] [CrossRef]
- Pearson, K. Notes on regression and inheritance in the case of two parents. Proc. R. Soc. Lond. 1895, 58, 240–242. [Google Scholar] [CrossRef]
- Statgraphics Technologies, Inc. STATGRAPHICS Centurion 19 (Release 19) [Statistical Analysis Software]. Available online: https://www.statgraphics.com (accessed on 22 May 2025).
- Adhikari, A.; Reponen, T.; Grinshpun, S.A.; Martuzevicius, D.; LeMasters, G. Correlation of ambient inhalable bioaerosols with particulate matter and ozone: A two-year study. Environ. Pollut. 2006, 140, 16e28. [Google Scholar] [CrossRef] [PubMed]
- Karimi, B.; Shokrinezhad, B. Spatial variation of ambient PM2.5 and PM10 in the industrial city of Arak, Iran: A land-use regression. Atmos. Pollut. Res. 2021, 12, 101235. [Google Scholar] [CrossRef]
- Li, D.; Xiong, J.; Cheng, G. Long-term exposure to ambient PM2.5 and its components on menarche timing among Chinese adolescents: Evidence from a representative nationwide cohort. BMC Public. Health 2024, 24, 707. [Google Scholar] [CrossRef]
- Reyna-Carranza, M.A.; Moreno-Flores, A.P.; López-Avitia, R. Acute respiratory infections and its Spearman correlation with meteorological and air pollutants data from Mexicali, BC, Mexico. In Proceedings of the Pan American Health Care Exchanges, Lima, Peru, 15–19 March 2010; p. 17. [Google Scholar] [CrossRef]
- Ni, W.; Stafoggia, M.; Zhang, S.; Ljungman, P.; Breitner, S.; de Bont, J.; Jernberg, T.; Atar, D.; Schneider, A.; Agewall, S. Short-term exposure to ambient temperature variability and myocardial infarction hospital admissions: A nationwide case-crossover study in Sweden. PLoS Med. 2025, 22, e1004607. [Google Scholar] [CrossRef]
- Fisher, R.A.; Tippett, L.H.C. Limiting forms of the frequency distribution of the largest or smallest member of a sample. Math. Proc. Camb. Philos. Soc. 1928, 24, 180–190. [Google Scholar] [CrossRef]
- Fréchet, M. Sur la loi de probabilité de l’écart maximum [On the probability distribution of the maximum deviation]. Ann. Pol. Math. 1927, 6, 93. [Google Scholar]
- Nair, J.; Wierman, A.; Zwart, B. The Fundamentals of Heavy Tails: Properties, Emergence, and Estimation; Cambridge Series in Statistical and Probabilistic Mathematics; Cambridge University Press: Cambridge, UK, 2022; pp. 240–248. [Google Scholar]
- Eliazar, I.; Klafter, J. Fractal probability laws. Phys. Rew. 2008, E77, 061125. [Google Scholar] [CrossRef] [PubMed]
- Decreto Supremo N° 12 del Ministerio del Medio Ambiente de Chile. Establishes Primary Environmental Quality Standard for Respirable Particulate Matter MP10. Available online: https://www.bcn.cl/leychile/navegar?idNorma=1176988 (accessed on 28 August 2025).
- Buszewski, B.; Kesy, M.; Ligor, T.; Amann, A. Human exhaled air analytics: Biomarkers of diseases. Biomed. Chromatogr. 2007, 21, 553–566. [Google Scholar] [CrossRef]
- Hashoul, D.; Haick, H. Sensors for detecting pulmonary diseases from exhaled breath. Eur. Respir. Rev. 2019, 28, 190011. [Google Scholar] [CrossRef] [PubMed]
- Ponce, M.C.; Sankari, A.; Sharma, S. Pulmonary Function Tests. National Library of Medicine. 2023. Available online: https://www.ncbi.nlm.nih.gov/books/NBK482339/ (accessed on 2 June 2025).
- Chen, S.-L.; Chang, S.-W.; Chen, Y.-J.; Chen, H.-L. Possible warming effect of fine particulate matter in the atmosphere. Commun. Earth Environ. 2021, 2, 208. [Google Scholar] [CrossRef]
- Xu, R.; Huang, S.; Shi, C.; Wang, R.; Liu, T.; Li, Y.; Zheng, Y.; Lv, Z.; Wei, J.; Sun, H.; et al. Extreme Temperature Events, Fine Particulate Matter, and Myocardial Infarction Mortality. Circulation 2023, 148, 312–323. [Google Scholar] [CrossRef] [PubMed]
- Stingone, J.A.; Luben, T.J.; Sheridan, S.C.; Langlois, P.H.; Shaw, G.M.; Reefhuis, J.; Romitti, P.A.; Feldkamp, M.L.; Nembhard, W.N.; Browne, M.L.; et al. Associations between fine particulate matter, extreme heat events, and congenital heart defects. Environ. Epidemiol. 2019, 3, e071. [Google Scholar] [CrossRef]
- Landguth, E.L.; Knudson, J.; Graham, J.; Orr, A.; Coyle, E.A.; Smith, P.; Semmens, E.O.; Noonan, C. Seasonal extreme temperatures and short-term fine particulate matter increases pediatric respiratory healthcare encounters in a sparsely populated region of the intermountain western United States. Environ. Health 2024, 23, 40. [Google Scholar] [CrossRef] [PubMed]
- Ke, L.; Zhang, Y.; Fu, Y.; Shen, X.; Zhang, Y.; Ma, X.; Di, Q. Short-term PM2.5 exposure and cognitive function: Association and neurophysiological mechanisms. Environ. Int. 2022, 170, 107593. [Google Scholar] [CrossRef]
- Gao, X.; Wang, P.; Hu, Y.; Cao, Y.; Yuan, W.; Luan, Y.; Quan, C.; Zhou, Z.; Zou, H. Exposure Concentrations and Inhalation Risk of Submicron Particles in a Gasoline Station—A Pilot Study. Sustainability 2023, 15, 9455. [Google Scholar] [CrossRef]
- Yu, A.; Lu, J.; Shen, X.; Hu, X.; Zhang, Y.; Liu, Q.; Tong, H.; Liang, L.; Liu, L.; Ma, Q.; et al. Determination of the deposition of urban submicron aerosols in the human respiratory tract considering hygroscopic growth. Atmos. Environ. 2025, 356, 121289. [Google Scholar] [CrossRef]
- Li, C.; Martin, R.V.; van Donkelaar, A.; Jimenez, J.L.; Zhang, Q.; Turner, J.R.; Liu, X.; Rowe, M.; Meng, J.; Yu, W.; et al. Estimates of submicron particulate matter (PM1) concentrations for 1998–2022 across the contiguous USA: Leveraging measurements of PM1 with nationwide PM2·5 component data. Lancet Planet. Health 2025, 9, e491–e502. [Google Scholar] [CrossRef]
- Moniruzzaman, M.; Hossain, K.; Saha, B.; Parvin, A.; Suchi, P.D.; Gulshan, J.-E.; Nawar, A.; Shahrukh, S.; Alam, S.; Ankhy, R.S.; et al. Multivariate toxicological assessments of inhaled fine-submicron particle-bound metals in school-aged children of Dhaka city. Atmos. Pollut. Res. 2025, 16, 102545. [Google Scholar] [CrossRef]
- ISO 14644-1:2015; Cleanrooms and Associated Controlled Environments—Part 1: Classification of Air Cleanliness by Particle Concentration. ISO—International Organization for Standardization: Geneva, Switzerland, 2015. Available online: https://www.iso.org/standard/53394.html (accessed on 29 May 2025).
 .
.
 .
.


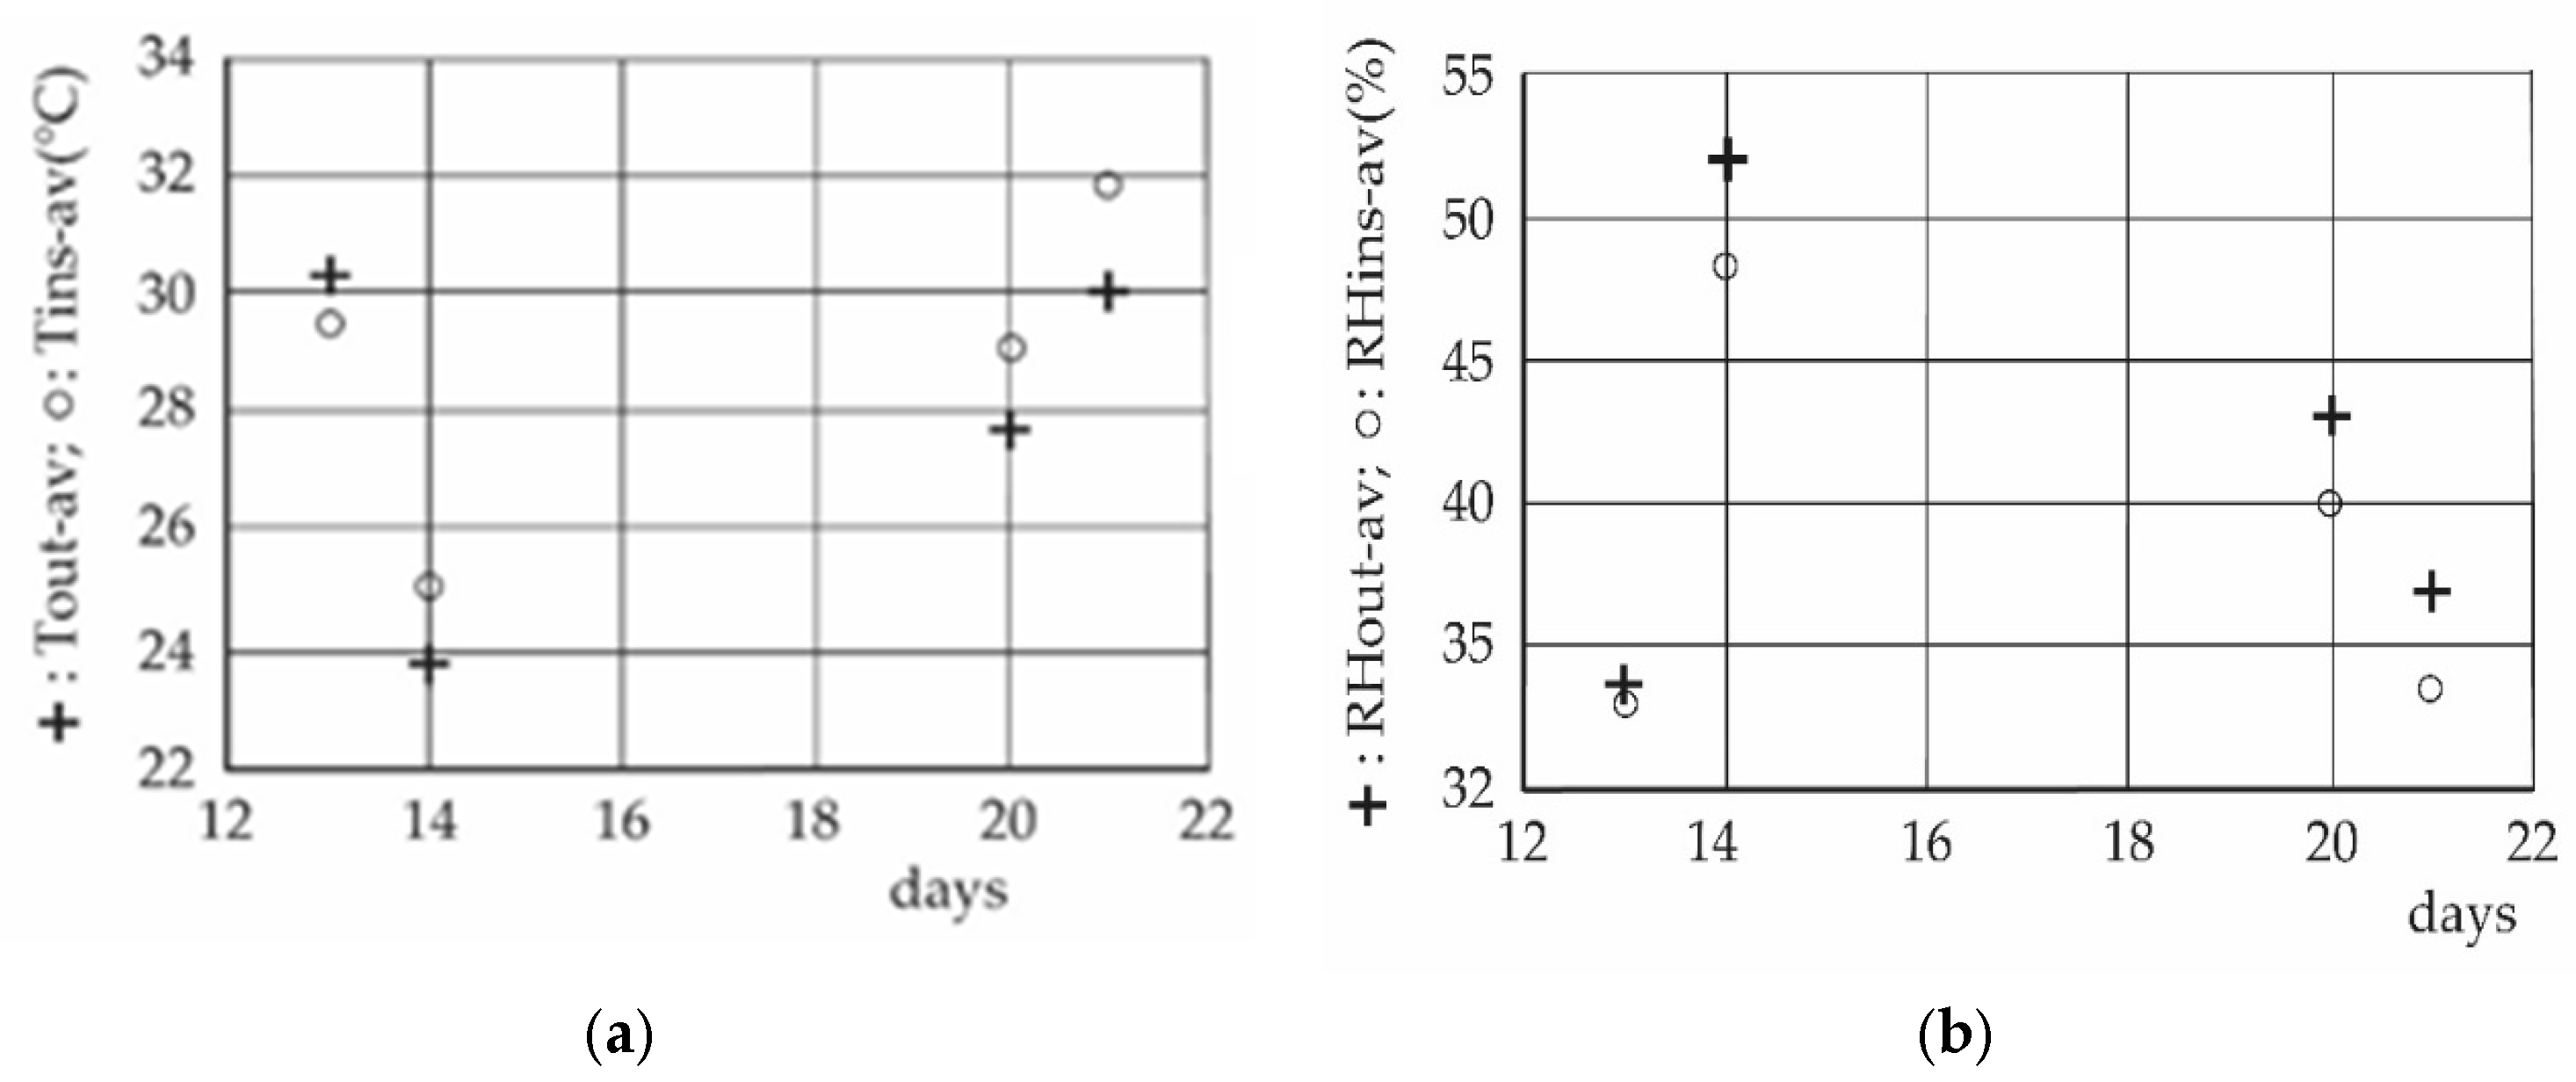

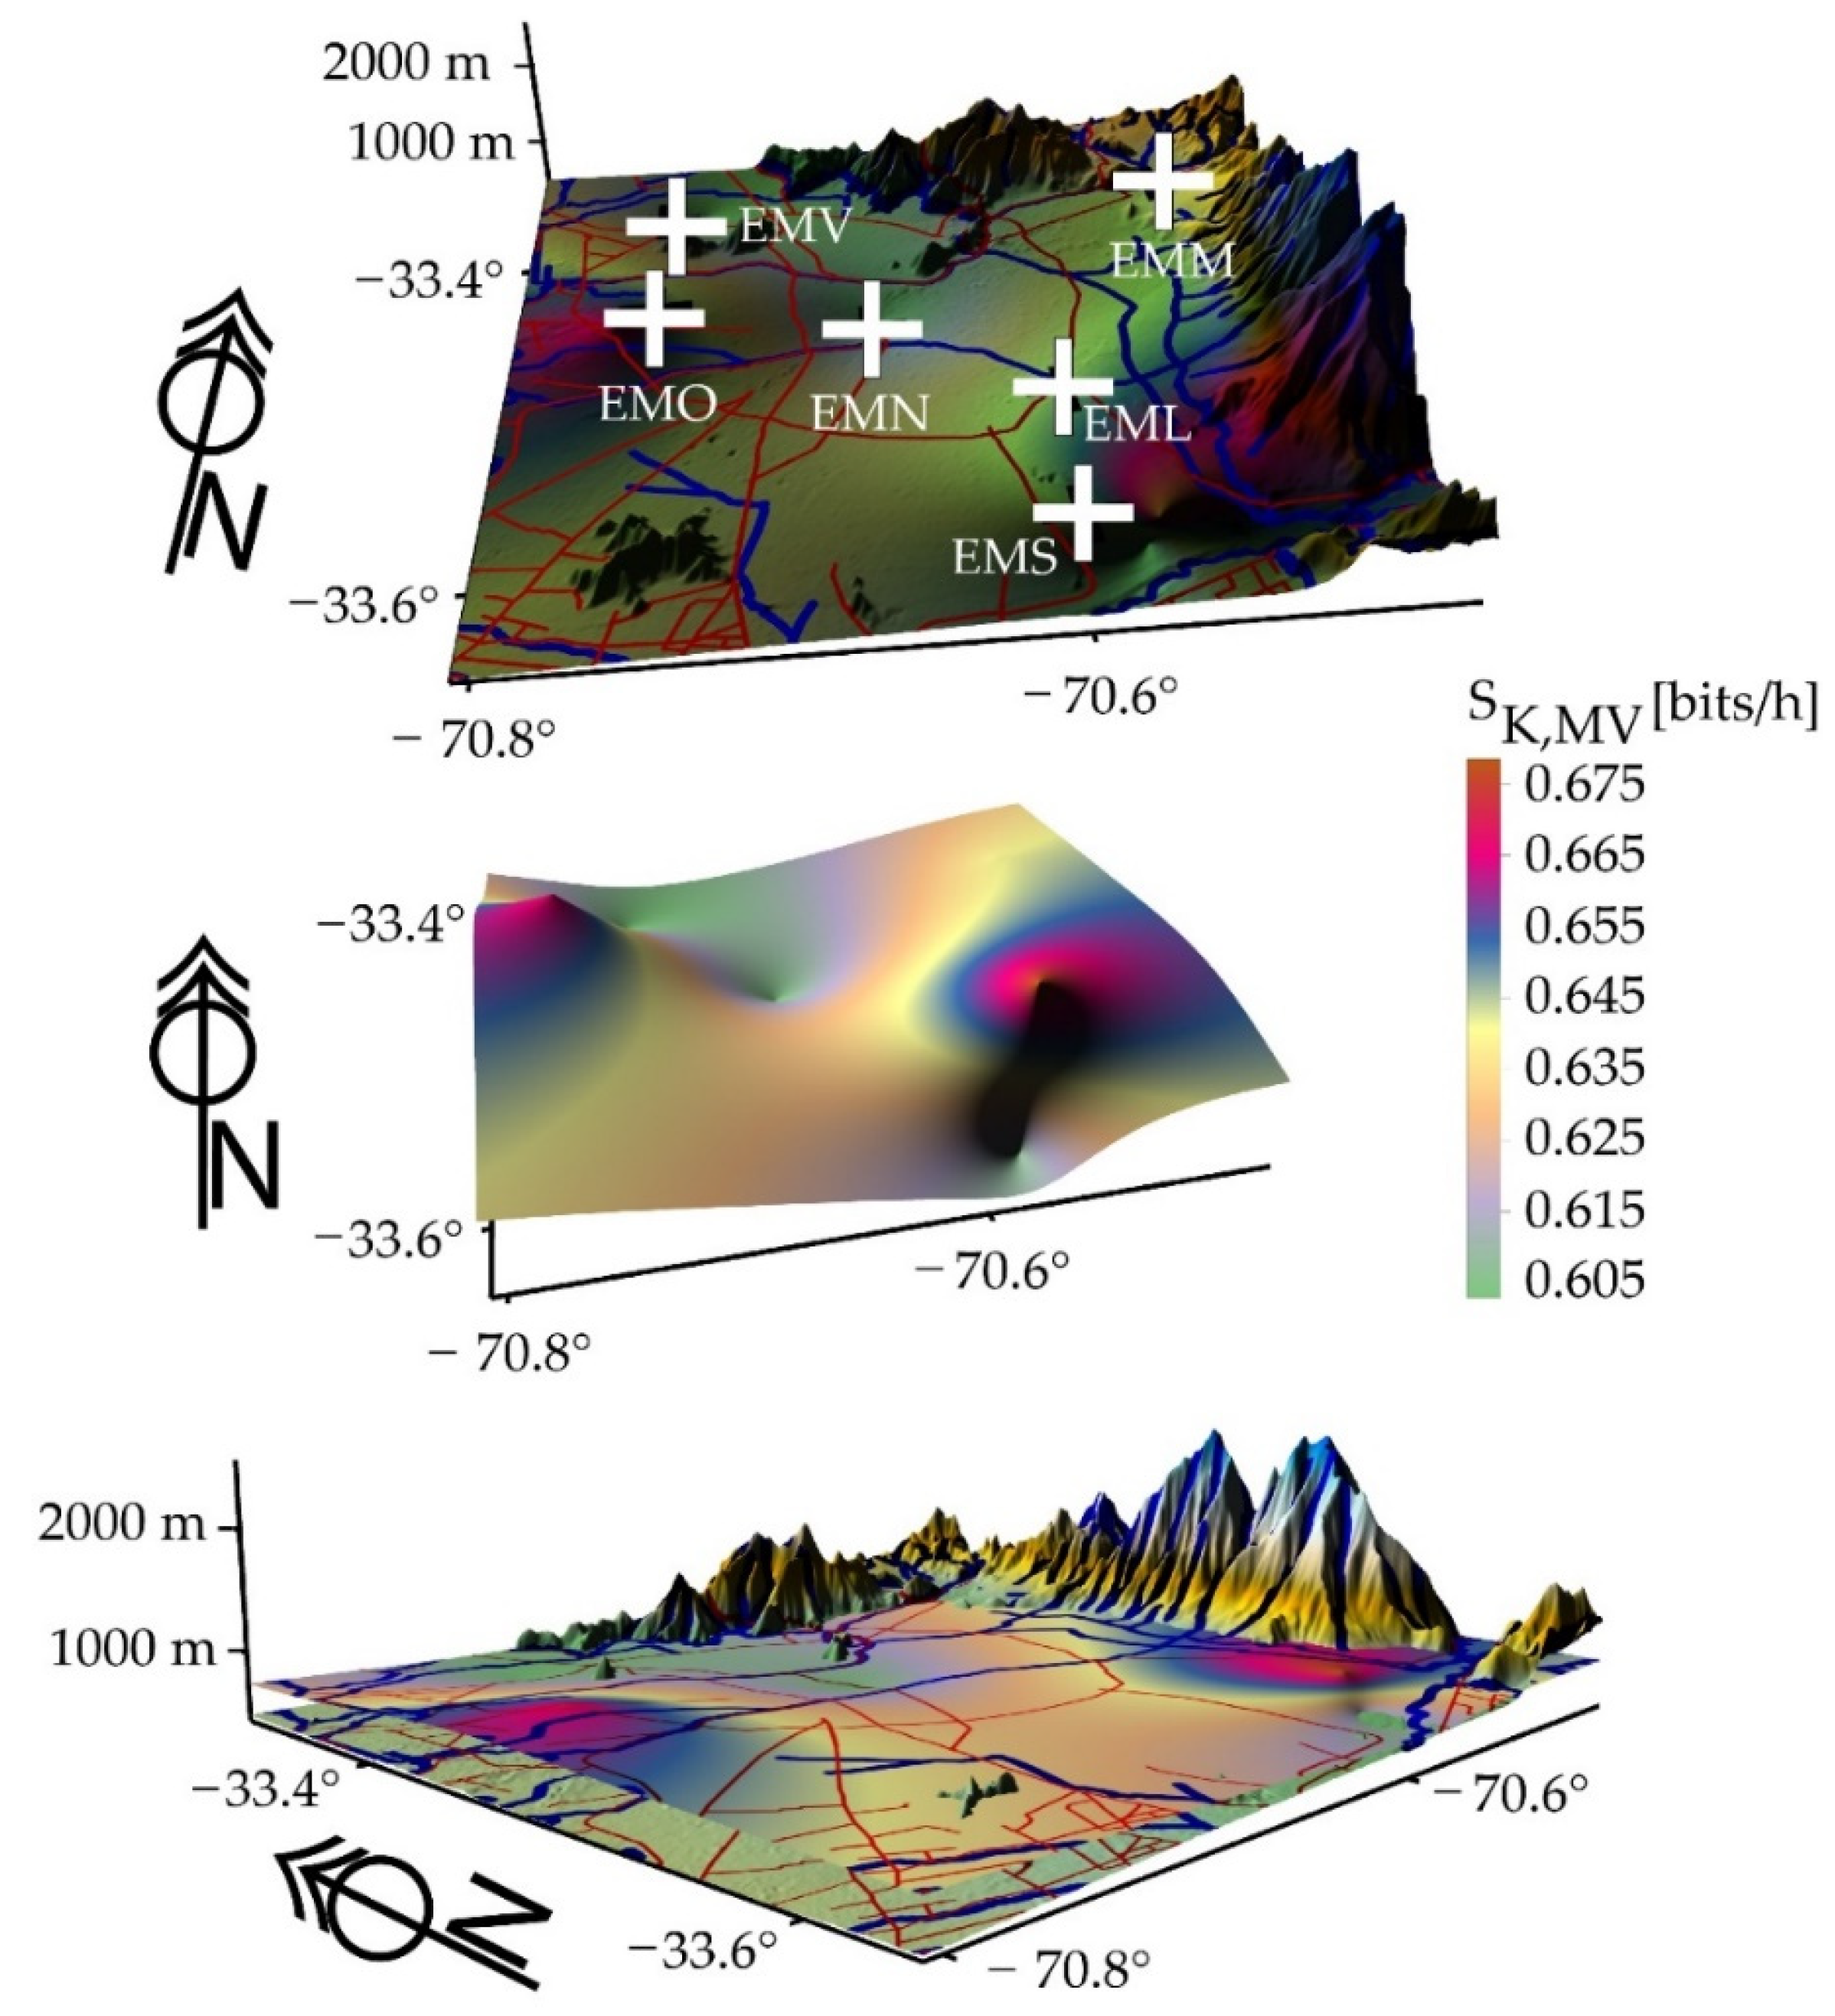


| (a) OUTSIDE | (b) INSIDE | ||||||||||
|---|---|---|---|---|---|---|---|---|---|---|---|
| (STATION 3) | March | (STATION 1) | March | ||||||||
| Hours | Days | Tav (°C) | RHav (%) | Tmax (°C) | RHmax | Hours | Days | Tav (°C) | RHav (%) | Tmax (°C) | RHmax |
| 10:52/12:52 | 13 | 33.136 | 30.239 | 39.8 | 41.2 | 11:16/13:14 | 13 | 23.849 | 40.511 | 27.3 | 46.7 |
| 13:50/15:51 | 13 | 29.854 | 34.877 | 30.6 | 40.6 | 13:37/15:36 | 13 | 32.762 | 29.704 | 39.8 | 35.8 |
| 16:28/18:31 | 13 | 27.823 | 35.277 | 29.1 | 37.3 | 16:29/18:27 | 13 | 31.759 | 28.592 | 36.2 | 32.5 |
| av | 30.27 | 33.46 | av | 29.46 | 32.94 | ||||||
| 10:27/12:28 | 14 | 24.288 | 51.569 | 31.8 | 70.7 | 11:02/13:01 | 14 | 19.815 | 60.404 | 22.8 | 69.8 |
| 13:21/15:22 | 14 | 23.612 | 51.626 | 24.4 | 53.5 | 13:26/15:10 | 14 | 26.545 | 44.144 | 36.2 | 53.8 |
| 16:30/18:28 | 14 | 23.335 | 52.964 | 24 | 56.2 | 16:35/18:34 | 14 | 28.824 | 40.332 | 33.5 | 49.8 |
| av | 23.75 | 52.05 | av | 25.06 | 48.29 | ||||||
| 11:05/13:04 | 20 | 31.71 | 36.775 | 37.4 | 51.8 | 11:31/13:31 | 20 | 23.915 | 49.708 | 26.5 | 55.1 |
| 13:33/15:31 | 20 | 25.917 | 47.14 | 26.9 | 51.2 | 14:01/16:00 | 20 | 32.963 | 34.579 | 42.1 | 50 |
| 16:49/18:47 | 20 | 25.565 | 45.593 | 26.3 | 48.4 | 16:59/18:57 | 20 | 30.32 | 35.525 | 34.3 | 41.8 |
| av | 27.73 | 43.17 | av | 29.07 | 39.94 | ||||||
| 11:00/12:58 | 21 | 34.064 | 32.446 | 43.2 | 53.4 | 11:26/13:24 | 21 | 25.283 | 44.349 | 28.5 | 51.8 |
| 13:36/15:34 | 21 | 28.182 | 39.399 | 29.1 | 46.9 | 14:12/16:10 | 21 | 37.218 | 26.515 | 44.6 | 41.7 |
| 16:43/18:42 | 21 | 27.838 | 38.884 | 28.7 | 41.9 | 16:53/18:51 | 21 | 33.01 | 29.784 | 39.3 | 35.9 |
| av | 30.03 | 36.91 | av | 31.84 | 33.55 |
| Height (msln) | 2010/2013 | 2017/2020 | 2019/2022 |
|---|---|---|---|
| 784 (EML) | 15.40 | 16.12 | 16.10 |
| 709 (EMM) | 15.86 | 16.85 | 14.70 |
| 520 (EMN) | 15.34 | 16.17 | 16.05 |
| 469 (EM0) | 16.77 | 16.80 | 15.31 |
| 698 (EMS) | 14.69 | 15.53 | 15.42 |
| 485 (EMV) | 15.77 | 16.85 | 15.50 |
| (a) + (b) | B 0.3 (µm) | B 0.5 (µm) | B 1 (µm) | B 10 (µm) | B 2.5 (µm) | B 5 (µm) | B RH (%) | B T(°C) | B WS (ms−1) | |||||||||
| B 0.3 (µm) | 0.97 | 0.95 | 0.75 | 0.93 | 0.77 | 0.32 | 0.43 | 0.36 | ||||||||||
| p-value | 0.000 | 0.000 | 0.000 | 0.000 | 0.000 | 0.035 | 0.141 | 0.234 | ||||||||||
| B 0.5 (µm) | 0.95 | 0.76 | 0.93 | 0.78 | 0.31 | 0.41 | 0.38 | |||||||||||
| p-value | 0.000 | 0.000 | 0.000 | 0.000 | 0.010 | 0.062 | 0.076 | |||||||||||
| B 1 (µm) | 0.77 | 0.94 | 0.78 | 0.29 | 0.40 | 0.39 | ||||||||||||
| p-value | 0.000 | 0.000 | 0.000 | 0.005 | 0.030 | 0.025 | ||||||||||||
| B 10 (µm) | 0.81 | 0.80 | 0.18 | 0.29 | 0.24 | |||||||||||||
| p-value | 0.000 | 0.000 | 0.119 | 0.107 | 0.226 | |||||||||||||
| B 2.5 (µm) | 0.81 | 0.24 | 0.35 | 0.36 | ||||||||||||||
| p-value | 0.000 | 0.004 | 0.029 | 0.017 | ||||||||||||||
| B 5 (µm) | 0.24 | 0.34 | 0.19 | |||||||||||||||
| p-value | 0.225 | 0.160 | 0.014 | |||||||||||||||
| B RH (%) | 0.87 | 0.27 | ||||||||||||||||
| p-value | 0.000 | 0.036 | ||||||||||||||||
| B T (°C) | 0.22 | |||||||||||||||||
| p-value | 0.023 | |||||||||||||||||
| WS (ms−1) | ||||||||||||||||||
| p-value | ||||||||||||||||||
| (c) + (d) | B 0.3 (µm) | B 0.5 (µm) | B 1 (µm) | B 10 (µm) | B 2.5 (µm) | B 5 (µm) | B RH (%) | B T(°C) | B WS (ms−1) | |||||||||
| B 0.3 (µm) | 0.97 | 0.95 | 0.75 | 0.93 | 0.77 | −0.08 | 0.21 | −0.35 | ||||||||||
| p-value | 0.000 | 0.000 | 0.000 | 0.000 | 0.000 | 0.035 | 0.141 | 0.234 | ||||||||||
| B 0.5 (µm) | 0.95 | 0.76 | 0.93 | 0.78 | −0.10 | 0.22 | −0.35 | |||||||||||
| p-value | 0.000 | 0.000 | 0.000 | 0.000 | 0.010 | 0.062 | 0.076 | |||||||||||
| B 1 (µm) | 0.77 | 0.94 | 0.78 | −0.09 | 0.22 | −0.34 | ||||||||||||
| p-value | 0.000 | 0.000 | 0.000 | 0.005 | 0.030 | 0.025 | ||||||||||||
| B 10 (µm) | 0.81 | 0.80 | 0.05 | 0.10 | −0.16 | |||||||||||||
| p-value | 0.000 | 0.000 | 0.119 | 0.107 | 0.226 | |||||||||||||
| B 2.5 (µm) | 0.81 | −0.11 | 0.25 | −0.31 | ||||||||||||||
| p-value | 0.000 | 0.004 | 0.029 | 0.017 | ||||||||||||||
| B 5 (µm) | 0.11 | 0.02 | −0.12 | |||||||||||||||
| p-value | 0.225 | 0.160 | 0.014 | |||||||||||||||
| B RH (%) | −0.87 | 0.16 | ||||||||||||||||
| p-value | 0.000 | 0.036 | ||||||||||||||||
| B T (°C) | −0.11 | |||||||||||||||||
| p-value | 0.023 | |||||||||||||||||
| WS (ms−1) | ||||||||||||||||||
| p-value | ||||||||||||||||||
| (a) + (b) | B 0.3 (µm) | B 0.5 (µm) | B 1 (µm) | B 10 (µm) | B 2.5 (µm) | B 5 (µm) | B RH (%) | B T(°C) | B WS (ms−1) | |||||||||
| B 0.3 (µm) | 0.95 | 0.94 | 0.86 | 0.90 | 0.71 | 0.72 | 0.68 | 0.33 | ||||||||||
| p-value | 0.000 | 0.000 | 0.000 | 0.000 | 0.000 | 0.000 | 0.000 | 0.005 | ||||||||||
| B 0.5 (µm) | 0.96 | 0.89 | 0.94 | 0.74 | 0.68 | 0.65 | 0.37 | |||||||||||
| p-value | 0.000 | 0.000 | 0.000 | 0.000 | 0.000 | 0.000 | 0.001 | |||||||||||
| B 1 (µm) | 0.87 | 0.94 | 0.74 | 0.67 | 0.63 | 0.38 | ||||||||||||
| p-value | 0.000 | 0.000 | 0.000 | 0.000 | 0.000 | 0.001 | ||||||||||||
| B 10 (µm) | 0.91 | 0.73 | 0.62 | 0.59 | 0.32 | |||||||||||||
| p-value | 0.000 | 0.000 | 0.000 | 0.000 | 0.104 | |||||||||||||
| B 2.5 (µm) | 0.77 | 0.59 | 0.55 | 0.37 | ||||||||||||||
| p-value | 0.000 | 0.000 | 0.000 | 0.004 | ||||||||||||||
| B 5 (µm) | 0.59 | 0.57 | 0.17 | |||||||||||||||
| p-value | 0.000 | 0.000 | 0.142 | |||||||||||||||
| B RH (%) | 0.99 | 0.27 | ||||||||||||||||
| p-value | 0.000 | 0.000 | ||||||||||||||||
| B T (°C) | 0.24 | |||||||||||||||||
| p-value | 0.000 | |||||||||||||||||
| WS (ms−1) | ||||||||||||||||||
| p-value | ||||||||||||||||||
| (c) + (d) | B 0.3 (µm) | B 0.5 (µm) | B 1 (µm) | B 10 (µm) | B 2.5 (µm) | B 5 (µm) | B RH (%) | B T(°C) | B WS (ms−1) | |||||||||
| B 0.3 (µm) | 0.95 | 0.94 | 0.86 | 0.90 | 0.71 | 0.72 | −0.68 | −0.25 | ||||||||||
| p-value | 0.000 | 0.000 | 0.000 | 0.000 | 0.000 | 0.000 | 0.000 | 0.005 | ||||||||||
| B 0.5 (µm) | 0.96 | 0.89 | 0.94 | 0.74 | 0.68 | −0.65 | −0.28 | |||||||||||
| p-value | 0.000 | 0.000 | 0.000 | 0.000 | 0.000 | 0.000 | 0.001 | |||||||||||
| B 1 (µm) | 0.87 | 0.94 | 0.74 | 0.67 | −0.63 | −0.26 | ||||||||||||
| p-value | 0.000 | 0.000 | 0.000 | 0.000 | 0.000 | 0.001 | ||||||||||||
| B 10 (µm) | 0.91 | 0.73 | 0.62 | −0.59 | −0.30 | |||||||||||||
| p-value | 0.000 | 0.000 | 0.000 | 0.000 | 0.104 | |||||||||||||
| B 2.5 (µm) | 0.77 | 0.59 | −0.55 | 0.26 | ||||||||||||||
| p-value | 0.000 | 0.000 | 0.000 | 0.004 | ||||||||||||||
| B 5 (µm) | −0.59 | −0.57 | −0.10 | |||||||||||||||
| p-value | 0.000 | 0.000 | 0.142 | |||||||||||||||
| B RH (%) | −0.99 | −0.27 | ||||||||||||||||
| p-value | 0.000 | 0.000 | ||||||||||||||||
| B T (°C) | −0.24 | |||||||||||||||||
| p-value | 0.000 | |||||||||||||||||
| WS (ms−1) | ||||||||||||||||||
| p-value | ||||||||||||||||||
Disclaimer/Publisher’s Note: The statements, opinions and data contained in all publications are solely those of the individual author(s) and contributor(s) and not of MDPI and/or the editor(s). MDPI and/or the editor(s) disclaim responsibility for any injury to people or property resulting from any ideas, methods, instructions or products referred to in the content. |
© 2025 by the authors. Licensee MDPI, Basel, Switzerland. This article is an open access article distributed under the terms and conditions of the Creative Commons Attribution (CC BY) license (https://creativecommons.org/licenses/by/4.0/).
Share and Cite
Pacheco Hernández, P.; Mera Garrido, E.; Navarro Ahumada, G.; Wachter Chamblas, J.; Polo Pizan, S. Submicron Particles and Micrometeorology in Highly Densified Urban Environments: Heavy-Tailed Probability Study. Atmosphere 2025, 16, 1044. https://doi.org/10.3390/atmos16091044
Pacheco Hernández P, Mera Garrido E, Navarro Ahumada G, Wachter Chamblas J, Polo Pizan S. Submicron Particles and Micrometeorology in Highly Densified Urban Environments: Heavy-Tailed Probability Study. Atmosphere. 2025; 16(9):1044. https://doi.org/10.3390/atmos16091044
Chicago/Turabian StylePacheco Hernández, Patricio, Eduardo Mera Garrido, Gustavo Navarro Ahumada, Javier Wachter Chamblas, and Steicy Polo Pizan. 2025. "Submicron Particles and Micrometeorology in Highly Densified Urban Environments: Heavy-Tailed Probability Study" Atmosphere 16, no. 9: 1044. https://doi.org/10.3390/atmos16091044
APA StylePacheco Hernández, P., Mera Garrido, E., Navarro Ahumada, G., Wachter Chamblas, J., & Polo Pizan, S. (2025). Submicron Particles and Micrometeorology in Highly Densified Urban Environments: Heavy-Tailed Probability Study. Atmosphere, 16(9), 1044. https://doi.org/10.3390/atmos16091044


