Article

Assessing Spatiotemporal Distribution of Air Pollution in Makkah, Saudi Arabia, During the Hajj 2023 and 2024 Using Geospatial Techniques

Department of Geography, Faculty of Social Sciences, Umm Al-Qura University, Makkah 21961, Saudi Arabia
*
Author to whom correspondence should be addressed.
Atmosphere 2025, 16(9), 1025; https://doi.org/10.3390/atmos16091025
Submission received: 14 July 2025 / Revised: 23 August 2025 / Accepted: 25 August 2025 / Published: 29 August 2025

Abstract

Mass gatherings such as the annual Hajj pilgrimage in Makkah, Saudi Arabia, generate extreme, short-term anthropogenic emission loads with significant air quality and public health implications. This study assesses the spatiotemporal dynamics of key atmospheric pollutants—including nitrogen dioxide (NO2), carbon monoxide (CO), sulfur dioxide (SO2), formaldehyde (HCHO), and aerosols—across Makkah and its holy sites before and during the Hajj seasons of 2023 and 2024. Using high-resolution Sentinel-5P TROPOMI satellite data, pollutant fields were reconstructed at 100 m spatial resolution via cloud-based geospatial analysis on the Google Earth Engine. During Hajj 2023, spatially resolved NO2 concentrations ranged from 15.4 μg/m3 to 38.3 μg/m3 with an average of 24.7 μg/m3, while SO2 during the 2024 event peaked at 51.2 μg/m3 in key hotspots, occasionally exceeding World Health Organization (WHO) guideline values. Aerosol index values showed episodic surges (up to 1.43), particularly over transportation corridors, parking areas, and logistics facilities. CO concentrations reached values as high as 1069.8 μg/m3 in crowded zones, and HCHO concentrations surged up to 9.99 μg/m3 during peak periods. Quantitative correlation analysis revealed that during Hajj, atmospheric chemistry diverged from urban baseline: the NO2–SO2 relationship shifted from strongly negative pre-Hajj (r = −0.74) to moderately positive during the event (r = 0.35), while aerosol–HCHO correlations intensified negatively from r = −0.23 pre-Hajj to r = −0.50 during Hajj. Meteorological analysis indicated significant positive correlations between wind speed and NO2 (r = 0.35) and wind speed and CO (r = 0.35) during 2024, demonstrating that extreme emission rates overwhelmed typical dispersive processes. Relative humidity was positively correlated with aerosol loading (r = 0.37), pointing to hygroscopic growth patterns. These results quantitatively demonstrate that Hajj drives a distinct, event-specific pollution regime, characterized by sharp increases in key pollutant concentrations, altered inter-pollutant and pollutant–meteorology relationships, and spatially explicit hotspots driven by human activity and infrastructure. The integrated satellite–meteorology workflow enabled near-real-time monitoring in a data-sparse environment and establishes a scalable framework for evidence-based air quality management and health risk reduction in mass gatherings.

1. Introduction

Rapid urbanization and episodic mass gatherings intensify environmental pressures in cities, necessitating rigorous assessment of air pollution to protect public health and guide policy. Makkah, a central religious city in Saudi Arabia, experiences an acute surge in anthropogenic activities during the Hajj season, when millions of pilgrims converge over a short period, leading to marked increases in transportation demand, energy use, and service-related emissions [1,2]. These conditions elevate concentrations of key atmospheric pollutants and have direct implications for the health of vulnerable groups, including older adults and individuals with pre-existing cardiopulmonary conditions, given established links between air pollution exposure and respiratory and cardiovascular morbidity [3].
In alignment with Saudi Arabia’s Vision 2030, the anticipated expansion in Hajj capacity is expected to amplify environmental stressors in Makkah and adjacent holy sites, underscoring the urgency of robust air quality management during pilgrimage periods [4]. Recent reviews emphasize the health risks associated with elevated pollution levels during Hajj and call for targeted mitigation strategies to reduce emissions from transport and related sources [5,6]. Empirical investigations have documented pollutant spikes and associated health risks among pilgrims, including associations between nitrogen dioxide (NO2) and adverse health outcomes, as well as elevated concentrations of carbon monoxide (CO) and volatile organic compounds (VOCs) in high-traffic microenvironments such as tunnels, where sources include vehicle exhaust, fuel evaporation, and climate-control systems [7]. Particularly, follow-up observations outside the pilgrimage season reported pollutant levels comparable to those of other urban environments with chronic air quality challenges, reinforcing the need for sustained management beyond peak periods [8].
Comprehensive evaluation of atmospheric pollution requires approaches that capture spatial and temporal heterogeneity, which is often constrained by the sparse coverage of ground-based monitoring networks in rapidly changing settings [9,10]. Satellite-based remote sensing has emerged as a transformative complement, enabling consistent, wide-area monitoring of key pollutants. The Sentinel-5 Precursor (Sentinel-5P), launched under the Copernicus program, carries the Tropospheric Monitoring Instrument (TROPOMI), which provides high-resolution global observations of atmospheric constituents including ozone (O3), NO2, sulfur dioxide (SO2), formaldehyde (HCHO), and aerosols [11,12]. The integration of Sentinel-5P data with cloud-based platforms such as Google Earth Engine (GEE) facilitates scalable, near-real-time analyses and efficient handling of large datasets, enabling nuanced assessments of pollution dynamics across extensive regions [13].
Despite growing interest in environmental monitoring of the Hajj, research on the spatiotemporal distribution of pollutants in Makkah during pilgrimage periods remains limited. Existing studies primarily address general environmental impacts of transportation and urbanization or rely on ground monitoring with limited spatial representativeness [3,5,14]. Few investigations have systematically mapped the spatial and temporal variability of CO, NO2, SO2, HCHO, and aerosols during Hajj using high-resolution satellite observations, and comprehensive analyses explicitly linking pollutant fields to meteorological drivers and event dynamics are scarce [15,16].
This study addresses these gaps by assessing the spatiotemporal distribution of atmospheric pollutants in Makkah before and during the Hajj seasons of 2023 and 2024 using Sentinel-5P imagery integrated within a geospatial analysis workflow. By reconstructing pollutant concentration fields over the Holy Sites region and incorporating meteorological context, the analysis provides continuous, spatially resolved insights into pollution dynamics under extreme, short-term population surges. This approach is particularly valuable where ground networks are sparse and conditions evolve rapidly, offering an operationally relevant framework for large-scale, near-real-time air quality assessment during mass gatherings and for informing targeted emission reduction strategies that safeguard public health.
This study aims to assess the spatiotemporal distribution of key atmospheric pollutants CO, NO2, SO2, HCHO, and aerosols across Makkah and the Holy Sites before and during the 2023 and 2024 Hajj seasons, using Sentinel-5P TROPOMI observations integrated within a geospatial analysis workflow on Google Earth Engine. Motivated by documented pollution spikes, health risks to vulnerable pilgrim populations, and the anticipated intensification of environmental pressures under Vision 2030, the study provides continuous, spatially resolved assessments that complement sparse ground-based monitoring and capture short-term dynamics during mass gatherings.
This study contributes to the scientific understanding of air quality dynamics during mass gatherings by establishing a high-resolution, satellite-based monitoring framework using Sentinel-5P TROPOMI data integrated with Google Earth Engine to assess the spatiotemporal distribution of CO, NO2, SO2, HCHO, and aerosols across Makkah’s Holy Sites during the 2023 and 2024 Hajj seasons. The research demonstrates an operationally scalable geospatial workflow suitable for near-real-time air quality monitoring in data-sparse environments with rapidly changing emission patterns, while providing spatially explicit pollutant mapping that identifies critical microenvironments and exposure hotspots for targeted intervention strategies. By integrating meteorological context with satellite observations and establishing a multi-year comparative framework, the study enhances understanding of atmospheric processes and pollutant–weather interactions during extreme events, bridging a critical research gap in event-centric air quality monitoring through advanced remote sensing applications. The methodology creates a transferable framework applicable to other large-scale gatherings and cities with limited ground-based monitoring infrastructure, supporting evidence-based policy development for targeted emission control strategies, traffic management, and health risk mitigation during religious events. Finally, the research advances public health preparedness by identifying priority zones for intervention and demonstrating the utility of cloud-based platforms for large-scale environmental monitoring in resource-constrained settings, while establishing a geospatial evidence base that informs microenvironment-focused mitigation strategies during mass gatherings.

2. Materials and Methods

2.1. Study Area

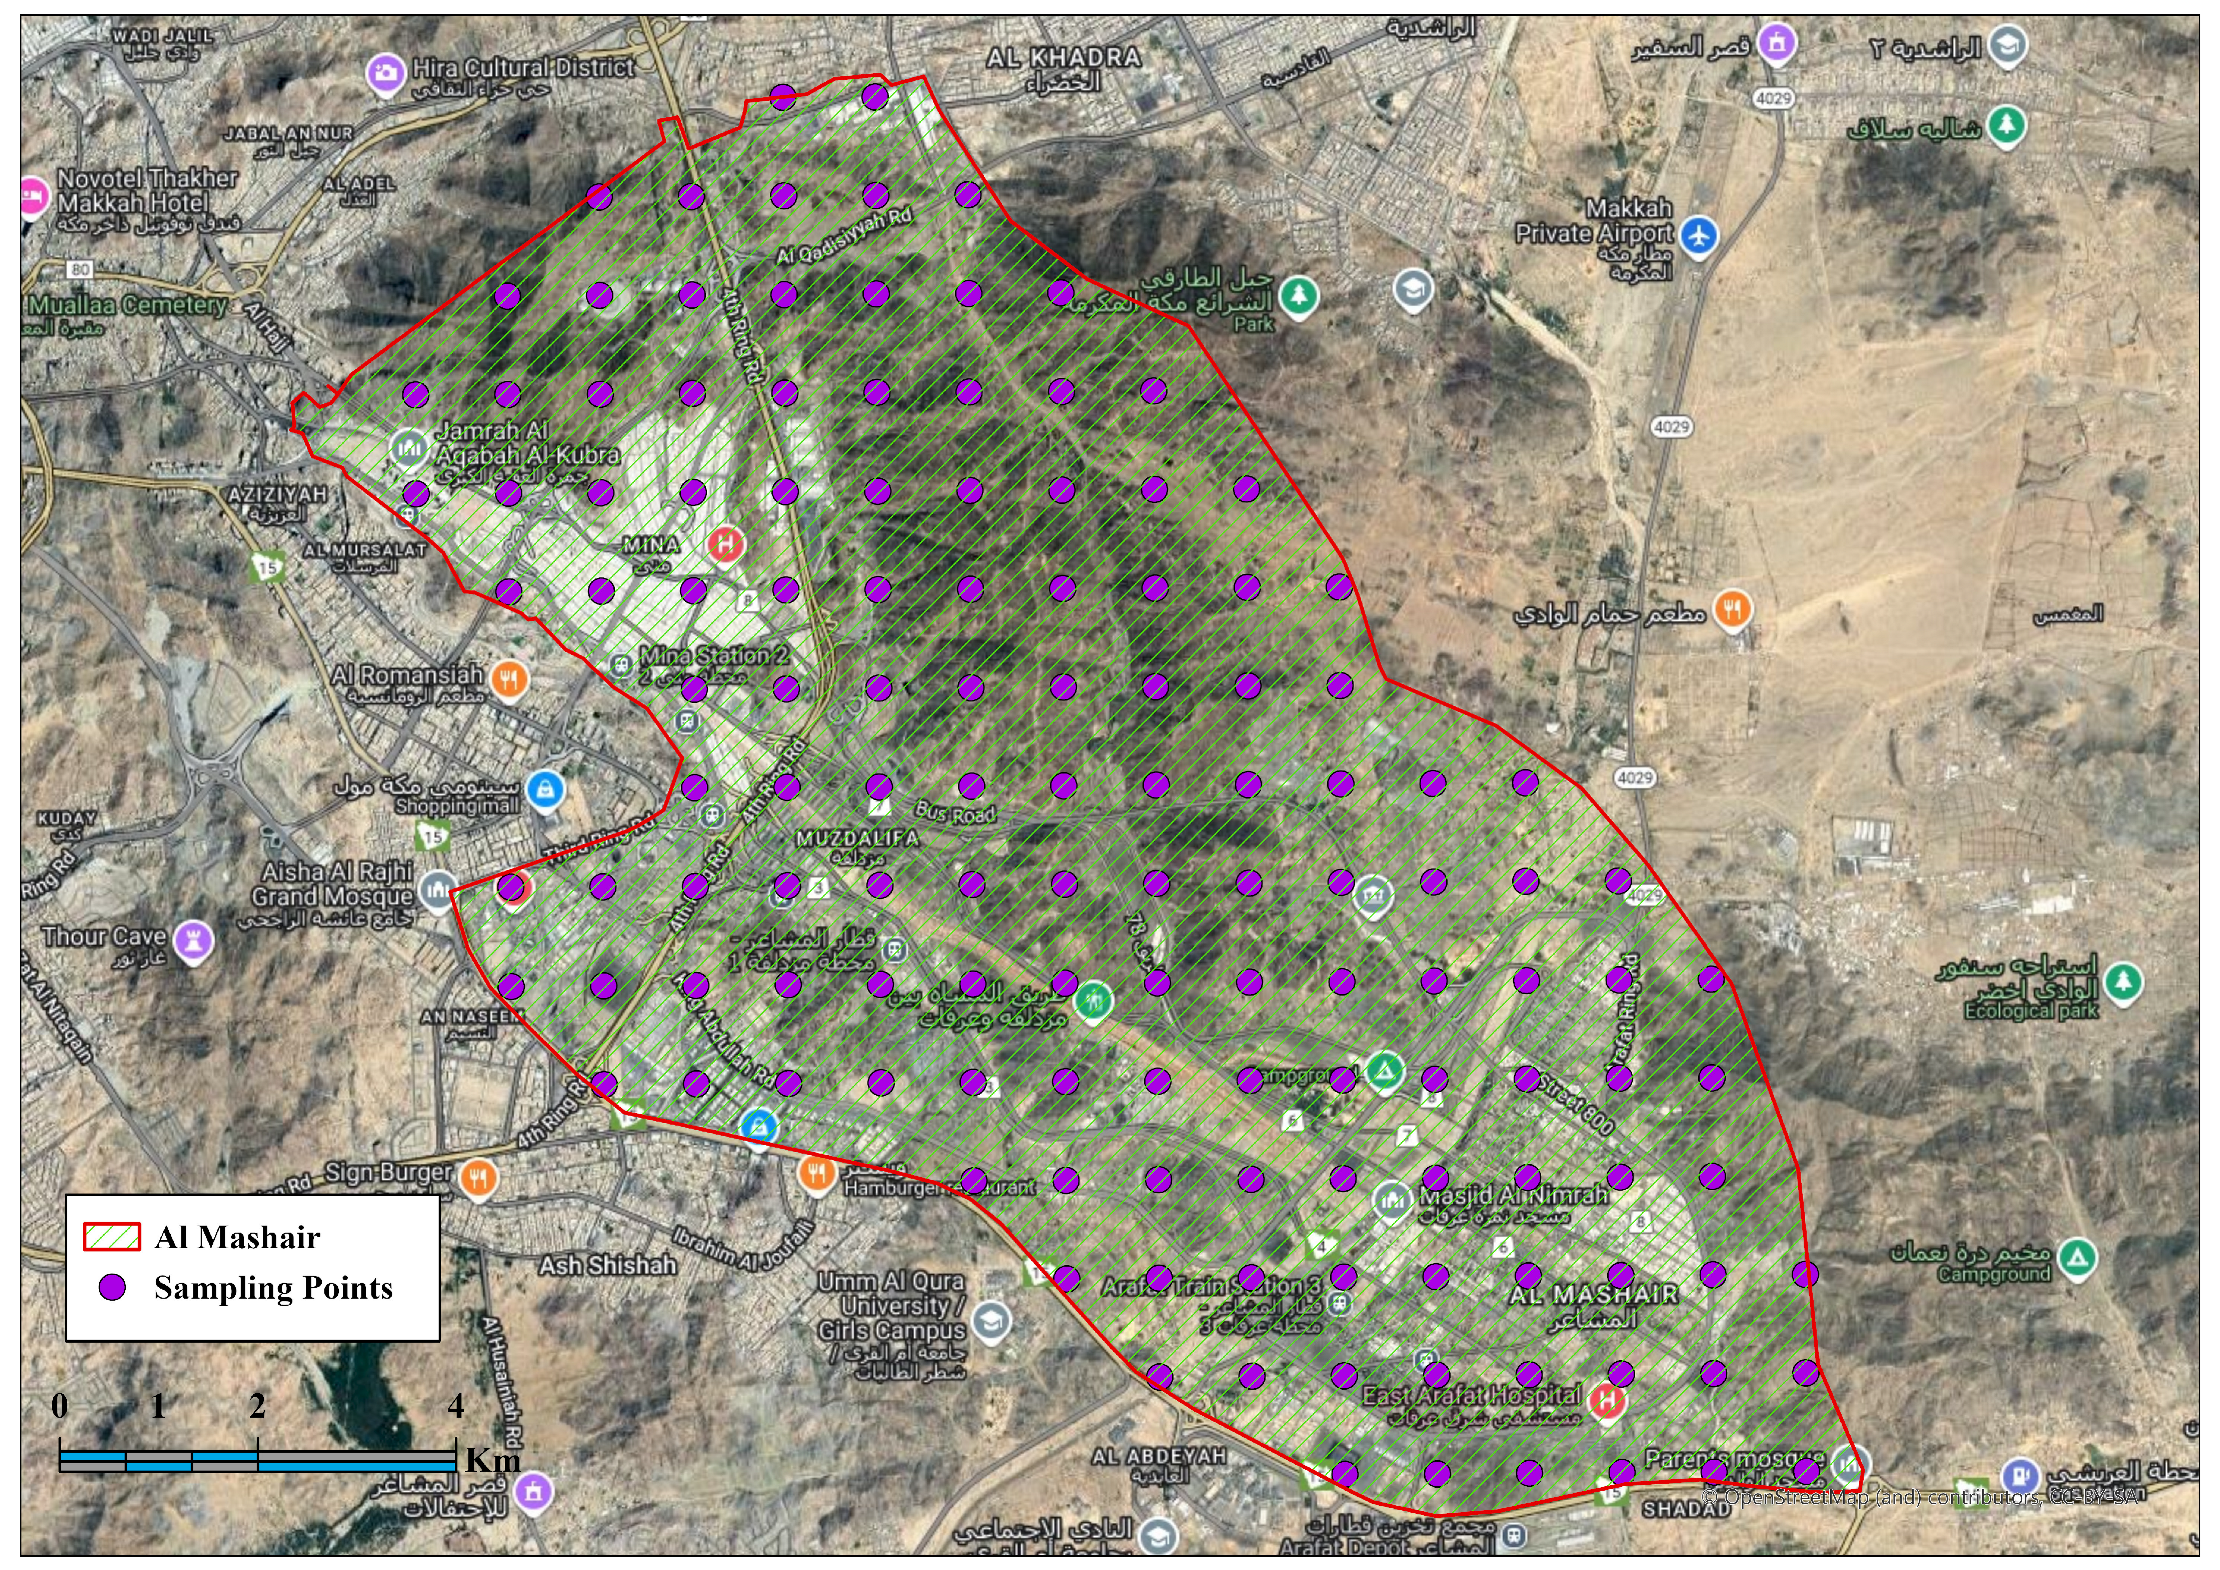
Makkah is in western Saudi Arabia between 21°25′21.0360″ N and 39°49′34.2048″ E (Figure 1). The city covers an administrative area of 1412 km2 and has a population of approximately 2 million residents. Notably, 26% of Saudi Arabia’s total population is concentrated in the Makkah region [17]. According to the Köppen–Geiger climate classification system, Makkah has an arid desert climate (BWh) characterized by extreme heat and minimal precipitation [18].
The Al Mashair region within Makkah Al-Mukarramah, Saudi Arabia, is clearly delineated by a distinctive red boundary. The area of this region is about 119.47 km2 and covering coordinates between 39°52′ E to 40° E longitude and 21°26′ N to 21°30′ N latitude, as Figure 1. Within several critical religious sites are prominently identified and strategically distributed across the landscape. Arafat occupies the southeastern portion of the study area and represents one of the most significant pilgrimage destinations during Hajj. Mina is positioned in the western section, while Muzdalifah is centrally located between Mina and Arafat, creating a triangular arrangement of the three most important ritual sites. The broader Al Mashair district encompasses this entire sacred geography, with additional infrastructure elements visible including the Al Rajhi Mosque and various transportation networks that connect these holy locations and facilitate pilgrim movement during the mass gathering events.
The satellite imagery reveals diverse topographic and land use characteristics across the study region, providing important context for understanding pollution dynamics. The eastern portion, particularly around Arafat, displays more varied terrain with visible elevation changes and topographic complexity, while the western sections demonstrate more developed, urbanized characteristics with denser infrastructure. This spatial heterogeneity in land use patterns ranging from densely developed zones to more open areas is particularly relevant for analyzing pollution source distribution, emission patterns, and atmospheric dispersion processes during the Hajj season when millions of pilgrims converge in this relatively confined geographic area.

2.2. Datasets

2.2.1. Air Quality Dataset

The atmospheric composition data used in this study were sourced from a suite of Sentinel-5 Precursor (Sentinel-5P) satellite products provided by the European Space Agency under the Copernicus program, accessed via the Google Earth Engine platform. These datasets offer near real-time, high-resolution measurements of key trace gases and aerosol properties critical for air quality and atmospheric chemistry assessments. Specifically, data on tropospheric NO2 column number density, absorbing aerosol index (AAI) indicating UV-absorbing aerosols such as dust and smoke, CO column number density, SO2 column number density, and HCHO column number density were included. These datasets provide spatial resolutions ranging approximately from 1.1 km (NO2, SO2, CO, HCHO and AAI), as shown in Table 1. The temporal scope of the data encompassed two specific Hajj pilgrimage periods—26 June to 1 July 2023, and 14 to 19 June 2024—allowing focused analysis during these specific events.
The inclusion of these Sentinel-5P atmospheric composition data complements meteorological information from ERA5-Land reanalysis, enabling an integrated evaluation of both pollutant distributions and environmental conditions over the study region. These products have been widely employed in recent atmospheric science research to monitor air quality and atmospheric chemistry dynamics at regional to global scales. For example, ref. [19] employed Sentinel-5P NO2 data to analyze spatial and temporal patterns of nitrogen dioxide pollution in the Community of Madrid. Ref. [20] conducted a spatio-temporal analysis of NO2 in Jakarta by processing Sentinel-5P images. Ref. [21] analyzed NO2 and CO concentrations using Sentinel-5P TROPOMI imagery to characterize pollution levels over time. Ref. [22] documented observed changes in multiple trace gases (NO2, SO2, CO, HCHO) detected by Sentinel-5P during COVID-19 lockdowns.

2.2.2. Meteorological Dataset

Meteorological data utilized in this study were sourced from the ERA5-Land Hourly Reanalysis dataset accessed via the Google Earth Engine platform. This dataset provides high-resolution hourly land-surface meteorological variables, including 10-m wind components, 2-m air temperature, and 2-m dewpoint temperature, facilitating the derivation of wind speed, wind direction, and relative humidity, as Table 1. The temporal scope of the data encompassed specific Hajj pilgrimage period: 14 to 19 June 2024. The spatial resolution of approximately 11 km enabled detailed regional analysis over the study area. ERA5-Land’s comprehensive spatiotemporal coverage and physical consistency have made it a widely adopted dataset in atmospheric and environmental research, as demonstrated by studies such as [23,24], who highlighted its capabilities for land surface reanalysis and climate applications. Employing ERA5-Land data ensures robust meteorological characterization critical for assessing environmental conditions during the Hajj events.

2.3. Methods

2.3.1. Conversion of Satellite-Derived Pollutant Column Densities to Near-Surface Concentrations

Satellite-derived atmospheric composition products, such as those from Sentinel-5P TROPOMI, report pollutant amounts as total vertical column densities in mol m−2 (moles per square meter). These values represent the integrated quantity of a pollutant across the full atmospheric column and cannot be directly compared to air quality guideline values provided by the World Health Organization (WHO) or national standards, which are expressed as near-surface concentrations in μg m−3 (micrograms per cubic meter). Therefore, a conversion was required to approximate ground-level concentrations from the satellite column amounts.
The conversion was based on the ideal gas law and the known molecular weight ( M ) of each pollutant, under the assumption that the pollutant is uniformly mixed within a well-defined atmospheric mixing layer of height H (m). The general formula applied was:
C μ g / m 3 = C m o l m 2 × M × 10 6 H  
where:
  • C μ g / m 3   = estimated near-surface concentration (μg m−3)
  • C m o l / m 2 = satellite-retrieved column amount (mol m−2)
  • M = molecular weight of the pollutant (g mol−1)
  • 10 6 = conversion factor from grams to micrograms
  • H   = assumed mixing layer height (1000 m)
The molecular weights used were specific to each gas: NO2 (46.0055 g mol−1), CO (28.0101 g mol−1), SO2 (64.066 g mol−1), and HCHO (30.026 g mol−1). For the absorbing aerosol index (AAI), which is dimensionless, no mass conversion was performed.
Estimation of H was based on literature values and meteorological reanalysis data for the region, typically representing the planetary boundary layer height (PBLH) during the observation period. This approach, while a simplification, is commonly used in satellite–surface comparison studies, e.g., [25,26], and provides a first-order approximation of ground-level pollutant concentrations suitable for comparison with WHO and local ambient air quality standards. This was implemented using the Raster Calculator tool in ArcGIS Pro v3.4.

2.3.2. Spatial Resampling and Surface Interpolation of Air Quality Data

Given the original spatial resolution of the air quality data 1 km, all datasets were resampled to better represent the relatively small study area, which covers less than 120 km2. After exporting the data in GeoTIFF format, each file was georeferenced using the UTM Zone 37N projection (Datum: WGS 1984), and the spatial resolution was refined to 100 m to provide greater spatial detail. This process was uniformly applied to all air quality variables. Subsequently, each raster layer representing pollutant concentrations was converted into point features, resulting in a total of 133 data points distributed across the study area, as illustrated in Figure 2. To generate continuous surfaces for each of the five air quality variables, an Inverse Distance Weighting (IDW) interpolation method was used. The IDW tool was configured with a power parameter of 3 and included up to 20 neighboring points within the search radius for interpolation. This approach enabled the creation of spatially detailed concentration surfaces essential for further analysis.

2.3.3. Statistical and Correlation Analyses

To evaluate the relationships between atmospheric pollutants and meteorological variables, correlation matrices were generated separately for the periods before and during the Hajj season. This comparative approach enables the detection of changes in pollutant–pollutant and pollutant–meteorology interactions under substantially different emission and atmospheric regimes. The analysis focused on detecting significant shifts in correlation strength, reversals in correlation sign, and variations in the magnitude of associations, thereby providing quantitative insights into altered atmospheric processing and emission dynamics during large-scale mass gatherings.
Pearson Correlation Computation
The strength and direction of the linear relationship between each pair of variables were quantified using the Pearson product-moment correlation coefficient (r) [27]. For two variables, X and Y , the coefficient is computed as:
r = i = 1 n     ( X i X ) ( Y i Y ) i = 1 n     ( X i X ) 2 i = 1 n     ( Y i Y ) 2      
where:
  • X i and Y i are the individual observations,
  • X and Y are the sample means, and
  • n is the number of paired observations.
The coefficient r ranges from −1 to +1, where values close to ±1 indicate strong relationships (positive or negative), and values near 0 indicate weak or no linear association [28]. The value of r > 0 implies that as one variable increases, the other tends to increase, while r < 0 implies an inverse relationship [29].
For each variable pair, both r and its associated p-value were computed using the t-test for correlation significance, given by:
t = r n 2 1 r 2    
with n 2 degrees of freedom. This test evaluates the null hypothesis (H0: r = 0) that there is no linear correlation between the variables.
Significance Testing
The computed p-values were compared against a significance threshold of α = 0.05. Correlations with p < 0.05 were deemed statistically significant, indicating that the observed linear association is unlikely to have arisen from random sampling variation. This distinction between statistically significant and non-significant correlations is crucial for interpreting which relationships are robust and reproducible under the studied environmental conditions [30,31].
By combining the Pearson correlation coefficient equation with hypothesis testing through p-values, this analytical approach not only quantifies the intensity and direction of variable relationships but also assesses the reliability of these associations, thereby ensuring that the interpretations are grounded in statistically validated evidence [32].

3. Results and Discussion

3.1. Temporal and Spatial Analysis of Air Quality Before and During Hajj Season

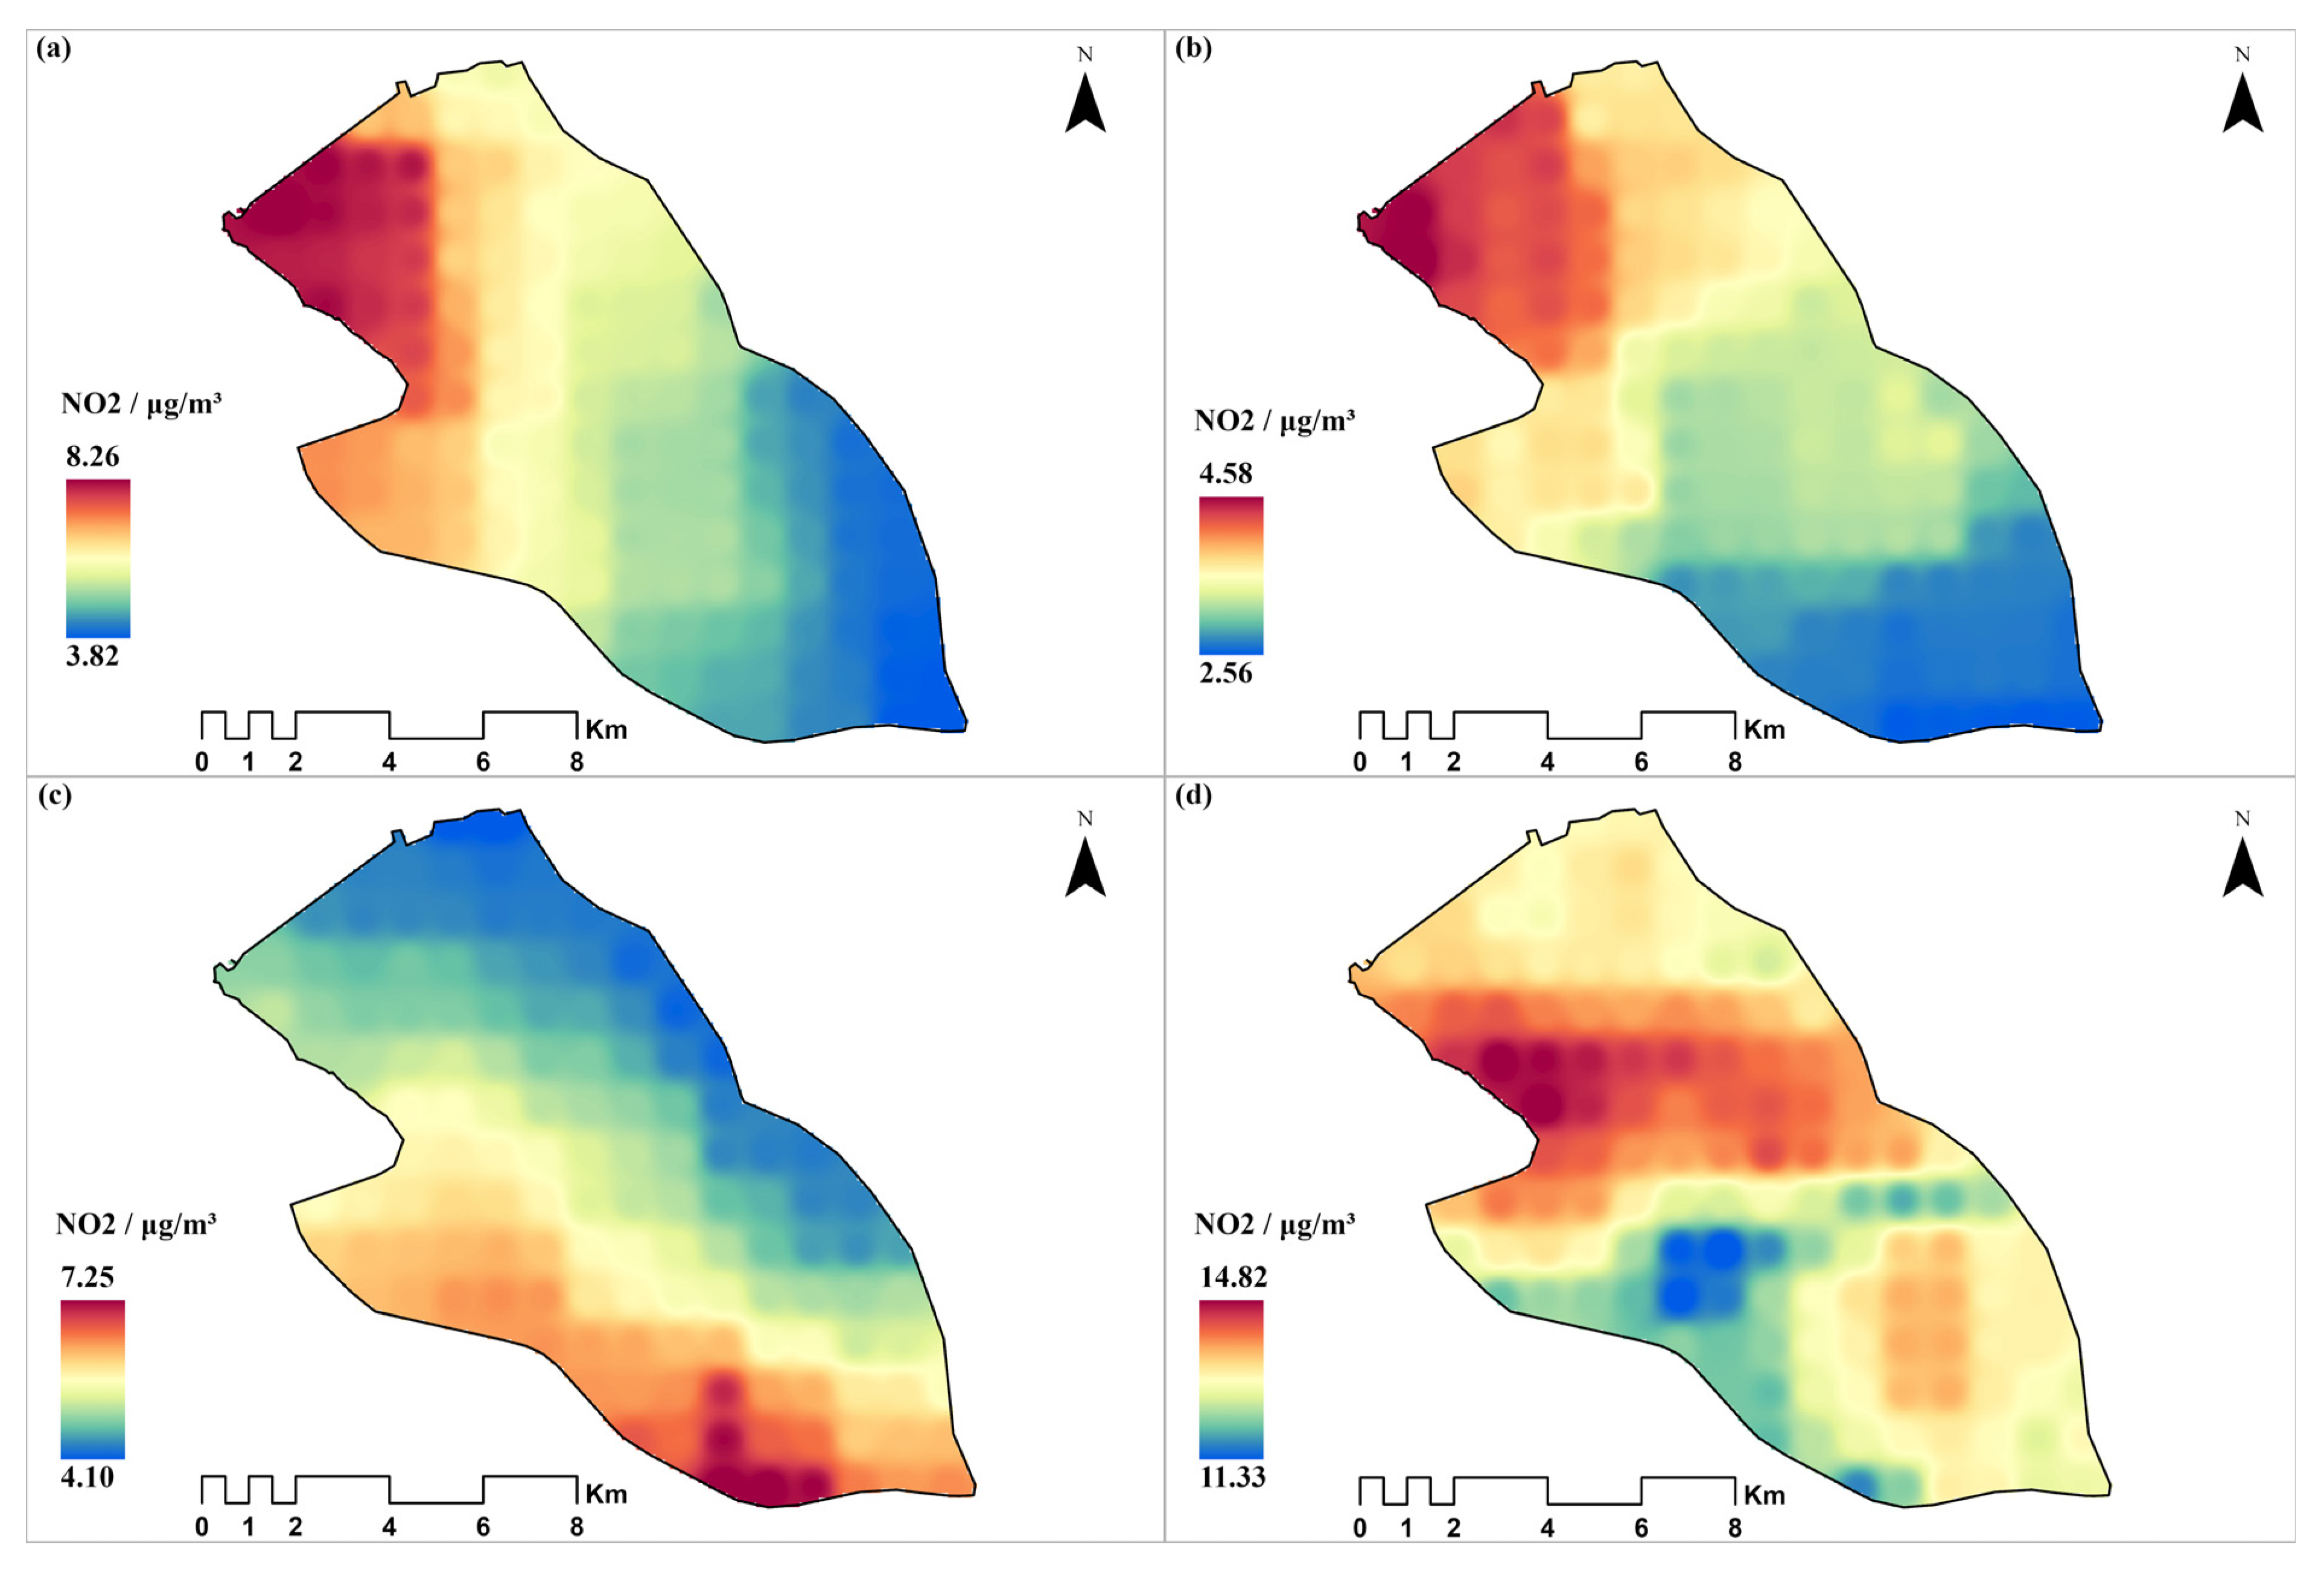
The spatial and temporal distribution of NO2 concentrations across Makkah’s holy sites during the Hajj pilgrimage shows distinctive patterns and fluctuations that have been well documented in the scientific literature [5,33,34]. Studies consistently report elevated NO2 levels linked to increased vehicular traffic and intense human activities during the Hajj season [35]. For instance, in 2023 prior to Hajj, as Figure 3, NO2 concentrations peaked at 8.26 μg/m3 in northwestern areas like Mina, tapering off toward southeastern locations such as Arafat with levels around 3.82 μg/m3, mirroring spatial pollution gradients seen in similar investigations [36]. Although 2024 saw generally lower pre-Hajj NO2 levels, the spatial pattern of higher concentrations in densely trafficked zones persisted.
During the Hajj itself, NO2 concentrations change dynamically both in level and location. In 2023, the highest concentrations shifted toward southern and southwestern sacred sites like Al Mashair, indicating intensified emissions from concentrated pilgrimage-related activities and traffic [2]. The 2024 Hajj experienced a sharper increase, with NO2 reaching 14.82 μg/m3, particularly in central and northwestern sites such as Mina and Muzdalifa, corresponding to known pollution hotspots during pilgrimage events [37]. Consistently, southeastern areas like Arafat recorded the lowest levels, likely due to fewer emissions and lower population density [38].
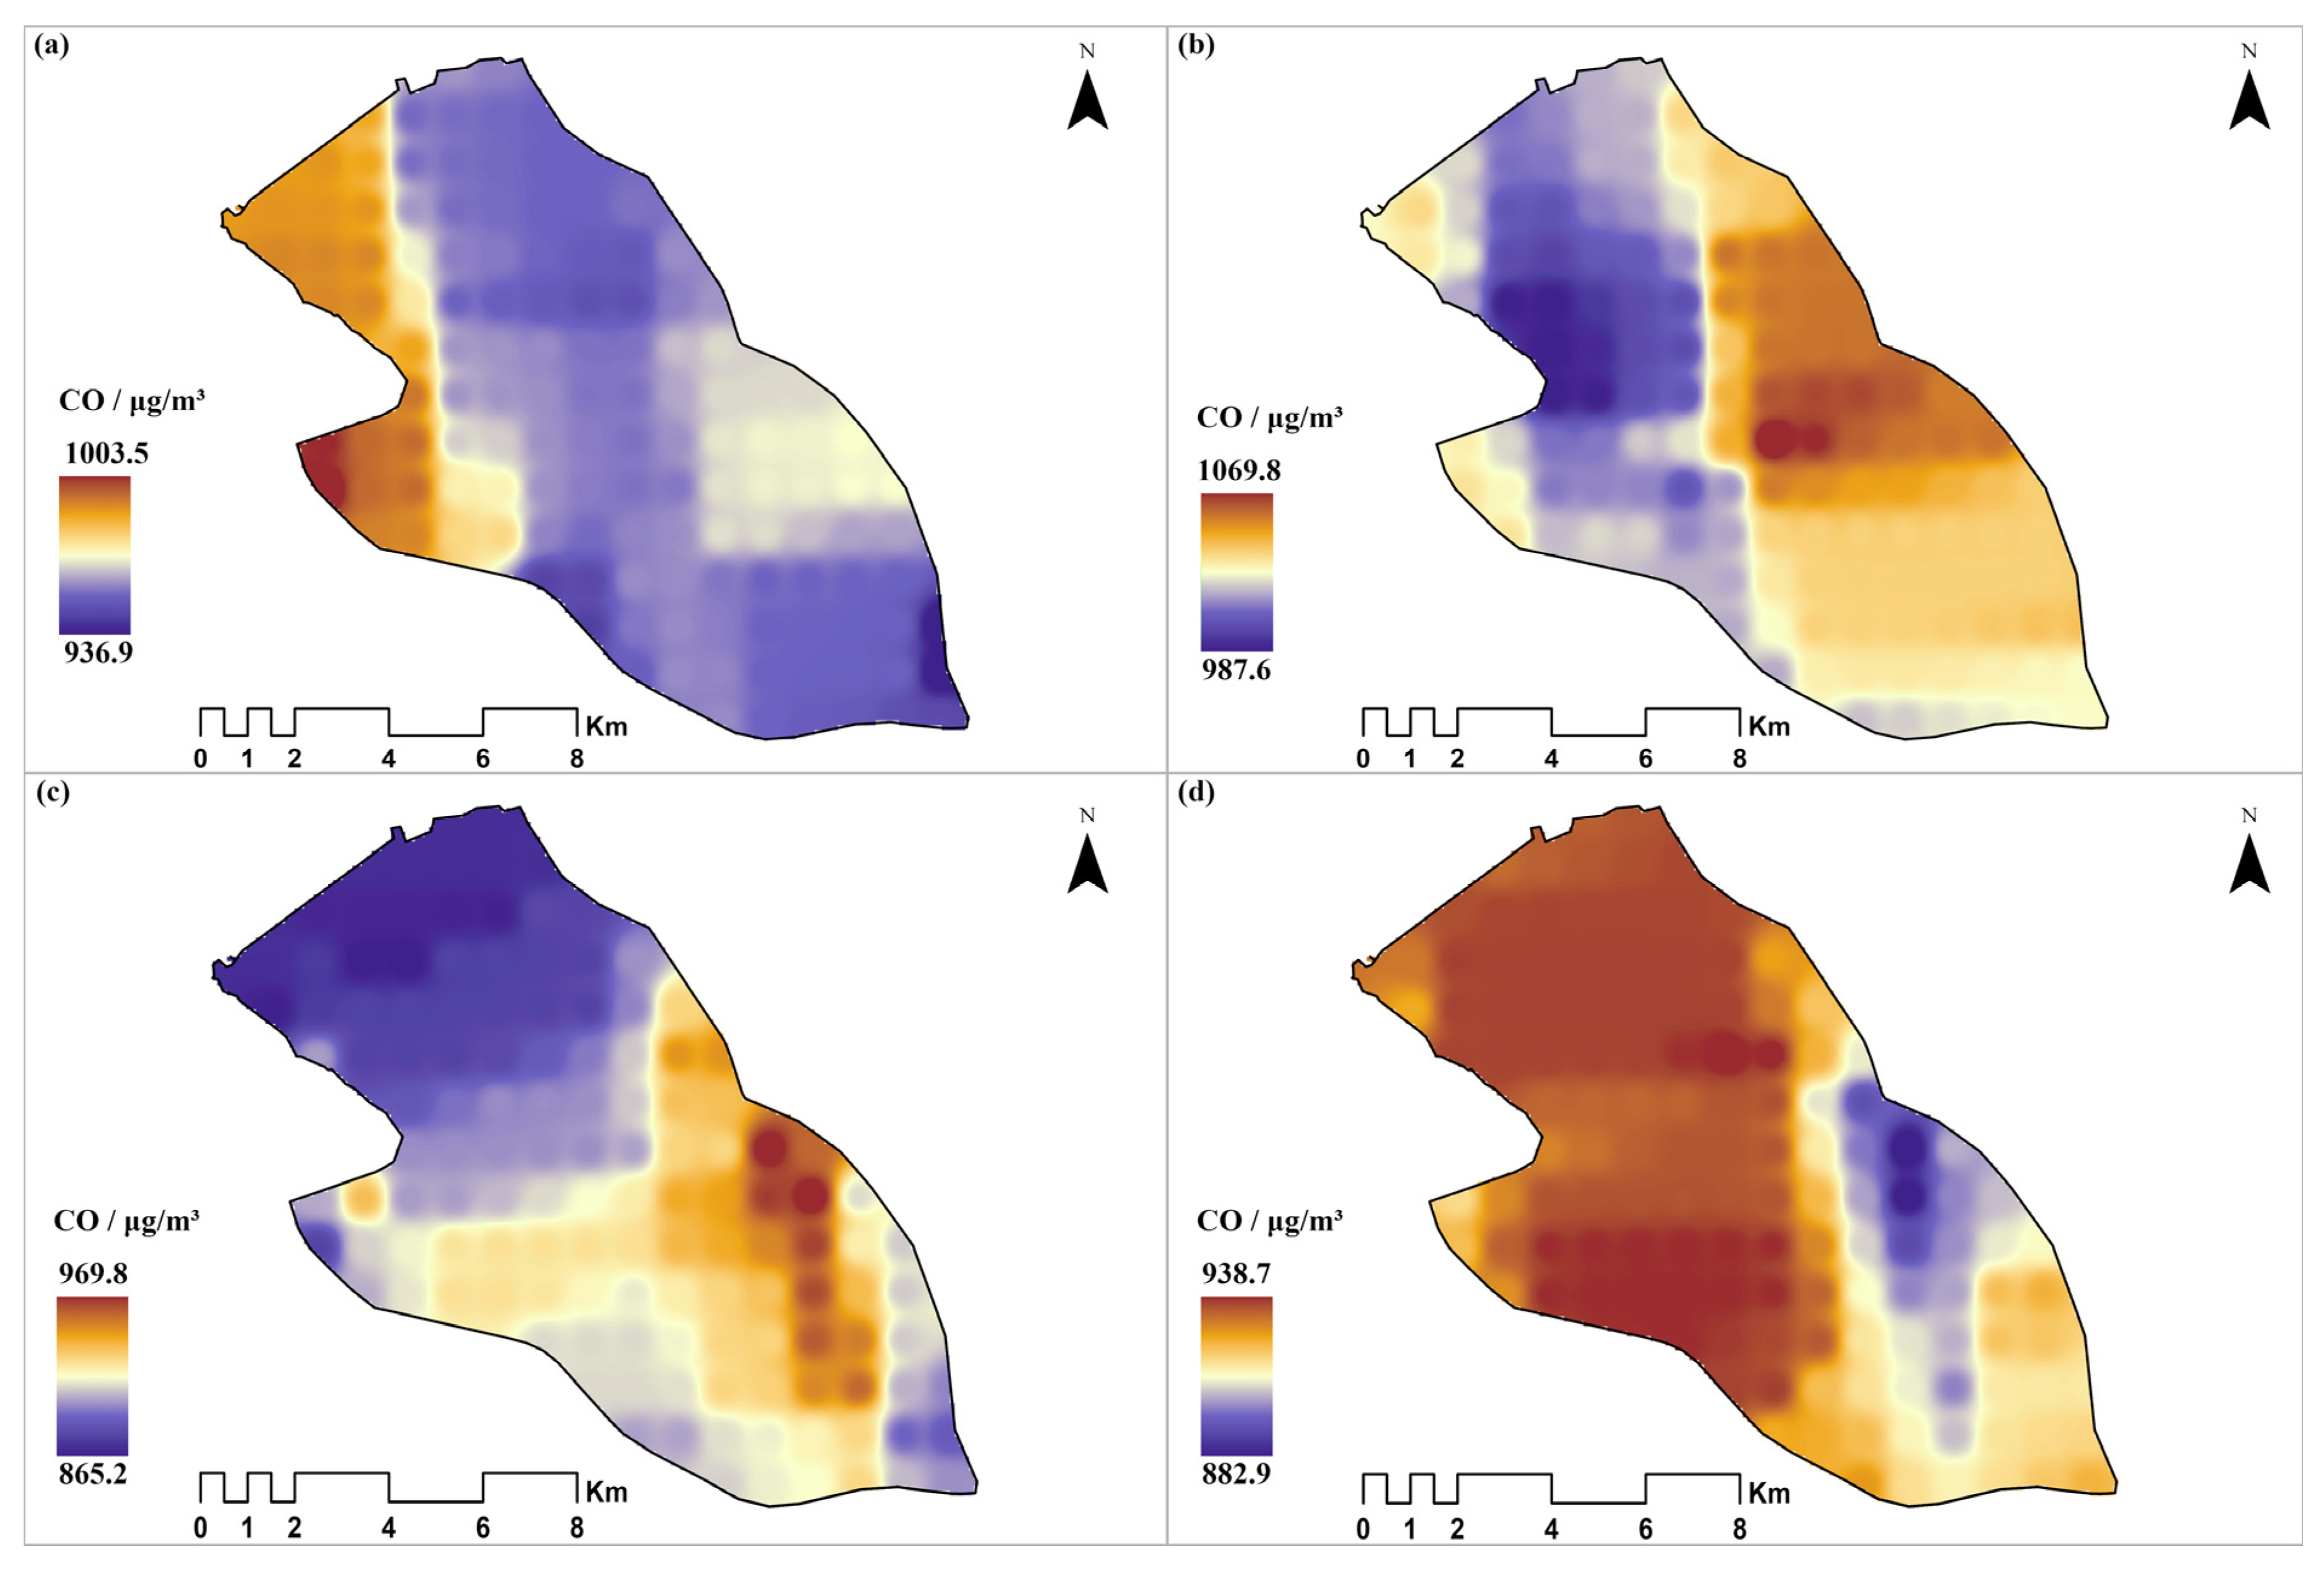
Figure 4 illustrates the distribution of CO concentrations (µg/m3) over the principal holy sites in Makkah before and during the Hajj for the years 2023 and 2024. Panels (a) and (b) show CO levels prior to the Hajj in 2023 and 2024, respectively, while panels (c) and (d) capture concentrations during the pilgrimage in the same years. This spatiotemporal mapping highlights how crowd densities, transportation flows, and ritual activities during Hajj impact air pollution across these religious sites, with documented studies showing that air pollution levels in Makkah surge significantly during the Hajj season due to the influx of millions of pilgrims and increased vehicular activity [14]. Research has consistently demonstrated that vehicular emissions are a major source of air pollution in Makkah, with both light-duty and heavy-duty vehicles contributing to elevated pollutant concentrations during peak pilgrimage seasons [39].
Prior to the Hajj in 2023, panel (a) reveals higher CO concentrations in the western and northwestern parts of the study area, prominently affecting regions such as Mina, with values reaching up to 1003.5 µg/m3. Concentrations decline south-eastward, with the lowest values (approximately 936.9 µg/m3) appearing near Arafat. Studies have documented that CO levels in Makkah exhibit pronounced spatial variations linked to traffic congestion and vehicular exhaust emissions, with concentrations averaging significantly higher in urban areas of Makkah during pilgrimage periods [5]. In the pre-Hajj period of 2024 (panel b), a distinct shift is observed: the highest CO concentrations move toward the northeast and eastern sectors, including Muzdalifa and portions of Mina, with maxima of 1069.8 µg/m3, while the northwest exhibits comparatively lower levels.
The onset of the Hajj period leads to pronounced changes in CO distribution. During the 2023 Hajj (panel c), the spatial pattern shifts yet again, with peak concentrations emerging in central and southern areas such as Al Mashair, reaching up to 969.8 µg/m3. These central hotspots likely correspond to the highest densities of pilgrims, ritual activity, and vehicle flow, which aligns with research showing that CO concentrations increase substantially during Hajj due to heavy traffic and slow-moving vehicles, particularly along the pilgrimage route between holy sites [40]. Studies have documented that the most polluted air samples during Hajj occur at key transportation nodes and bridges connecting the holy sites, where millions of pilgrims create traffic bottlenecks [41]. In contrast, during the 2024 Hajj (panel d), CO concentrations increase substantially across most sites, with a maximum recorded value of 938.7 µg/m3 and widespread elevations, especially in Mina, Muzdalifa, and central Al Mashair, while the southeastern sites (notably Arafat) maintain the lowest concentrations. Research indicates that air quality in Makkah is highly affected by Hajj activities compared to other periods, with CO concentrations showing clear temporal variations before, during, and after the pilgrimage due to changes in traffic patterns and human [42].
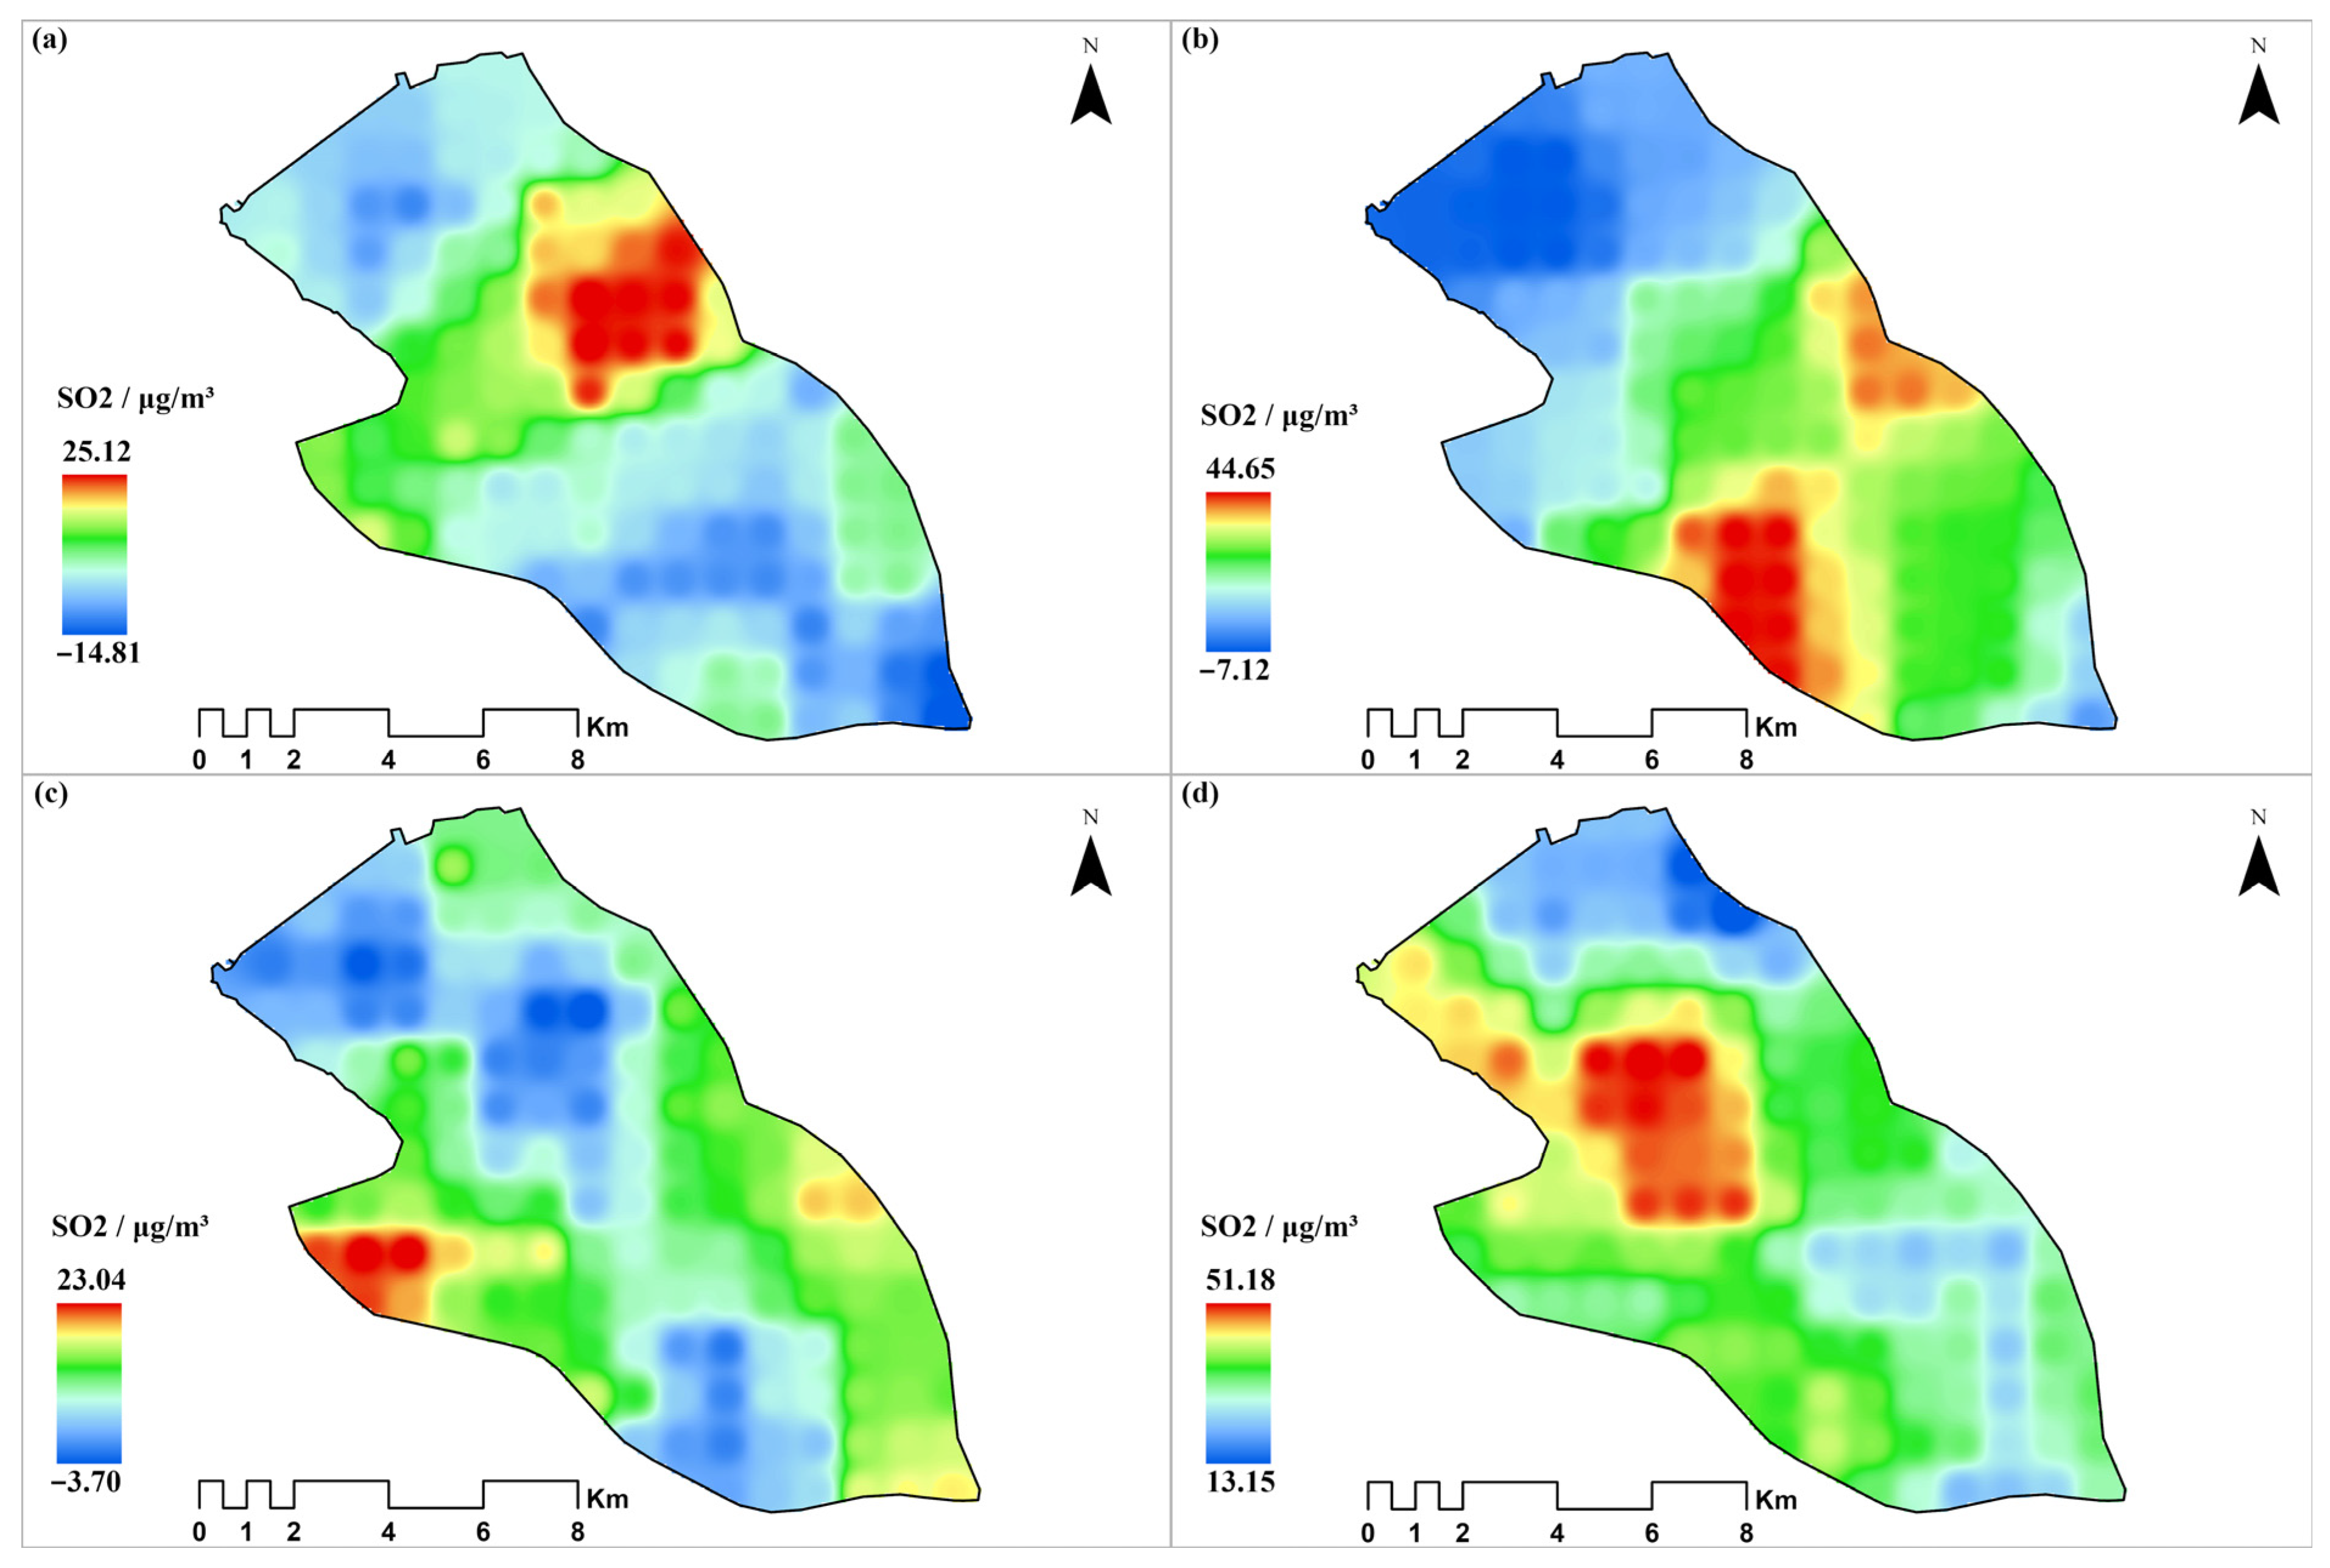
Figure 5 presents the spatial and temporal variation in SO2 concentrations in micrograms per cubic meter (μg/m3) across Makkah’s key holy sites before and during the Hajj pilgrimage for 2023 and 2024. Panels (a) and (b) display SO2 levels prior to the Hajj in the two consecutive years, while panels (c) and (d) show the spatial distributions during the pilgrimage. Research has documented that sulfur dioxide concentrations in Makkah show significant temporal and spatial variations linked to industrial emissions, vehicular traffic, and meteorological conditions during pilgrimage periods [43].
Before the Hajj season in 2023 (panel a), SO2 concentrations peaked centrally, affecting especially the area bordering Mina and Muzdalifa. The highest values reached up to 25.12 μg/m3, while the southeast, encompassing Arafat, recorded the lowest concentrations as low as −14.81 μg/m3, indicative of either measurement limits or negligible background levels. In 2024, pre-Hajj conditions (panel b) revealed a distinct hotspot of SO2 in the south and southwestern districts, and extending into the southern regions of Muzdalifa, with maxima up to 44.65 μg/m3. Northern and eastern zones, including Arafat, maintained lower SO2 concentrations, consistent with documented patterns showing that SO2 distribution varies significantly across different districts of Makkah based on emission sources and topographical factors [44].
During the Hajj in 2023 (panel c), elevated SO2 shifted toward the western sector particularly affecting Mina and adjacent parts of Al Mashair, where concentrations approached 23.04 μg/m3. Eastern and southeastern regions, notably Arafat, continued to register the lowest SO2 values. Research indicates that SO2 concentrations during Hajj are influenced by increased generator usage, vehicular emissions, and concentrated human activities around the holy sites [45]. The Hajj period of 2024 (panel d) saw a further amplification of SO2, with the most pronounced hotspots emerging again in the central and west-central zones, notably Mina, Muzdalifa, where concentrations peaked at 51.18 μg/m3. Despite this, Arafat and southeastern portions continued to experience comparatively diminished SO2 presence, reflecting the documented pattern that air pollutant concentrations vary significantly across Makkah’s holy sites during pilgrimage periods due to differences in emission sources, crowd density, and local meteorological conditions [46].
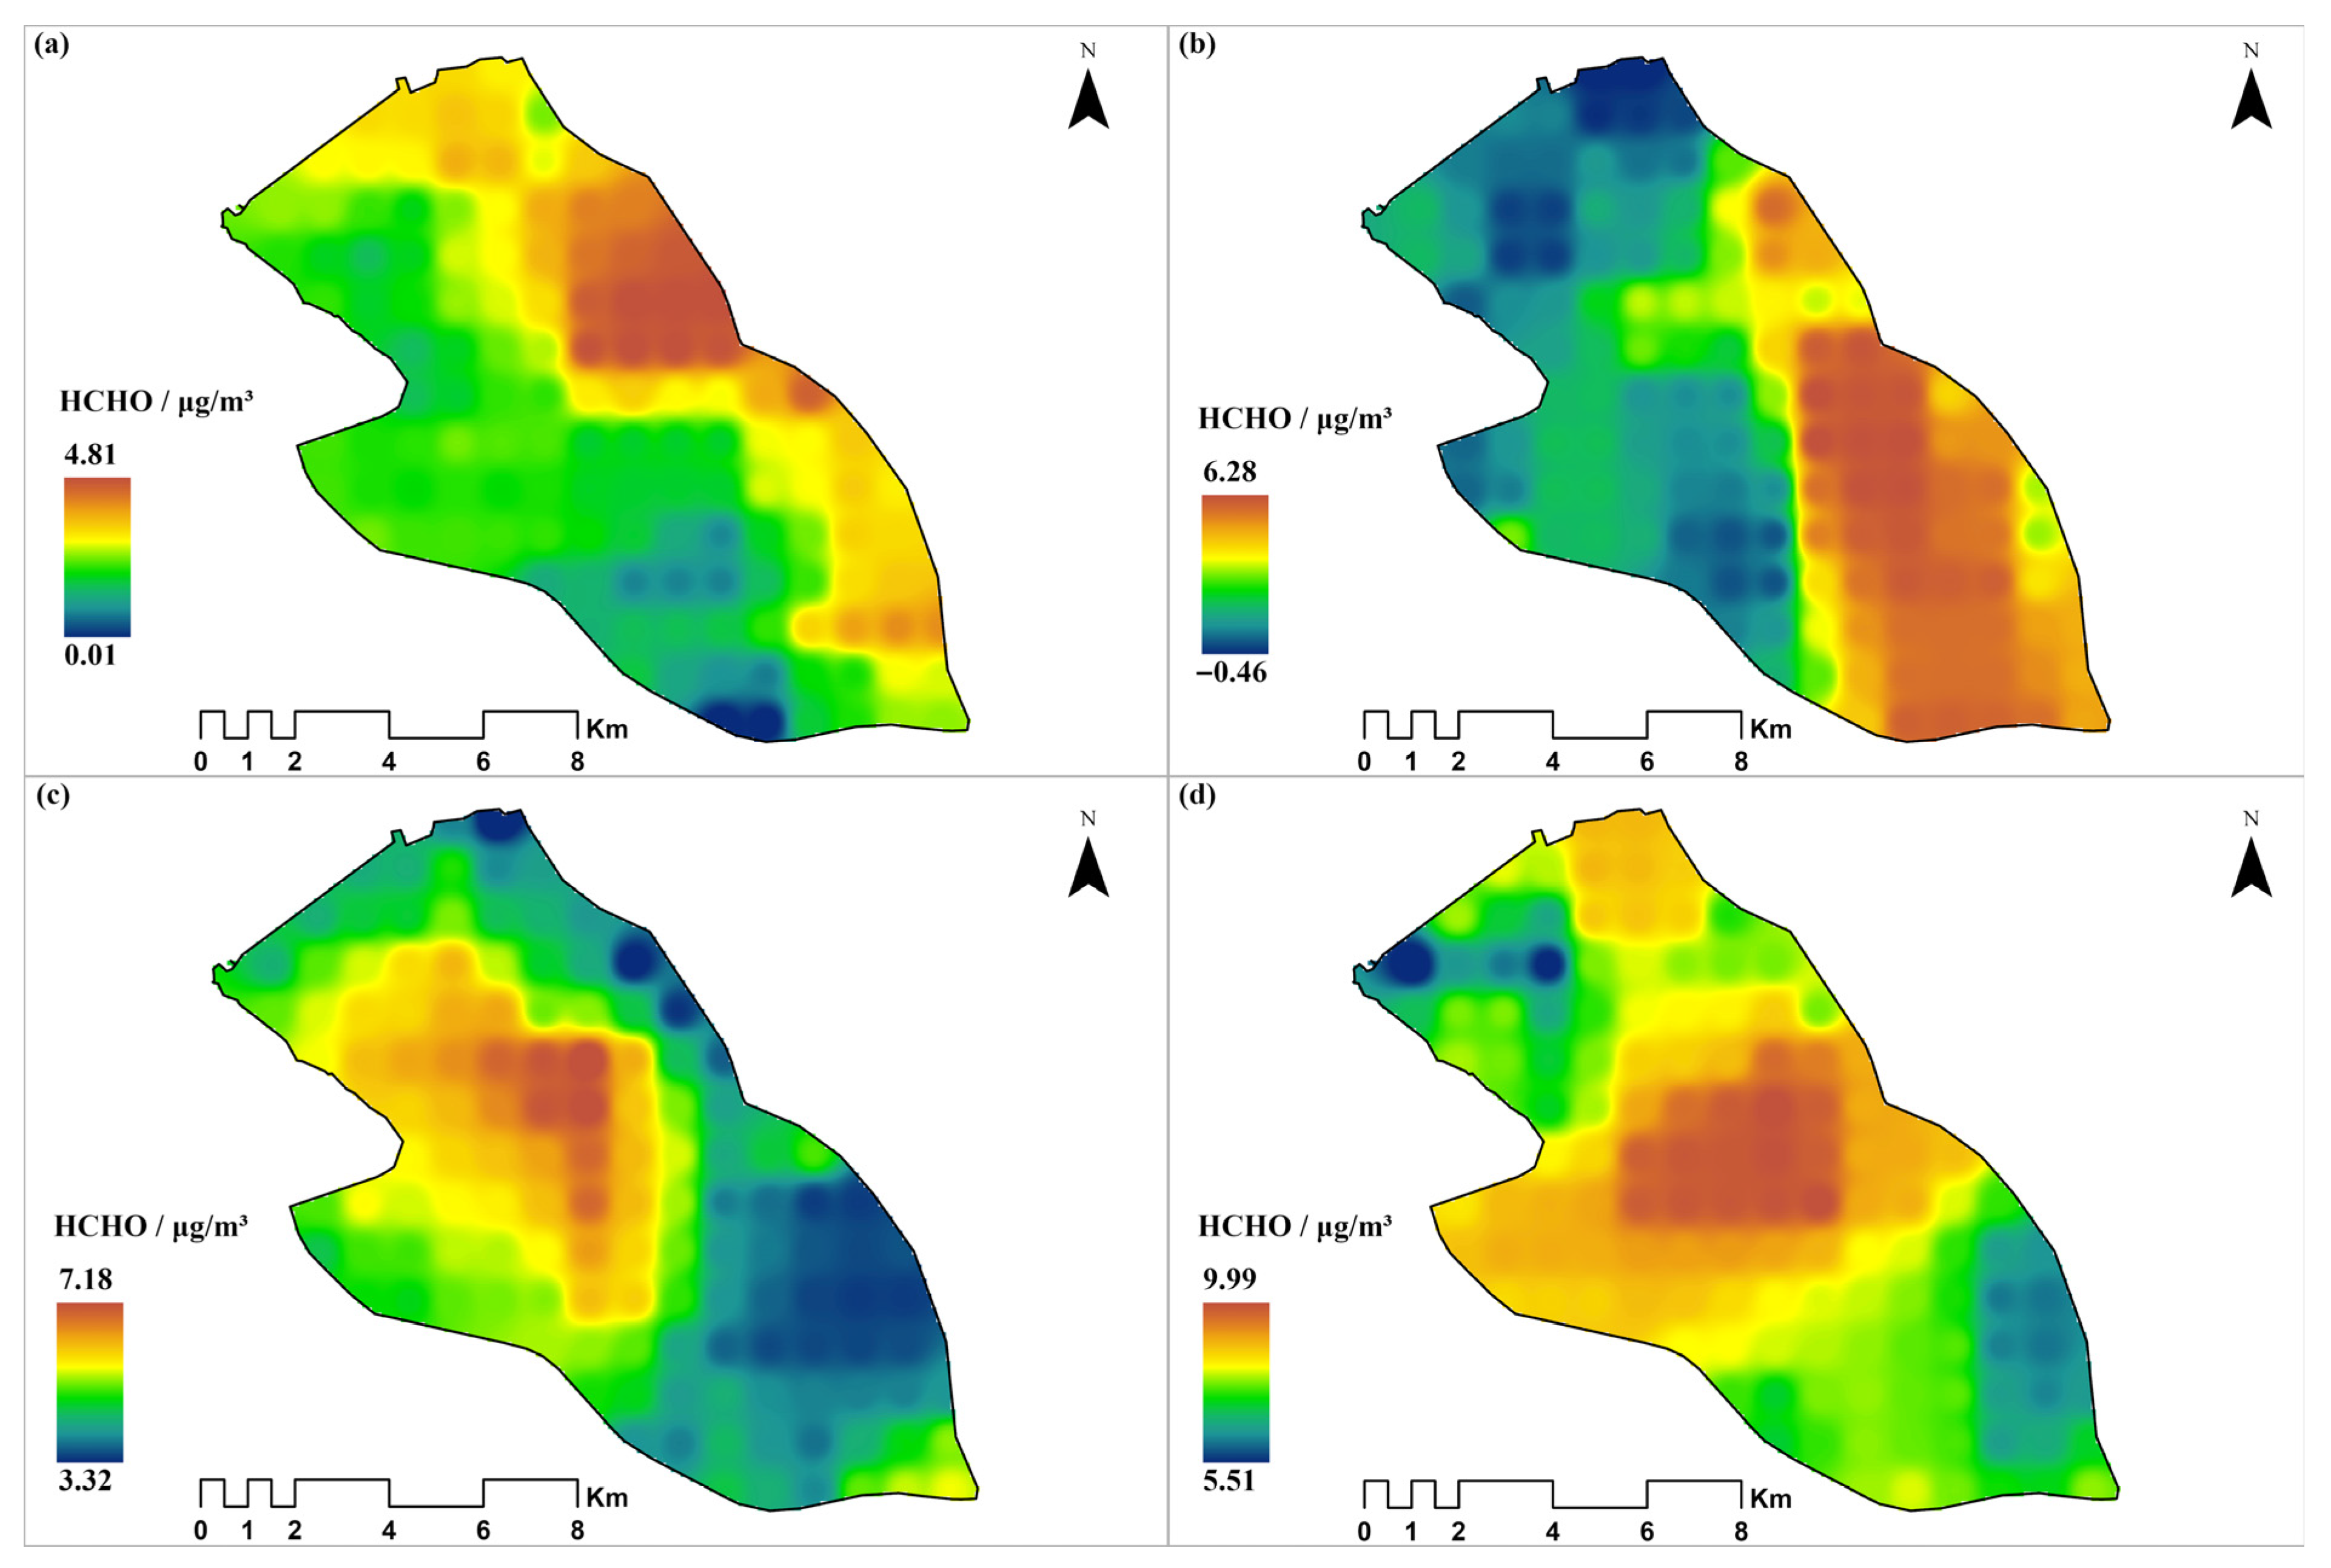
Figure 6 illustrates the distribution of HCHO concentrations (μg/m3) in the holy sites for pre-Hajj (panels a and b, representing 2023 and 2024) and Hajj periods (panels c and d, representing 2023 and 2024). HCHO is a critical pollutant in urban and crowded environments, stemming from mobile emissions, combustive activities, and secondary atmospheric formation—a recurring concern during mass gatherings such as the Hajj. Research has documented that formaldehyde concentrations are significantly influenced by vehicular emissions and photochemical processes, with levels varying substantially during periods of increased traffic and human activity [47].
Before the Hajj in 2023 (panel a), the highest HCHO concentrations were observed primarily in the northeastern part of the study area, notably encompassing Al Khadra and sections of Mina, with maximum values reaching 4.81 μg/m3. A gradient of declining concentrations extended south-westward, with Arafat and Shadad displaying the lowest values, falling near 0.01 μg/m3. Studies have shown that formaldehyde concentrations in Makkah exhibit spatial variations linked to traffic density and combustion activities, with higher levels typically observed in areas with greater vehicular emissions [7]. For the pre-Hajj period in 2024 (panel b), the spatial distribution shifted, with the highest concentrations (up to 6.28 μg/m3) apparent in the eastern sector—specifically in Muzdalifa and the southeastern extent of Mina—while the northwest displayed reduced levels, and minimum values (down to −0.46 μg/m3) were recorded in the northern area.
During the Hajj period of 2023 (panel c), HCHO concentrations increased in magnitude and the central zone—especially Al Mashair and the surrounding area—emerged as new hotspots, registering values up to 7.18 μg/m3. Lower levels persisted in the southeast, including Arafat and Shadad. Research indicates that formaldehyde levels increase significantly during mass gathering events due to enhanced vehicular emissions, generator usage, and increased combustion activities associated with the influx of pilgrims [48]. In 2024 (panel d), the Hajj saw further amplification of HCHO concentrations, now peaking at 9.99 μg/m3 across the central and northwestern holy sites, including Mina and Al Khadra, with minimum values consistently located in Arafat.
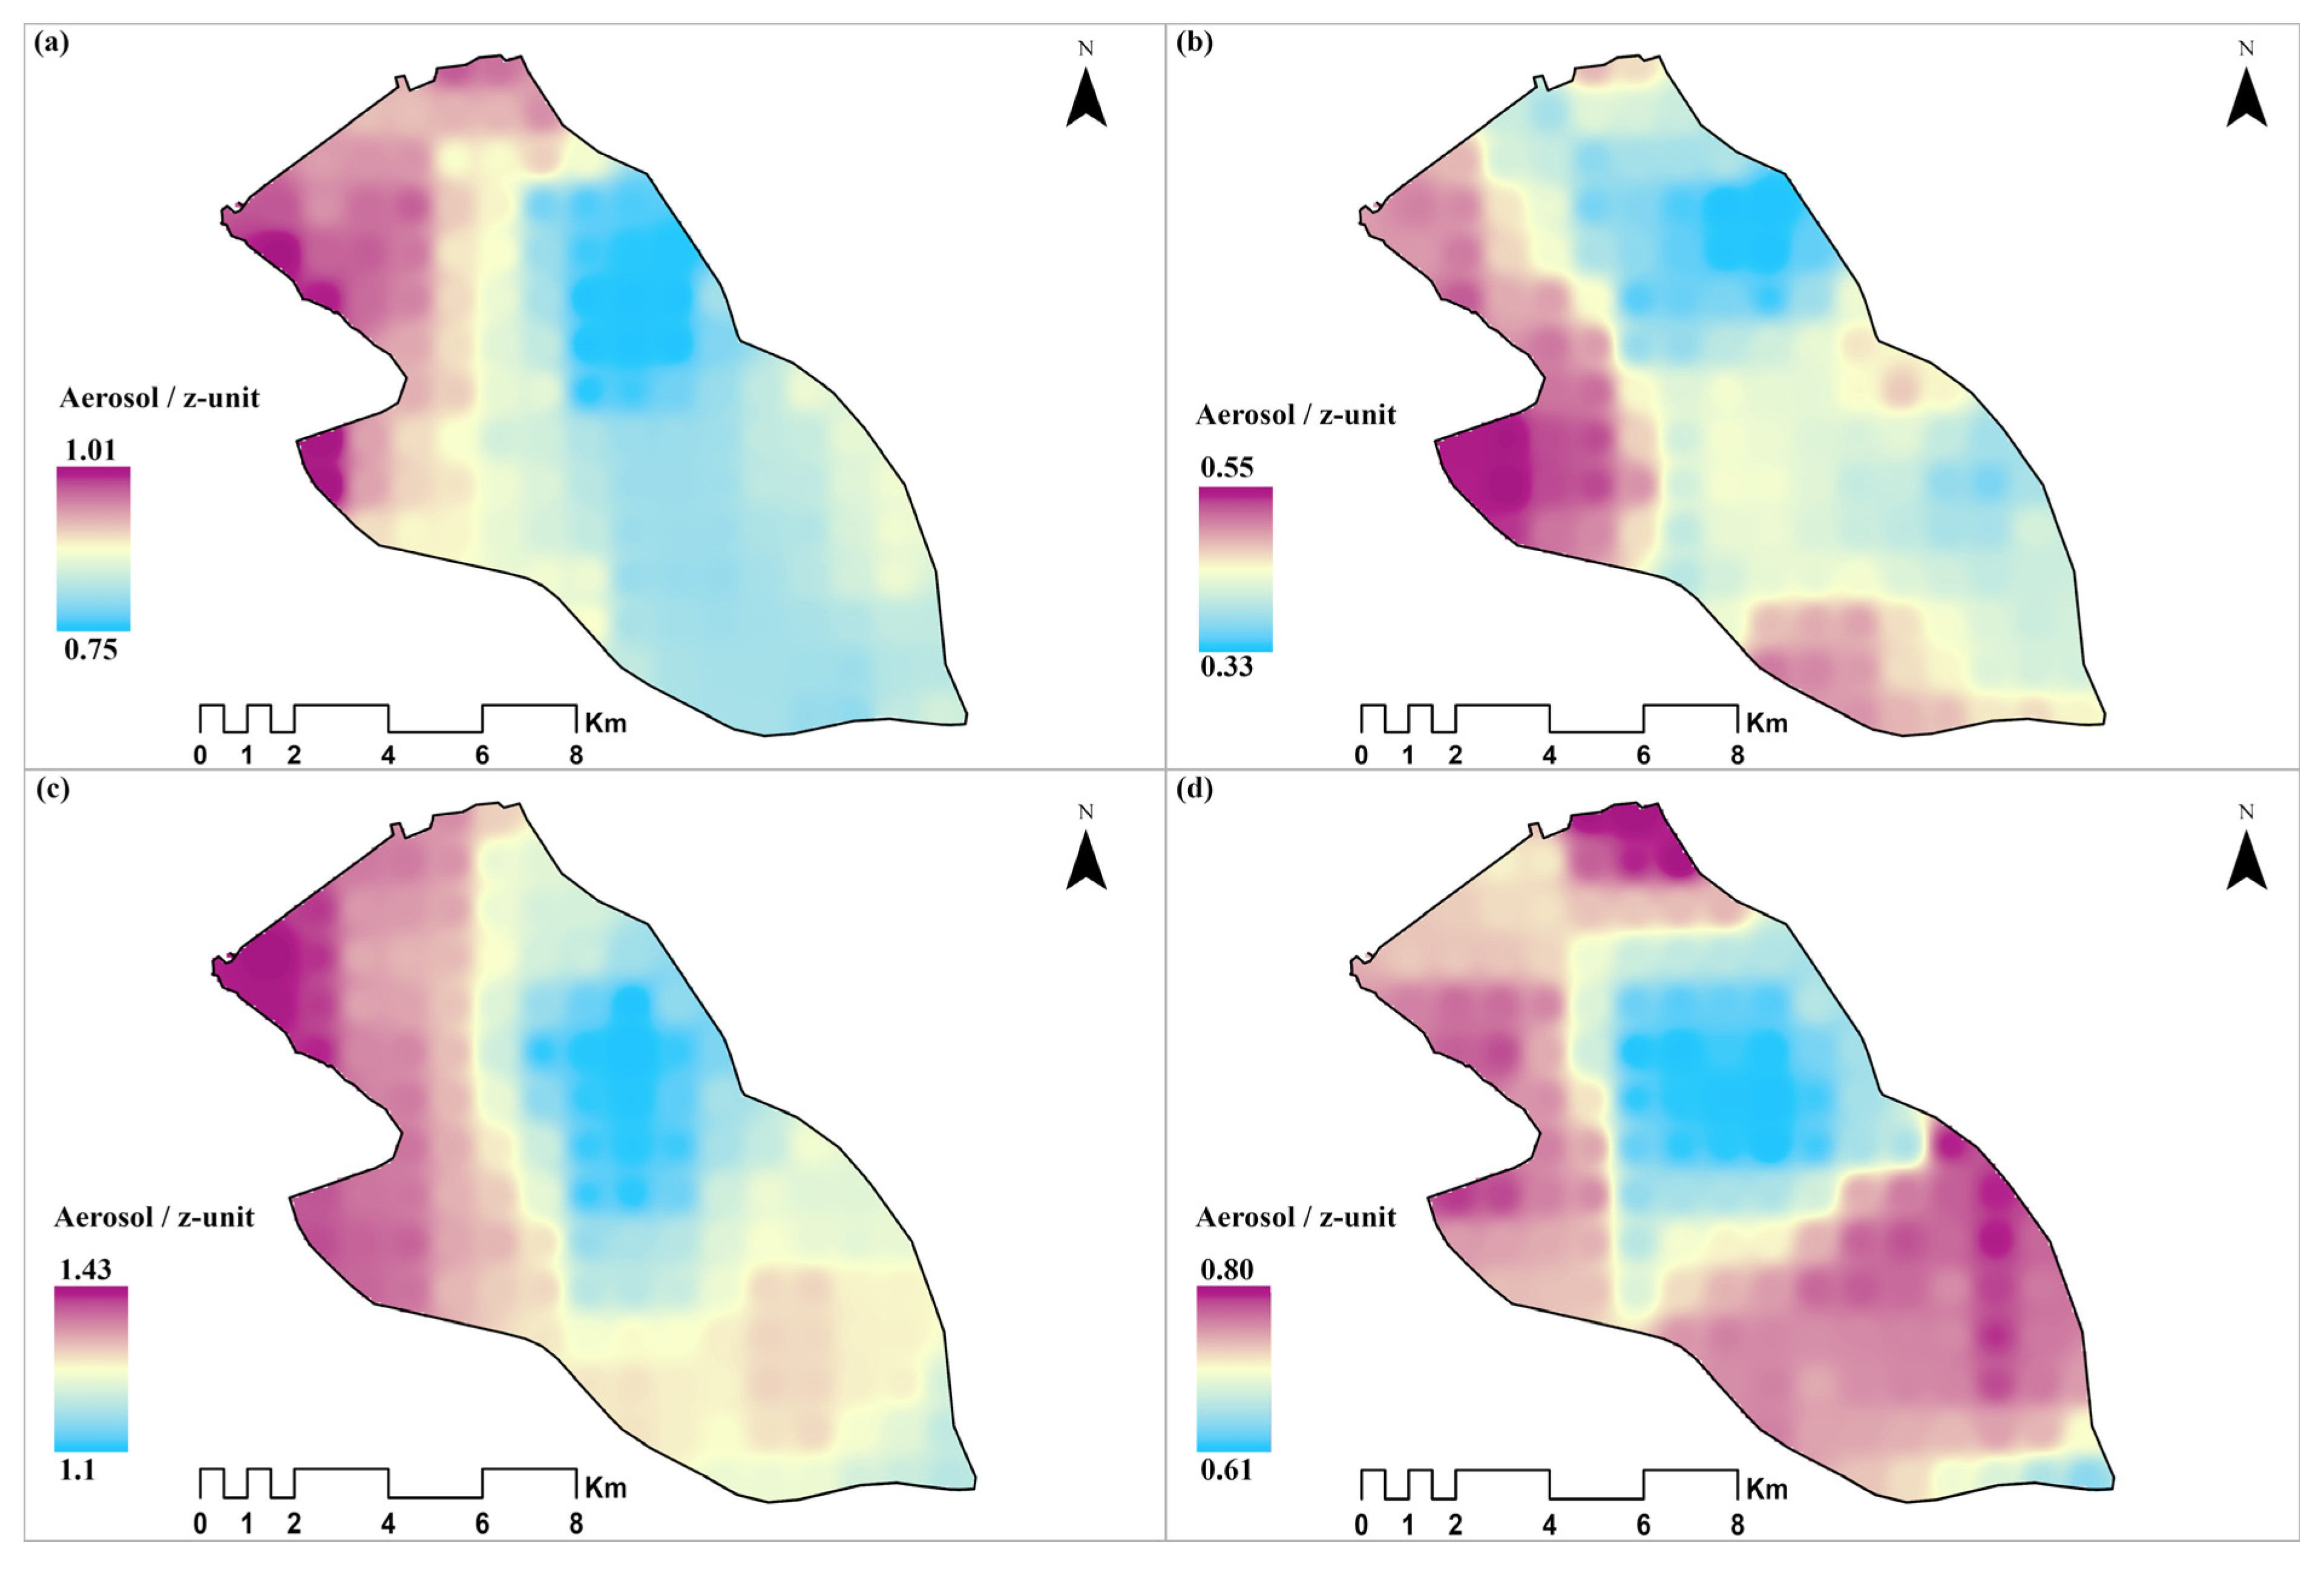
Figure 7 presents the distribution of aerosol concentrations expressed, in line with satellite aerosol indices over the holy sites for both pre-Hajj (panels a and b, corresponding to 2023 and 2024) and Hajj periods (panels c and d, for 2023 and 2024). Aerosol index values, while not a direct measure of mass concentration, provide critical insight into the spatial and temporal dynamics of particulate pollution, which is a well-documented concern during Hajj due to escalated human activities and traffic density [49].
Prior to the Hajj in 2023 (panel a), higher aerosol index values are evident in the northwestern parts of the study area, particularly over Mina and parts of Al Khadra, with values peaking at 1.01. The lowest values, about 0.75, are recorded south-eastward in Arafat. This spatial pattern aligns with documented findings that show particulate matter concentrations vary significantly across different districts of Makkah, with higher concentrations typically observed in areas with greater traffic density and human activity [50]. In 2024 (panel b), the pattern remains consistent, with maxima in the northwest—again over Mina—but the overall range narrows to 0.33–0.55, indicating a possible reduction in baseline particulate levels, consistent with documented improvements in air quality management during recent Hajj seasons.
During the Hajj periods, spatial gradients in aerosols shift noticeably. In 2023 (panel c), the highest aerosol index values up to 1.43 intensify over northwestern sites and central sectors, such as Mina and Al Mashair, signifying a strong impact of crowd influx and related emissions. By contrast, Arafat maintained the lowest readings down to 1.1. The air quality in Makkah is highly affected by Hajj activities, with pronounced increases in particulate matter concentrations during peak pilgrimage periods due to vehicular emissions and concentrated human activities. The 2024 Hajj (panel d) further amplifies these trends: maximum aerosol index values up to 0.80 become more pronounced in Mina and Al Mashair, while the lowest levels around 0.61 persist in the southeast, notably in Arafat.
When compared to WHO air quality guidelines—which stipulate an annual mean NO2 concentration not exceeding 10 μg/m3 and a 24-h mean limit of 25 μg/m3—the data indicate that pre-Hajj NO2 levels across the holy sites were within safe limits in both 2023 and 2024. However, during the 2024 Hajj, substantial areas including Mina, Muzdalifa and Al Mashair exceeded the annual mean threshold, with concentrations reaching well above 11 μg/m3 and a peak of 14.82 μg/m3. Although these values did not surpass the acute 24-h guideline, their episodic elevation above the annual recommended value is significant, especially considering the vulnerability of pilgrims and residents during periods of high crowd density. NO2 concentrations during Hajj periods can exceed WHO guidelines in certain areas of Makkah, with elevated levels particularly observed in high-traffic zones and areas of intense pilgrimage activity [51].
Comparison with international air quality standards and previous literature reveals the public health significance of these findings. The World Health Organization (WHO) recommends a 24-h mean CO limit of 4 mg/m3 (4000 µg/m3), indicating that the CO values reported in Figure 3 are within global health guidelines for short-term exposure. However, the evident surges in CO during Hajj correspond with peak pilgrimage densities and are driven primarily by traffic congestion, bus fleets, and increased fuel use in and around sites such as Mina, Muzdalifa, and central Mashair. CO concentrations in Makkah increase substantially during the Hajj season due to heavy vehicular traffic and slow-moving vehicles along pilgrimage routes, though levels typically remain below WHO acute exposure guidelines [52]. Similar studies emphasize that mass gatherings like Hajj can raise local pollutant levels—particularly CO, NO2, and particulate matter—via vehicle emissions and energy consumption, with transient spikes on ritual days [53].
When benchmarked against WHO 24-h SO2 guideline of 40 μg/m3, pre-Hajj SO2 concentrations in both 2023 and most of 2024 remained within recommended exposure limits across the majority of sites. However, the Hajj period of 2024 was notable for extensive exceedances, especially in the central and western holy sites, with peak levels surpassing the WHO guideline. Such short-term surges, even if brief, are epidemiologically significant: SO2 exposure is associated with increased risks of respiratory symptoms, exacerbations of asthma, and cardio-respiratory morbidity—particularly among sensitive groups, including the elderly, children, and individuals with pre-existing respiratory conditions. SO2 concentrations in Makkah can exceed international guidelines during peak Hajj periods, with elevated levels posing health risks to vulnerable populations including pilgrims with pre-existing respiratory conditions [54].
Unlike for NO2, SO2, and CO, the WHO has not specified a short- or long-term ambient guideline for formaldehyde, although health authorities recognize adverse effects at urban background levels below 10 μg/m3. The peak HCHO concentrations observed in the 2024 Hajj—nearly 10 μg/m3 in central pilgrimage sites—approach or exceed reference levels used in public health advisories, highlighting episodic but meaningful exposure that could impact sensitive populations and those with pre-existing respiratory issues. Research has shown that volatile organic compounds, including formaldehyde, can reach elevated concentrations during mass gathering events due to increased vehicular emissions and combustion activities [55].
These spatially and temporally resolved data underscore the pronounced elevation in HCHO concentrations linked to crowding, transportation flows, and ritual activities, particularly in Mina, Al Mashair, and Al Khadra during the Hajj. Sustained lower values in Arafat point to either lower emission densities or more effective atmospheric dispersion in those sectors. Such patterns are mirrored in previous studies of volatile organic compounds (VOCs) during large-scale gatherings, which pinpoint traffic management and the use of clean energy as key interventions for mitigating HCHO. Air pollutant concentrations, including VOCs, show significant spatial variations across Makkah’s holy sites, with concentrations generally higher in areas of greatest pilgrim density and vehicular activity [56].
While the aerosol index is not directly equivalent to gravimetric PM2.5 measurements, higher values are indicative of greater particulate loading and, by extension, increased potential for adverse respiratory and cardiovascular outcomes among susceptible populations. The peaks observed during the Hajj, particularly in 2023 and 2024, coincide with periods of intense crowding and ritual practices, representing temporary but significant public health challenges, demonstrated that particulate matter concentrations during Hajj can pose health risks to pilgrims, particularly those with cardiovascular and respiratory conditions, with elevated PM levels associated with increased hospital admissions and respiratory symptoms [57].

3.2. Inter-Annual Variability in Air Quality Correlations Before and During Hajj

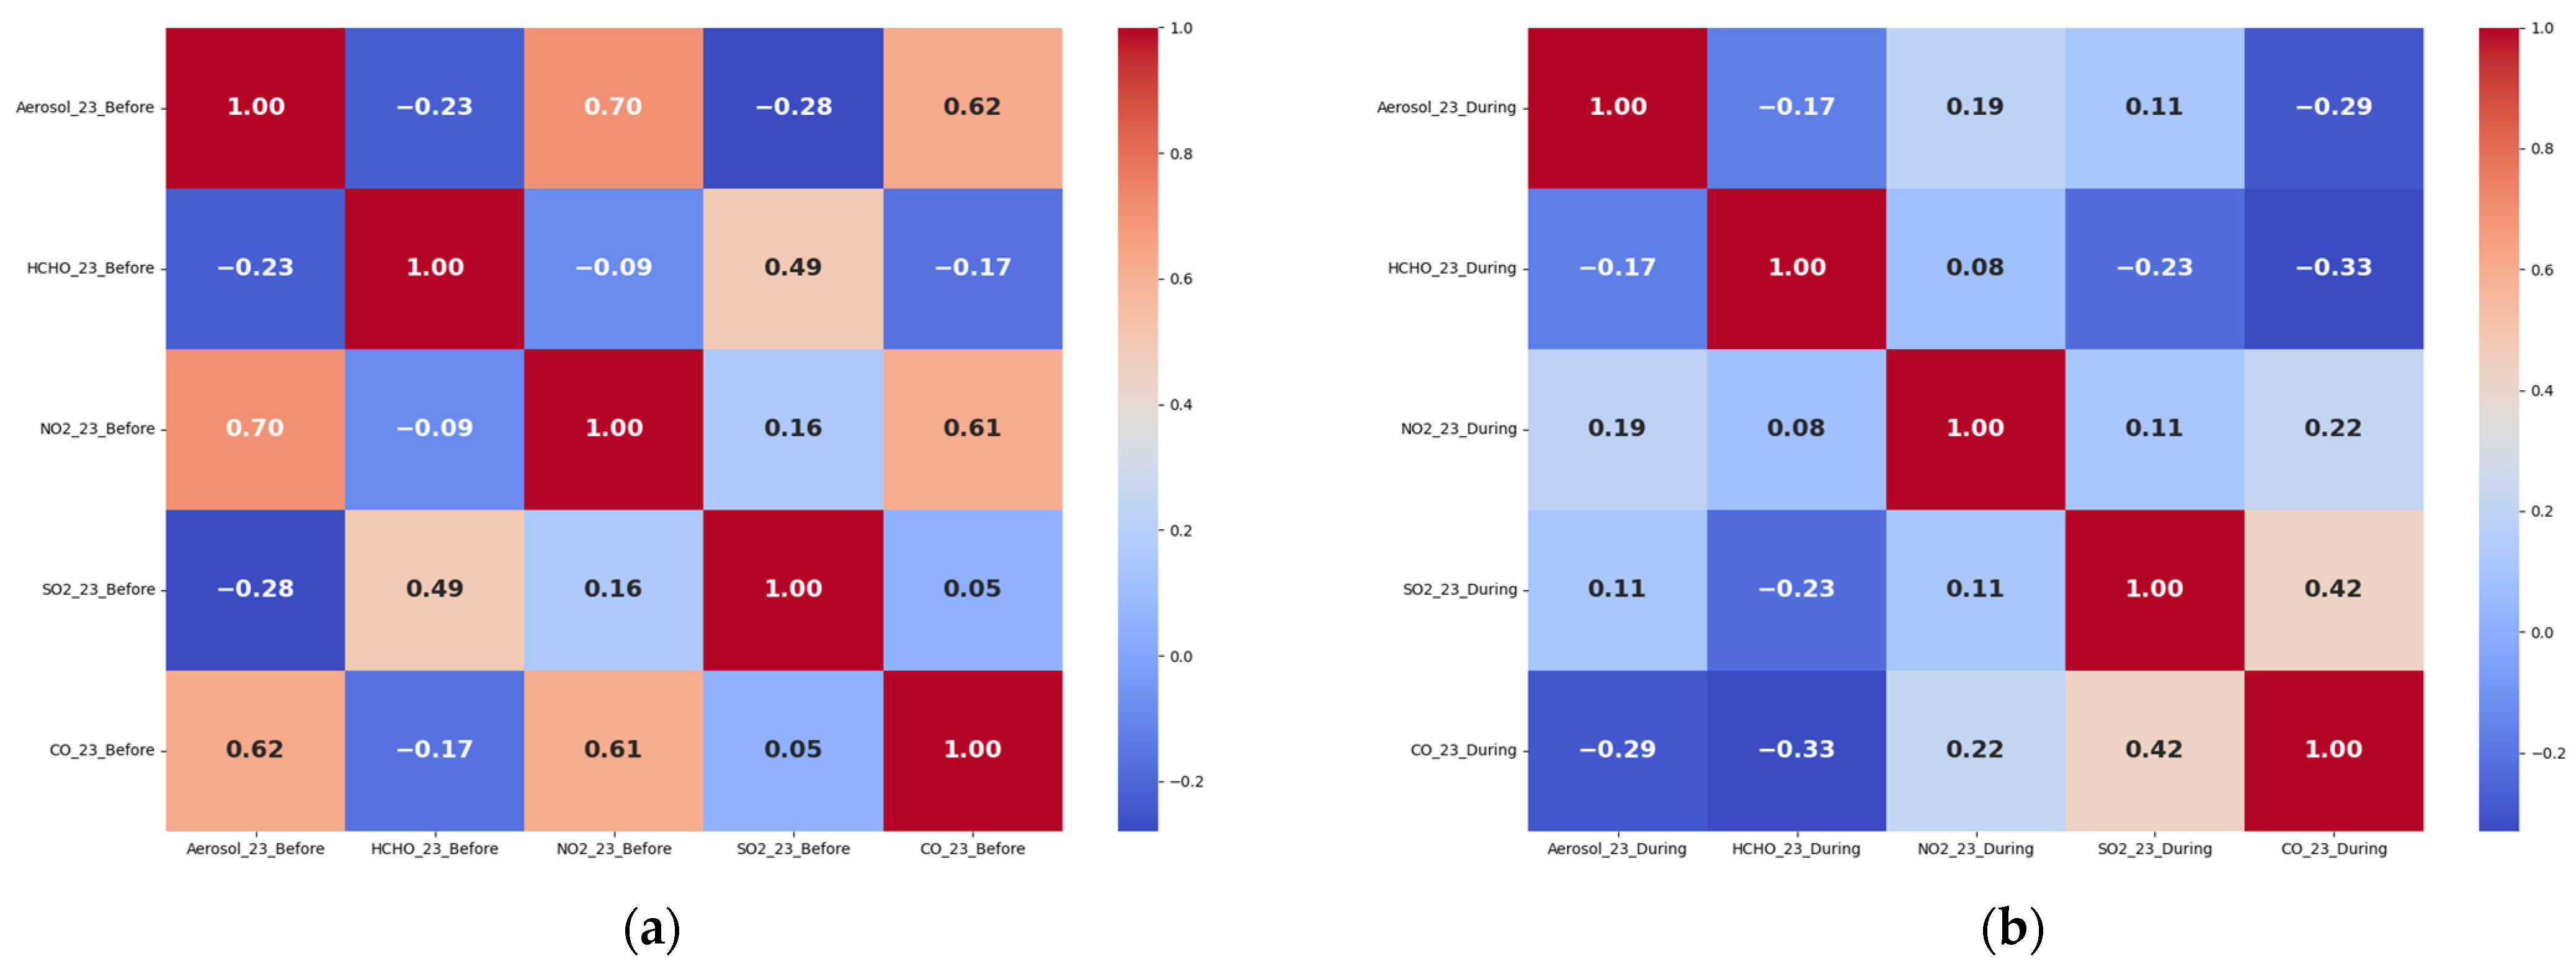
The statistical analysis reveals distinct changes in air quality variable relationships between the pre-Hajj and during-Hajj periods in 2023, as Table 2 and Figure 8. The data demonstrate that 7 out of 10 variable pairs showed statistically significant correlations (p < 0.05) during the Before period, while only 6 pairs-maintained significance during the During period, suggesting that the massive influx of pilgrims and associated activities altered the typical atmospheric chemistry dynamics [58].
Aerosol concentrations exhibited the most pronounced changes between periods. The strongest correlation observed was between Aerosol and NO2 during the Before period (r = 0.70), indicating a robust positive relationship likely reflecting typical urban air pollution patterns where both pollutants share common sources such as vehicular emissions. However, this relationship weakened significantly during the Hajj period (r = 0.19), though it remained statistically significant. This reduction suggests that the massive transportation influx during Hajj may have disrupted the typical aerosol–NO2 equilibrium, possibly due to different emission patterns or meteorological changes associated with increased human activity [59].
The Aerosol–CO relationship displayed the most dramatic shift, changing from a strong positive correlation (r = 0.62) before Hajj to a moderate negative correlation (r = −0.29) during Hajj. This reversal is particularly noteworthy as it suggests fundamental changes in emission sources or atmospheric processing mechanisms. The negative correlation during Hajj might indicate that increased CO emissions from transportation activities occurred under different atmospheric conditions that reduced aerosol formation or enhanced aerosol removal processes [14].
NO2 relationships showed mixed patterns across the two periods. The NO2-CO correlation remained consistently positive in both periods (r = 0.61 before, r = 0.22 during), though with reduced strength during Hajj, indicating that while these combustion-related pollutants maintained their co-occurrence, the relationship was diluted, possibly due to different emission ratios or enhanced atmospheric mixing during the high-activity period. Nitrogen dioxide and carbon monoxide concentrations show positive correlations due to their common vehicular emission sources, though this relationship can weaken during periods of altered traffic patterns [60]. Interestingly, the NO2-SO2 relationship remained weak and non-significant in both periods (r = 0.16 before, r = 0.11 during), suggesting these pollutants originate from largely independent sources or undergo different atmospheric transformations throughout the study period.
HCHO demonstrated complex relationships that varied significantly between periods. The HCHO-SO2 relationship showed a complete reversal, changing from a strong positive correlation (r = 0.49) before Hajj to a significant negative correlation (r = −0.23) during Hajj. This dramatic shift suggests that the sources or formation mechanisms of these species became fundamentally different during the pilgrimage period, possibly due to changes in photochemical processes or precursor availability.
The HCHO-CO relationship strengthened in the negative direction from the Before period (r = −0.17) to the During period (r = −0.33), both maintaining statistical significance. This consistent negative relationship suggests that conditions favouring CO accumulation may inhibit HCHO formation or vice versa, with this pattern becoming more pronounced during the intense activity period.
The SO2-CO relationship provides one of the most interesting findings, changing from no significant correlation before Hajj (r = 0.05) to a strong positive correlation during Hajj (r = 0.42). This emergence of a significant positive relationship suggests that during the pilgrimage period, these pollutants began sharing common sources or atmospheric conditions, possibly related to increased fuel combustion from transportation, and heating activities in the concentrated pilgrimage areas [3].
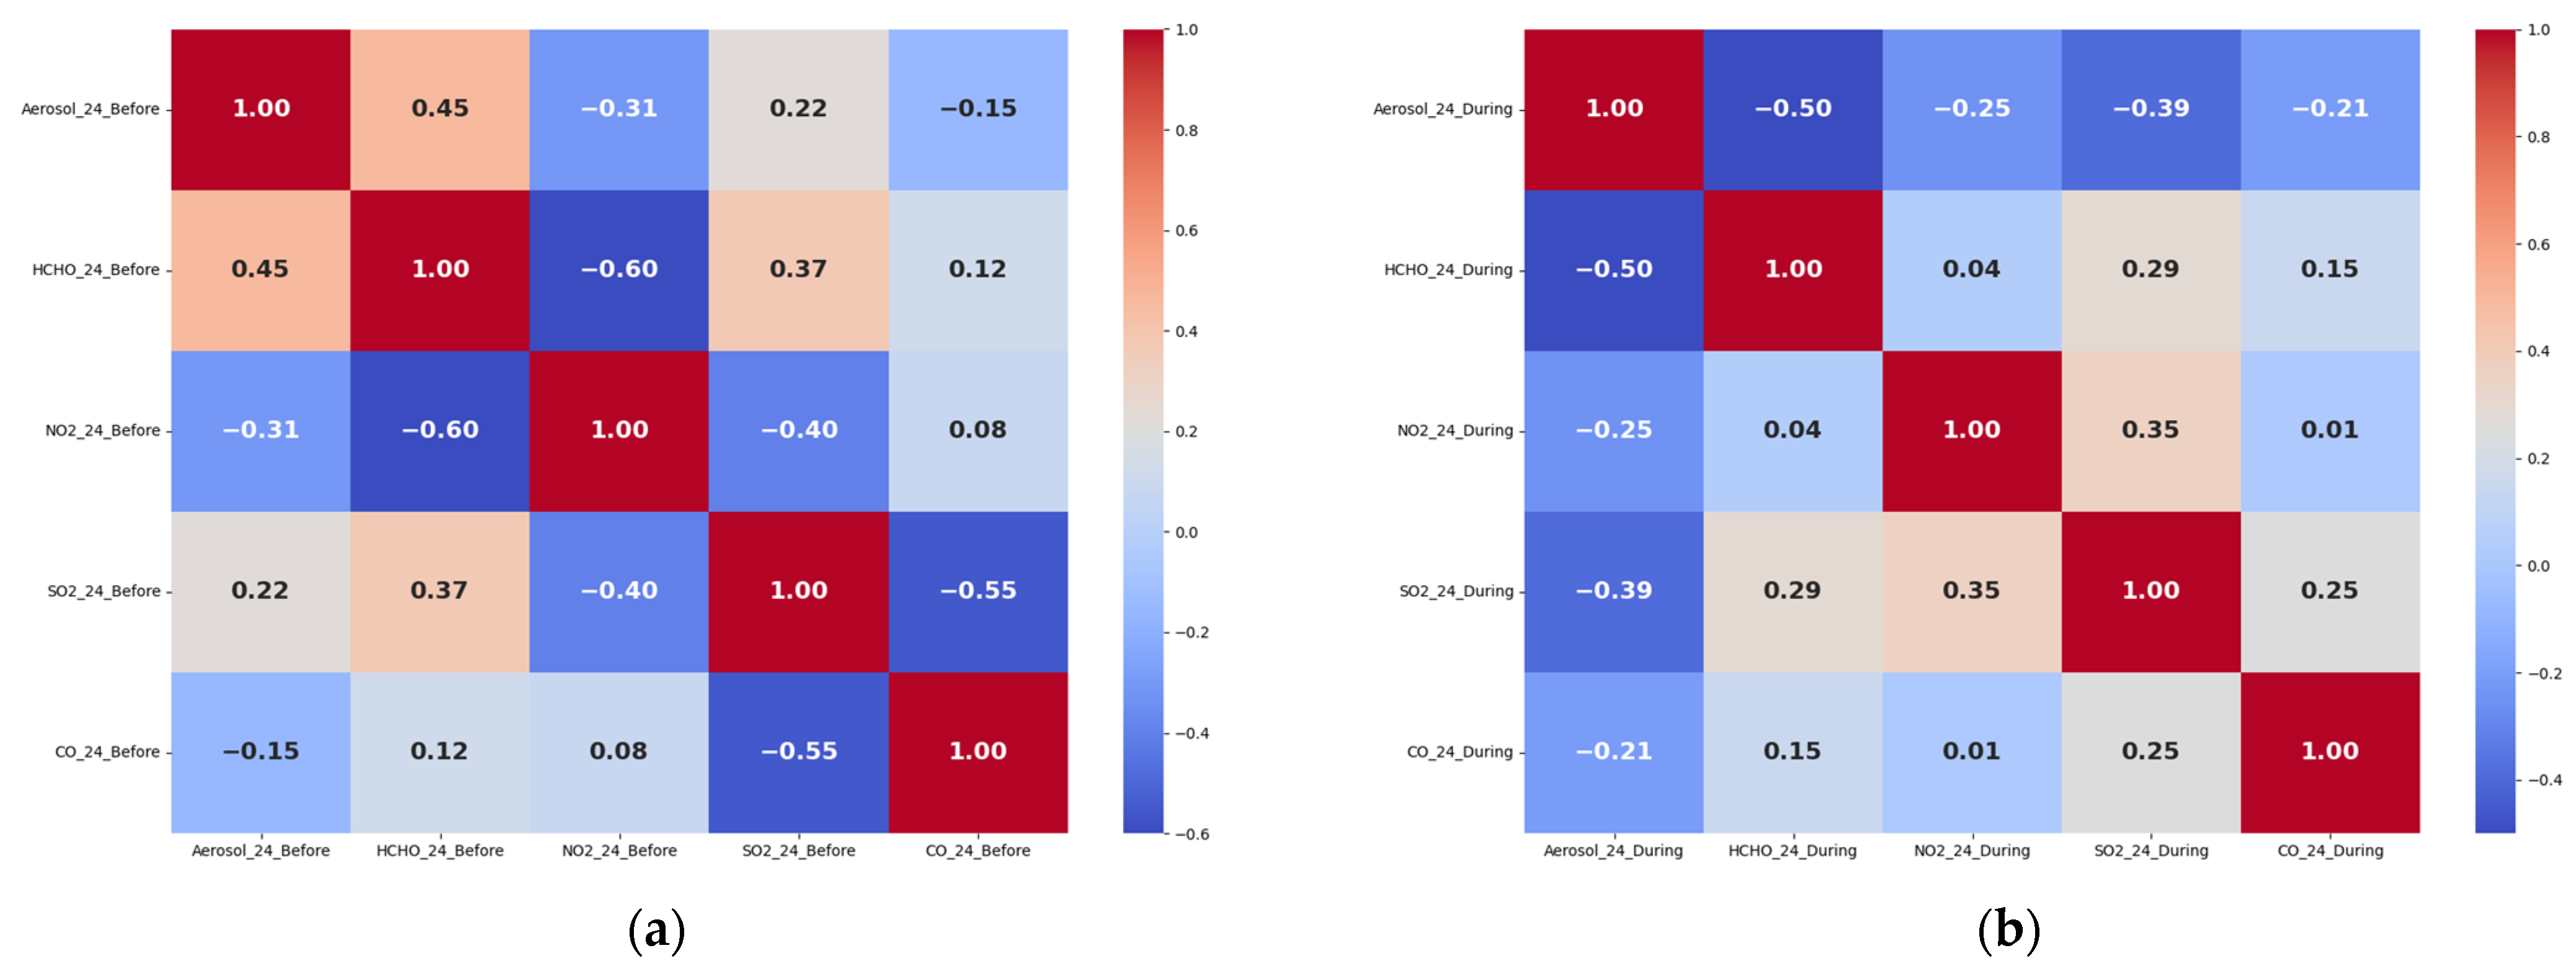
Table 3 and Figure 9 present a comprehensive analysis of air quality variable relationships during the 2024 Hajj season, providing both quantitative correlation coefficients and visual representation through Pearson correlation matrices. This dataset reveals markedly different patterns compared to the 2023 data previously analyzed, suggesting year-to-year variability in atmospheric chemistry dynamics during major pilgrimage events. The dual-period comparison (Before vs. During) offers critical insights into how massive human congregation fundamentally alters urban atmospheric chemistry beyond simple emission scaling effects.
The aerosol correlation patterns in 2024 demonstrate profound changes from baseline conditions, with particularly notable shifts in relationships with nitrogen compounds and carbonaceous species. The Aerosol–NO2 relationship shows a complete reversal from a weak positive correlation before Hajj (r = 0.09) to a significant negative correlation during the pilgrimage period (r = −0.25). This transformation suggests fundamental changes in emission sources or atmospheric processing mechanisms, possibly indicating that increased vehicular emissions during Hajj occurred under meteorological or chemical conditions that favoured aerosol scavenging or enhanced NOx photochemical consumption. Studies have shown that particulate matter relationships with gaseous pollutants can change dramatically during mass gathering events due to altered emission sources and atmospheric processing conditions [61]. The strengthening of negative correlations between aerosol and other pollutants (particularly HCHO, from r = −0.23 to r = −0.50) indicates that the massive influx of pilgrims created atmospheric conditions where aerosol formation processes became decoupled from, or inversely related to, gaseous pollutant concentrations.
NO2 relationships exhibit the most dramatic transformations among all measured species, reflecting the complex interplay between increased emissions and altered atmospheric processing during the pilgrimage period. The NO2-SO2 relationship demonstrates a complete chemical regime shift, changing from a strong negative correlation before Hajj (r = −0.74) to a moderate positive correlation during the event (r = 0.35). This reversal is particularly significant as it suggests that the emission sources and atmospheric chemistry during Hajj created conditions where these species began co-varying positively, possibly due to shared combustion sources or similar atmospheric lifetimes under the altered meteorological conditions [62]. Nitrogen dioxide correlations with other pollutants can show dramatic shifts during Hajj due to changes in emission source profiles and atmospheric mixing patterns. The NO2-CO relationship also reversed dramatically, from a significant negative correlation (r = −0.42) to near-zero correlation (r = 0.01), indicating that the typical inverse relationship between these combustion products was eliminated during the high-activity period, possibly due to different emission ratios or enhanced atmospheric mixing.
HCHO correlations provide crucial insights into photochemical processing changes during the pilgrimage period. The HCHO-CO relationship weakened substantially from a strong positive correlation before Hajj (r = 0.59) to a non-significant correlation during the event (r = 0.15). This pattern suggests that the typical co-emission or co-formation of these species was disrupted during Hajj, possibly due to enhanced photochemical processing under different atmospheric conditions or changes in precursor emission patterns. The maintenance of positive HCHO-SO2 correlations in both periods (r = 0.42 before, r = 0.29 during), though with reduced strength, indicates that certain aspects of atmospheric chemistry remained consistent despite the massive environmental perturbation, possibly reflecting persistent industrial emission patterns.
CO relationships demonstrate how combustion signatures evolved during the transition from baseline to high-activity conditions. The strengthening of negative Aerosol–CO correlations from r = −0.25 to r = −0.21 suggests that increased CO emissions during Hajj occurred under conditions that were unfavourable for aerosol formation or enhanced aerosol removal processes. The SO2-CO relationship maintained positive correlations in both periods (r = 0.48 before, r = 0.25 during) but with reduced strength during Hajj, indicating that while these combustion products continued to share some common sources, the relationship was diluted by additional or different emission sources during the pilgrimage period.
SO2 correlations reveal important insights into fuel usage and emission source changes during the massive logistical operation required to support millions of pilgrims. The emergence of significant negative Aerosol–SO2 correlations during Hajj (from r = −0.07 to r = −0.39) suggests that SO2 sources became more prominent while aerosol formation was suppressed, possibly indicating increased reliance on cleaner combustion technologies or different fuel types [63]. The reversal of NO2-SO2 relationships from strongly negative to moderately positive indicates fundamental changes in the emission source mix, possibly reflecting increased contributions from diesel generators, heavy-duty transportation, and industrial facilities required to support the pilgrimage infrastructure [64].
The comprehensive changes observed across multiple pollutant pairs indicate that the 2024 Hajj period created a distinct atmospheric chemistry regime that cannot be predicted from baseline urban air quality patterns. The systematic weakening or reversal of several correlations suggests that the massive scale of human activity, combined with the unique geographic and meteorological conditions of the pilgrimage sites, created atmospheric processing conditions that fundamentally altered typical pollutant interaction patterns. Research has emphasized that air quality modelling during mass gathering events requires consideration of altered atmospheric chemistry regimes that differ substantially from typical urban pollution patterns [65]. This finding has profound implications for air quality modelling and health risk assessment during large-scale events, as traditional urban air quality models may significantly underestimate or mischaracterize exposure patterns during such extraordinary circumstances.

3.3. The Impact of Weather Variables on Air Quality During the Hajj Season 2024

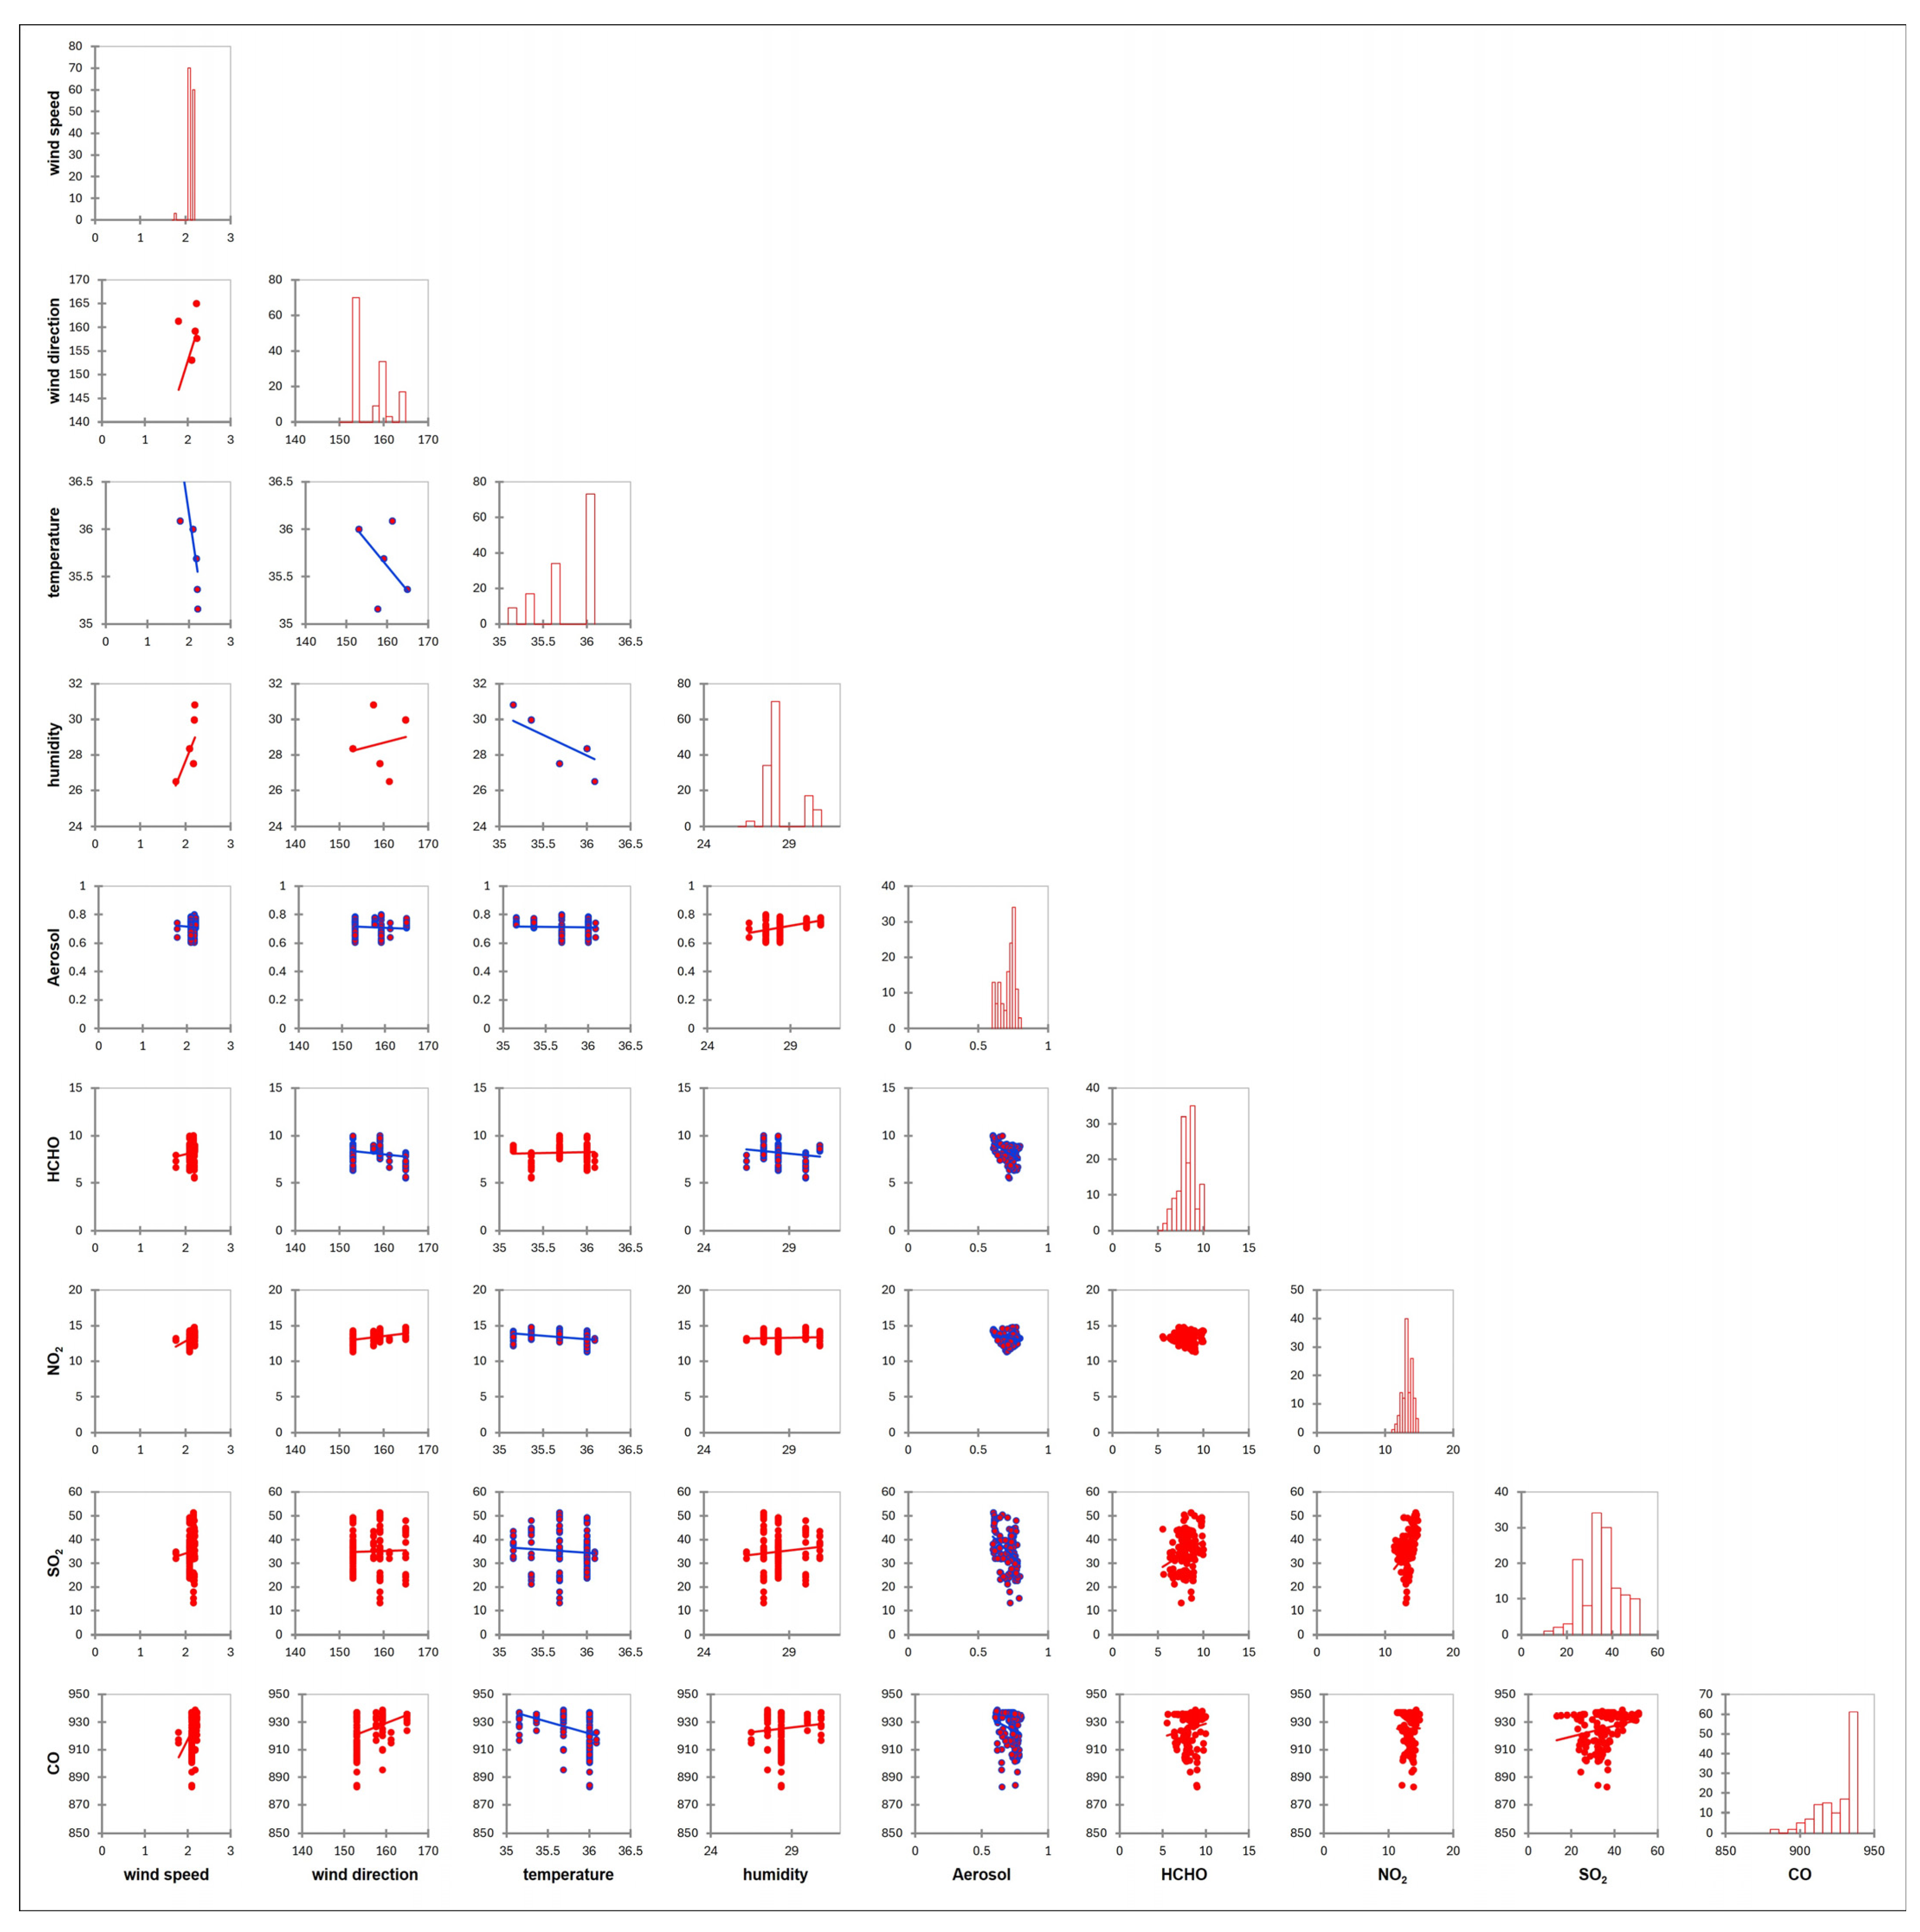
The relationships between wind characteristics and air pollutants during the 2024 Hajj season reveal complex dispersion dynamics that deviate from conventional atmospheric chemistry expectations, as Table 4 and Figure 10. Wind speed demonstrates significant positive correlations with both NO2 (r = 0.347) and CO (r = 0.345), a pattern that contradicts typical dispersion theory where increased wind speeds enhance pollutant dilution. This counterintuitive relationship suggests that during the Hajj period, higher wind speeds coincided with peak emission activities, possibly due to increased transportation demands during windy periods or the correlation between meteorological conditions and ritual timing. Meteorological factors, particularly wind patterns, significantly influence pollutant dispersion in Makkah during Hajj, though the complex topography and extreme emission densities can lead to unexpected pollutant–meteorology relationships [37]. The positive correlation between wind speed and these primary combustion pollutants indicates that the massive scale of pilgrimage activities created emission patterns that overwhelmed typical dispersion benefits.
Wind direction exhibits the strongest relationship with pollutants through its correlation with NO2 (r = 0.449), indicating that specific wind directions systematically transport nitrogen dioxide from concentrated source areas. This directional dependence suggests that the spatial arrangement of major emission sources including vehicle corridors, generator clusters, and created distinct plumes that were preferentially detected under certain wind conditions. Wind direction plays a crucial role in pollutant distribution across Makkah’s holy sites, with certain wind patterns leading to accumulation of pollutants in specific areas during Hajj [5]. The weaker but notable correlation between wind direction and CO (r = 0.395) supports this source-oriented transport pattern, while the minimal correlation with SO2 (r = 0.036) suggests that sulfur dioxide sources were more uniformly distributed or subject to different transport mechanisms.
Temperature emerges as a critical factor influencing pollutant concentrations through multiple atmospheric processes. The significant negative correlations between temperature and primary pollutants specifically NO2 (r = −0.380) and CO (r = −0.377) indicate that higher temperatures during the Hajj season enhanced pollutant removal processes. This relationship likely reflects increased convective mixing under extreme heat conditions, where enhanced vertical air movement facilitated pollutant dispersion away from ground level. High temperatures in Makkah during summer Hajj seasons promote enhanced vertical mixing and photochemical processes that can reduce certain pollutant concentrations at ground level [66]. Additionally, elevated temperatures may have accelerated photochemical reactions that consumed NO2, contributing to lower observed concentrations during the hottest periods.
The temperature–SO2 relationship (r = −0.090) shows a weaker negative correlation, suggesting that sulfur dioxide was less sensitive to temperature-driven dispersion processes, possibly due to different source characteristics or chemical behavior. Interestingly, temperature shows minimal correlation with HCHO (r = 0.056), indicating that formaldehyde concentrations remained relatively independent of thermal conditions, despite its role as both a primary pollutant and secondary photochemical product.
Relative humidity demonstrates the strongest meteorological–pollutant relationship through its significant positive correlation with aerosol concentrations (r = 0.374). This relationship reflects the hygroscopic properties of atmospheric particles, where increased moisture content promotes aerosol water uptake, leading to particle growth and enhanced light scattering. Relative humidity significantly affects particulate matter concentrations, with higher humidity levels leading to particle growth and enhanced aerosol optical properties [65]. The humidity–aerosol correlation suggests that periods of higher relative humidity during the Hajj created conditions favorable for secondary aerosol formation and growth processes, potentially exacerbating visibility reduction and health impacts [67].
The weaker correlations between humidity and gaseous pollutants including negative relationships with HCHO (r = −0.180) indicate that moisture primarily affected particulate matter rather than gas-phase species. This selectivity suggests that humidity influenced atmospheric chemistry through heterogeneous processes on aerosol surfaces rather than through gas-phase reaction modifications. Humidity effects on air quality in arid regions like Saudi Arabia are primarily manifested through impacts on particulate matter rather than gaseous pollutants [68].
The combined meteorological influences on pollutant behavior reveal a complex atmospheric processing regime during the 2024 Hajj season. The temperature-driven reductions in primary pollutants (NO2, CO) occurred simultaneously with humidity-enhanced aerosol formation, suggesting competing atmospheric processes where thermal dispersion reduced gas-phase concentrations while moisture promoted particulate matter accumulation. This dichotomy indicates that different pollutant classes responded distinctly to the extreme meteorological. Condition’s characteristic of the Saudi Arabian summer during the pilgrimage period. Research has emphasized that meteorological factors interact in complex ways with pollutant chemistry during extreme conditions such as those experienced during summer Hajj seasons [69].
The wind–pollutant relationships demonstrate that the extraordinary emission density during Hajj created conditions where meteorological dispersion capacity was exceeded, leading to positive correlations between wind parameters and pollutant concentrations. This finding has significant implications for air quality management during mass gatherings, suggesting that traditional meteorological dispersion models may underestimate pollutant concentrations when emission rates are sufficiently high to overwhelm atmospheric mixing capacity. Conventional air quality models may not accurately predict pollutant concentrations during extreme events like Hajj due to the unprecedented scale of emissions and unique meteorological interactions [70].
These atmospheric variable–pollutant interactions collectively indicate that the 2024 Hajj season created a unique environmental regime where extreme emissions, challenging meteorological conditions, and complex atmospheric chemistry processes combined to produce pollutant concentration patterns that require specialized modelling approaches for accurate prediction and effective environmental management during future pilgrimage events. Research has highlighted the need for specialized air quality modelling approaches during mass gathering events that account for the unique emission patterns and meteorological interactions characteristic of such extraordinary circumstances [71].

3.4. Event-Driven Aerosol Hotspots During Hajj in Makkah 2024

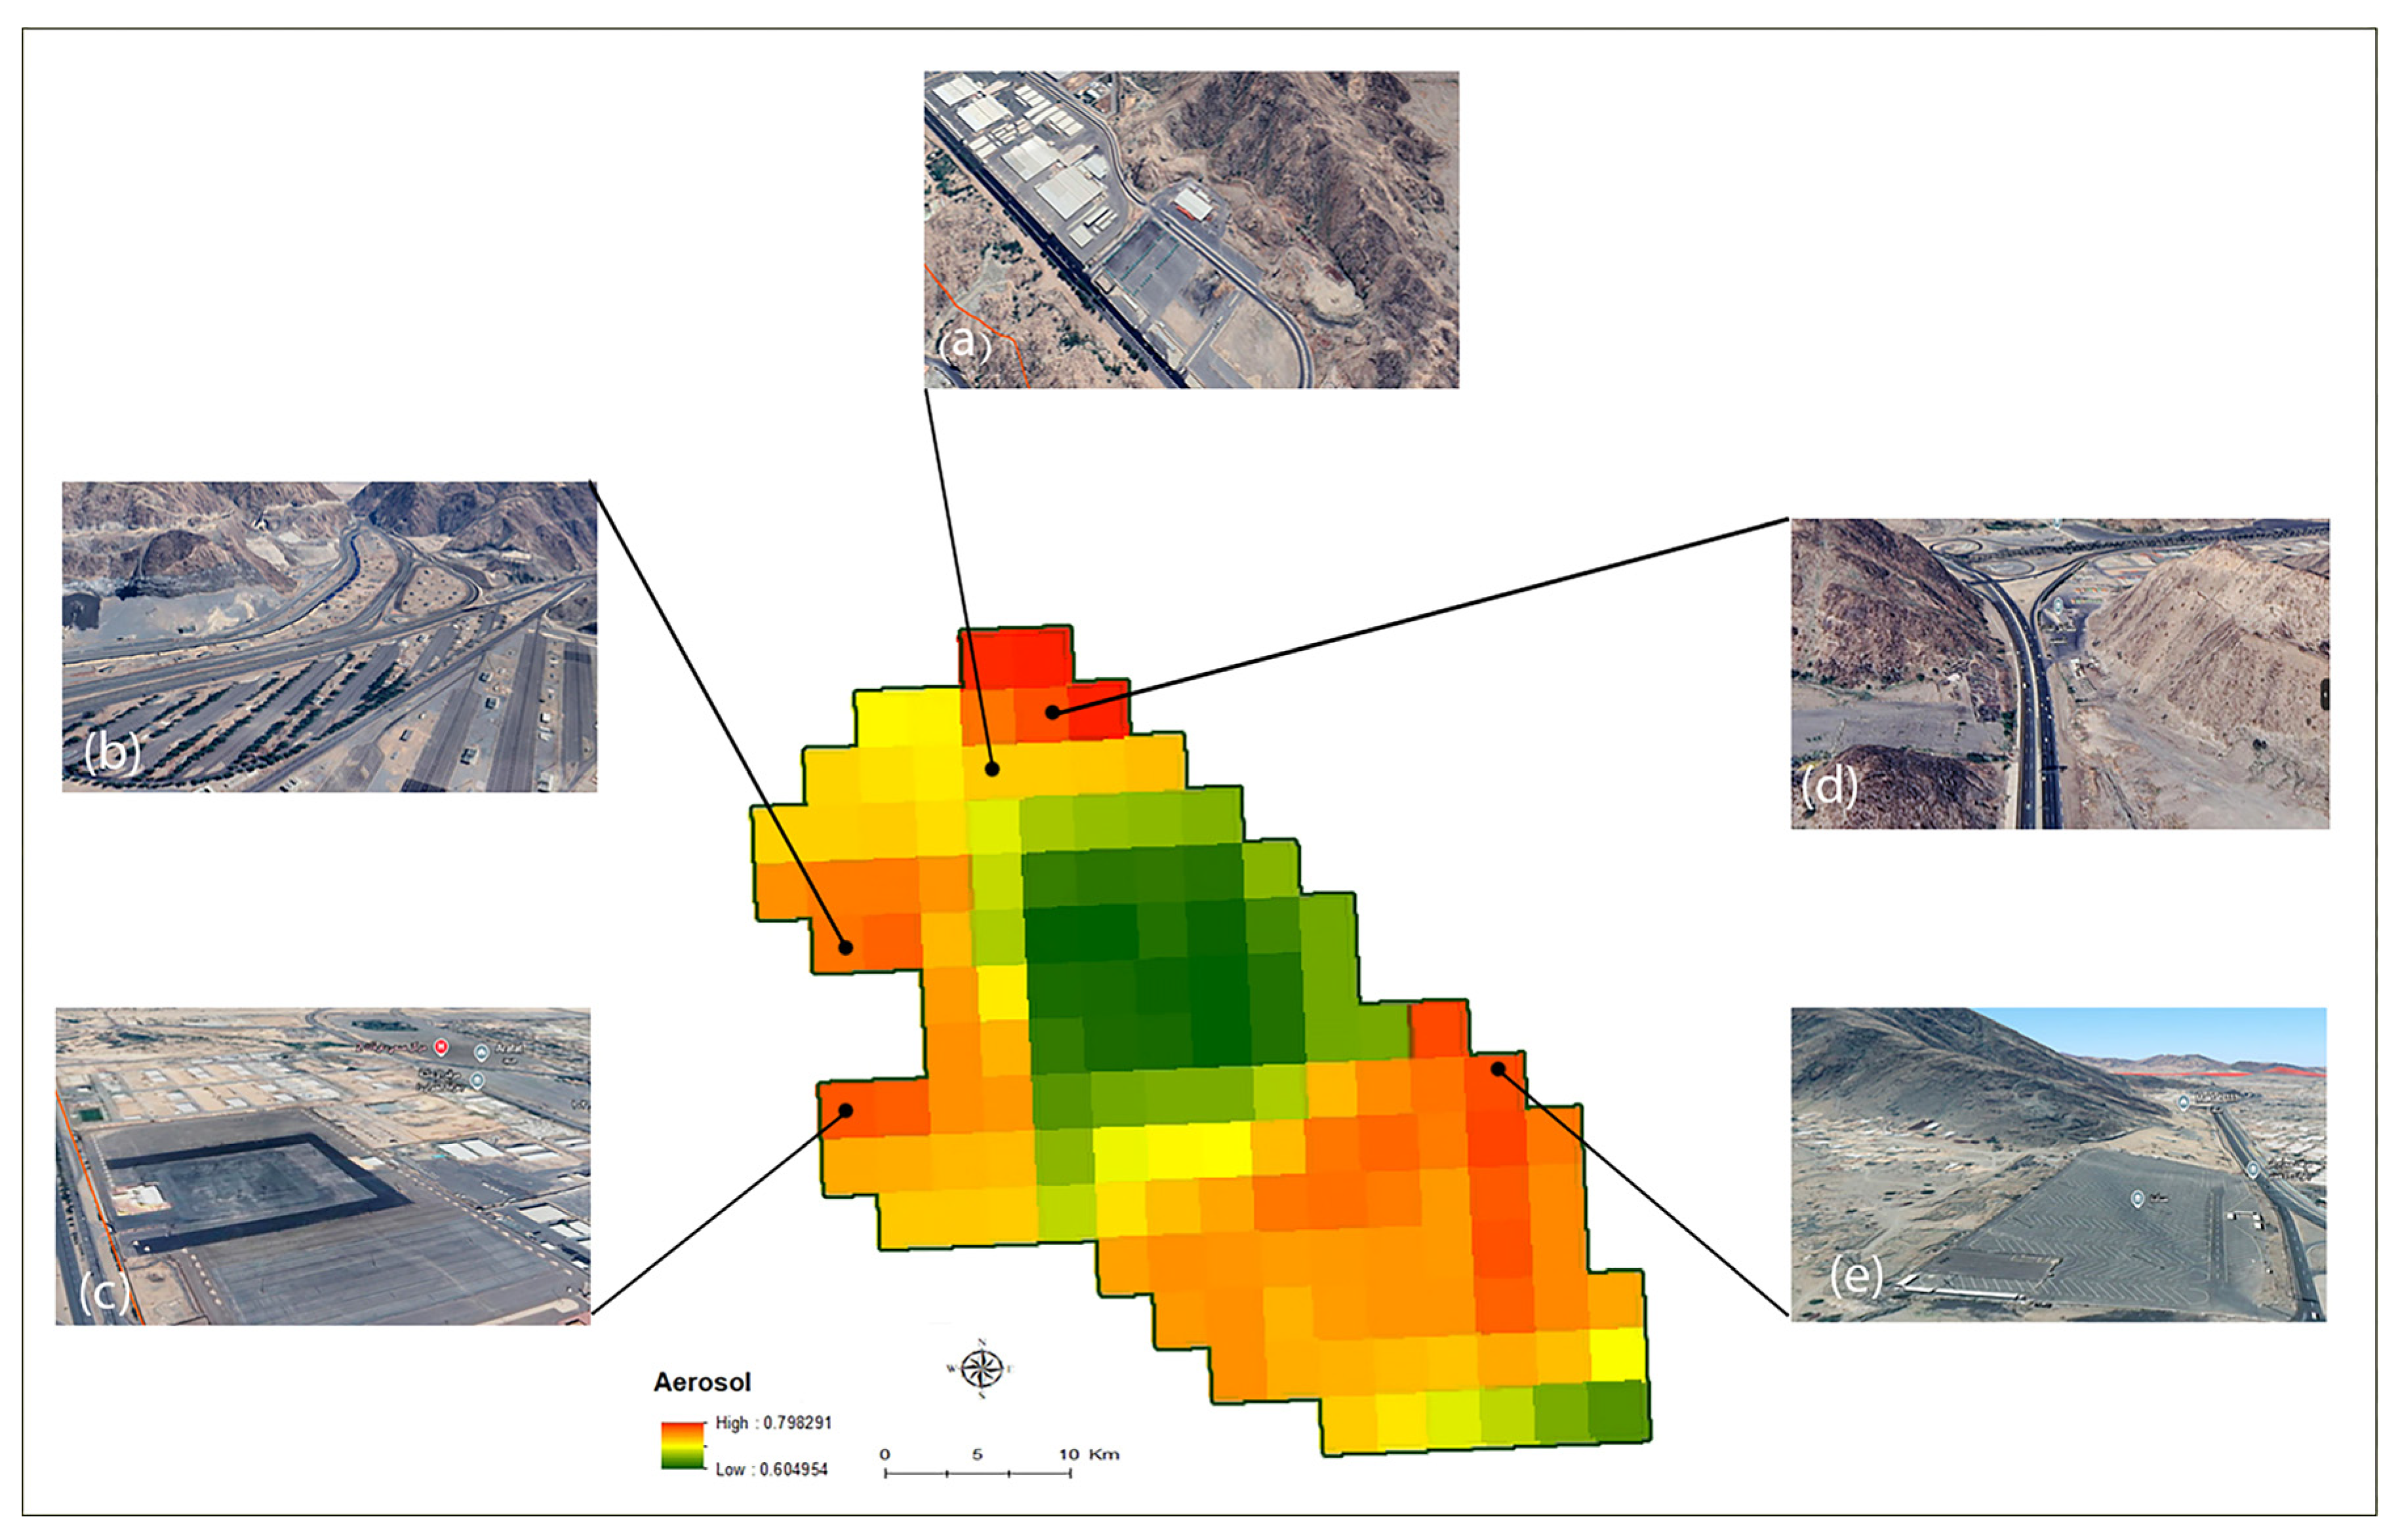
Figure 11 presents spatial patterns of aerosol loading across the holy sites in Makkah metropolitan area using a gridded representation overlaid with georeferenced satellite views of key hotspots. The central map depicts aerosol intensity as a continuous surface with warm colors indicating elevated aerosol burden and cooler tones denoting comparatively cleaner air. The gradient reveals a clear west–east heterogeneity, with multiple high-intensity cells aligning with transport corridors and activity hubs. This spatial structure is consistent with emission processes dominated by on-road traffic, parking aggregation, material handling, and transient dust resuspension under arid conditions. Aerosol distributions in Makkah show distinct spatial patterns closely linked to transportation infrastructure and land use types, with the highest concentrations typically observed along major traffic corridors and at transportation hubs [72].
The annotated insets provide contextual evidence linking the aerosol hotspots to specific land-use types. Panel a highlights the Al-Ma’isem slaughterhouses, a complex that concentrates logistics, animal transport, and waste-handling operations; such activities are known to increase coarse and fine particulate emissions through vehicle exhaust, biomass residues, and mechanical disturbance of unpaved surfaces [73]. Studies have shown that industrial facilities and livestock operations in Saudi Arabia contribute significantly to local particulate matter concentrations through both direct emissions and resuspension of surface materials [74]. Panel b shows the Muzdalifah parking lots, a sprawling impervious area that serves mass bus fleets; intense braking/acceleration cycles, idling, tire and brake wear, and passenger turnover collectively amplify primary particulate emissions and dust resuspension. Research has documented that large parking areas and transportation hubs in Makkah generate substantial particulate matter emissions during Hajj due to intensive vehicle activity and dust resuspension from paved surfaces [47].
Panel d points to the Al-Ma’isem motorcycle reservation and waste transfer station, where two emission drivers co-occur: dense two-wheeler traffic with higher emission factors per passenger-kilometer in congested settings, and particulate releases associated with waste loading, crushing, and transfer. Studies have shown that motorcycle emissions in urban Saudi Arabian environments contribute significantly to fine particulate matter concentrations, particularly in areas with heavy two-wheeler traffic [75]. Panel e locates the Al-Wadi Al-Akhdar parking lots in Arafat, another episodic congregation site where staging of buses and service vehicles elevates localized aerosol concentrations. Research indicates that temporary parking areas and vehicle staging zones during Hajj can become significant sources of particulate pollution due to concentrated vehicle emissions and surface disturbance [38].
Taken together, the figure substantiates a land-use emissions connection: zones dedicated to intensive, seasonal mobility and logistics repeatedly register higher aerosol levels than surrounding residential or undeveloped areas. The spatial coherence between the gridded aerosol maxima and transport/service infrastructure implies that event-driven traffic (e.g., Hajj peaks) is a principal determinant of short-term particulate pollution. Studies have demonstrated strong correlations between land use patterns and aerosol concentrations in Makkah, with transportation-intensive areas showing consistently elevated particulate matter levels compared to residential zones [76]. The observed pattern is also consistent with the role of mineral dust mobilization over large paved and semi-paved surfaces, especially under low vegetation cover and frequent vehicle movement. Dust resuspension from paved surfaces under arid conditions represents a major source of coarse particulate matter in Saudi Arabian urban environments, with the effect amplified by vehicle-induced turbulence and low precipitation rates [77,78].

3.5. Limitations, Implications, and Future Research

This analysis relies on satellite-derived aerosol indices and gridded estimates, which introduce several methodological limitations with important implications for interpretation. Aerosol index measurements are not direct PM2.5 mass concentrations; while they reliably indicate spatiotemporal particulate variability, conversion to health-relevant mass concentrations requires aerosol type and vertical profile information, introducing uncertainty in exposure assessment. Temporal aggregation over Hajj periods can smooth short-lived pollution peaks that drive acute health risks during specific ritual windows, potentially underestimating maximum exposure levels experienced by pilgrims. The correlation framework does not establish causality; confounding by co-varying emission sources and meteorological factors is possible without comprehensive source apportionment modelling. Interannual differences between 2023 and 2024 may partly reflect meteorological variability and evolving transportation logistics rather than pilgrimage-specific impacts. Additionally, the gridded spatial analysis may not capture micro-scale pollution hotspots particularly relevant for pedestrian exposure during ritual activities. These limitations likely result in conservative bias, understating short-duration exposures and potentially masking the strength of source-specific pollution signals. The findings therefore represent minimum estimates of pollution impacts, suggesting that actual exposure levels and health risks may be higher than reported, with important implications for precautionary air quality management strategies during future Hajj events.
These findings demonstrate that air quality during Hajj creates unique atmospheric chemistry regimes requiring specialized management approaches beyond conventional urban air quality models. Future research should prioritize real-time PM2.5 monitoring with higher temporal resolution to capture episodic exposure peaks, comprehensive source apportionment modelling to establish causal relationships, and health outcome studies linking pollutant concentrations to pilgrim morbidity. Integration of meteorological forecasting with emission modelling could enable predictive air quality management systems for mass gathering events. Additionally, investigating the effectiveness of traffic management interventions, clean energy deployment, and emission reduction technologies during pilgrimage periods would inform evidence-based policy development for protecting vulnerable populations during future Hajj seasons.

4. Conclusions

This study set out to investigate the spatiotemporal distribution of key atmospheric pollutants NO2, CO, SO2, HCHO, and aerosols across Makkah and its holy sites before and during the Hajj seasons of 2023 and 2024, using Sentinel-5P TROPOMI observations integrated with cloud-based geospatial analysis on Google Earth Engine. By combining high-resolution satellite data with meteorological reanalysis information, the research addressed a critical monitoring gap in a context where conventional ground-based networks are sparse and crowd-induced emissions fluctuate sharply over short timescales.
The findings show that Hajj-related activities substantially altered pollutant concentrations and relationships among atmospheric constituents. Spatial patterns consistently identified high-exposure zones in densely trafficked pilgrimage sites such as Mina, Muzdalifa, and Al Mashair, with lower levels in Arafat. NO2, SO2, and HCHO experienced episodic peaks during Hajj, in some cases approaching or exceeding World Health Organization annual mean guidelines, highlighting short-term but potentially significant health risks, especially for vulnerable populations. Aerosol hotspots were closely aligned with transportation corridors, parking areas, logistics facilities, and waste-handling sites, underscoring the strong land-use–emissions connection during mass gatherings.
Correlation analyses revealed that the atmospheric chemistry regime during Hajj differs fundamentally from baseline urban behavior. In both 2023 and 2024, multiple pollutant and pollutant–meteorology relationships weakened, reversed, or emerged indicating shifts in emission source profiles, altered chemical processing, and meteorological influences unique to the event. In 2024, wind speed and direction displayed positive correlations with primary combustion pollutants, challenging conventional dispersion expectations and suggesting that extreme emission density can override typical dilution effects under the prevailing climatic conditions. Relative humidity was positively associated with aerosol loading, likely reflecting hygroscopic growth.
These results confirm that the Hajj period creates a distinctive, event-driven air pollution regime shaped by intensified transportation, concentrated human activity, and complex meteorological interactions. The evidence highlights the importance of targeted, short-term air quality management strategies, including traffic flow optimization, deployment of low-emission transport, and enhanced dust control in high-activity zones, to protect the health of millions of pilgrims and residents.
Finally, this study demonstrates the operational viability of integrating Sentinel-5P satellite data with cloud-based geospatial processing for near-real-time environmental assessment in mass gathering contexts. The approach is transferable to other cities and events where monitoring infrastructure is limited, offering a scalable framework for evidence-based policy design, proactive risk mitigation, and improved public health preparedness in the face of episodic, high-intensity emissions.

Author Contributions

Conceptualization, E.A. and H.A.; Methodology, E.A. and H.A.; Software, E.A. and H.A.; Formal analysis, E.A. and H.A.; Resources, E.A. and H.A.; Data curation, E.A. and H.A.; Writing—original draft, E.A.; Writing—review & editing, E.A.; Visualization, H.A. All authors have read and agreed to the published version of the manuscript.

Funding

This research received no external funding.

Institutional Review Board Statement

Not applicable.

Informed Consent Statement

Not applicable.

Data Availability Statement

Data are available on request from the corresponding author.

Conflicts of Interest

The authors declare no conflicts of interest.

References

  1. Alghamdi, M.A.; Khoder, M.; Abdelmaksoud, A.S.; Harrison, R.M.; Hussein, T.; Lihavainen, H.; Hämeri, K. Seasonal and diurnal variations of BTEX and their potential for ozone formation in the urban background atmosphere of the coastal city Jeddah, Saudi Arabia. Air Qual. Atmos. Health 2014, 7, 467–480. [Google Scholar] [CrossRef]
  2. Nayebare, S.R.; Aburizaiza, O.S.; Siddique, A.; Carpenter, D.O.; Hussain, M.M.; Zeb, J.; Khwaja, H.A. Ambient air quality in the holy city of Makkah: A source apportionment with elemental enrichment factors (EFs) and factor analysis (PMF). Environ. Pollut. 2018, 243, 1791–1801. [Google Scholar] [CrossRef] [PubMed]
  3. Farahat, A.; Chauhan, A.; Al Otaibi, M.; Singh, R.P. Air quality over major cities of Saudi Arabia during hajj periods of 2019 and 2020. Earth Syst. Environ. 2021, 5, 101–114. [Google Scholar] [CrossRef] [PubMed]
  4. Vision, S. Vision 2030 Kingdom Saudi Arabia. 2017. Available online: https://www.vision2030.gov.sa/media/rc0b5oy1/saudi_vision203.pdf (accessed on 1 December 2024).
  5. Simpson, I.J.; Aburizaiza, O.S.; Siddique, A.; Barletta, B.; Blake, N.J.; Gartner, A.; Blake, D.R. Air quality in Mecca and surrounding holy places in Saudi Arabia during Hajj: Initial survey. Environ. Sci. Technol. 2014, 48, 8529–8537. [Google Scholar] [CrossRef]
  6. Alasmari, A. Meningococcal Vaccination and Travel Health in Hajj Pilgrims–A Study of Pilgrims to Mecca, Saudi Arabia. Doctoral Thesis, London School of Hygiene & Tropical Medicine, London, UK, 2020. [Google Scholar]
  7. Habeebullah, T.M. An analysis of air pollution in Makkah-A view point of source identification. Environ. Asia 2013, 2, 11–17. [Google Scholar]
  8. Almaliki, A.H.; Derdour, A.; Ali, E. Air Quality Index (AQI) Prediction in Holy Makkah based on machine learning methods. Sustainability 2023, 15, 13168. [Google Scholar] [CrossRef]
  9. Filonchyk, M.; Yan, H. Urban Air Pollution Monitoring by Ground-Based Stations and Satellite Data; Springer: Berlin/Heidelberg, Germany, 2019; Volume 10. [Google Scholar]
  10. Zhou, B.; Zhang, S.; Xue, R.; Li, J.; Wang, S. A review of Space-Air-Ground integrated remote sensing techniques for atmospheric monitoring. J. Environ. Sci. 2023, 123, 3–14. [Google Scholar] [CrossRef]
  11. Guanter, L.; Aben, I.; Tol, P.; Krijger, J.M.; Hollstein, A.; Köhler, P.; Landgraf, J. Potential of the TROPOspheric Monitoring Instrument (TROPOMI) onboard the Sentinel-5 Precursor for the monitoring of terrestrial chlorophyll fluorescence. Atmos. Meas. Tech. 2015, 8, 1337–1352. [Google Scholar] [CrossRef]
  12. Hu, Y.; Yan, H.; Zhang, X.; Gao, Y.; Zheng, X.; Liu, X. Study on calculation and validation of tropospheric ozone by ozone monitoring instrument–microwave limb sounder over China. Int. J. Remote Sens. 2020, 41, 9101–9120. [Google Scholar] [CrossRef]
  13. Gorelick, N.; Hancher, M.; Dixon, M.; Ilyushchenko, S.; Thau, D.; Moore, R. Google Earth Engine: Planetary-scale geospatial analysis for everyone. Remote Sens. Environ. 2017, 202, 18–27. [Google Scholar] [CrossRef]
  14. Abonomi, A.; De Lacy, T.; Pyke, J. Environmental impact of the hajj. Int. J. Relig. Tour. Pilgr. 2022, 10, 12. [Google Scholar]
  15. Ahmed, O.B.; Habeebullah, T.M. Health Impacts of Air Pollution During a Short-Term Event (Hajj). 2024. Available online: https://www.researchgate.net/profile/Omar-Ahmed-34/publication/378714432_Health_Impacts_of_Air_Pollution_during_a_short-term_event_Hajj/links/65e6d5bdadc608480a01a40e/Health-Impacts-of-Air-Pollution-during-a-short-term-event-Hajj.pdf (accessed on 5 August 2025).
  16. Mitra, B.; Hridoy, A.E.E.; Mahmud, K.; Uddin, M.S.; Talha, A.; Das, N.; Rahman, M.M. Exploring Spatial and Temporal Dynamics of Red Sea Air Quality through Multivariate Analysis, Trajectories, and Satellite Observations. Remote Sens. 2024, 16, 381. [Google Scholar] [CrossRef]
  17. General Authority for Statistics (GASTAT). Population Estimates—Kingdom of Saudi Arabia—2022. Available online: https://www.stats.gov.sa/en (accessed on 10 December 2024).
  18. Kottek, M.; Grieser, J.; Beck, C.; Rudolf, B.; Rubel, F. World map of the Köppen-Geiger climate classification updated. Meteorol. Z. 2006, 15, 259–263. [Google Scholar] [CrossRef]
  19. Morillas, C.; Alvarez, S.; Serio, C.; Masiello, G.; Martinez, S. TROPOMI NO2 Sentinel-5P data in the Community of Madrid: A detailed consistency analysis with in situ surface observations. Remote Sens. Appl. Soc. Environ. 2024, 33, 101083. [Google Scholar] [CrossRef]
  20. Faisal, M.; Jaelani, L.M. Spatio-temporal analysis of nitrogen dioxide (NO2) from Sentinel-5P imageries using Google Earth Engine changes during the COVID-19 social restriction policy in jakarta. Nat. Hazards Res. 2023, 3, 344–352. [Google Scholar] [CrossRef]
  21. Bodah, B.W.; Neckel, A.; Maculan, L.S.; Milanes, C.B.; Korcelski, C.; Ramírez, O.; Oliveira, M.L. Sentinel-5P TROPOMI satellite application for NO2 and CO studies aiming at environmental valuation. J. Clean. Prod. 2022, 357, 131960. [Google Scholar] [CrossRef]
  22. Levelt, P.F.; Stein Zweers, D.C.; Aben, I.; Bauwens, M.; Borsdorff, T.; De Smedt, I.; Verhoelst, T. Air quality impacts of COVID-19 lockdown measures detected from space using high spatial resolution observations of multiple trace gases from Sentinel-5P/TROPOMI. Atmos. Chem. Phys. Discuss. 2021, 2021, 1–53. [Google Scholar] [CrossRef]
  23. Hersbach, H.; Bell, B.; Berrisford, P.; Hirahara, S.; Horányi, A.; Muñoz-Sabater, J.; Thépaut, J.N. The ERA5 global reanalysis. Q. J. R. Meteorol. Soc. 2020, 146, 1999–2049. [Google Scholar] [CrossRef]
  24. Muñoz-Sabater, J.; Dutra, E.; Agustí-Panareda, A.; Albergel, C.; Arduini, G.; Balsamo, G.; Thépaut, J.N. ERA5-Land: A state-of-the-art global reanalysis dataset for land applications. Earth Syst. Sci. Data 2021, 13, 4349–4383. [Google Scholar] [CrossRef]
  25. Geddes, J.A.; Martin, R.V.; Boys, B.L.; van Donkelaar, A. Long-term trends worldwide in ambient NO2 concentrations inferred from satellite observations. Environ. Health Perspect. 2016, 124, 281–289. [Google Scholar] [CrossRef]
  26. Liu, P.; Chen, X. Tropospheric Atmospheric Heterogeneities of ALOS-2 Interferograms in the Greater Bay Area. IEEE J. Sel. Top. Appl. Earth Obs. Remote Sens. 2024, 17, 11777–11793. [Google Scholar] [CrossRef]
  27. King, A.P.; Eckersley, R.J. Descriptive statistics II: Bivariate and multivariate statistics. In Statistics for Biomedical Engineers and Scientists; Academic Press: London, UK, 2019; pp. 23–56. [Google Scholar]
  28. Schober, P.; Boer, C.; Schwarte, L.A. Correlation coefficients: Appropriate use and interpretation. Anesth. Analg. 2018, 126, 1763–1768. [Google Scholar] [CrossRef]
  29. Alsaqr, A.M. Remarks on the use of Pearson’s and Spearman’s correlation coefficients in assessing relationships in ophthalmic data. Afr. Vis. Eye Health 2021, 80, 10. [Google Scholar] [CrossRef]
  30. Weber, M.M.; Stevens, R.D.; Diniz-Filho, J.A.F.; Grelle, C.E.V. Is there a correlation between abundance and environmental suitability derived from ecological niche modelling? A meta-analysis. Ecography 2017, 40, 817–828. [Google Scholar] [CrossRef]
  31. Tedoldi, D.; Kim, B.; Sandoval, S.; Forquet, N.; Tassin, B. Common mistakes and solutions for a better use of correlation-and regression-based approaches in environmental sciences. In Environmental Modelling & Software; Elsevier: Amsterdam, The Netherlands, 2025; p. 106526. [Google Scholar]
  32. Deng, J.; Deng, Y.; Cheong, K.H. Combining conflicting evidence based on Pearson correlation coefficient and weighted graph. Int. J. Intell. Syst. 2021, 36, 7443–7460. [Google Scholar] [CrossRef]
  33. Pasha, M.J.; Alharbi, B.H. Characterization of size–fractionated PM10 and associated heavy metals at two semi–arid holy sites during Hajj in Saudi Arabia. Atmos. Pollut. Res. 2015, 6, 162–172. [Google Scholar] [CrossRef]
  34. Morsy, E.; Habeebullah, T.M.; Othman, A. Assessing the air quality of megacities during the COVID-19 pandemic lockdown: A case study from Makkah City, Saudi Arabia. Arab. J. Geosci. 2021, 14, 548. [Google Scholar] [CrossRef]
  35. Al-Jeelani, H.A. Evaluation of air quality in the Holy Makkah during Hajj season 1425 H. J. Appl. Sci. Res. 2009, 5, 115–121. [Google Scholar]
  36. Habeebullah, T.M.; Munir, S.; Morsy, E.A.; Mohammed, A.M. Spatial and temporal analysis of air pollution in Makkah, the Kingdom of Saudi Arabia. In Proceedings of the 5th International Conference on Environmental Science and Technology, San Antonio, TX, USA, 12–16 July 2010; Volume 4618, pp. 65–70. [Google Scholar]
  37. Fallatah, A.; Imam, A. Detecting Land Surface Temperature Variations Using Earth Observation at the Holy Sites in Makkah, Saudi Arabia. Sustainability 2023, 15, 13355. [Google Scholar] [CrossRef]
  38. Mohammed, A.M.; Munir, S.A.I.D.; Habeebullah, T.M. Characterization of atmospheric aerosols in Makkah. Int. J. Agric. Environ. Res. 2015, 1, 1–18. [Google Scholar]
  39. Chowdhury, S.R.; ALKHAMMAS, F.; ALMSHAR, Z.; ALMADI, H. Air pollution from vehicles in Makkah, Saudi Arabia: Challenges and sustainable solutions. Mater. Res. Proc. 2025, 48, 634–642. [Google Scholar] [CrossRef]
  40. Tayan, O. A proposed model for optimizing the flow of pilgrims between Holy sites during Hajj using traffic congestion control. Proc. Int. J. Eng. Technol. 2010, 10, 55–59. [Google Scholar]
  41. Dasari, H.P.; Desamsetti, S.; Langodan, S.; Karumuri, R.K.; Singh, S.; Hoteit, I. Atmospheric conditions and air quality assessment over NEOM, kingdom of Saudi Arabia. Atmos. Environ. 2020, 230, 117489. [Google Scholar] [CrossRef]
  42. Rahman, J.; Thu, M.; Arshad, N.; Van der Putten, M. Mass gatherings and public health: Case studies from the Hajj to Mecca. Ann. Glob. Health 2017, 83, 386–393. [Google Scholar] [CrossRef] [PubMed]
  43. Nayebare, S.R.; Aburizaiza, O.S.; Khwaja, H.A.; Siddique, A.; Hussain, M.M.; Zeb, J.; Blake, D.R. Chemical characterization and source apportionment of PM2. 5 in Rabigh, Saudi Arabia. Aerosol Air Qual. Res. 2016, 16, 3114–3129. [Google Scholar] [CrossRef]
  44. Munir, S.; Habeebullah, T.M.; Seroji, A.R.; Morsy, E.A.; Mohammed, A.M.; Saud, W.A.; Awad, A.H. Modeling particulate matter concentrations in Makkah, applying a statistical modeling approach. Aerosol Air Qual. Res. 2013, 13, 901–910. [Google Scholar] [CrossRef]
  45. Othman, N.; Jafri, M.Z.M.; San, L.H. Estimating particulate matter concentration over arid region using satellite remote sensing: A case study in Makkah, Saudi Arabia. Mod. Appl. Sci. 2010, 4, 131. [Google Scholar] [CrossRef]
  46. Lihavainen, H.; Alghamdi, M.A.; Hyvärinen, A.; Hussein, T.; Neitola, K.; Khoder, M.; Abdelmaksoud, A.S.; Al-Jeelani, H.; Shabbaj, I.I.; Almehmadi, F.M. Aerosol Optical Properties at Rural Background Area in Western Saudi Arabia. Atmos. Res. 2017, 197, 370–378. [Google Scholar] [CrossRef]
  47. Khoder, M.I. Ambient levels of volatile organic compounds in the atmosphere of Greater Cairo. Atmos. Environ. 2007, 41, 554–566. [Google Scholar] [CrossRef]
  48. Shabbaj, I.I.; Alghamdi, M.A.; Shamy, M.; Hassan, S.K.; Alsharif, M.M.; Khoder, M.I. Risk assessment and implication of human exposure to road dust heavy metals in Jeddah, Saudi Arabia. Int. J. Environ. Res. Public Health 2018, 15, 36. [Google Scholar] [CrossRef]
  49. McCabe, M.; AlShalan, M.; Hejazi, M.; Beck, H.; Maestre, F.T.; Guirado, E.; Gallouzi, I.E. Climate Futures Report: Saudi Arabia in a 3 Degrees Warmer World. 2023. Available online: https://www.researchgate.net/publication/374632030_Climate_Futures_Report_Saudi_Arabia_in_a_3-degrees_warmer_world (accessed on 10 December 2024).
  50. Khan, M.; Tariq, S.; Haq, Z.U.; Rashid, M. Understanding the spatiotemporal distribution of aerosols and their association with natural and anthropogenic factors over Saudi Arabia using multi-sensor remote sensing data. Air Qual. Atmos. Health 2024, 17, 2365–2394. [Google Scholar] [CrossRef]
  51. Abdalmogith, S.S.; Harrison, R.M. An analysis of spatial and temporal properties of daily sulfate, nitrate and chloride concentrations at UK urban and rural sites. J. Environ. Monit. 2006, 8, 691–699. [Google Scholar] [CrossRef]
  52. Hussein, T.; Alghamdi, M.A.; Khoder, M.; AbdelMaksoud, A.S.; Al-Jeelani, H.; Goknil, M.K.; Hämeri, K. Particulate matter and number concentrations of particles larger than 0.25 µm in the urban atmosphere of Jeddah, Saudi Arabia. Aerosol Air Qual. Res. 2014, 14, 1383–1391. [Google Scholar] [CrossRef]
  53. Mashat, B.H. Bacterial and Chemical Contamination Associated Carpet Dust in the Holy Mosque, Makkah Al-Mukarramah. J. King Abdulaziz Univ. 2016, 26, 83–91. [Google Scholar]
  54. Seroji, A.R. Particulates in the atmosphere of Makkah and Mina Valley during the Ramadan and Hajj seasons of 2004 and 2005. In Air Pollution XIX; Brebbia, C.A., Longhurst, J.W.S., Popov, V., Eds.; Wessex Institute of Technology: Hampshire, UK, 2011; pp. 319–327. [Google Scholar]
  55. Alwadei, M.M. Air Pollution Climatology of Particulate Matter in Dammam, Saudi Arabia: Composition, Sources and Toxicity. Doctoral Thesis, University of Birmingham, Birmingham, UK, 2022. [Google Scholar]
  56. Al-Rashdi, A.; Ebqa’ai, M.; Harb, M.; Faidi, F. A solid phase extraction procedure for the determination of heavy metals in street dust from Dammam, Kingdom of Saudi Arabia and Estimation of the health risk. J. Mater. Environ. Sci 2017, 8, 2050–2061. [Google Scholar]
  57. Al-Hemoud, A.; Al-Dousari, A.; Al-Shatti, A.; Al-Khayat, A.; Behbehani, W.; Malak, M. Health impact assessment associated with exposure to PM10 and dust storms in Kuwait. Atmosphere 2018, 9, 6. [Google Scholar] [CrossRef]
  58. Parker, S.; Steffen, R.; Rashid, H.; Cabada, M.M.; Memish, Z.A.; Gautret, P.; Mahomed, O. Sacred journeys and pilgrimages: Health risks associated with travels for religious purposes. J. Travel Med. 2024, 31, taae122. [Google Scholar] [CrossRef]
  59. Zhao, S.; Feng, T.; Xiao, W.; Zhao, S.; Tie, X. Weather-climate anomalies and regional transport contribute to air pollution in northern China during the COVID-19 lockdown. J. Geophys. Res. Atmos. 2022, 127, e2021JD036345. [Google Scholar] [CrossRef]
  60. Shaheed, S.H.; Ghawi, A.H.; Al-Obaedi, J.T.S. Air pollution assessment at University of Al-Qadisiyah associated with traffic from neighbouring roads. In Journal of Physics: Conference Series; IOP Publishing: Bristol, UK, 2021; Volume 1895, p. 012034. [Google Scholar]
  61. Perrino, C.; Canepari, S.; Catrambone, M.; Dalla Torre, S.; Rantica, E.; Sargolini, T. Influence of natural events on the concentration and composition of atmospheric particulate matter. Atmos. Environ. 2009, 43, 4766–4779. [Google Scholar] [CrossRef]
  62. Osra, F.A.; Alzahrani, J.S.; Alsoufi, M.S.; Osra, O.A.; Mirza, A.Z. Environmental and economic sustainability in the Hajj system. Arab. J. Geosci. 2021, 14, 2121. [Google Scholar] [CrossRef]
  63. Bhuiyan, M.M.H.; Siddique, Z. Hydrogen as an alternative fuel: A comprehensive review of challenges and opportunities in production, storage, and transportation. Int. J. Hydrogen Energy 2025, 102, 1026–1044. [Google Scholar] [CrossRef]
  64. Kamga, C.; Miller, B.; Spertus, J.; Douglass, L.; Ross, B.; Eickemeyer, P. A Study of the Feasibility of Pneumatic Transport of Municipal Solid Waste and Recyclables in Manhattan Using Existing Transportation Infrastructure (No. C-10-21); New York State Energy Research and Development Authority: New York, NY, USA, 2013. [Google Scholar]
  65. Yezli, S.; Ehaideb, S.; Yassin, Y.; Alotaibi, B.; Bouchama, A. Escalating climate-related health risks for Hajj pilgrims to Mecca. J. Travel Med. 2024, 31, taae042. [Google Scholar] [CrossRef] [PubMed]
  66. Lihavainen, H.; Alghamdi, M.A.; Hyvärinen, A.P.; Hussein, T.; Aaltonen, V.; Abdelmaksoud, A.S.; Hämeri, K. Aerosols physical properties at Hada Al Sham, western Saudi Arabia. Atmos. Environ. 2016, 135, 109–117. [Google Scholar] [CrossRef]
  67. Ding, J.; Dai, Q.; Zhang, Y.; Xu, J.; Huangfu, Y.; Feng, Y. Air humidity affects secondary aerosol formation in different pathways. Sci. Total Environ. 2021, 759, 143540. [Google Scholar] [CrossRef]
  68. Tsiouri, V.; Kakosimos, K.E.; Kumar, P. Concentrations, sources and exposure risks associated with particulate matter in the Middle East Area—A review. Air Qual. Atmos. Health 2015, 8, 67–80. [Google Scholar] [CrossRef]
  69. Rushdi, A.I.; Al-Mutlaq, K.F.; Al-Otaibi, M.; El-Mubarak, A.H.; Simoneit, B.R. Air quality and elemental enrichment factors of aerosol particulate matter in Riyadh City, Saudi Arabia. Arab. J. Geosci. 2013, 6, 585–599. [Google Scholar] [CrossRef]
  70. Rehan, M.; Munir, S. Analysis and Modeling of Air Pollution in Extreme Meteorological Conditions: A Case Study of Jeddah, the Kingdom of Saudi Arabia. Toxics 2022, 10, 376. [Google Scholar] [CrossRef]
  71. Anil, I.; Alagha, O. The impact of COVID-19 lockdown on the air quality of Eastern Province, Saudi Arabia. Air Qual. Atmos. Health 2021, 14, 117–128. [Google Scholar] [CrossRef] [PubMed]
  72. Orif, M.I.; El-Shahawi, M.S.; Ismail, I.M.; Rushdi, A.; Alshemmari, H.; El-Sayed, M.A. An extensive assessment on the distribution pattern of organic contaminants in the aerosols samples in the Middle East. Open Chem. 2022, 20, 1566–1574. [Google Scholar] [CrossRef]
  73. Vithanage, M.; Mayakaduwage, S.S.; Gunarathne, V.; Rajapaksha, A.U.; Ahmad, M.; Abduljabbar, A.; Ok, Y.S. Animal carcass burial management: Implications for sustainable biochar use. Appl. Biol. Chem. 2021, 64, 91. [Google Scholar] [CrossRef]
  74. Al-Dabbous, A.N.; Kumar, P. Source apportionment of airborne nanoparticles in a Middle Eastern city using positive matrix factorization. Environ. Sci. Process. Impacts 2015, 17, 802–812. [Google Scholar] [CrossRef] [PubMed]
  75. Khodeir, M.; Shamy, M.; Alghamdi, M.; Zhong, M.; Sun, H.; Costa, M.; Maciejczyk, P. Source apportionment and elemental composition of PM2. 5 and PM10 in Jeddah City, Saudi Arabia. Atmos. Pollut. Res. 2012, 3, 331–340. [Google Scholar] [CrossRef]
  76. Habeebullah, T.M. Assessment of ground-level ozone pollution with monitoring and modelling approaches in Makkah, Saudi Arabia. Arab. J. Geosci. 2020, 13, 1164. [Google Scholar] [CrossRef]
  77. Amato, F.; Padoan, E. Road dust emissions: Impact on air quality and health and possible mitigation. In Scientific Research Abstracts; Digilabs: Bari, Italy, 2018; Volume 8, p. 5. [Google Scholar]
  78. Hassan, H.; Saraga, D.; Kumar, P.; Kakosimos, K.E. Vehicle-induced fugitive particulate matter emissions in a city of arid desert climate. Atmos. Environ. 2020, 229, 117450. [Google Scholar] [CrossRef]
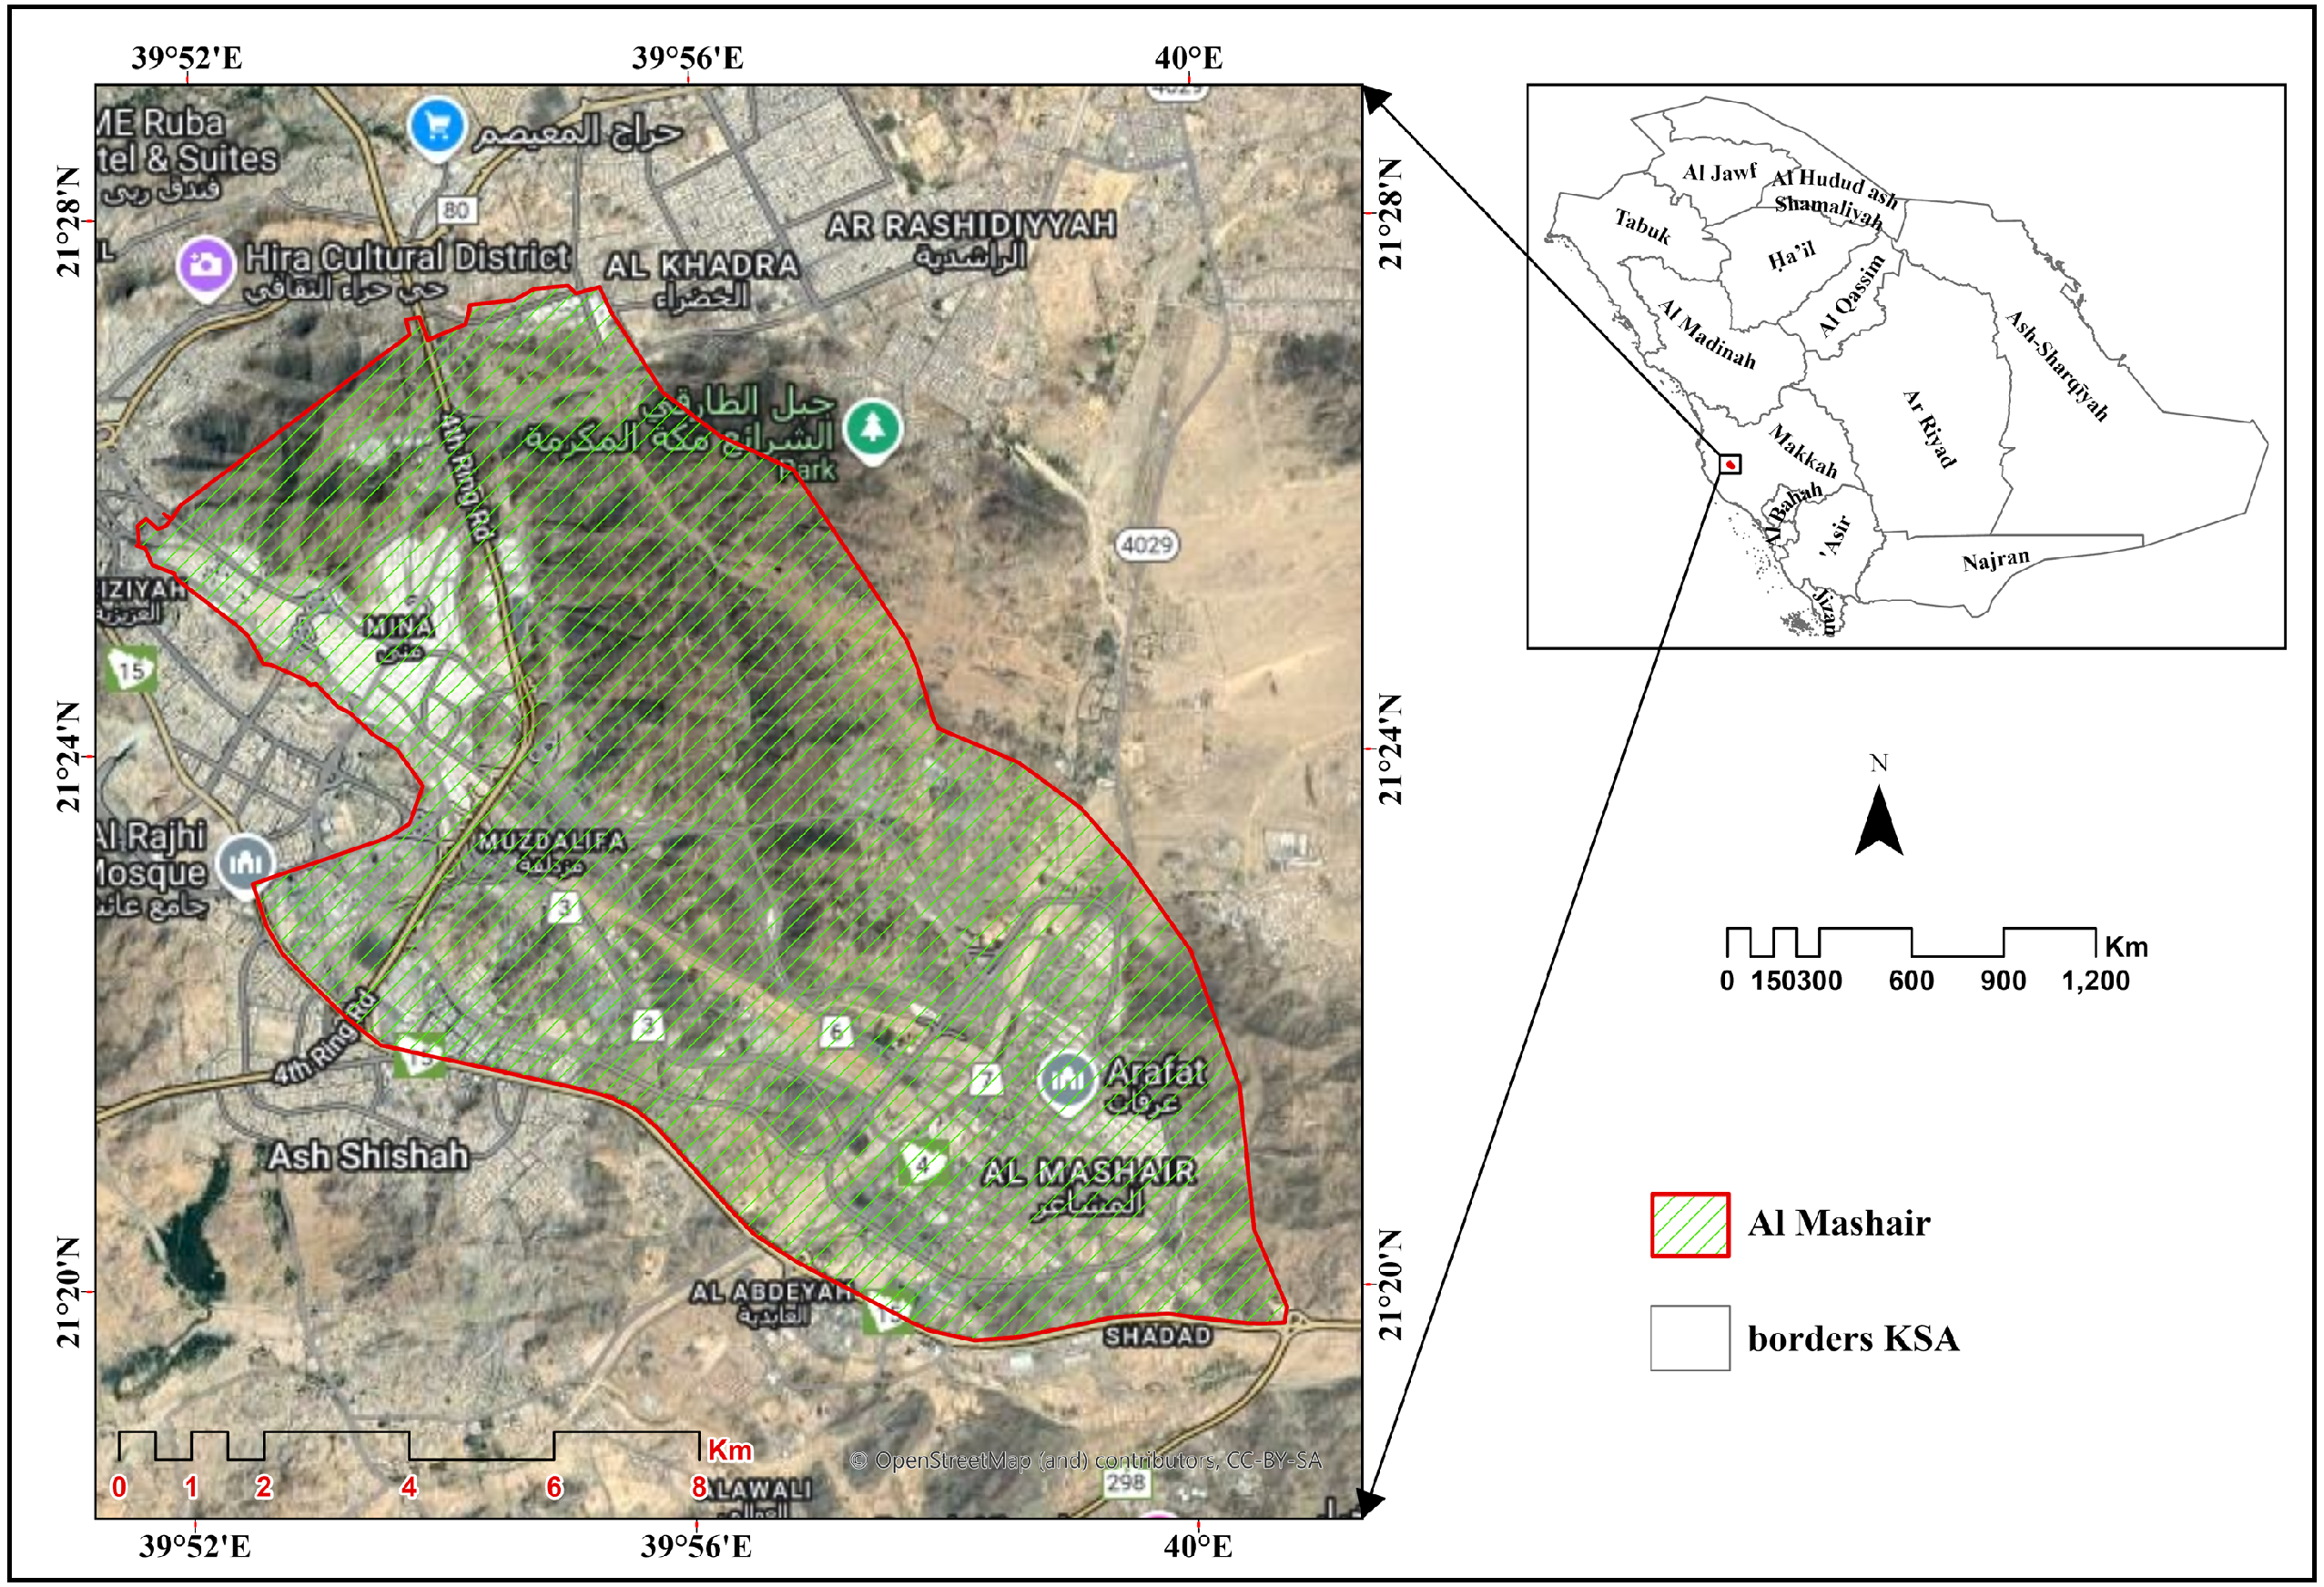
Figure 1. Location of study area, Makkah, Saudi Arabia.
Atmosphere 16 01025 g001
Figure 2. Spatial Distribution of Sampling Points Generated from Resampled Air Quality Raster Data within the Study Area.
Atmosphere 16 01025 g002
Figure 3. Spatiotemporal changes in NO2 concentrations at the holy sites in Makkah before the Hajj season (a) 2023, (b) 2024, and during the Hajj season (c) 2023, (d) 2024.
Atmosphere 16 01025 g003
Figure 4. Spatiotemporal changes in CO concentrations at the holy sites in Makkah before the Hajj season (a) 2023, (b) 2024, and during the Hajj season (c) 2023, (d) 2024.
Atmosphere 16 01025 g004
Figure 5. Spatiotemporal changes in SO2 concentrations at the holy sites in Makkah before the Hajj season (a) 2023, (b) 2024, and during the Hajj season (c) 2023, (d) 2024.
Atmosphere 16 01025 g005
Figure 6. Spatiotemporal changes in HCHO concentrations at the holy sites in Makkah before the Hajj season (a) 2023, (b) 2024, and during the Hajj season (c) 2023, (d) 2024.
Atmosphere 16 01025 g006
Figure 7. Spatiotemporal changes in Aerosol at the holy sites in Makkah before the Hajj season (a) 2023, (b) 2024, and during the Hajj season (c) 2023, (d) 2024.
Atmosphere 16 01025 g007
Figure 8. Pearson correlation matrix between air quality variables, (a) before and, (b) during the 2023 Hajj season.
Atmosphere 16 01025 g008
Figure 9. Pearson correlation matrix between air quality variables, (a) before and (b) during the 2024 Hajj season.
Atmosphere 16 01025 g009
Figure 10. Scatter Plot Matrix of Meteorological and Air Quality Variable Relationships During Hajj 2024 Season.
Atmosphere 16 01025 g010
Figure 11. Observed examples of air pollution (aerosol) across Makkah, showing affected areas including (a) Al-Ma’isem slaughterhouses, (b) Muzdalifah parking lots, (c) Al-Ma’isem motorcycle reservation, (d) waste transfer station, and (e) Al-Wadi Al-Akhdar parking lots in Arafat (satellite imagery), are areas that experience seasonal heavy traffic and activity, particularly during peak periods like the Hajj.
Atmosphere 16 01025 g011
Table 1. Air Quality and Meteorological datasets.
DatasetVariablesPeriod
(During)
Period
(Before)
Temporal ResolutionSpatial ResolutionSource
Sentinel-5PNO2, Aerosol, CO, SO2, HCHO26 June to 1 July 2023; 14–19 June 202426 March to 1 April 2023; 14–19 March 20242 Days~1.1 kmhttps://developers.google.com/earth-engine/datasets/catalog/sentinel-5p (accessed on 12 December 2024)
ERA5-LandWind Speed and Direction, Temperature, Relative Humidity26 June to 1 July 2023; 14–19 June 2024-Hourly~11 kmhttps://developers.google.com/earth-engine/datasets/catalog/ECMWF_ERA5_LAND_HOURLY (accessed on 5 August 2025)
Table 2. Statistical Relationships Between Air Quality Variables Before and During Hajj Season 2023.
Var1Var2r_Beforer_During
AerosolNO20.70.19
AerosolCO0.62−0.29
AerosolSO2−0.280.11
AerosolHCHO−0.23−0.17
NO2CO0.610.22
NO2SO20.160.11
NO2HCHO−0.090.08
HCHOSO20.49−0.23
HCHOCO−0.17−0.33
SO2CO0.050.42
Values in bold are different from 0 with a significance level alpha = 0.05.
Table 3. Statistical Relationships Between Air Quality Variables Before and During Hajj Season 2024.
Var1Var2r_Beforer_During
AerosolNO20.09−0.25
AerosolCO−0.25−0.21
AerosolSO2−0.07−0.39
AerosolHCHO−0.23−0.5
NO2CO−0.420.01
NO2SO2−0.740.35
NO2HCHO−0.570.04
HCHOSO20.420.29
HCHOCO0.590.15
SO2CO0.480.25
Values in bold are different from 0 with a significance level alpha = 0.05.
Table 4. The Relationships between Meteorological and Air Quality Variable During Hajj 2024.
VariablesWindspeedWind DirectionTemperatureHumidityAerosol_HCHONO2SO2CO
Wind speed1
Wind direction0.4791
Temperature−0.746−0.7881
Humidity0.4550.273−0.6561
Aerosol_−0.041−0.096−0.0400.3741
HCHO0.088−0.2080.056−0.180−0.4951
NO20.3470.449−0.3800.052−0.2490.0421
SO20.0580.036−0.0900.107−0.3900.2940.3471
CO0.3450.395−0.3770.111−0.2110.1490.0060.2491
Values in bold are different from 0 with a significance level alpha = 0.05.
Disclaimer/Publisher’s Note: The statements, opinions and data contained in all publications are solely those of the individual author(s) and contributor(s) and not of MDPI and/or the editor(s). MDPI and/or the editor(s) disclaim responsibility for any injury to people or property resulting from any ideas, methods, instructions or products referred to in the content.