Article

Lake-Effect Snowfall Climatology over Lake Champlain: A Comparative Analysis of the 2015–2024 and 1997–2006 Periods

School of Marine and Atmospheric Sciences, Stony Brook University, Stony Brook, NY 11794, USA
*
Author to whom correspondence should be addressed.
Atmosphere 2025, 16(9), 1011; https://doi.org/10.3390/atmos16091011
Submission received: 28 May 2025 / Revised: 19 August 2025 / Accepted: 21 August 2025 / Published: 28 August 2025
(This article belongs to the Section Climatology)

Abstract

This study updates the climatology of lake-effect (LE) snowfall over Lake Champlain by analyzing radar and surface data from nine winter seasons spanning 2015 to 2024. A filtering approach was applied to isolate periods with favorable LE conditions, and events were manually classified using criteria consistent with a previous climatology from 1997 to 2006. A total of 64 LE events were identified and compared across the two periods to evaluate potential changes associated with regional warming. Despite a substantial reduction in lake ice cover during the recent decades, no increase in LE frequency or duration was observed. Instead, warming has shifted the seasonal distribution of events, with fewer early-season cases and more late-season occurrences. LE events also exhibited shorter durations and higher minimum temperatures and dew points. These findings suggest that warming may constrain LE snowfall development over small lakes such as Champlain, in contrast to intensification trends reported for larger lake systems. The analysis also highlights a rarely documented transitional band type that migrated along the lake axis during synoptic shifts. Results underscore the value of observational climatologies for detecting emerging snowfall behaviors in response to climate variability.

1. Introduction

Lake-effect (LE) snowfall is a localized winter weather phenomenon that occurs when cold air masses pass over relatively warmer lake water surfaces, acquiring heat and moisture that are then released as snowfall downwind [1,2,3,4,5]. These events can produce intense, narrow snowfall bands and have substantial implications for regional snow totals, transportation, and winter hazard management [6,7,8,9,10]. As such, understanding the behavior of LE snowfall and its response to climate variability and change is essential for both scientific insight and practical forecasting [2,3,11,12,13,14].
The North American Great Lakes have been the focus of most LE snowfall research, as their expansive surface areas and long fetches contribute to extreme events during cool seasons [15,16,17,18,19]. Furthermore, recent studies have highlighted that warmer winters over the Great Lakes tend to delay icing or reduce lake ice cover [20], allowing more frequent LE episodes earlier in the season, particularly in November and December, when the lakes remain unfrozen and cold-air outbreaks are still common [5,21,22]. However, these same warming trends may suppress LE activity later in the season by reducing the severity and frequency of favorable synoptic conditions or by weakening the lake–air temperature contrast [4,12,22].
Smaller lakes, including small-to-mid-sized and shallow ones, have been studied less extensively for lake-effect snowfall in the context of climate change, despite growing evidence that they too tend to experience reduced ice cover under warming climate conditions [13]. Research on such systems, including the Great Salt Lake [17,23,24,25], Lake Erie [21], the Finger Lakes [26,27,28,29], Lake Tahoe, and Pyramid Lake [30], and those in Arkansas [31], indicates that these water bodies can actively support LE snowfall. However, their dynamics often differ considerably from those over the Great Lakes due to shorter fetch lengths, lower heat capacity, and more complex orography [11,17,30]. These smaller and mid-sized lakes may therefore provide important insights into how LE processes function in marginal environments as climate change continues to alter thermodynamic and synoptic conditions [5,13,21,22,32].
This study focuses on Lake Champlain, a long (193 km), narrow lake that reaches a maximum width of 19 km near the city of Burlington on the eastern shore. It is a small-sized lake (≤1500 km2) located in the Champlain Valley between Vermont and New York [33]. Bordered by the Green Mountains to the east and the Adirondack High Peaks to the west, the lake’s topographic setting helps channel synoptic winds along its axis, creating favorable conditions for lake-effect snowband development [34], particularly over the uninterrupted central section between Cumberland Bay and Hawkins Bay [35]. For example, a notably well-defined north–south-oriented snowband developed over Lake Champlain in January 2003, attributed to a combination of favorable mesoscale and synoptic-scale conditions aligned parallel to the lake axis, similar to those observed over Lake Ontario [36,37]. However, not all sections of the lake contribute equally to LE snowfall, due to its irregular shape and the presence of large islands, such as North and South Hero, in the northern basin. As a result, the majority of LE events occur over the 55 km uninterrupted stretch between Cumberland Bay and Hawkins Bay [8]. Although Lake Champlain reaches a maximum depth of 120 m, its average depth is only 20 m [35], which has historically allowed the lake to freeze over during most winters.
The long-term climatology of LE precipitation events over Lake Champlain was previously developed by [8]. Their analysis covered nine cool seasons (October–March) from 1997 to 2006, a period when systematic radar and surface observations were relatively complete and readily available. These data were used to characterize the frequency, duration, thermal structure, and synoptic conditions of LE events, outlining statistical distributions for temperature, lake–air temperature difference, dew point temperatures, and winds. A total of 67 events were identified, classified into distinct types, and linked to prevailing wind regimes. Several noteworthy findings emerged, including peak activity in January under southerly wind conditions, a clear diurnal cycle for most events, anomalously high lake–air temperature differences, and upper-level environmental characteristics. These results provided valuable baseline statistics for understanding LE snowfall in the region. However, they may no longer reflect current conditions, as studies in other small- to mid-sized lake regions have documented shifts in seasonal timing [38], reduced lake ice persistence [13], and increased marginal LE environments under regional warming [5]. An updated climatology for the past decade is therefore needed to assess whether and how LE snowfall over Lake Champlain is being affected by ongoing climate change.
The goal of this study is to update the LE snowfall climatology over Lake Champlain for the 2015–2024 period, using radar and surface data and applying the same classification framework as the earlier work [8]. This approach allows for direct comparison across decades to assess whether event frequency, timing, and structure have shifted under regional climate change. We hypothesize that although warming has reduced lake ice extent, it may not have amplified LE activity—instead, it may have altered its timing and spatial behavior. The results reveal a shift toward later-season events, overall stability in frequency, and the emergence of a transitional band type migrating along the lake axis. These findings offer new observational insight into how LE snowfall over small lakes may respond to continued warming.

2. Materials and Methods

This study integrates radar, surface, and lake data to classify and analyze LE snowfall events. The following subsections describe the classification criteria, observational sources, filtering methods, and visualization tools used to characterize LE behavior over the 2015–2024 period.

2.1. Radar and Event Classification

A variety of modern methods are used to monitor and identify lake-effect (LE) clouds and snowbands, including radar, surface weather stations, and sometimes aircraft observations [39]. In this study, Level II radar data were obtained from the NEXRAD WSR-88D site KCXX, selected for its proximity to Lake Champlain and ability to detect the lowest levels of the boundary layer, where LE processes typically develop. Data were retrieved from the National Climatic Data Center (NCDC) for nine winter seasons spanning 2015/2016 to 2023/2024. Radar reflectivity loops were processed using the NOAA Weather and Climate Toolkit. Mild smoothing and 20% opacity were applied to enhance the identification of snowband positioning relative to the lake surface.
LE events were classified according to their structure and origin, following a scheme adapted from [8]. “North” events formed under northerly flow and extended southward over the lake, while “South” events developed under southerly flow and extended northward. Bands with slight azimuthal offsets from due north or south were retained in their respective categories to avoid excessive granularity. These classifications were based primarily on the spatial orientation of radar-observed snowbands, interpreted in conjunction with the prevailing low-level wind direction at KBTV at the time of event onset. North-type events were typically associated with wind directions from 300° to 45°, while South-type events corresponded to winds from approximately 120° to 240°, consistent with the lake’s topographic alignment and prior studies [8,30]. While the broader wind direction thresholds used in the filtering step (Section 2.4)—22.5–337.5° for general LE alignment—helped reduce the candidate day pool, final classification was based on radar-confirmed snowband geometry and not filtering thresholds alone.
Subtypes included transitional (NorthTRAN and SouthTRAN), where events evolved from broader synoptic systems, and synoptic (NorthSYNOP and SouthSYNOP), where bands maintained mesoscale structure while embedded in transient synoptic environments. A rare “North–South” category was also defined for bands that transitioned directionally during the event due to shifting wind regimes.
North-type events typically formed under cold, dry, continental air masses and extended southward across the uninterrupted mid-lake stretch. South-type events occurred under warmer, moister conditions and extended northward, often influenced by broader synoptic systems. Subcategories included:
  • Transitional events (NorthTRAN and SouthTRAN): evolved from broader synoptic systems into narrow bands with distinct LE features;
  • Synoptic events (NorthSYNOP and SouthSYNOP): maintained mesoscale structure while embedded within transient synoptic environments;
  • North–South events: rare cases in which band orientation transitioned from northward to southward or vice versa due to shifting wind regimes.
Four major LE event types are illustrated in Figure 1.
Events were retained for analysis if they: (1) remained at least partially stationary over the lake during development, (2) could be clearly distinguished from transient or widespread synoptic precipitation, (3) initiated over the lake and extended downwind.

2.2. Surface Observations

Surface meteorological data were acquired from KBTV (Patrick Leahy Burlington International Airport) via the NCDC. Variables used in both event classification and filtering included: wind direction and speed of the fastest 2 min wind (WDF2, WSF2), mean sea-level pressure (ASLP), dew point temperature (ADPT), and minimum daily temperature (TMIN). These observations were used to assess synoptic support and thermodynamic conditions for each candidate event day.

2.3. Lake Temperature and Ice Cover

Lake temperature data were obtained from a U.S. Geological Survey (USGS) sensor located 88 feet below the surface near Burlington. This sensor has operated continuously since 2014 under the ECHO Center for Lake Champlain. Due to the nearly isothermal winter structure of Lake Champlain [34], deep-water temperatures are reasonable proxies for surface temperature during LE conditions.
Areal lake ice cover data were unavailable. Instead, official ice closure dates reported by the National Weather Service in Burlington were used to define full freeze-over conditions. Only one complete lake freeze occurred during the study period—on 8 March 2019.

2.4. Event Filtering Criteria

To reduce the number of days requiring manual radar inspection, a climatology-based filter was applied to identify conditions favorable for LE formation. Of the 1629 total days in the cool-season months (October–March, 2015–2024), the filter reduced the dataset to 241 candidate days—a reduction of more than 85%. Candidate days were retained if the following conditions were met:
  • Wind direction (WDF2) was within 22.5–337.5° (excluding easterly winds);
  • Wind speed (WSF2) was less than or equal to 11.5 m/s;
  • Minimum Temperature (TMIN) satisfied: −34 °C ≤ TMIN ≤ −5 °C;
  • Dew point (ADPT) satisfied: −34 °C ≤ ADPT ≤ −4 °C;
  • Mean sea-level pressure (ASLP) satisfied: 1010 hPa ≤ ASLP ≤ 1044 hPa.
These filtering thresholds are consistent with the earlier LE climatology over Lake Champlain [8] and reflect the typical thermal and synoptic conditions supportive of LE snowfall [13,21,30]. They effectively captured the range of thermodynamic and synoptic conditions historically associated with LE events. While a small number of cases may fall outside these ranges (e.g., under easterly or westerly flow), such events are rare and not representative of broader LE climatology. A discussion of possible exclusions and limitations is included in Section 4.

2.5. Visualization and Statistical Tools

All graphics and analysis tools were implemented in Python 3.12.7 using Jupyter Notebook 7.2.2. The following visualizations were generated to examine event frequency, timing, and characteristics by LE type:
  • Wind roses based on the highest daily 2 min sustained wind, with a maximum wind speed value of 9.8 m/s;
  • Box-and-whisker plots showing distributions of key variables, including minimum temperature, dew point, and pressure. These plots display the mean (orange line), interquartile range (box), whiskers (1.5× IQR), and outliers (open circles);
  • Event timelines indicating the seasonal distribution and interannual frequency of LE events.
Comparisons between the 1997–2006 and 2015–2024 periods were based on descriptive statistics. Box-and-whisker plots were used to visualize distributions of key variables across event types, showing the median, spread, and outliers. This non-parametric approach avoids assumptions about data distribution and was chosen to accommodate small sample sizes in some subcategories.
A schematic diagram summarizing the full LE snowfall analysis workflow is provided in Figure 2, illustrating the sequence from data sources through filtering, classification, and statistical analysis.

3. Results

This section presents the results of the updated LE snowfall climatology, based on 64 events identified during the 2015–2024 period. Comparisons are made with the 1997–2006 period to evaluate frequency, timing, duration, and thermal and synoptic characteristics.

3.1. Event Classification and Frequency

A total of 64 lake-effect (LE) events were identified across the 2015–2024 study period, slightly smaller than that in 1997–2006 [8]. A summary of identified events is provided in Table 1.
Of the 64 total events, 46 (~72%) were classified as North-type, including 28 regular (~44%), 11 transitional (~17%), and 7 synoptic (~11%) cases. This proportion is comparable to the 1997–2006 period, during which 70% (47 of 67 events) were North-type. South-type events accounted for 16 cases (~25%), comprising 12 regular (~19%), 2 transitional (~3%), and 2 synoptic (~3%) events. Two events (~3%) exhibited a North–South transition and were categorized separately due to their bidirectional evolution.
The interannual distribution of LE events is shown in Figure 3. Variability ranged from a minimum of 3 events in the 2016–2017 and 2023–2024 seasons to a maximum of 10 events in 2017–2018 and 2019–2020. The frequency of LE events varied widely from year to year during the 2015–2024 period, with annual totals ranging from 1 to 10 events, consistent with the 1997–2006 period [8]. However, several recent winters with above-freezing seasonal temperatures (e.g., 2020 and 2023) produced only one or two events, suggesting that interannual variability is increasingly modulated by marginal thermodynamic conditions.

3.2. Event Duration and Timing

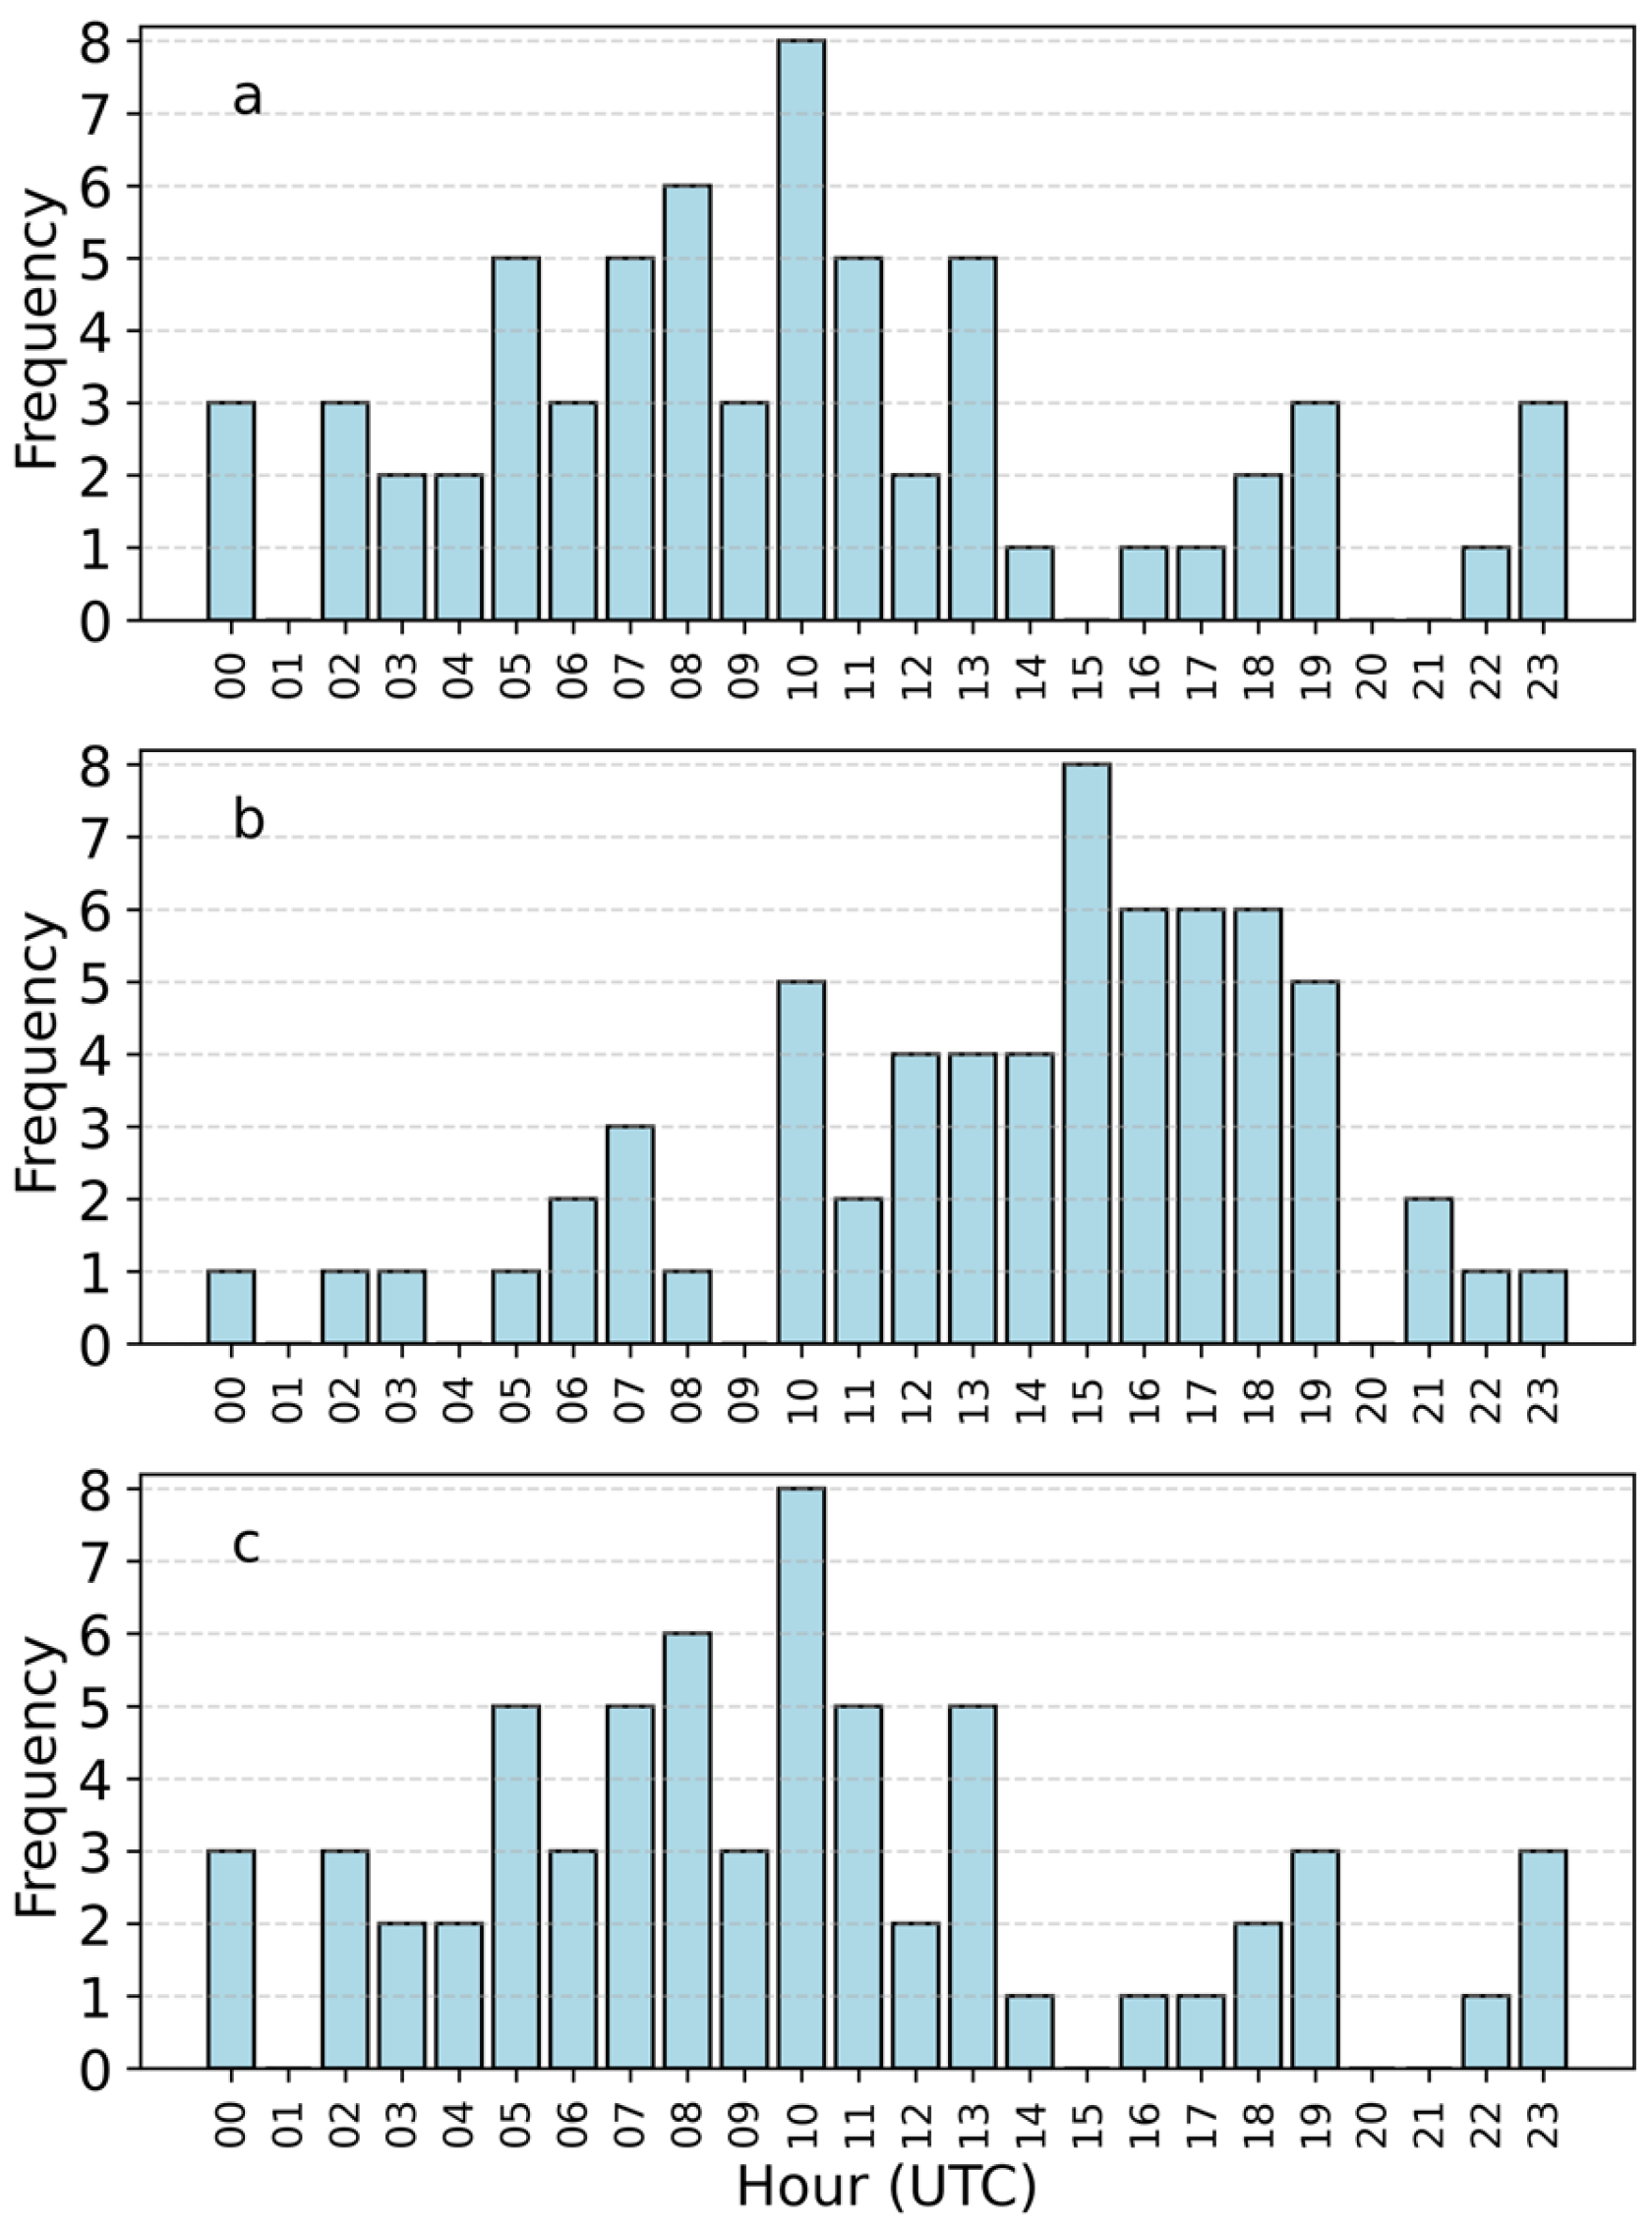
Most events (81%) began between 0000 and 1400 UTC, with a peak frequency at 1000 UTC (Figure 4a). This timing corresponds to the typical daily minimum air temperature, maximizing the lake–air temperature gradient under the assumption of minimal diurnal lake cooling. The majority of events (78%) ended between 1000 and 1900 UTC, reflecting a typical decay period under daytime warming (Figure 4b). This strong diurnal modulation is consistent with LE behavior observed over both large and small lakes [7,8].
The average duration of LE events was 7.9 h (Figure 4c). The shortest events lasted between one and two hours, while the longest—typically synoptic or transitional—ranged from 11 to 14 h. The three longest cases included one North–South event and two NorthSYNOP events. A fourth-longest event, also classified as North–South, supports the designation of this rare category as associated with prolonged evolution, likely due to shifting wind regimes.

3.3. Seasonal Timing and Lake Ice Effects

The annual average was seven LE events per season. The coldest years—2017–2018 and 2019–2020—recorded the highest number of events (10 each), while the warmest years (2016–2017 and 2023–2024) yielded the fewest (three each). Notably, 2018–2019, the only year with full lake ice closure, recorded seven LE events and the lowest average winter temperature (−1.15 °C). All seven events occurred prior to the complete lake freeze-over on 8 March 2019, during a period when sufficient open water remained to support LE development. No events were observed after full ice coverage. This pattern supports the concept of diminishing returns in LE production as lake ice increases [20].
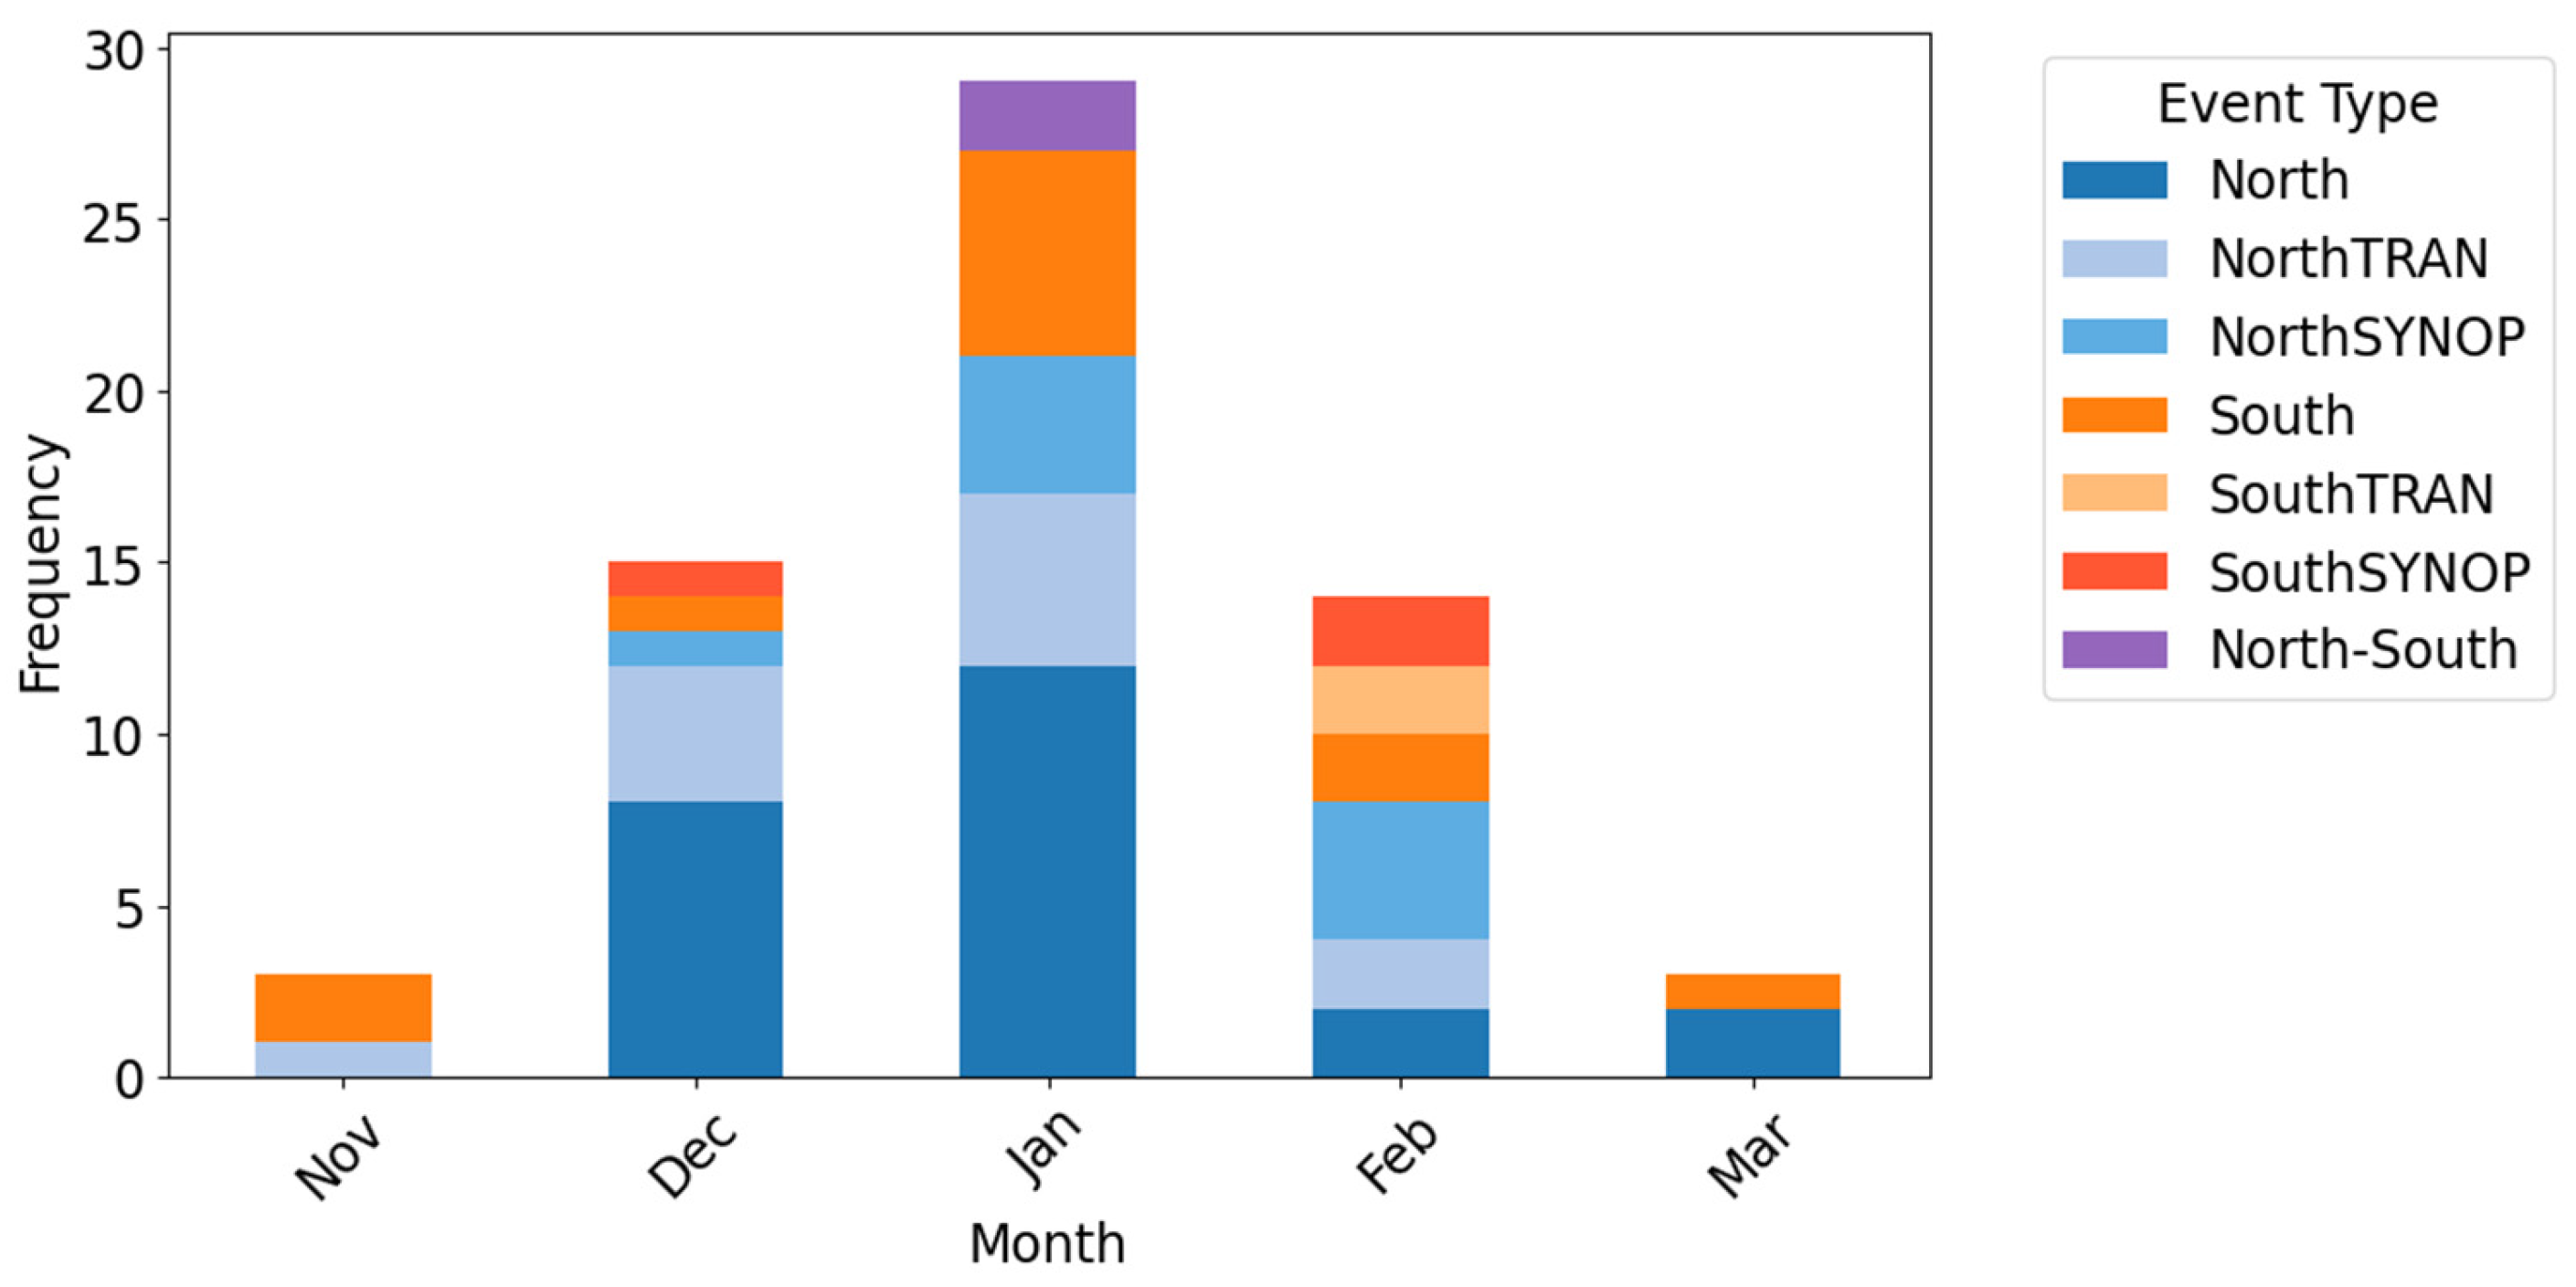
The monthly distribution of events (Figure 5) followed a near-normal curve centered on January, which accounted for 29 events (~45%). This peak month matches the distribution observed during the 1997–2006 period [8], in which 45% of events also occurred in January and 9% in February. In comparison, the 2015–2024 period recorded 42% of events in January and 14% in February, suggesting a modest shift toward later-season activity. December followed with 15 events (~23%), February with 14 (~22%), and both November and March with 3 events each (~5%). No single month showed a clear preference for any specific LE event type.

3.4. Thermal Characteristics

Temperature characteristics varied by LE event type, but all events occurred below the −5 °C threshold used in event filtering (Figure 6). The warmest average temperatures were observed during NorthSYNOP events (−10 °C), followed by South (−12 °C), North (−13 °C), NorthTRAN (−17 °C), SouthTRAN (−20 °C), and SouthSYNOP (−21 °C). While the extremely cold averages for SouthTRAN and SouthSYNOP are notable, they are based on small sample sizes (n = 2 each) and should be interpreted with caution.
The coldest recorded LE event temperature was −26 °C during a NorthSYNOP case in the December 2017–2018 Arctic outbreak, somewhat higher than the KBTV observed record of −29 °C. Several other events occurred near −22 °C, indicating LE processes persist during substantial Arctic intrusions. Four events occurred at exactly −5 °C, the filtering threshold, suggesting a few marginal LE cases may have been excluded. However, given that most events occurred well below this level and that snowfall above 0 °C is rare, the impact of these exclusions on climatology is likely minimal.
North-type events were the most frequent and exhibited the widest temperature range. The remaining types exhibited progressively narrower spreads, generally corresponding to smaller sample sizes: South, NorthTRAN, NorthSYNOP, SouthTRAN, and SouthSYNOP, in that order (Figure 6).

3.5. Dew Point Temperature

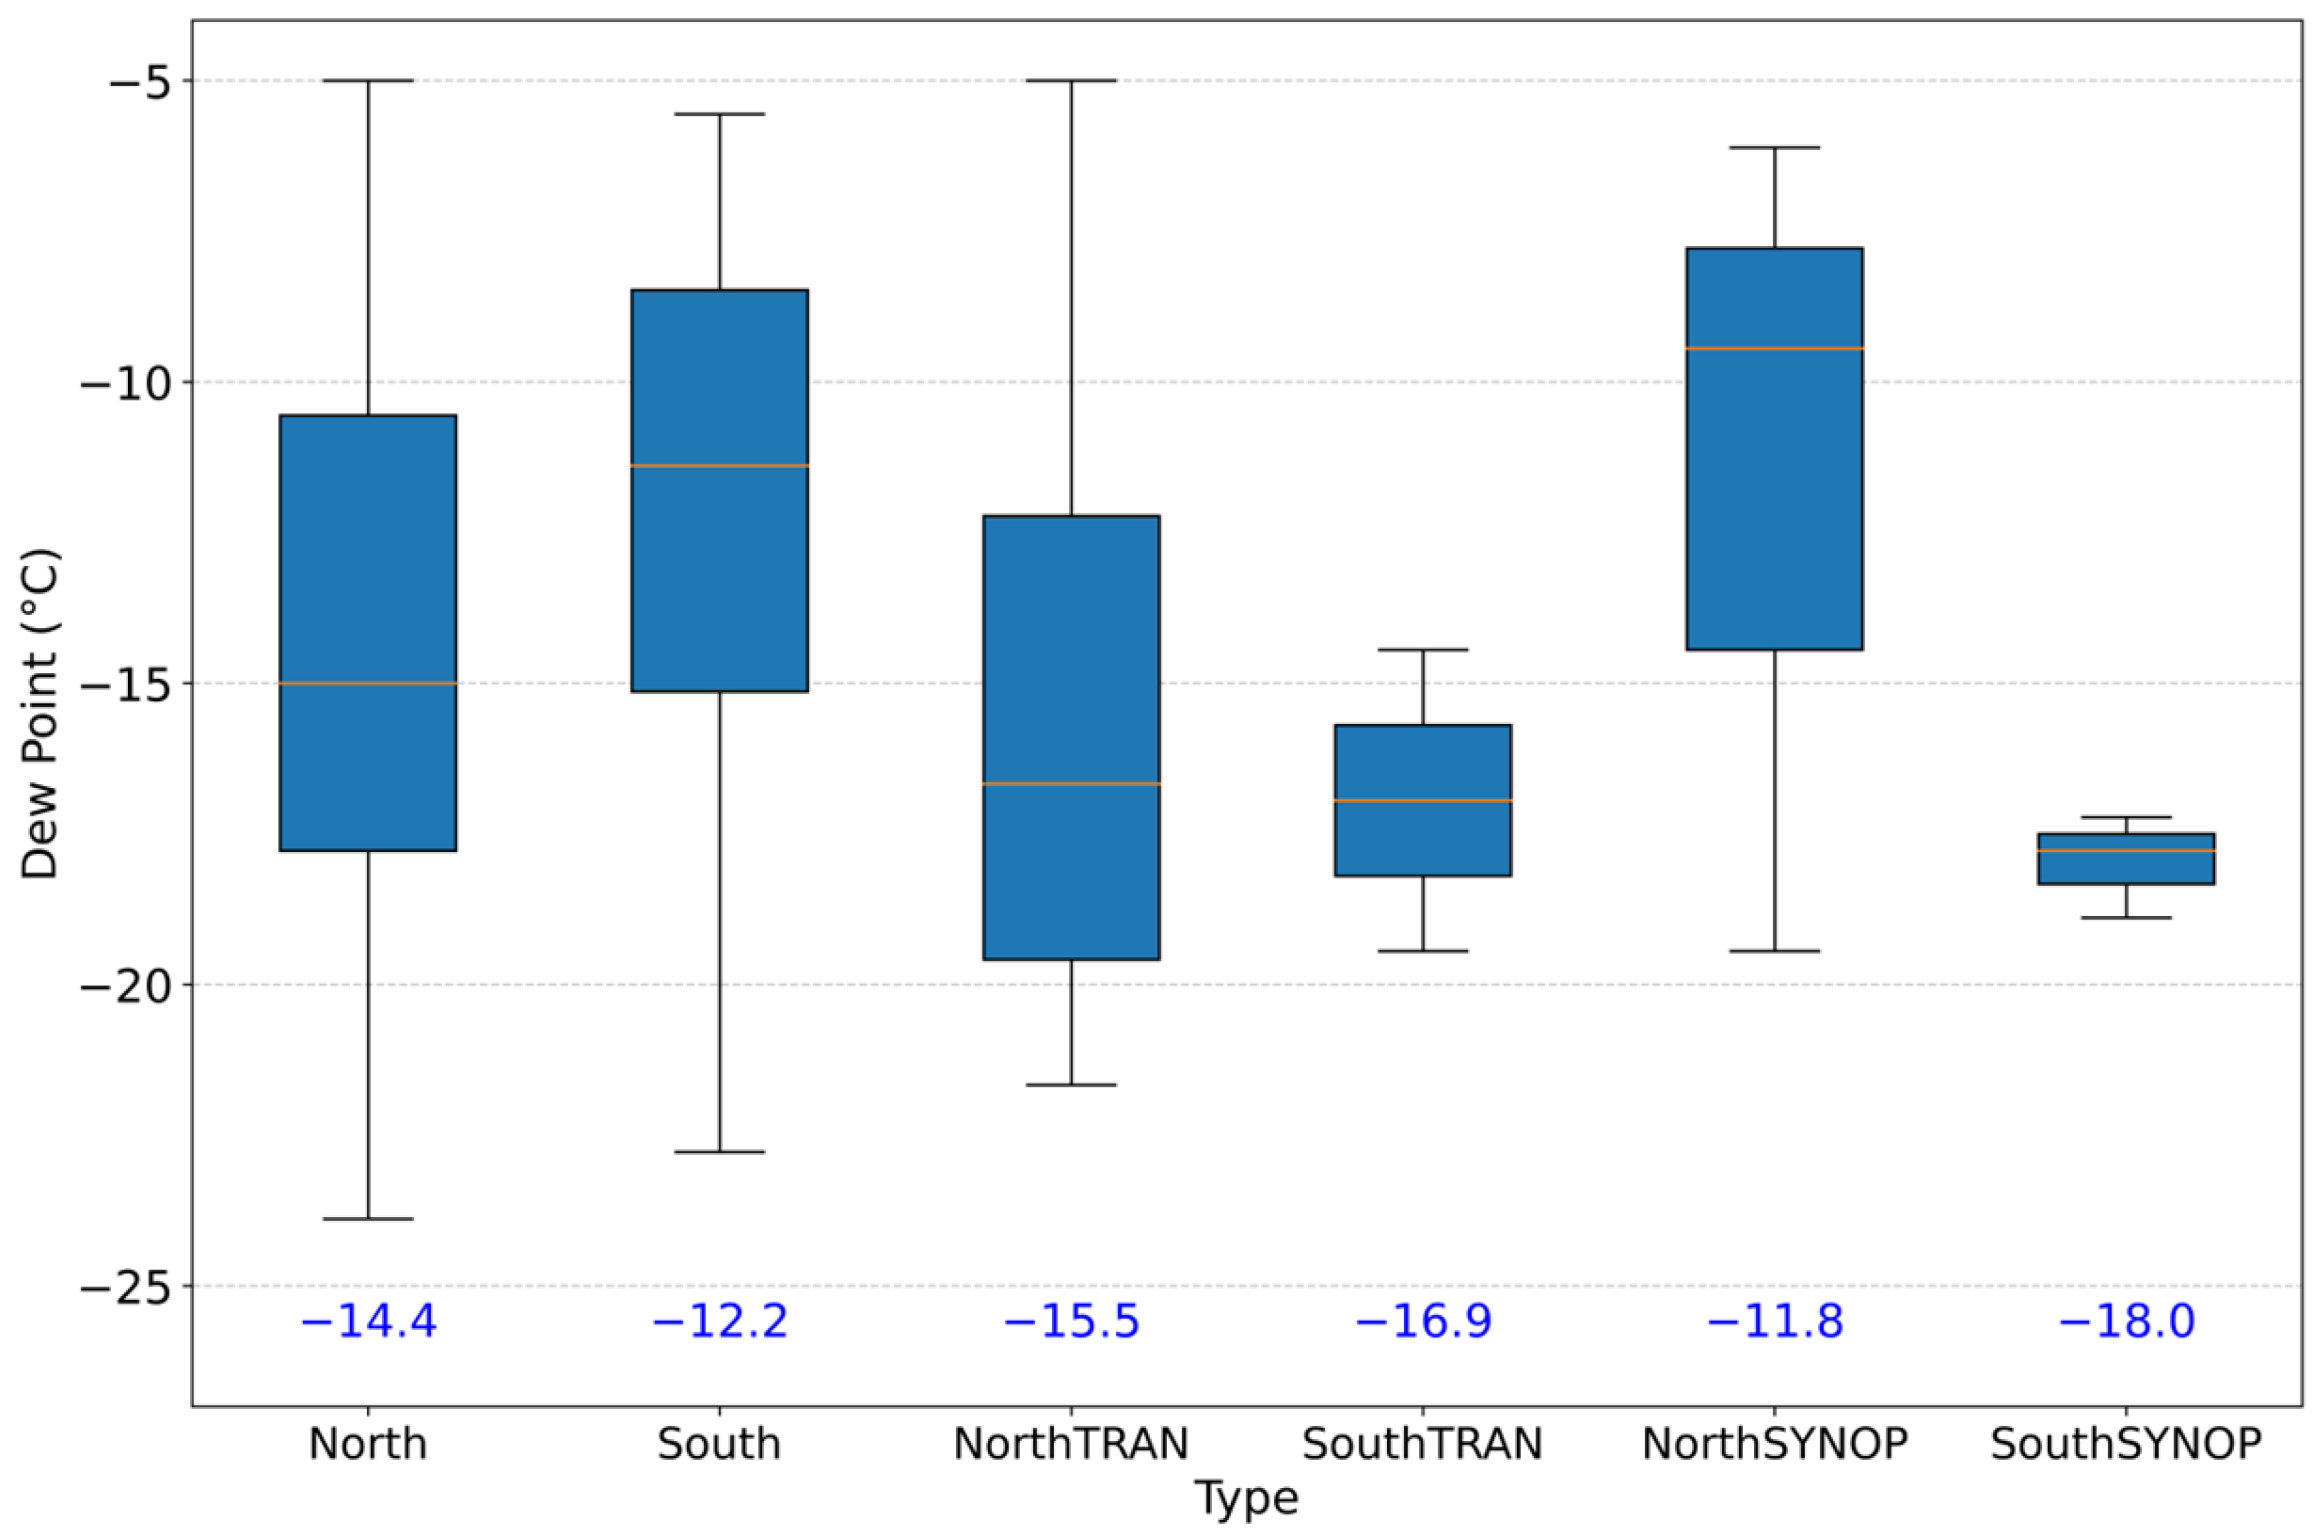
Dew point temperature patterns were similar to those of air temperature distributions across LE snowfall event types, with comparable rankings in both mean values and variability (Figure 7). Average dew points were highest in NorthSYNOP events (−9 °C), followed by South (−12 °C), North (−15 °C), NorthTRAN and SouthTRAN (−17 °C), and SouthSYNOP (−18 °C).
A key distinction was that southern events had warmer dew point temperatures than their northern counterparts. While air temperatures differed by roughly 13 °C between North and South event categories, dew points differed by only ~6 °C. This smaller gap suggests that southern-origin events were generally more moisture-rich, consistent with the maritime or southern air mass origins of these systems.

3.6. Sea-Level Pressure

As shown in Figure 8, SouthTRAN events had the highest average sea-level pressure (1028.1 hPa), followed by North (1026.8 hPa) and South (1022.4 hPa). Isolated North events recorded the highest individual pressure values, while isolated South events showed the lowest. Eight of the ten highest-pressure events were classified as North-type. However, no consistent relationship between sea-level pressure and LE event type was observed.

3.7. Wind Speed and Direction

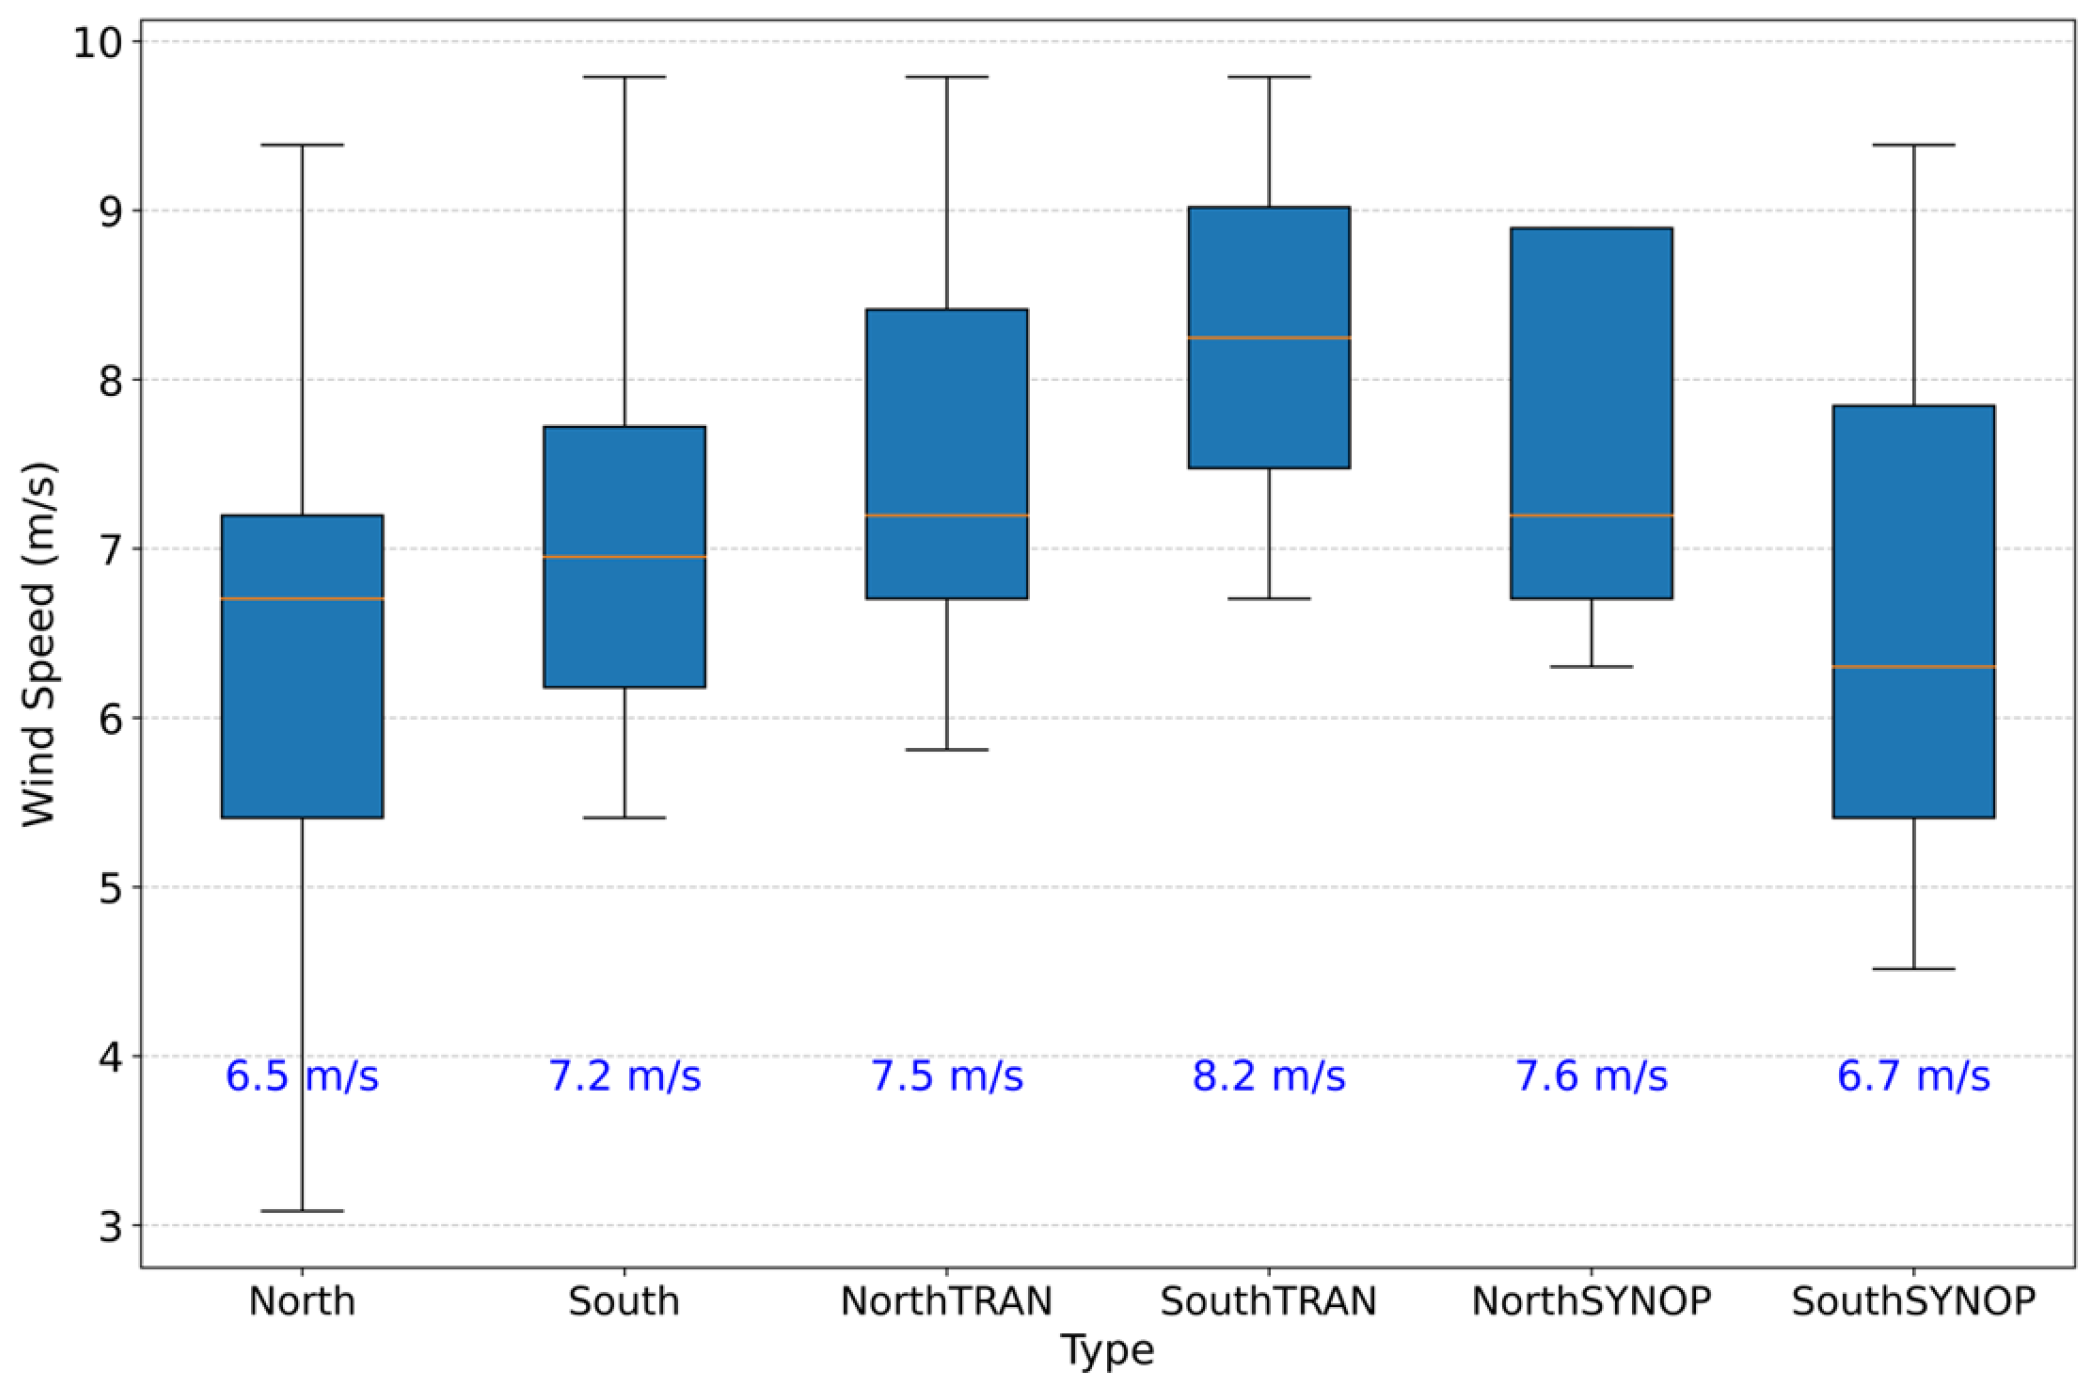
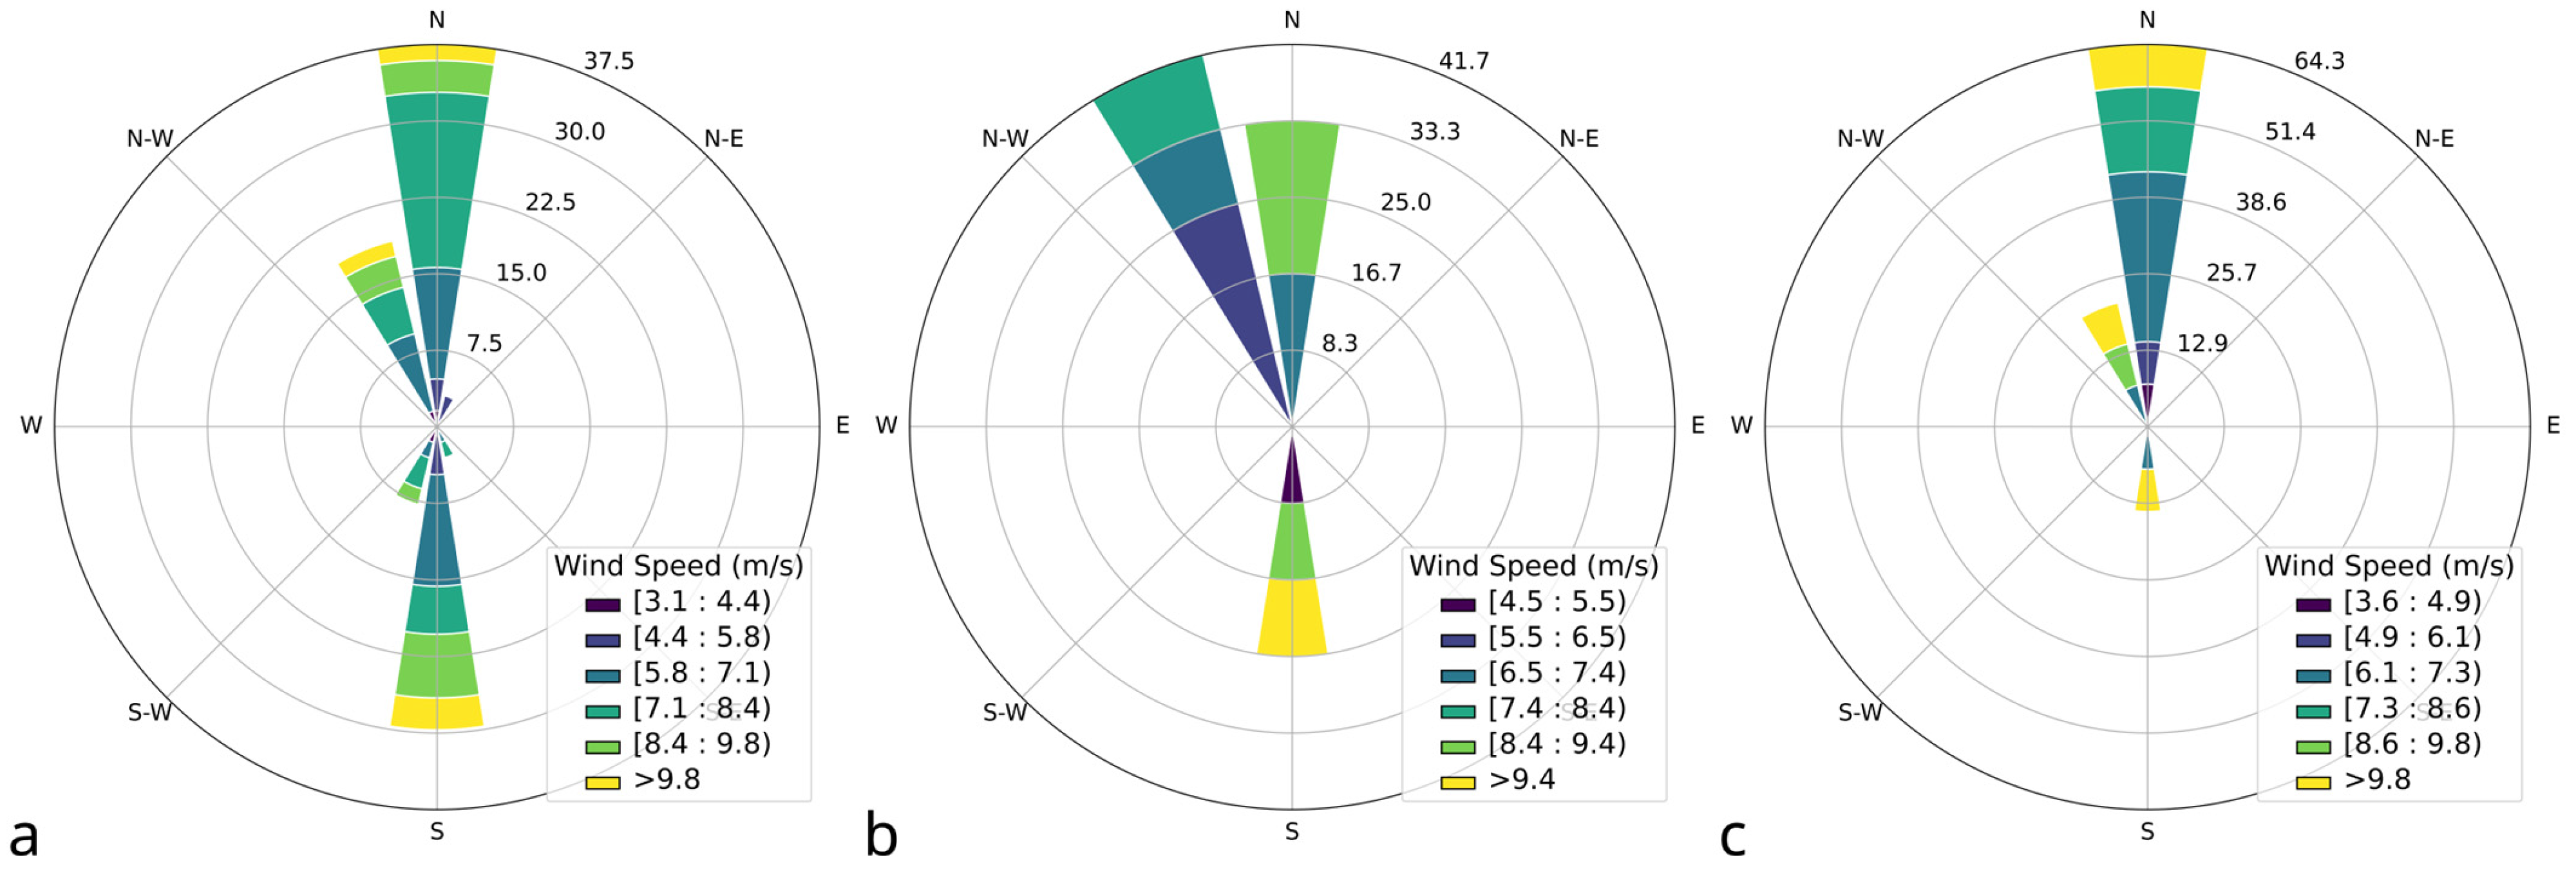
Wind speeds (Figure 9) peaked in SouthTRAN events (8.2 m/s), followed by all transitional events combined (7.9 m/s). Isolated events showed the lowest average wind speeds (6.9 m/s). Northerly winds dominated isolated and transitional types (56% of all cases), while synoptic events displayed greater directional variability. No easterly wind events were observed during the 2015–2024 period, in contrast to the earlier climatology [8].
Wind roses for each LE event type are shown in Figure 10a–c. Isolated LE events (Figure 10a) and transitional events (Figure 10b) were both dominated by northerly winds, consistent with cold-air outbreaks and narrow lake fetch. Synoptic LE events (Figure 10c), by contrast, exhibited a bimodal wind direction pattern: 45% of cases were associated with north-northwest winds, while both northerly and southerly flows each accounted for 27%. Southerly events tended to feature stronger winds, in agreement with the 1997–2006 climatology [8]. These distributions likely reflect evolving synoptic conditions and warrant further dynamical study.

3.8. Lake–Air Temperature Difference

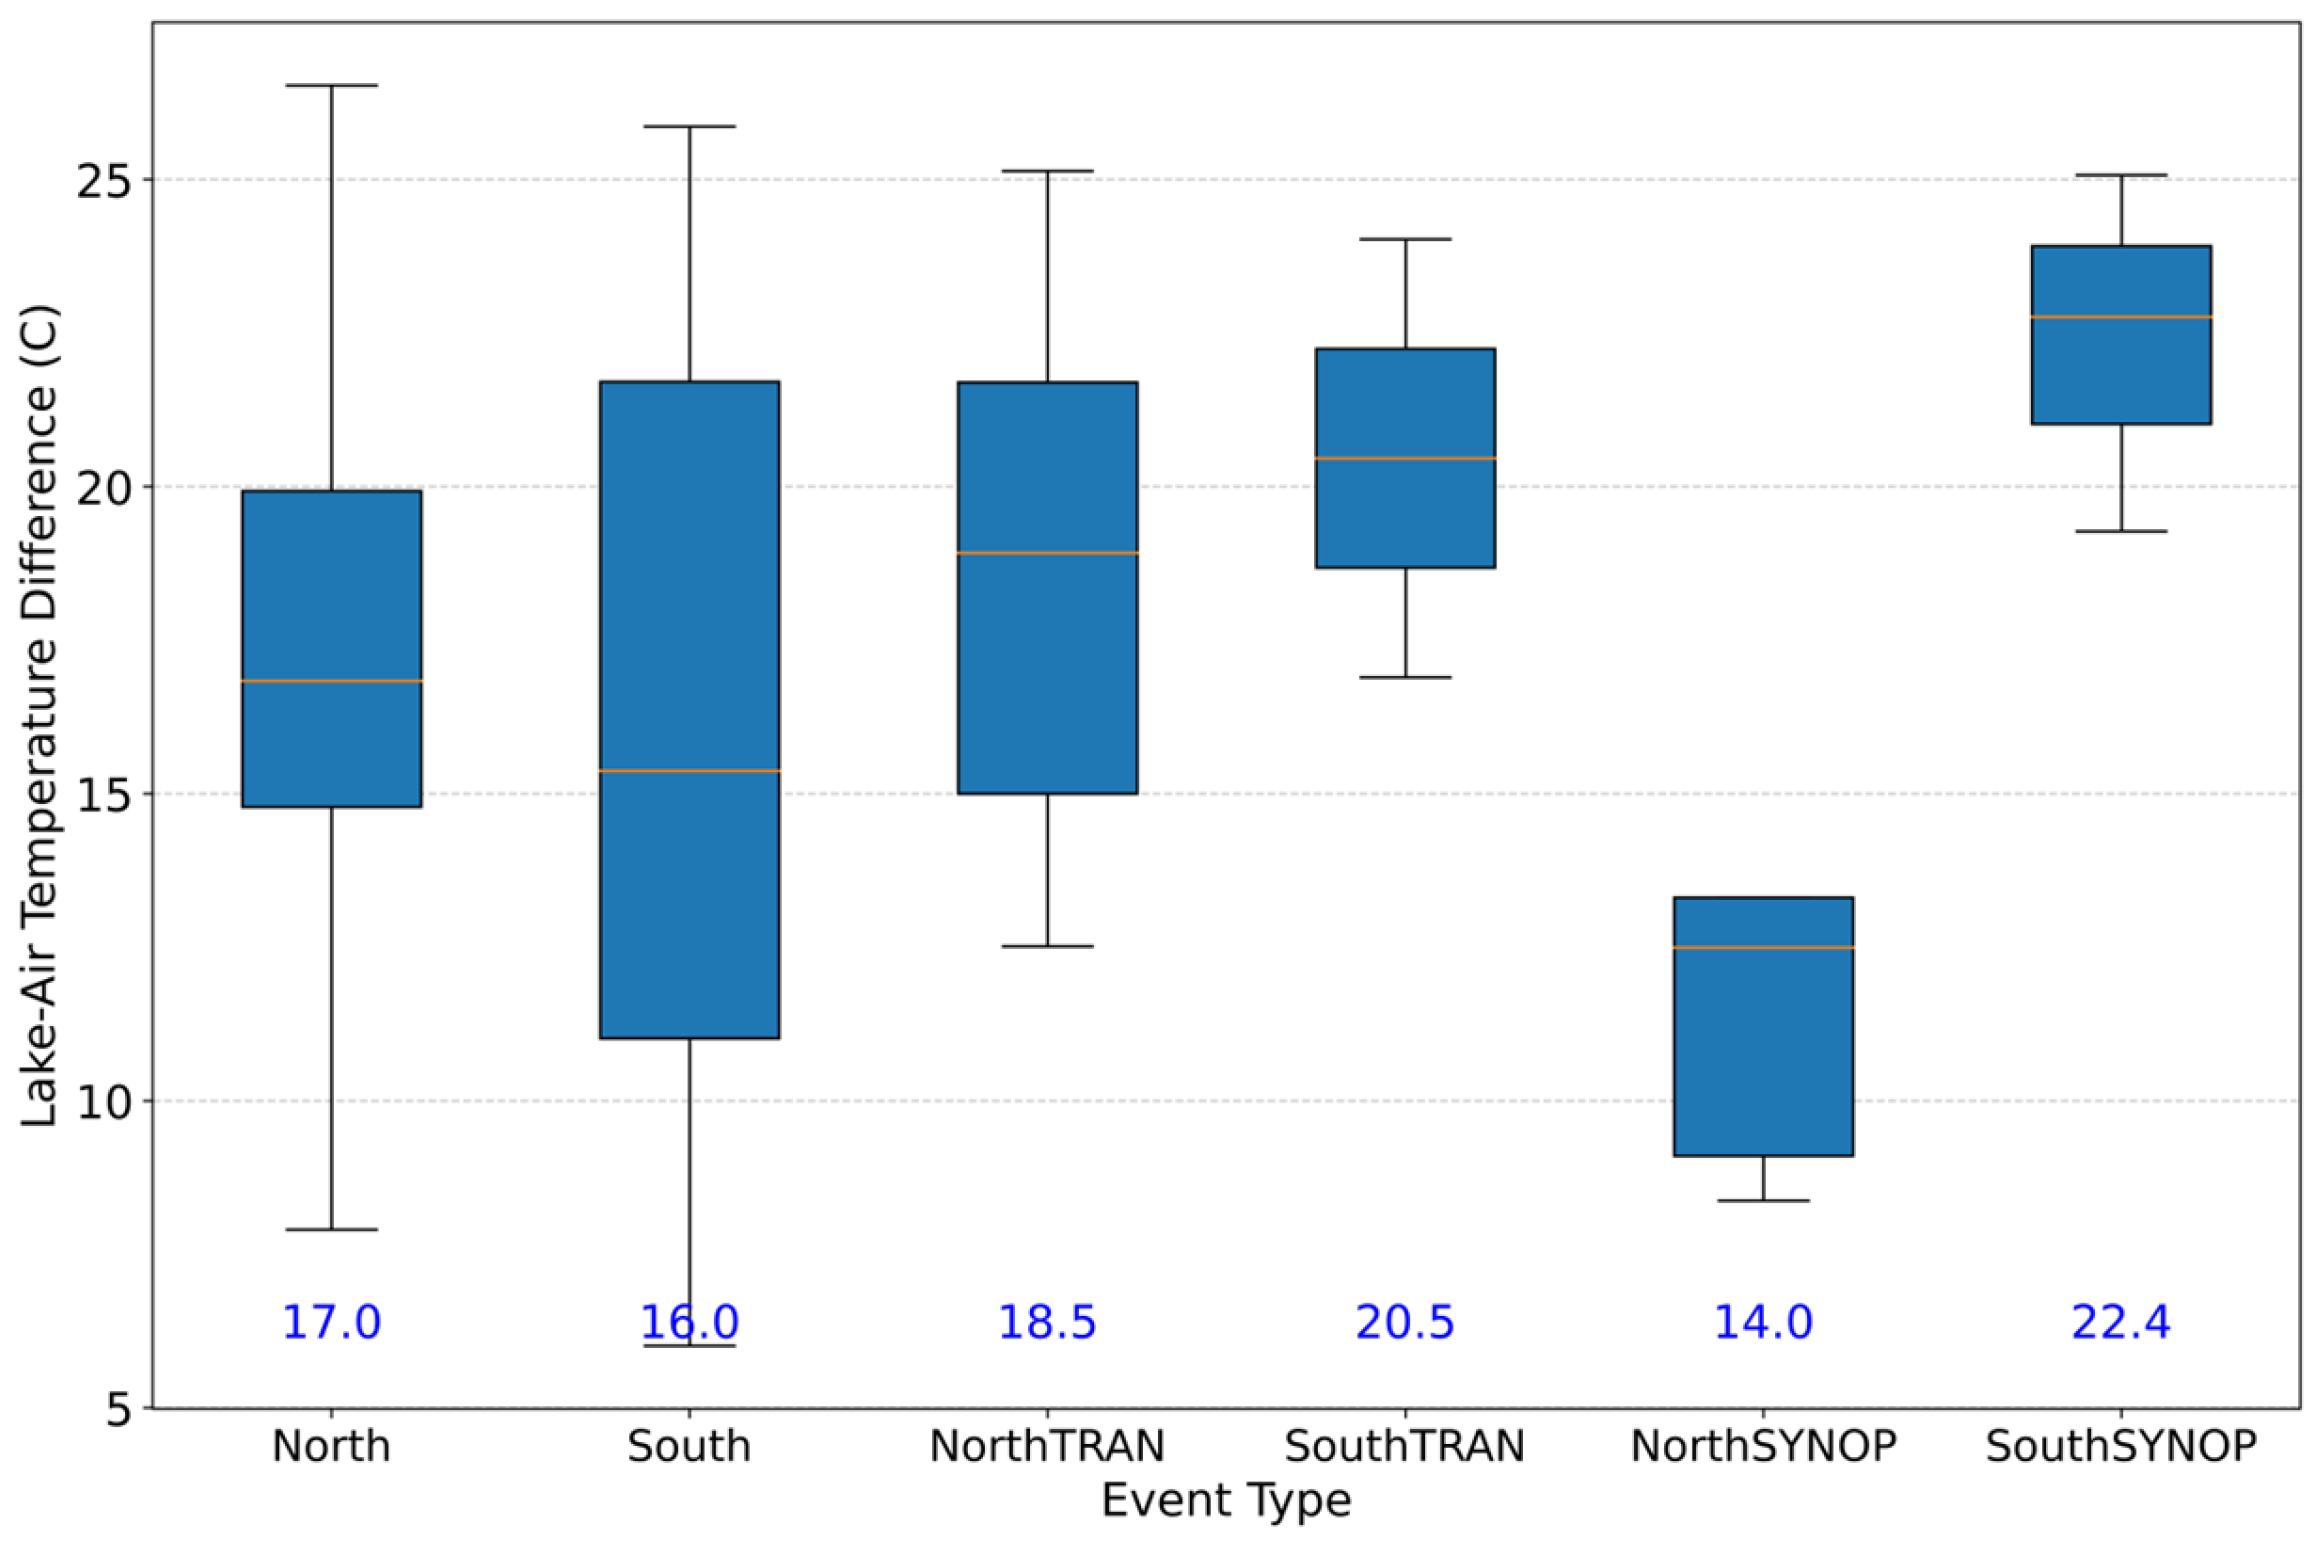
Lake–air temperature differences (Figure 11) ranged from 6 °C to nearly 29 °C, with mean values highest for SouthSYNOP events (22.4 °C) and lowest for NorthSYNOP (14 °C). These estimates are based on near-surface air temperature (approximately 10 m). While not directly comparable to the 850 hPa–lake differences used in the earlier climatology [8], they still suggest stronger lake–air gradients than typically observed over larger lakes. This finding supports previous observations that smaller lakes require larger lake–air temperature differences to sustain LE development due to their limited fetch and moisture availability [23].

4. Discussion

We have shown that despite substantial reductions in ice cover over Lake Champlain during the 2015–2024 period, the total number of lake-effect (LE) snowfall events did not increase but instead declined slightly compared to the 1997–2006 climatology. Rather than indicating a clear amplification in event frequency or intensity, the findings point to a redistribution in the seasonal timing and characteristics of LE events.
One of the most significant changes is the temporal redistribution of events. The LE season appeared to stretch later into the winter, with a reduction in early-season events and an increase in late-season occurrences. This adjustment likely reflects delayed winter onset and overall warmer seasonal temperatures, both of which are consistent with regional warming trends [38]. At the same time, the narrowing of lake–air temperature gradients may limit the frequency of favorable LE conditions, even when lake ice is minimal.
Event durations also shortened, with a drop in the average event length and a decline in long-duration events. Thermal conditions became milder overall. Minimum temperatures and dew points increased by 5–10 °C for North and South event types, and the warmest LE events approached the filtering threshold of −5 °C. These changes suggest LE events now occur more often under marginally favorable conditions, consistent with findings from [13] that marginal LE environments are becoming more common in a warming climate.
Synoptic characteristics also evolved. Fewer easterly wind events were observed in the recent decade, contrasting with their occasional appearance in the earlier climatology. The apparent increase in wind speed is likely a methodological artifact due to differences in reporting intervals (2 min maximum vs. hourly values). Pressure characteristics remained broadly consistent between periods.
This analysis also identified a novel transitional band type migrating along the lake axis, not previously documented in detail. While rare, these bands reflect a dynamic LE behavior that may become more prominent as synoptic conditions evolve under climate change.
Overall, these findings reinforce that warming has not uniformly increased LE snowfall but has reshaped its characteristics. Event frequency and intensity have remained relatively stable, while timing, structure, and thermodynamic conditions have shifted. These results align with recent modeling studies such as [5], which project that warming will alter LE snowfall structure and timing rather than simply amplify it.
A brief sensitivity test confirmed that small adjustments to the filtering thresholds (e.g., ±2 °C for temperature or ±5° for wind direction) would have changed the event count by only one or two cases over nine seasons, without affecting seasonal patterns or subtype frequencies. This supports the robustness of the filtering approach and justifies the exclusion of rare events under atypical wind regimes, which lack the characteristic lake-aligned structure and were similarly omitted in the 1997–2006 baseline study [8].

5. Conclusions

This study updates the climatology of lake-effect (LE) snowfall over Lake Champlain for the 2015–2024 period, building on the 1997–2006 baseline. While reductions in lake ice cover and increased open-water exposure might suggest an amplification of LE activity, our analysis finds that event frequency and intensity have remained broadly stable. Instead, the most notable changes are structural and temporal: more events now occur later in the season, durations have shortened, and the thermal environment has become milder.
These results indicate that small lakes like Champlain may respond to climate change differently than larger systems such as the Great Lakes, where enhanced LE snowfall has been more consistently observed. In contrast, the Champlain record suggests that warming has constrained LE snowfall by shortening event durations and shifting activity toward later in the season, rather than increasing event frequency. While an earlier case of a well-defined snowband aligned with the lake axis was documented in [36], our analysis identifies a previously unclassified transitional band type that migrates along the lake axis during the event. This structure highlights the emergence of new mesoscale behaviors under evolving synoptic conditions and may become more prominent as marginal environments continue to shift under climate forcing. The results underscore the need for continued high-resolution monitoring and periodic updates to regional LE climatologies, particularly in small-lake systems.
From an applied perspective, these findings have practical implications for forecasting LE snowfall in marginal environments. For regions surrounding small lakes, declining ice cover and evolving thermal structures may reduce predictability and complicate hazard response. The shift toward late-season activity may also affect snow management operations, communication strategies, and public safety planning.
This study has certain limitations. The use of a single radar site and manual classification, while consistent with earlier work, may result in occasional underdetection of weak or short-lived events. Nonetheless, methodological consistency ensures robust comparison across periods, and the identification of novel LE structures underscores the value of continued observational monitoring.
Future research should explore the mechanisms driving these structural changes, apply high-resolution numerical modeling, and assess analogous trends in other mid-sized lake regions. Such efforts will be essential for improving our understanding of lake–atmosphere interactions and anticipating regional snowfall behavior under a warming climate.

Author Contributions

K.D.N. and P.L. conceived and designed the research. K.D.N. conducted the analysis and illustration and wrote the manuscript. P.L. edited the manuscript. All authors have read and agreed to the published version of the manuscript.

Funding

This research was partly supported by the National Oceanic and Atmospheric Administration (NO. NA23OAR4310603).

Institutional Review Board Statement

Not applicable.

Informed Consent Statement

Not applicable.

Data Availability Statement

The datasets generated and/or analyzed during this study are available from the corresponding author upon reasonable request. The data and Python script used to produce Figure 1 are openly available at Zenodo: https://zenodo.org/records/16905541 (accessed on 22 August 2025).

Conflicts of Interest

The authors declare no conflicts of interest.

Abbreviations

The following abbreviations are used in this manuscript:
NEXRADNext Generation Weather Radar
WSR-88DWeather Surveillance Doppler Radar—88D
KCXXDoppler Radar at Burlington, Vermont
LELake-effect
NCDCNational Climatic Data Center
NOAANational Oceanic and Atmospheric Administration
NorthTRANNorth transitional
SouthTRANSouth transitional
NorthSYNOPNorth synoptic
SouthSYNOPSouth synoptic
KBTVPatrick Leahy Burlington International Airport
WSF2Magnitude of the Fastest 2 min Wind
WDF2Direction of the Fastest 2 min Wind
ASLPMean Sea-level Pressure
ADPTDew Point Temperature
TMINMinimum Temperature
USGSThe United States Geological Survey
IQRInterquartile Range

References

  1. Peace, R.L.; Sykes, R.B. Mesoscale study of a lake effect snow storm. Mon. Wea. Rev. 1966, 94, 495–507. [Google Scholar] [CrossRef]
  2. Niziol, T.A.; Snyder, W.R.; Waldstreicher, J.S. Winter weather forecasting throughout the eastern United States. Part IV: Lake effect snow. Wea. Forecast. 1995, 10, 61–77. [Google Scholar] [CrossRef]
  3. Rodriguez, Y.; Kristovich, D.A.R.; Hjelmfelt, M.R. Lake-to-lake cloud bands: Frequencies and locations. Mon. Wea. Rev. 2007, 135, 4202–4213. [Google Scholar] [CrossRef]
  4. Eipper, D.T.; Young, G.S.; Greybush, S.J.; Saslo, S.; Sikora, T.D.; Clark, R.D. Predicting the inland penetration of long-lake-axis-parallel snowbands. Wea. Forecast. 2018, 33, 1435–1451. [Google Scholar] [CrossRef]
  5. Kayastha, M.B.; Huang, C.; Wang, J.; Qian, Y.; Yang, Z.; Chakraborty, T.; Pringle, W.J.; Hetland, R.D.; Xue, P. How could future climate conditions reshape a devastating lake-effect snow storm? Earth’s Future 2024, 12, e2024EF004622. [Google Scholar] [CrossRef]
  6. Laird, N.F.; Miller, L.J.; Kristovich, D.A.R. Synthetic dual-Doppler analysis of a winter mesoscale vortex. Mon. Wea. Rev. 2001, 129, 312–331. [Google Scholar] [CrossRef]
  7. Kristovich, D.A.R.; Spinar, M.L. Diurnal variations in lake-effect precipitation near the western Great Lakes. J. Hydrometeorol. 2005, 6, 210–218. [Google Scholar] [CrossRef]
  8. Laird, N.F.; Desrochers, J.; Payer, M. Climatology of Lake-Effect Precipitation Events over Lake Champlain. J. Appl. Meteorol. Climatol. 2009, 48, 232–250. [Google Scholar] [CrossRef]
  9. Dai, Y.; Yao, T.; Li, X.; Ping, F. The impact of lake effects on the temporal and spatial distribution of precipitation in the Nam Co basin, Tibetan Plateau. Quat. Int. 2018, 475, 63–69. [Google Scholar] [CrossRef]
  10. Demirtaş, M. A lake-effect snowstorm over southern Europe with upstream blocking in early January 2017. Weather 2023, 78, 9–15. [Google Scholar] [CrossRef]
  11. Carpenter, D.M. The lake effect of the Great Salt Lake. Overview and forecast problems. Wea. Forecast. 1993, 8, 181–193. [Google Scholar] [CrossRef]
  12. Campbell, L.S.; Steenburgh, W.J.; Veals, P.G.; Letcher, T.W.; Minder, J.R. Lake-Effect Mode and Precipitation Enhancement over the Tug Hill Plateau during OWLeS IOP2b. Mon. Wea. Rev. 2016, 144, 1729–1748. [Google Scholar] [CrossRef]
  13. Filazzola, A.; Blagrave, K.; Imrit, M.A.; Sharma, S. Climate change drives increases in extreme events for lake ice in the Northern Hemisphere. Geophys. Res. Lett. 2020, 47, e2020GL089608. [Google Scholar] [CrossRef]
  14. Bartolini, W.M.; Minder, J.R. Evaluating stochastic parameter perturbations in convection-permitting ensemble forecasts of lake-effect snow. Wea. Forecast. 2025, 7, 1181–1200. [Google Scholar] [CrossRef]
  15. Dewey, K.F. The prediction of Lake Huron lake-effect snowfall systems. J. Appl. Meteorol. Climatol. 1975, 14, 3–7. [Google Scholar] [CrossRef]
  16. Braham, R.R., Jr.; Dungey, M.J. Quantitative estimates of the effect of Lake Michigan on snowfall. J. Appl. Meteorol. Climatol. 1984, 23, 940–949. [Google Scholar] [CrossRef]
  17. Steenburgh, W.J.; Halvorson, S.F.; Onton, D.J. Climatology of lake-effect snowstorms of the Great Salt Lake. Mon. Wea. Rev. 2000, 128, 709–727. [Google Scholar] [CrossRef]
  18. Bergmaier, P.T.; Geerts, B. LLAP band structure and intense lake-effect snowfall downwind of Lake Ontario: Insights from the OWLeS 7–9 January 2014 event. J. Appl. Meteorol. Climatol. 2020, 59, 1691–1715. [Google Scholar] [CrossRef]
  19. Greybush, S.J.; Sikora, T.D.; Young, G.S.; Mulhern, Q.; Clark, R.D.; Jurewicz, M.L., Sr. Elevated mixed layers during Great Lake lake-effect events: An investigation and case study from OWLeS. Mon. Wea. Rev. 2023, 152, 79–95. [Google Scholar] [CrossRef]
  20. Cordeira, J.M.; Laird, N.F. The Influence of Ice Cover on Two Lake-Effect Snow Events over Lake Erie. Mon. Wea. Rev. 2008, 136, 2747–2763. [Google Scholar] [CrossRef]
  21. Kunkel, K.E.; Westcott, N.E.; Kristovich, D.A.R. Assessment of potential effects of climate change on heavy lake-effect snowstorms near Lake Erie. J. Great Lakes Res. 2002, 28, 521–536. [Google Scholar] [CrossRef]
  22. Burnett, A.W.; Kirby, M.E.; Mullins, H.T.; Patterson, W.P. Increasing Great Lake–Effect Snowfall during the Twentieth Century: A Regional Response to Global Warming? J. Clim. 2003, 16, 3535–3542. [Google Scholar] [CrossRef]
  23. Steenburgh, W.J.; Onton, D.J. Multiscale analysis of the 7 December 1998 Great Salt Lake–effect snowstorm. Mon. Wea. Rev. 2001, 129, 1296–1317. [Google Scholar] [CrossRef]
  24. Onton, D.J.; Steenburgh, W.J. Diagnostic and sensitivity studies of the 7 December 1998 Great Salt Lake–effect snowstorm. Mon. Wea. Rev. 2001, 129, 1318–1338. [Google Scholar] [CrossRef]
  25. Alcott, T.I.; Steenburgh, W.J. Orographic Influences on a Great Salt Lake-Effect Snowstorm. Mon. Wea. Rev. 2013, 144, 2432–2450. [Google Scholar] [CrossRef]
  26. Cosgrove, B.A.; Colucci, S.J.; Ballentine, R.J.; Waldstreicher, J.S. Lake Effect Snow in the Finger Lakes Region. In Proceedings of the 15th Conference on Weather Analysis and Forecasting, Norfolk, VA, USA, 19–23 August 1996; American Meteorological Society: Boston, MA, USA, 1996; pp. 573–576. [Google Scholar]
  27. Watson, J.S.; Jurewicz, M.L.; Ballentine, R.J.; Colucci, S.J.; Waldstreicher, J.S. High Resolution Numerical Simulations of Finger Lakes Snow Bands. In Proceedings of the 16th Conference on Weather Analysis and Forecasting, Phoenix, AZ, USA, 11–16 January 1998; American Meteorological Society: Boston, MA, USA, 1998; pp. 308–310. [Google Scholar]
  28. Laird, N.; Sobash, R.; Hodas, N. Climatological Conditions of Lake-Effect Precipitation Events Associated with the New York State Finger Lakes. J. Appl. Meteorol. Climatol. 2010, 49, 1052–1062. [Google Scholar] [CrossRef]
  29. Bergmaier, P.T.; Geerts, B. Airborne Radar Observations of Lake-Effect Snow Bands over the New York Finger Lakes. Mon. Wea. Rev. 2016, 144, 3895–3914. [Google Scholar] [CrossRef]
  30. Laird, N.; Bentley, A.M.; Ganetis, S.A.; Steineke, A.; Tushaus, S.A. Climatology of Lake-Effect Precipitation Events over Lake Tahoe and Pyramid Lake. J. Appl. Meteorol. Climatol. 2016, 55, 297–312. [Google Scholar] [CrossRef]
  31. Wilken, G.R. A lake-effect snow in Arkansas. NWS/NOAA Tech. Attach. SR/SSD 1997, 97, 3. [Google Scholar]
  32. Guilbert, J.; Beckage, B.; Winter, J.M.; Horton, R.M.; Perkins, T.; Bomblies, A. Impacts of Projected Climate Change over the Lake Champlain Basin in Vermont. J. Appl. Meteorol. Climatol. 2014, 53, 1861–1875. [Google Scholar] [CrossRef]
  33. Manley, T.O.; Hunkins, K.L.; Saylor, J.H.; Miller, G.S.; Manley, P.L. Aspects of summertime and wintertime hydrodynamics of Lake Champlain. Lake Champlain Transit. Res. Towar. Restor. 1999, 1, 67–115. [Google Scholar] [CrossRef]
  34. Steenburgh, W.J.; Cunningham, J.A.; Bergmaier, P.T.; Geerts, B.; Veals, P. Characteristics of lake-effect precipitation over the Black River Valley and Western Adirondack Mountains. J. Appl. Meteorol. Climatol. 2023, 9, 1347–1366. [Google Scholar] [CrossRef]
  35. Tardy, A. Lake-Effect and Lake-Enhanced Snow in the Champlain Valley of Vermont; United States National Weather Service, Eastern Region: Silver Spring, MD, USA, 2020; p. 27.
  36. Payer, M.; Desrochers, J.; Laird, N.F. A lake-effect snow band over Lake Champlain. Mon. Wea. Rev. 2007, 135, 3895–3900. [Google Scholar] [CrossRef]
  37. Kosiba, K.A.; Wurman, J.; Knupp, K.; Pennington, K.; Robinson, P. Ontario winter lake-effect system (OWLeS): Bulk characteristics and kinematic evolution of mesovortices in long-lake-axis-parallel snowbands. Mon. Wea. Rev. 2019, 1, 131–157. [Google Scholar] [CrossRef]
  38. Wang, J.; Guan, Y.; Wu, L.; Guan, X.; Cai, W.; Huang, J.; Dong, W.; Zhang, B. Changing lengths of the four seasons by global warming. Geophys. Res. Lett. 2021, 48, e2020GL091753. [Google Scholar] [CrossRef]
  39. Bhimireddy, S.R.; Kristovich, D.A.R. Identification of convective boundary layer depth over the Great Lakes region using aircraft observations: A comparison of various methods. J. Appl. Meteorol. Climatol. 2024, 3, 401–423. [Google Scholar] [CrossRef]
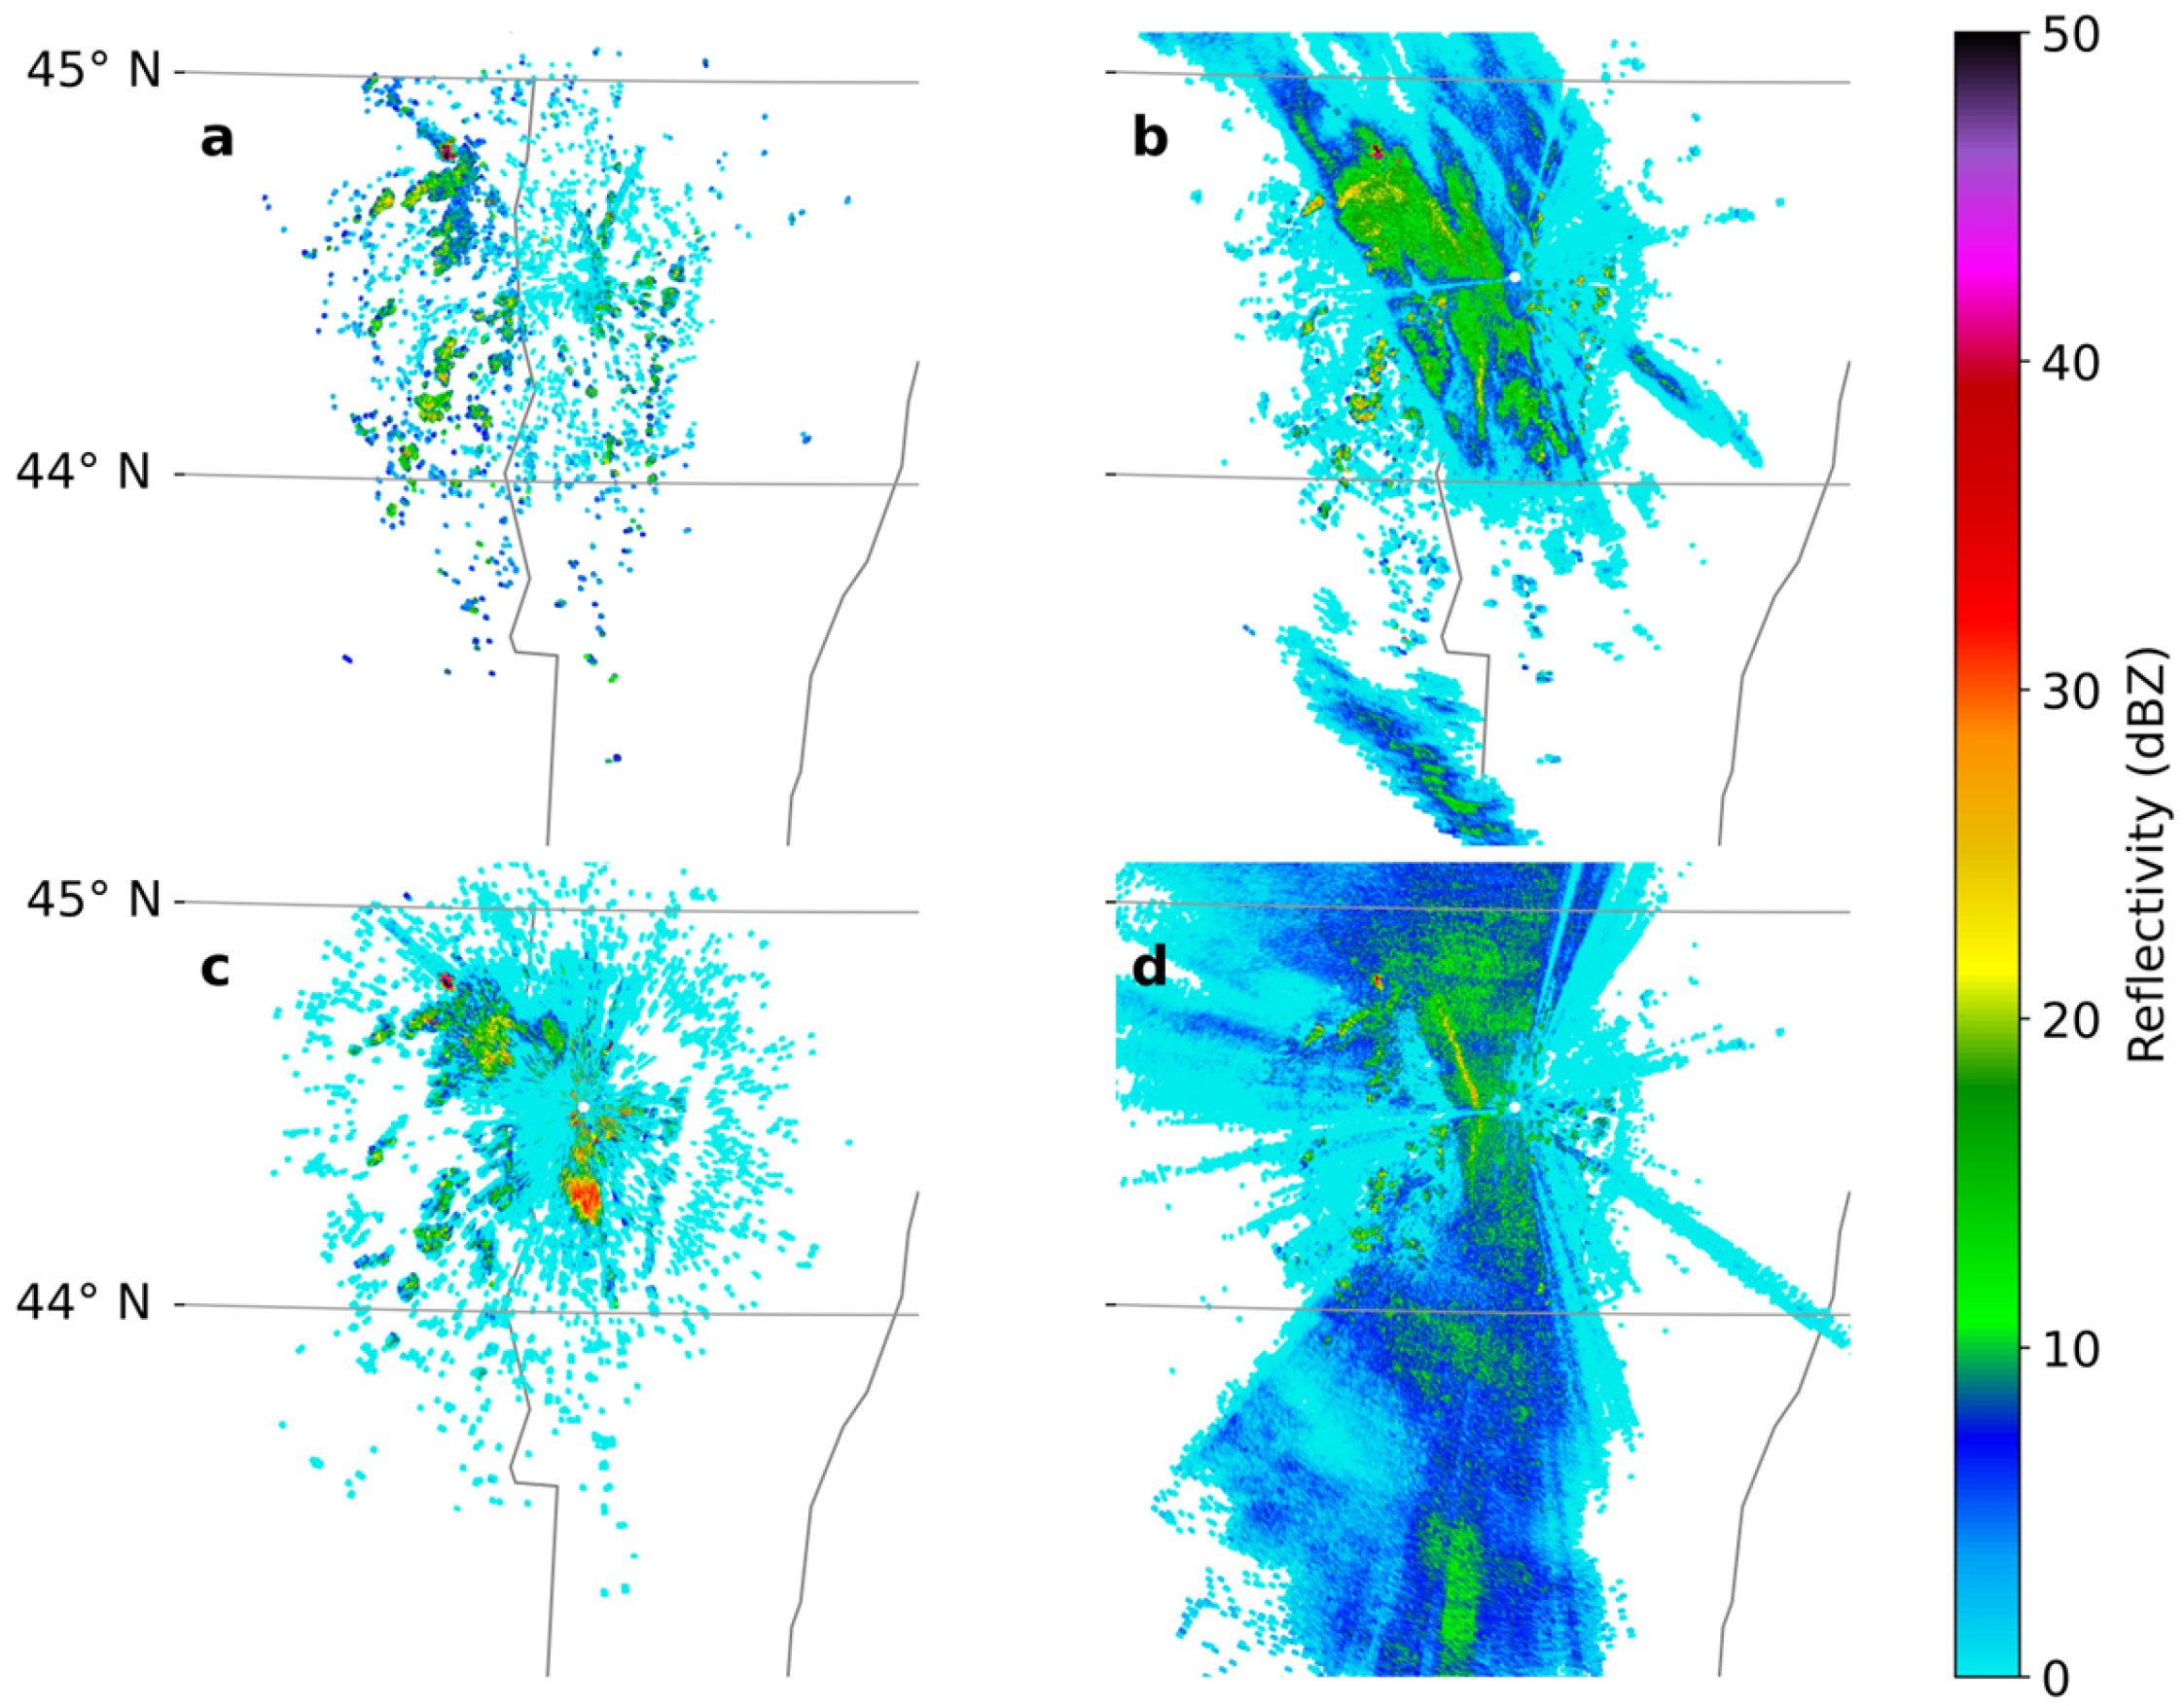
Figure 1. Representative examples of lake-effect (LE) snowfall event types observed by the KCXX WSR-88D base reflectivity (dBZ). Panels: (a) North, 2016-01-23 04:27:56 UTC; (b) NorthSYNOP, 2021-01-06 10:55:16 UTC; (c) South, 2017-01-31 12:03:04 UTC; (d) SouthSYNOP, 2023-02-25 19:40:14 UTC. These cases illustrate distinct spatial structures and synoptic contexts associated with each category.
Atmosphere 16 01011 g001
Figure 2. Workflow for lake-effect snowfall climatology over Lake Champlain.
Atmosphere 16 01011 g002
Figure 3. Inter-annual distribution of lake-effect (LE) snowfall event types during the 2015–2024 seasons.
Atmosphere 16 01011 g003
Figure 4. Histograms of lake-effect (LE) snowfall events showing the distribution of (a) start times, (b) end times, and (c) event durations during the 2015–2024 period.
Atmosphere 16 01011 g004
Figure 5. Monthly distribution of lake-effect (LE) event types from November through March during the 2015–2024 study period.
Atmosphere 16 01011 g005
Figure 6. Box-and-whisker plots of temperature distributions for each lake-effect (LE) snowfall event type during the 2015–2024 study period.
Atmosphere 16 01011 g006
Figure 7. Distribution of dew point temperatures by lake-effect (LE) snowfall event type, shown as box-and-whisker plots for the 2015–2024 study period.
Atmosphere 16 01011 g007
Figure 8. Box-and-whisker representation of sea-level pressure values associated with each LE event type from 2015 to 2024.
Atmosphere 16 01011 g008
Figure 9. Surface wind speeds across different lake-effect snowfall types, visualized using box-and-whisker plots based on 2015–2024 observations.
Atmosphere 16 01011 g009
Figure 10. Wind roses showing wind direction frequencies for (a) isolated, (b) transitional, and (c) synoptic LE events.
Atmosphere 16 01011 g010
Figure 11. Lake–air temperature differences corresponding to each LE event type, displayed as box-and-whisker plots for the 2015–2024 decade.
Atmosphere 16 01011 g011
Table 1. Summary of all identified lake-effect (LE) snowfall events during the 2015–2024 study period, including event start and end times, duration, and classified event type.
No.Start DateStart Time (UTC)End DateEnd Time (UTC)Duration (h)Type
14 Jan 201608434 Jan 2016000015.28NorthTRAN
27 Jan 201602377 Jan 201611459.13South
323 Jan 2016102123 Jan 201618228.02North
424 Jan 2016023224 Jan 2016155613.4SouthTRAN
515 Feb 2016070815 Feb 2016194512.62NorthSYNOP
622 Feb 2016065222 Feb 201615599.12North
73 Mar 201604443 Mar 201612117.45North
819 Dec 2016081719 Dec 201612224.08North
97 Jan 201710077 Jan 201716566.82North
1031 Jan 2017105631 Jan 201714594.05South
1111 Dec 2017170211 Dec 201721344.53North
1221 Dec 2017034121 Dec 2017170913.47North
1329 Dec 2017000029 Dec 2017130513.08NorthTRAN
1430 Dec 2017111431 Dec 2017222311.15SouthSYNOP
152 Jan 201807352 Jan 201812194.73NorthSYNOP
1613 Jan 2018192714 Jan 201803538.43NorthTRAN
1715 Jan 2018223316 Jan 201807188.75North
1818 Jan 2018031818 Jan 201806553.62South
1925 Jan 2018050715 Jan 201810395.53North
203 Feb 201811003 Feb 201814043.07North
2123 Nov 2018121723 Nov 201816194.03South
228 Dec 201806418 Dec 2018175411.22North
2312 Dec 2018162512 Dec 201819573.53NorthTRAN
2420 Dec 2018041520 Dec 2018155611.68South
2530 Dec 2018050030 Dec 201810005North
262 Jan 201905042 Jan 2019181113.12North
276 Feb 201907326 Feb 201910302.97North
2811 Nov 2019130911 Nov 201914271.3NorthTRAN
2920 Dec 2019101021 Dec 201918133.05North
3018 Jan 2020023518 Jan 2020183916.07North-South
3120 Jan 2020060020 Jan 202010514.85NorthTRAN
3223 Jan 2020084023 Jan 202017288.8South
3331 Jan 2020051931 Jan 2020152310.07South
349 Feb 202010459 Feb 202015555.17South
3514 Feb 2020113614 Feb 202016334.95NorthTRAN
3620 Feb 2020131320 Feb 202019266.22North
3721 Feb 2020112521 Feb 202013382.22South
3817 Dec 2020195017 Dec 202023554.08NorthTRAN
3918 Dec 2020053918 Dec 2020173912North
406 Jan 202108216 Jan 2021190410.72NorthSYNOP
418 Jan 202108178 Jan 202116228.08North
4230 Jan 2021133230 Jan 202118174.75NorthSYNOP
4311 Feb 2021120611 Feb 202113361.5NorthTRAN
4417 Mar 2021003117 Mar 202105244.88South
4530 Nov 2021182230 Nov 202121583.6South
4619 Dec 2021190820 Dec 2021075011.7NorthSYNOP
473 Jan 202209294 Jan 2022150329.56North-South
488 Jan 202209548 Jan 202211421.8North
4916 Jan 2022070316 Jan 2022173110.45South
5021 Jan 2022091321 Jan 202216567.72North
5126 Jan 2022115526 Jan 202217175.37North
524 Feb 202207555 Feb 2022085925.07NorthSYNOP
5326 Feb 2022102326 Feb 202214163.83SouthTRAN
5412 Dec 2022135112 Dec 202215311.67North
5514 Dec 2022102414 Dec 202215325.13NorthTRAN
5610 Jan 2023230811 Jan 2023105211.73North
5713 Jan 2023232915 Jan 2023020226.52NorthSYNOP
5815 Jan 2023081415 Jan 202318009.77NorthTRAN
5921 Jan 2023101221 Jan 202312492.62North
6023 Feb 2023131323 Feb 202316283.25NorthSYNOP
6125 Feb 2023185726 Feb 2023065912.03SouthSYNOP
6219 Jan 2024144719 Jan 202919394.87NorthTRAN
632 Feb 202423563 Feb 2024135213.93NorthSYNOP
6424 Mar 2024005529 Mar 202407086.22North
Disclaimer/Publisher’s Note: The statements, opinions and data contained in all publications are solely those of the individual author(s) and contributor(s) and not of MDPI and/or the editor(s). MDPI and/or the editor(s) disclaim responsibility for any injury to people or property resulting from any ideas, methods, instructions or products referred to in the content.