Article

Spatiotemporal Variability and Driving Factors of Vegetation Net Primary Productivity in the Yellow River Basin (Shaanxi Section) from 2000 to 2022

1
Shaanxi Satellite Application Center for Natural Resources, Xi’an 710002, China
2
School of Artificial Intelligence, Xidian University, Xi’an 710071, China
3
Shaanxi Yulin Public Security Bureau, Yulin 719000, China
*
Authors to whom correspondence should be addressed.
Atmosphere 2025, 16(9), 1004; https://doi.org/10.3390/atmos16091004
Submission received: 8 July 2025 / Revised: 18 August 2025 / Accepted: 19 August 2025 / Published: 25 August 2025

Abstract

Net primary productivity (NPP) is a key metric for assessing ecosystem functionality and sustainability. This study utilized MOD17A3 NPP data in conjunction with trend analysis, a gravity center model, and the Geodetector method to examine the spatiotemporal evolution and driving mechanisms of NPP across the Yellow River Basin (Shaanxi section) from 2000 to 2022. Results revealed: (1) The average NPP over the study period was 353.01g C m−2 with an upward trend of 9.7 g C m−2yr−1; spatially, NPP increased from north to south, with significant variability in northern Shaanxi and a 17.89 km northeastward shift in NPP’s gravity center. (2) Areas exhibiting significant NPP increases (slope > 0, p < 0.01) comprised 97.83% of the region, while declines were mainly observed in Guanzhong. (3) Normalized Difference Vegetation Index (NDVI) was the dominant factor, with the strongest synergistic, nonlinear interaction with land use type reflecting human activities (q = 0.831), indicating that the combined influence of climate factors, land surface factors, and human activities amplifies the explanatory effect on NPP variability. The study demonstrates an overall improvement in NPP, although local declines occurred, and its spatial distribution was influenced by a combination of natural and human factors. These findings will provide data support for the high-quality development of the Yellow River Basin.

1. Introduction

Net Primary Productivity (NPP) represents the net carbon fixed by plants during photosynthesis, serving as a crucial indicator of regional ecological quality and ecosystem carbon sequestration [1]. NPP is integral to terrestrial ecosystems, influencing ecosystem productivity, carbon cycling, and global climate change. It is essential for evaluating the health of terrestrial ecosystems and maintaining ecological balance [2,3]. Thus, analyzing the spatial and temporal patterns of NPP and its influencing factors is vital for assessing regional ecological quality, carbon sequestration potential, and sustainable development [4].
Significant progress has been made in the study of NPP worldwide. Traditionally, NPP investigations have relied on methods such as soil science [5,6,7,8], ecological modeling [9,10,11,12,13], and manual techniques [14,15,16]. However, these methods have inherent limitations in data collection, temporal resolution, and spatial scope. making them less effective for large-scale or long-term studies.
The advancement of remote sensing technology, with its strengths in temporal and spatial resolution, has made it possible to conduct dynamic monitoring of NPP over long time series and across large areas. This technology has been extensively used for the analysis of large-scale spatiotemporal dynamics of NPP and the study of influencing factors in various regions [17,18,19,20,21], especially in ecologically fragile areas. Ecologically fragile regions in China account for more than 55% of the country’s land area, with a multitude of fragile ecological types [22]. The application of remote sensing technology for NPP estimation has become a focus for the high-quality development of ecologically fragile areas [23,24,25,26].
The Yellow River Basin (Shaanxi section), located in the middle and upper reaches of the Yellow River, is distinguished by dissected topography and heterogeneous ecoregions that collectively create a complex terrain and diverse ecosystems [27]. This corridor constitutes a strategic ecological shield for China’s “Ecological Protection and High-quality Development of the Yellow River Basin” initiative [28,29]. Empirical evidence indicates that vegetation NPP governs the regional carbon budget and modulates critical ecosystem services—soil retention and water yield—that are increasingly jeopardized by chronic erosion and land degradation [28,30]. The Loess Plateau portion within Shaanxi delivers > 40% of the Yellow River’s sediment; any NPP reduction would amplify erosion and elevate downstream flood risk [31,32]. Therefore, obtaining timely and accurate data on the spatiotemporal patterns of NPP and its influencing factors in this region is crucial for ecological protection and enhancing ecosystem services.
Although significant progress has been made in studying NPP in the Yellow River Basin [33,34,35,36,37], most research has predominantly focused on two main aspects: spatiotemporal dynamics [34,38,39,40] and driving factors [41,42,43,44]. In terms of spatiotemporal dynamics, many studies have employed relatively basic spatial and statistical methods, concentrating on mapping the distribution of high and low NPP values, as well as tracking changes in area and magnitude over time [45,46]. For the Yellow River Basin (Shaanxi section), existing studies generally indicate a significant upward trend in NPP since 2000, with marked spatial heterogeneity characterized by a “high in the south and low in the north” pattern and higher productivity in the Qinling–Guanzhong and southern mountainous areas compared with the Loess Plateau and Mu Us Sandy Land margins [47,48,49]. These studies have further revealed that precipitation and solar radiation are the dominant climatic drivers of NPP variations in this region, while large-scale ecological restoration projects, such as the Grain-for-Green program, have played a decisive role in long-term vegetation recovery [50,51]. However, these approaches often fail to capture the more intricate patterns and underlying processes that drive NPP variability in the region, leaving a gap in fully understanding the complexities of NPP changes.
Similarly, in the realm of driving factor analysis, most research has relied heavily on land-use data to represent human activities [52,53], which limits the scope of factors considered. Important variables that are closely tied to human activity, such as PM2.5 (fine particulate matter with aerodynamic diameter ≤ 2.5 µm), PM10 (particulate matter ≤ 10 µm), and nighttime light data, have been largely overlooked [54,55]. Additionally, many studies have used simple linear regression models [56], which provide only qualitative insights into how driving factors influence NPP. As a result, there is a clear need for more robust quantitative analyses that can offer a deeper, more comprehensive understanding of these influences [57].
Based on this, the present study focuses on the Yellow River Basin (Shaanxi section), with the following objectives: (1) to analyze the spatiotemporal distribution patterns of annual average NPP in the region from 2000 to 2022; (2) to investigate the shifts in the centroid of NPP within the study area using the gravity center model; and (3) to incorporate nighttime light and land-use data to reflect human activity factors, and apply the Geodetector model to quantitatively analyze the trends of climate, land surface, and human activity factors. The aim is to provide a scientific basis for environmental protection, as well as to offer data support for the high-quality development of the Yellow River Basin.

2. Materials and Methods

2.1. Study Area

The Yellow River Basin (Shaanxi section) is located in the central-northern part of Shaanxi Provincem (Figure 1), within the middle reaches of the Yellow River (105°20′–111°15′ E, 33°37′–39°28′ N), covering an area of approximately 133,000 km2. The terrain is diverse and can be mainly divided into the bedrock mountainous area, the loess plateau gully area, and the sand area, with elevations ranging from 319 to 3748 m. The climate shifts from arid and semi-arid in the north to semi-humid in the south, with annual precipitation averaging 400~600 mm, concentrated in the summer [58]. The average annual temperature is approximately 7 °C, and both precipitation and temperature exhibit a southeast-to-northwest decreasing gradient in spatial distribution [59].
Based on natural conditions such as rainfall, climate, elevation, and vegetation types, as well as socio-economic characteristics, the study area was divided into three regions: northern Shaanxi, Guanzhong, and southern Shaanxi.
Northern Shaanxi includes Yulin and Yan’an cities, located in the northern part of Shaanxi Province, accounting for 60.18% of the study area. Elevation ranges from 1000 to 1900 m, with a dry climate, annual precipitation of 180~350 mm, and an average annual temperature of 8.0~10.0 °C. Vegetation is sparse, dominated by drought-resistant plants.
Guanzhong, located in central Shaanxi, includes Xi’an, Baoji, Xianyang, Weinan, and Tongchuan cities, accounting for 37.63% of the study area. Elevation ranges from 320 to 700 m, with a mild climate, annual precipitation of 200~380 mm, and an average annual temperature of 12.0~14.0 °C. Guanzhong experiences distinct seasons, with abundant vegetation primarily consisting of crops. It is also the political, economic, and cultural center of Shaanxi Province.
Southern Shaanxi includes Shangluo city, situated in the Qinling Mountains, accounting for 2.18% of the study area. Elevation ranges from 215 to 2802 m, with a humid climate, annual precipitation of 300~710 mm, and an average annual temperature of 14.0~15.6 °C. The area is densely vegetated, dominated by subtropical evergreen broadleaf forests and mixed forests [60].

2.2. Data Source

This study collected a range of time-series datasets spanning 2000 to 2022 (Table 1), including NPP, temperature, precipitation, nighttime light, land use type, NDVI, PM2.5, and PM10. The NPP data were obtained from the MOD17A3 NPP product (NASA Goddard Space Flight Center, Greenbelt, USA) and preprocessed using MRT software (MODIS Reprojection Tool) version 4.1), including format conversion, reprojection, and scaling, with the final unit converted to g C m−2 yr−1. The NDVI data used in this study have already undergone preprocessing, including radiometric, atmospheric, and geometric corrections [61]. Nighttime light data were sourced from the widely used DMSP/OLS product (Northrop Grumman Systems Corporation, Falls Church, Virginia, USA), which is commonly applied for monitoring human activities [55,62]. Additionally, monthly temperature and precipitation data were averaged to derive annual values. The study also incorporated raster data for Digital Elevation Model (DEM), vegetation types, and soil types. All raster datasets were reprojected to match the projection of the NPP data, and Kriging interpolation was applied to resample the data to a 1 km resolution.

3. Method

3.1. Analysis of NPP Change Trends

In this study, the trend analysis method [63] was employed to investigate the slope of NPP changes and its spatial distribution across the study area from 2000 to 2022. The slope was calculated using the following equation:
S = n × i = 1 n i × N P P i i = 1 n i i = 1 n N P P i n × i = 1 n i 2 ( i = 1 n i ) 2
where n represents the monitoring period, which is 23 years in this study; S denotes the slope of the NPP trend; NPPi is the vegetation NPP in year i. A positive S value indicates an increasing trend in NPP, while a negative S suggests a decreasing trend. The larger the absolute value of S, the more pronounced the trend.

3.2. Significance Test of NPP Changes

The Mann–Kendall (MK) test [64,65] was employed to calculate the Z-value, which determines the statistical significance of long-term NPP changes. The MK Z statistic follows a standard normal distribution: a positive value indicates an increasing trend in vegetation NPP, while a negative value indicates a decreasing trend. At the 95% and 99% confidence levels, the trend is considered statistically significant when the absolute value of the MK Z statistic exceeds 1.96 (p < 0.05) and 2.58 (p < 0.01), respectively. The calculation details for the MK test can be referenced in Pang, et al. [66]. MATLAB 2020 was used to implement pixel-wise calculations for NPP data from 2000 to 2022 across the study area.
Based on the NPP trend slope and the corresponding Z-value significance, changes in NPP were classified into five categories: significant improvement (Slope > 0, p ≤ 0.01), slight improvement (Slope > 0, 0.01 < p ≤ 0.05), no significant change (p > 0.05), slight degradation (Slope < 0, 0.01 < p ≤ 0.05), and significant degradation (Slope < 0, p ≤ 0.01) [67].

3.3. Analysis of Spatial Variability of NPP

The coefficient of variation (Cv) [68,69] was used to assess the stability of NPP over time by measuring the degree of variability relative to the mean. A lower Cv suggests more stable NPP fluctuations over the time series, while a higher Cv indicates greater variability. The Cv was calculated using the following equation:
C v = 1 N P P ¯ 1 ( n 1 ) i = 1 n ( N P P i N P P ¯ ) 2
where n represents the monitoring period, which is 23 years in this study. The results were classified into five categories using the natural breaks method in ArcGIS 10.8, ranging from very low to very high fluctuation regions: very low fluctuation, low fluctuation, moderate fluctuation, high fluctuation, and very high fluctuation [70]. This categorization allowed for a more nuanced understanding of spatial variability in NPP stability across the study area.

3.4. Analysis of NPP Gravity Center Shift Patterns

The spatial variation of NPP within the study area essentially reflects shifts in the gravity center of vegetation NPP, which can be represented by changes in the gravity center coordinates. In geography, gravity center calculations are widely used in fields such as economics, population studies, and environmental research [71,72]. Analyzing the trajectory of NPP gravity center shifts helps to understand the evolution of the geographical distribution of vegetation NPP in the study area.
X t = i = 1 n G t i x i i = 1 n G t i Y t = i = 1 n G t i y i i = 1 n G t i
where Xt and Yt are the gravity center coordinates in year t [73,74]; Gti is the NPP value of the i-th research unit; Xi and Yi are the geographic coordinates of the center of the i-th research unit, and n is the total number of research units.

3.5. Analysis of Driving Factors for Spatial Variations of NPP

This study employed the Geodetector model to analyze the driving factors behind the spatial variation of NPP in the study area. Using the q-statistic [75,76], the explanatory power of different factors was compared. In addition, interaction detection was applied to assess whether two factors interact and how these interactions affect the spatial differentiation of NPP.
The factors were grouped into three main categories: climatic, land surface, and human activity factors. Climatic factors included annual precipitation and temperature, which were calculated by averaging monthly data, along with PM2.5 and PM10. PM2.5 and PM10 were included as potential driving factors because atmospheric particulate matter can affect vegetation growth and NPP by reducing solar radiation, altering radiation quality, and depositing on leaf surfaces, thereby impacting photosynthesis efficiency. Additionally, long-term accumulation may indirectly influence vegetation through changes in soil properties and local climate conditions [77,78]. Land surface factors comprised slope and aspect, derived from DEM data, as well as NDVI, vegetation type, and soil type. Human activity factors were represented by nighttime light and land use types.
The 12 factors were reclassified as follows: aspect was divided into eight directional categories (e.g., north, northeast, northwest); soil types were classified into nine categories, such as brown soil, black felt soil, and grass felt soil; vegetation types were divided into eight categories, including shrubs, meadows, and coniferous forests; and land use types were grouped into seven classes, including farmland, forestland, and grassland. The remaining factors, such as temperature and precipitation, were classified into nine categories using the natural breaks method.
The study area was then divided into a 3 km × 3 km grid, with the center of each grid cell serving as a sampling point. This resulted in a total of 14,774 sampling points. The reclassified factor values, along with multi-year NPP data, were extracted for each sampling point and then analyzed using the Geodetector software to calculate the q-values for each factor [79].

4. Results

4.1. Spatiotemporal Change Analysis of NPP

4.1.1. Interannual Variation of NPP

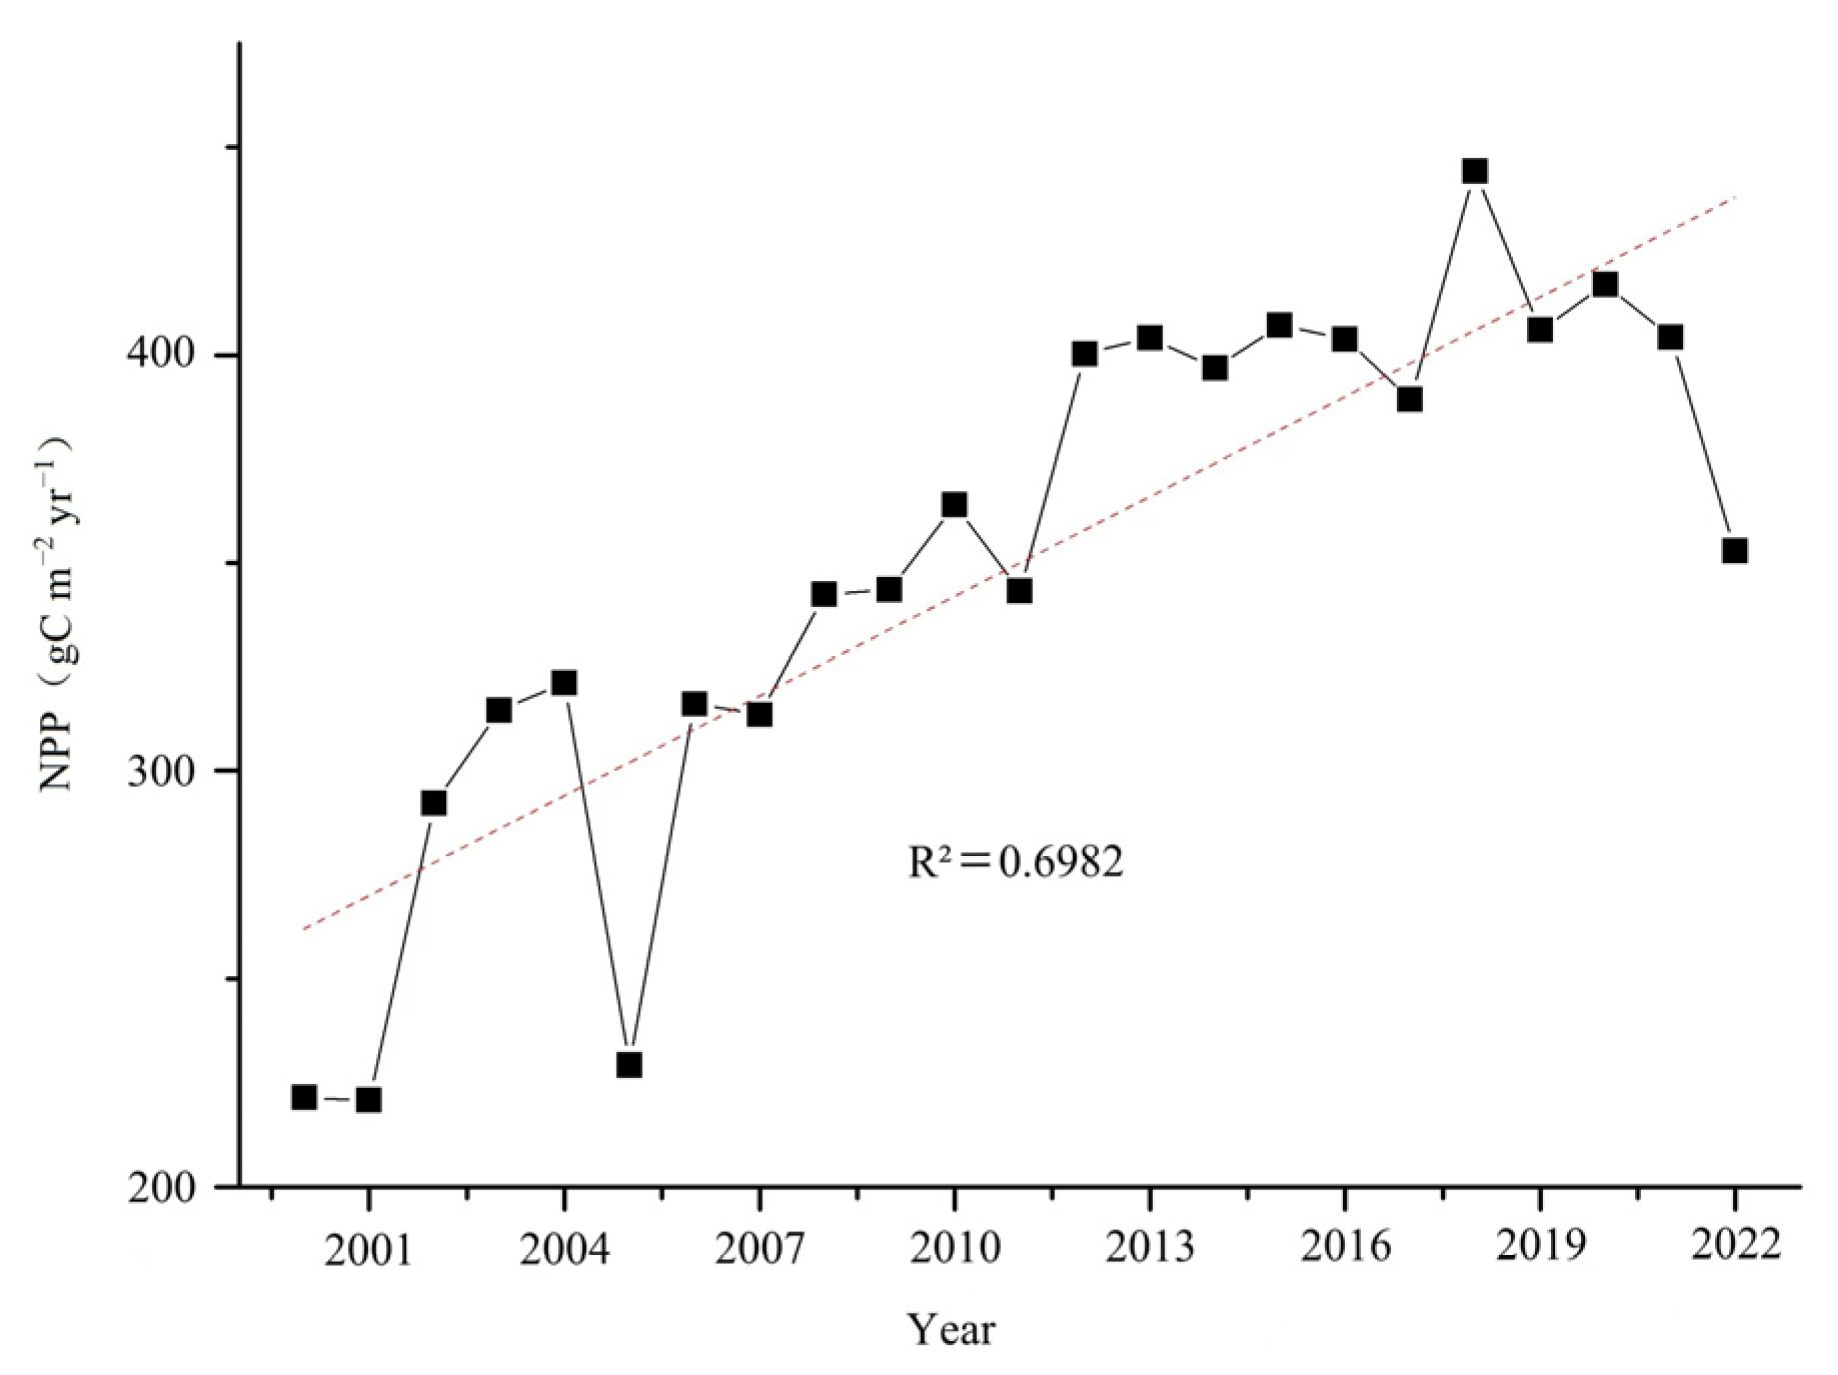
The interannual variation of NPP in the study area from 2000 to 2022 was shown in Figure 2. Over these 23 years, NPP ranged from 220.85 to 444.27 g C m−2, with an average of 353.01 g C m−2. The lowest NPP occurred in 2001 with 220.85 g C m−2, followed by a sharp increase to 400.30 g C m−2 in 2012. Following this, NPP generally oscillated around 400 g C m−2, which is strongly associated with the national initiatives to implement “cropland-to-grassland” and “grazing-to-grassland” policies in the region. The overall trend of NPP indicates an upward trajectory with an average annual increment of 9.7 g C m−2. As depicted in Figure 3, the NPP in the Northern Shaanxi, Guanzhong, and Southern Shaanxi regions increased annually by 5.48 g C m−2, 6.07 g C m−2, and 6.5g C m−2, respectively. From 2000 to 2011, except for 2010, annual NPP values were generally below the 23-year average, while values from 2011 to 2022 were generally above it.

4.1.2. Spatial Variation of NPP

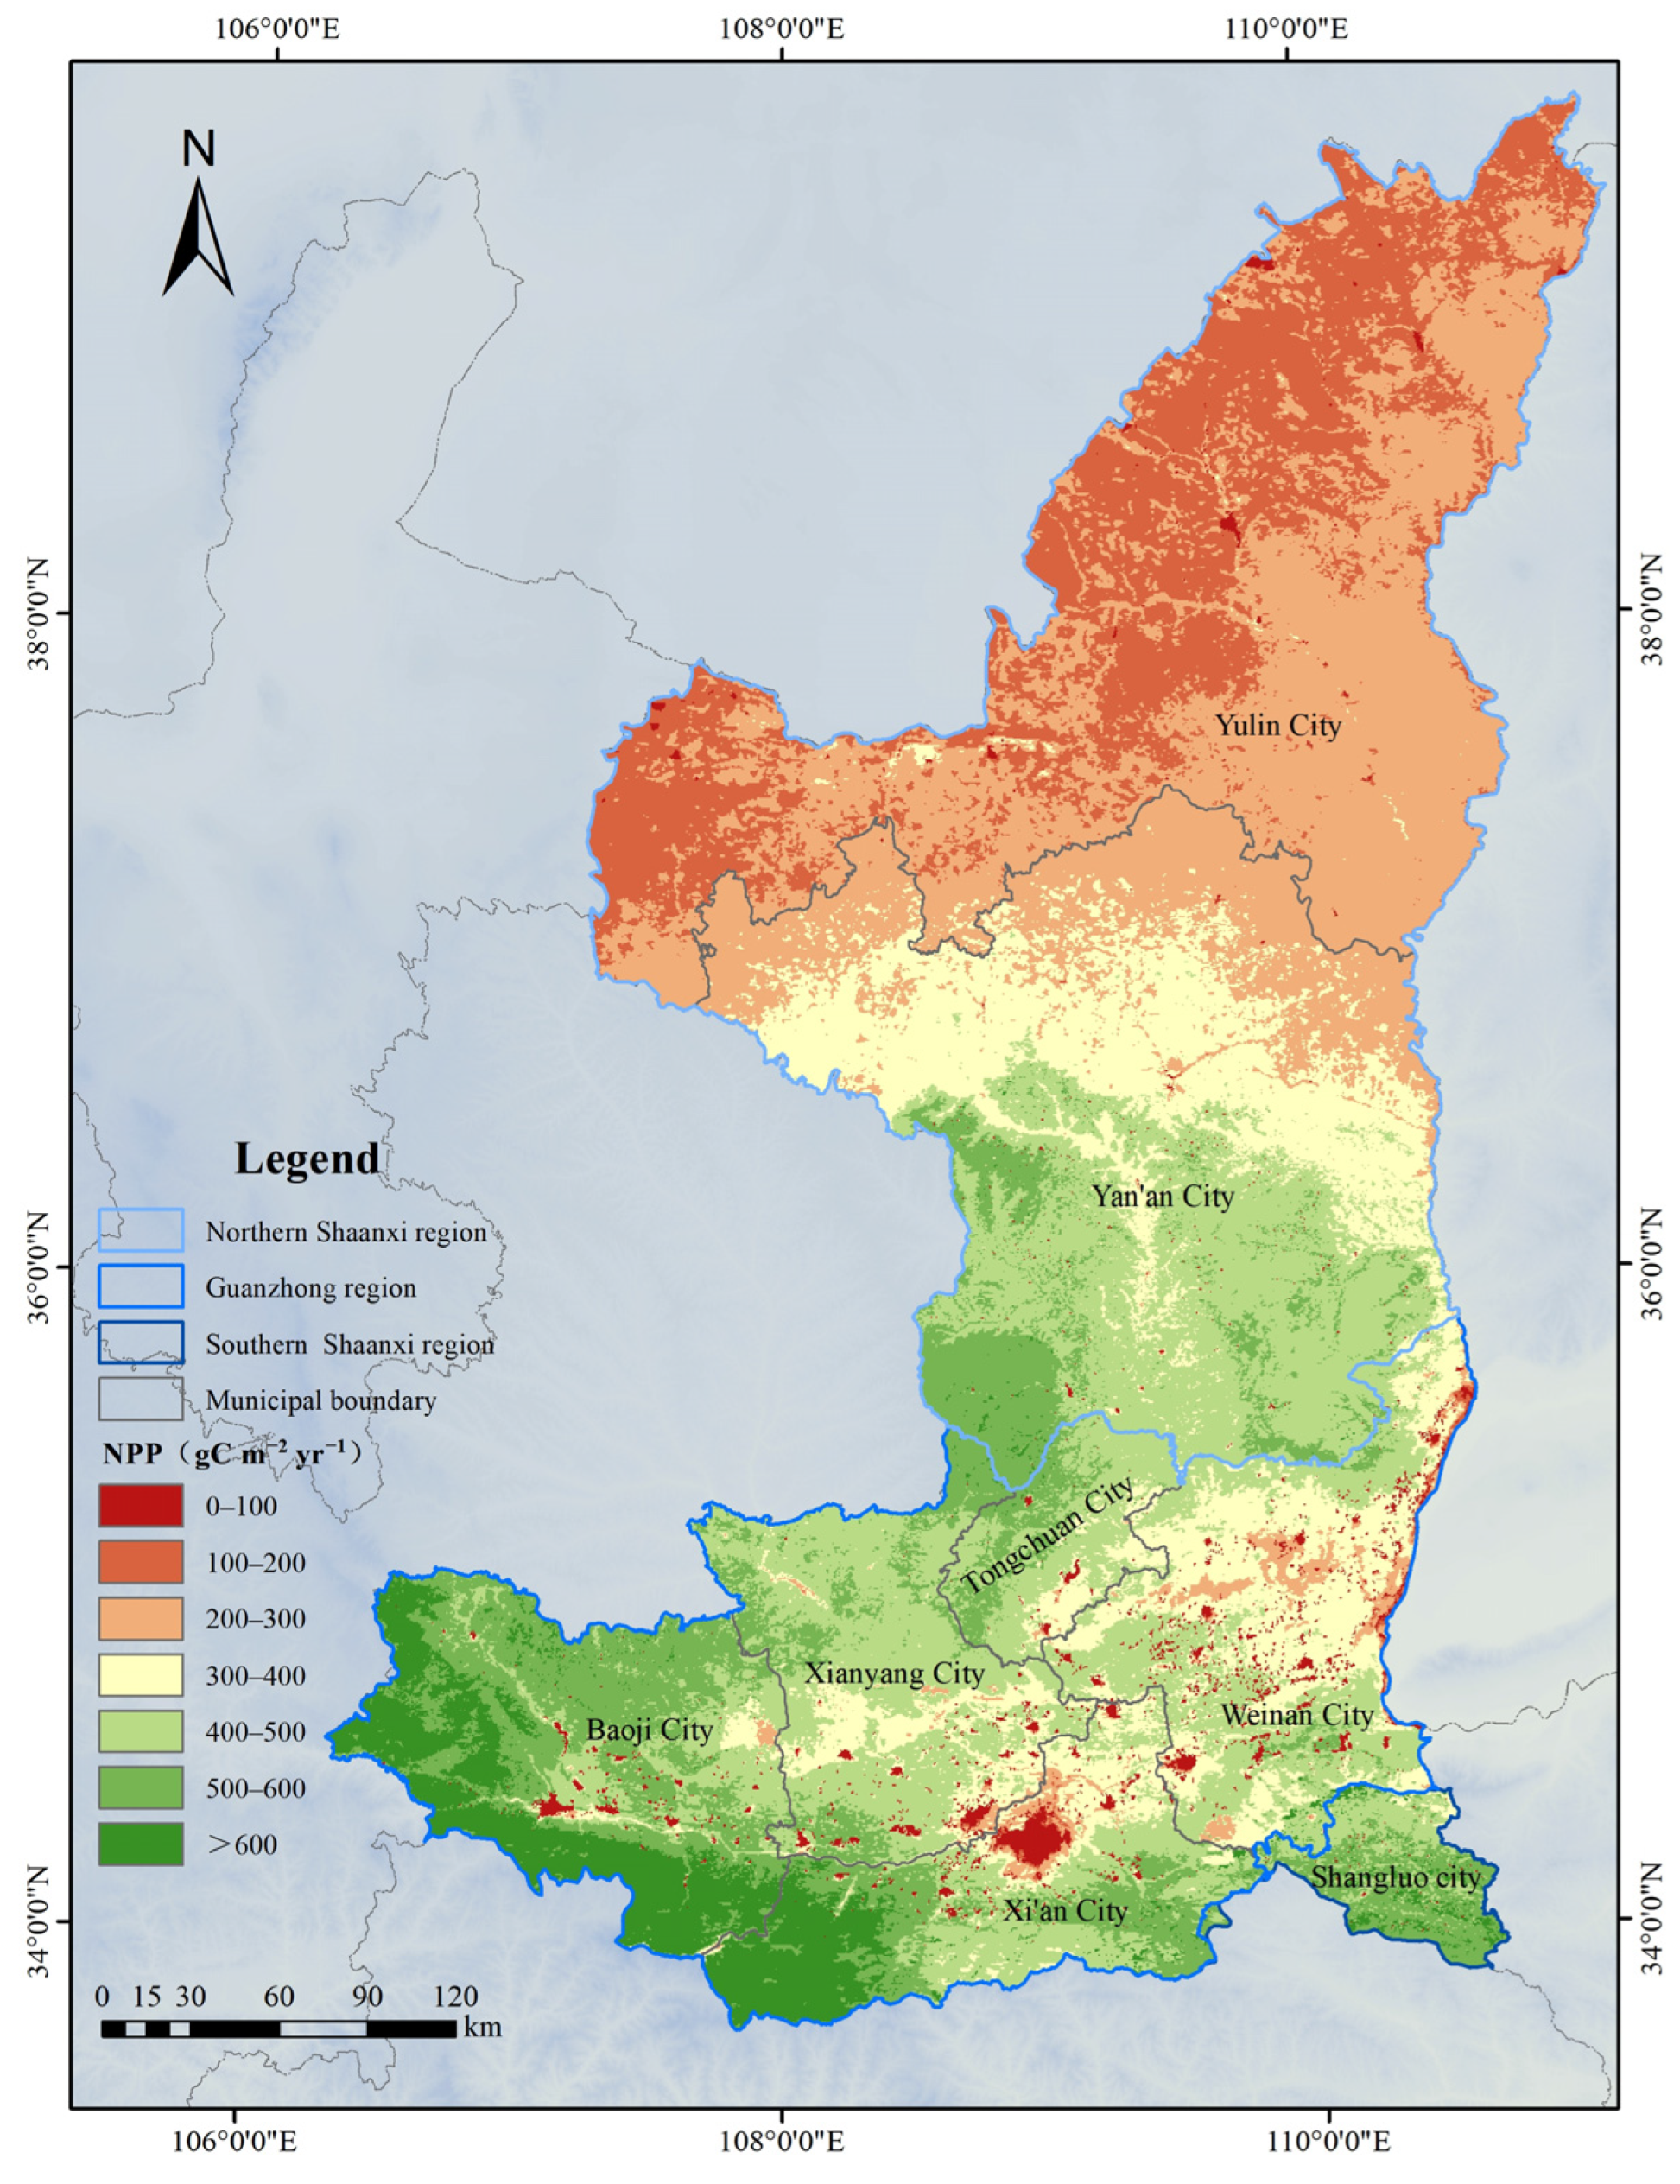
The spatial distribution pattern of annual NPP in the study area from 2000 to 2022 exhibits significant heterogeneity, with an overall increasing trend from north to south in both space and time, as shown in Figure 3. The average annual NPP values are 283.92 g C m−2 for Northern Shaanxi, 457.95 g C m−2 for Guanzhong, and 513.25 g C m−2 for Southern Shaanxi. In the northwestern part of Northern Shaanxi, a low NPP value area is formed, with an average NPP less than 200 g C m−2, primarily located in the Yulin region. High NPP value areas are mainly found in the southwestern part of Guanzhong and Southern Shaanxi, with average vegetation NPP greater than 600 g C m−2, including areas such as the southwestern part of Baoji City, the southern part of Xi’an City, and the southern part of Shangluo City. This phenomenon is related to local vegetation types, topography, and climate.

4.2. Trend of NPP Changes in the Study Area

4.2.1. Spatial Stability of NPP

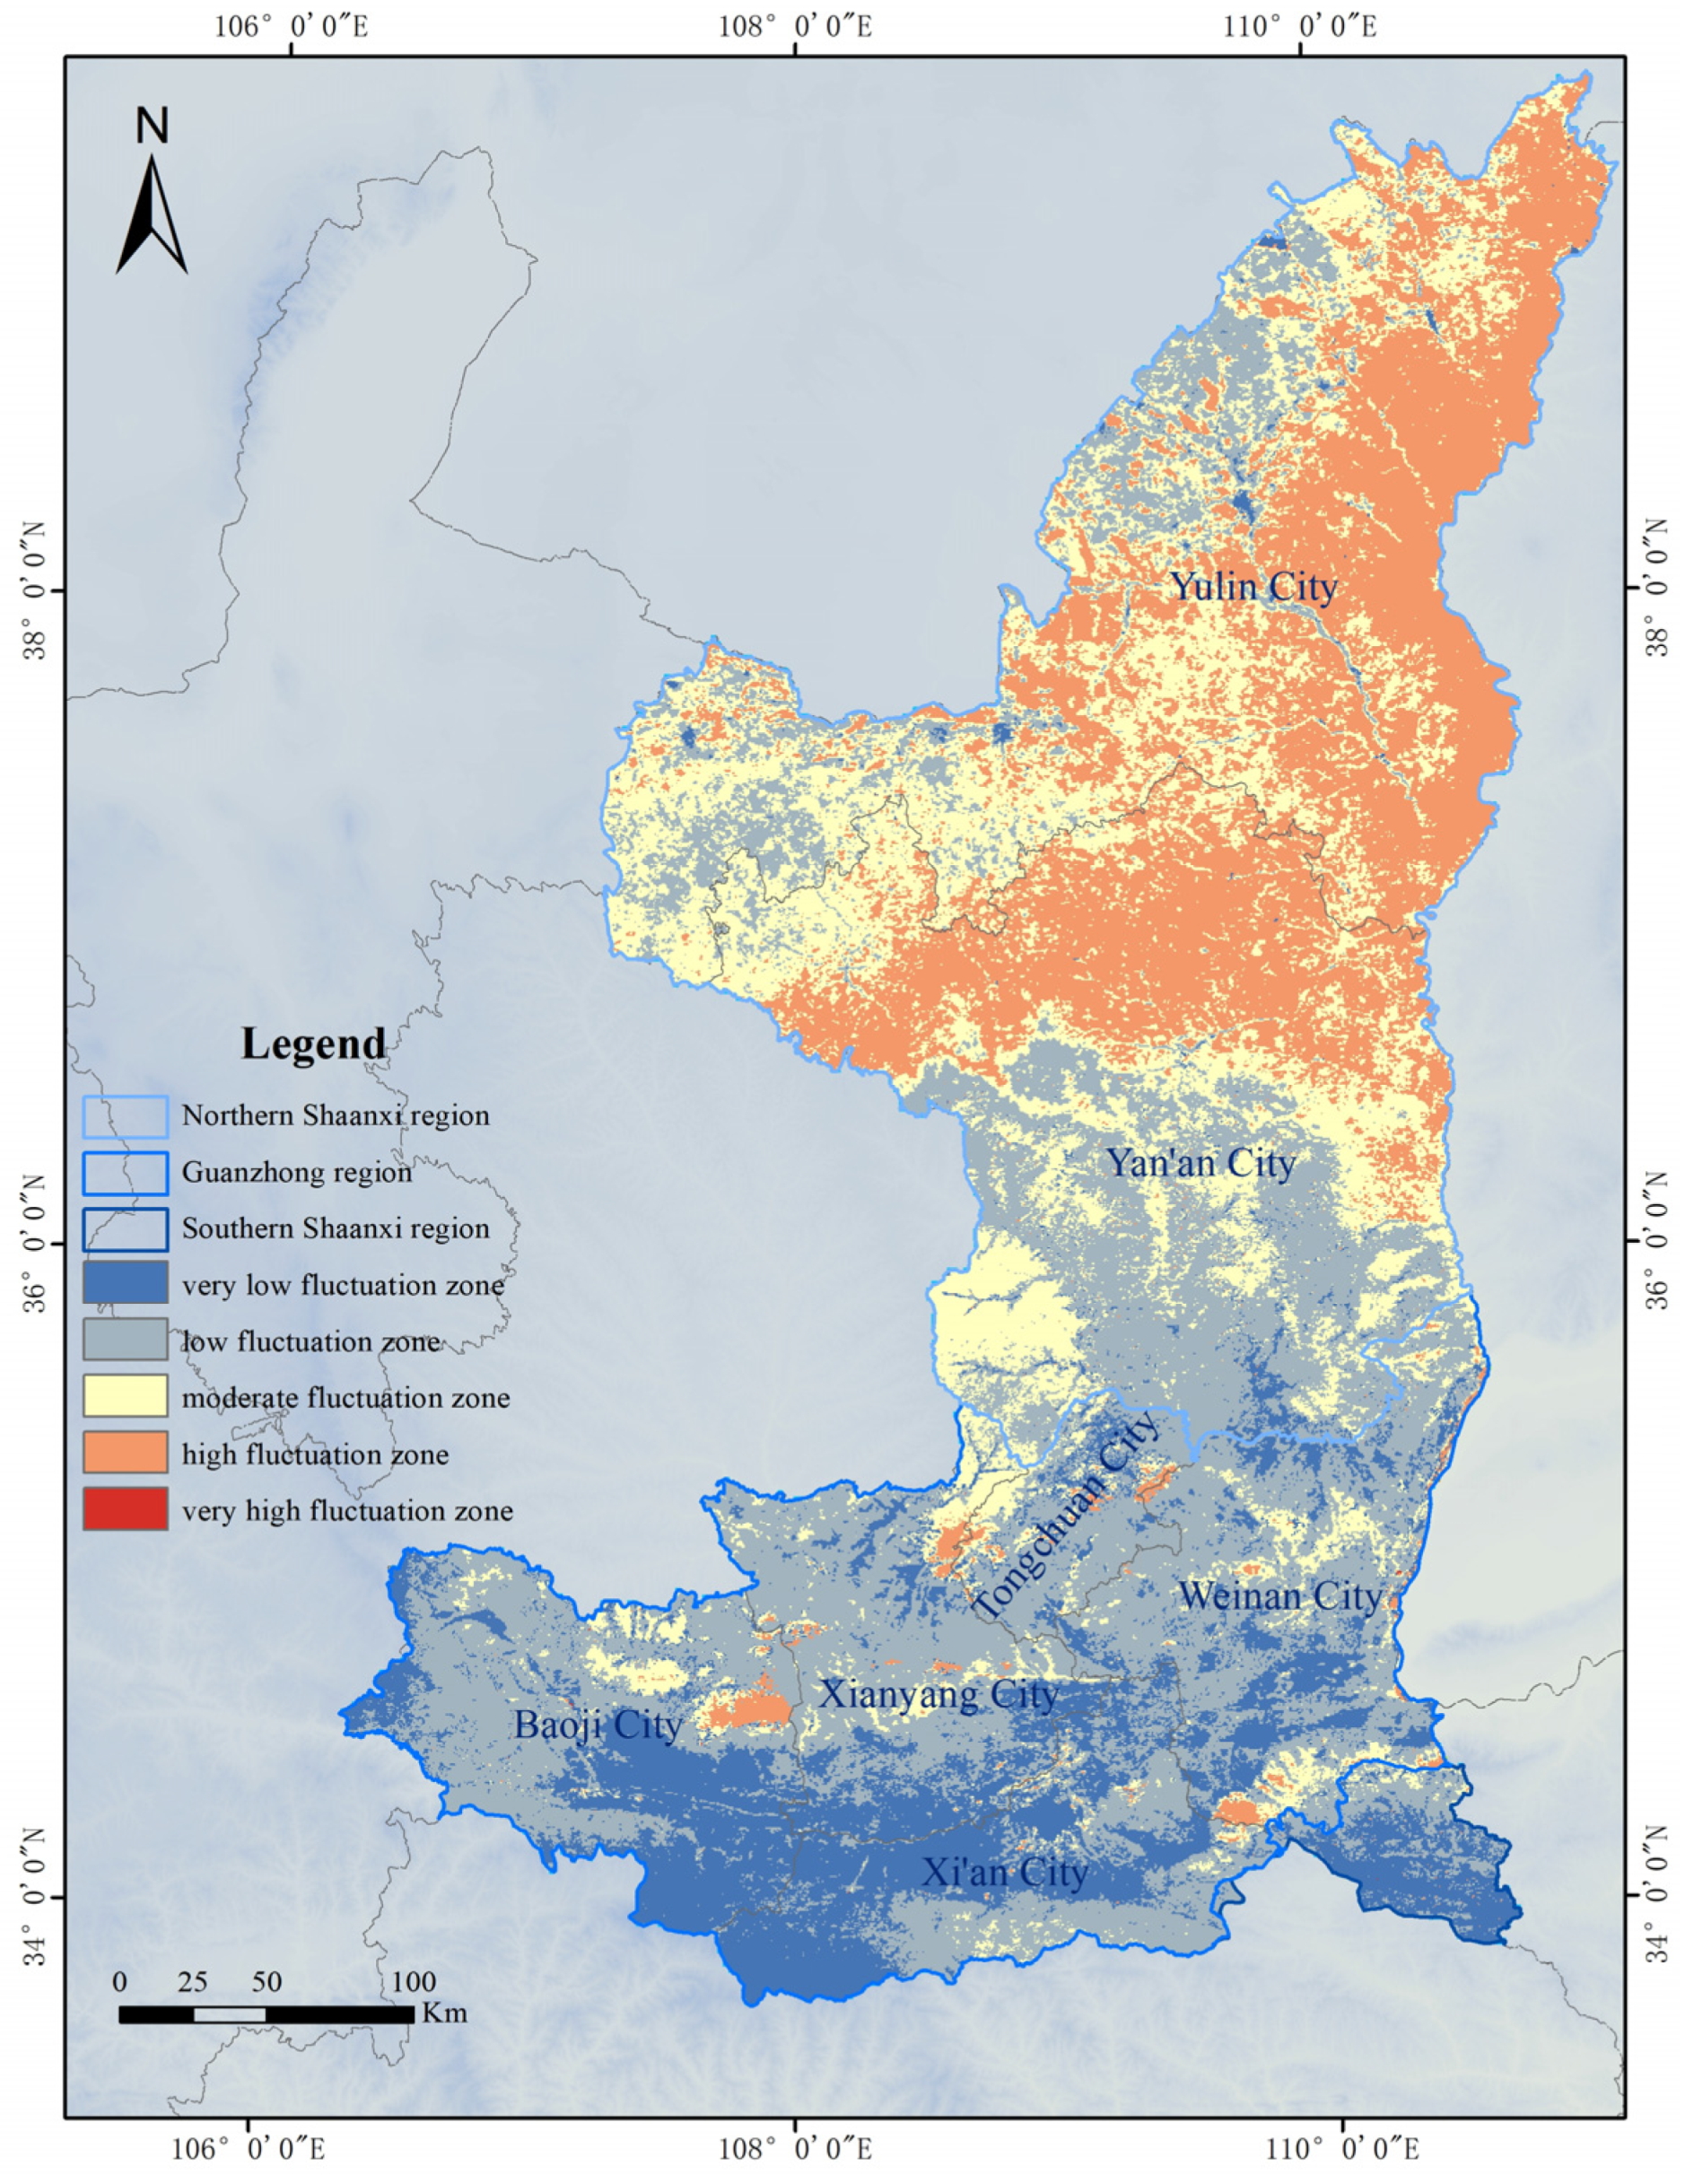
To further understand the spatial stability of NPP, the Cv for each pixel from 2000 to 2022 was calculated. As shown in Figure 4, the Cv of NPP ranged from 0 to 4.48, with an average of 0.19. Low Cv values (0 to 2) accounted for approximately 75.19% of the study area. Over the 23 years, the proportions of the study area classified as very low fluctuation, low fluctuation, moderate fluctuation, high fluctuation, and very high fluctuation zones were 13.58%, 36.32%, 25.29%, 24.80%, and 0.01%, respectively (Figure 4). Spatially, the Cv of average NPP for northern Shaanxi, Guanzhong, and southern Shaanxi was 0.23, 0.14, and 0.12, respectively, indicating overall stability. However, northern Shaanxi exhibited relatively larger fluctuations, particularly in the northern areas of Yulin and Yan’an cities (Figure 4).

4.2.2. NPP Gravity Center Dynamics

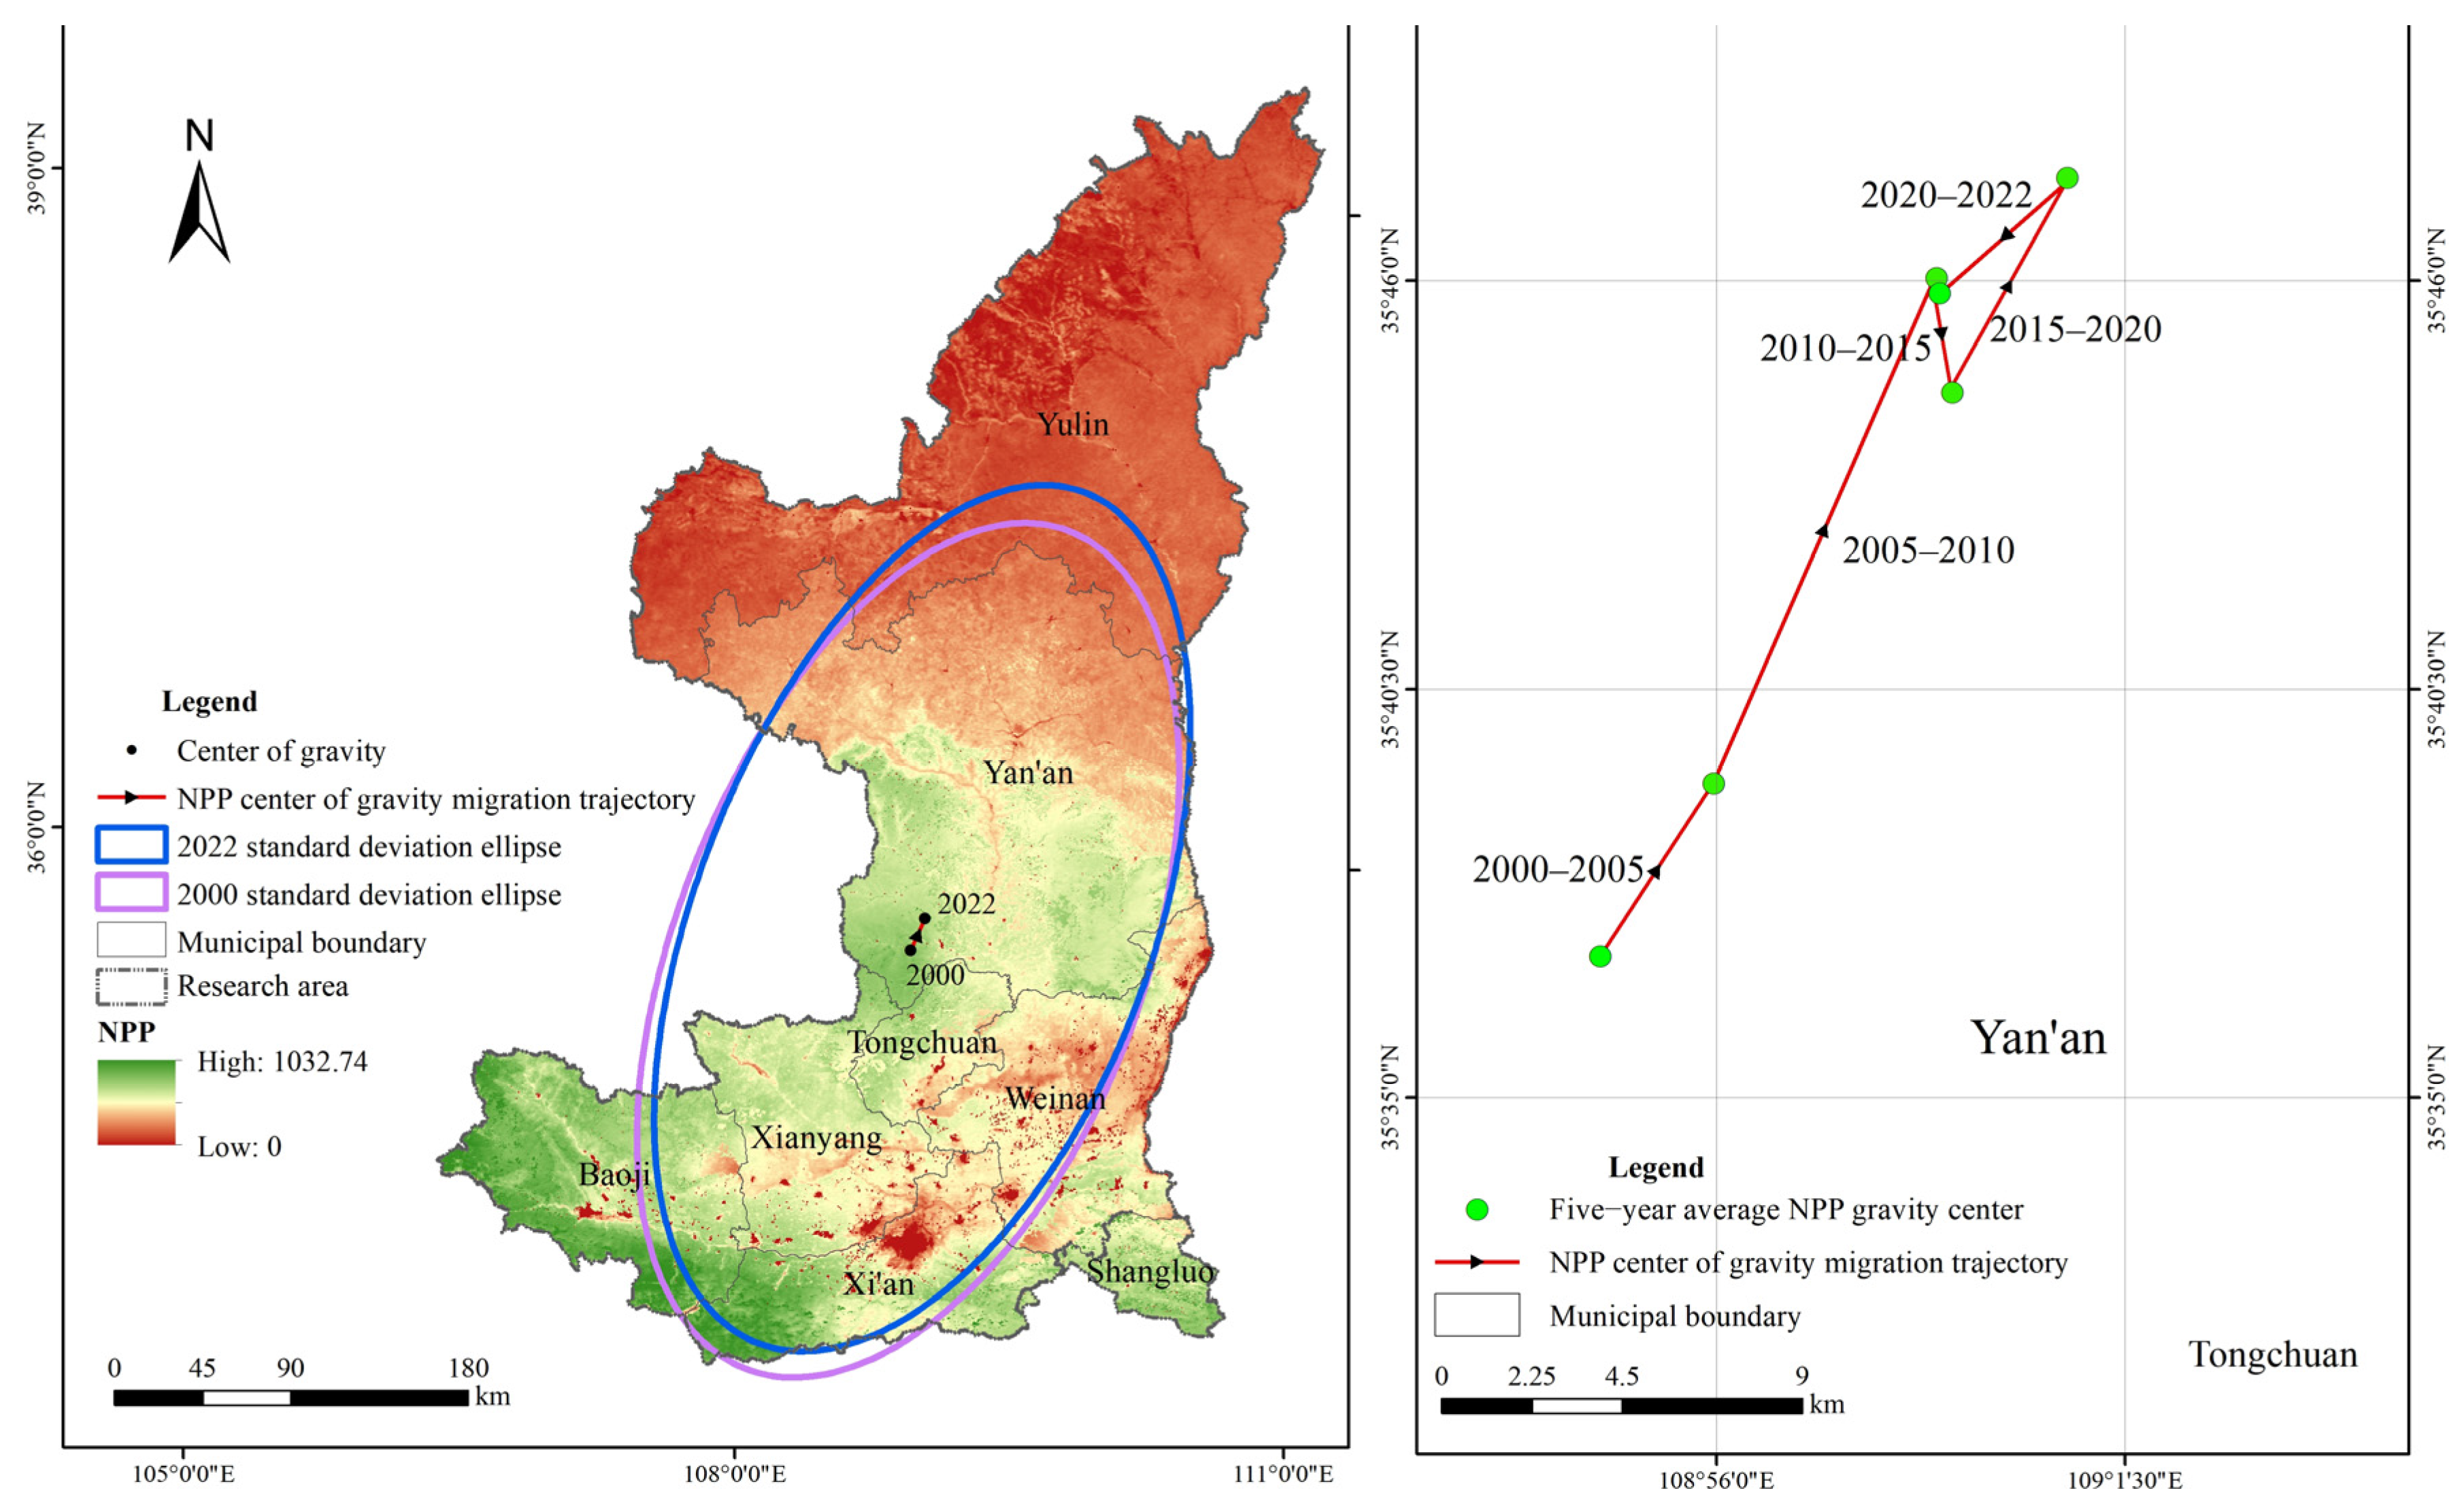
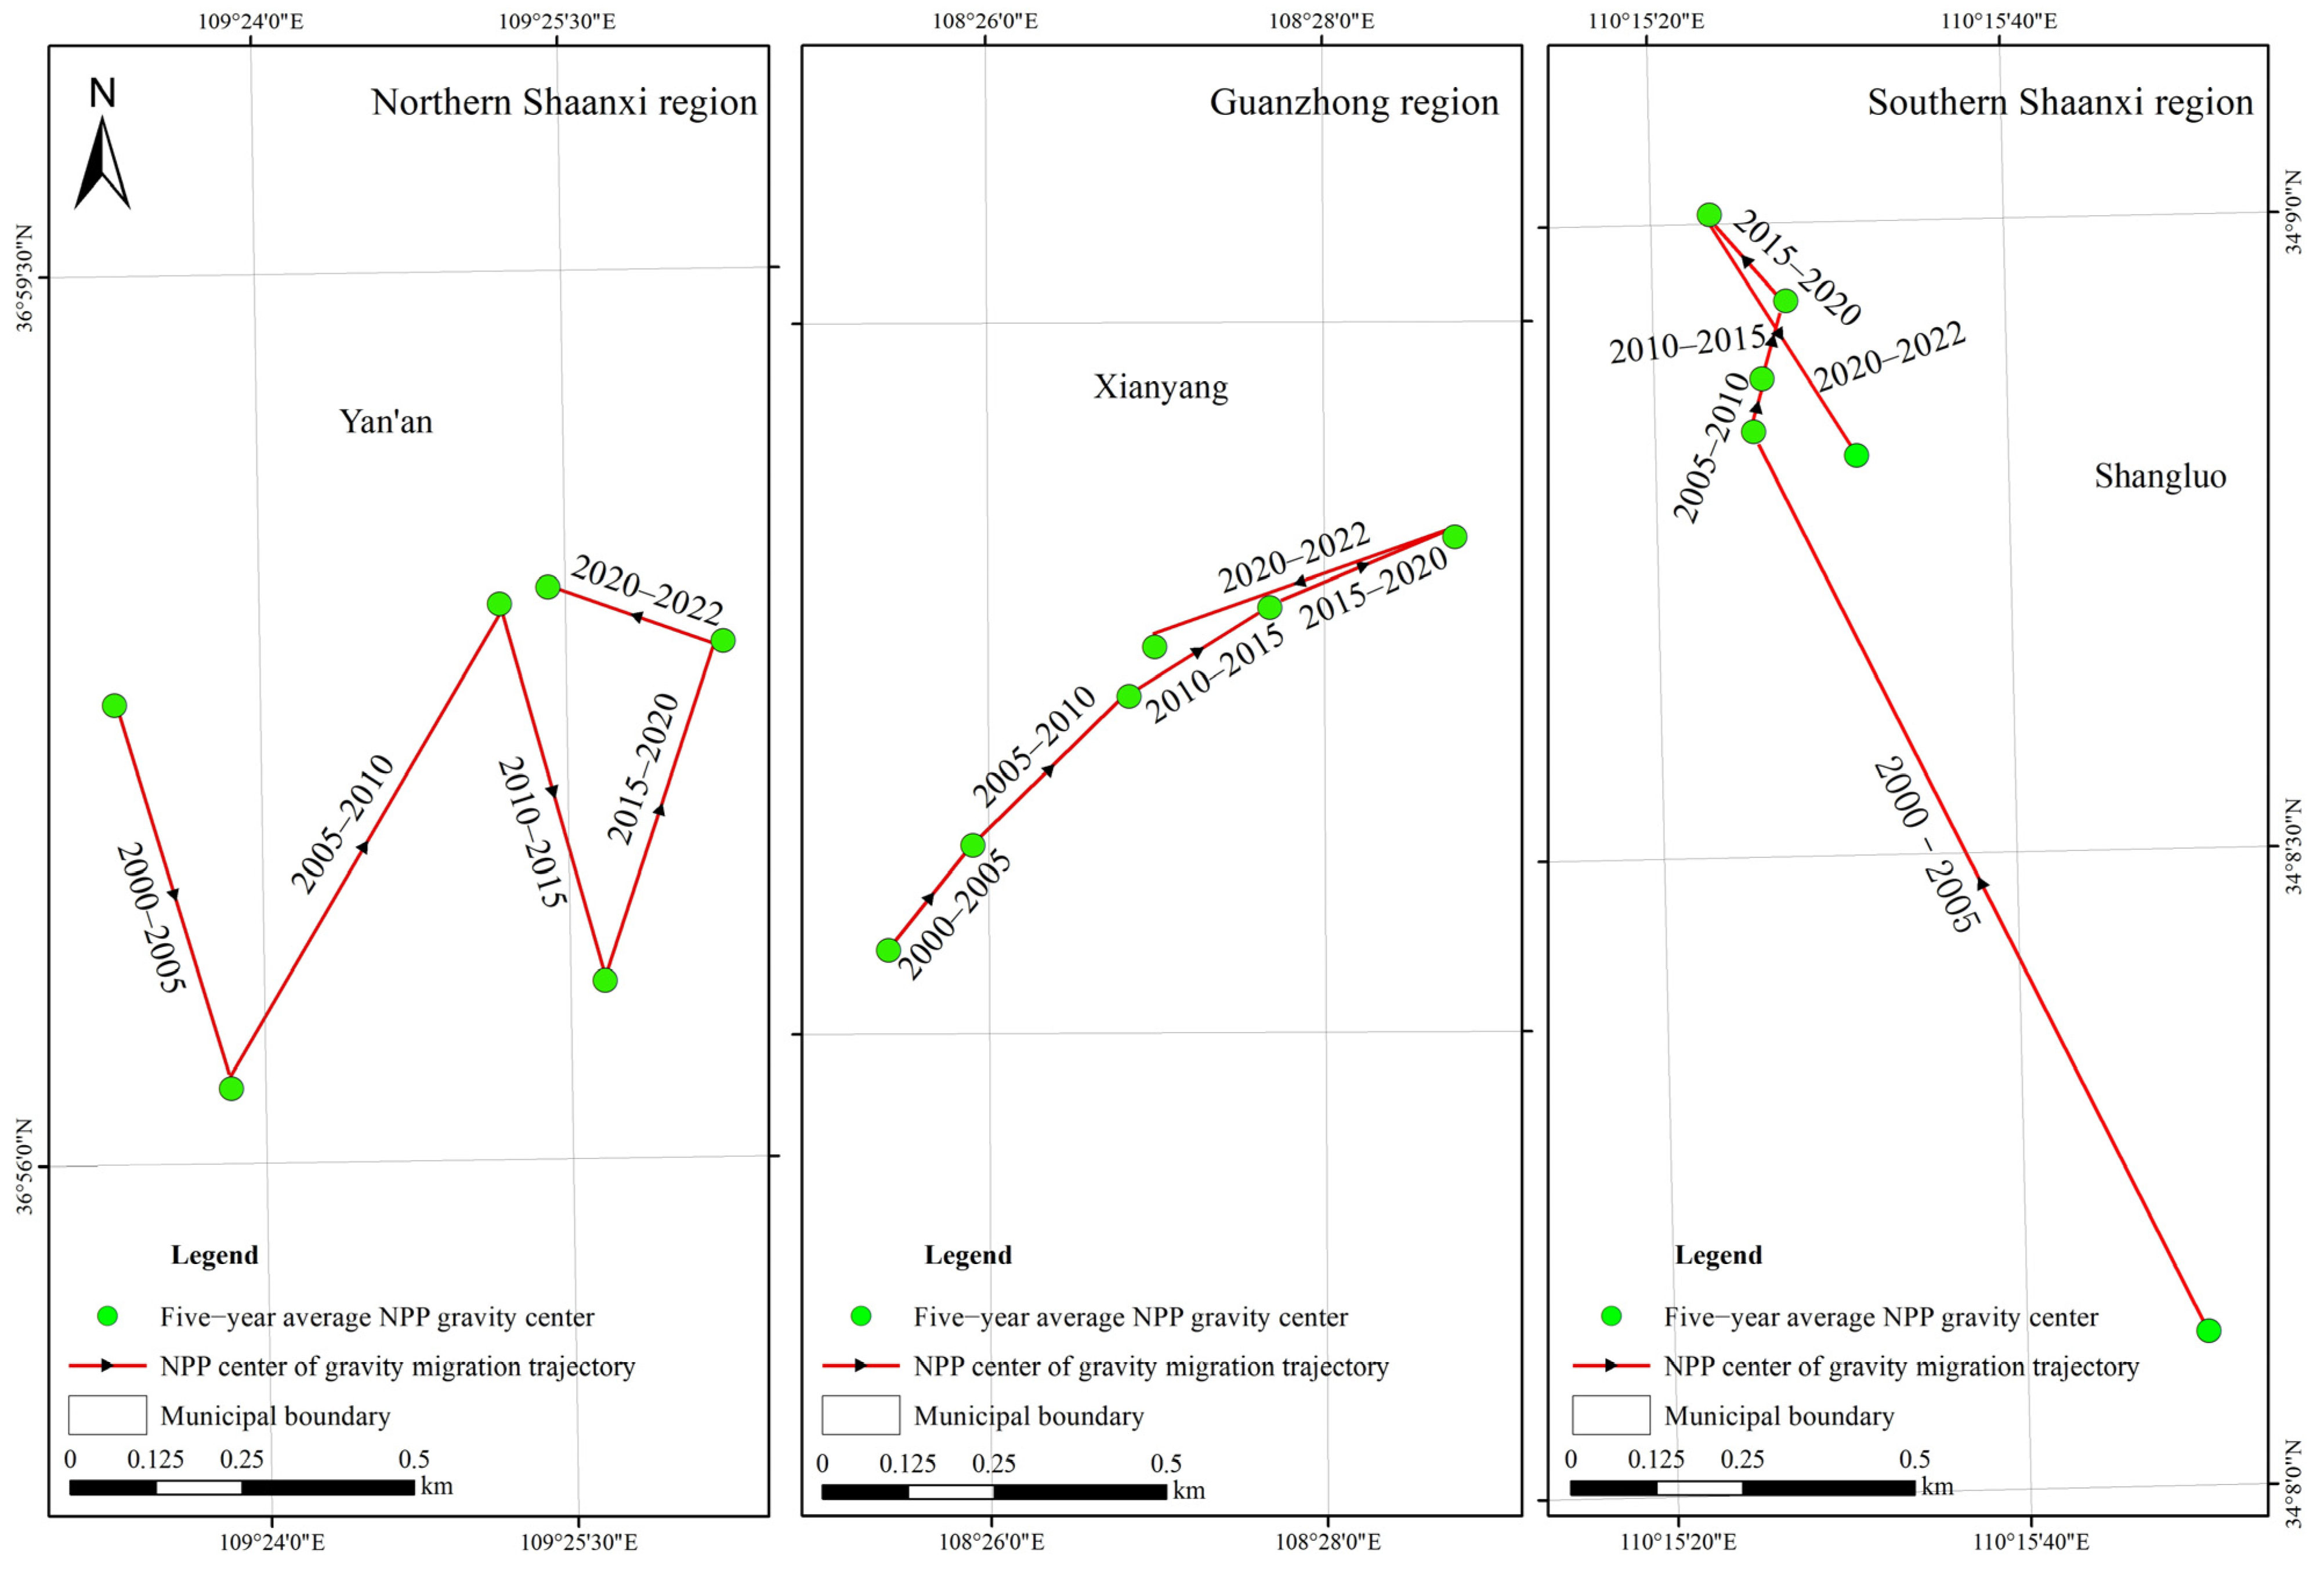
From 2000 to 2022, the NPP gravity center in the study area shifted from the southwest to the northeast (Figure 5 left), with a consistent pattern observed in the 5-year intervals (Figure 5 right). Overall, the centroid moved 17.89 km northeastward, indicating that the NPP increase in the northeastern region was greater than in the southwestern region. Specifically, during the period from 2010 to 2015, the NPP centroid temporarily shifted northwestward.
To further examine the spatial variation of the NPP gravity center within the study area, its shifts over the past 23 years were analyzed for Northern Shaanxi, Guanzhong, and Southern Shaanxi at 5-year intervals (Figure 6). In Northern Shaanxi, the NPP gravity center shifted northeastward by 3.27 km overall, with fluctuations. It moved southeastward during 2000–2005 and 2010–2015, while aligning with the overall northeastward trend during 2005–2010 and 2015–2020. In Guanzhong, the gravity center shifted northeastward by 3.68 km over the 23 years, maintaining consistency with the overall trend from 2000 to 2020, but shifted southwestward during 2020–2022. The changes in Southern Shaanxi were more complex. Over 23 years, the gravity center slightly shifted northwestward by 1.37 km. It moved northeastward from 2005 to 2015, then reversed northwestward during 2015–2020, and finally shifted southeastward during 2020–2022.

4.2.3. The Trend of NPP Changes

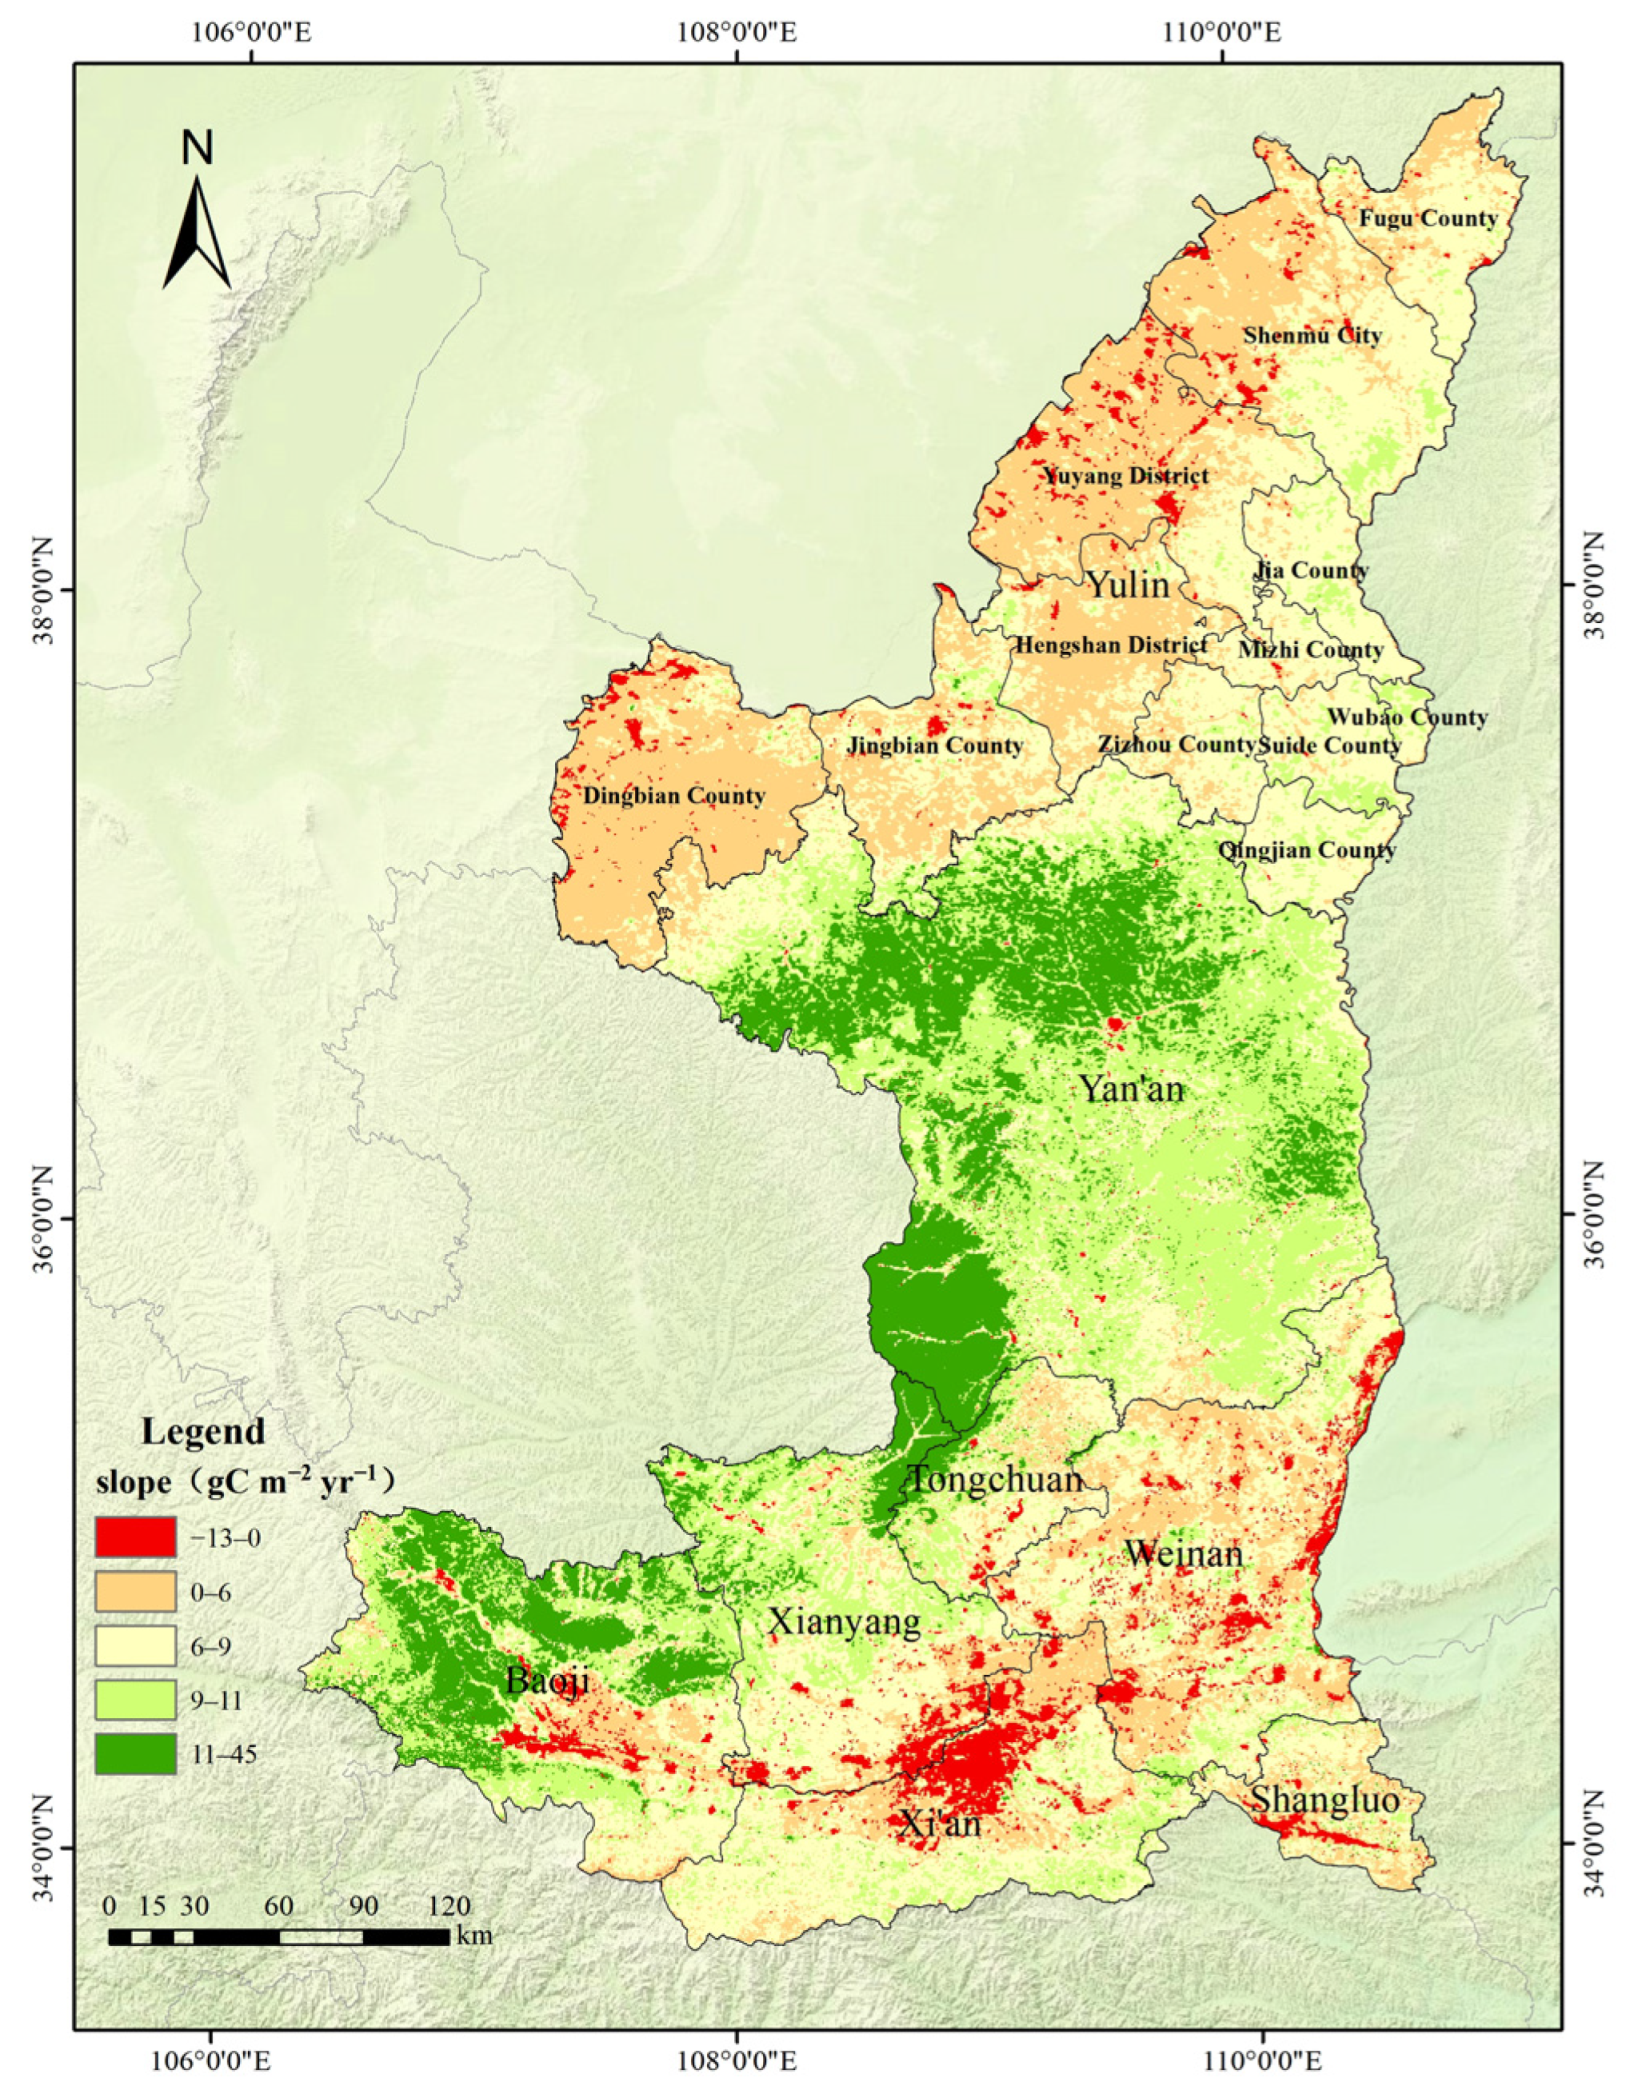
Over the past 23 years, the NPP change slope in the study area ranged from −13.13 g C m−2 yr−1 to 44.46 g C m−2 yr−1 (Figure 7), with an average of 7.58 g C m−2 yr−1, indicating an overall increasing trend. Areas with a positive slope made up 98.07% of the study area, suggesting widespread NPP growth. This increase in NPP likely reflects improvements in vegetation productivity, indicating a potential enhancement in the region’s ecological environment quality.
By region, in northern Shaanxi, Yan’an had the highest slope, ranging from −5.92 to 40.68, with an average of 9.95, indicating an overall improving trend. In Yulin, the average slope was 5.91, with a gradual decline from east to west. Areas with a negative trend were scattered across the northwest, including parts of Dingbian, Hengshan, Yuyang, Shenmu, Jingbian County, and the western part of Fugu County. In the Guanzhong region’s urban agglomeration, as well as in the urban area of Shangluo in southern Shaanxi, the NPP slope showed a downward trend.
The MK test further validates the significance of the trends. Over the 23-year study period, areas with significant degradation and slight degradation accounted for 0.02% and 0.07% of the total area, respectively, mostly concentrated in the urban agglomeration of the Guanzhong region (Figure 8). Meanwhile, significant improvement and slight improvement were observed across 97.83% and 0.70% of the area, respectively. The proportion of NPP improvement far exceeded that of degradation, further reinforcing the overall positive trend in NPP development.

4.3. Spatial Drivers and Interactions on NPP

4.3.1. Driving Factors for Spatial Variations of NPP

This study applied Geodetector to analyze the driving forces of NPP changes over the past 23 years, using six representative years (2000, 2005, 2010, 2015, 2020, and 2022). The q-values in Table 2 identify the dominant factors; the right-most column, “2000–2022”, provides the overall q-value for the entire period, while the intervening columns give the annual q-values for each representative year.
The results indicated that NDVI, precipitation, land use type, PM10, and vegetation type were the primary drivers of NPP spatial variations. NDVI exhibited a fluctuating upward trend, with its q-value rising from 0.629 to 0.744 (p < 0.01). The explanatory power of precipitation increased from 0.643 in 2000 to 0.686 in 2005 before gradually declining to 0.600 by 2022 (p < 0.01). Land use type showed a steady increase in explanatory power from 2000 to 2020, followed by a sharp decline in 2022. PM10 consistently increased in influence, with q-values rising from 0.323 in 2000 to 0.675 in 2022. The explanatory power of vegetation type grew significantly from 2000 to 2005, then remained stable. In contrast, factors such as elevation, slope, aspect, nighttime light, PM2.5, and soil type had relatively low explanatory power, with q-values ranging from 0.001 to 0.234.

4.3.2. Interaction Detection Analysis

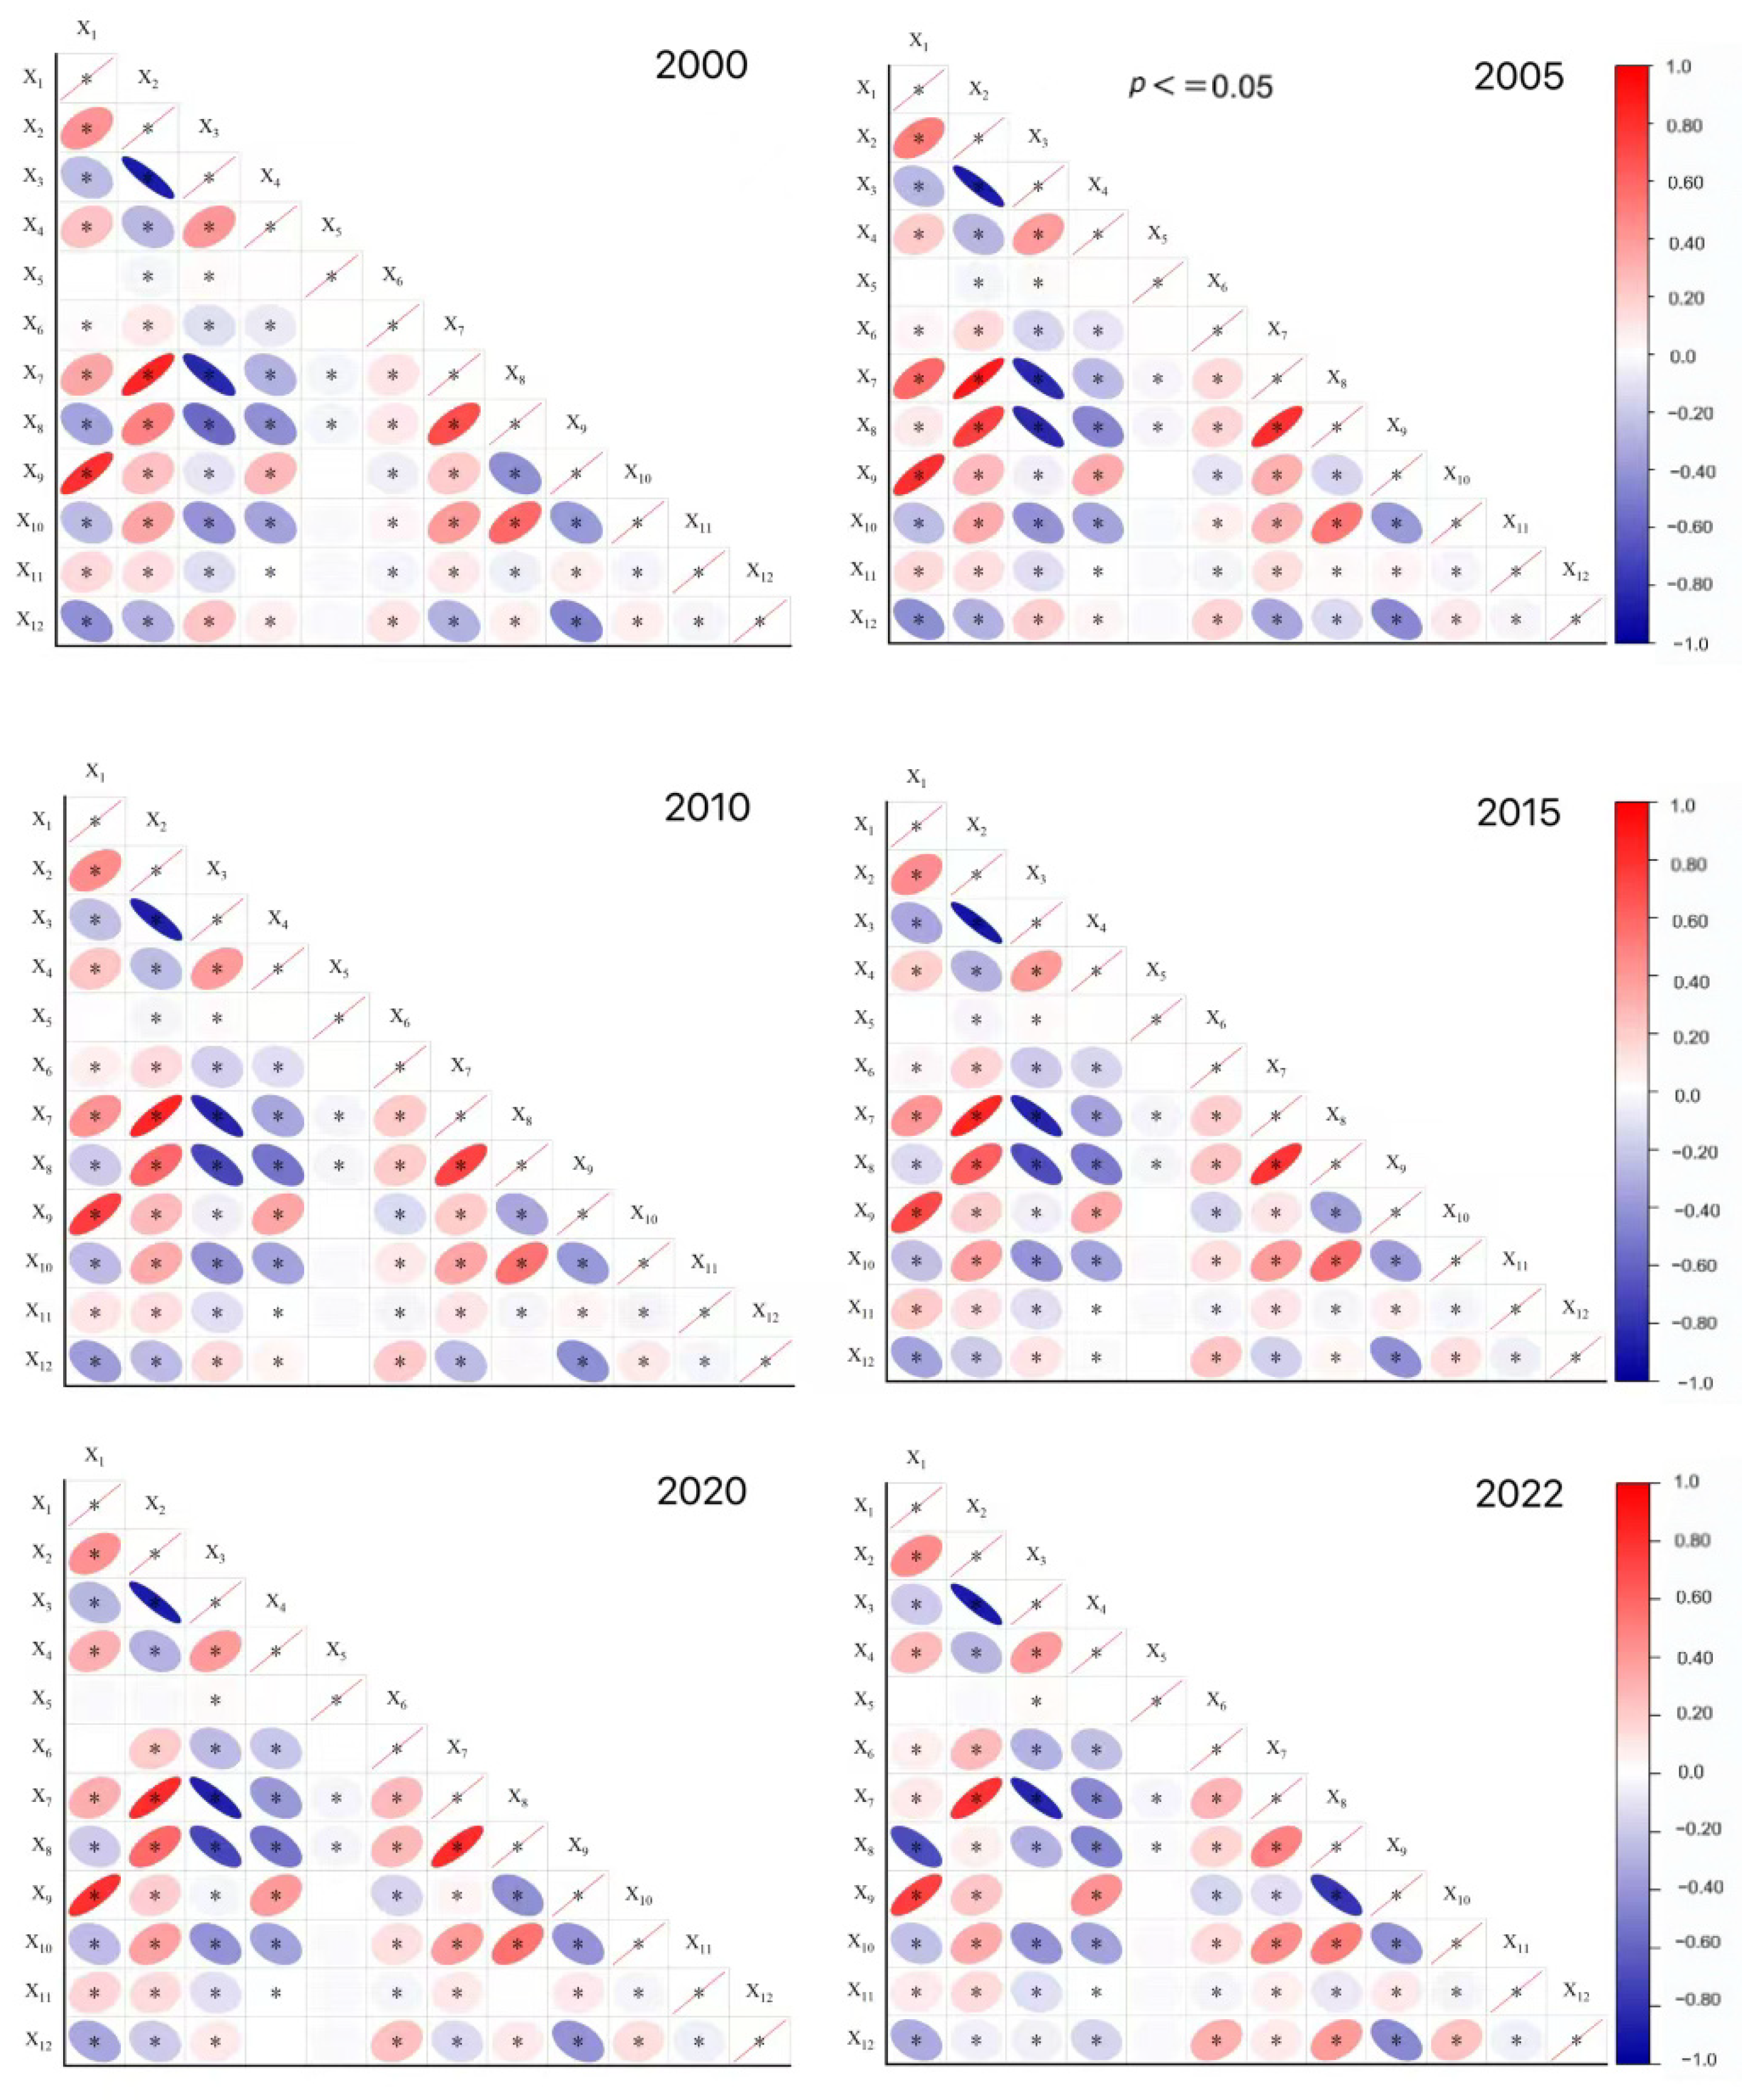
The interaction analysis of the driving factors behind NPP spatial variation (Figure 9) revealed that most interactions exhibited synergistic and nonlinear enhancement, where the explanatory power for NPP changes increased significantly when two factors interacted.
Interactions such as precipitation ∩ land use type (q = 0.771), temperature ∩ land use type (q = 0.592), precipitation ∩ nighttime light (q = 0.734), and NDVI ∩ land use type (q = 0.831) demonstrated that the combined influence of climate or land surface factors with human activity factors had greater explanatory power for NPP. These synergistic effects indicated that NPP spatial variation was not driven by a single factor but rather by the interplay of multiple factors. The combined influence of climate factors, land surface factors, and human activities often led to an amplified explanatory effect.

5. Discussion

5.1. Overall Variations and Spatial Differences in NPP

From 2000 to 2022, the annual average NPP in the study area showed a fluctuating yet overall upward trend. A significant improvement in NPP was observed in 97.83% of the area (p < 0.01), reflecting a general increase in vegetation productivity. These results align with previous studies on NPP trends in the region [80,81]. Notably, the average NPP in 2022 exhibited a marked decline compa.red to 2020. As reported in the 2022 China Ecological and Environmental Status Bulletin [82], consecutive spring and summer droughts, exacerbated by Typhoon “Muifa” and other factors, affected northern regions, including grasslands and desertification zones. These drought conditions likely contributed to a reduction in vegetation quality across parts of the study area, which may explain the observed decrease in NPP in 2022 relative to two years prior.
NPP in the study area exhibits significant spatial variation, with a “higher in the south, lower in the north” pattern, consistent with the findings of Zhang, et al. [83]. The spatial variation in NPP aligns with the distribution patterns of land use types and vegetation types. Specifically, the southern mountainous region of the study area has a warm and humid climate, with temperate deciduous broadleaf forests as the dominant vegetation. These areas have higher vegetation coverage and biodiversity, leading to higher NPP values, as noted by Dengke and Zhao [84] in their study of Shaanxi Province. In contrast, the northern, western, and central-southern regions are primarily grasslands and croplands, where herbaceous crops like wheat and sorghum dominate, resulting in relatively lower NPP values. Furthermore, the studies by Zhu, et al. [85], Li, et al. [86], Ma, et al. [87] have also observed differences in NPP across various vegetation covers, which are consistent with the findings of this research.
In this study, Yan’an in northern Shaanxi showed a significant NPP increase. This was largely due to large-scale soil erosion control efforts on the Loess Plateau since the 1970s, including the Grain for Green Project (GFG) [85,86], which spurred substantial vegetation recovery. The factor detection results (Table 2) also confirmed the impact of land use change on NPP. In addition, the Ziwuling forest in central Yan’an saw improved soil nutrients from vegetation restoration, further boosting forest quality and NPP [87].

5.2. Patterns of NPP Gravity Center Shifts

The shifts in NPP centroid further reveal the dynamic characteristics of different regions. In northern Shaanxi, the overall NPP centroid shifted northeastward. Studies have shown that over the past 23 years, forest area expansion in northern Shaanxi exhibited a spatial pattern of “greater growth in the northeast than in the southwest,” which aligns with the spatial trend of NPP changes [88]. However, during the period from 2010 to 2015, while the forest growth rate in Yulin City (northern part) reached as high as 213.11%, far exceeding the 7.3% growth in Yan’an City (southern part), the NPP centroid shifted southward, contrary to the spatial pattern of forest growth.
Further analysis revealed that during this period, the impervious surface area in Yan’an increased by 24.82%, higher than the 19.75% increase in Yulin. Since 2012, the construction of a new urban area in Yan’an led to reductions in natural vegetation, consequently decreasing NPP [89]. However, the urban heat island effect provided some degree of enhancement to urban vegetation NPP [90,91]. Studies have shown that in the global urbanization process, although urbanization reduces natural vegetation, the greenness of vegetation within urban areas tends to increase due to indirect impacts of the urban environment, with a global average enhancement of 26% [92]. This indirect enhancement of vegetation growth partially compensated for the vegetation loss caused by urban expansion, especially in urban core areas.
Therefore, this study suggests that the southward shift of the NPP centroid in northern Shaanxi during 2010–2015 was mainly associated with the expansion of impervious surfaces due to land use changes. This conclusion aligns with the findings from the geographic detector analysis conducted in this study, which identified land use change as a major driver of NPP variation.
A similar mechanism was observed in the Guanzhong region, where the NPP centroid shifted along a “southwest-to-northeast” direction, consistent with the spatial distribution of construction land expansion [88]. The expansion of construction land enhanced the positive impact of the urban heat island effect on vegetation NPP [92], driving this shift.
In contrast, the NPP centroid in southern Shaanxi exhibited minimal overall change but showed a significant northwestward shift during 2000–2005. In 2002, ecological restoration projects were launched in Shangluo City [84]. As a major agricultural area, northern parts of southern Shaanxi experienced significant vegetation recovery under the GFG project, which likely drove the substantial northwestward shift in the NPP centroid [93,94]. Subsequently, with the continued implementation of ecological projects, the NPP centroid in southern Shaanxi stabilized, showing minimal variation.

5.3. Analysis of Driving Mechanisms

The interaction detection results (Figure 9.) indicated that the combined influence of precipitation and NDVI significantly impacted NPP in the study area. Over the course of this study, the annual average NDVI increased significantly. This increase was driven by both human interventions, such as the GFG project, and enhanced rainfall. Precipitation, a critical driver of vegetation growth [95], rose by an average of 5.85 mm per year over the past 23 years, likely contributing to vegetation recovery and the rapid increase in NPP.
The interaction between precipitation and PM10 was the strongest (Figure 9) before 2010, exhibiting nonlinear enhancement. Both factors were closely related to air quality and the terrestrial ecological environment [96]. PM10 particles contain harmful substances that can adversely affect vegetation [97]. Increased precipitation can cleanse particulate matter from the air, depositing it on the ground and thus reducing its concentration in the atmosphere [98].
After 2010, the interaction between NDVI and PM10 was the strongest, with NDVI also showing significantly enhanced interactions with other indicators. This indicated that NDVI had a strong influence on the spatial variation of NPP. As an indicator of vegetation growth, higher NDVI values reflected better local ecological conditions and higher NPP, consistent with the findings of Zuo and Gao [99] in karst areas.
The strong interactions between precipitation, PM10, and NDVI underscore vegetation’s sensitivity to air quality and the ecological environment. Thus, advancing ecological management, improving air quality, and maintaining a healthy ecosystem are critical for enhancing NPP.

6. Conclusions

(1) From 2000 to 2022, the average NPP in the Yellow River Basin (Shaanxi section) was 353.01 g C m−2yr−1, with a significant upward trend of 9.7 g C m−2yr−1 (p < 0.01). Spatially, NPP was higher in the south and lower in the north, with the highest values found in Yan’an, northern Shaanxi.
(2) The Cv for NPP indicated overall stability, with low Cv values covering approximately 75.19% of the study area. Northern Shaanxi showed relatively larger fluctuations, particularly in the northern areas of Yulin and Yan’an cities. NPP variability was stable in Guanzhong and southern Shaanxi, while northern Shaanxi showed greater fluctuations, likely due to large-scale ecological restoration altering land use and vegetation. Over the 23-year period, the NPP centroid shifted in a southwest-to-northeast direction, covering a total distance of 17.89 km.
(3) Over the past 23 years, areas with a highly significant increase in NPP accounted for 97.83% of the study area, indicating that most of the region experienced NPP growth. This may suggest an overall improvement in the ecological environment.
(4) NDVI, precipitation, land use, PM10, and vegetation type were the primary drivers of NPP’s spatial distribution in the study area. The synergistic and nonlinear interactions among these factors significantly influenced NPP, with the NDVI and land use type interaction showing the strongest explanatory power (q = 0.831). This highlights the need to consider both natural factors and human activities when evaluating NPP changes.

Author Contributions

Conceptualization, Q.L. and T.X.; methodology, Q.L. and T.X.; software, Q.L.; validation, D.L., L.C. and Q.L.; formal analysis, D.L., L.C. and Y.M.; investigation, Q.L., T.X. and Y.Z.; resources, T.X.; data curation, D.L., L.C. and Y.M.; writing—original draft preparation, Q.L.; writing—review and editing, T.X. and D.L.; visualization Q.L.; supervision, T.X.; project administration, D.L., Y.Z. and L.C.; funding acquisition, T.X. All authors have read and agreed to the published version of the manuscript.

Funding

This research was funded by the Shaanxi Provincial Public Welfare Geological Survey Project, grant number 202508; the Shaanxi Provincial Public Welfare Geological Survey Project, grant number 202311; the Young Talent Fund of Association for Science and Technology in Shaanxi, China, grant number 20230125; the Shaanxi Province Financial Special Project “Construction and Demonstration Application of Qinling Satellite Remote Sensing Integrated Monitoring Service Platform”, grant number 202254; and the Xidian University Project “Intelligent Interpretation Technology and Demonstration Application of Multimodal Remote Sensing Data”,grant number 2024GX-ZDCYL-02-08. The APC was funded by the Shaanxi Provincial Public Welfare Geological Survey Project, grant number 202508.

Institutional Review Board Statement

Not applicable.

Informed Consent Statement

Not applicable.

Data Availability Statement

Data is contained within the article.

Conflicts of Interest

The authors declare no conflict of interest.

References

  1. Running, S.W.; Thornton, P.E.; Nemani, R.; Glassy, J.M. Global terrestrial gross and net primary productivity from the earth observing system. In Methods in Ecosystem Science; Springer: Berlin/Heidelberg, Germany, 2000; pp. 44–57. [Google Scholar]
  2. Cao, M.; Woodward, F.I. Dynamic responses of terrestrial ecosystem carbon cycling to global climate change. Nature 1998, 393, 249–252. [Google Scholar] [CrossRef]
  3. Fang, J.; Chen, A.; Peng, C.; Zhao, S.; Ci, L. Changes in forest biomass carbon storage in China between 1949 and 1998. Science 2001, 292, 2320–2322. [Google Scholar] [CrossRef]
  4. Carlson, T.N.; Ripley, D.A. On the relation between NDVI, fractional vegetation cover, and leaf area index. Remote Sens. Environ. 1997, 62, 241–252. [Google Scholar] [CrossRef]
  5. Bolinder, M.A.; Janzen, H.H.; Gregorich, E.G.; Angers, D.A.; Vandenbygaart, A.J. An approach for estimating net primary productivity and annual carbon inputs to soil for common agricultural crops in Canada. Agric. Ecosyst. Environ. 2007, 118, 29–42. [Google Scholar] [CrossRef]
  6. Cleveland, C.C.; Townsend, A.R.; Taylor, P.; Alvarez-Clare, S.; Bustamante, M.M.; Chuyong, G.; Dobrowski, S.Z.; Grierson, P.; Harms, K.E.; Houlton, B.Z. Relationships among net primary productivity, nutrients and climate in tropical rain forest: A pan-tropical analysis. Ecol. Lett. 2011, 14, 939–947. [Google Scholar] [CrossRef] [PubMed]
  7. van Breemen, N. Soils as biotic constructs favouring net primary productivity. Geoderma 1993, 57, 183–211. [Google Scholar] [CrossRef]
  8. Ren, L.; Zhao, W.; Li, J.; Chen, J.; Li, Y.; Zou, H.; Zhang, Y. Characteristics of soil CO2 emission and carbon balance in greenhouse soil under different fertilization patterns. Chin. J. Soil Sci. 2022, 53, 874881. [Google Scholar]
  9. Running, S.W.; Coughlan, J.C. A general model of forest ecosystem processes for regional applications I. Hydrologic balance, canopy gas exchange and primary production processes. Ecol. Model. 1988, 42, 125–154. [Google Scholar] [CrossRef]
  10. Field, C.B.; Randerson, J.T.; Malmström, C.M. Global net primary production: Combining ecology and remote sensing. Remote Sens. Environ. 1995, 51, 74–88. [Google Scholar] [CrossRef]
  11. Tagesson, T.; Smith, B.; Lfgren, A.; Rammig, A.; Lindroth, E.A. Estimating Net Primary Production of Swedish Forest Landscapes by Combining Mechanistic Modeling and Remote Sensing. Ambio 2009, 38, 316–324. [Google Scholar] [CrossRef]
  12. Wang, S.; Mo, X. Comparison of multiple models for estimating gross primary production using remote sensing data and fluxnet observations. Remote Sens. GIS Hydrol. Water Resour. 2015, 368, 75–80. [Google Scholar] [CrossRef]
  13. Zhao, M.; Running, S.W. Drought-induced reduction in global terrestrial net primary production from 2000 through 2009. Science 2010, 329, 940–943. [Google Scholar] [CrossRef] [PubMed]
  14. Qiao, B.; Cao, X.; Sun, W.; Gao, Y.; Chen, Q.; Yu, H.; Wang, Z.; Wang, N.a.; Cheng, H.; Wang, Y. Ecological zoning identification and optimization strategies based on ecosystem service value and landscape ecological risk: Taking Qinghai area of QilianM ountain National Park as an example. Acta Ecol. Sin. 2023, 43, 986–1004. [Google Scholar]
  15. Hou, J.; Li, M.; Mao, X.; Hao, Y.; Liu, H. Response of microbial community of organic-matter-impoverished arable soil to long-term application of soil conditioner derived from dynamic rapid fermentation of food waste. PLoS ONE 2017, 12, e0175715. [Google Scholar] [CrossRef]
  16. Jenkinson, D.; Adams, D.; Wild, A. Model estimates of CO2 emissions from soil in response to global warming. Nature 1991, 351, 304–306. [Google Scholar] [CrossRef]
  17. He, H.; MaB, X. Spatiotemporal changes of NPP and Natural factors in the Southwestern karst areas from 2000 to 2019. Res. Soil Water Conserv. 2022, 29, 172–178, 188. [Google Scholar]
  18. Ji, Y.; Zhou, G.; Luo, T.; Dan, Y.; Zhou, L.; Lv, X. Variation of net primary productivity and its drivers in China’s forests during 2000–2018. For. Ecosyst. 2020, 7, 15. [Google Scholar] [CrossRef]
  19. Ren, H.; Shang, Y.; Zhang, S. Measuring the spatiotemporal variations of vegetation net primary productivity in Inner Mongolia using spatial autocorrelation. Ecol. Indic. 2020, 112, 106108. [Google Scholar] [CrossRef]
  20. Wei, J.; Yaning, C.; Weihong, L.I.; Chenggang, Z.; Zhi, L.I. Estimation of net primary productivity and its driving factors in the Ili River Valley, China. J. Arid. Land 2018, 10, 781–793. [Google Scholar] [CrossRef]
  21. ZHU, Y.-y.; HAN, L.; ZHAO, Y.-h.; AO, Y.; LI, J.-j.; XU, K.-b.; LIU, B.; GE, Y.-y. Simulation and spatio-temporal pattern of vegetation NPP in northwest China. Chin. J. Ecol. 2019, 38, 1861. [Google Scholar]
  22. Chen, Y.; Li, Y.; Wang, X.; Yao, C.; Niu, Y. Risk and countermeasures of global change in ecologically vulnerable regions of China. J. Desert Res. 2022, 42, 148. [Google Scholar]
  23. Zhang, Z.; Pan, H.; Liu, Y.; Sheng, S. Ecosystem services’ response to land use intensity: A case study of the Hilly and Gully Region in China’s Loess Plateau. Land 2024, 13, 2039. [Google Scholar] [CrossRef]
  24. Xiao, T.; Wang, J.B.; Chen, Z.Q. Vulnerability of Grassland Ecosystems in the Sanjiangyuan Region Based on NPP. Resour. Sci. 2010, 32, 323–330. [Google Scholar]
  25. Chen, X.; Bai, J.; Li, X.; Luo, G.; Li, J.; Li, B.L. Changes in land use/land cover and ecosystem services in Central Asia during 1990–2009. Curr. Opin. Environ. Sustain. 2013, 5, 116–127. [Google Scholar] [CrossRef]
  26. Shi, W.Y.; Chen, Y.Z.; Feng, X.M. Identifying the terrestrial carbon benefits from ecosystem restoration in ecologically fragile regions. Agric. Ecosyst. Environ. 2020, 296, 106889. [Google Scholar] [CrossRef]
  27. Bai, X.; Zhang, Z.; Li, Z.; Zhang, J. Spatial heterogeneity and formation mechanism of eco-environmental quality in the Yellow River Basin. Sustainability 2023, 15, 10878. [Google Scholar] [CrossRef]
  28. Yong, X.; Chuansheng, W. Ecological protection and high-quality development in the Yellow River Basin: Framework, path, and countermeasure. Bull. Chin. Acad. Sci. (Chin. Version) 2020, 35, 875–883. [Google Scholar]
  29. Zhang, J.; Liu, Y.; Liu, C.; Guo, S.; Cui, J. Study on the spatial and temporal evolution of high-quality development in nine provinces of the Yellow River Basin. Sustainability 2023, 15, 6975. [Google Scholar] [CrossRef]
  30. Zhang, Z.; Wang, S.; Zhang, J. Spatiotemporal evolution of carbon budget and carbon compensation zoning of urban agglomerations in the Yellow River Basin. Sci. Rep. 2024, 14, 17984. [Google Scholar] [CrossRef] [PubMed]
  31. Wang, S.; Fu, B.; Piao, S.; Lü, Y.; Ciais, P.; Feng, X.; Wang, Y. Reduced sediment transport in the Yellow River due to anthropogenic changes. Nat. Geosci. 2016, 9, 38–41. [Google Scholar] [CrossRef]
  32. Fu, B.; Wang, S.; Liu, Y.; Liu, J.; Liang, W.; Miao, C. Hydrogeomorphic ecosystem responses to natural and anthropogenic changes in the Loess Plateau of China. Annu. Rev. Earth Planet. Sci. 2017, 45, 223–243. [Google Scholar] [CrossRef]
  33. Xuan, W.; Rao, L. Spatiotemporal dynamics of net primary productivity and its influencing factors in the middle reaches of the Yellow River from 2000 to 2020. Front. Plant Sci. 2023, 14, 1043807. [Google Scholar] [CrossRef]
  34. Lin, Z.; Liu, Y.; Wen, Z.; Chen, X.; Han, P.; Zheng, C.; Yao, H.; Wang, Z.; Shi, H. Spatial–temporal variation characteristics and driving factors of net primary production in the Yellow River Basin over multiple time scales. Remote Sens. 2023, 15, 5273. [Google Scholar] [CrossRef]
  35. Li, H.; He, Y.; Zhang, L.; Cao, S.; Sun, Q. Spatiotemporal changes of Gross Primary Production in the Yellow River Basin of China under the influence of climate-driven and human-activity. Glob. Ecol. Conserv. 2023, 46, e02550. [Google Scholar] [CrossRef]
  36. Zhang, F.; Hu, X.; Zhang, J.; Li, C.; Zhang, Y.; Li, X. Change in Alpine Grassland NPP in response to climate variation and human activities in the Yellow River Source Zone from 2000 to 2020. Sustainability 2022, 14, 8790. [Google Scholar] [CrossRef]
  37. Zhang, X.; Xiao, W.; Wang, Y.; Wang, Y.; Wang, H.; Wang, Y.; Zhu, L.; Yang, R. Spatial-temporal changes in NPP and its relationship with climate factors based on sensitivity analysis in the Shiyang River Basin. J. Earth Syst. Sci. 2020, 129, 24. [Google Scholar] [CrossRef]
  38. Yang, Z.P.; Gao, J.X.; Tian, M.R. Spatial and Temporal Patterns of Net Primary Productivity in the Source Regions of Yangtze and Yellow Rivers. Adv. Mater. Res. 2012, 518–523, 5130–5137. [Google Scholar] [CrossRef]
  39. Lyu, J.; Fu, X.; Lu, C.; Zhang, Y.; Luo, P.; Guo, P.; Huo, A.; Zhou, M. Quantitative assessment of spatiotemporal dynamics in vegetation NPP, NEP and carbon sink capacity in the Weihe River Basin from 2001 to 2020. J. Clean. Prod. 2023, 428, 139384. [Google Scholar] [CrossRef]
  40. Rui, S.; Yuyu, Z.; Changming, L.; Shiqi, Y. Response of net primary productivity on climate change in the Yellow River basin. In Proceedings of the IGARSS 2003. 2003 IEEE International Geoscience and Remote Sensing Symposium. Proceedings (IEEE Cat. No. 03CH37477), Toulouse, France, 21–25 July 2003; pp. 3371–3373. [Google Scholar]
  41. Guo, R.; Tian, J.; Yang, Z.; Yang, Z.; Wenrui, S.U.; Liu, W. Spatio-temporal variation characteristics of forest net primary productivity in the Yellow River Basin based on Google Earth Engine cloud platform. Acta Ecol. Sin. 2022, 42, 5437–5445. [Google Scholar] [CrossRef]
  42. Xie, B.; Qin, Z.; Wang, Y.; Chang, Q. Spatial and temporal variation in terrestrial net primary productivity on Chinese Loess Plateau and its influential factors. Trans. Chin. Soc. Agric. Eng. (Trans. CSAE) 2014, 30, 244–253. [Google Scholar]
  43. Tian, K.; Liu, X.; Zhang, B.; Wang, Z.; Xu, G.; Chang, K.; Xu, P.; Han, B. Analysis of Spatiotemporal Evolution and Influencing Factors of Vegetation Net Primary Productivity in the Yellow River Basin from 2000 to 2022. Sustainability 2023, 16. [Google Scholar] [CrossRef]
  44. Yang, M.; Xue, L.; Liu, Y.; Liu, S.; Han, Q.; Yang, L.; Chi, Y. Asymmetric response of vegetation GPP to impervious surface expansion: Case studies in the Yellow and Yangtze River Basins. Environ. Res. 2023, 243, 117813. [Google Scholar] [CrossRef] [PubMed]
  45. Tian, Z.; Qin, T.; Wang, H.; Li, Y.; Yan, S.; Hou, J.; Li, C.; Abebe, S.A. Delayed response of net primary productivity with climate change in the Yiluo River basin. Front. Earth Sci. 2023, 10, 1017819. [Google Scholar] [CrossRef]
  46. Cao, Y.; Xie, Z.; Huang, X.; Cui, M.; Wang, W.; Li, Q. Vegetation dynamics and its trends associated with extreme climate events in the Yellow River Basin, China. Remote Sens. 2023, 15, 4683. [Google Scholar] [CrossRef]
  47. Liu, Z.; Wang, D.; Han, L.; Kang, H.; Cao, X. Vegetation Quality Assessment of the Shaanxi Section of the Yellow River Basin Based on NDVI and Rain-Use Efficiency. Land 2025, 14, 166. [Google Scholar] [CrossRef]
  48. Xin, Z.; Xu, J.; Zheng, W. Spatiotemporal variations of vegetation cover on the Chinese Loess Plateau (1981–2006): Impacts of climate changes and human activities. Sci. China Ser. D Earth Sci. 2008, 51, 67–78. [Google Scholar] [CrossRef]
  49. Sun, W.; Song, X.; Mu, X.; Gao, P.; Wang, F.; Zhao, G. Spatiotemporal vegetation cover variations associated with climate change and ecological restoration in the Loess Plateau. Agric. For. Meteorol. 2015, 209, 87–99. [Google Scholar] [CrossRef]
  50. Ge, W.; Deng, L.; Wang, F.; Han, J. Quantifying the contributions of human activities and climate change to vegetation net primary productivity dynamics in China from 2001 to 2016. Sci. Total Environ. 2021, 773, 145648. [Google Scholar] [CrossRef]
  51. Lü, Y.; Fu, B.; Feng, X.; Zeng, Y.; Liu, Y.; Chang, R.; Sun, G.; Wu, B. A policy-driven large scale ecological restoration: Quantifying ecosystem services changes in the Loess Plateau of China. PLoS ONE 2012, 7, e31782. [Google Scholar] [CrossRef]
  52. Jiao, W.; Chen, Y.-n.; Li, Z. Remote sensing estimation and the reasons for temporal-spatial differences of vegetation net primary productivity in arid region of Northwest China. Chin. J. Ecol. 2017, 36, 181. [Google Scholar]
  53. Zhou, Y.; Li, X.; Liu, Y. Land use change and driving factors in rural China during the period 1995-2015. Land Use Policy 2020, 99, 105048. [Google Scholar] [CrossRef]
  54. Wei, F.; Teng, E.; Wu, G.; Hu, W.; Zhang, J. Ambient Concentrations and Elemental Compositions of PM 10 and PM 2.5 in Four Chinese Cities. Environ. Sci. Technol. 1999, 33, 4188–4193. [Google Scholar] [CrossRef]
  55. Elvidge, C.D.; Baugh, K.E.; Dietz, J.B.; Bland, T.; Sutton, P.C.; Kroehl, H.W. Radiance calibration of DMSP-OLS low-light imaging data of human settlements. Remote Sens. Environ. 1999, 68, 77–88. [Google Scholar] [CrossRef]
  56. Wang, F.; Cao, Y.; Zhou, S.; Fan, S.; Jiang, X. Estimation of vegetation carbon sink in the Yellow River Basin ecological function area and analysis of its main meteorological elements. Acta Ecol. Sin. 2023, 43, 2501–2514. [Google Scholar] [CrossRef]
  57. Yang, N.; Wang, L.; Zhu, L.; Zhang, X.; Sun, H.; Wang, W.; Xia, J. NPP Variation Characteristics and Driving Factors of the Yellow River Valley in the Last Decade. J. Basic Sci. Eng. 2023, 31, 280–295. [Google Scholar] [CrossRef]
  58. Zhao, C.; Chen, Y.; Wang, W.; Gao, Z. Temporal and Spatial Variation of Extreme Precipitation Indexes of the Yellow River Basin in Recent 50 Years. Yellow River 2015, 37, 18–22. [Google Scholar]
  59. Yang, Z.; Tian, J.; Li, W.; Su, W.; Guo, R.; Liu, W. Spatio-temporal pattern and evolution trend of ecological environment quality in the Yellow River Basin. Acta Ecol. Sin. 2021, 41, 7627–7636. [Google Scholar] [CrossRef]
  60. Ren, Z.; Huang, Q.; Li, J. Quantitative Analysis of Dynamic Change and Spatial Difference of the Ecological Safety: The Case of Shaanxi Province. Acta Geogr. Sin. 2005, 60, 597–606. [Google Scholar]
  61. Wu, C.; Zhou, Z.; Xiao, W.; Wang, P.; Wang, T.; Huang, Z. Dynamic Monitoring of Vegetation Coverage in Three Gorges Reservoir Area Based on MODIS NDVI. Sci. Silvae Sin. 2012, 48, 22–28. [Google Scholar]
  62. Yi, K.; Tani, H.; Li, Q.; Zhang, J.; Guo, M.; Bao, Y.; Wang, X.; Li, J. Mapping and Evaluating the Urbanization Process in Northeast China Using DMSP/OLS Nighttime Light Data. Sensors 2014, 14, 3207–3226. [Google Scholar] [CrossRef]
  63. Theil, H. A rank-invariant method of linear and polynomial regression analysis. Indag. Math. 1950, 12, 173. [Google Scholar]
  64. Du, S.; Gu, H.; Wen, J.; Chen, K.; Van Rompaey, A. Detecting Flood Variations in Shanghai over 1949–2009 with Mann-Kendall Tests and a Newspaper-Based Database. Water 2015, 2015, 1808–1824. [Google Scholar] [CrossRef]
  65. Xu, C.; Chen, Y.; Li, W.; Chen, Y. Climate change and hydrologic process response in the Tarim River Basin over the past 50 years. Chin. Sci. Bull. 2006, 51, 25–36. [Google Scholar] [CrossRef]
  66. Pang, Y.; Dong, L.; Ding, W.; Zhang, P.; Zhu, X. The characteristic of spatial-temporal variations of rainfall erosivity of the Yangtze River Basin during the period of 1960–2015 based on EOF method. Soil Water Conserv. China 2018, 10, 37–41. [Google Scholar]
  67. Hao, J.T.; Hu, Y.Y.; Du, Y.C.; Hou, X.W.; Xiang, A.M. Ndvi-based coverage changes of forest and grass vegetation in Yellow River Basin during 2009 to 2018. Sci. Silvae Sin. 2022, 58, 10–19. [Google Scholar] [CrossRef]
  68. Zhong, H.; Wang, H. Temporal and spatial variation of normalized vegetation index in Hubei Province from 2007to 2016. J. Cent. China Norm. Univ. (Nat. Sci.) 2018, 52, 582–588. [Google Scholar] [CrossRef]
  69. Liu, L.; Guan, J.; Mu, C.; Han, W.; Qiao, X.; Zheng, J. Spatio-temporal characteristics of vegetation net primary productivity in the Ili River Basin from 2008 to 2018. Acta Ecol. Sin. 2022, 42, 4861–4871. [Google Scholar] [CrossRef]
  70. Dai, Z.; Zhao, X.; Li, G.; Wang, X.; Pang, L. Spatial-temporal variations in NDVI in vegetation-growing season in Qinghai based on GIMMS NDVI 3g.v1 in past 34 years. Pratacultural Sci. 2018, 35, 713–725. [Google Scholar]
  71. Chen, S.-T.; Guo, B.; Yang, F.; Han, B.-M.; Fan, Y.-W.; Yang, X.; He, T.-L.; Liu, Y.; Yang, W.-N. Spatial and temporal patterns of NPP and its response to climate change in the Qinghai-Tibet Plateau from 2000 to 2015. J. Nat. Resour. 2020, 35, 2511–2527. [Google Scholar] [CrossRef]
  72. Fan, Q.; Lu, Q.; Liu, B.; Li, J.; Ping, X.; Yang, X. Research on the centre of gravity after “Transfer-Conversion-Changes” in different land use types during 2010–2020. Sci. Rep. 2025, 15, 21722. [Google Scholar] [CrossRef]
  73. Li, Z.; Jiang, W.; Wang, W.; Lei, X.; Deng, Y. Exploring spatial-temporal change and gravity center movement of construction land in the Chang-Zhu-Tan urban agglomeration. J. Geogr. Sci. 2019, 29, 1363–1380. [Google Scholar] [CrossRef]
  74. Zhang, Y.; Yang, Z.; Zi, L.; Cao, Y.; Yu, H. Spatio-temporal Evolution of the AIDS Pattern in China. J. Geo-Inf. Sci. 2020, 22, 198–206. [Google Scholar]
  75. Wang, H.; Qin, F.; Xu, C.; Li, B.; Guo, L.; Wang, Z. Evaluating the suitability of urban development land with a Geodetector. Ecol. Indic. 2021, 123, 107339. [Google Scholar] [CrossRef]
  76. Peuquet, D.J.; Duan, N. An event-based spatiotemporal data model (ESTDM) for temporal analysis of geographical data. Int. J. Geogr. Inf. Syst. 1995, 9, 7–24. [Google Scholar] [CrossRef]
  77. Wang, J.; Li, Y.; Gao, J. Time effects of global change on forest productivity in China from 2001 to 2017. Plants 2023, 12, 1404. [Google Scholar] [CrossRef] [PubMed]
  78. Fang, K.; Wang, T.; He, J.; Wang, T.; Xie, X.; Tang, Y.; Shen, Y.; Xu, A. The distribution and drivers of PM2. 5 in a rapidly urbanizing region: The Belt and Road Initiative in focus. Sci. Total Environ. 2020, 716, 137010. [Google Scholar] [CrossRef]
  79. Dong, Y.; Yin, D.; Li, X.; Huang, J.; Su, W.; Li, X.; Wang, H. Spatial–temporal evolution of vegetation NDVI in association with climatic, environmental and anthropogenic factors in the loess plateau, China during 2000–2015: Quantitative analysis based on geographical detector model. Remote Sens. 2021, 13, 4380. [Google Scholar] [CrossRef]
  80. Ren, Y.; Liu, J.; Liu, S.; Wang, Z.; Liu, T.; Shalamzari, M.J. Effects of Climate Change on Vegetation Growth in the Yellow River Basin from 2000 to 2019. Remote Sens. 2022, 14, 687. [Google Scholar] [CrossRef]
  81. Pan, J.-H.; Li, Z. Temporal spatial change of vegetation net primary productivity in the arid region of Northwest China during 2001 and 2012. Chin. J. Ecol. 2015, 34, 3333. [Google Scholar]
  82. Department of Ecological Environment. China Ecological Environment Status Bulletin 2020 (Excerpt). Environ Protec 2021, 49, 47–68. [Google Scholar]
  83. Zhang, W.; Wang, L.; Xiang, F.; Qin, W.; Jiang, W. Vegetation dynamics and the relations with climate change at multiple time scales in the Yangtze River and Yellow River Basin, China. Ecol. Indic. 2020, 110, 105892. [Google Scholar] [CrossRef]
  84. Dengke, L.; Zhao, W. Quantitative Analysis of the Impact of Climate Change and Human Activities on Vegetation NPP in Shaanxi Province. Ecol. Environ. Sci. 2022, 31, 1071–1079. [Google Scholar] [CrossRef]
  85. Zhu, H.; Yang, G.; Han, L. Analysis of Fractional Vegetation Coverage Changes and Its Influence Factors during Farmland Returned to Forest Period in Yan’an City. Trans. Chin. Soc. Agric. Mach. 2015, 046, 272–280. [Google Scholar]
  86. Li, T.; Ma, C.; Guo, Z. Response of Spatiotemporal Change of NPP to Climate in Helanshan Mountain Nature Reserve from 2004 to 2015. Res. Soil Water Conserv. 2020, 27, 254–261. [Google Scholar] [CrossRef]
  87. Ma, S.; Cui, G.; Zhao, Y.; Zhao, Y.; Liu, X.; Zhang, C. Spatial-temporal Variation Characteristics of NPP and the Driving Factors:A Case Study of Yan’an. Chin. Agric. Sci. Bull. 2022, 38, 93–98. [Google Scholar]
  88. Dang, X.; Zhou, L.; Hu, F.; Yuan, B.; Tang, J. The multi-scale direct and indirect effects of urban extension of Guanzhong Plain urban agglomeration on ecologic land. Acta Ecol. Sin 2022, 42, 3020–3032. [Google Scholar]
  89. Jiyuan, L.; Zengxiang, Z.; Dafang, Z.; Yimou, W.; Wancun, Z.; Shuwen, Z.; Rendong, L.; Nan, J.; Shixin, W. A study on the spatial-temporal dynamic changes of land-use and driving forces analyses of China in the 1990s. Geogr. Res. 2003, 22, 1–12. [Google Scholar]
  90. Zhao, S.; Liu, S.; Zhou, D. Prevalent vegetation growth enhancement in urban environment. Proc. Natl. Acad. Sci. USA 2016, 113, 6313–6318. [Google Scholar] [CrossRef]
  91. Lu, X.-Y.; Chen, X.; Zhao, X.-L.; Lv, D.-J.; Zhang, Y. Assessing the impact of land surface temperature on urban net primary productivity increment based on geographically weighted regression model. Sci. Rep. 2021, 11, 22282. [Google Scholar] [CrossRef]
  92. Wang, Z.-g.; Bai, Y.-p.; Che, L.; Chen, Z.-j.; Qiao, F.-w. Spatio-temporal characteristics and influencing factors of vegetation coverage in urban agglomeration of Guanzhong Plain. Arid. Land Geogr. 2020, 43, 1041–1050. [Google Scholar]
  93. Zhao, W.; Dengke, L. Spatial-temporal distribution of vegetation net primary productivity and its driving factors from 2000 to 2015 in Shaanxi, China. Chin. J. Appl. Ecol. 2018, 29, 9. [Google Scholar] [CrossRef]
  94. Duan, Y.; Ren, Z.; Yijie, S. Quantitative evaluation and analysis of human impact on net primary productivity of vegetation in northern Shaanxi. Chin. J. Soil Water Conserv. 2020, 18, 8. [Google Scholar] [CrossRef]
  95. Shi, S.; Yu, J.; Wang, F.; Wang, P.; Jin, K. Quantitative contributions of climate change and human activities to vegetation changes over multiple time scales on the Loess Plateau. Sci. Total Environ. 2021, 755, 142419. [Google Scholar] [CrossRef] [PubMed]
  96. Zhang, D.; Shi, P.; Zhang, X. Some advance in the main factors controlling soil respiration. Adv. Earth Sci. 2005, 20, 778–785. [Google Scholar]
  97. Zhao, C.; Wang, Y.; Wang, Y.; Zhang, H. Interactions between fine particulate matter (PM2.5) and vegetation: A review. Chin. J. Ecol. 2013, 32, 2203–2210. [Google Scholar] [CrossRef]
  98. Ding, Y.; Li, Q.; Liu, Y.; Zhang, L.; Song, Y.; Zhang, J. Atmospheric Aerosols, Air Pollution and Climate Change. Meteorol. Mon. 2009, 35, 3–14+129. [Google Scholar]
  99. Zuo, L.; Gao, J. Quantitative Attribution Analysis of NPP in Karst Peak Cluster Depression Based on Geographical Detector. Ecol. Environ. Sci. 2020, 29, 686–694. [Google Scholar] [CrossRef]
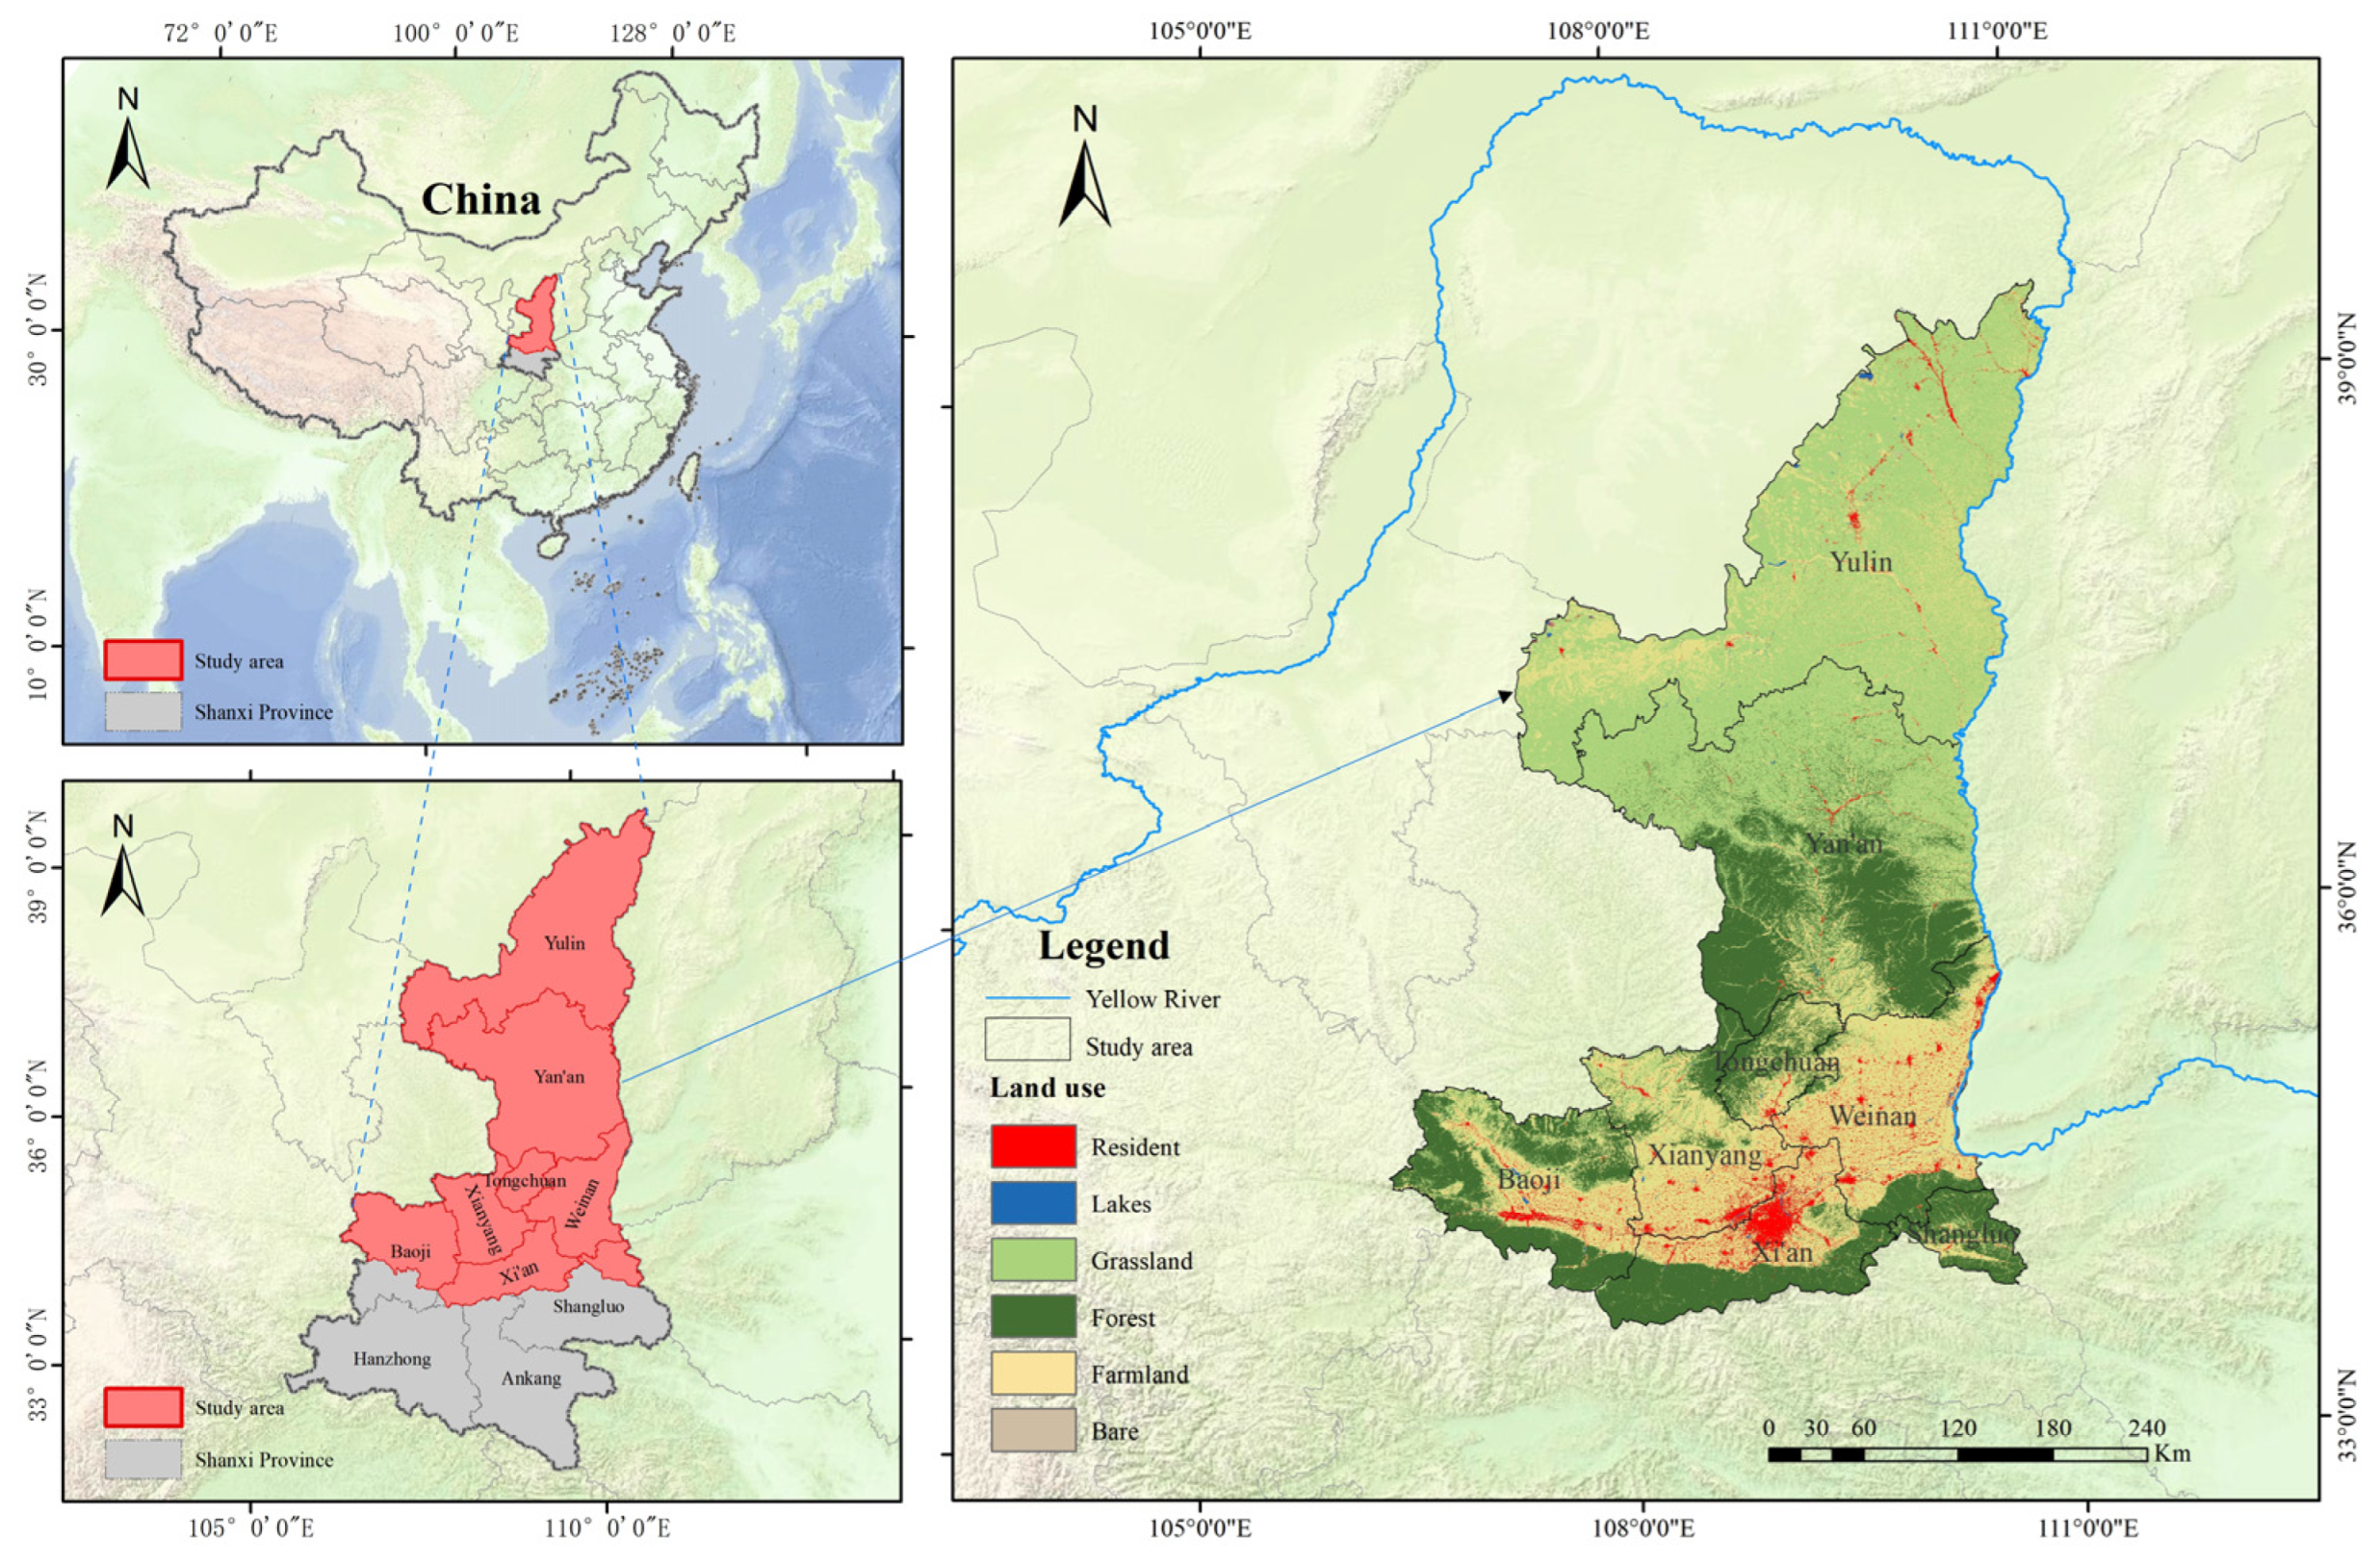
Figure 1. Geographical features of the Yellow River Basin (Shaanxi section).
Atmosphere 16 01004 g001
Figure 2. The interannual variation trend of annual mean NPP in the Yellow River Basin (Shaanxi Section) from 2000 to 2022.
Atmosphere 16 01004 g002
Figure 3. The spatial distribution of the annual mean NPP in the Yellow River Basin (Shaanxi Section) from 2000 to 2022.
Atmosphere 16 01004 g003
Figure 4. Spatial variation in NPP stability based on Cv in the Yellow River Basin (Shaanxi section) from 2000 to 2022.
Atmosphere 16 01004 g004
Figure 5. Shift in NPP gravity center in the Yellow River Basin (Shaanxi section) from 2000 to 2022.
Atmosphere 16 01004 g005
Figure 6. The trajectory of gravity center migration in different regions of the Yellow River Basin (Shaanxi section) from 2000 to 2022.
Atmosphere 16 01004 g006
Figure 7. The rate of change in NPP and its grading in the Yellow River Basin (Shaanxi Section) from 2000 to 2022.
Atmosphere 16 01004 g007
Figure 8. Trend and significance of NPP changes in the Yellow River Basin (Shaanxi Section) from 2000 to 2022.
Atmosphere 16 01004 g008
Figure 9. Interaction detection of driving factors for NPP spatial variation.
Atmosphere 16 01004 g009
Table 1. Data and sources.
DatasetIndicator FactorsData Source Temporal ResolutionSpatial Resolution (km)
NPP https://ladsweb.modaps.eosdis.nasa.gov/ (accessed on 20 March 2024)year0.5
PrecipitationX1http://data.cma.cn/ (accessed on 18 May 2024)month1
TemperatureX2http://data.cma.cn/ (accessed on 18 May 2024)month1
DEMX3http://www.resdc.cn/ (accessed on 18 May 2024)-0.03
Slope X4http://www.resdc.cn/ (accessed on 18 May 2024)-0.03
Aspect X5http://www.resdc.cn/ (accessed on 18 May 2024)-0.03
Nighttime light dataX6http://www.resdc.cn/ (accessed on 25 May 2024)year1
PM2.5X7https://zenodo.org/record/6398971 (accessed on 25 May 2024)year1
PM10X8https://zenodo.org/record/6398971 (accessed on 25 May 2024)year1
NDVI X9https://lpdaac.usgs.gov (accessed on 20 March 2024)year1
1:1,000,000 vegetation typeX10http://www.resdc.cn/ (accessed on 20 March 2024)-1
1:1,000,000 soil typeX11http://www.resdc.cn/ (accessed on 25 May 2024)year1
Land use typeX12http://www.resdc.cn/ (accessed on 20 March 2024)year1
Table 2. q value of each influencing factors.
Driving
Factors
Indicator Factors2000200520102015202020222000–2022
Climatic FactorsX10.6430.6860.6440.5410.5560.6000.694
X20.2260.1390.1340.1280.1410.1430.138
X70.0810.1190.0570.1540.1290.2340.065
X80.3230.2780.4200.4470.4380.6750.414
Land surface factorsX30.1220.0900.0690.0640.0620.0650.064
X40.0720.0990.1240.1220.1130.1080.142
X50.0010.0020.0020.0020.0030.0020.003
X90.6290.7560.7450.7700.8040.7440.827
X100.2340.3320.3690.3660.3460.3240.403
X110.0900.0990.1070.1010.1080.1100.116
Human Activity FactorsX60.0090.0130.0190.0240.0290.0270.017
X120.2940.4030.4150.4340.4300.3110.486
Disclaimer/Publisher’s Note: The statements, opinions and data contained in all publications are solely those of the individual author(s) and contributor(s) and not of MDPI and/or the editor(s). MDPI and/or the editor(s) disclaim responsibility for any injury to people or property resulting from any ideas, methods, instructions or products referred to in the content.