Abstract
In this study, two air pollution abatement strategies are examined, focusing on sources and sinks. These include the reduction in ozone precursors (source) and impact of nature-based solutions (sink). For the first abatement strategy (source), two waves of COVID-19 lockdown periods are leveraged as proxies for the potential abatement of air quality pollutants in Toronto, Ontario, Canada, that could occur through electric vehicle deployment. Ground level ozone (O3) and its precursors (NO, NO2), were examined from April to December 2020, during the first two pandemic lockdown periods in Toronto. An ozone weekend effect framework was used to evaluate changes. Results showed that ozone precursors were the lowest of any of the preceding 10 years for both weekdays and weekends; however, ozone concentrations did not have a corresponding decrease but rather had a marked increase for both weekdays and weekends. These findings reflect reduced vehicular traffic and the ozone chemistry in an NOx-saturated (VOC-limited) environment. For the second abatement strategy (sink), a comparison of surface NO2 observations and NO2 satellite data showed the benefits of nature-based solutions as a sink abatement strategy, with the 2020 reduction amplified at the surface. Given the lack of ozone abatement realized through source reduction, deployment of nature-based solutions as a pollutant sink may present a more effective strategy for ground-level ozone abatement.
1. Introduction
Ozone exposure poses a significant risk to both human health and the natural environment. Inhalation of ozone can cause extreme irritation and inflammation of the eyes and airways; increase the risk of lung infections; decrease lung function and exacerbate respiratory conditions such as asthma; and increase cardiovascular and respiratory morbidity [1,2,3,4,5]. Populations including children and those who are elderly and immunocompromised are particularly vulnerable [6]. In the natural environment, ground-level tropospheric ozone can damage crops, reduce agricultural yields, and impair ecosystem function [7]. Ozone impacts vegetation and plant growth by impairing photosynthesis [8], thereby accelerating ecosystem degradation and biodiversity loss.
Addressing ozone pollution requires a combination of source and sink solutions. Source solutions include reducing emissions of pollutants like NOx and volatile organic compounds (VOCs) [9]. This is crucial, as these pollutants are key precursors to ozone formation. To address ozone and precursor pollution (e.g., NOx and VOCs), one potential source solution is the deployment of electric vehicles (EVs), a technology that produces zero tailpipe emissions [10]. Since EVs do not emit NOx or VOCs during operation, widespread adoption could significantly reduce the amount of ozone precursor pollutants in the atmosphere. This reduction in emissions, particularly in urban areas with heavy traffic, could help to change ozone levels. As transportation is a major source of NOx, a shift to EV deployment in place of combustion engines can significantly reduce ozone-forming pollutants, especially in urban areas [11].
On the other hand, nature-based solutions (NbS) offer a complementary approach by providing ozone sinks. Forests, urban green spaces, and wetlands can absorb ozone and other air pollutants from the atmosphere, acting as natural filters. For example, plants and trees can absorb ozone through their stomata, reducing its concentration [12,13]. Broad implementation of NbS in urban areas can reduce ozone concentrations, in addition to cooling urban environments, improving air quality, and enhancing biodiversity [7,12,13]. As a sink approach, NbS play a critical role in mitigating ozone pollution. Trees and vegetation can absorb air pollutants, including ozone and its precursors, such as NO2, to improve overall air quality [14]. Urban green spaces, reforestation, afforestation, and sustainable agricultural practices can create natural “sinks” for ozone, reducing its concentrations in the atmosphere [15]. Nature-based solutions also enhance biodiversity and build urban climate resilience, providing multiple environmental co-benefits [7,12].
EVs are often considered to be zero-emission vehicles, and while there are no exhaust-related emissions, other non-exhaust emissions do exist. These include the generation of particulate matter (PM) from tire wear, brake wear, road surface wear, and resuspension of road dust. Comparable EVs to internal combustion vehicles tend to be heavier due to the required batteries, and this has been found to increase non-exhaust emissions [16,17,18]. Since there is no direct impact of PM on ozone chemistry, we focus on changes in exhaust emissions. We note as well that VOCs, important in atmospheric ozone chemistry, have both exhaust and non-exhaust sources [19]. The non-exhaust VOCs for internal combustion engines are typically related to the evaporation of gasoline in refuelling, an aspect that should be curtailed for EVs. While acknowledging this difference, we do not explore the impact of differing non-exhaust VOC production.
Combining both source solutions, like the deployment of EVs, and sink solutions, such as nature-based approaches, presents a holistic method for managing ozone pollution. By reducing the emissions that lead to ozone formation and enhancing the environment’s natural ability to absorb ozone, these strategies can mitigate the negative environmental and health impacts of this pervasive pollutant. In order to evaluate source and sink effects on ozone pollution in Toronto, Ontario, Canada, the following two pathways of inquiry were undertaken in this study:
- To understand the potential impact of widespread EV deployment as a source approach for ozone pollution, the COVID-19 pandemic disruption to human activity (including the emission of primary pollutants and impacted production of secondary pollutants) is used as a proxy for EV deployment using surface based ozone monitoring and the ozone weekend effect (OWE) [20].
- To understand the potential of nature-based solutions as a sink approach for ozone pollution, the remediative effect of nature-based solutions (NbS) on tropospheric ozone precursors, specifically nitrogen dioxide (NO2) is explored using remote sensing.
1.1. Theoretical Background
Research into ozone source and sink solutions has grown in recent years as the impacts of air pollution and climate change increasingly manifest in deleterious ways. Tropospheric ozone is a harmful air pollutant accentuated by the reaction between NOx and VOCs in sunlight. Reducing ozone pollution requires addressing both the sources of these precursor emissions and implementing strategies for ozone abatement. Academic research has increasingly focused on two key areas of intervention that include deployment of EVs and NbS as source and sink strategies, respectively, as demonstrated in the following bibliometric analysis.
1.2. Bibliometric Analysis
The search for relevant articles used a series of search terms, including air*, “carbon management”, “clean technology”, “nature-based solutions”, “ozone”, “traffic”, and vehicle* in various combinations within the Scopus database. This resulted in 95 English-language articles published from 2016 to 2024. The expansion of articles in these targeted areas began in 2016–2018 and has since grown. The first stage of bibliometric analysis revealed that air quality studies are multidisciplinary and often describe or evaluate the benefit emerging from both EV and NbS implementation.
Figure 1 shows that the general search term air* is strongly correlated to a series of terms including “air quality”, “air pollution”, “atmospheric pollution”, “ozone”, “nitrogen oxides”, “nitrogen dioxide”, “particulate matter”, “traffic emissions”, and “vehicle emissions”. This suggests the majority of articles relevant for this study deal with the aforementioned terms. However, other articles use a diverse range of keywords to indicate the primary focus of the air studies. For example, the related terms “air quality”, “air pollution”, and “atmospheric pollution” appear connected with the terms “urban area”, “electric vehicle”, “nature-based solutions”, “vegetation”, “greenspace”, and “green infrastructure”, which indicates that specific applications are used for air pollutant abatement in certain areas. On the other hand, correlation with terms such as “emission control”, “urban area”, “mitigation”, “greenhouse gases”, “climate change”, “carbon dioxide” and “sustainable development” indicate that EV and NbS applications are used for multiple urban climate resilience purposes.
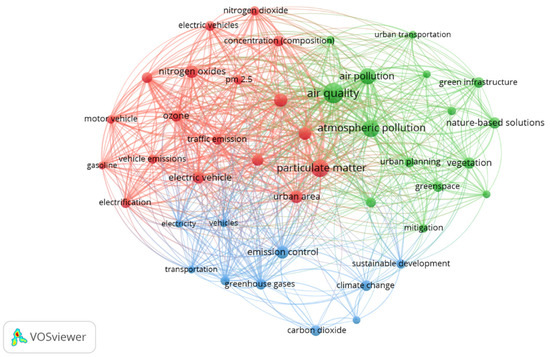
Figure 1.
Analysis of keyword co-occurrence of selected articles from Scopus.
Research on the deployment of both EVs and NbS for air pollution abatement has grown in the past decade, with the largest number of articles on this research focus occurring in China, the USA, the UK, India, and Italy, as shown in Figure 2.
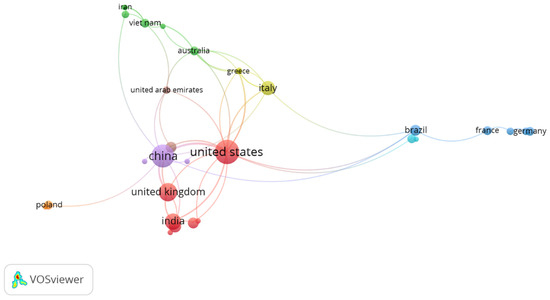
Figure 2.
Analysis of authorship of selected articles from Scopus by country.
EV deployment is widely researched for its potential to reduce ozone precursor (NOx and VOC) emissions in urban environments where transportation is a key contributor to air pollution. Studies have shown widespread adoption of EVs can significantly reduce ozone precursors through elimination of tailpipe emissions [10]. Research also highlights the role of EVs in improving overall air quality, with substantial improvements in areas with high levels of traffic congestion and industrial activity. However, the effectiveness of EV deployment depends on whether the electricity grid is decarbonized and green, as fossil fuel-based energy sources reduce the net benefits of EV deployment [21]. Research has shown that China has been a leader in the widespread deployment of EVs, with evidence of the reduction in air quality pollutants [22] and the projection of wider spread improvement [23,24,25,26,27]. However, ref. [21] issues a cautionary note indicating that the proliferation of EVs shifts emissions from the transportation industry to the electricity generation sector. There may be localized air quality benefits coupled with concerns about the sustainability with respect to greenhouse gases.
Nature-based solutions (NbS), including urban greening, green infrastructure, and urban forestry, have shown beneficial impacts for abatement of ozone and other air pollutants [12,13,14]. Trees and vegetation remove ozone and its precursors through atmospheric deposition [15]. Research has also shown the co-benefits of NbS in enhancing biodiversity, stormwater management and flood attenuation, reducing urban heat islands, and enhancing carbon sequestration capacity [12,13,14,28,29,30]. Urban greening through afforestation and green infrastructure provides a multi-faceted solution for both ozone abatement and urban resilience [31]. The use of NbS has gained widespread recognition as a key planning and design practice for urban sustainability. The International Union for Conservation of Nature has defined nature-based solutions (NbS) as “actions to protect, sustainably manage, and restore natural or modified ecosystems that address societal challenges effectively and adaptively, simultaneously providing human well-being and biodiversity benefits” [31,32,33]. Although there is agreement that NbS can address challenges such as air quality, understanding their characteristics and how they work as an intervention is essential to demonstrating how NbS can behave as an air pollutant sink.
While research on both EV deployment and nature-based solutions highlights their potential to mitigate ozone pollution, challenges remain. For EVs, the need for widespread infrastructure, consumer uptake, and connectivity to clean grid energy sources requires strategic policy support [34]. Similarly, the benefits of NbS vary depending on NbS type, species selection, and maintenance practices [31,32,33]. Further interdisciplinary research is essential to optimize these source and sink solutions and address barriers to broad implementation.
1.3. COVID-19 Lockdowns as a Proxy for EV Deployment
Beginning in March 2020, the COVID-19 pandemic resulted in widespread lockdowns leading to travel restrictions, economic slowdown, and a suspension of many atmospheric pollutant-producing activities. As an unintended consequence, air quality around the globe improved in a significantly detectable fashion [20,23,24,25,26,27], including in Toronto, Ontario, Canada, during the first pandemic wave lockdown from April to June 2020 [20]. Ref. [23] studied 44 cities in China. Their analysis revealed, during the first wave of the pandemic, a reduction in air pollutants by 6–25%. Ref. [25] showed that large, urbanized locations had a decrease in air pollution by as much as 70%. Pollutant reductions have been primarily the result of dramatic reductions in vehicular emissions and industrial activity [23,24,25,26,27]. Of particular interest to this work is the recently published work of [35]. They examined the air quality of the Shanghai area during their 2022 lockdown (18 March 2022 to 31 May 2022). The city experienced a 53% reduction in NOx and a 52% reduction in VOCs during that period. The net result on ozone was an increase due to the conflicting influences of the NOx and VOC reductions. The VOCs reduction caused a reduction in ozone, and the NOx caused an increase in ozone, with the two processes yielding a net increase in ozone in Shanghai’s VOC-limited (NOx-dominated) atmosphere during the lockdown, similar to Toronto’s during its first lockdown and, as we will see in this work, the second lockdown as well.
The response to the pandemic (lockdowns) has provided an unprecedented opportunity to examine significant modifications in air quality. In particular, it allows for the assessment of changes in air quality that may result from the widespread use of electric vehicles (EVs). This study examines the change in air quality via the ozone weekend effect (OWE) that occurred during the second lockdown phase of the COVID-19 pandemic in Toronto, Ontario, Canada, during the fall of 2020 as a continuation of the analysis performed on the first wave of the pandemic [20] and building on the work of [36].
1.4. Ozone Chemistry—Ozone Weekend Effect
The ozone (O3) weekend effect (OWE) occurs when ozone levels fluctuate inversely on weekends compared to weekdays. This phenomenon occurs with higher ozone concentrations on weekends despite lower concurrent emissions of precursor pollutants such as nitrogen oxides (NO and NO2, referred to jointly as NOx) from industrial operations and traffic. This counterintuitive effect occurs because the formation of O3 is influenced by a set of complex interactions between NOx and volatile organic compounds (VOCs). On weekends, NOx emissions from sources such as vehicular traffic decrease, but this can result in elevated O3 levels as NO, particularly during the morning rush hour, is a scavenger for O3 [37]. In urban areas this effect is significant, highlighting the chemical complexity of ozone pollution [38], which will be detailed below.
Tropospheric ozone is generated through a series of chemical reactions, which stem from the precursors, nitrogen oxides (NOx) and volatile organic compounds (VOCs) in the presence of ultraviolet radiation. Ozone production is detailed in the following reactions:
NO + O3 = NO2 + O2,
NO2 + O2 + hv = NO + O3.
When reactions (1) and (2) are in equilibrium, ozone is in a dynamic steady state of approximately 10–20 ppb. However, the oxidation of CO and VOCs by OH in the atmosphere generates peroxy radicals (RO2), which then oxidize NO, forming NO2:
OH + VOC + O2 = H2O + RO2,
RO2 + NO = RO + NO2.
This results in a net production of excess ozone through Reaction (2) and produces additional NO that enables repetition of the cycle. At high NOx concentrations, however, ozone is broken down (Reaction (1)). High NOx relative to VOC concentrations can, thus, result in the scavenging of ozone, producing lower ozone levels as NO2 outcompetes VOC for OH, thus reducing the production of peroxy radicals. The relative dominance of NO2 and VOCs directly affects ozone remediation strategies resulting from two possible precursor states: NOx-saturated (VOC-limited) or VOC-saturated (NOx-limited). For example, in NOx-saturated environments, a reduction in NOx relative to VOCs leads to greater ozone production and vice versa [37,38,39,40,41,42,43,44,45,46]. The OWE has also been detected throughout the world [37,40,47,48,49,50,51,52,53,54,55,56].
Observation of the OWE is an effective tool in providing insight into the ozone chemistry for a given location and how ozone levels will respond to precursor emissions variation [57,58,59,60,61]. As the weekday/weekend effect is most apparent during the morning rush hour, most studies have attributed the OWE to vehicular emissions. Usually, these vehicular emissions have a higher percentage of NOx compared to VOCs, and vehicles with combustion engines release a higher proportion of NO compared to NO2 [52], and this results in ozone reduction. The presence of an OWE signifies that a region is NOx-saturated (VOC-limited).
The COVID-19 pandemic of 2020–2022 provides a unique opportunity to examine the OWE under conditions of substantially reduced NOx emissions and a muted difference between weekday and weekend emissions. As noted above, recently published work indicated a substantial reduction in NO and NO2 throughout the world during the pandemic, but the signal for ozone has been less ubiquitous in many regions, although generally with higher ozone concentrations during the first wave of the pandemic [20,62,63,64,65,66,67,68,69,70,71,72,73,74,75,76]. This work examines the behaviour of ozone and NOx during the first two waves of the COVID-19 pandemic that hit the Greater Toronto Area (October to December of 2020) with a particular focus on the impact on the OWE, building on the work of [20]. They found substantially lower NO and NO2 levels throughout the week (that is, both weekend and weekday) but observed that ozone levels did not follow this pattern, increasing during weekdays and not changing significantly on the weekends, an indicator of an NOx-saturated atmosphere [43,44,45,46,47,48,49,50]. The current work builds on the first analysis, reusing the OWE detection methodology for site-specific observations and contextualizing it as a proxy for a potential electric vehicle air pollutant abatement strategy. In addition, from a sink perspective, the efficacy of NbS (urban forestry) uptake of NO2 is assessed.
1.5. Research Questions
The period of May to December of 2020 is examined, which included the first two waves of the pandemic in Toronto, Ontario, Canada, through the following research lenses:
- As a proxy for EV deployment, how did the COVID-19 restrictions imposed by the provincial government impact the magnitude of primary pollutants, NO and nitrogen dioxide (NO2), compared to the levels detected in the previous 10 years?
- Using the well-documented ozone weekend effect, how was the secondary pollutant O3 impacted during the COVID-19 pandemic as a proxy for the potential impact of the widespread use of electric vehicles on Toronto’s air quality resulting from changes in NO and NO2, also in comparison to the previous 10 years? How does EV deployment in similar urban settings reflect these similarities?
- Are the remediation effects of NbS on ozone precursor concentrations (specifically NO2) visible by satellite imagery and quantifiable by comparing to surface-based observations?
2. Data and Methods
2.1. Data
Hourly pollutant data for NO, NO2, and ground-level O3, are publicly available from the Ontario Ministry of the Environment, Conservation, and Parks (i.e., http://www.airqualityontario.ca, accessed on 15 September 2023), the same dataset used in previous work [20,40,52]. The data were extracted for the 11-year period, 2010 to 2020 for two locations in Toronto, Ontario, Canada, the largest urban area in Ontario, Canada, as was performed in [36]. The two locations are Toronto West (43.71° N, 79.54° W) and Toronto East (43.75° N, 79.27° W) (see Figure 3). The first 10 years of data (2010–2019) constitute a climatology of these three air quality constituents, and the last year, 2020, occurs during the worldwide COVID-19 pandemic. We analyzed the October to December period for 2020, identified as the second pandemic lockdown in Toronto, Ontario. We note that this period occurs when the photochemistry in Reaction (2) is waning due to seasonally induced reduced insolation. Included in the analysis were the same months for the previous 10 years (2010–2019). We note that the 2020 data were used in [20], and this work confirmed a well-established weekday/weekend effect (OWE) in Toronto [40,52].
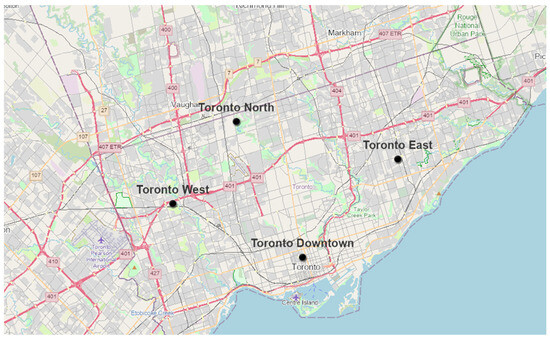
Figure 3.
The location of four air monitoring sites in the metropolitan area of Toronto, Ontario, Canada. Due to data quality issues only Toronto West and Toronto East were used. Scale: 1:220,000.
2.2. Method
2.2.1. Climatology
The climatology was calculated using averaged measurements of NO, NO2, and ground level O3 for the months of October to December for the baseline period, 2010–2019, binning the data according to “weekend” and “weekday”. “Weekends” included each Saturday and Sunday, as well as holidays in the 3-month period (Canadian Thanksgiving in October; Christmas Day and Boxing Day), following the methodology used in [20,40,52]. Weekdays were the average of Monday through Friday, excluding the holidays. Each hour was averaged over the 3 months and binned into weekdays and weekends.
2.2.2. Data Ranking
The 2020 data were ranked out of 11 years (2010–2020) examined for the 3-month aggregate (October–December average) for each station, separately ranking the weekday and weekend data, with “1” indicating the highest values during the 11-year period and “11” indicating the lowest values during this period.
2.2.3. Remote Sensing of a Precursor Pollutant (Nitrogen Dioxide)
This study provides a lens to evaluate how NbS can ameliorate ozone and its precursor pollutant, nitrogen dioxide (NO2), at coarser scales. The analysis used remote sensing from May to October for 2019 and 2020 to explore the spatial differences in NO2 based on surface source and sink considerations informed by the microscale results of [14,35]. Only 2019 was used as a comparator for 2020 as the satellite data was not available for the climatological period of 2010–2019 as it was for the surface observations (Section 2.2.1). Ref. [36], in a different context, examined the impact of NbS on NO2 for the same time period in 2018. NO2 column densities are visible by satellite and are not precisely identical to concentrations measured in situ. The remote sensing analysis was conducted using the spatial distribution of NO2 column densities observed by the Sentinel-5P satellite at a resolution of approximately one kilometre, in addition to observations from the Landsat-8 satellite of the Normalized Difference Vegetation Index (NDVI).
3. Results
3.1. Comparing October to December 2020 to the 2010–2019 Climatology
In Figure 4, Figure 5 and Figure 6 we contrast the concentrations of NO, NO2 and O3 (ppb) for fall of 2020 during the second lockdown period with the corresponding climatology generated from the ten previous years for the Toronto East (TE) station. The corresponding figures for Toronto West are not presented. These results with larger magnitude, as expected from [20], behave in a similar fashion. Nitrous oxide (NO) concentrations (Figure 4) followed a familiar, distinct daily cycle with a considerably muted cycle on weekends compared to weekdays, consistent with patterns of vehicular traffic. The peak values coincided with the morning rush hour and were consistent with OWE ozone scavenging [36]. These values were greater at Toronto West than Toronto East, where there is substantially higher traffic volume, as was found in the first lockdown [20] and in the 2010–2019 climatology. NO is mainly gained through vehicular emissions during the rush hour. NO then reacts readily with ozone (Reaction (1)) to produce NO2 and O2 and reaches a steady state as regulated by Reactions (1)–(4) [20]. As explored in more detail below, the NO values for the fall period were larger than those measured in the first lockdown (April to June) [20]. Similar behaviour was found for NO2 as shown in Figure 5 with substantial reductions found in the second lockdown period as found in the first lockdown period [20], although with higher values for the fall period as was noted for NO. There are two substantial observations for the ozone results (Figure 6). First, the overall levels for ozone are lower in the second lockdown than the first lockdown. This is as expected, as ozone production is photochemically driven and there is less UV radiation available in the fall compared to spring/summer. Second, for the second period, the ozone levels were unambiguously greater than the climatology for both weekends and weekdays, whereas this was clear only for weekdays during the first lockdown period, a point explored in more detail with the other analyses below.
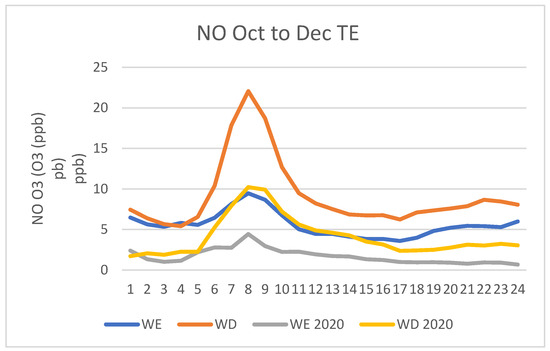
Figure 4.
Averaged diurnal cycle (1–24 h) of nitrogen oxide (NO) for the second lockdown period (October to December 2020) for Toronto East (TE) and the 2010–2019 climatology for the same months. Weekends (WE) and weekdays (WD) are presented.
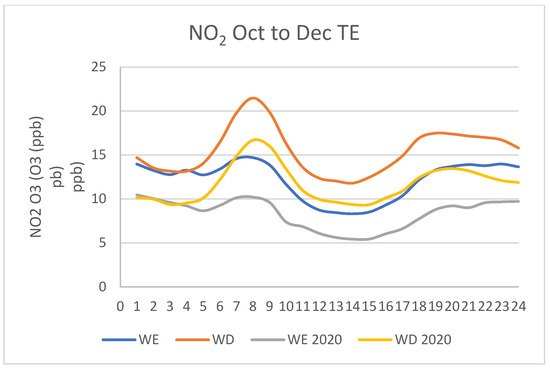
Figure 5.
Averaged diurnal cycle (1–24 h) of nitrogen dioxide (NO2) for the second lockdown period (October to December 2020) for Toronto East (TE) and the 2010–2019 climatology for the same months. Weekends (WE) and weekdays (WD) are presented.
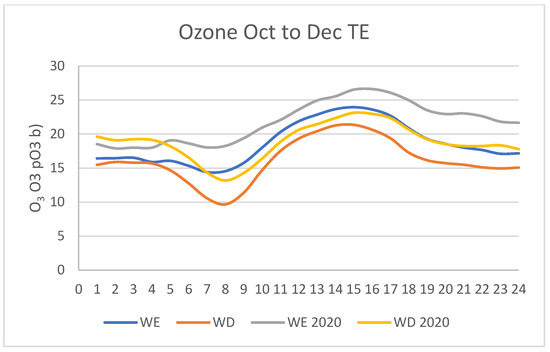
Figure 6.
Averaged diurnal cycle (1–24 h) of ozone (O3) for the second lockdown period (October to December 2020) for Toronto East (TE) and the 2010–2019 climatology for the same months. Weekends (WE) and weekdays (WD) are presented.
In Table 1, we present a comprehensive comparison of the two lockdown periods for both stations for the three atmospheric constituents, NO, NO2 and O3.

Table 1.
Summary of NO, NO2 and O3 (ppb) results at Toronto East (TE) and Toronto West (TW) for the two time periods, April to June (A–J) and October to December (O–D), for weekends (WE) and weekdays [WD]. “C” represents the 2010 to 2019 climatology. The A–J results are reproduced from [20]. Values that are less than climatological values are italicized, values above climatology are bolded. Values in parentheses are the percentage reductions from the climatological means for NO and NO2, and the percentage increase for O3.
The following general observations emerge from this table:
- NO and NO2 for 2020 are both reduced from climatology for both time periods for both weekend and weekdays and at both TE and TW. NO and NO2 are higher on WDs than on WEs, as expected from traffic patterns [20]. NO reduces on average by 61% on WD and 52% on WE. NO2 reduces on average by 39% on WD and 32% on WE, and 37% combining WE and WD.
- For NO and NO2, TW exceeds TE for both time periods and climatology for both WD and WE, reflective of local traffic patterns [20]. For NO and NO2, the reduction at TE is 20% larger than TW for WE and 13 to 14% for WD.
- For NO and NO2, the second period (O–D) exceeds the first period (A–J) at both TW and TE and for WEs and WDs.
- For O3, WE exceeds WD for both TW and TE for both time periods, as expected for the ozone weekend effect (OWE).
- For O3, A–J exceeds O–D for both TW and TE and WE and WD as a result of greater photochemistry from the greater insolation during the A–J period.
- For 2020, A–J, WE, and O3 change only marginally for both TE and TW.
- For 2020, O–D, WE, and O3 increase for both TE and TW by 9% on average, the most significant difference between the two time periods.
- For 2020, A–J and O–D, WD, and O3 increase for both TE and TW by 15% on average.
In summary, the OWE behaviour is similar, with two differences between the two periods: the relatively higher values of NO and NO2 for the second lockdown period and the shifting of ozone levels to higher levels for both WE and WD and not just WD also for the second lockdown period. The NO/NO2 reductions varied from 26% to 71% for WE and from 19% to 63% for WD. These reductions are consistent with reductions found in Shanghai [35,37] during a 2022 lockdown.
3.2. Ranking
The results of the ranking of 2020 with respect to the climatological values (2010–2019) are presented in Table 2 for weekdays for both locations (TE, TW). In parentheses are the rankings for the first pandemic lockdown period (April to June of 2020) reported in [20]. As with the earlier lockdown period, NO and NO2 were at the lowest values with respect to the same months in the climatology, 2010–2019. Ozone, however, had a small deviation. During the first lockdown, the ozone values were higher than all years of the climatological values. For the second lockdown, the fall of 2020 ranked second highest rather than highest. The corresponding results are shown for weekends in Table 3. Once again, the ranking results for NO and NO2 are identical to those for the first lockdown (in parentheses). The most significant change was again in ozone. For the first lockdown the ozone values were in the middle of the pack (6). For the second lockdown, ozone is higher than all the years of the climatology period. The non-intuitive OWE chemistry resulted in an extreme in ozone while there was a reduction in NO and NO2, a clear indication that Toronto remained in an NOx-saturated (VOC-limited) environment. These results are consistent with the results of the previous section.
Table 2.
Ranking of 2020 during the period of 2010–2020 with 1 for the highest value and 11 for the lowest value for the two Toronto stations, Toronto East (TE) and Toronto West (TW), for weekdays, for NO, NO2 and O3.
Table 3.
Ranking of 2020 during the period of 2010–2020, with 1 for the highest value and 11 for the lowest value for the two Toronto stations, Toronto East (TE) and Toronto West (TW), for weekends.
3.3. Remote Sensing of a Precursor Pollutant (Nitrogen Dioxide)
Figure 7 and Figure 8 depict the column density of NO2 (10−6 mol/m2) for the Toronto region for 2019 and 2020, respectively, for sampling that occurred between May and October. The surface observational sites, reported in the previous sections, are identified on the graphs as 1 (Toronto West), 2 (Toronto North), 3 (Toronto Downtown), and 4 (Toronto East). In 2019 (Figure 7), the peak occurs to the west of the Greater Toronto Area (depicted with a black outline) in a heavily industrial area of Peel Region. Across Toronto, from west to east, is a gradient of reduced NO2 concentrations, consistent with 2018 reported in [36]. Using the same colour scheme to represent ranges of NO2 concentration, Figure 8 shows the dramatic difference in 2020, the first year of the pandemic. For the four locations (1–4), the reduction is 27% for 1, 13% for 2, 15% for 3 and 18% for 4, for an overall reduction of 18%. The surface reduction of NO2 at two locations (TW, TE; 1 and 4, respectively) from the climatological mean reported in Section 3.1 was 37%. Although the two cannot be directly compared due to different sampling periods, the difference is suggestive of the nature of the interaction of NO2 and the land surface.
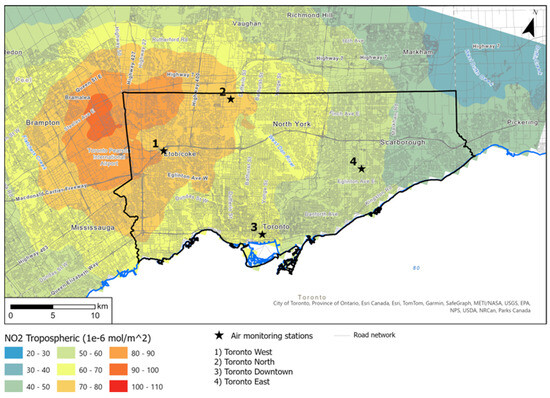
Figure 7.
The column density of NO2 (10−6 mol/m2) for 2019. The black outline indicates the extent of the City of Toronto.
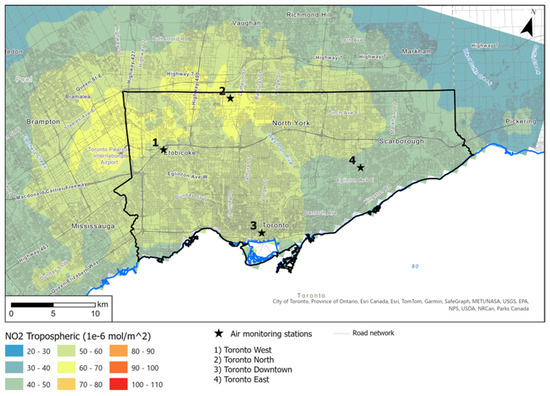
Figure 8.
The column density of NO2 (10–6 mol/m2) for 2020. The black outline indicates the extent of the City of Toronto.
The NbS responsible for this amplified surface reduction in the form of urban forestry, are represented in the Normalized Difference Vegetation Index (NDVI) reported in Figure 9 for 2020 and the difference between 2020 and 2019 in Figure 10. The small differences in Figure 10 indicate the comparable biological activity of the urban spaces was operating in the same way for both years (and similar to 2018 as reported in [35]).
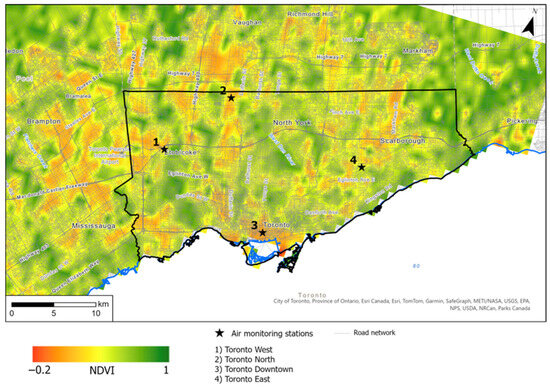
Figure 9.
Normalized Difference Vegetation Index (NDVI) for 2020. The black outline indicates the extent of the City of Toronto.
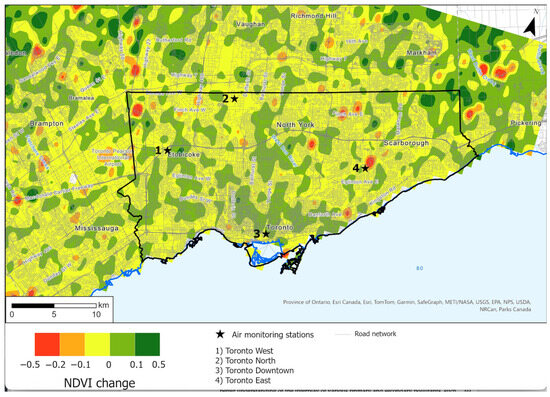
Figure 10.
Difference in the Normalized Difference Vegetation Index (NDVI) (2020–2019). The black outline indicates the extent of the City of Toronto.
4. Discussion
In this work, two approaches to urban air pollutant abatement have been examined. The environmental response to the second pandemic lockdown in Toronto, Ontario, Canada has been effectively used as a proxy for widespread EV deployment. The various phases of the pandemic with concomitant changes in human behaviour, such as the intensity and timing of vehicular traffic, provide a unique natural experiment to gain a better understanding of the interplay of various primary and secondary pollutants, such as those that play a role in the ozone weekend effect (OWE). Tropospheric ozone levels are dependent on the relative amounts of precursors such as NO, NO2, and VOCs and the availability of UV radiation. In an NOx-dominant atmosphere (VOC-limited), the reduction in NO emissions on weekends leads to the counterintuitive increase in ozone levels on the weekend. This is the result of reduced ozone scavenging during the less intense morning rush hours on weekends. During the pandemic, the distinction between weekday and weekend emissions of NO from vehicular emissions diminished, and thus, the exploration of the impact on ozone levels.
For Toronto, this analysis was first conducted in [20] during the first pandemic lockdown from April to May 2020. This led to record low levels of NO and NO2 compared to a climatology created from data from 2010 to 2019. This, however, led to no discernible changes in weekend levels of ozone and an increase in weekday ozone levels, consistent with [40], that is attributable to weaker morning rush hour scavenging. For the second pandemic period from October to December, reported for the first time in this work, there continued to be record-breaking lower than climatology NO and NO2 levels. Although levels were higher than the first lockdown period, this may be attributed to more exceptions to the lockdown restrictions or differing meteorological conditions experienced in the autumn. The more substantive change in the second lockdown period was the record levels of ozone for both weekdays and weekends, which was not the case for weekends during the first lockdown period. This may indicate that atmospheric conditions in the autumn were more strongly NOx dominant (higher NOx to VOC ratio) than in the first pandemic lockdown period. This behaviour is strikingly similar to that found in [37] for Shanghai during its 2022 lockdown, also in NOx-dominant environments. A substantial reduction in both NOx and VOCs resulted in an increased ozone concentration in [37].
A main motivator of this work was to assess the potential impact of the widespread use of EVs on air quality in Toronto. Such assessments are difficult to undertake in a controlled environment that realistically represents conditions in an urban centre. The pandemic as a proxy for EV deployment is ideal. Widespread deployment of EVs mimics the type of NO and NO2 (and likely VOC) reduction that occurred during the pandemic. These reductions during both lockdowns were significant and record-breaking, indicative of the impact that widespread EV deployment could have on primary pollutants. While the ozone behaviour varied between lockdowns, no reduction in ozone was observed. This, as noted above, indicates an NOx-dominant environment and that this nature did not change as a result of pandemic pollutant abatement. This means that either the NOx to VOC ratio is unchanged or not changing in a way that makes the environment VOC dominant. Thus, the widespread deployment of EVs is unlikely to provide any ground-level ozone relief. Other sources of VOCs and their potential for abatement would need to be considered, such as NbS, which focus on sinks of ozone.
The NO2 column density analysis has provided insights into the efficacy of NbS as a sink for NO2. The reduction of NO2 at the surface stations for the pandemic year 2020 (37%) was greater than the reduction reported for the column density (18%), indicating that the surface uptake of NO2 through NbS in the form of urban forests was active and discernible.
In this work, two approaches to ozone abatement were explored. The clear precursor source reduction (NO, NO2), as illustrated by the pandemic proxy period reductions, had little to no benefit for ozone reduction due to the NOx-dominant Toronto atmosphere. Thus, if ozone abatement is to be effectively addressed, NbS (sink) needs to be considered for broad and strategic deployment. The NbS analysis of the satellite data shows considerable promise. NbS have multiple co-benefits beyond air pollution abatement, including stormwater attenuation and urban cooling, in addition to biodiversity and pollinator support. Within urban settings, NbS provide a multi-faceted strategy to improve air quality and urban climate.
5. Conclusions
In this work, two air pollution abatement strategies are examined that include the reduction in ozone precursors (source) and impact of nature-based solutions (NbS) in the form of urban forestry (sink). The waves of the COVID-19 pandemic lockdown periods are used as proxies for the potential abatement of air quality pollutants in Toronto, Ontario, Canada by the widespread deployment of electric vehicles. Air pollutants (NO, NO2, and O3) were examined from April to December 2020, during the first two lockdowns responding to the COVID-19 pandemic in this city, and were compared to a 10-year (2010–2019) climatology for two local air quality monitoring sites. An ozone weekend effect (OWE) framework was used to evaluate changes in the three ground-level atmospheric constituents. NO and NO2 values for these two lockdowns were the lowest of any of the preceding 10 years at the two Toronto sites for both weekdays and weekends, with a reduction of up to 70% for NO and up to 37% for NO2 from the climatological baseline period. Ozone concentrations, however, did not have a corresponding decrease but rather a marked increase for both weekdays and weekends by as much as 18%, similar to other parts of the world. The OWE was muted during the morning rush hour throughout this pandemic period. These findings are indicative of reduced vehicular traffic during this time and the ozone chemistry of NOx-saturated (VOC-limited) environments. These results indicate some potential benefits to improving air quality in Toronto should electric vehicles (EVs) be widely deployed as a vehicular source reduction, as is occurring in other parts of the world. A comparison of surface NO2 observations and column integrated NO2 from satellite derived data found that the 2020 reduction (sink) was amplified at the surface, an indication that the NbS sink of NO2 was active. Given the lack of ozone abatement realized for NO2 reduction (source), deployment of NbS (sink) may present the most effective strategy for air pollutant abatement, rather than precursor reduction.
Managing ozone pollution using both source and sink solutions, including deployment of EVs and nature-based approaches, can provide strategic pathways for cities to improve local air quality and enhance urban resilience. By reducing the emissions that lead to ozone formation and enhancing the urban environment’s natural ability to absorb ozone and its precursors, the negative environmental and health impacts of this pervasive pollutant can be mitigated. However, as these results for ozone abatement show, careful consideration of the local atmospheric conditions plays a role in determining the best source and sink strategies.
Author Contributions
All authors contributed to the study conception and design. Material preparation, data collection and analysis were performed by W.A.G., V.A. and M.Z. The first draft of the manuscript was written by W.A.G. and V.A. and all authors commented on previous versions of the manuscript. All authors have read and agreed to the published version of the manuscript.
Funding
The authors are supported by Natural Sciences and Engineering Research Council of Canada (NSERC) Grant RGPIN-2018-06801.
Institutional Review Board Statement
Not applicable
Informed Consent Statement
Not applicable.
Data Availability Statement
The data presented in this study are available on request from the corresponding author.
Conflicts of Interest
The authors declare that there are no conflicts of interest.
References
- Lippmann, M. Health Effects of Ozone: A Critical Review. JAPCA 1989, 39, 672–695. [Google Scholar] [CrossRef]
- Follinsbee, L.J. Human Health Effects of Air Pollution. Environ. Health Perspect. 1992, 100, 45–56. [Google Scholar] [CrossRef]
- Kampa, M.; Castanas, E. Human health effects of air pollution. Environ. Pollut. 2008, 151, 362–367. [Google Scholar] [CrossRef]
- Jerrett, M.; Burnett, R.T.; Pope, C.A., III; Ito, K.; Thurston, G.; Krewski, D.; Shi, Y.; Calle, E.; Thun, M. Long-term ozone exposure and mortality. N. Engl. J. Med. 2009, 360, 1085–1095. [Google Scholar] [CrossRef] [PubMed]
- Health Canada. Health Impacts of Air Pollution in Canada: Estimates of Premature Deaths and Nonfatal Outcomes—2021 Report; Health Canada: Ottawa, ON, Canada, 2021; ISBN 978-0-660-37331-7. Available online: https://www.canada.ca/en/health-canada/services/publications/healthy-living/2021-health-effects-indoor-air-pollution.html (accessed on 20 January 2022).
- World Health Organization (WHO). Air Quality Guidelines: Global Update. 2021. Available online: https://www.who.int/news-room/fact-sheets/detail/ambient-(outdoor)-air-quality-and-health (accessed on 1 March 2025).
- Salmond, J.A.; Tadaki, M.; Vardoulakis, S.; Arbuthnott, K.; Coutts, A.; Demuzere, M.; Dirks, K.N.; Heaviside, C.; Lim, S.; MacIntyre, H.; et al. Health and climate related ecosystem services provided by street trees in urban environments. Environ. Health 2016, 15, S36. [Google Scholar] [CrossRef] [PubMed]
- Mills, G.; Pleijel, H.; Malley, C.S.; Sinha, B.; Cooper, O.R.; Schultz, M.G.; Neufeld, H.S.; Simpson, D.; Sharps, K.; Feng, Z.; et al. Tropospheric ozone assessment report: Present-day tropospheric ozone distribution and trends relevant to vegetation. Elem. Sci. Anthr. 2018, 6, 47. [Google Scholar] [CrossRef]
- US EPA. Ground-Level Ozone Basics. United States Environmental Protection Agency. 2022. Available online: https://www.epa.gov/ground-level-ozone-pollution (accessed on 1 March 2025).
- Schnell, J.L.; Naik, V.; Horowitz, L.; Paulot, F.; Ginoux, P. Air quality impacts from the electrification of light-duty passenger vehicles in the United States. Atmos. Environ. 2019, 208, 95–102. [Google Scholar] [CrossRef]
- Wu, X.; Gao, Y.; Zhang, Y.; Wang, Y. The role of electric vehicles in addressing the ozone–NOx–VOC chemistry in China. Atmos. Chem. Phys. 2021, 21, 3167–3177. [Google Scholar]
- Anderson, V.; Gough, W.A. Form, Function, and Nomenclature: Deconstructing Green Infrastructure and its Role in a Changing Climate. In Climate Change and Extreme Events; Fares, A., Ed.; Elsevier: Maryland Heights, MO, USA, 2021; ISBN U1104201903351. [Google Scholar]
- Anderson, V.; Gough, W.A. A Typology of Nature-Based Solutions for Sustainable Development: An Analysis of Form, Function, Nomenclature, and Associated Applications. Land 2022, 11, 1072. [Google Scholar] [CrossRef]
- Anderson, V.; Gough, W.A. Evaluating the potential of green infrastructure to address the impacts of climate change in Ontario through the reduction of ozone, nitrogen dioxide, and carbon dioxide concentrations. City Environ. Interact. 2020, 6, 100043. [Google Scholar] [CrossRef]
- Nowak, D.J.; Hirabayashi, S.; Bodine, A.; Greenfield, E. Tree and forest effects on air quality and human health in the United States. Environ. Pollut 2014, 193, 119–129. [Google Scholar] [CrossRef]
- Woo, S.-H.; Jang, H.; Lee, S.-B.; Lee, S. Comparison of total PM emissions emitted from electric and internal combustion engine vehicles: An experimental analysis. Sci. Total Environ. 2022, 842, 156961. [Google Scholar] [CrossRef] [PubMed]
- Songkitti, W.; Sa-ard-iam, S.; Plengsa-Ard, C.; Wirojaskunchai, E. Effects of payloads on non-exhaust PM emissions from a hybrid vehicle during a braking sequence. Aerosol Air Qual. Res. 2022, 22, 220150. [Google Scholar] [CrossRef]
- Mehlig, D.; Staffell, I.; Stettler, M.; Apsimon, H. Accelerating electric vehicle uptake favours greenhouse gas over air pollutant emissions. Transp. Res. Part D 2023, 124, 103954. [Google Scholar] [CrossRef]
- Li, J.; Ge, Y.; Wang, X.; Zhang, M.; Yang, Z.; Zhong, C.; Sun, J.; Wang, Y. Non-exhaust gas and particle emissions of light-duty vehicles—Quantification under driving conditions in a sealed cabin. Atmos. Environ. 2024, 319, 120308. [Google Scholar] [CrossRef]
- Gough, W.A.; Anderson, V. Changing air quality and the ozone weekend effect during the COVID-19 pandemic in Toronto, Ontario, Canada. Climate 2022, 10, 41. [Google Scholar] [CrossRef]
- Li, H.; Zeng, L.; Wu, Y.; Yang, W. Vehicle electrification: Reducing NOx and ozone across the continental United States. Environ. Sci. Technol. Lett. 2016, 3, 281–285. [Google Scholar]
- Shen, W.; Han, W.; Cao, D.; Zhu, W.; Du, K. The potential environmental benefits of electric vehicles in China. J. Clean. Prod. 2020, 255, 120283. [Google Scholar]
- Bao, R.; Zhang, A. Does lockdown reduce air pollution? Evidence from 44 cities in northern China. Sci. Total Environ. 2020, 731, 139052. [Google Scholar] [CrossRef]
- Krecl, P.; Targino, A.C.; Oukawa, G.Y.; Cassino Junior, R.P. Drop in urban air pollution from COVID-19 pandemic: Policy implications for the megacity of São Paulo. Environ. Pollut. 2020, 265, 114883. [Google Scholar] [CrossRef]
- Rodríguez-Urrego, D.; Rodríguez-Urrego, L. Air quality during the COVID-19: PM2.5 analysis in the 50 most polluted capital cities in the world. Environ. Pollut. 2020, 266, 115042. [Google Scholar] [CrossRef]
- Kerimray, A.; Baimatova, N.; Ibragimova, O.P.; Bukenov, B.; Kenessov, B.; Plotitsyn, P.; Karaca, F. Assessing air quality changes in large cities during COVID-19 lockdowns: The impacts of traffic-free urban conditions in Almaty, Kazakhstan. Sci. Total Environ. 2020, 730, 139179. [Google Scholar] [CrossRef] [PubMed]
- Li, L.; Li, Q.; Huang, L.; Wang, Q.; Zhu, A.; Xu, J.; Liu, Z.; Li, H.; Shi, L.; Li, R.; et al. Air quality changes during the COVID-19 lockdown over the Yangtze River Delta Region: An insight into the impact of human activity pattern changes on air pollution variation. Sci. Total Environ. 2020, 732, 139282. [Google Scholar] [CrossRef]
- Griscom, B.W.; Adams, J.; Ellis, P.W.; Houghton, R.A.; Lomax, G.; Miteva, D.A.; Schlesinger, W.H.; Shoch, D.; Siikamäki, J.V.; Smith, P.; et al. Natural climate solutions. Proc. Natl. Acad. Sci. USA 2017, 114, 11645–11650. [Google Scholar] [CrossRef]
- Anderson, V.; Gough, W.A. Nature-based cooling potential: A multi-type green infrastructure evaluation in Toronto, Ontario, Canada. Int. J. Biometeorol. 2021, 66, 397–410. [Google Scholar] [CrossRef]
- Song, X.P.; Richards, D.R.; Tan, P.Y. Does urban greening reduce anthropogenic carbon dioxide? Landsc. Urban Plan. 2020, 203, 103907. [Google Scholar]
- Cohen-Shacham, E.; Walters, G.; Janzen, C.; Maginnis, S. (Eds.) Nature-Based Solutions to Address Global Societal Challenges; IUCN: Gland, Switzerland, 2016; p. xiii. 97p, ISBN 978-2-8317-1812-5. [Google Scholar] [CrossRef]
- Cohen-Shacham, E.; Andrade, A.; Dalton, J.; Dudley, N.; Jones, M.; Kumar, C.; Maginnis, S.; Maynard, S.; Nelson, C.R.; Renauda, F.G.; et al. Core principles for successfully implementing and upscaling Nature-based Solutions. Environ. Sci. Policy 2019, 98, 20–29. [Google Scholar] [CrossRef]
- Seddon, N.; Chausson, A.; Berry, P.; Girardin, C.A.J.; Smith, A.; Turner, B. Understanding the value and limits of nature-based solutions to climate change and other global challenges. Phil. Trans. R. Soc. B 2020, 375, 20190120. [Google Scholar] [CrossRef]
- Hawkins, T.R.; Singh, B.; Majeau-Bettez, G.; Strømman, A.H. Comparative environmental life cycle assessment of conventional and electric vehicles. J. Ind. Ecol. 2013, 17, 53–64. [Google Scholar] [CrossRef]
- Zhang, S.; Jiang, Y.; Zhang, S.; Choma, E.F. Health benefits of vehicle electrification through air pollution in Shanghai, China. Sci. Total Environ. 2024, 914, 16985. [Google Scholar] [CrossRef]
- Anderson, V.; Zgela, M.; Gough, W.A. Building urban resilience with nature-based solutions: A multi-scale case study of the atmospheric cleansing potential of green infrastructure in Southern Ontario, Canada. Sustainability 2023, 15, 14146. [Google Scholar] [CrossRef]
- Yao, X.; Zhang, Y.; Zhou, S.; Wei, W. A study on the ozone weekend effect and its causes in Shanghai. Environ. Sci. Pollut. Res. 2022, 29, 31821–31834. [Google Scholar]
- He, H.; Hambeck, L.; Hosley, K.M.; Canty, T.P.; Salawich, R.J.; Dickerson, R.R. High ozone concentration on hot days: The role of electric power demand and NOx emissions. Geophys. Res. Letts. 2013, 40, 5291–5294. [Google Scholar] [CrossRef]
- Burnett, R.T.; Brook, J.R.; Yung, W.T.; Dales, R.E.; Krewski, D. Association between ozone and hospitalization for respiratory diseases in 16 Canadian cities. Environ. Res. 1997, 72, 24–31. [Google Scholar] [CrossRef] [PubMed]
- Huryn, S.M.; Gough, W.A. Impact of urbanization on the ozone weekday/weekend effect in Southern Ontario, Canada. Urban Clim. 2014, 8, 11–20. [Google Scholar] [CrossRef]
- Murphy, J.G.; Day, D.A.; Cleary, P.A.; Wooldridge, P.J.; Millet, D.B.; Goldstein, A.H.; Cohen, R.C. The weekend effect within and downwind of Sacramento: Part 1. Observations of ozone, nitrogen oxides and VOC reactivity. Atmos. Chem. Phys. Discuss. 2006, 6, 11427–11464. [Google Scholar] [CrossRef]
- Murphy, J.G.; Day, D.A.; Cleary, P.A.; Wooldridge, P.J.; Millet, D.B.; Goldstein, A.H.; Cohen, R.C. The weekend effect within and downwind of Sacramento: Part 2. Observational evidence for chemical and dynamical contributions. Atmos. Chem. Phys. Discuss. 2006, 6, 11971–12019. [Google Scholar]
- Geddes, J.A.; Murphy, J.G.; Wang, D.K. Long term changes in nitrogen oxides and volatile organic compounds in Toronto and the challenges facing local ozone control. Atmos. Environ. 2009, 43, 3407–3415. [Google Scholar] [CrossRef]
- Beekmann, M.; Vautard, R. A modelling study of photochemical regimes over Europe: Robustness and variability. Atmos. Chem. Phys. 2010, 10, 10067–10084. [Google Scholar] [CrossRef]
- Pusede, S.E.; Cohen, R.C. On the observed response of ozone to NOx and VOC reactivity reductions in San Joaquin Valley California 1995-present. Atmos. Chem. Phys. 2012, 12, 8323–8339. [Google Scholar] [CrossRef]
- Karl, T.; Graus, M.; Striednig, M.; Lamprecht, C.; Hammerle, A.; Wohlfahrt, G.; Held, A.; von der Heyden, L.; Deventer, M.J.; Krismer, A.; et al. Urban eddy covariance measurements reveal significant missing NOx emissions in Central Europe. Sci. Rep. 2017, 7, 2536. [Google Scholar] [CrossRef]
- Sicard, P.; Paoletti, E.; Agathokleous, E.; Araminiene, V.; Proietti, C.; Coulibaly, F.; DeMarco, A. Ozone weekend effect in cities: Deep insights for urban air pollution control. Environ. Res. 2020, 191, 110193. [Google Scholar] [CrossRef]
- Cleveland, W.S.; Graedel, T.E.; Kleiner, B.; Warmer, J.L. Sunday and workday variations in the photochemical air pollution in New Jersey and New York. Science 1974, 186, 1037–1038. [Google Scholar] [CrossRef]
- Lebron, F. A comparison of weekend weekday ozone and hydrocarbon concentrations in the Baltimore Washington Metropolitan Area. Atmos. Environ. 1975, 9, 861–863. [Google Scholar] [CrossRef]
- Elkus, B.; Wilson, K.R. Photochemical air pollution: Weekend–weekday differences. Atmos. Environ. 1977, 11, 509–515. [Google Scholar] [CrossRef]
- Karl, T.R. Day of the week variations of photochemical pollutants in the St. Louis area. Atmos. Environ. 1978, 12, 1657–1667. [Google Scholar] [CrossRef]
- Beaney, G.; Gough, W.A. The influence of tropospheric ozone on the air temperature of the city of Toronto, Ontario, Canada. Atmos. Environ. 2002, 36, 2319–2325. [Google Scholar] [CrossRef]
- Sadanaga, Y.; Shibata, S.; Hamana, M.; Takenaka, N.; Bandow, H. Weekday/weekend differences of ozone and its precursors in urban areas of Japan, focusing on nitrogen oxides and hydrocarbons. Atmos. Environ. 2008, 42, 4708–4723. [Google Scholar] [CrossRef]
- Pudasainee, D.; Sapkota, B.; Bhatnagar, A.; Kim, S.H.; Seo, Y.C. Influence of weekdays, weekends, and bandhas on surface ozone in Kathmandu valley. Atmos. Res. 2010, 95, 150–156. [Google Scholar] [CrossRef]
- Pires, M. Ozone weekend effect analysis in three European urban areas. CLEAN-Soil Air Water 2012, 40, 790–797. [Google Scholar] [CrossRef]
- Castell-Balaguer, N.; Téllez, L.; Mantilla, E. Daily, seasonal and monthly variations in ozone levels recorded at the Turia river basin in Valencia (Eastern Spain). Environ. Sci. Pollut. Res. 2012, 19, 3461–3480. [Google Scholar] [CrossRef] [PubMed]
- Im, U.; Incecik, S.; Guler, M.; Tek, A.; Topcu, S.; Unal, Y.S.; Yenigun, O.; Kindap, T.; Odman, M.T.; Tayanç, M. Analysis of surface ozone and nitrogen oxides at urban, semi-rural and rural sites in Istanbul, Turkey. Sci. Total Environ. 2013, 443, 920–931. [Google Scholar] [CrossRef]
- Wolf, G.T.; Kalhbaum, D.F.; Heuss, J.M. The vanishing ozone weekday/weekend effect. J. Air Waste Manag. Assoc. 2013, 63, 292–299. [Google Scholar] [CrossRef]
- Wang, Z.S.; Li, Y.T.; Chen, T.; Zhang, D.W.; Sun, F.; Sun, R.W.; Dong, X.; Sun, N.D.; Pan, L.B. Temporal and spatial distribution characteristics of ozone in Beijing. Huan Jing Ke Xue 2014, 35, 4446–4453. [Google Scholar] [PubMed]
- Szep, R.; Matyas, L.; Keresztes, R.; Ghimpusan, M. Tropospheric ozone concentrations-seasonal and daily analysis and its association with NO and NO2 as a function of NOx in Ciuc depression—Romania. Rev. Chim. 2016, 67, 205–213. [Google Scholar]
- Yao, X.; Lau, N.T.; Chan, C.K.; Fang, M. The use of tunnel concentration profile data to determine the ratio of NO2/NOx directly emitted from vehicles. Atmos. Chem. Phys. Discuss. 2005, 5, 12723–12740. [Google Scholar]
- Adams, M.D. Air pollution in Ontario, Canada during the COVID-19 state of emergency. Sci. Total Environ. 2020, 742, 140516. [Google Scholar] [CrossRef]
- Adam, M.G.; Tran, P.T.M.; Balasubramanian, R. Air quality changes in cities during the COVID-19 lockdown: A critical review. Atmos. Res. 2021, 264, 105823. [Google Scholar] [CrossRef]
- Dantas, G.; Siciliano, B.; França, B.B.; da Silva, C.M.; Arbilla, G. The impact of COVID-19 partial lockdown on the air quality of the city of Rio de Janeiro, Brazil. Sci. Total Environ. 2020, 729, 139085. [Google Scholar] [CrossRef]
- Grange, S.K.; Lee, J.D.; Drysdale, W.S.; Lewis, A.C.; Hueglin, C.; Emmenegger, L.; Carslaw, D.C. COVID-19 lockdowns highlight a risk of increasing ozone pollution in European urban areas. Atmos. Chem. Phys. 2021, 21, 4169–4185. [Google Scholar] [CrossRef]
- Keller, C.A.; Evans, M.J.; Knowland, K.E.; Hasenkopf, C.A.; Modekurty, S.; Lucchesi, R.A.; Oda, T.; Franca, B.B.; Mandarino, F.C.; Díaz Suarez, M.V.; et al. Global impact of COVID-19 restrictions on the atmospheric concentrations of nitrogen dioxide and ozone. Atmos. Chem. Phys. 2021, 21, 3555–3592. [Google Scholar] [CrossRef]
- Lovri, M.; Pavlovi, K.; Vukovi, M.; Grange, S.K.; Haberl, M.; Kern, R. Understanding the true effects of the COVID-19 lockdown on air pollution by means of machine learning. Environ. Pollut. 2021, 274, 115900. [Google Scholar] [CrossRef]
- Luo, J.; Qin, G.; Cheng, J. Ozone pollution mitigation in Guangxi (south China) driven by meteorology and anthropogenic emissions during the COVID-19. Environ. Pollut. 2020, 272, 115927. [Google Scholar]
- Miyazaki, K.; Bowman, K.; Sekiya, T.; Jiang, Z.; Chen, X.; Eskes, H.; Ru, M.; Zhang, Y.; Shindell, D. Air quality response in China linked to the 2019 novel Coronavirus (COVID-19) lockdown. Geophys. Res. Lett. 2020, 47, e2020GL089252. [Google Scholar] [CrossRef]
- Ordonez, C.; Garrido-Perez, J.M.; García-Herrera, R. Early spring near-surface ozone in Europe during the COVID-19 shutdown: Meteorological effects outweigh emission changes. Sci. Total Environ. 2020, 747, 141322. [Google Scholar] [CrossRef] [PubMed]
- Qi, J.; Mo, Z.; Yuan, B.; Huang, S.; Huangfu, Y.; Wang, Z.; Li, X.; Yang, S.; Wang, W.; Zhao, Y.; et al. An observation approach in evaluation of ozone production to precursor changes during the COVID-19 lockdown. Atmos. Environ. 2021, 262, 118618. [Google Scholar] [CrossRef] [PubMed]
- Sicard, P.; De Marco, A.; Agathokleous, E.; Feng, Z.; Xu, X.; Paoletti, E.; Rodriguez, J.J.D.; Calatayud, V. Amplified ozone pollution in cities during the COVID-19 lockdown. Sci. Total Environ. 2020, 735, 139542. [Google Scholar] [CrossRef]
- Siciliano, B.; Dantas, G.; Cleyton, M.; Arbilla, G. Increased ozone levels during the COVID-19 lockdown: Analysis for the city of Rio de Janeiro, Brazil. Sci. Total Environ. 2020, 737, 139765. [Google Scholar] [CrossRef]
- Singh, V.; Singh, S.; Biswal, A.; Kesarkar, A.P.; Mor, S.; Ravindra, K. Diurnal and temporal changes in air pollution during COVID-19 strict lockdown over different regions of India. Environ. Pollut. 2020, 266, 115368. [Google Scholar] [CrossRef]
- Soni, M.; Ojha, N.; Girach, I. Impact of COVID-19 lockdown on surface ozone build-up at an urban site in western India based on photochemical box modelling. Curr. Sci. 2021, 120, 376–381. [Google Scholar] [CrossRef]
- Trebrewal, K.; Venkataraman, C. COVID-19 lockdown closures of emissions sources in India: Lessons for air quality and climate policy. J. Environ. Manag. 2022, 302, 114079. [Google Scholar] [CrossRef] [PubMed]
Disclaimer/Publisher’s Note: The statements, opinions and data contained in all publications are solely those of the individual author(s) and contributor(s) and not of MDPI and/or the editor(s). MDPI and/or the editor(s) disclaim responsibility for any injury to people or property resulting from any ideas, methods, instructions or products referred to in the content. |
© 2025 by the authors. Licensee MDPI, Basel, Switzerland. This article is an open access article distributed under the terms and conditions of the Creative Commons Attribution (CC BY) license (https://creativecommons.org/licenses/by/4.0/).