A Hybrid Air Quality Prediction Model Integrating KL-PV-CBGRU: Case Studies of Shijiazhuang and Beijing
Abstract
1. Introduction
- (1)
- Given the instability and high volatility of AQI data, Kalman filtering is employed to decompose the AQI series and reduce its volatility. However, in cases of extremely intense AQI fluctuations—particularly without outlier processing—the subsequences obtained from a single decomposition method may still exhibit significant volatility. To address this, a secondary decomposition using VMD is applied, with its parameters optimized by the PSO algorithm to enhance the effectiveness of the decomposition and further reduce volatility.
- (2)
- In the prediction module, the limitations of a single model’s performance are addressed by employing a convolutional neural network (CNN) for feature extraction, enhanced with a convolutional attention module to improve feature learning, followed by BiGRU for prediction; this hybrid approach significantly improves both prediction accuracy and generalization compared to individual models.
2. Materials and Methods
2.1. The Technology Roadmap
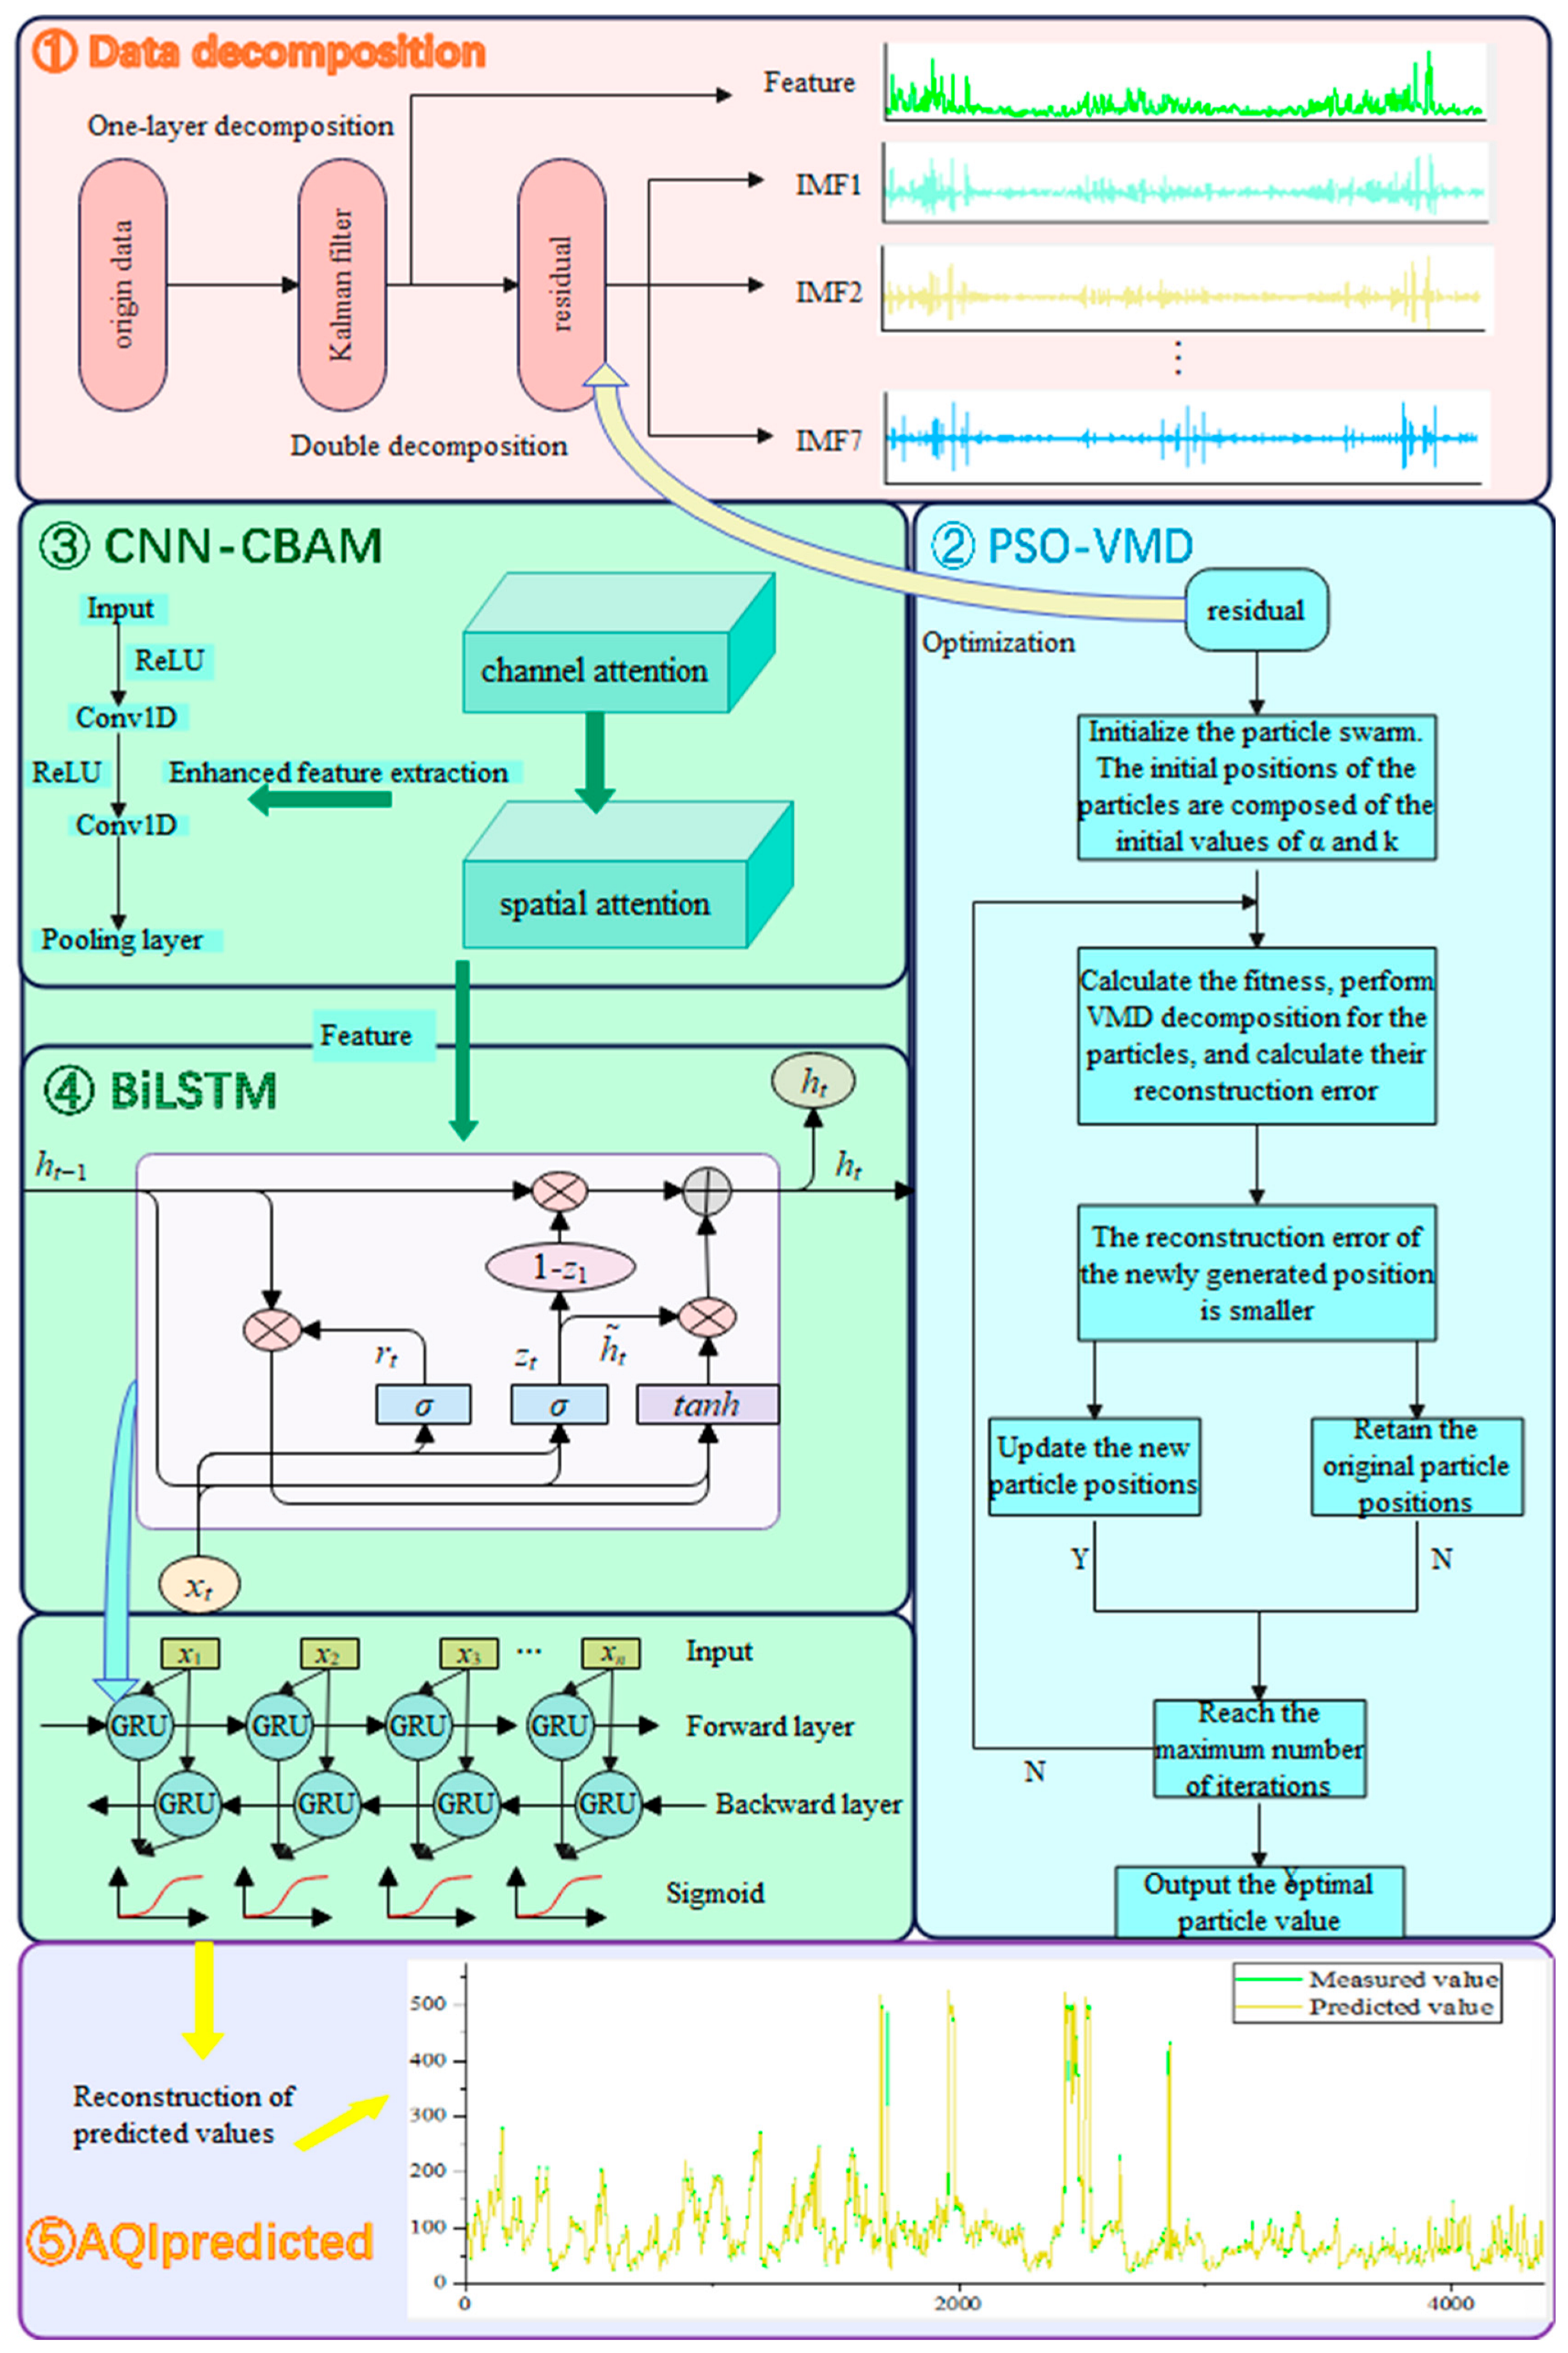
- Data decomposition: The AQI is decomposed into features and residuals using Kalman filtering, after which the residuals are further broken down into subsequences via VMD.
- Optimize the VMD by applying PSO to determine the optimal parameters.
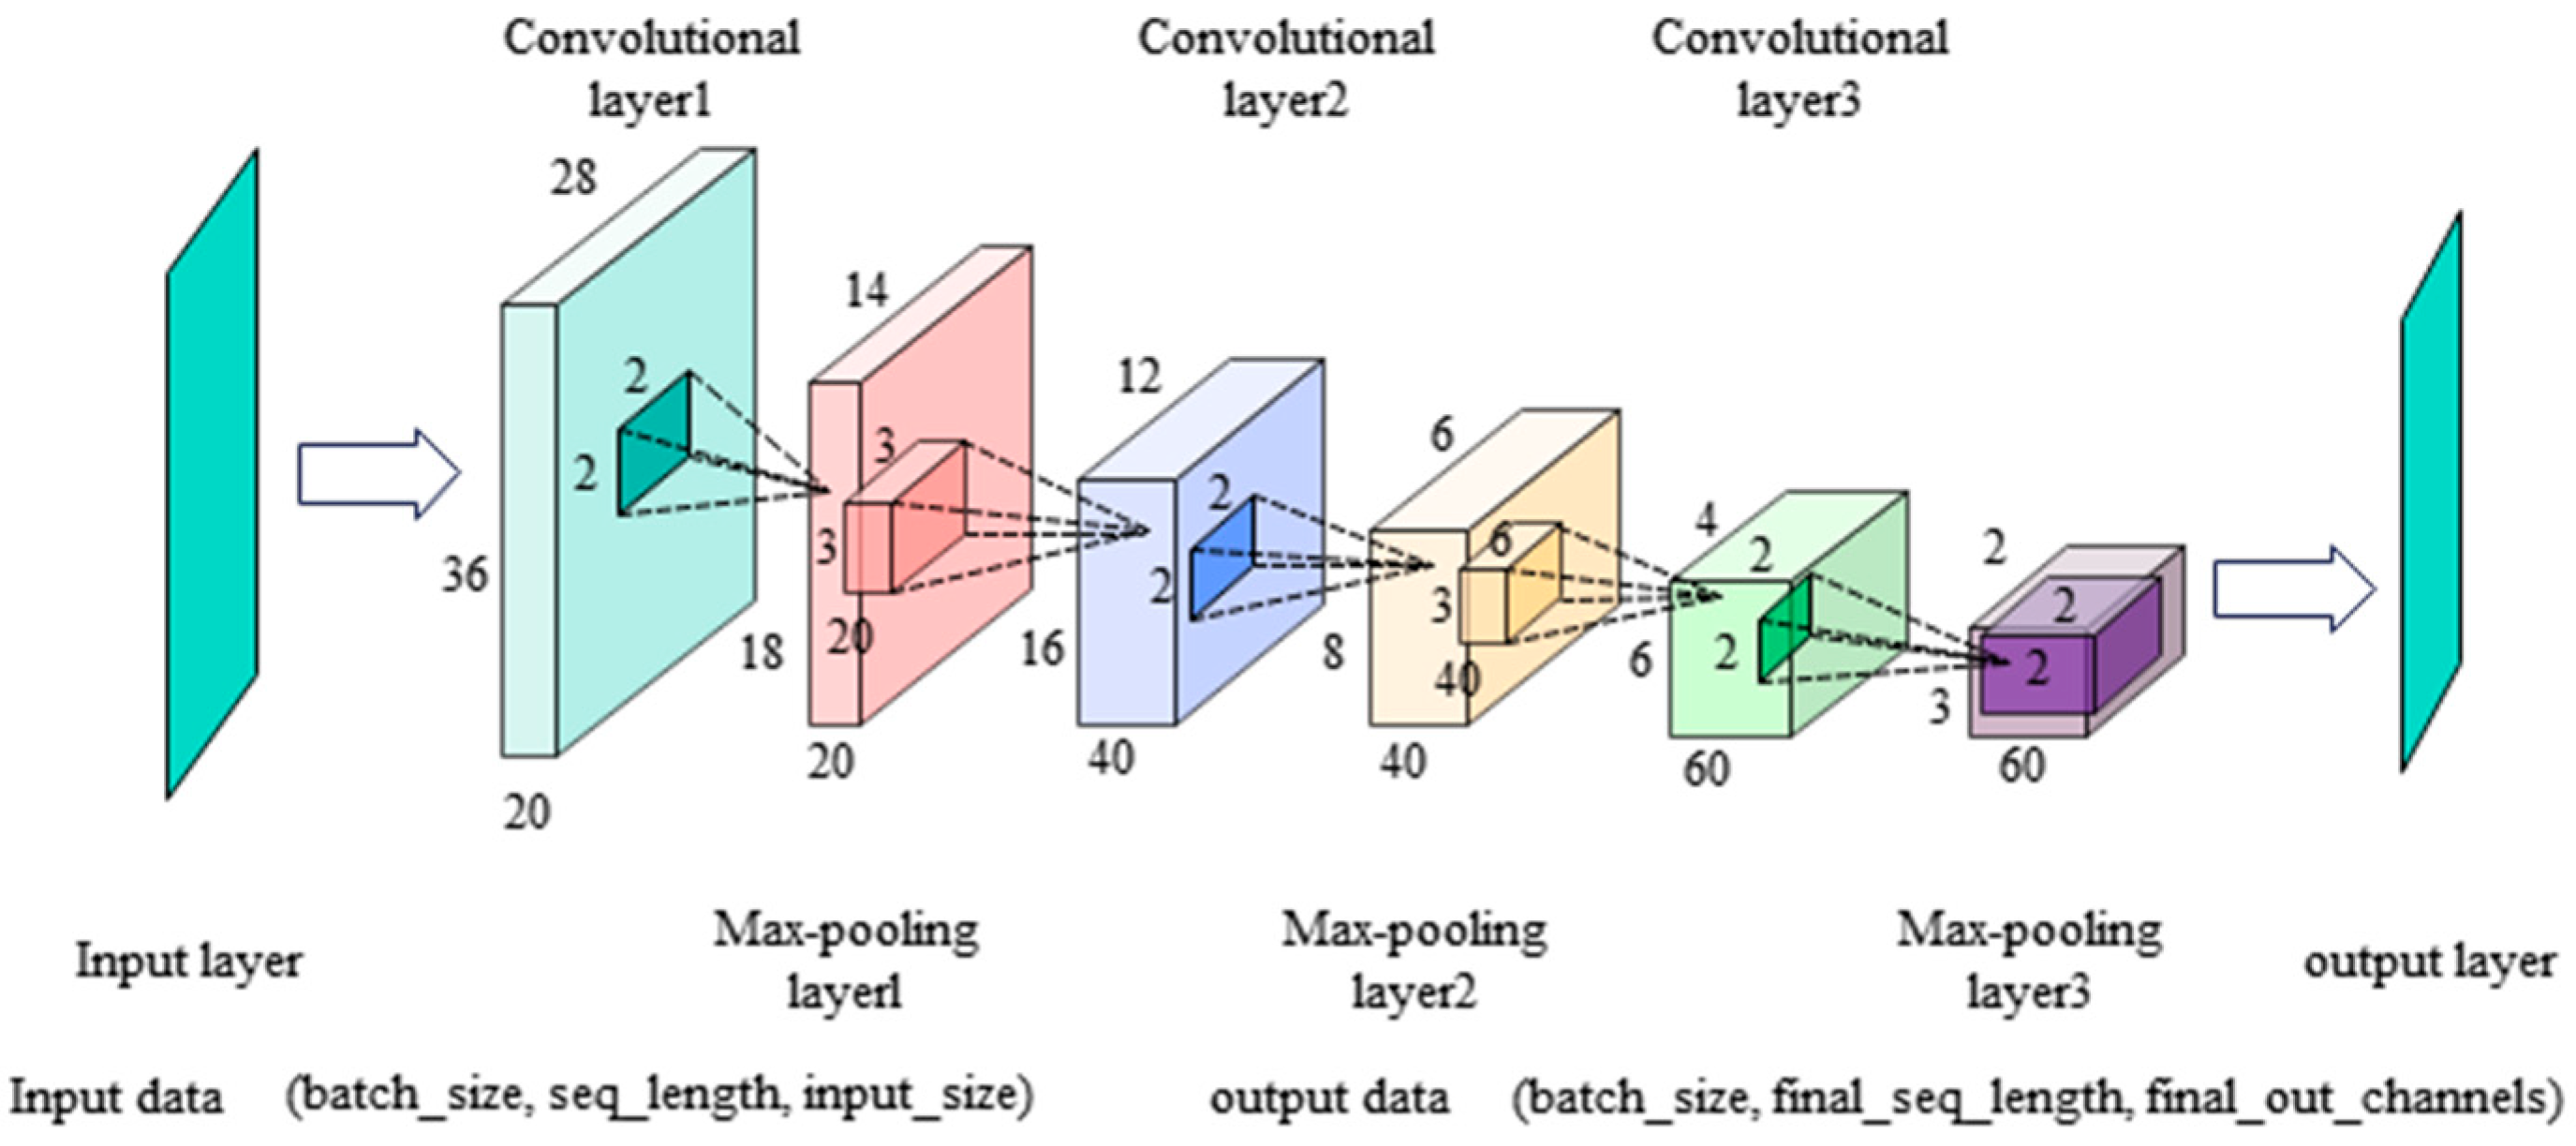
- Integrate the convolutional attention module into the CNN to extract features from the input subsequences and residuals.
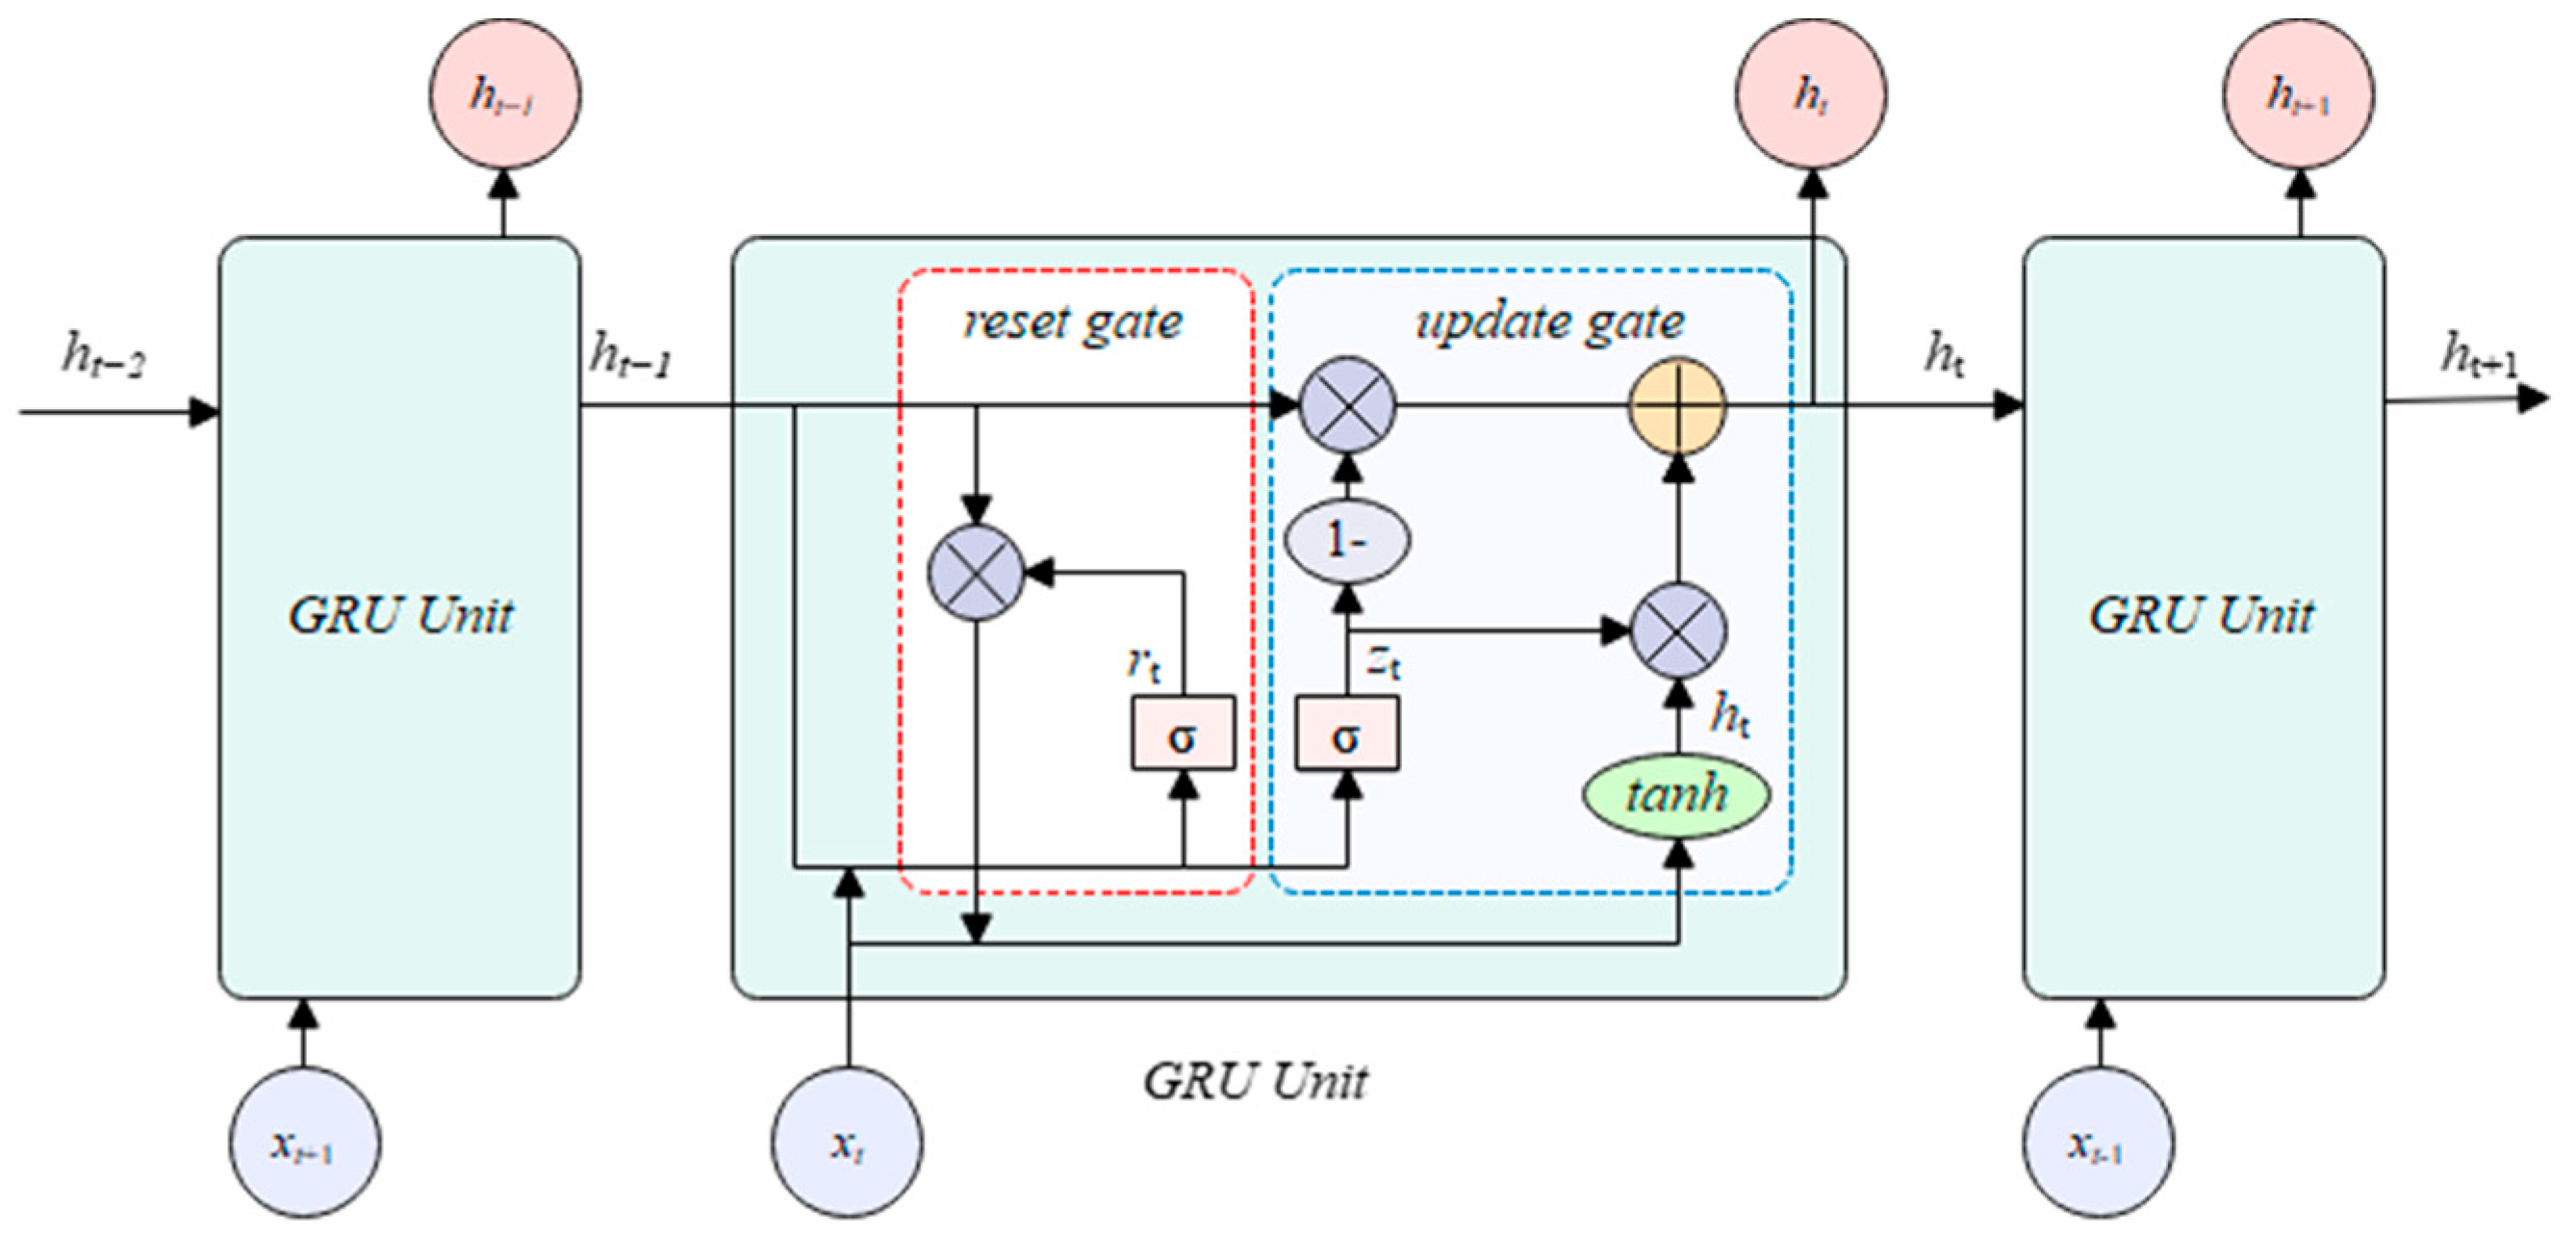
- Feed the extracted features into the BIGRU for prediction.
- Reconstruct the predicted results to derive the final predicted AQI value.
2.2. Particle Swarm Optimization
2.3. Kalman Filtering
2.4. VMD
2.5. CNN
2.6. Convolutional Block Attention Module (CBAM)
- Channel attention module
- 2.
- The spatial attention module can be computed using the following formula:
2.7. Gated Recurrent Unit (GRU)
2.8. Study Area and Data Processing
3. Results
3.1. Evaluation Metrics
3.2. Model Time Intervals and Step Selection
3.3. Comparison Results of Different Models
3.4. Ablation Experiment
3.5. Model Transfer
4. Discussion
- To address the instability of the AQI, the index is first decomposed into features and residuals using Kalman filtering to reduce overall volatility. However, since the residuals still exhibit significant fluctuations, they are further decomposed using VMD optimized by a PSO algorithm, effectively minimizing their volatility. To overcome the limited predictive capability of a single model, the final prediction is performed using BIGRU integrated with CNN and convolutional attention modules, enhancing both feature extraction and predictive accuracy.
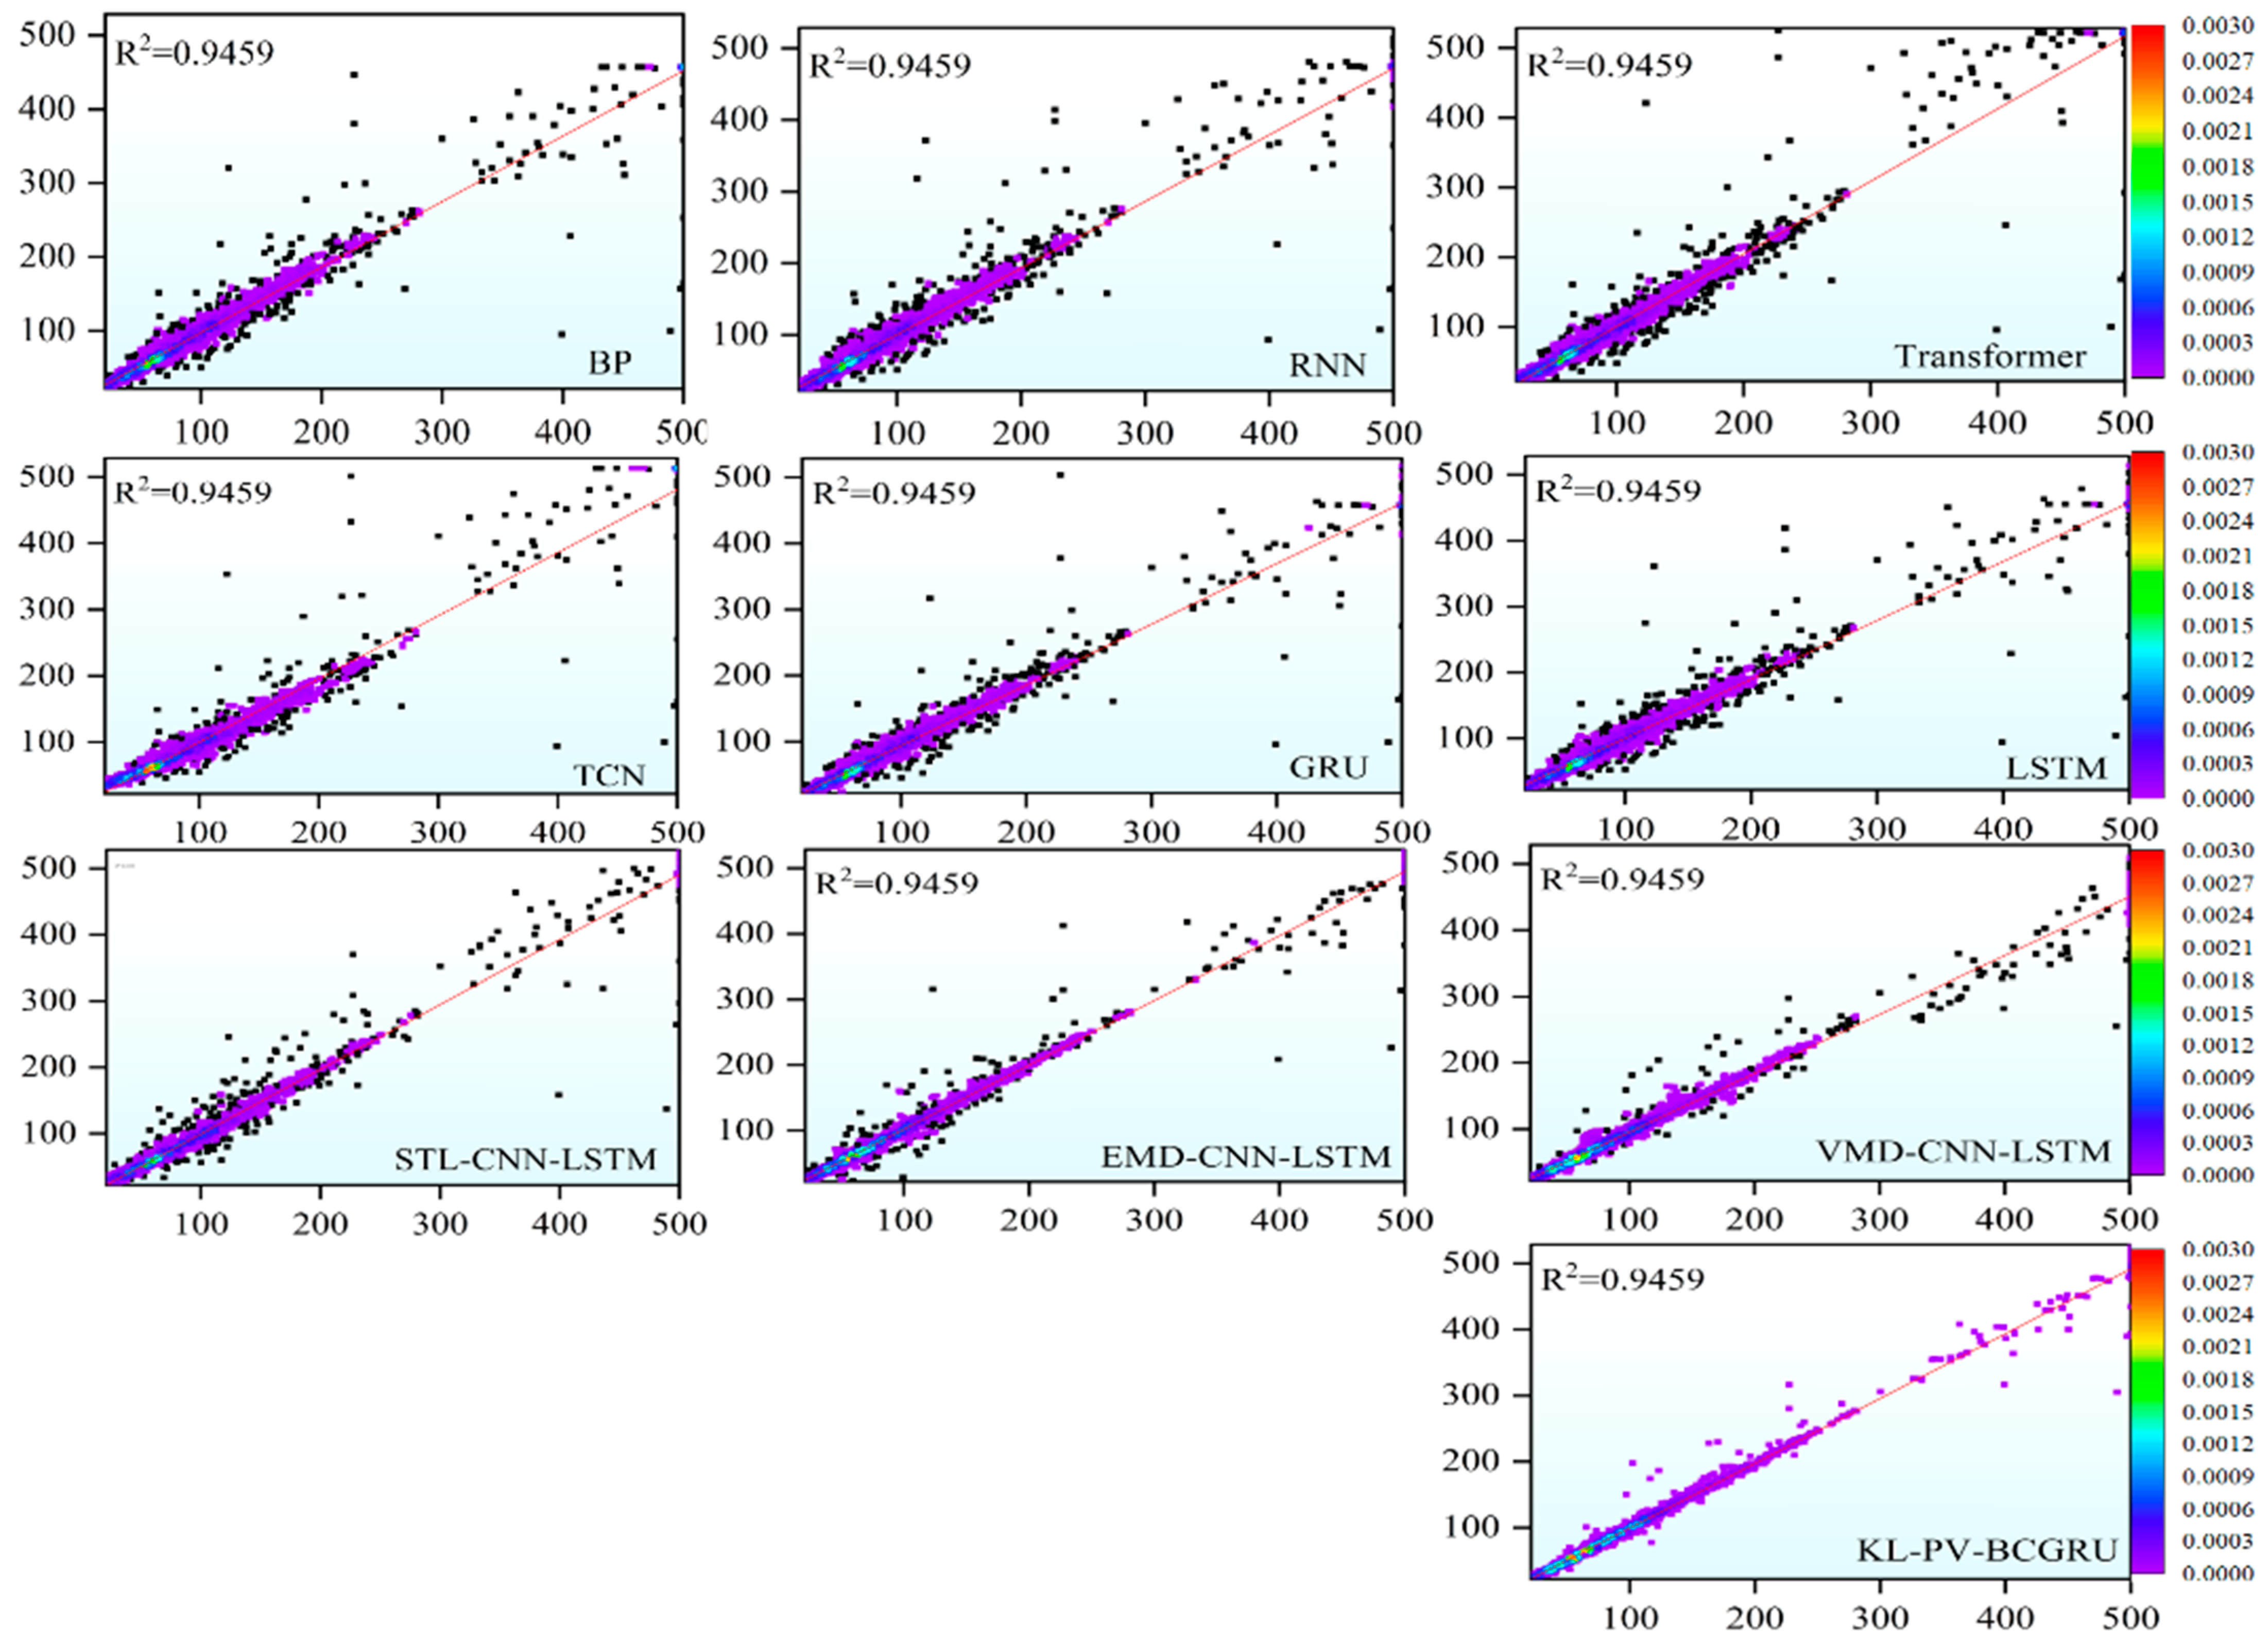
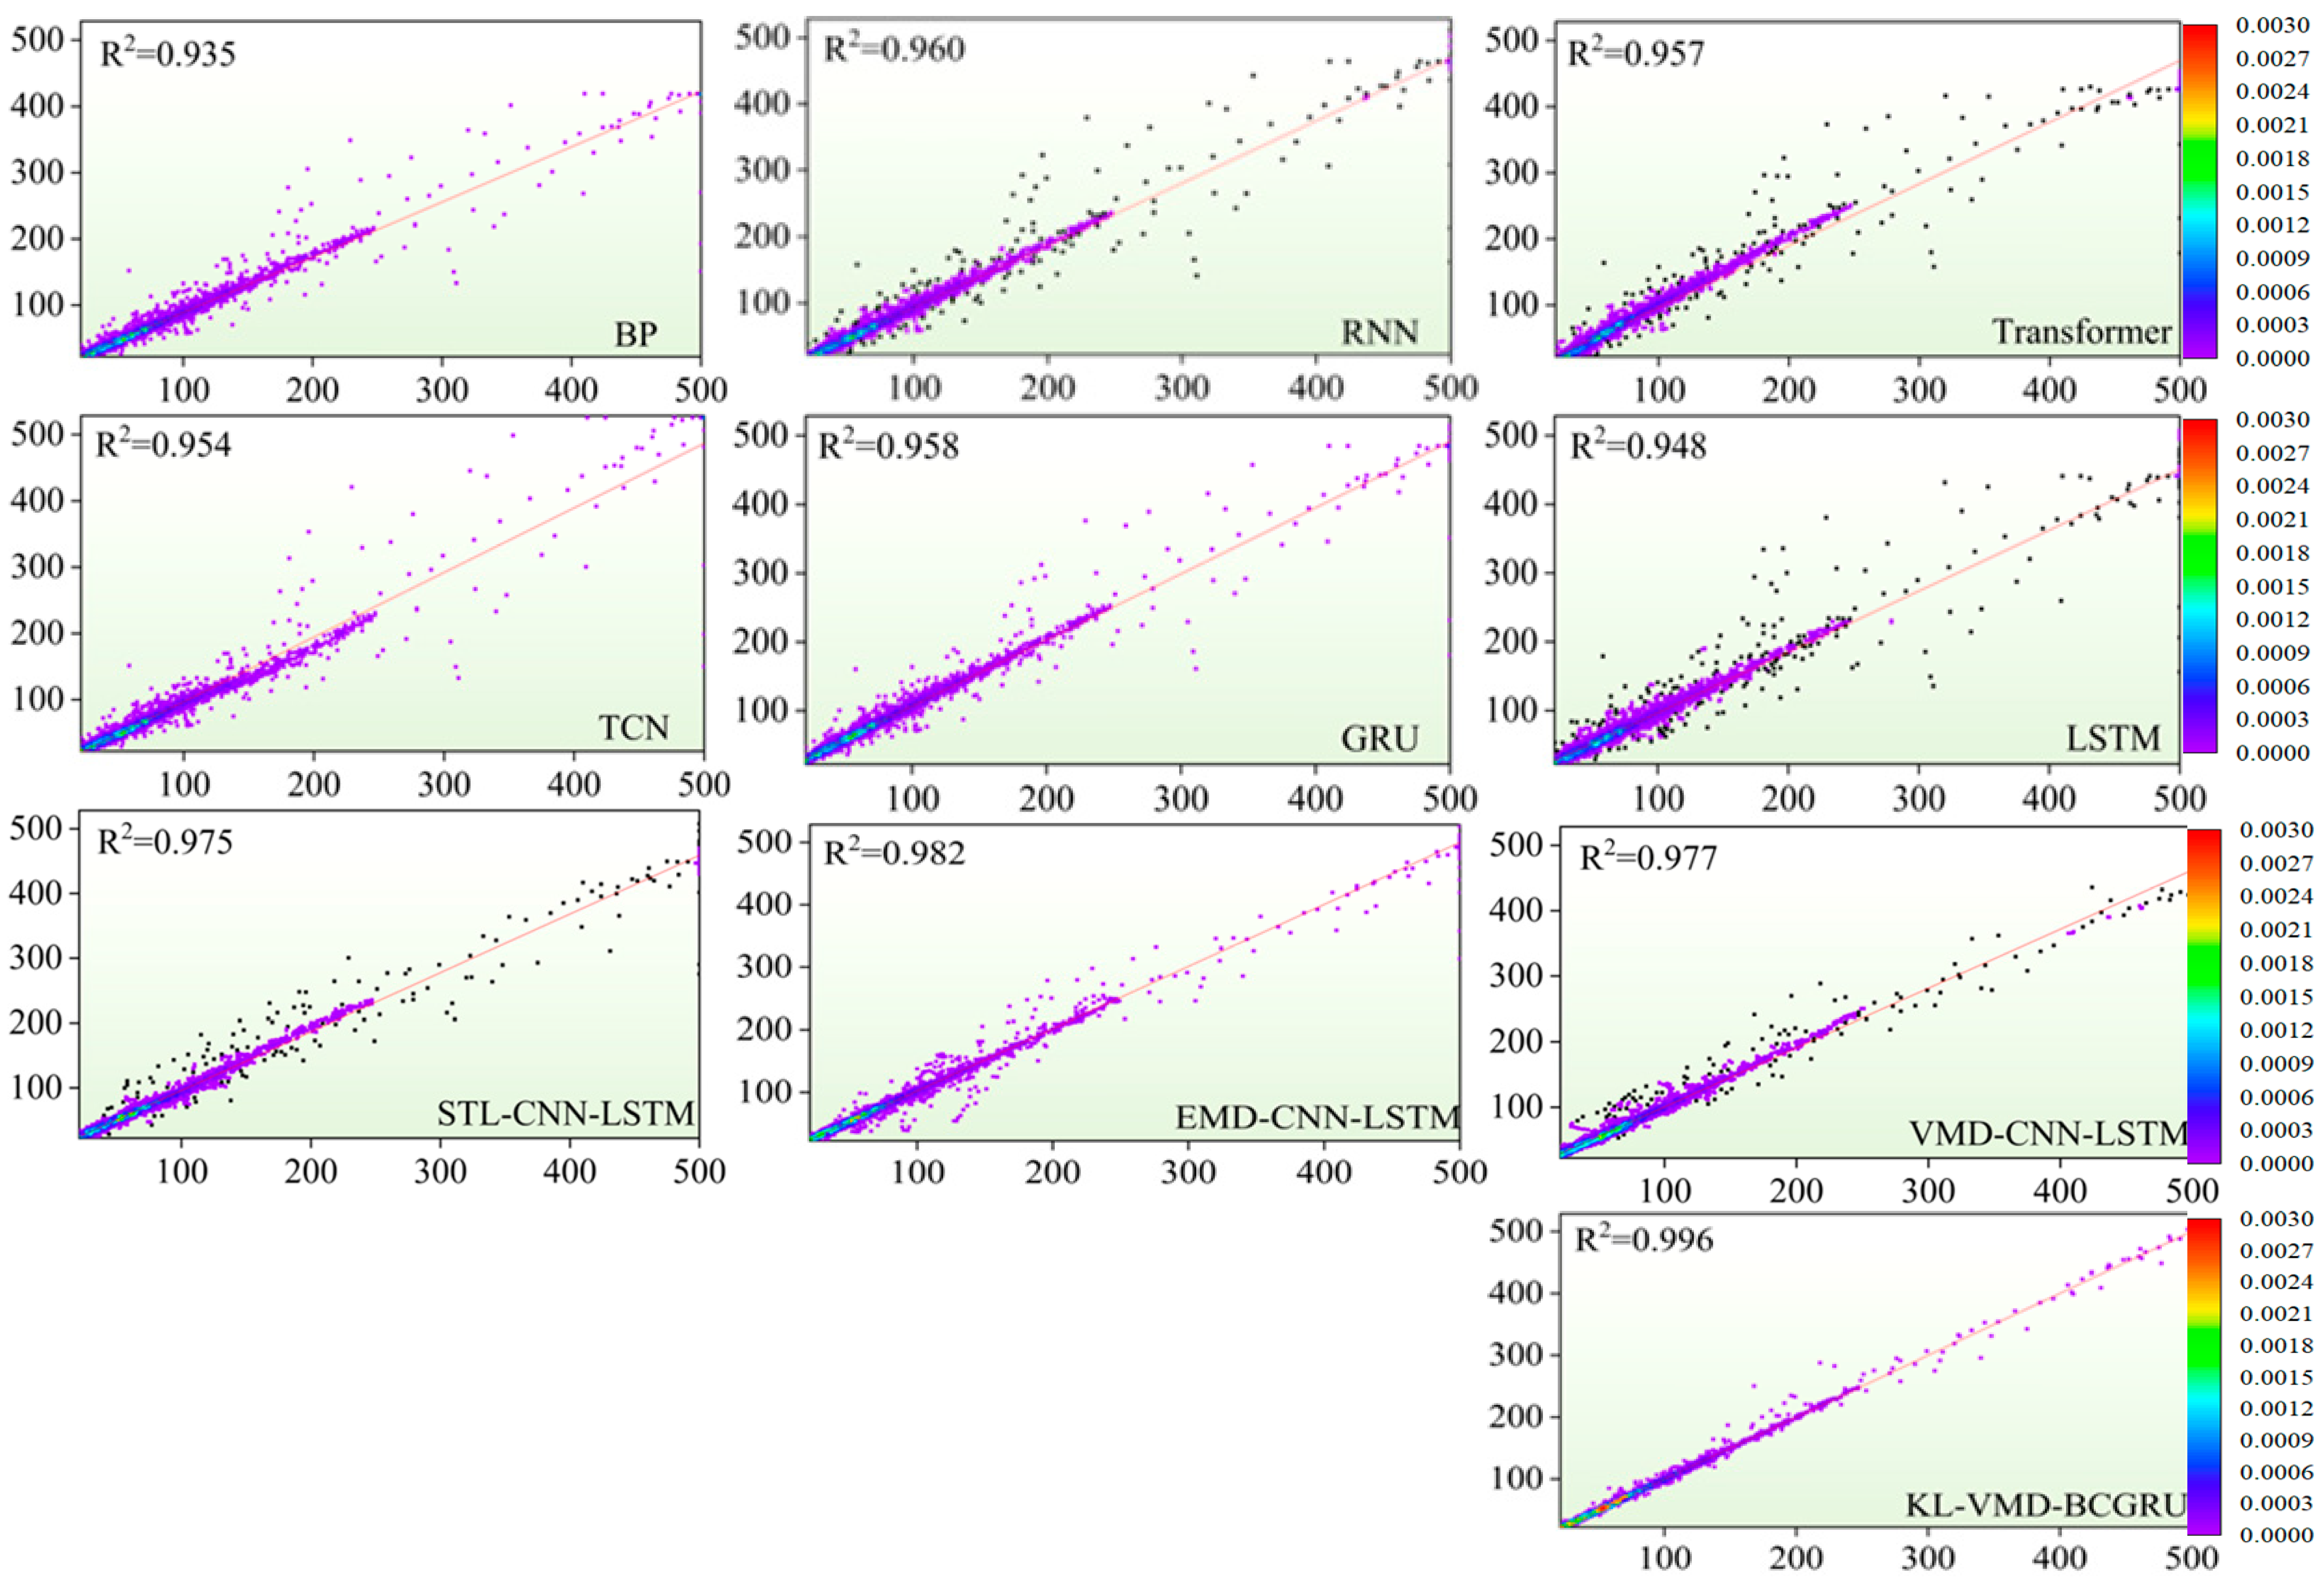
- The model proposed in this paper demonstrates strong prediction accuracy across various time intervals and time steps, highlighting its robustness and generalization ability in effectively capturing the volatility and instability of AQI under complex conditions. All models introduced in this study achieve high levels of accuracy, with R2, MAE, and RMSE reaching 0.993, 2.397, and 6.182 in Shijiazhuang, and 0.996, 1.723, and 4.349 in Beijing, respectively—surpassing the performance of other deep learning models. The effectiveness of the proposed models has been comprehensively validated through multiple experimental evaluations.
- This paper has achieved good experimental results by improving the model to predict AQI, but it still avoids the shortcomings of machine learning; that is, it is impossible to make an effective physical and chemical explanation of the prediction process, and the prediction process ignores the influence of meteorological factors. Future work should integrate meteorological data and enhance the interpretability of the model by adding physical and chemical principles to the machine learning model, so as to provide more reliable warnings and stronger support for public health protection and environmental management.
Author Contributions
Funding
Institutional Review Board Statement
Informed Consent Statement
Data Availability Statement
Conflicts of Interest
References
- Yao, M.; Wu, G.; Zhao, X.; Li, H.; Chen, J. Estimating health burden and economic loss attributable to short-term exposure to multiple air pollutants in China. Environ. Res. 2020, 183, 109184. [Google Scholar] [CrossRef]
- Kim, C.M.; Park, J.S.; Lee, H.; Choi, K.; Smith, D. Association between short-term exposure to air pollution and cardiovascular disease in older adults: A time-stratified case-crossover study in South Korea. Atmos. Environ. 2023, 30, 112–130. [Google Scholar] [CrossRef]
- Kai, Y.J.; Dong, X.X.; Miao, F.Y.; Zhang, L.; Huang, R. Impact of ambient air pollution on reduced visual acuity among children and adolescents. Ophthalmic Epidemiol. 2025, 32, 1–8. [Google Scholar] [CrossRef]
- Peng, D.; Liu, Y.X.; Sheng, H.Y.; Zhao, Q.; Wang, S. Ambient air pollution and the risk of cancer: Evidence from global cohort studies and epigenetic-related causal inference. J. Hazard. Mater. 2025, 398, 12. [Google Scholar] [CrossRef]
- Guo, Z.; Jing, X.; Ling, Y.; Xue, P.; Tan, W. Optimized air quality management based on AQI prediction and pollutant identification in representative cities in China. Sci. Rep. 2024, 14, 17923. [Google Scholar]
- Wyat, K.A.; Johnson, O.J.B.; Matthews, M.K.; Lee, S.; Patel, R. The Community Multiscale Air Quality (CMAQ) model versions 5.3 and 5.3.1: System updates and evaluation. Geosci. Model. Dev. 2021, 14, 2867–2897. [Google Scholar]
- Yang, W.; Wang, J.; Lu, H.; Zhou, X.; Chen, Y. Hybrid wind energy forecasting and analysis system based on divide-and-conquer scheme: A case study in China. J. Clean. Prod. 2019, 222, 942–959. [Google Scholar] [CrossRef]
- Gu, Y.; Zhang, Y.; Zhou, J.; Li, X.; Sun, T. A fuzzy multiple linear regression model based on meteorological factors for air quality index forecast. J. Intell. Fuzzy Syst. 2021, 40, 10523–10547. [Google Scholar] [CrossRef]
- Kim, E.S. Ordinal time series model for forecasting air quality index for ozone in Southern California. Environ. Model. Assess. 2017, 22, 175–182. [Google Scholar] [CrossRef]
- Liu, H.; Li, Q.; Yu, D.; Chen, L.; Zhao, M. Air quality index and air pollutant concentration prediction based on machine learning algorithms. Appl. Sci. 2019, 9, 4069. [Google Scholar] [CrossRef]
- Chatterjee, S.; Roy, A.C. Air quality index assessment prelude to mitigate environmental hazards. Nat. Hazards 2018, 91, 1–17. [Google Scholar] [CrossRef]
- Moolchand, S.; Samyak, J.; Sidhant, M.; Verma, P.; Gupta, R. Forecasting and prediction of air pollutant concentrations using machine learning techniques: The case of India. IOP Conf. Ser. Mater. Sci. Eng. 2021, 1022, 012123. [Google Scholar]
- Su, Y.; Xie, H. Prediction of AQI by BP neural network based on genetic algorithm. In Proceedings of the 5th International Conference on Automation, Control and Robotics Engineering (CACRE 2020), Dalian, China, 19–20 September 2020; School of Science, Dalian Maritime University: Dalian, China, 2020; pp. 650–654. [Google Scholar]
- Maleki, H.; Sorooshian, A.; Goudarzi, G.; Farzanegan, A.; Li, X. Air pollution prediction by using an artificial neural network model. Clean. Technol. Environ. Policy 2019, 21, 1341–1352. [Google Scholar] [CrossRef] [PubMed]
- Kumar, A.M.; Rikta, S. Medium-term AQI prediction in selected areas of Bangladesh based on bidirectional GRU network model. SN Comput. Sci. 2024, 5, 112–125. [Google Scholar] [CrossRef]
- Kumar, S.N.; Prakash, S.; Daniel, A.; Venkatesh, P.; Rao, K. Optimized machine learning model for air quality index prediction in major cities in India. Sci. Rep. 2024, 14, 6795. [Google Scholar] [CrossRef] [PubMed]
- Jia, Z.; Baofeng, L.; Hong, C.; Zhang, Y. AQI multi-point spatiotemporal prediction based on K-means clustering and RNN-LSTM model. J. Phys. Conf. Ser. 2021, 2006, 012034. [Google Scholar]
- Zhu, X.; Zou, F.; Li, S.; Wang, T.; Sun, Z. Enhancing air quality prediction with an adaptive PSO-optimized CNN-Bi-LSTM model. Appl. Sci. 2024, 14, 5787. [Google Scholar] [CrossRef]
- Sarkar, N.; Keserwani, K.P.; Govil, C.M.; Verma, S. A modified PSO-based hybrid deep learning approach to predict AQI of urban metropolis. Urban Clim. 2024, 19, 102212. [Google Scholar] [CrossRef]
- Wang, J.; Li, X.; Wang, T.; Chen, Y.; Liu, H. A CA-GRU-based model for air quality prediction. Int. J. Ad. Hoc Ubiquitous Comput. 2021, 38, 184–198. [Google Scholar] [CrossRef]
- Qian, S.; Peng, T.; He, R.; Zhang, L.; Liu, Y. A novel ensemble framework based on intelligent weight optimization and multi-model fusion for air quality index prediction. Urban Clim. 2024, 25, 33–47. [Google Scholar] [CrossRef]
- Zhu, S.; Lian, X.; Liu, H.; Wang, P.; Zhao, Q. Daily air quality index forecasting with hybrid models: A case in China. Environ. Pollut. 2017, 231, 1232–1244. [Google Scholar] [CrossRef] [PubMed]
- Shi, X.; Tang, Z.; Zhang, Z.; Li, F.; Chen, G. A new decomposition-integrated air quality index prediction model. Earth Sci. Inform. 2023, 16, 2307–2321. [Google Scholar]
- Zhang, S.; Wang, P.; Wu, R.; Li, M.; Zhao, Y. CEEMD-LASSO-ELM nonlinear combined model of air quality index prediction for four cities in China. Environ. Ecol. Stat. 2023, 30, 309–334. [Google Scholar]
- Dalal, S.; Lilhore, K.U.; Faujdar, N.; Singh, P. Optimising air quality prediction in smart cities with hybrid particle swarm optimization–LSTM–RNN model. IET Smart Cities 2024, 6, 156–179. [Google Scholar] [CrossRef]
- Chen, J.; Chen, K.; Ding, C.; Wang, G.; Liu, Q.; Liu, X. An Adaptive Kalman Filtering Approach to Sensing and Predicting Air Quality Index Values. IEEE Access 2020, 8, 4265–4272. [Google Scholar] [CrossRef]
- Dragomiretskiy, K.; Zosso, D. Variational mode decomposition. IEEE Trans. Signal Process. 2014, 62, 531–544. [Google Scholar] [CrossRef]
- Dong, X.; Li, D.; Wang, W.; Zhang, Q.; Liu, J. BWO-CAformer: An improved Informer model for AQI prediction in Beijing and Wuhan. Process Saf. Environ. Prot. 2025, 195, 106800. [Google Scholar] [CrossRef]


| Time Step | R2(1) | MAE | RMSE | R2(8) | MAE | RMSE | R2(16) | MAE | RMSE | R2(24) | MAE | RMSE |
|---|---|---|---|---|---|---|---|---|---|---|---|---|
| 3 | 0.992 | 2.893 | 6.481 | 0.958 | 9.300 | 15.357 | 0.911 | 13.633 | 21.993 | 0.922 | 15.928 | 25.071 |
| 6 | 0.993 | 2.397 | 6.182 | 0.962 | 8.962 | 14.637 | 0.932 | 11.081 | 19.268 | 0.940 | 14.035 | 22.108 |
| 9 | 0.990 | 2.993 | 6.681 | 0.962 | 8.535 | 14.735 | 0.933 | 11.158 | 19.014 | 0.933 | 14.047 | 23.357 |
| 12 | 0.993 | 2.480 | 6.057 | 0.963 | 8.668 | 14.391 | 0.935 | 11.001 | 18.821 | 0.935 | 14.267 | 22.907 |
| Model | R2(1) | MAE | RMSE | R2(8) | MAE | RMSE |
|---|---|---|---|---|---|---|
| LSTM | 0.9469 | 7.3766 | 17.2026 | 0.5369 | 25.8072 | 51.1200 |
| GRU | 0.9485 | 7.7413 | 16.9467 | 0.5642 | 25.3652 | 49.5876 |
| RNN | 0.9463 | 6.9255 | 17.3110 | 0.5468 | 25.7218 | 50.5703 |
| BP | 0.9481 | 6.8144 | 17.0117 | 0.5184 | 26.3376 | 52.1308 |
| TCN | 0.9459 | 7.9340 | 17.3704 | 0.5159 | 26.4386 | 52.2667 |
| Transformer | 0.9404 | 6.7763 | 18.2390 | 0.5107 | 27.1366 | 52.5444 |
| VMD-CNN-LSTM | 0.9721 | 5.9081 | 12.4794 | 0.861 | 16.510 | 28.0094 |
| EMD-CNN-LSTM | 0.9778 | 4.9613 | 11.1358 | 0.762 | 20.131 | 36.739 |
| STL-CNN-LSTM | 0.9718 | 5.4344 | 12.5468 | 0.8116 | 19.1606 | 32.6334 |
| KL-PV-CBGRU | 0.993 | 2.397 | 6.182 | 0.963 | 8.668 | 14.391 |
| Models | R2(16) | MAE | RMSE | R2(24) | MAE | RMSE |
| LSTM | 0.2741 | 32.5211 | 62.7765 | 0.2731 | 38.4885 | 76.6695 |
| GRU | 0.2812 | 35.3698 | 62.4689 | 0.2546 | 40.7808 | 77.6354 |
| RNN | 0.2982 | 32.6587 | 61.7293 | 0.2621 | 40.6721 | 77.2483 |
| BP | 0.3235 | 32.5666 | 60.6066 | 0.2335 | 38.0625 | 78.7288 |
| TCN | 0.2914 | 32.0082 | 62.0273 | 0.2464 | 38.2540 | 78.0645 |
| Transformer | 0.3016 | 35.8116 | 61.5778 | 0.2417 | 38.9847 | 78.3053 |
| CNN-LSTM-VMD | 0.8418 | 18.0704 | 29.3039 | 0.8116 | 22.6703 | 39.0332 |
| CNN-LSTM-EMD | 0.6790 | 25.7290 | 41.7500 | 0.6194 | 35.3254 | 55.4775 |
| STL-CNN-LSTM | 0.6403 | 26.5700 | 44.1920 | 0.3768 | 39.7020 | 70.9900 |
| KL-PV-CBGRU | 0.935 | 11.001 | 18.821 | 0.940 | 14.035 | 22.108 |
| Models | R2 | MAE | RMSE |
|---|---|---|---|
| KL-PV-CGRU | 0.987 | 5.254 | 8.367 |
| KL-PV-CBGRU | 0.993 | 2.397 | 6.182 |
| KL-CBGRU | 0.960 | 5.817 | 14.943 |
| Time Steps | R2(1) | MAE | RMSE | R2(8) | MAE | RMSE | R2(16) | MAE | RMSE | R2(24) | MAE | RMSE |
|---|---|---|---|---|---|---|---|---|---|---|---|---|
| 3 | 0.996 | 1.781 | 4.345 | 0.950 | 9.555 | 16.168 | 0.920 | 13.422 | 20.985 | 0.879 | 0.879 | 27.000 |
| 6 | 0.995 | 2.118 | 4.845 | 0.950 | 9.632 | 16.198 | 0.940 | 11.770 | 18.166 | 0.902 | 15.168 | 24.317 |
| 9 | 0.996 | 1.723 | 4.349 | 0.951 | 9.279 | 16.042 | 0.941 | 11.583 | 17.986 | 0.909 | 14.547 | 23.396 |
| 12 | 0.996 | 1.961 | 4.509 | 0.950 | 9.442 | 16.177 | 0.950 | 10.985 | 16.528 | 0.905 | 14.528 | 23.885 |
| Model | R2(1) | MAE | RMSE | R2(8) | MAE | RMSE |
|---|---|---|---|---|---|---|
| LSTM | 0.9481 | 6.8661 | 15.7642 | 0.4742 | 26.3235 | 52.3974 |
| GRU | 0.9584 | 9.3443 | 14.1072 | 0.4678 | 26.4168 | 52.7193 |
| RNN | 0.9601 | 7.4203 | 13.8245 | 0.4615 | 26.6180 | 53.0262 |
| BP | 0.9356 | 9.0744 | 17.5583 | 0.4688 | 27.1843 | 52.6663 |
| TCN | 0.9541 | 6.7830 | 14.8293 | 0.4304 | 26.8854 | 54.5387 |
| Transformer | 0.9575 | 6.3880 | 14.2598 | 0.4555 | 27.9065 | 53.3249 |
| CNN-LSTM-VMD | 0.9778 | 5.9286 | 10.3216 | 0.8717 | 15.3052 | 25.9079 |
| VMD-CNN-LSTM | 0.9827 | 4.5889 | 9.1019 | 0.7392 | 21.2418 | 36.9375 |
| STL-CNN-LSTM | 0.9753 | 5.1647 | 10.8767 | 0.5953 | 24.5176 | 46.0082 |
| KL-PV-CBGRU | 0.996 | 1.723 | 4.349 | 0.951 | 9.279 | 16.042 |
| Model | R2(16) | MAE | RMSE | R2(24) | MAE | RMSE |
| LSTM | 0.2444 | 36.1134 | 64.3183 | 0.0052 | 39.8898 | 77.3441 |
| GRU | 0.2398 | 34.5962 | 64.5147 | 0.0089 | 40.3123 | 77.1996 |
| RNN | 0.2045 | 35.8221 | 65.9938 | 0.0071 | 40.2891 | 77.2693 |
| BP | 0.2195 | 33.4292 | 65.3715 | 0.0663 | 40.7569 | 74.9304 |
| TCN | 0.2455 | 33.6317 | 64.2695 | 0.1073 | 39.4742 | 73.2669 |
| Transformer | 0.2396 | 34.4169 | 64.5236 | 0.1081 | 39.9265 | 73.2339 |
| CNN-LSTM-VMD | 0.8339 | 18.1176 | 30.1578 | 0.7735 | 22.8377 | 36.9064 |
| CNN-LSTM-EMD | 0.5248 | 31.7690 | 51.0044 | 0.3304 | 37.6196 | 63.4538 |
| STL-CNN-LSTM | 0.5603 | 29.0838 | 49.0654 | 0.1729 | 40.0659 | 70.5240 |
| KL-PV-CBGRU | 0.950 | 10.985 | 16.528 | 0.909 | 14.547 | 23.396 |
Disclaimer/Publisher’s Note: The statements, opinions and data contained in all publications are solely those of the individual author(s) and contributor(s) and not of MDPI and/or the editor(s). MDPI and/or the editor(s) disclaim responsibility for any injury to people or property resulting from any ideas, methods, instructions or products referred to in the content. |
© 2025 by the authors. Licensee MDPI, Basel, Switzerland. This article is an open access article distributed under the terms and conditions of the Creative Commons Attribution (CC BY) license (https://creativecommons.org/licenses/by/4.0/).
Share and Cite
Chen, S.; Zhao, Q.; Chen, Z.; Jin, Y.; Zhang, C. A Hybrid Air Quality Prediction Model Integrating KL-PV-CBGRU: Case Studies of Shijiazhuang and Beijing. Atmosphere 2025, 16, 965. https://doi.org/10.3390/atmos16080965
Chen S, Zhao Q, Chen Z, Jin Y, Zhang C. A Hybrid Air Quality Prediction Model Integrating KL-PV-CBGRU: Case Studies of Shijiazhuang and Beijing. Atmosphere. 2025; 16(8):965. https://doi.org/10.3390/atmos16080965
Chicago/Turabian StyleChen, Sijie, Qichao Zhao, Zhao Chen, Yongtao Jin, and Chao Zhang. 2025. "A Hybrid Air Quality Prediction Model Integrating KL-PV-CBGRU: Case Studies of Shijiazhuang and Beijing" Atmosphere 16, no. 8: 965. https://doi.org/10.3390/atmos16080965
APA StyleChen, S., Zhao, Q., Chen, Z., Jin, Y., & Zhang, C. (2025). A Hybrid Air Quality Prediction Model Integrating KL-PV-CBGRU: Case Studies of Shijiazhuang and Beijing. Atmosphere, 16(8), 965. https://doi.org/10.3390/atmos16080965


