Optimizing Pedestrian-Friendly Spaces in Xi’an’s Residential Streets: Accounting for PM2.5 Exposure
Abstract
1. Introduction
2. Research Methods and PM2.5 Exposure Calculation
2.1. Environmental Characteristics of Xi’an City
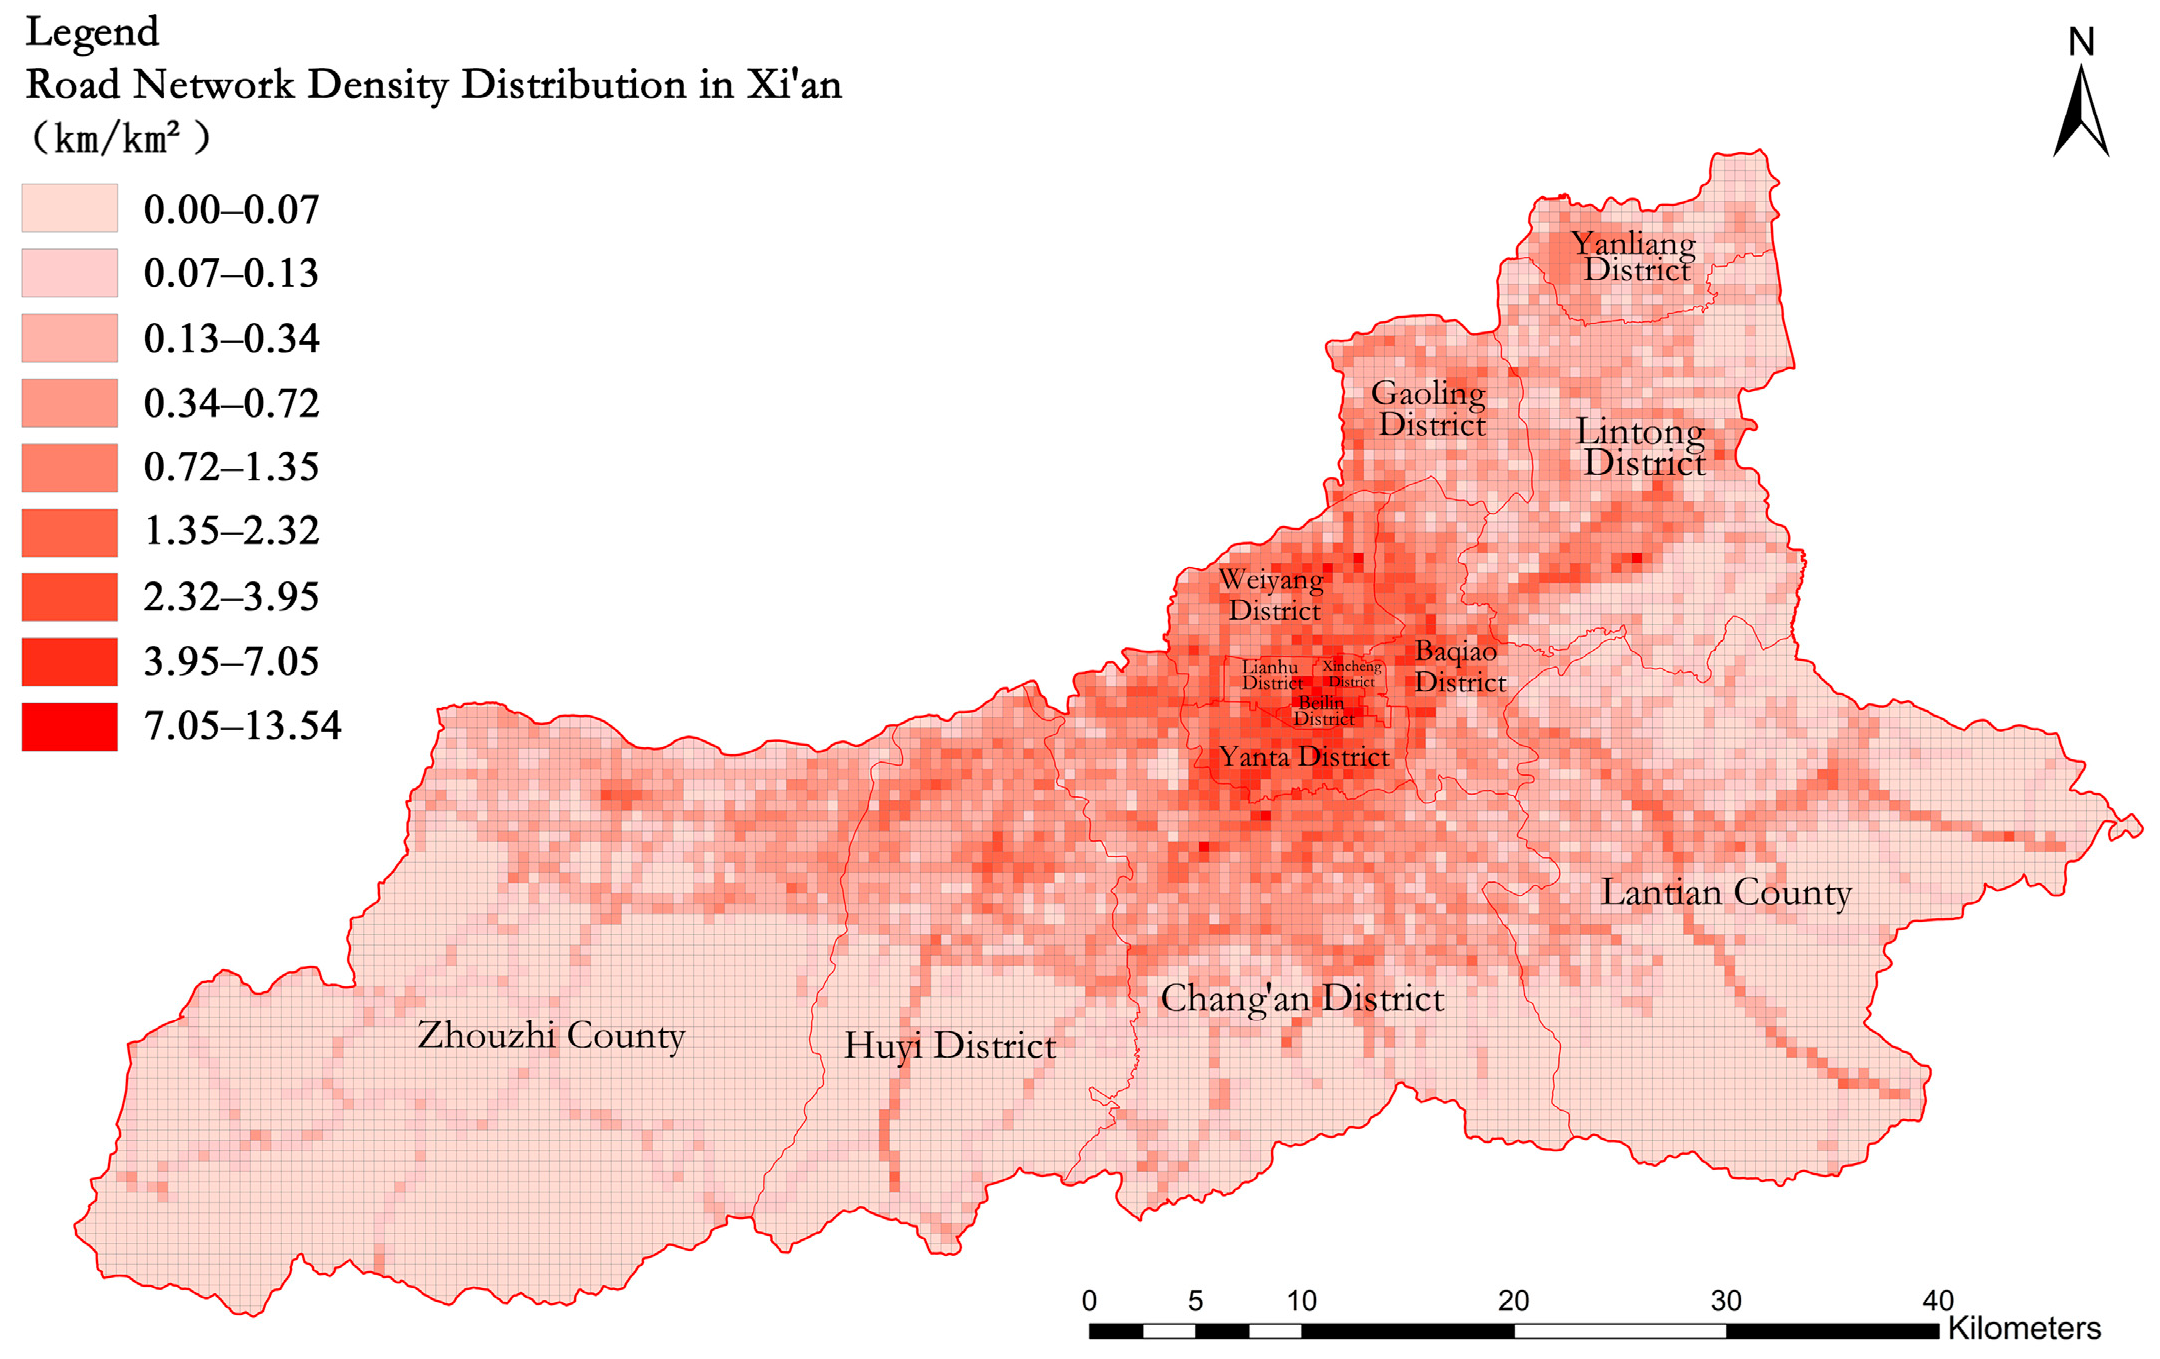
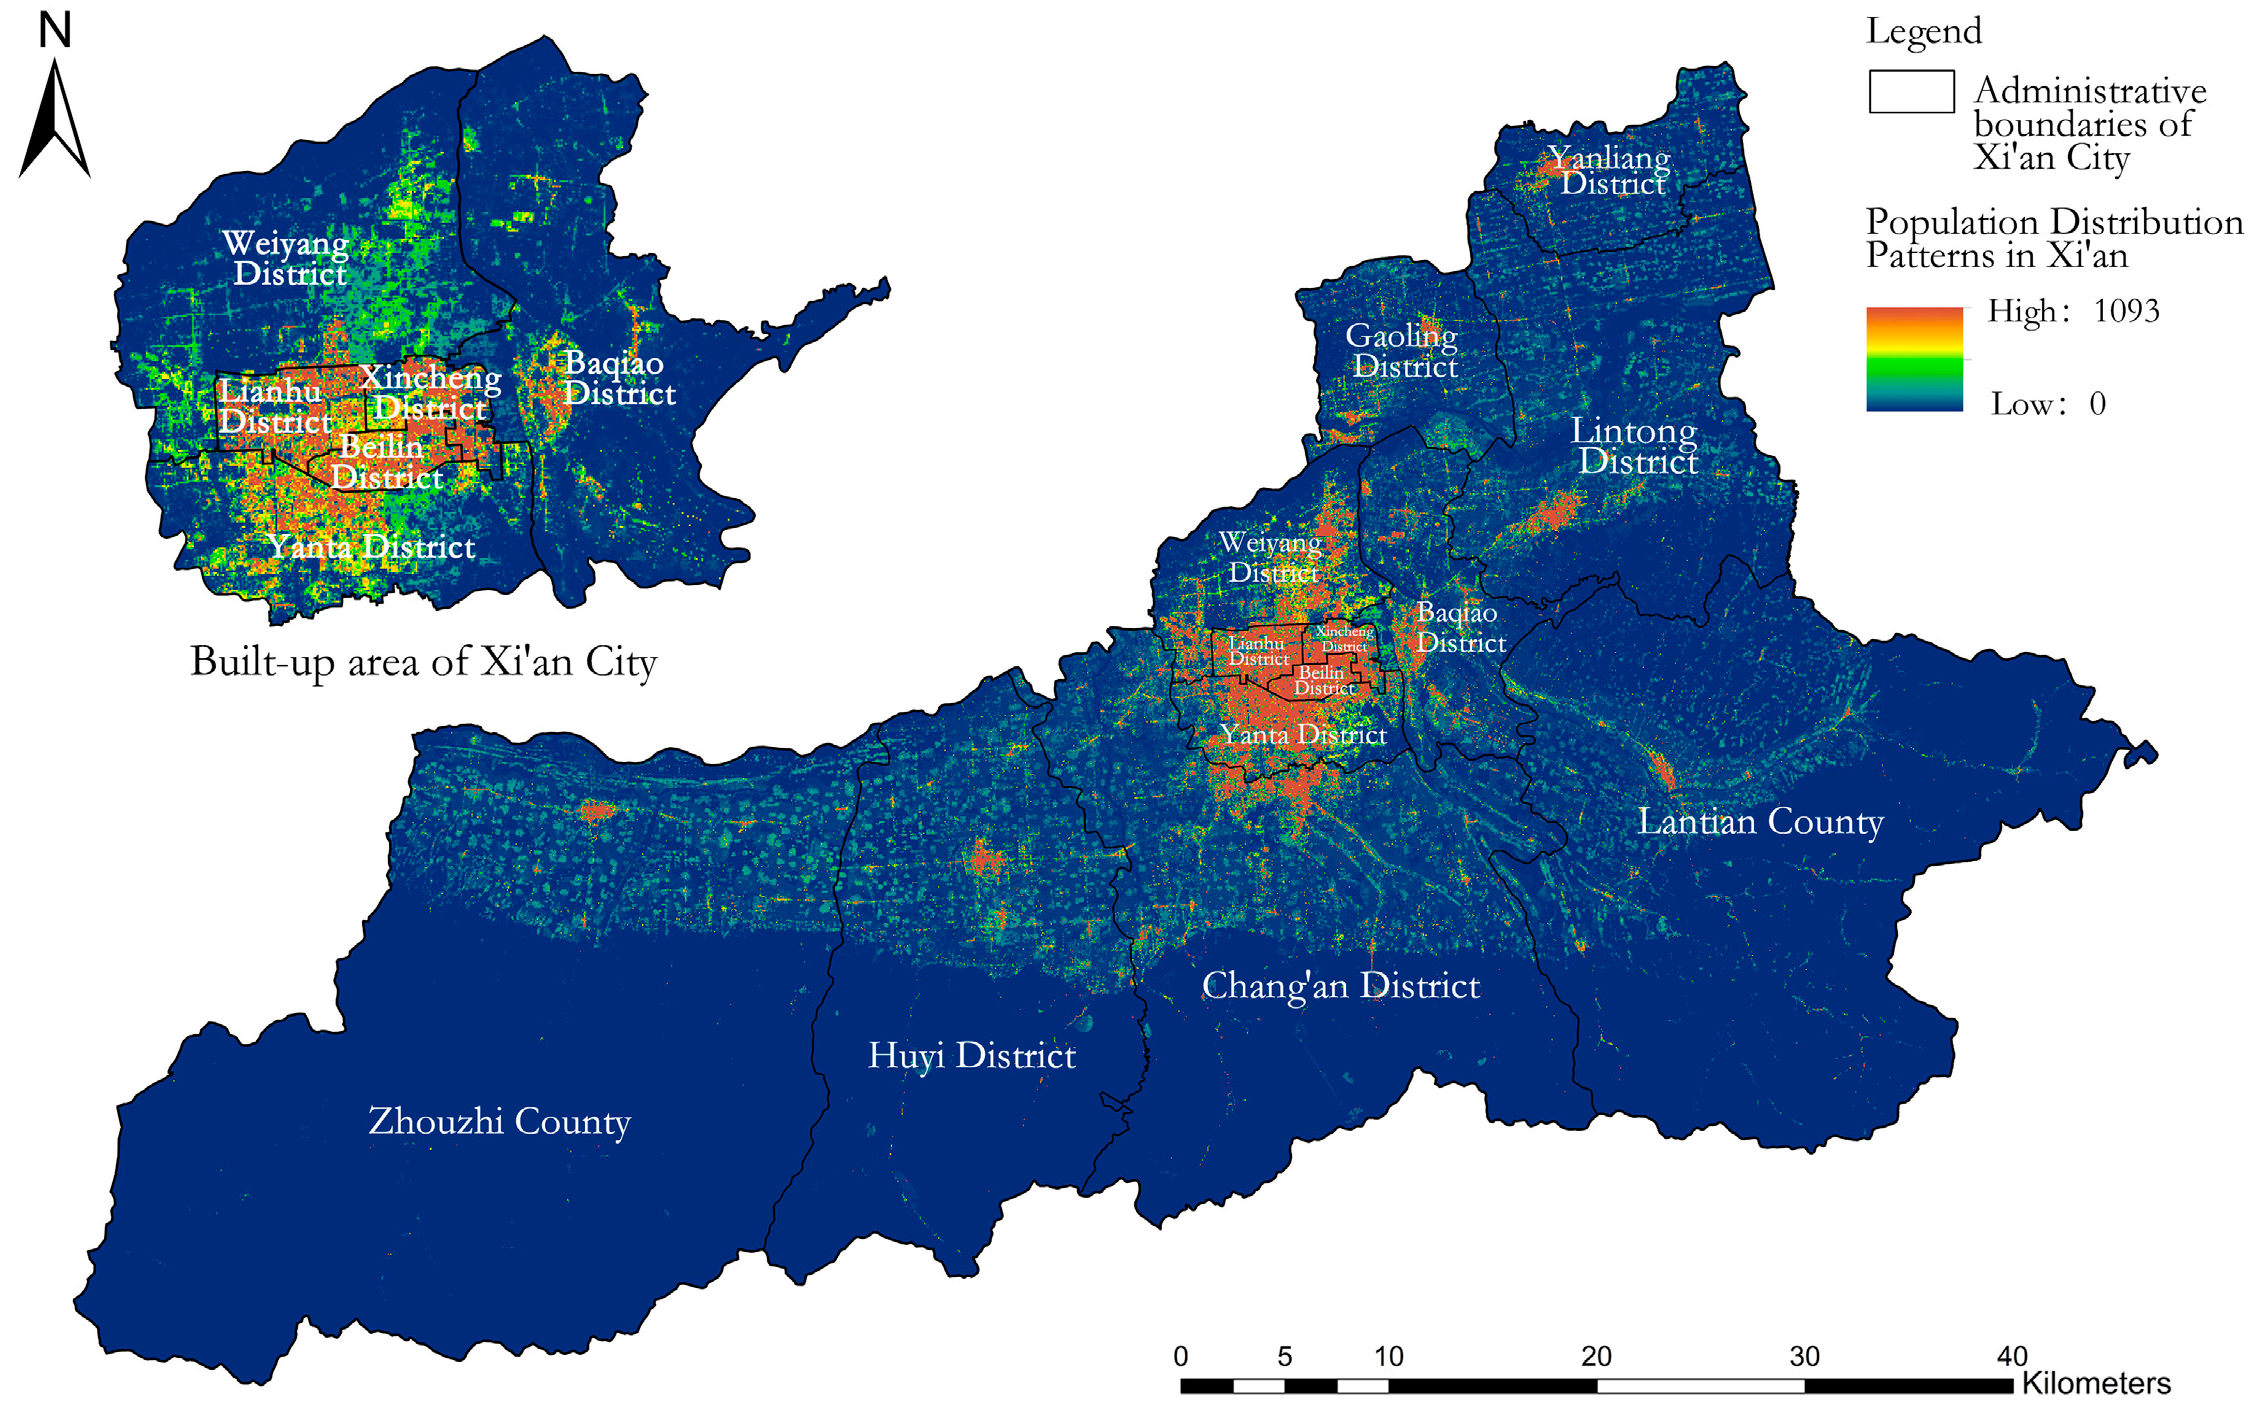
2.1.1. Basic Characteristics of Xi’an City
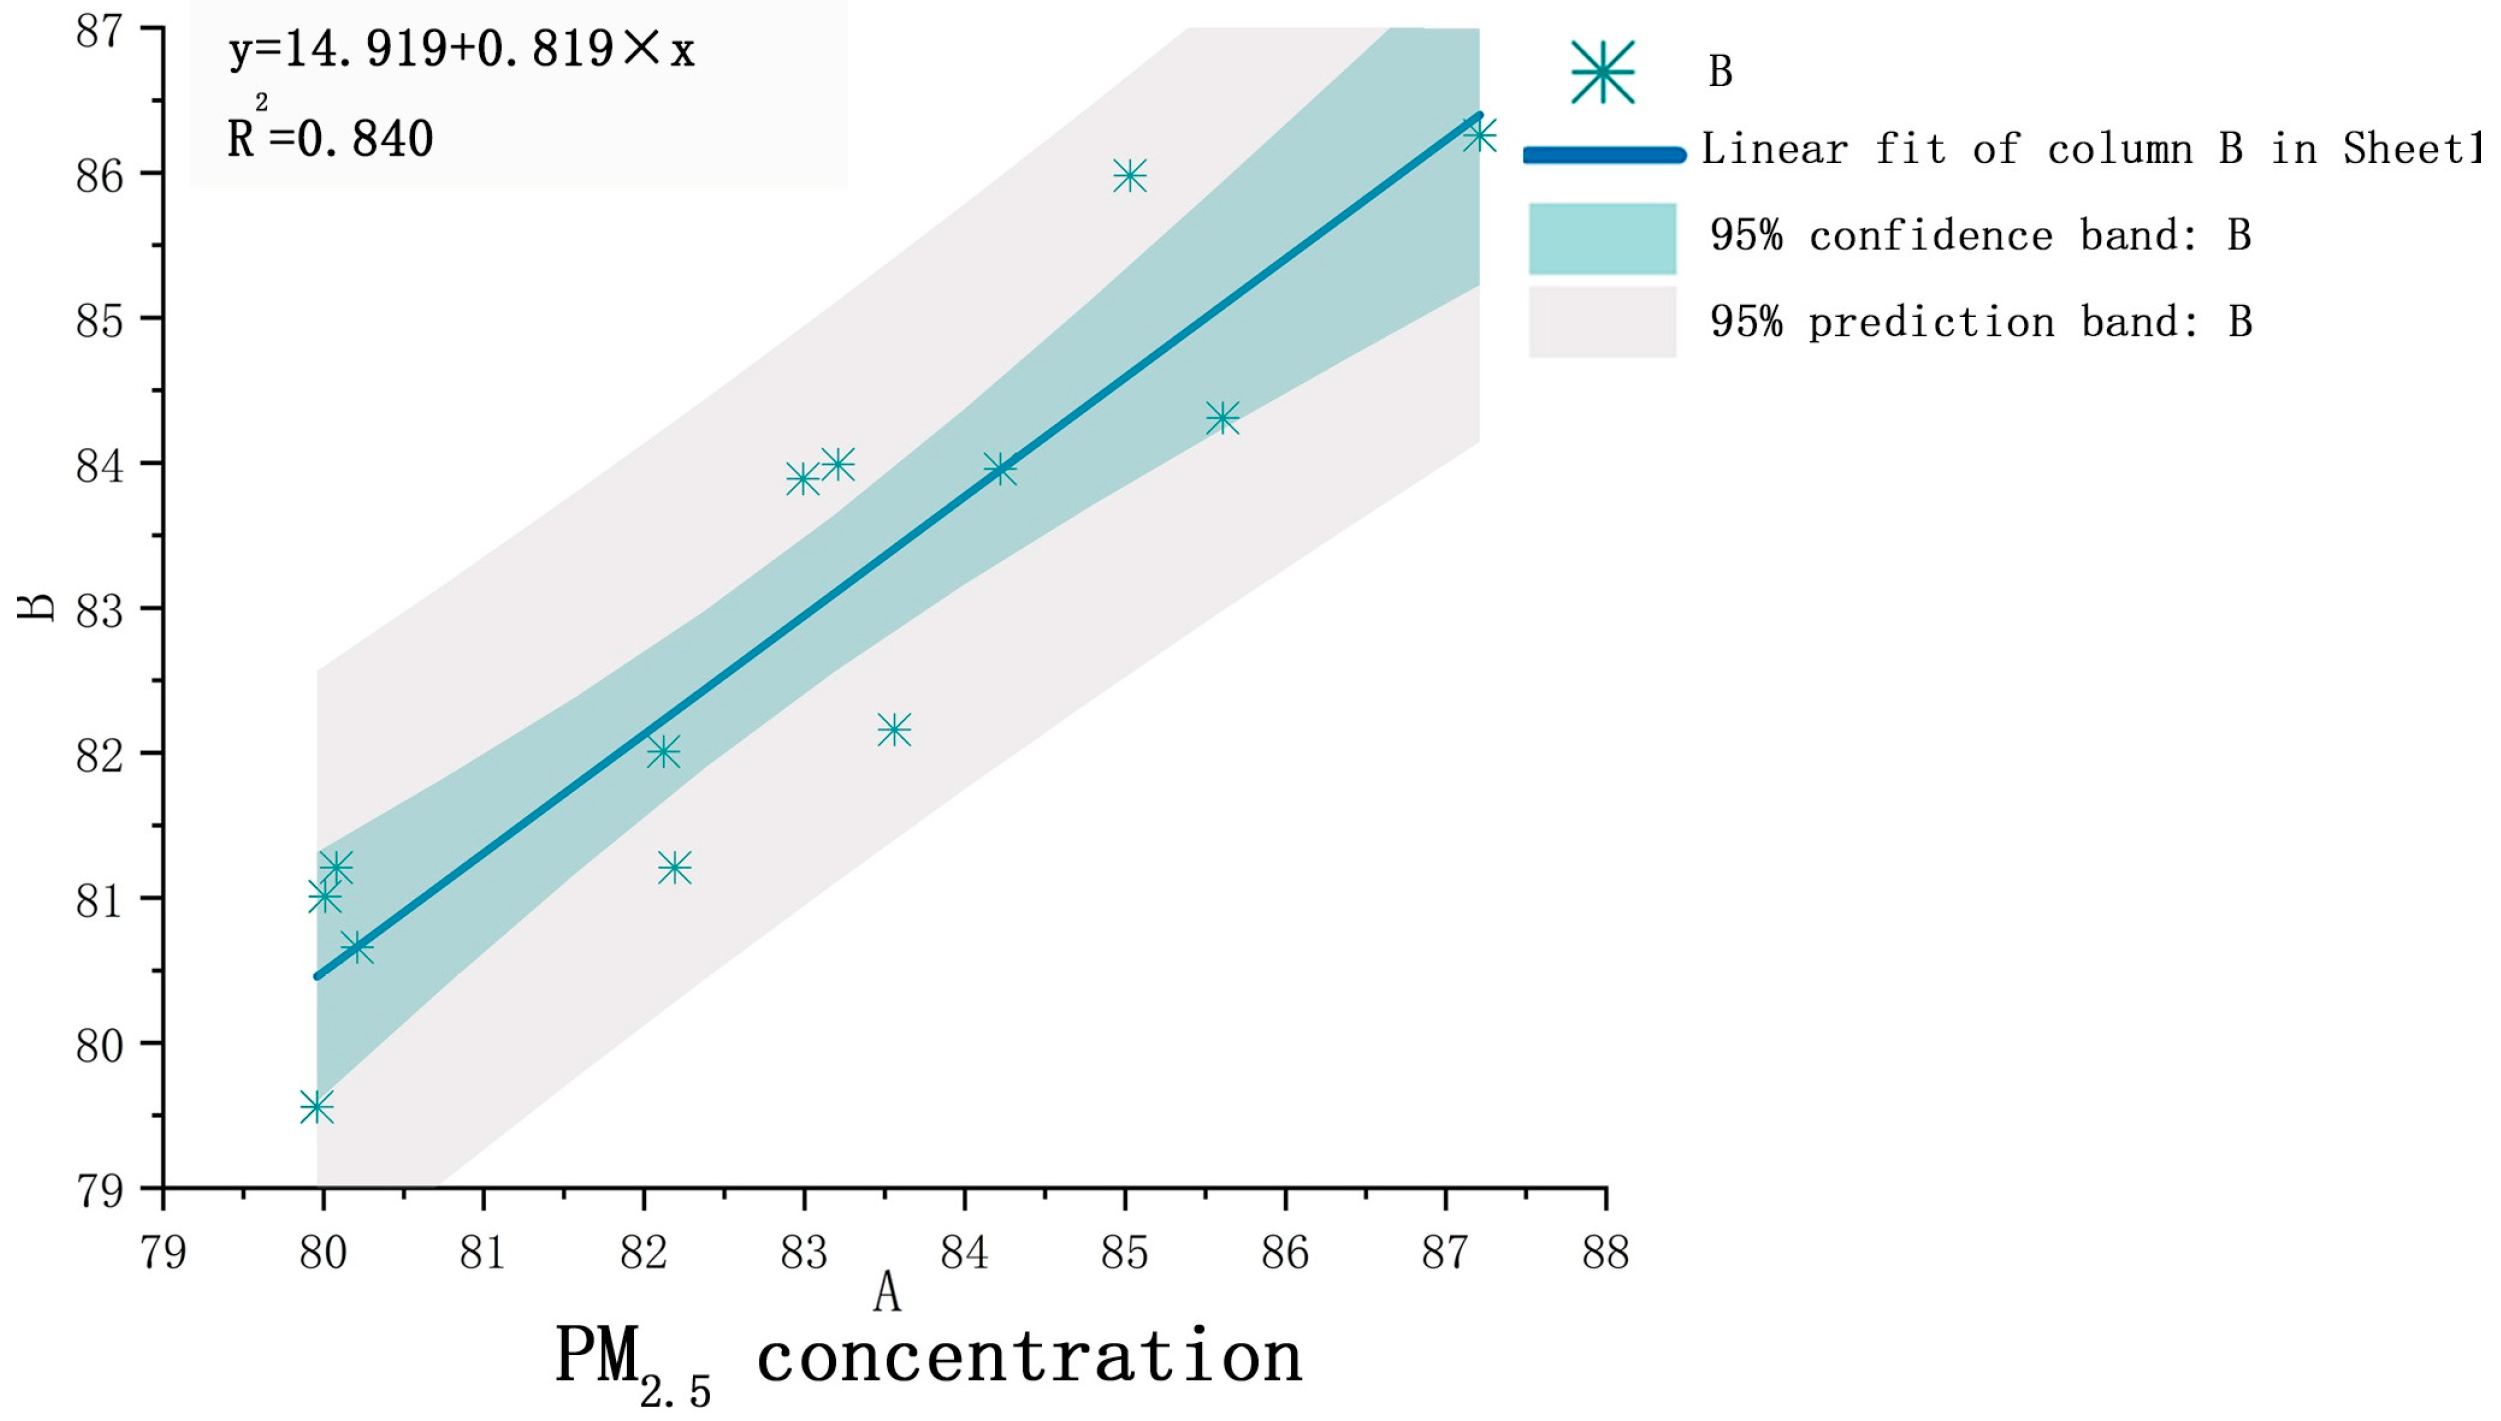
2.1.2. Distribution of PM2.5 Pollution in Xi’an
2.2. Research on the Current Status of Residential Streets in Built-Up Areas
2.2.1. Street Dimensions and Orientation
2.2.2. Building Morphology Along Street Corridors
2.3. Analysis of PM2.5 Exposure in Xi’an’s Built-Up Area
2.3.1. Calculation Methods for PM2.5 Exposure
2.3.2. Data Source
- (1)
- PM2.5 Concentration Data
- (2)
- Inhalation Rate Parameters
- (3)
- Exposure Duration Parameters
2.3.3. Current Spatial Distribution of PM2.5 Exposure in Xi’an’s Built-Up Area
3. Screening Walkability Indicators and Field-Based Validation
3.1. Preliminary Screening of Walkability Indicators
3.2. Field Measurement Protocol Design
- Pavement types: Hardscapes vs. green spaces;
- Plant configurations: Tree, shrub–tree, or tree-shrub-grass assemblages;
- Height-to-width ratios (H/W): >1, ≈1, or <1.
3.3. Identification of Core Pedestrian-Oriented Metrics
4. Computational Simulation and Optimization of Pedestrian-Oriented Metrics in High-PM2.5-Exposure Residential Streets
4.1. Parametric Benchmarking: Standard Model Establishment and Threshold Definition
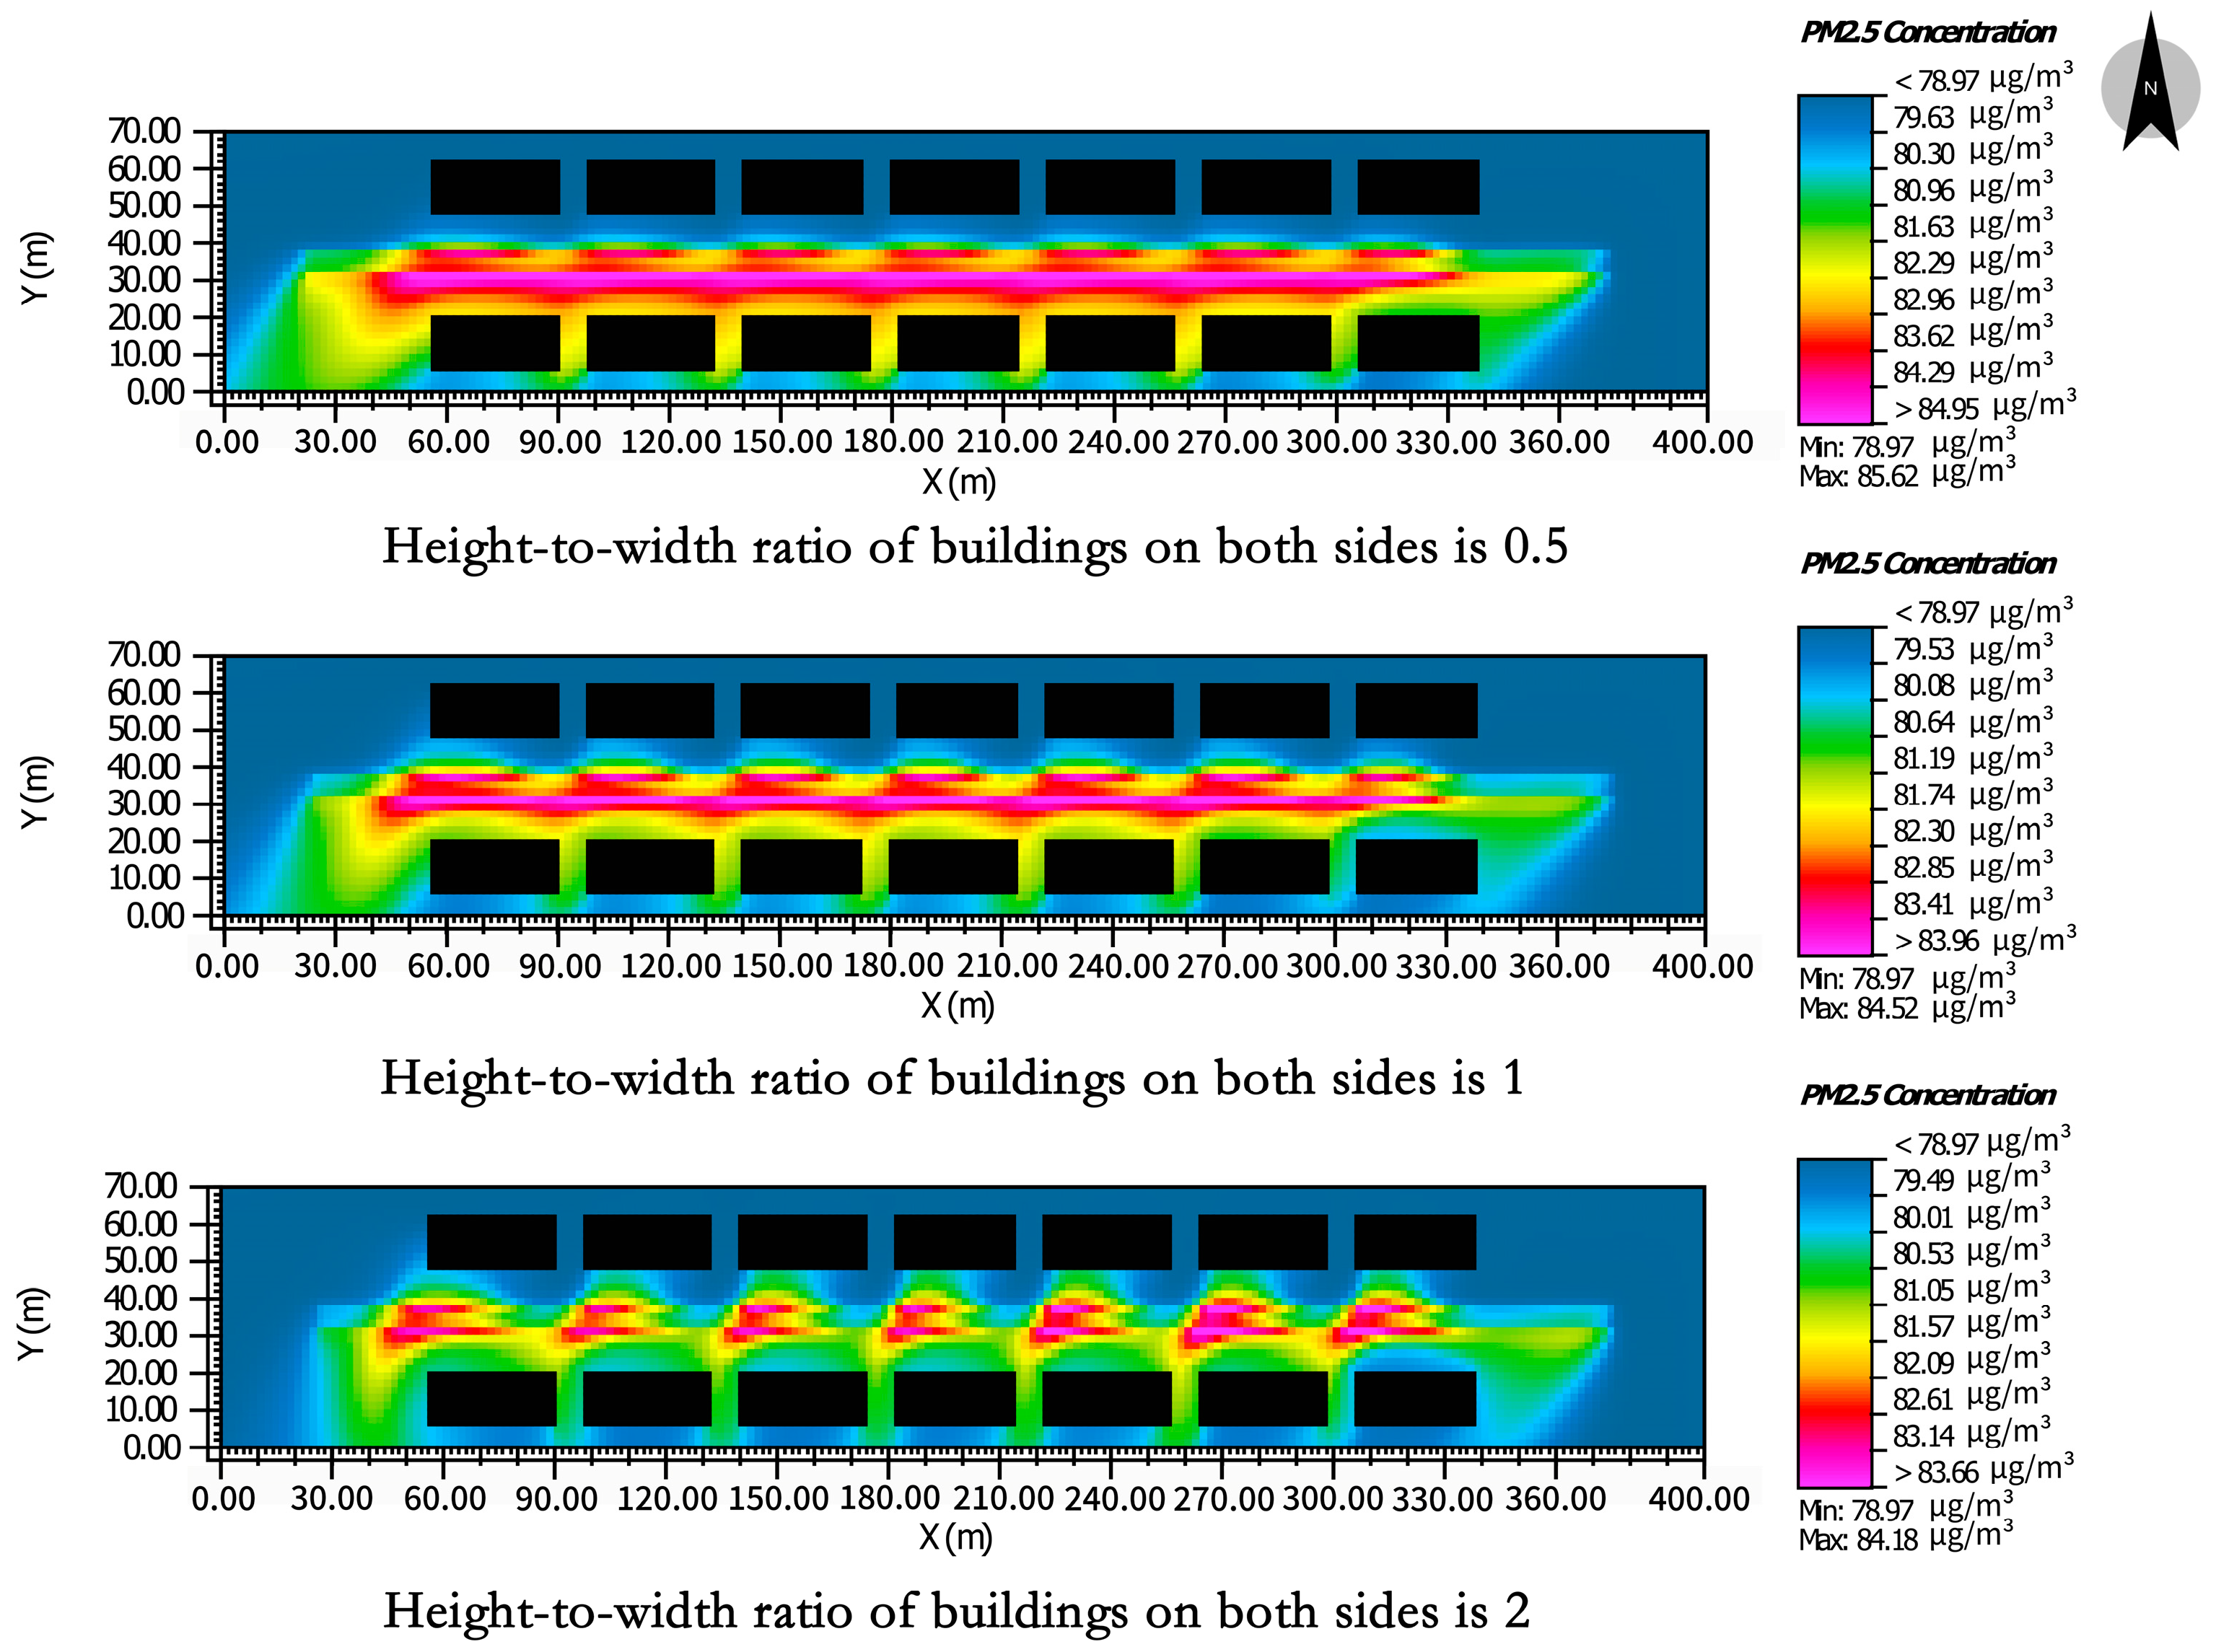
4.2. Spatiotemporal Modeling of Height-to-Width Ratio’s Effects on Pollutant Dispersion
- H/W = 0.5: The peak PM2.5 concentrations occurred within the street canyon, with extensive pollutant dispersion encroaching upon bilateral pedestrian walkways.
- H/W = 1.0: The concentration decreased by 18–22% (vs. that at H/W = 0.5), with the lateral dispersion attenuated; pollutants primarily accumulated in the central roadway.
- H/W = 2.0: The concentration declined by 37–41% (vs. that at H/W = 0.5), exhibiting enhanced dispersion efficiency, contracted pollution cores (>50% reduction), and fragmented PM2.5 distribution patterns along the road axis.
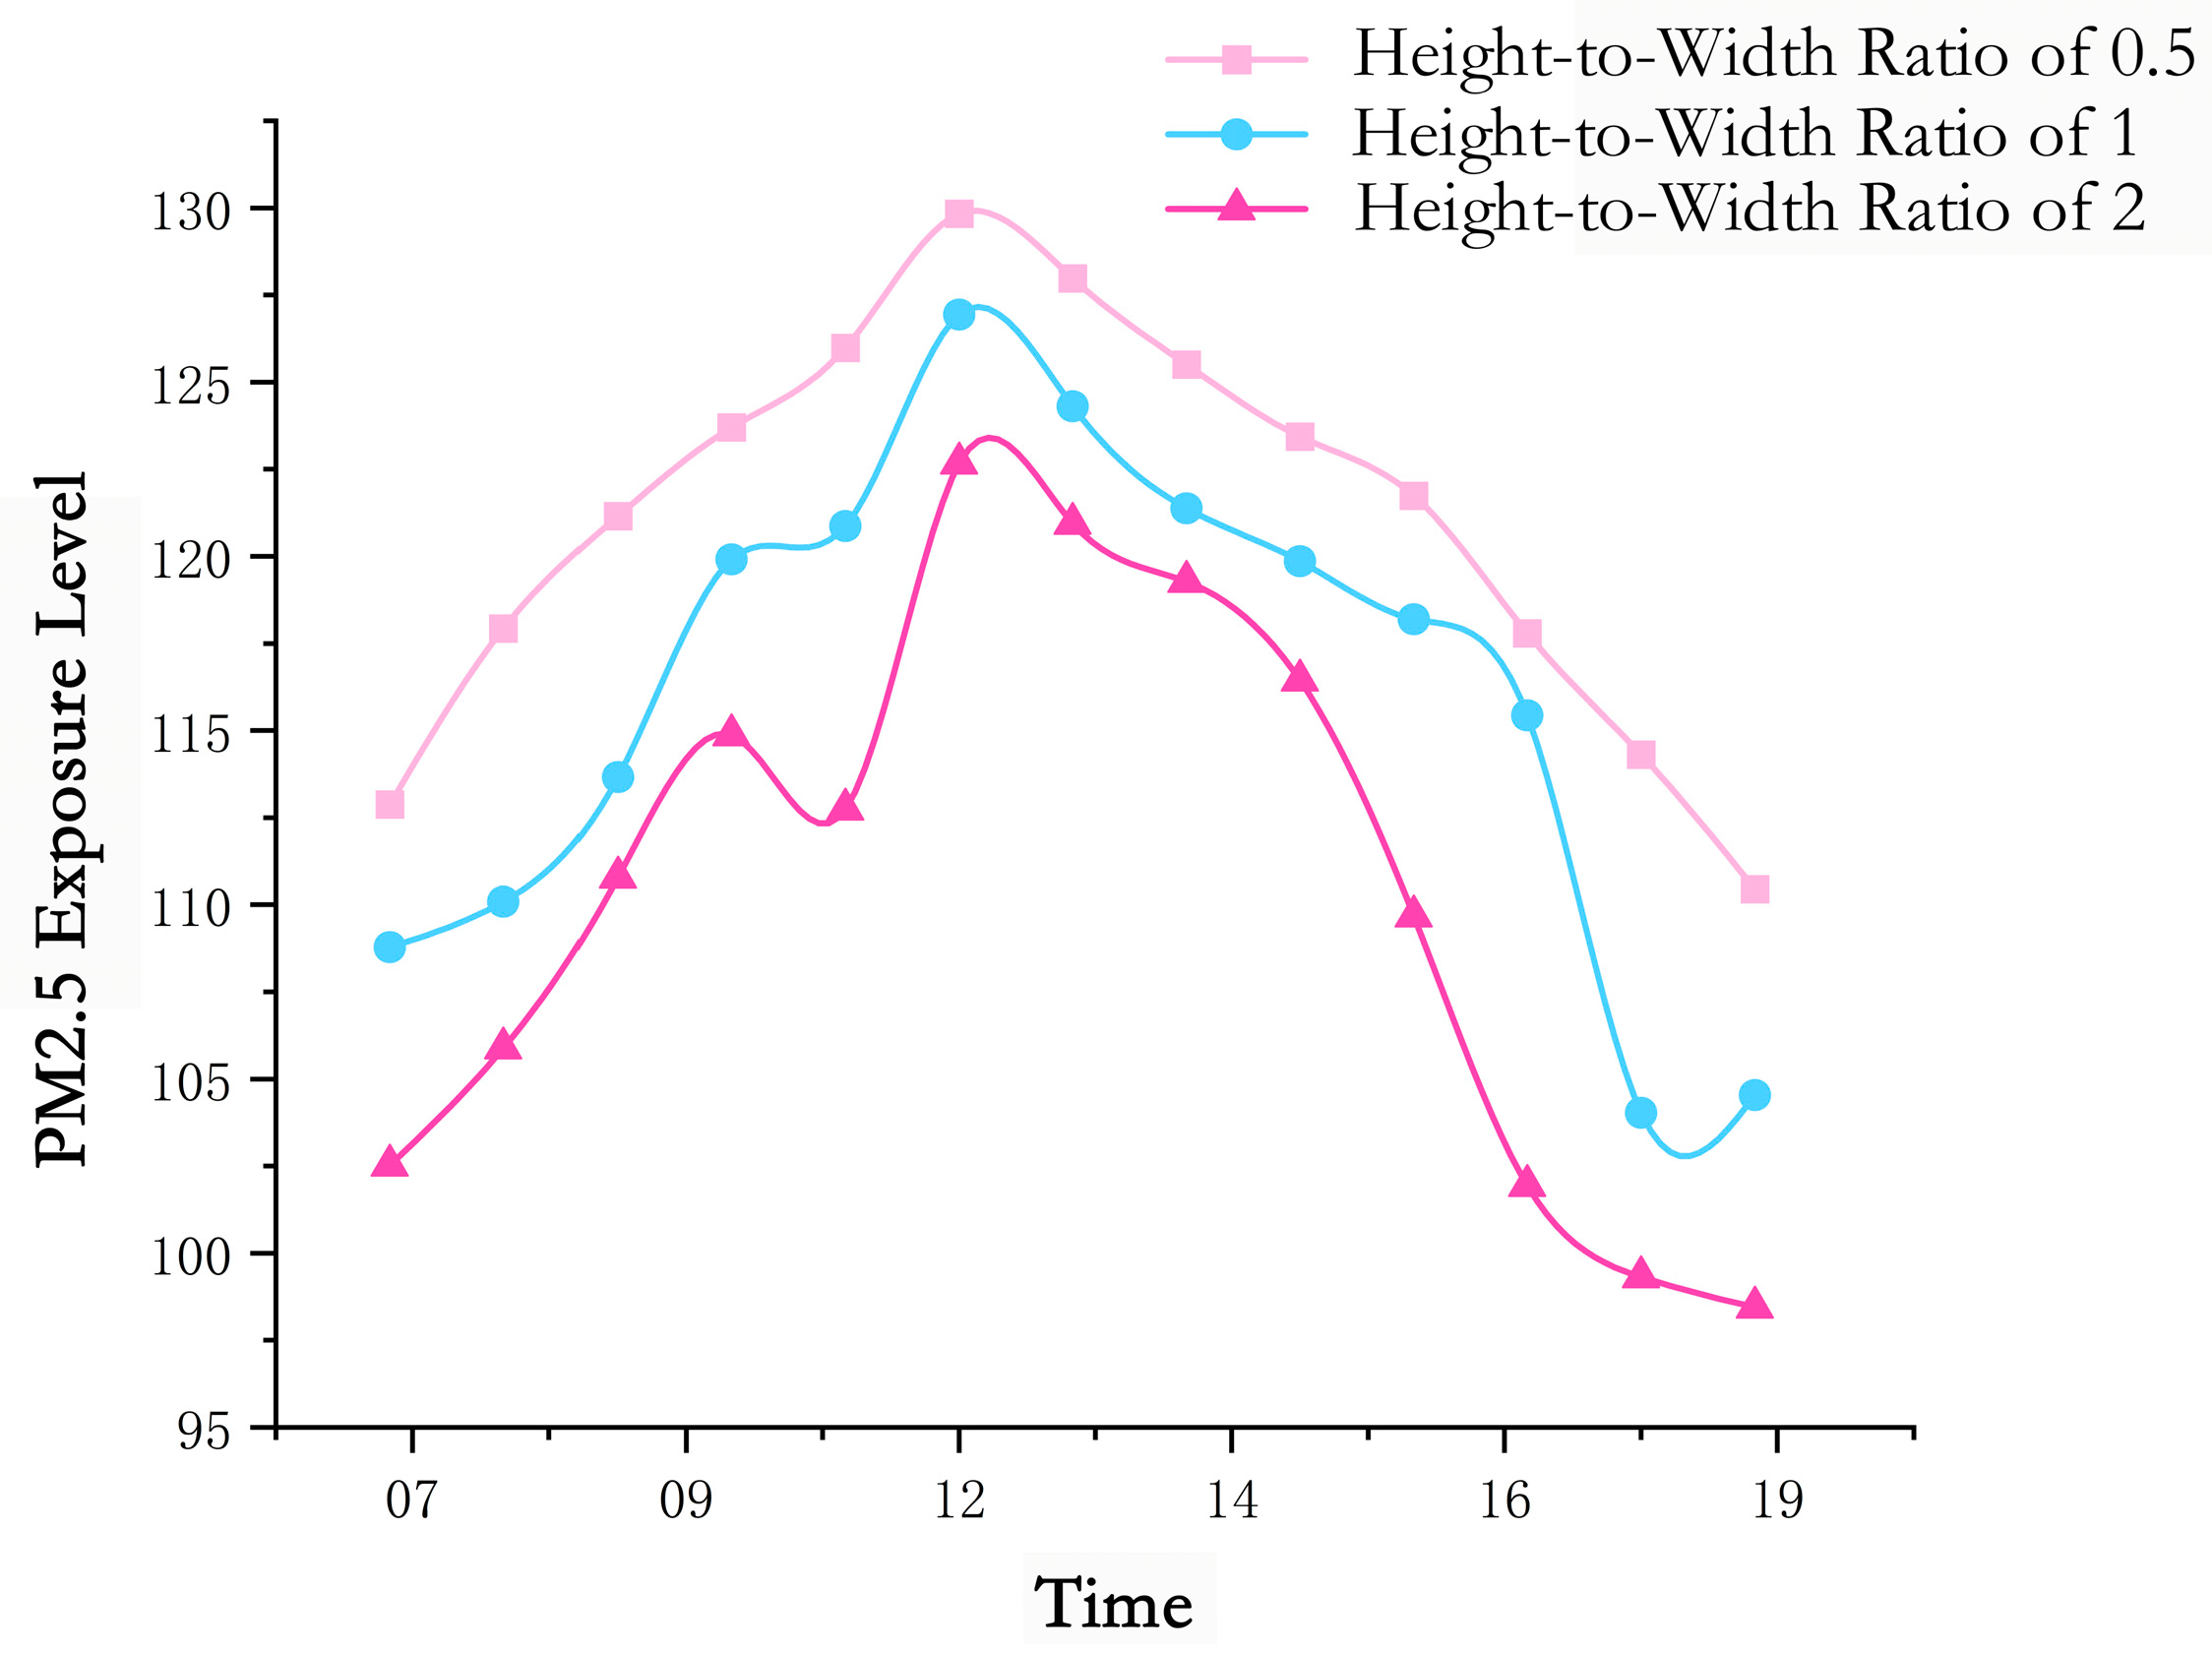
- H/W = 0.5: The peak exposure (≈130 μg/m3·h) occurred at 12:00, representing the maximum accumulation.
- H/W = 1.0: The exposure decreased by 2.3% (peak ≈ 127 μg/m3·h at 12:00) with moderate spatial variability.
- H/W = 2.0: Minimal exposure levels manifested (peak ≈ 123 μg/m3·h at 12:00), demonstrating a 5.4% reduction in exposure compared to that at H/W = 0.5.
4.3. Build-to-Line Ratio Dynamics in Street Canyon Exposure Simulations
- Build-to-Line ratios = 63.2%: PM2.5 exhibited a fragmented distribution concentrated in the central roadway with minimal lateral dispersion to the sidewalks.
- Build-to-Line ratios = 70.0%: The pollutant coherence increased, expanding the contamination zones toward bilateral pedestrian corridors.
- Build-to-Line ratios = 76.8%: Continuous pollution plumes developed, fully encroaching upon the sidewalks due to restricted vertical advection and 31% reduced ventilation efficiency.
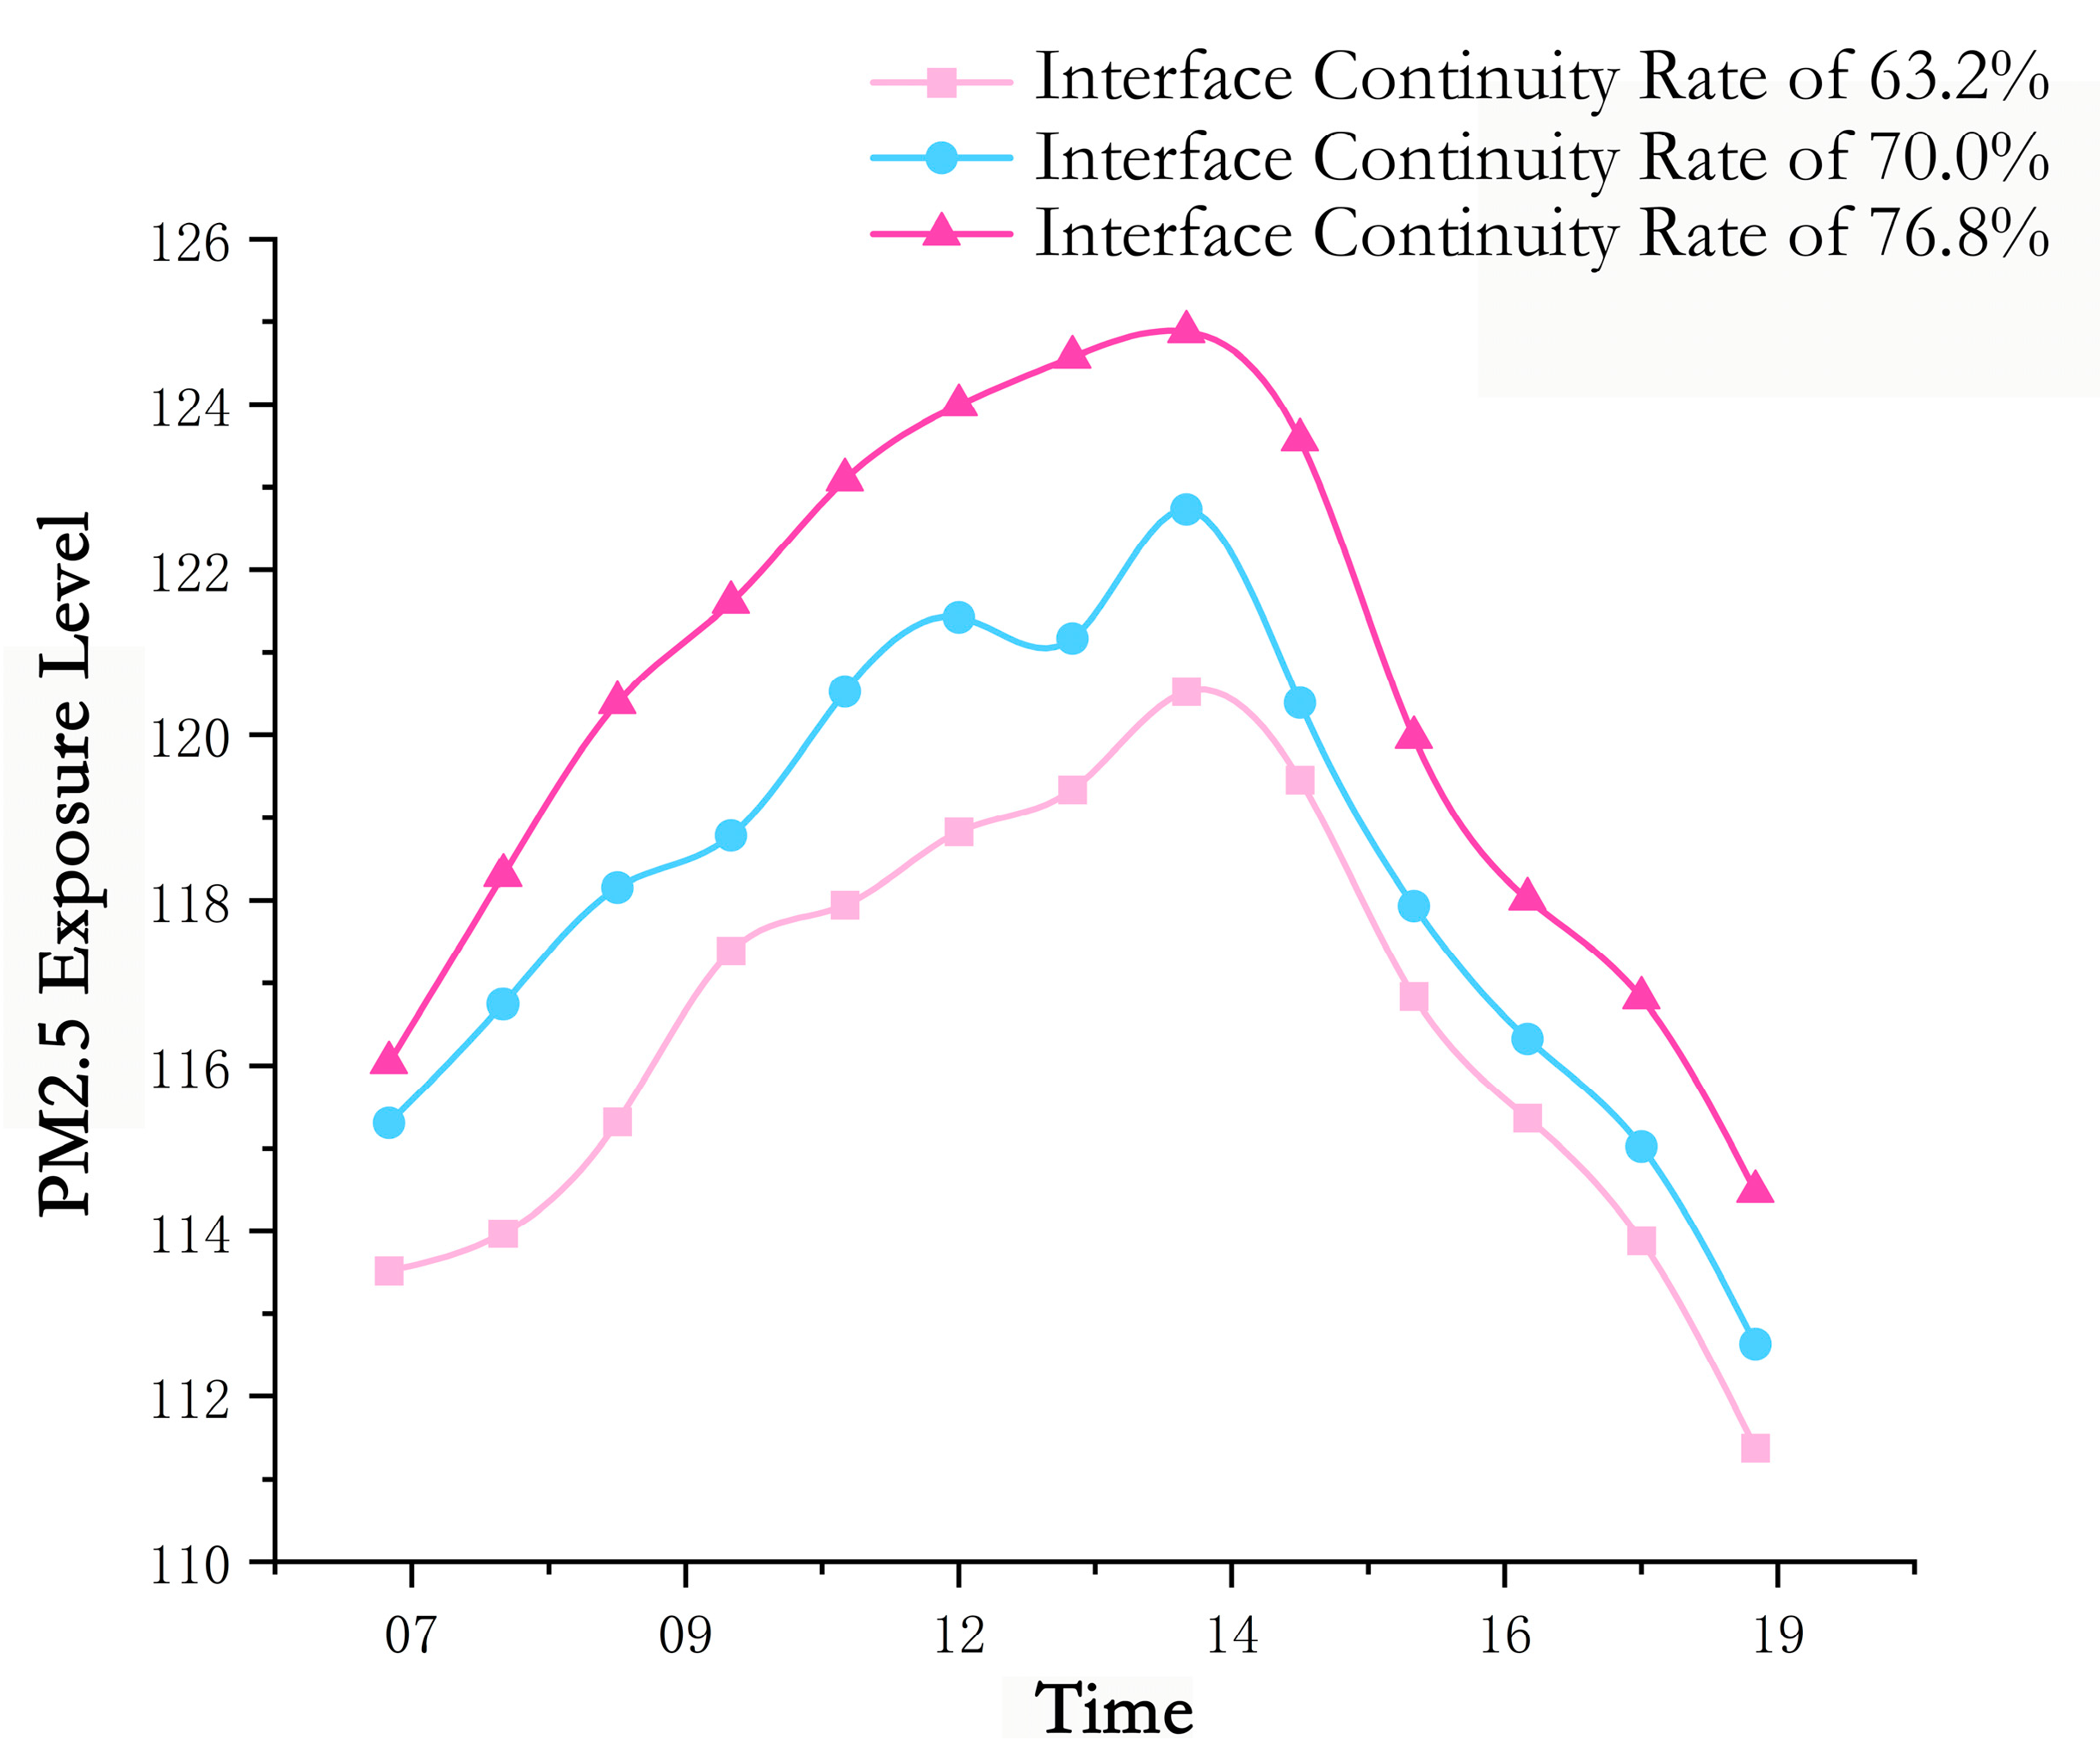
- The maximum exposure occurred at Build-to-Line ratios = 76.8%;
- Intermediate exposure at Build-to-Line ratios = 70%;
- The minimum exposure at Build-to-Line ratios = 63.2%.
4.4. Sensitivity Analysis of PM2.5 Exposure to Interactive Effects of Height-to-Width Ratio and Building-to-Line Ratio
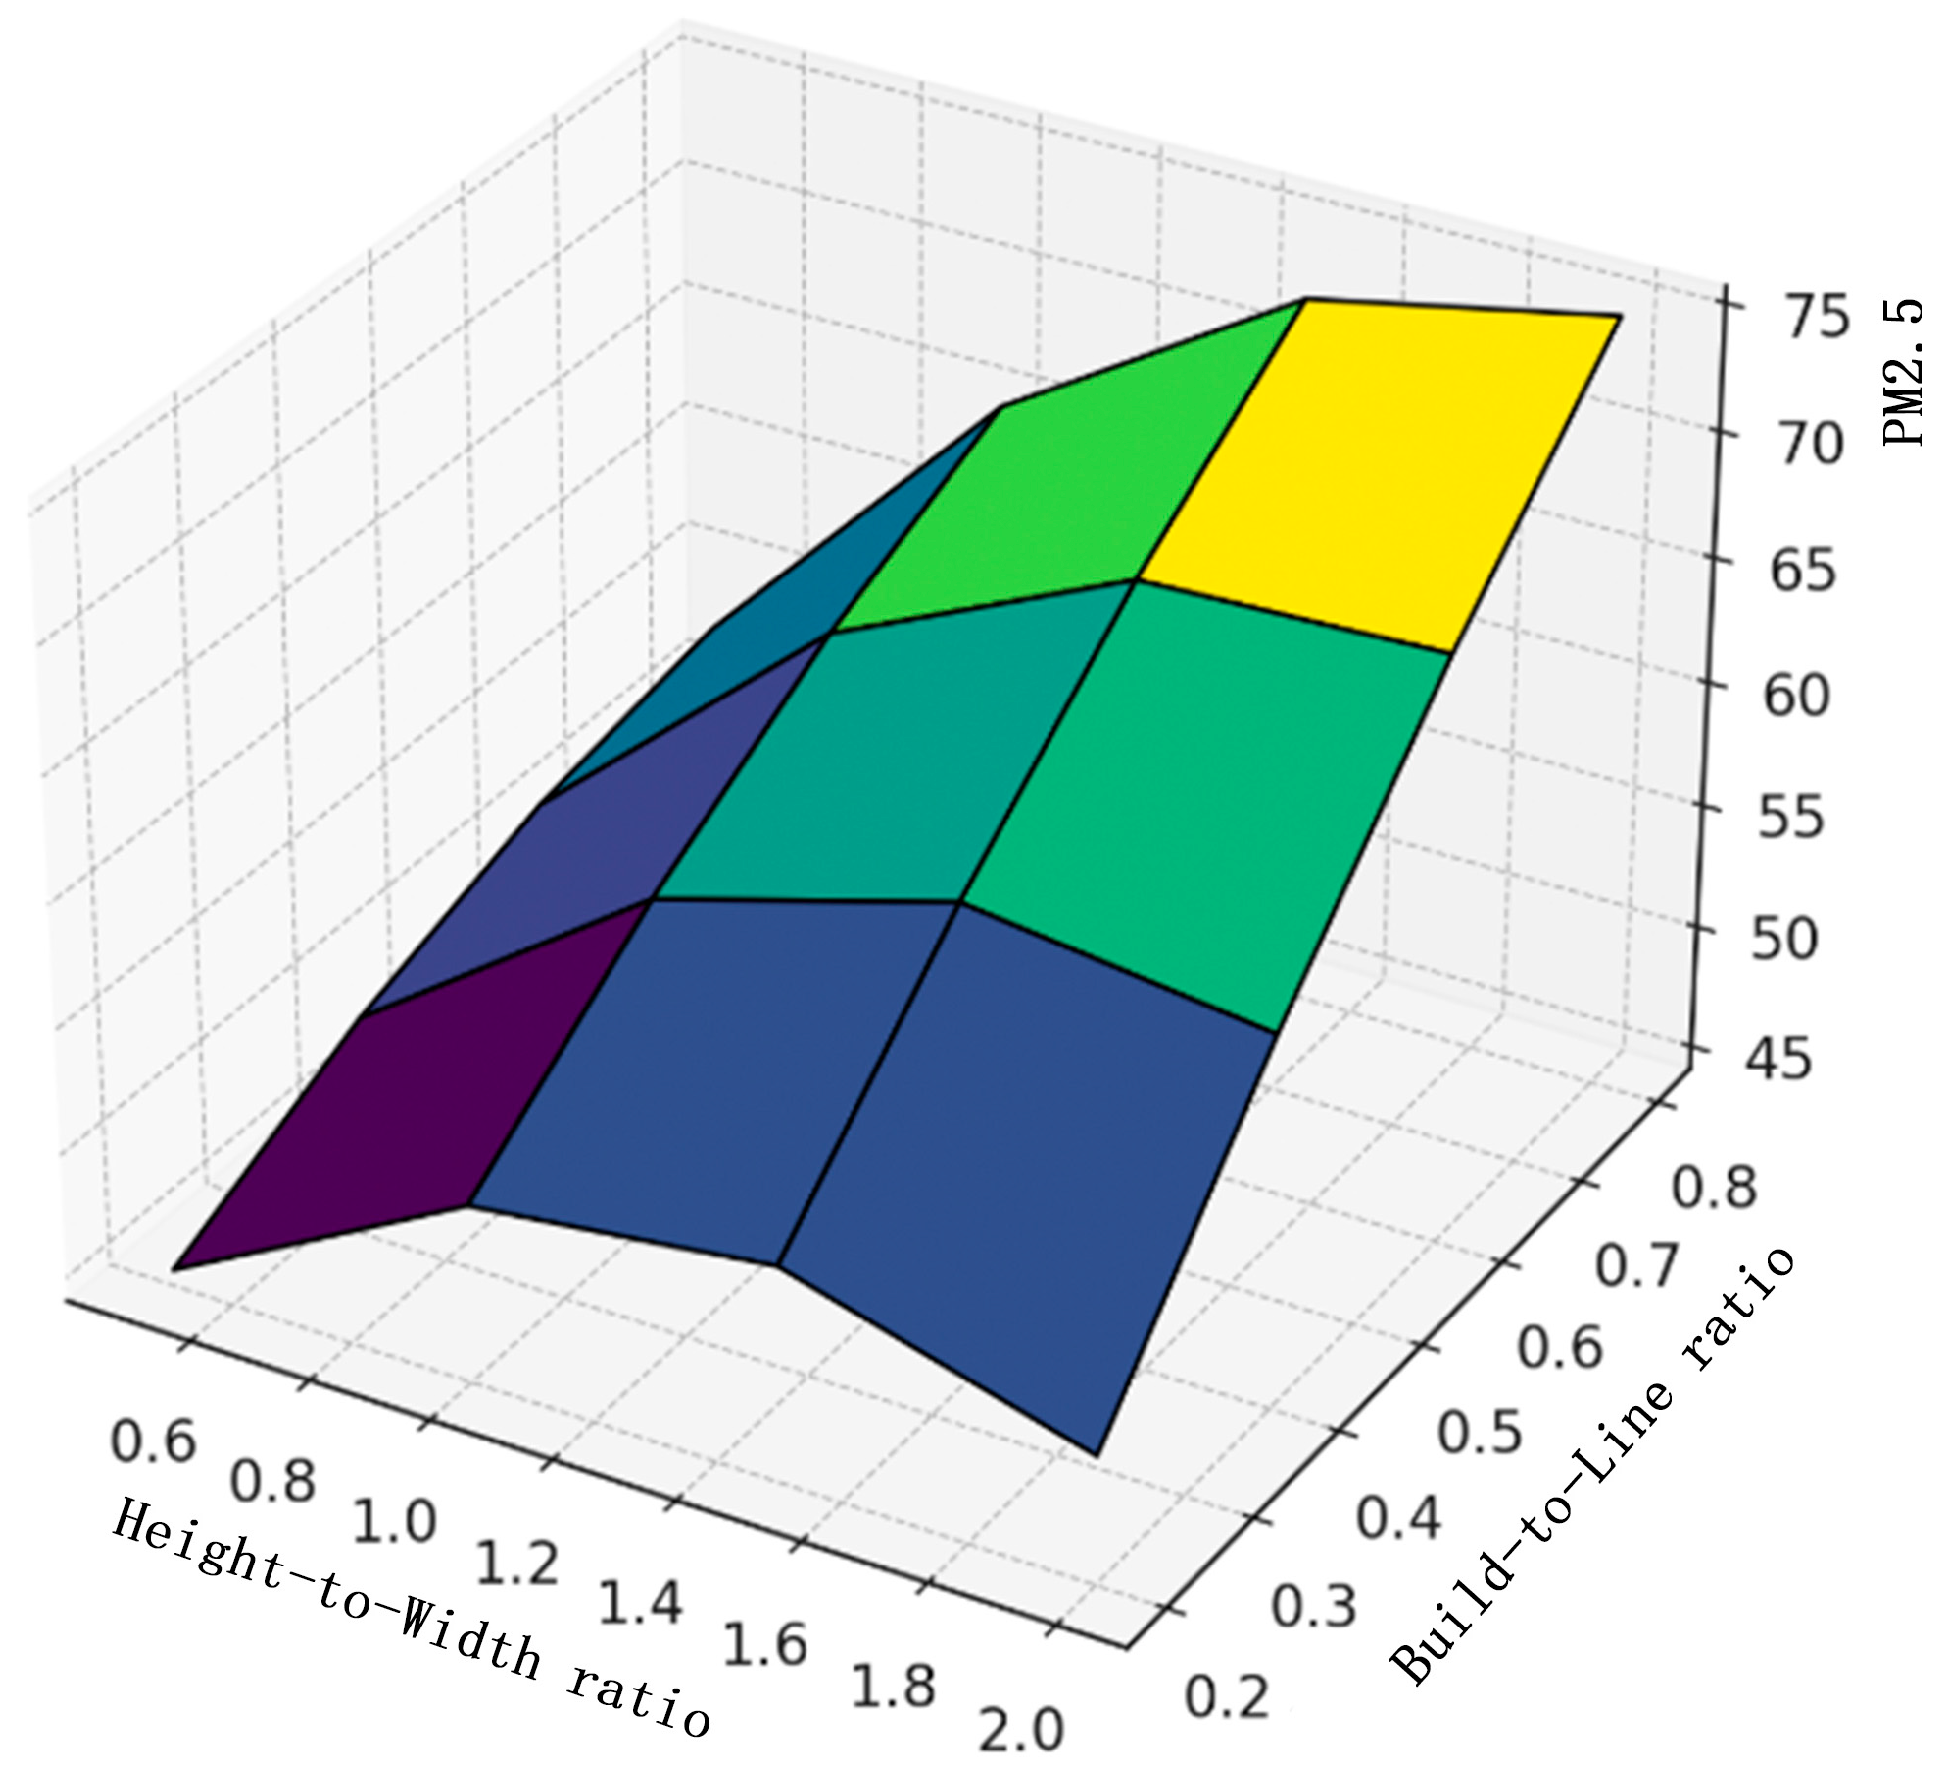
- The minimum exposure occurred at H/W ≈ 1.2 and BTR ≈ 0.6;
- Significantly elevated exposure manifested under high-density enclosures (BTR > 0.8) or low-BTR scenarios (BTR < 0.4) combined with strong architectural confinement, where the pollutant stagnation intensified by 12.7–18.3%.
4.5. Evidence-Based Interventions for Walkability Enhancement in Polluted Residential Corridors
- The height-to-width ratio (H/W) constitutes the primary contributor to ventilation enhancement, achieving the most significant PM2.5 exposure reduction;
- The Build-to-Line ratio secondarily influences the inter-building airflow dynamics, with a lower Build-to-Line ratio attenuating aerodynamic stagnation to reduce the exposure by 12–15%.
5. Discussion
5.1. Implications
5.2. Limitations
6. Conclusions
Author Contributions
Funding
Institutional Review Board Statement
Informed Consent Statement
Data Availability Statement
Conflicts of Interest
References
- Wang, B.; Yuan, Q.; Yang, Q.; Zhu, L.; Li, T.; Zhang, L. Estimate hourly PM2.5 concentrations fromHimawari-8TOA reflectance directly using geo-intelligent long short-term memory network. Environ. Pollut. 2021, 271, 116327. [Google Scholar] [CrossRef]
- Deryugina, T.; Heutel, G.; Miller, N.H.; Molitor, D.; Reif, J. The mortality and medical costs of air pollution: Evidence from changes in wind direction. Am. Econ. Rev. 2019, 109, 4178–4219. [Google Scholar] [CrossRef]
- Li, Y.; Xu, Y.F.; Yuan, M.H.; Su, F.C.; Wang, S.B.; Wang, K.; Zhang, R.Q. High-Resolution Grid-Based Assessment of PM2.5 Exposure Concentrations and Associated Health Risks for Urban Residents in Zhengzhou, China. Environ. Sci. 2023, 44, 1911–1923. [Google Scholar]
- Wen, L.; Kenworthy, J.; Marinova, D. Higher Density Environments and the Critical Role of City Streets as Public Open Spaces. Sustainability 2020, 12, 8896. [Google Scholar] [CrossRef]
- Sharifi, A. Resilient urban forms: A review of literature on streets and street networks. Build. Environ. 2019, 147, 171–187. [Google Scholar] [CrossRef]
- Wen, Y.; Liu, B.B.; Li, Y.L.; Zhao, L. A Review of Research on the Impact of Urban Street Environment on Physical Activity: A Comparison between China and Developed Countries. Buildings 2024, 14, 1779. [Google Scholar] [CrossRef]
- Boeing, G. Spatial Information and the Legibility of Urban Form: Big Data in Urban Morphology. Int. J. Inf. Manag. 2021, 56, 102013. [Google Scholar] [CrossRef]
- Strano, E.; Viana, M.; Da Fontoura Costa, L.; Cardillo, A.; Porta, S.; Latora, V. Urban Street Networks: A Comparative Analysis of Ten European Cities. Environ. Plan. B Plan. Des. 2013, 40, 1071–1086. [Google Scholar] [CrossRef]
- Rui, J.; Othengrafen, F. Examining the Role of Innovative Streets in Enhancing Urban Mobility and Livability for Sustainable Urban Transition: A Review. Sustainability 2023, 15, 5709. [Google Scholar] [CrossRef]
- Fraser, M.P.; Yue, Z.W.; Buzcu, B. Source apportionment of fine particulate matter in Houston, TX, using organic molecular markers. Atmos. Environ. 2003, 37, 2117–2123. [Google Scholar] [CrossRef]
- Wang, B.; Wu, J.; Xu, X.; Li, Y. Hourly population exposure index for PM2.5 in urban street canyons. Urban Clim. 2022, 45, 101242. [Google Scholar] [CrossRef]
- Pant, P.; Harrison, R.M. Estimation of the contribution of road traffic emissions to particulate matter concentrations from field measurements: A review. Atmos. Environ. 2013, 77, 78–97. [Google Scholar] [CrossRef]
- Rakowska, A.; Wong, K.C.; Townsend, T.; Chan, K.L.; Westerdahl, D.; Ng, S.; Močnik, G.; Drinovec, L.; Ning, Z. Impact of traffic volume and composition on the air quality and pedestrian exposure in urban street canyon. Atmos. Environ. 2014, 98, 260–270. [Google Scholar] [CrossRef]
- Li, L.; Zheng, M.Q.; Zhang, J.; Li, C.; Ren, Y.; Jin, X.; Chen, J. Effects of green infrastructure on the dispersion of PM2.5 and human exposure on urban roads. Environ. Res. 2023, 223, 115493. [Google Scholar] [CrossRef]
- Liu, B.; Xu, Y.J.; Wang, G.Y.; Xie, J.M. Research on street environment optimization based on sidewalk PM2.5 exposure analysis. In Proceedings of the Green-Wisdom-Integration-Proceedings of the 2021/2022 China Urban Transportation Planning Annual Conference, Shanghai, China, 17–18 November 2022; Academic Committee of Urban Transportation Planning, China Society of Urban Planning, China Academy of Urban Planning and Design, Institute of Urban Transportation: Beijing, China, 2022; p. 17. [Google Scholar]
- Grzędzicka, E. Is the existing urban greenery enough to cope with current concentrations of PM2.5, PM10 and CO2? Atmos. Pollut. Res. 2019, 10, 219–233. [Google Scholar] [CrossRef]
- He, H.Y.; Zhu, Y.S.; Liu, L.; Liu, J. Effects of roadside trees three-dimensional morphology characteristics on traffic-related PM2.5 distribution in hot-humid urban blocks. Urban Clim. 2023, 49, 101448. [Google Scholar] [CrossRef]
- Karale, Y.; Yuan, M. How May Building Morphology Influence Pedestrians’ Exposure to PM2.5? Appl. Sci. 2024, 14, 5149. [Google Scholar] [CrossRef]
- Liao, N.S.; Van Den Eeden, S.K.; Sidney, S.; Deosaransingh, K.; Schwartz, J.; Uong, S.P.; Alexeeff, S.E. Joint associations between neighborhood walkability, greenness, and particulate air pollution on cardiovascular mortality among adults with a history of stroke or acute myocardial infarction. Environ. Epidemiol. 2022, 6, e200. [Google Scholar] [CrossRef]
- Tong, C.Z.; Shi, Z.C.; Shi, W.Z.; Zhao, P.; Zhang, A. Mapping Microscale PM2.5 Distribution on Walkable Roads in a High-Density City. IEEE J. Sel. Top. Appl. Earth Obs. Remote Sens. 2021, 14, 6855–6870. [Google Scholar] [CrossRef]
- James, P.; Hart, J.E.; Laden, F. Neighborhood walkability and particulate air pollution in a nationwide cohort of women. Environ. Res. 2015, 142, 703–711. [Google Scholar] [CrossRef] [PubMed]
- Li, H.M.; Li, S.M.; Zhang, F.; Shang, Y.; Qiu, Y.; Xun, B.; Wang, J.; Wang, S. Analysis of Three-Dimensional Green Volume and Ecological Benefits of Different Green Space Types in Xi’an City. Res. Environ. Sci. 2025, 38, 59–67. [Google Scholar]
- Ma, Y.X.; Cong, H.; Zhou, W.B.; Zhang, H. Landscape Pattern of Land Use Dynamic Development and Driving Force in Xi’an. J. Northwest For. Univ. 2017, 32, 186–192. [Google Scholar]
- Zhao, X.Z.; Li, M.X.; Feng, H.Z.; Li, T.; Rui, Y. The Population distribution and spatial structurin Xi’an City between 2000 and 2010. J. Northwest Univ. (Nat. Sci. Ed.) 2017, 47, 127–131. [Google Scholar]
- Lin, Y.C.; Sun, S.W.; Pan, Y.; Liu, C.Q.; Zhou, P. Spatio-temporal evolution, spatio-temporal clustering and risk prevention and control of PM2.5 exposure risk in China from 2001 to 2016. Hubei Agric. Sci. 2024, 63, 247–253, 260. [Google Scholar]
- Du, X.; Fu, L.X.; Zhu, H.C.; Cong, Q.; Hu, S.X.; Wu, J.; Xu, X.S. Exposure Assessment of Vehicle Exhaust Pollution in Wuhan, Hubei. J. Environ. Health 2010, 27, 241–243. [Google Scholar]
- Ministry of Ecology and Environment of the People’s Republic of China. China Population Exposure Parameters Handbook (Adults); China Environmental Science Press: Beijing, China, 2016.
- Denuit, M.; Trufin, J. Model selection with Pearson’s correlation, concentration and Lorenz curves under autocalibration. Eur. Actuar. J. 2023, 13, 871–878. [Google Scholar] [CrossRef]
- Qian, D.X.; Hu, Y.; Xiao, X.D.; Wang, L.F. Cutting-edge research on numerical simulation of urban microclimate—Taking ENVI-met as an example. Anhui Archit. 2023, 30, 12–14. [Google Scholar] [CrossRef]
- Yang, S.M.; Yi, H.L.; Wu, Y.L.; Luo, J.C.; Dai, S.P.; Tan, G.W. Simulation Research on Spatial Microclimate of thePlant Community inErsha Island Park Based on ENVI-met. Chin. J. Trop. Agric. 2023, 43, 68–76. [Google Scholar]
- GB 50352-2005; Unified Standard for Design of Civil Buildings. Ministry of Housing and Urban-Rural Development of the People’s Republic of China: Beijing, China, 2005.
- GB 50016-2014; Code for Fire Protection Design of Buildings. Ministry of Housing and Urban-Rural Development of the People’s Republic of China: Beijing, China, 2014.
- Jon, K.S.; Jong, S.I.; Ri, S.H.; Ko, J.Y.; Ko, S.G.; Kim, H.; Ryang, T.S.; Sin, C.H. Effects of increasing the degree of building height asymmetry on ventilation and pollutant dispersion within street canyons. Energy Built Environ. 2024, 5, 727–740. [Google Scholar] [CrossRef]
- Hao, W.N.; Guo, X.Y.; Li, J.W.; Dong, H.Z.; Chen, N. Research on vehicle exhaust dispersion modeling at urban signal intersection. J. Zhejiang Univ. Technol. 2017, 45, 94–98. [Google Scholar]





| Shaanxi Province | Short-Term Respiratory Rate of the Population (L/min) | Time Spent on Outdoor Activities Not Related to Transportation (min/d) | Recommended Duration of Outdoor Activities (min/d) | ||
|---|---|---|---|---|---|
| Resting | Sitting | Light Activity | |||
| Male | 6.3 | 7.5 | 9.4 | 213 | 185 |
| Female | 5.1 | 6.1 | 7.6 | 191 | 172 |
| 18–44 years old | 5.8 | 6.9 | 8.7 | 188 | 173 |
| 45–59 years old | 5.8 | 7.0 | 8.7 | 191 | 188 |
| 60–79 years old | 4.7 | 5.6 | 7.0 | 168 | 180 |
| 80 years old and above | 4.2 | 5.1 | 6.4 | 129 | 140 |
| Average | 5.4 | 6.5 | 8.1 | 184 | 180 |
| Component 1 | Component 2 | Component 3 | Component 4 | |
|---|---|---|---|---|
| Shaded Street Coverage | 0.899 | |||
| Canopy Coverage Ratio | 0.928 | |||
| Walking Accessibility | 0.823 | |||
| Walking Score | 0.739 | |||
| Sidewalk Area Ratio | 0.867 | |||
| Air Quality Index (AQI) | 0.768 | 0.752 | ||
| Urban Road Scale/Hierarchy | 0.876 | 0.689 | ||
| Height-to-Width Ratio | 0.968 | |||
| Building-to-Line Ratio (BTR) | 0.866 | |||
| Building Height Variation | 0.803 | |||
| Building Setback Variation | 0.767 | |||
| Street Connectivity | 0.823 | 0.677 | ||
| Walking Score | 0.652 | 0.762 | ||
| Road Network Density | 0.798 |
| Street Name | Road Network Density | Walkability Index | Street Intersection Density | Street Width | Street Length |
|---|---|---|---|---|---|
| East Section of Renyi Road (Beilin District) | 3.95–7.05 | 90 | 359.97–473.11 | 18 m | 320 m |
| Yandian Street (Lianhu District) | 3.95–7.05 | 95 | 359.97–473.11 | 18 m | 280 m |
| Tangfang Street (Lianhu District) | 3.95–7.05 | 95 | 359.97–473.11 | 18 m | 360 m |
| Liangjia Paifang Street (Lianhu District) | 3.95–7.05 | 95 | 359.97–473.11 | 18 m | 300 m |
| Middle Section of West First Road (Xincheng District) | 3.95–7.05 | 95 | 359.97–473.11 | 18 m | 330 m |
| West Section of East Seventh Road (Xincheng District) | 3.95–7.05 | 93 | 359.97–473.11 | 18 m | 360 m |
| Predictor Variable | Non-Standardized Coefficient | Standardized Coefficient | t | Significance | R2 | Adjusted R2 | |
|---|---|---|---|---|---|---|---|
| B | Standard Error | Beta | |||||
| Pedestrian walkway area ratio | −0.038 | 0.001 | −0.123 | −0.290 | 0.707 | 0.899 | 0.896 |
| Tree-lined road coverage ratio | −0.042 | 0.001 | −0.289 | −5.772 | a-0.05 | ||
| Height-to-width ratio | −0.821 | 0.042 | −0.689 | 19.312 | <0.001 | ||
| Build-to-line ratio | 2.312 | 0.082 | 0.701 | 24.371 | <0.001 | ||
| Tree canopy coverage ratio | 0.085 | 0.001 | 0.231 | 7.191 | 0.051 | ||
| Building height stagger ratio | −0.063 | 0.001 | −0.295 | −7.521 | a-0.05 | ||
| Parameter | Value/Specification |
|---|---|
| Street name | Renyi Road (eastern segment) |
| Coordinates | 34.26° N, 108.95° E |
| Start of simulation | 20 January 2024, 00:00 (UTC + 8) |
| Duration | 12 h |
| Grid resolution | 1 × 1 × 1 m |
| Grid dimensions | 400 (x) × 70 (y) × 30 (z) |
| Vegetation | Turfgrass (0.15 m); shrubs (1.0 m); arbor (10.0 m) |
| Pavement materials | Lightweight concrete; vegetated soil |
| Wind speed | 2.4 m·s−1 |
| Wind direction | 45° (NE) |
| Air temperature | Max: 4.3 °C; min: 0.6 °C |
| Relative humidity | Max: 75%; min: 43.2% |
| Background PM2.5 | 79.5 µg·m−3 |
| Street Orientation | Aspect Ratio | Building Height | Elevation Diagram |
|---|---|---|---|
| 0.5 | 9 m |  | |
| East–west orientation | 1 | 18 m |  |
| 2 | 36 m |  |
| Street Orientation | Build-to-Line Ratios | Building Length and Spacing | Plan View |
|---|---|---|---|
| 63.2% | Building of length 28 m, spacing of 15 m |  | |
| East–west orientation | 70% | Building length of 31 m, spacing of 12 m |  |
| 76.8% | Building length of 34 m, spacing of 9 m |  |
| Street Characteristics | Optimization Strategy |
|---|---|
| Poor ventilation | Increase the height-to-width ratios of streets and reduce the Build-to-Line ratios |
| Walkability design indicators that need to be regulated | |
| Height-to-width ratios | Build-to-Line ratios |
| Increase height-to-width ratios | Reduce Build-to-Line ratios |
Disclaimer/Publisher’s Note: The statements, opinions and data contained in all publications are solely those of the individual author(s) and contributor(s) and not of MDPI and/or the editor(s). MDPI and/or the editor(s) disclaim responsibility for any injury to people or property resulting from any ideas, methods, instructions or products referred to in the content. |
© 2025 by the authors. Licensee MDPI, Basel, Switzerland. This article is an open access article distributed under the terms and conditions of the Creative Commons Attribution (CC BY) license (https://creativecommons.org/licenses/by/4.0/).
Share and Cite
Ma, X.; Xie, H.; Wang, J. Optimizing Pedestrian-Friendly Spaces in Xi’an’s Residential Streets: Accounting for PM2.5 Exposure. Atmosphere 2025, 16, 947. https://doi.org/10.3390/atmos16080947
Ma X, Xie H, Wang J. Optimizing Pedestrian-Friendly Spaces in Xi’an’s Residential Streets: Accounting for PM2.5 Exposure. Atmosphere. 2025; 16(8):947. https://doi.org/10.3390/atmos16080947
Chicago/Turabian StyleMa, Xina, Handi Xie, and Jingwen Wang. 2025. "Optimizing Pedestrian-Friendly Spaces in Xi’an’s Residential Streets: Accounting for PM2.5 Exposure" Atmosphere 16, no. 8: 947. https://doi.org/10.3390/atmos16080947
APA StyleMa, X., Xie, H., & Wang, J. (2025). Optimizing Pedestrian-Friendly Spaces in Xi’an’s Residential Streets: Accounting for PM2.5 Exposure. Atmosphere, 16(8), 947. https://doi.org/10.3390/atmos16080947


