Article

Cloud-Based Assessment of Flash Flood Susceptibility, Peak Runoff, and Peak Discharge on a National Scale with Google Earth Engine (GEE)

1
Institute of Geography, Faculty of Natural Sciences and Mathematics, Ss. Cyril and Methodius University, Gazi Baba, Arhimedova, 1000 Skopje, North Macedonia
2
Department of Geography, Tourism and Hotel Management, Faculty of Sciences, University of Novi Sad, Trg Dositeja Obradovića 3, 21000 Novi Sad, Serbia
3
Faculty of Geography, University of Belgrade, Studentski Trg 3/3, 11000 Belgrade, Serbia
4
School of Earth, Environment and Society, 190 Overman Hall, Bowling Green State University, Bowling Green, OH 43403, USA
*
Author to whom correspondence should be addressed.
Atmosphere 2025, 16(8), 945; https://doi.org/10.3390/atmos16080945
Submission received: 17 June 2025 / Revised: 23 July 2025 / Accepted: 5 August 2025 / Published: 7 August 2025
(This article belongs to the Section Biosphere/Hydrosphere/Land–Atmosphere Interactions)

Abstract

Flash floods, exacerbated by climate change and land use alterations, are among the most destructive natural hazards globally, leading to significant damage and loss of life. In this context, the Flash Flood Potential Index (FFPI), which is a terrain and land surface-based model, and Google Earth Engine (GEE) were used to assess flood-prone zones across North Macedonia’s watersheds. The presented GEE-based assessment was accomplished by a custom script that automates the FFPI calculation process by integrating key factors derived from publicly available sources. These factors, which define susceptibility to torrential floods, include slope (Copernicus GLO-30 DEM), land cover (Copernicus GLO-30 DEM), soil type (SoilGrids), vegetation (ESA World Cover), and erodibility (CHIRPS). The spatial distribution of average FFPI values across 1396 small catchments (10–100 km2) revealed that a total of 45.4% of the area exhibited high to very high susceptibility, with notable spatial variability. The CHIRPS rainfall data (2000–2024) that combines satellite imagery and in situ measurements was used to estimate peak 24 h runoff and discharge. To improve the accuracy of CHIRPS, the data were adjusted by 30–50% to align with meteorological station records, along with normalized FFPI values as runoff coefficients. Validation against 328 historical river flood and flash flood records confirmed that 73.2% of events aligned with moderate to very high flash flood susceptibility catchments, underscoring the model’s reliability. Thus, the presented cloud-based scenario highlights the potential of the GEE’s efficacy in scalability and robustness for flash flood modeling and regional risk management at national scale.

1. Introduction

Flash floods are sudden and rapid inundation events with varying intensity that can cause substantial economic and human losses. Such events are triggered by heavy rainfall, but the speed and severity vary across localized regional geography that is characterized by unique patterns and interactions between the atmosphere, land surface, and hydrology. Moreover, the rising frequency and intensity of flood events in recent years are attributed to global climate change, exacerbated by increasing human activities [1]. For instance, higher temperatures due to climate change increase the evapotranspiration rates, leading to higher atmospheric moisture and intense storms with heavier downpours and subsequent risk of flash floods. Such climate change effects are further amplified by human activities, mainly by burning fossil fuels, which release carbon dioxide (CO2) and trap heat in the atmosphere. As a result, the frequency and severity of flash floods are likely to increase, especially in regions where storm systems and river discharge patterns are affected by global climate shifts [1,2,3,4,5].
The high-intensity, short-duration flash floods rank among the most devastating natural disasters due to their transient and complex nature [6,7]. Between 1996 and 2015, flash floods claimed approximately 150,061 lives worldwide [8]. For example, the recent devastating floods in the Texas Hill Country, U.S., which occurred over the July 4th weekend 2025, have highlighted the vulnerabilities even developed nations face when confronted with extreme weather events. Such an event was propelled by a mesoscale convective vortex, causing the water levels along the Guadalupe River to rise rapidly, leading to at least 134 fatalities, including 37 children [9]. The devastating floods that occurred in several European countries in the early fall of 2024 caused widespread destruction, which resulted in at least 26 deaths [10]. In Europe, flash floods have accounted for 40% of flood-related casualties between 1950 and 2005 [11]. However, flash flood regimes exhibit significant spatial and temporal variability across different regions. For instance, Mediterranean semi-arid basins are characterized by intense flooding with shorter periods and seasonal shifts between summer and autumn [12]. In Europe, multiple mountainous regions (i.e., Alps, Pyrenees, Balkans) are also highly vulnerable to flash floods due to steep slopes, narrow valleys, rocky terrain, and unique orographic settings.
Furthermore, flash floods are the leading cause of weather-related fatalities and have severe economic, social, and environmental impacts worldwide. Thus, understanding the potential impacts is crucial for developing effective mitigation strategies and minimizing consequences from those natural events. However, predicting flash floods is inherently difficult due to the complex interplay of atmospheric conditions, terrain, and other human factors [13,14,15]. Despite their unpredictable nature, a combination of mitigation and preparedness strategies can significantly reduce their impact. A common approach for mitigation that reduces the likelihood and severity of flash floods involves the implementation of flash flood susceptibility mapping [14,15].
Many methods and techniques have been proposed to evaluate flood-prone areas, some using geographic information systems (GISs) and remote sensing (RS). Such approaches incorporate past flood data, morphometric factors, lithology, land use, and other variables into predictive frameworks for large-area assessments [16]. Moreover, recent research (e.g., [17,18,19,20,21]) has dramatically improved the spatial representation of flash floods by employing advanced methodologies for flood hazard mapping, as demonstrated by the application of the Flash Flood Potential Index (FFPI) [22], the characterization of extreme flash floods across Europe [23], and the integration of various methodologies such as statistical indices, frequency ratios, weights of evidence, multivariate statistical approaches, multi-criteria decision-making and machine learning techniques supported by RS and GIS [24].
In particular, flash floods pose a significant natural hazard in North Macedonia. The country is dominantly mountainous, characterized by a blend of Mediterranean and continental climates with hot, dry summers and cold, snowy winters [25,26]. The likelihood of dangerous conditions from torrential rainfall and potential flash floods is highest during the summer months, due to intense thunderstorms when temperatures are the highest [23,27,28,29]. Given the country’s complex configurations of climate and terrain, along with small spatial and temporal scales, flash floods are difficult to predict. Nevertheless, early indicators such as extreme precipitation events and FFPI are crucial for improving forecasting accuracy [30]. The FFPI is an essential tool for identifying and modeling areas where flash floods are likely to occur, enhancing the precision of early warning systems and risk assessments [31,32,33,34,35]. In this regard, substantial research efforts have been concentrated on flash flood modeling and risk assessment, with recent studies utilizing the FFPI to evaluate flood susceptibility and enhance predictive capabilities [25,36,37,38,39]. Integrating historical data with remote sensing techniques has been pivotal in validating these assessments and formulating effective flood management strategies [40].
Data sparsity and data limitation needed to train and develop effective flash flood models are significant challenges that prevent the choice and effectiveness of different modeling approaches in North Macedonia. However, free satellite imagery and geospatial datasets obtained through platforms such as Google Earth Engine (GEE) could significantly mitigate those limitations. GEE integrates a powerful suite of tools, algorithms, and built-in functionalities for large-scale data retrieval, mapping, and analysis [41]. One of the powerful benefits of GEE is the ease of sharing code and workflows with other researchers. As such, this encourages collaborative research which can be disseminated to colleagues, organizations, policy makers, NGOs, and even the general public.
Indeed, Google Earth Engine (GEE) is a robust cloud-based platform for planetary-scale geospatial analysis that allows users to process and visualize vast amounts of satellite imagery and geospatial data with unprecedented efficiency. Launched by Google in 2010, GEE provides access to a comprehensive catalog of datasets, including Landsat, Sentinel, MODIS, and climate reanalysis data such as ERA5 and CHIRPS, all hosted on Google’s infrastructure, which eliminates the need for local data storage [42]. Its JavaScript and Python APIs enable scalable computation, making it ideal for hydrological modeling and flash flood susceptibility mapping in data-scarce regions like North Macedonia. To enhance predictive accuracy in real-time hazard assessments, the implementation of flash flood modeling of peak discharge was tested and validated in GEE, which proved to be a powerful and efficient tool (e.g., [43,44,45]).
This research addresses the challenges of GEE-based FFPI assessment and mapping by employing indices such as slope, soils, land use, vegetation, bare soil index (BSI), and erodibility as significant flash-flood contributing factors. Because of data scarcity, the resulting map is validated using historical flood records, expert opinions, as well as the extreme precipitation and FFPI-based peak runoff and discharge models compared with observational data [46,47,48,49]. The results, which provide insights into areas with high flood potential, are further inserted and represented in a QGIS (https://www.qgis.org/) for subsequent visualization and mapping [50,51,52,53,54,55,56,57]. This novel application of GEE and particularly the transformation of FFPI to runoff coefficient C for use in the rational method, notably advances flood risk management and preventive measures at both local and national levels [58]. This framework offers a robust solution for regions with limited hydrological data [23], enhancing flood preparedness in North Macedonia.

2. Materials and Methods

This study employed the FFPI model [59,60] to identify areas susceptible to flash floods at the national level, using North Macedonia as a case study. GEE and advanced geospatial analytics were utilized in the analysis, which starts at the catchment level and extends to the national scale.

2.1. Overview of the Study Area

The Republic of North Macedonia, covering an area of 25,713 km2 and situated in the southern part of the Balkan Peninsula, features predominantly mountainous terrain, which accounts for 79% of its total area (Figure 1). Plains account for only 19%, while lakes and reservoirs comprise 2%. The country’s topography is noted for its alternating mountains and valleys, resulting in a significant average slope of 15.4°, with 39.5% of the land exhibiting slopes greater than 15° [61]. Geologically, the country is divided into six distinct geotectonic units, exhibiting a wide range of lithological formations spanning from the Precambrian to the Cenozoic periods [62]. The landscape is particularly vulnerable to erosion and landslides, especially in the foothill regions where highly erodible crystalline and clastic sedimentary rocks predominate. The highest mountain range, Korab (2764 m), is situated in the western part of the country, while the lowlands are found in the central areas, known as the Vardar Basin. This region is primarily characterized by fluvial landforms shaped by the Vardar River, the longest river, along with its major tributaries, including Treska, Crna Reka, Pčinja, Bregalnica, and Lepenec. According to the Study of Natural Characteristics for the Spatial Plan of the Republic of North Macedonia 2021–2040 [63], the country exhibits complex climatic conditions with significant regional variations.
The region’s climate is influenced by its diverse topography, which hosts Mediterranean, continental, and mountainous climatic factors. Recent decades have seen an increase in storm frequency and heavy rainfall events linked to climate change, further intensifying the risks of erosion and flash floods in this semi-arid region, which receives approximately 500–700 mm of precipitation annually. However, precipitation patterns vary across the country, with significant regional differences, including distinct wet and dry seasons and regular snowfall in the mountains during winter [64]. Additionally, the abrupt influx of warm Mediterranean air when winter changes to spring, often results in rapid snowmelt and significant overland flow, triggering river floods [65].
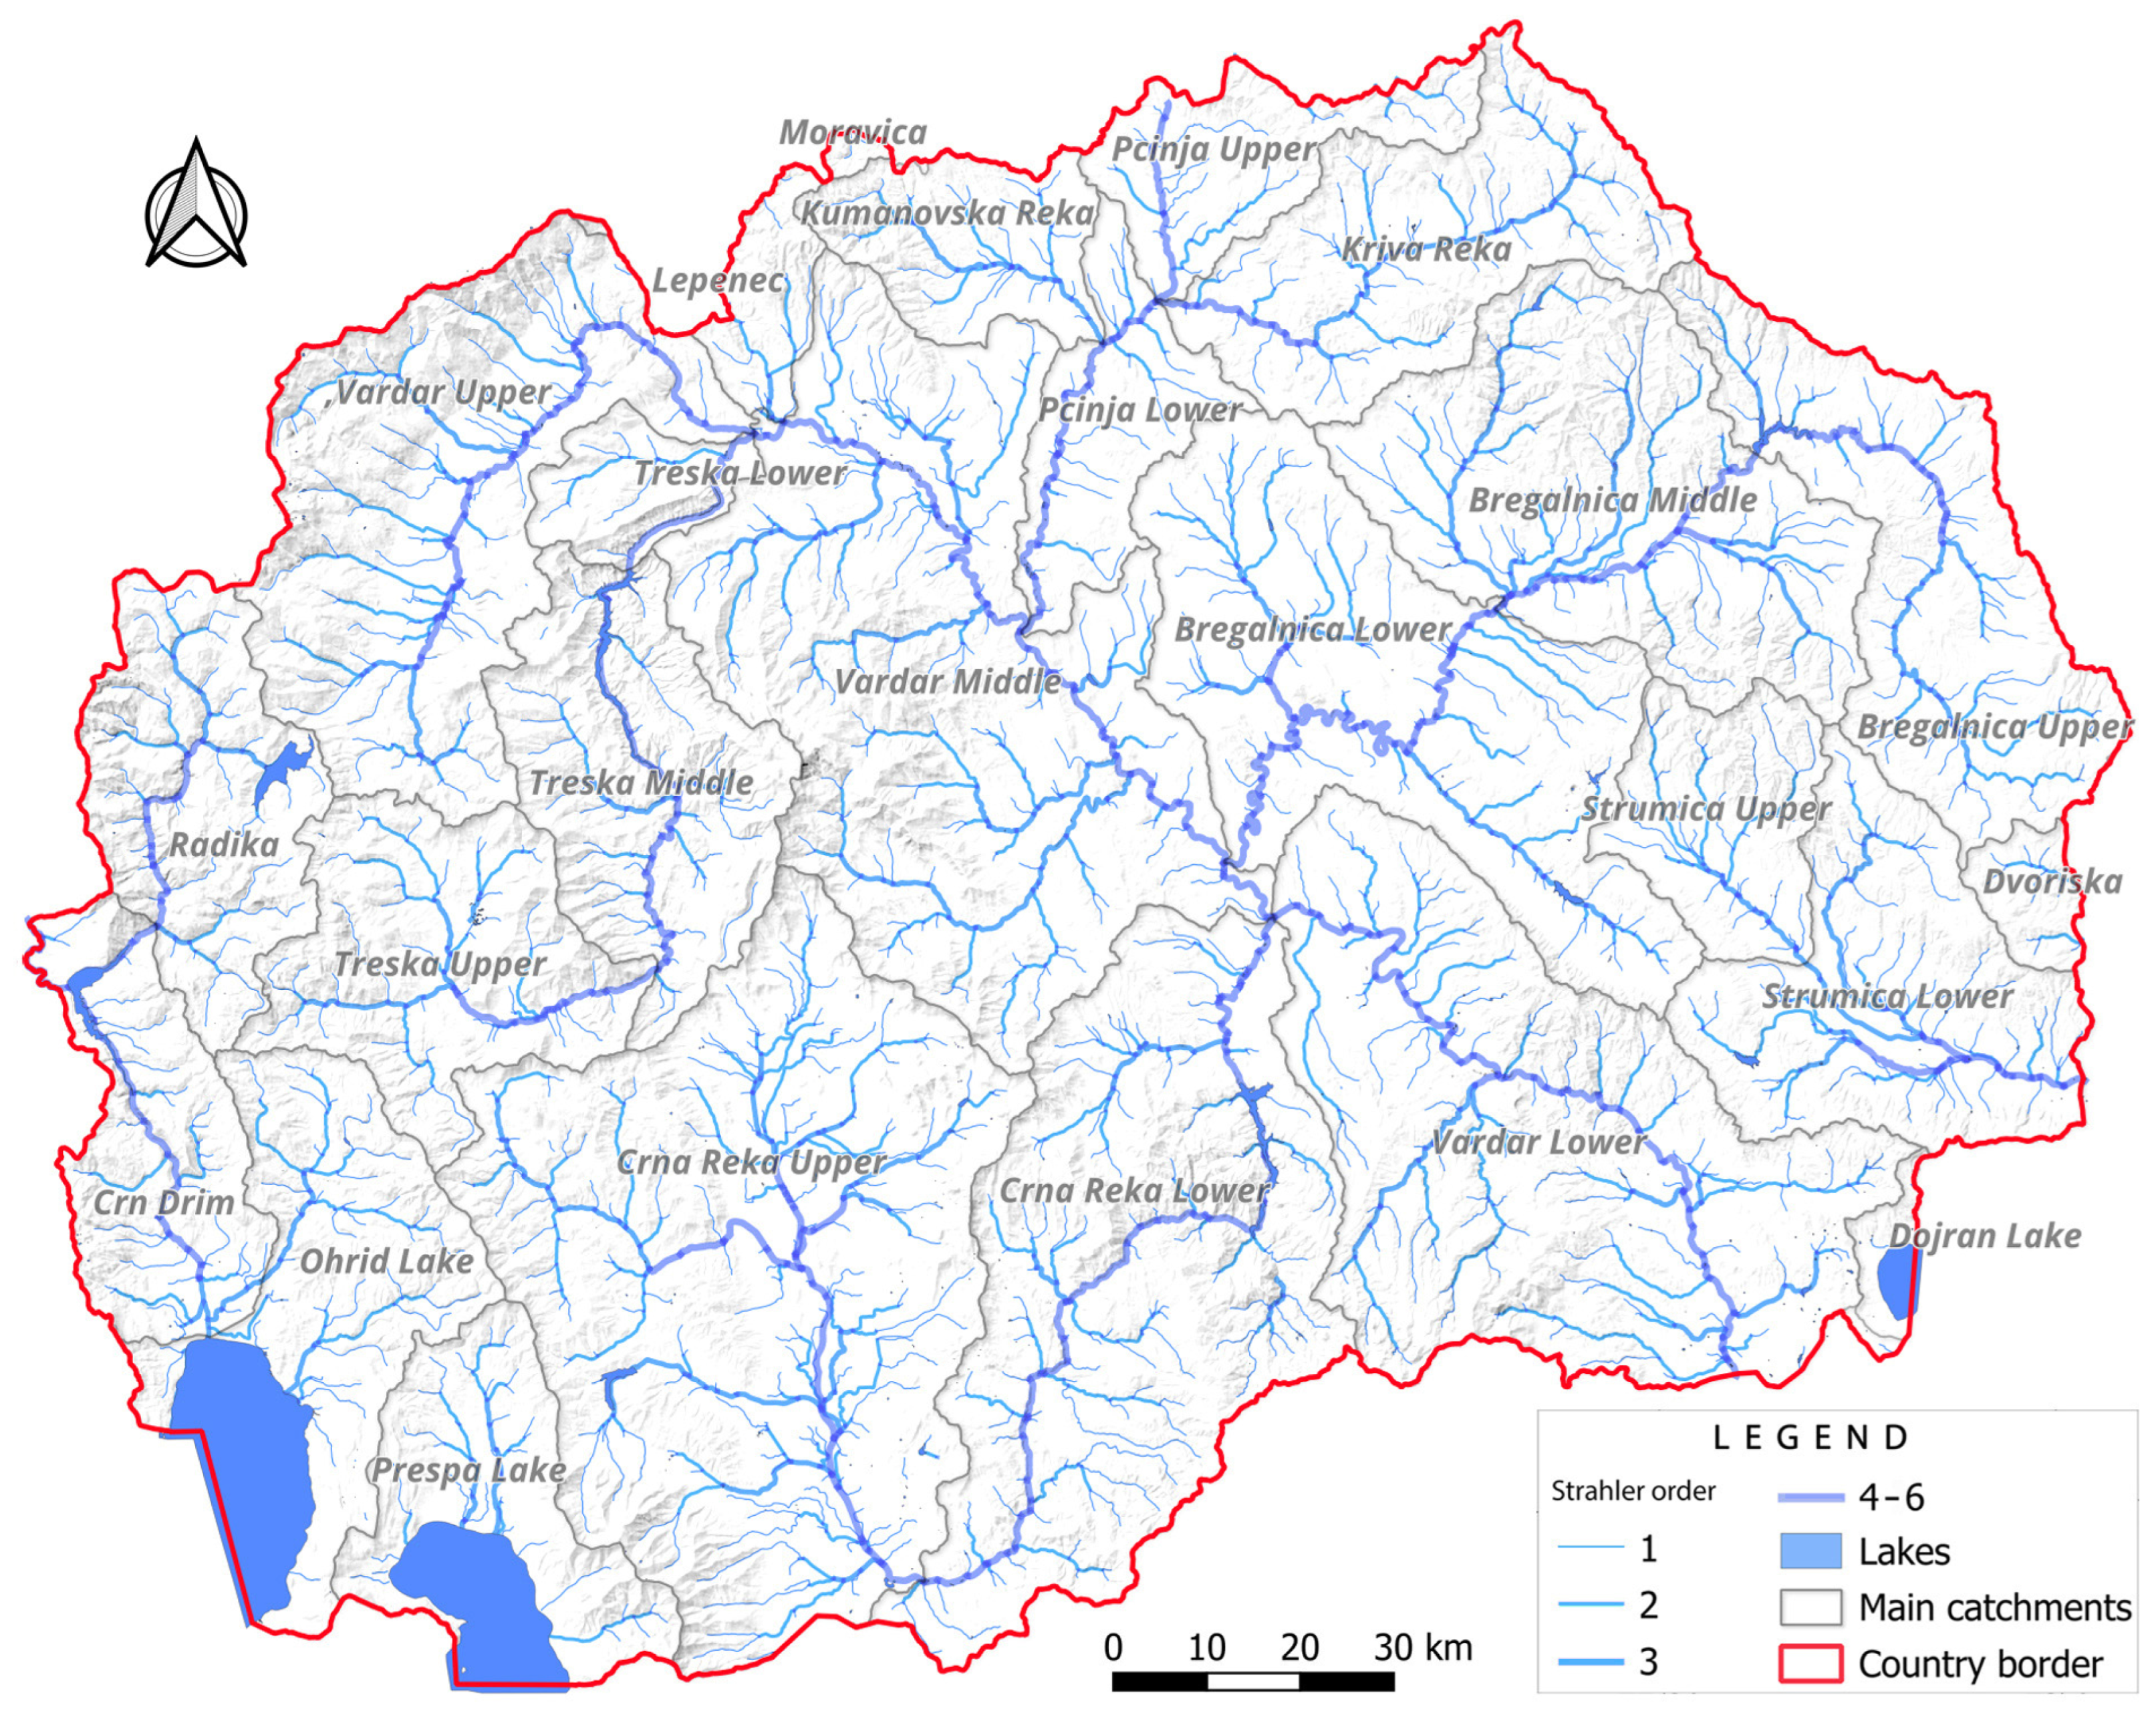
The river systems in the country are part of three main transboundary drainage basins: the Aegean Sea basin (87%), the Adriatic Sea basin (12.8%), and the Black Sea basin (0.2%). The total length of all rivers is 7637 km, with a river network density of 0.30 km/km2 [63]. Vardar watershed, which belongs to the Aegean Sea basin, is the largest in the country, covering 80% of the total area. The Strumica river catchment, on the southeast, as a tributary of the Struma River in Bulgaria, also belongs to the Aegean Sea basin. The Crn Drim watershed, with the catchments of the river Radika, Ohrid Lake, and Prespa Lake, belongs to the Adriatic Sea basin, while a very small part of the Moravica catchment on the north belongs to the Black Sea basin. These catchments play a crucial role in shaping the country’s hydrological dynamics, influencing both water resources and climatic conditions (Figure 2). Understanding these features is essential for effective water resource management and environmental conservation.
Throughout history, human activities have had a significant impact and continue to influence the occurrence of flash floods, primarily through changes in land use, deforestation, livestock grazing, and related practices. Today, North Macedonia, with a population of approximately 1.8 million mostly urban residents, contrasts with its predominantly rural composition that shifted in the 1960s. During that period, extensive agricultural practices substantially altered land use, leading to forest degradation and increased susceptibility to flash floods.

2.2. Methodology of FFPI Assessment in GEE

To evaluate flash flood susceptibility, the FFPI method was applied in the GEE environment. The FFPI is calculated through a statistical analysis that correlates various factors with the spatial distribution of drainage within a watershed. Based on empirical observations, this method indexes the weighting factors that influence flash floods [32,39,58,66,67,68,69,70,71,72]. The model assigns values ranging from 1 to 10, where 1 indicates the lowest and 10 is the highest potential for flash floods. The FFPI method was selected due to its reliance on static physiographic factors, offering a more consistent basis for identifying flash flood-prone areas, especially in contexts where meteorological data are limited or do not reliably capture spatial variability in flash flood occurrence. This method is quantitatively defined by the following equation
FFPI = (nM + L + S + V)/N
In the original formulation by [68], the FFPI is calculated using a weighted combination of terrain and land surface parameters. In this formula, n represents the weight assigned to the slope M, L denotes land cover or land use, S is soil type or texture, and V corresponds to vegetation cover or forest density. The denominator N is the total sum of weights, where L, S, and V each weigh 1, while the slope (M) is assigned a higher weight, making N greater than 4 [73]. Over time, the original formula has undergone several modifications to enhance its applicability and accuracy, including adaptations proposed by [73,74,75,76,77], among others.
In this study, FFPI values were computed using the Google Earth Engine (GEE) platform, which leveraged available remote sensing and geospatial datasets. A custom GEE script was developed to automate the calculation and spatial distribution of FFPI values nationwide, following the methodology proposed by [68]. The FFPI is calculated using the equation:
FFPI = ((1.5 × M) + (1.05 × L) + S + (1.25 × V) + (1.1 × E))/5
where E is the erodibility factor. Each factor is multiplied by its weight values based on expert knowledge that reflects careful validation of local conditions, and in consultation with relevant literature [74,75,76,77]. For calculating factor values, suitable datasets are used, including Sentinel-2 (10 m), ESA WorldCover (10 m), DEM-derived slope (30 m), and soil data (250 m), and they are harmonized to a common 30 m resolution via bilinear interpolation in GEE, as detailed later on the end of this section.
Among these, the slope factor (M) is one of the most influential components in FFPI modeling, as it directly affects surface runoff velocity and the potential for accumulation [60]. The slope factor (M) was derived from the 30 m resolution Copernicus GLO-30 Digital Elevation Model (DEM) [78], using the following equation:
M = 10n/30
In this equation, n represents the average terrain slope expressed as a percentage. When n equals or exceeds 30%, the slope factor M is assigned the maximum value of 10. In the context of this study, the average slope was found to be 28.4%, corresponding to a very high M value of 9. A classification system was applied to the slope values, assigning FFPI weights from 1 to 10 based on runoff potential (Table 1). Slopes greater than 30% received the highest FFPI weight due to their strong influence on surface runoff and limited infiltration capacity [60,68]. The final slope map was then produced and analyzed to assess its contribution to flash flood susceptibility (Figure 3A).
The land cover factor (L) was derived from the ESA World Cover (2021) dataset [79], which provides 10 m resolution data based on Sentinel-1 and Sentinel-2 satellite imagery. Land cover classes were ranked on a scale from 1 to 10, reflecting their respective impacts on flash flood risk. Tree cover or forests, with their dense canopies and extensive root systems, were assigned the lowest values (1) due to their high ability to retain water and prevent soil erosion [80]. Shrubland and grassland were assigned intermediate values (3 and 5), while cropland received moderate scores (6) due to partial vegetative cover. The most vulnerable areas, such as built-up zones, bare rock, and sparsely vegetated surfaces, were assigned the highest values (8, 10) because they offer minimal resistance to overland flow [60,81]. The resulting data, presented in Table 2, show that tree cover, dominated by broadleaf and coniferous forests, occupies almost half of the country’s area (48.7%). However, parts of these are sparse and highly degraded. On the other hand, sparse vegetation, including grasslands, croplands, and bare soils, covers another half of the country (47.8%), contributing to the high FFPI value (Figure 3C).
The soil factor (S) was estimated using data from the 250 m Soil Grids global dataset, specifically the layer representing clay content [82]. Clay content is a critical determinant of infiltration capacity; high clay concentrations reduce soil permeability, increasing runoff generation during heavy precipitation events [83]. For FFPI purposes, soil types were classified based on their clay content, with normalized values ranging from 1 (indicating very low clay content and high infiltration) to 10 (indicating very high clay content and low infiltration) (Figure 3B). Soils range from loamy to clayey, with particularly clay-rich zones in the lowlands, where runoff potential is higher [82].
The vegetation factor (V) was calculated using the BSI, derived from Sentinel-2 multispectral satellite imagery at a 10 m resolution (e.g., [84,85,86,87]. BSI is a widely used remote sensing indicator for evaluating erosion risk and susceptibility to flash floods [87]. In this study, the Sentinel-2-based BSI (BSI-S2) was calculated within the GEE environment as a yearly average for 2023 and 2024, as follows:
BSI S2 = ((SWIR + RED) − (NIR + BLUE))/SWIR + RED) + (NIR + BLUE))
The BSI combines blue, red, near infrared (NIR), and short-wave infrared (SWIR) bands to capture soil variations. BSI reflects varying degrees of soil exposure and ranges from −1 to 1, with higher values indicating areas of exposed soil or sparsely vegetated soil conditions associated with a greater erosion potential and higher surface runoff risk. In contrast, lower BSI values correspond to densely vegetated regions that contribute to runoff attenuation and enhanced soil stability [87]. For integration into the FFPI model, the vegetation factor (V) derived from BSI was reclassified into ten proportional classes ranging from 1 to 10. Low values (1–3) indicate dense vegetation cover and minimal runoff susceptibility, while high values (7–10) correspond to sparsely vegetated or barren land, which contributes to accelerated overland flow and increased flash flood hazard.
In addition to the aforementioned factors, the erodibility factor (E) was incorporated into the FFPI model to enhance its sensitivity to terrain vulnerability. This parameter is represented by the K-factor from the universal soil loss equation (USLE), a widely recognized metric for soil erodibility [83]. The K-factor quantifies the susceptibility of soil to erosion based on its intrinsic properties and plays a crucial role in estimating surface runoff and sediment transport, thereby influencing the generation of flash floods [88] Within the GEE framework, the K-factor was calculated using inputs from the 250 m SoilGrids raster dataset, which include soil texture components (sand, silt, and clay content), organic carbon content, soil structure, and permeability [82]. All of these components are in the form of raster bands, which are then processed in GEE according to the following empirical formulation [83]:
K = [2.1 × 10 − 4⋅M1.14⋅(12 − OM) + 3.25⋅(S − 2) + 2.5⋅(P − 3)]/100
where:
M = (silt + very fine sand) × (100 − clay); all components are expressed as percentages;
OM = Organic matter content (%), derived by converting SoilGrids’ soil organic carbon (SOC) using the relation: OM = SOC × 1.72;
S = Soil structure code (ranging from 1 to 4), estimated based on soil texture classification (e.g., S = 2 for loamy soils);
P = Permeability class (ranging from 1 to 6), also estimated from soil texture data (e.g., P = 3 for moderately permeable soils).
The resulting K-factor values are normalized on a scale from 1 to 10 to align with the other contributing parameters in the FFPI (Figure 3D). While the K-factor independently provides a broad measure of soil erodibility, its integration with clay content data from the SoilGrids dataset (at 250 m spatial resolution) allows for a more nuanced representation of soil characteristics. This enhancement improves the FFPI’s capacity to reflect both general erodibility and specific textural constraints, particularly the influence of high clay content on infiltration and surface runoff potential [82,83].
Due to the varying spatial resolutions of the FFPI input datasets, ranging from 10 m to 250 m, all raster layers were resampled with bilinear interpolation in the corresponding GEE-script to a uniform 30 m resolution and reprojected to the Universal Transverse Mercator (UTM) coordinate system and World Geodetic System 1984 (WGS84) datum, zone 34N to ensure spatial compatibility and consistency. By integrating all contributing factors described above (slope, land cover, soil type, vegetation, and erodibility), the final FFPI was calculated.

2.3. Methodology for Calculating the Peak Discharge in GEE

The next step involves calculating the runoff within these catchments during the maximum expected 24 h rainfall, which is a base to estimate the peak discharge. River discharge, defined as the volume of water flowing through a river per unit time (Q, in m3/s), is influenced by precipitation that contributes to runoff within a catchment. Discharge can be calculated using the rational method equation:
Q = C ⋅ P ⋅ A/t
where:
Q is the discharge (m3/s);
C is the runoff coefficient (dimensionless, ranging from 0 to 1);
P is the precipitation (m, depth over the catchment);
A is the catchment area (m2);
t is the period (typically the duration of the peak rainfall event and peak flash flood time, which is usually between 6 and 12 h).
The runoff coefficient (C) represents the fraction of precipitation that becomes surface runoff; thus, it is very important for the accurate discharge calculation. Our procedure used the normalized FFPI values for C, based on factors such as soil erodibility (K-factor), clay content, land cover, vegetation density, and slope [89]. The normalization is performed through a logarithmic sigmoidal function of the FFPI range (1 to 10) to the C range (0 to 1) as follows:
C = 1/(1 + exp (−k × (FFPI − m)))
where k is a curve value to widen the C range between 0 and 1, and m centers the curve at the midpoint of the FFPI range. In our case, 1.5 was given for k-value (providing a steep curve) and 5.5 for the m value as the midpoint (mean value). This normalization was validated by expert knowledge, field observation, and available data, to ensure that an FFPI of 1 (low flash flood potential) corresponded to C ≈ 0 (no runoff), and an FFPI of 10 (high flash flood potential) corresponded to C ≈ 1 (all precipitation becomes runoff).
To assess maximum 24 h precipitation, the CHIRPS (Climate Hazards Group InfraRed Precipitation with Station data) [90] dataset has been utilized in GEE for more than 25 years (2000–2024). CHIRPS is selected for its superior spatial resolution (approximately 5.6 km) compared to other datasets such as ERA5 (9 km) [91] and NASA GPM (Global Precipitation Measurement; 10 km) [92], while maintaining comparable accuracy [90].
The FFPI-based runoff coefficient (C), catchment areas (in m2), maximal 24 h rainfall (derived from CHIRPS) [90], and flood duration (in seconds) were then incorporated into the equation to compute peak discharge [93]. For computation consistency, being mindful that the original FFPI was in 30 m resolution, CHIRPS data were interpolated to the same resolution.
Finally, the peak discharge values calculated in GEE were validated and compared with the observational river discharge data available from the hydro-meteorological service of North Macedonia. Discrepancies between both (especially in the karst areas) were corrected and minimized by adjusting the FFPI factor values and weights, as well as by adjusting the coefficients k and m in the sigmoidal function for calculating runoff coefficient C.

3. Results

3.1. Assessment of Flash Flood Potential Using FFPI

The FFPI was applied to a nationwide flash flood model, enabling the identification of catchments most vulnerable to flash flooding. As the FFPI is based on relatively stable geospatial and environmental parameters, it serves as a consistent and reliable metric for assessing long-term flood risk, planning, and management.
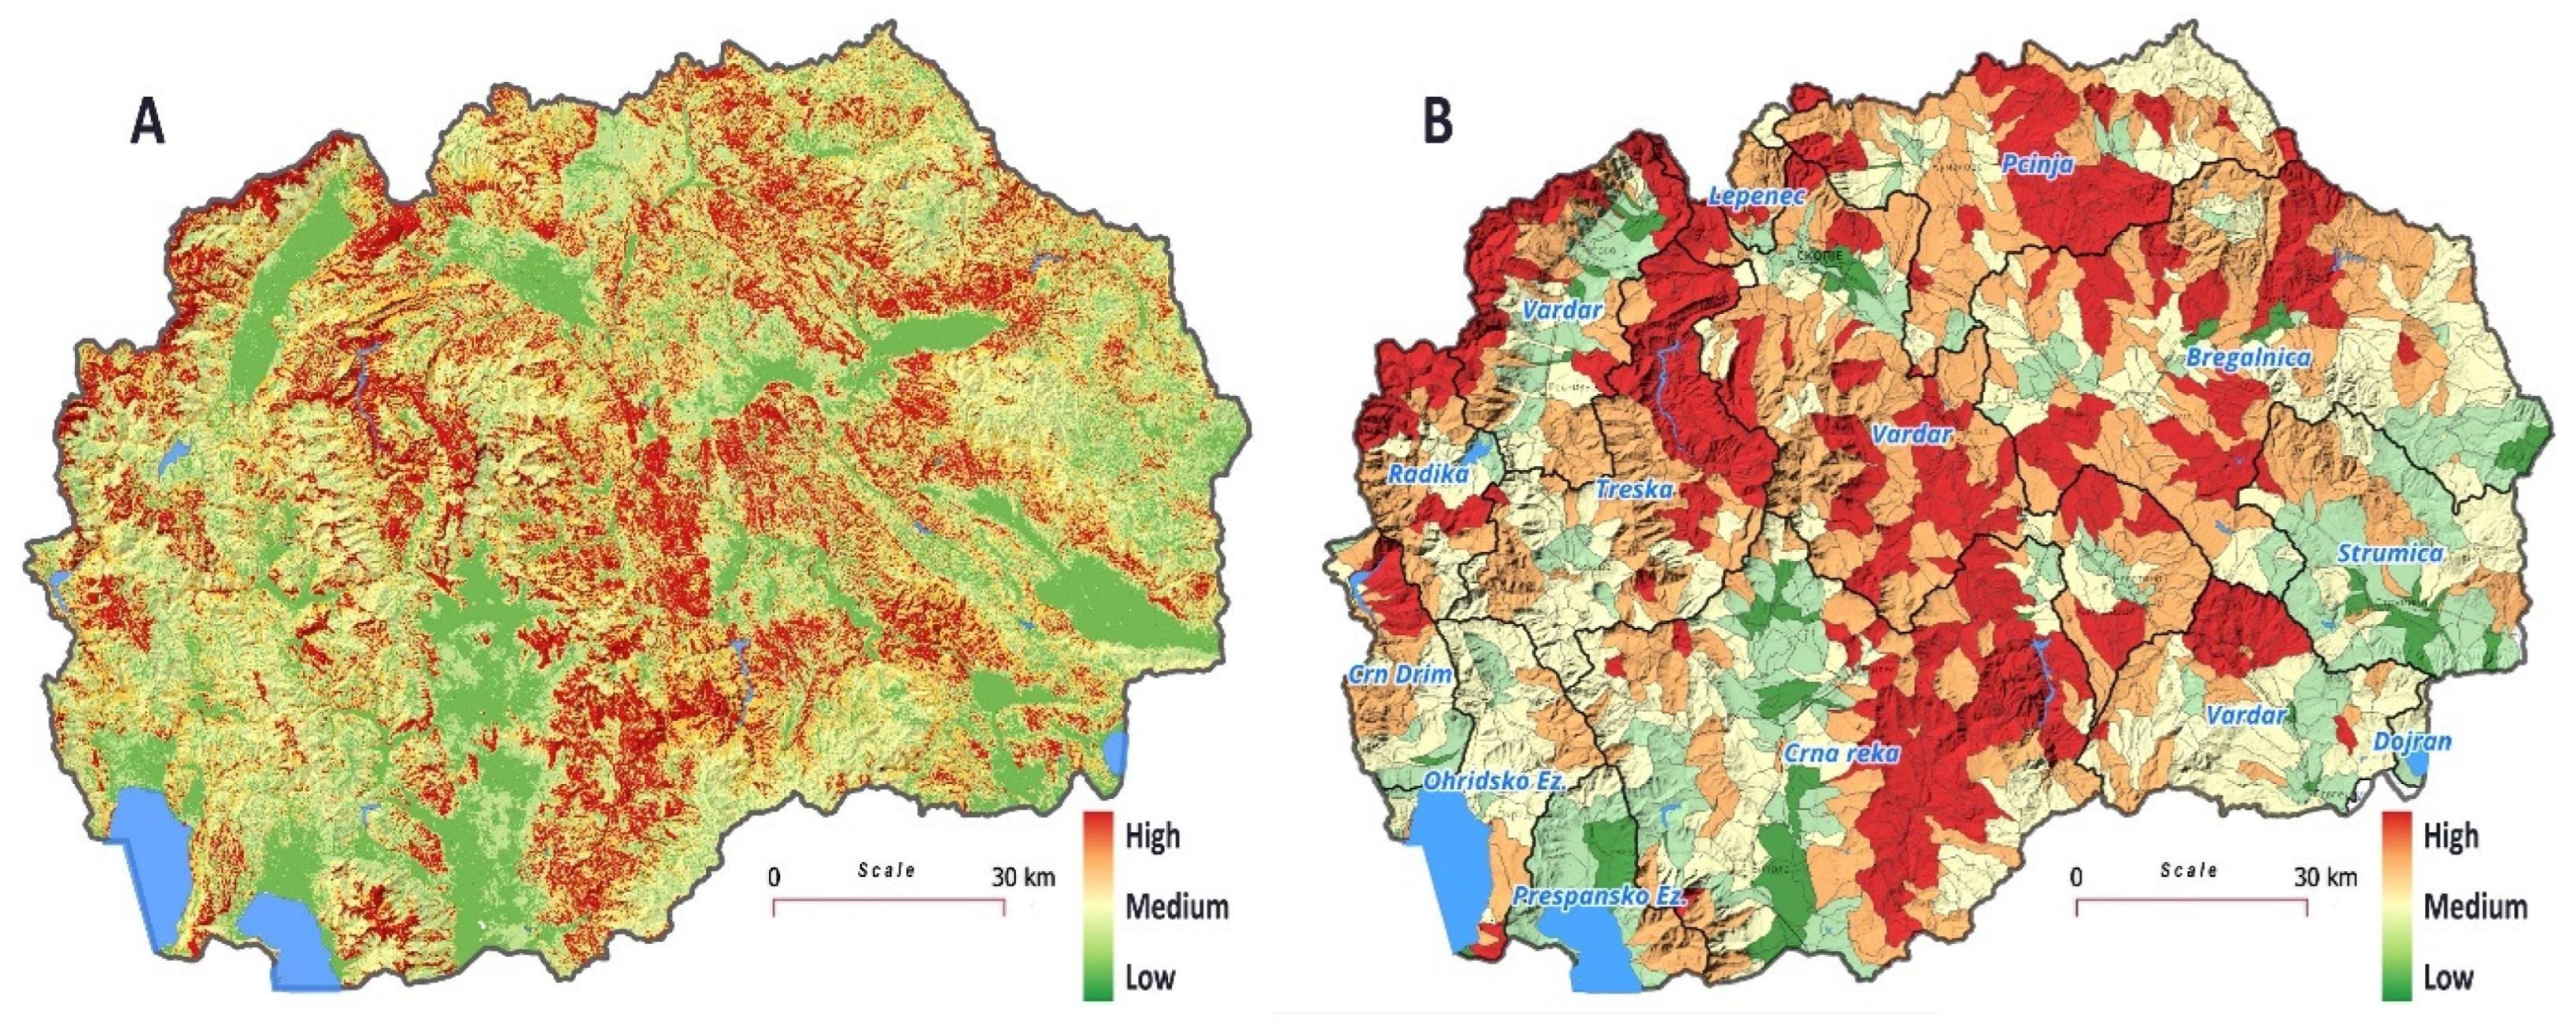
The GEE-calculated FFPI values ranged from 2.82 to 9.16, with a mean value of 5.5, indicating significant variability in flood risk. The natural breaks classification technique used for mapping and visualization grouped the FFPI values into five classes that represented susceptibility from very low (1) to very high (5).
This variability is driven by steep slopes, which increase runoff speed and erosion; deforestation, which reduces soil stability and absorption capacity; and erodible lithologies like tuffs and schists, which are prone to weathering and erosion. Additionally, areas with sparse vegetation contribute to higher flood risk due to diminished water absorption and increased sediment transport. Collectively, these factors create a complex landscape of flood susceptibility across the country (Figure 4A). Thus, the FFPI analysis shows that the dominant class is moderate susceptibility, covering an area of 26.2%. This is followed by very high and high susceptibility with 24.1% and 21.4%, respectively, or 45.5% combined. Low and very low susceptibility, which is the rest of the area, covers just 28.3%, excluding water bodies (Table 3).
To better assess flash flood susceptibility, the average FFPI values for each catchment were calculated (Figure 4B). A total of 1396 small catchments, with areas ranging from 10 km2 to 100 km2, were identified and used as the basis for assessing flash floods. Using the natural breaks (Jenks) classification, these catchments were categorized according to their average FFPI values. Calculating the average FFPI per catchment is an effective method for assessing flash flood susceptibility, particularly for regional or watershed-scale analyses. This approach aligns well with hydrological processes, as catchments (or watersheds) are natural units for studying water flow and flood dynamics. Catchments are defined by topography and drainage patterns, making them ideal for flash flood analysis [93]. Averaging the FFPI per catchment integrates spatial variability (e.g., soil properties, land cover, slope) into a single metric, reflecting the overall susceptibility of the catchment to flash floods. This method captures the cumulative effect of runoff generation and flow concentration within a catchment, which is critical for accurate flash flood prediction [93].
The average FFPI values for the catchments ranged from 2.93 to 7.62, with an average of 5.41. As mentioned earlier, the values were reclassified into five classes, ranging from 1 (very low susceptibility) to 5 (very high susceptibility). The analysis revealed significant variability in flash flood susceptibility, starting with the catchments having the highest average value (Figure 4B and Table 4). Exceptionally high mean FFPI values were observed in downstream catchments of the Crna Reka and Treska watersheds, as well as in the Vardar watershed, located in the central part of the country. Additionally, generally high FFPI values (>5.4) were associated with catchments in the Bregalnica and Pčinja watersheds in the eastern and northeastern parts of the country.

3.2. Assessment of the Peak Discharge

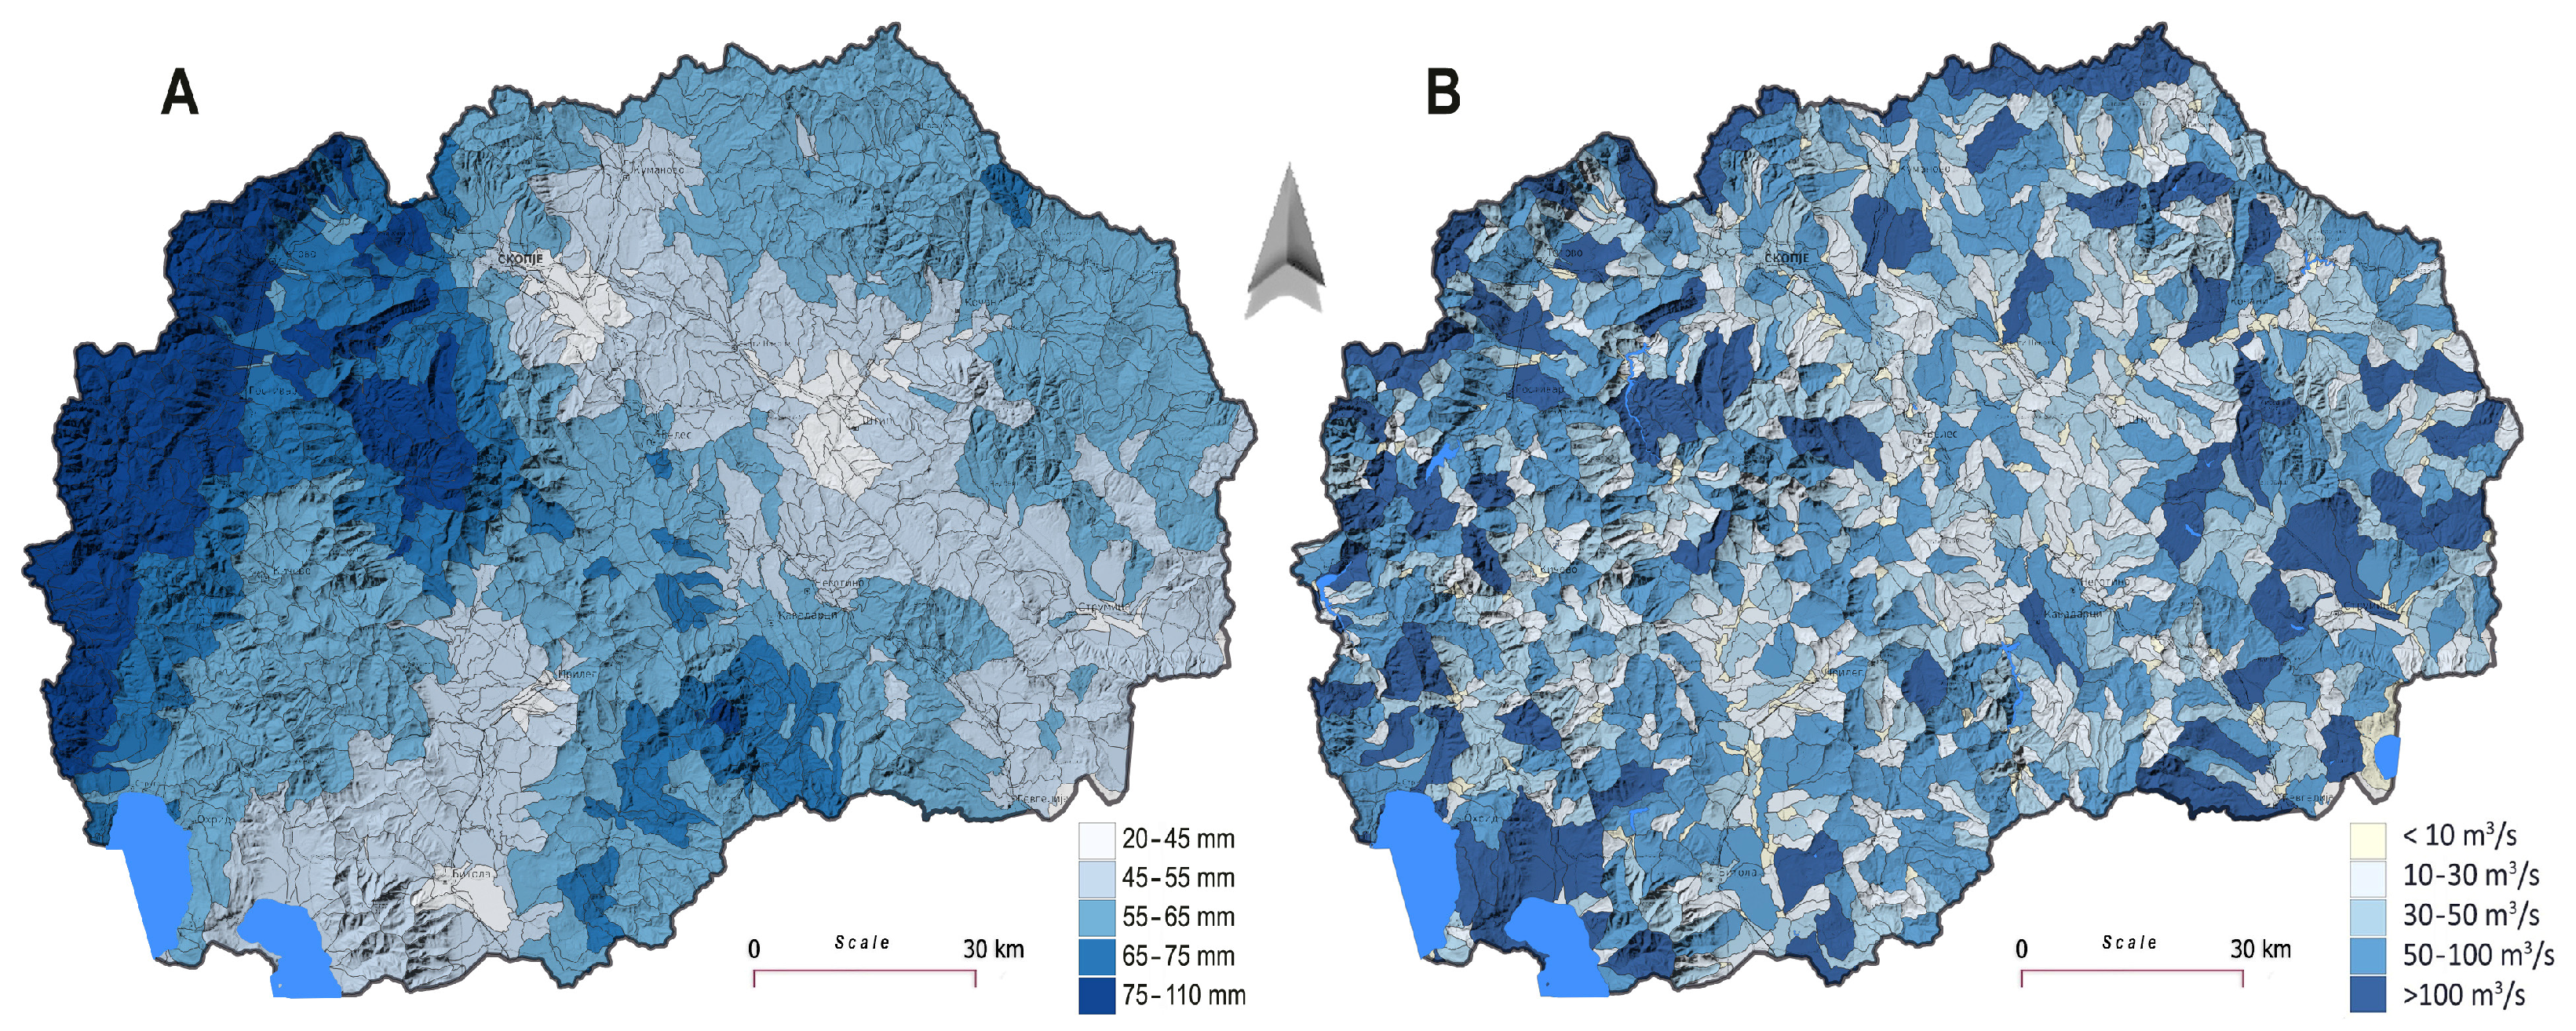
According to the CHIRPS data used [90], the maximum 24 h rainfall amount for the period 2000–2024 ranged from 50 mm in the central parts of the country to 100 mm in the northwestern parts, including the Šar Planina and Korab mountains. Similar results were found in the ERA5 [91] and NASA GPM [92] datasets. However, the data from the meteorological stations indicated approximately 30–50% higher values [94], suggesting that the available reanalysis data underestimates extreme precipitation values. Several factors can led to an underestimation of CHIRPS precipitation, including fewer or poorly distributed ground stations, satellite limitations to infer cloud top temperatures, temporal averaging of short-lived events, and complexities with orographic and terrain effects. As such, CHIRPS data [90] were further adjusted to better fit the real values (Figure 5A). Thus, the peak 24 h runoff for the period 2000–2024 was generated from the highest recorded CHIRPS rainfall values multiplied by the FFPI values normalized to runoff coefficient C [93]. The resulting map shows that the highest daily runoff occurred in the north-western part of the country, especially in the higher catchments on the Šar Planina Mountain, with extreme values of more than 80 mm/24 h (Figure 5B). The reasons for such high runoff here are high 24 h rainfall values combined with steep and exposed slopes and clay soils.
Furthermore, by inserting the 1396 small catchments (as vector polygons) in the GEE script, the peak runoff and discharge during the expected maximal 24 h rainfall were calculated and the results are presented in Figure 6. As a peak discharge time, 12 h (in seconds) is taken into consideration, as the peak flash flood duration in small catchments is usually 3–12 h.
The map of peak discharge per catchment (Figure 6B) is quite different from the runoff map (Figure 6A), which is primarily due to differences in catchment area and other characteristics (i.e., shape, topography, land cover, and soil).
Table 5 presents the number of catchments with average area, categorized by peak discharge, in five classes. The larger catchments usually have higher peak discharge. According to the model, the highest peak discharge (above 200 m3/s) during heavy rainfall is expected for the medium part of the Strumica river catchment, the upper part of the Pena catchment up to the vilage of Bozovce, the Konska Reka catchment on the east slopes of Kožuf Mt., the Oča catchment in the Poreče Basin, and the Suva Reka catchment in Mokra (Jakupica) Mts.
In these catchments, very frequent floods have been recorded in recent decades. However, the discharge during flash floods is usually estimated (rather than measured), and the values fall within a range of ±20% of the model values.

3.3. FFPI and Peak Discharge Validation

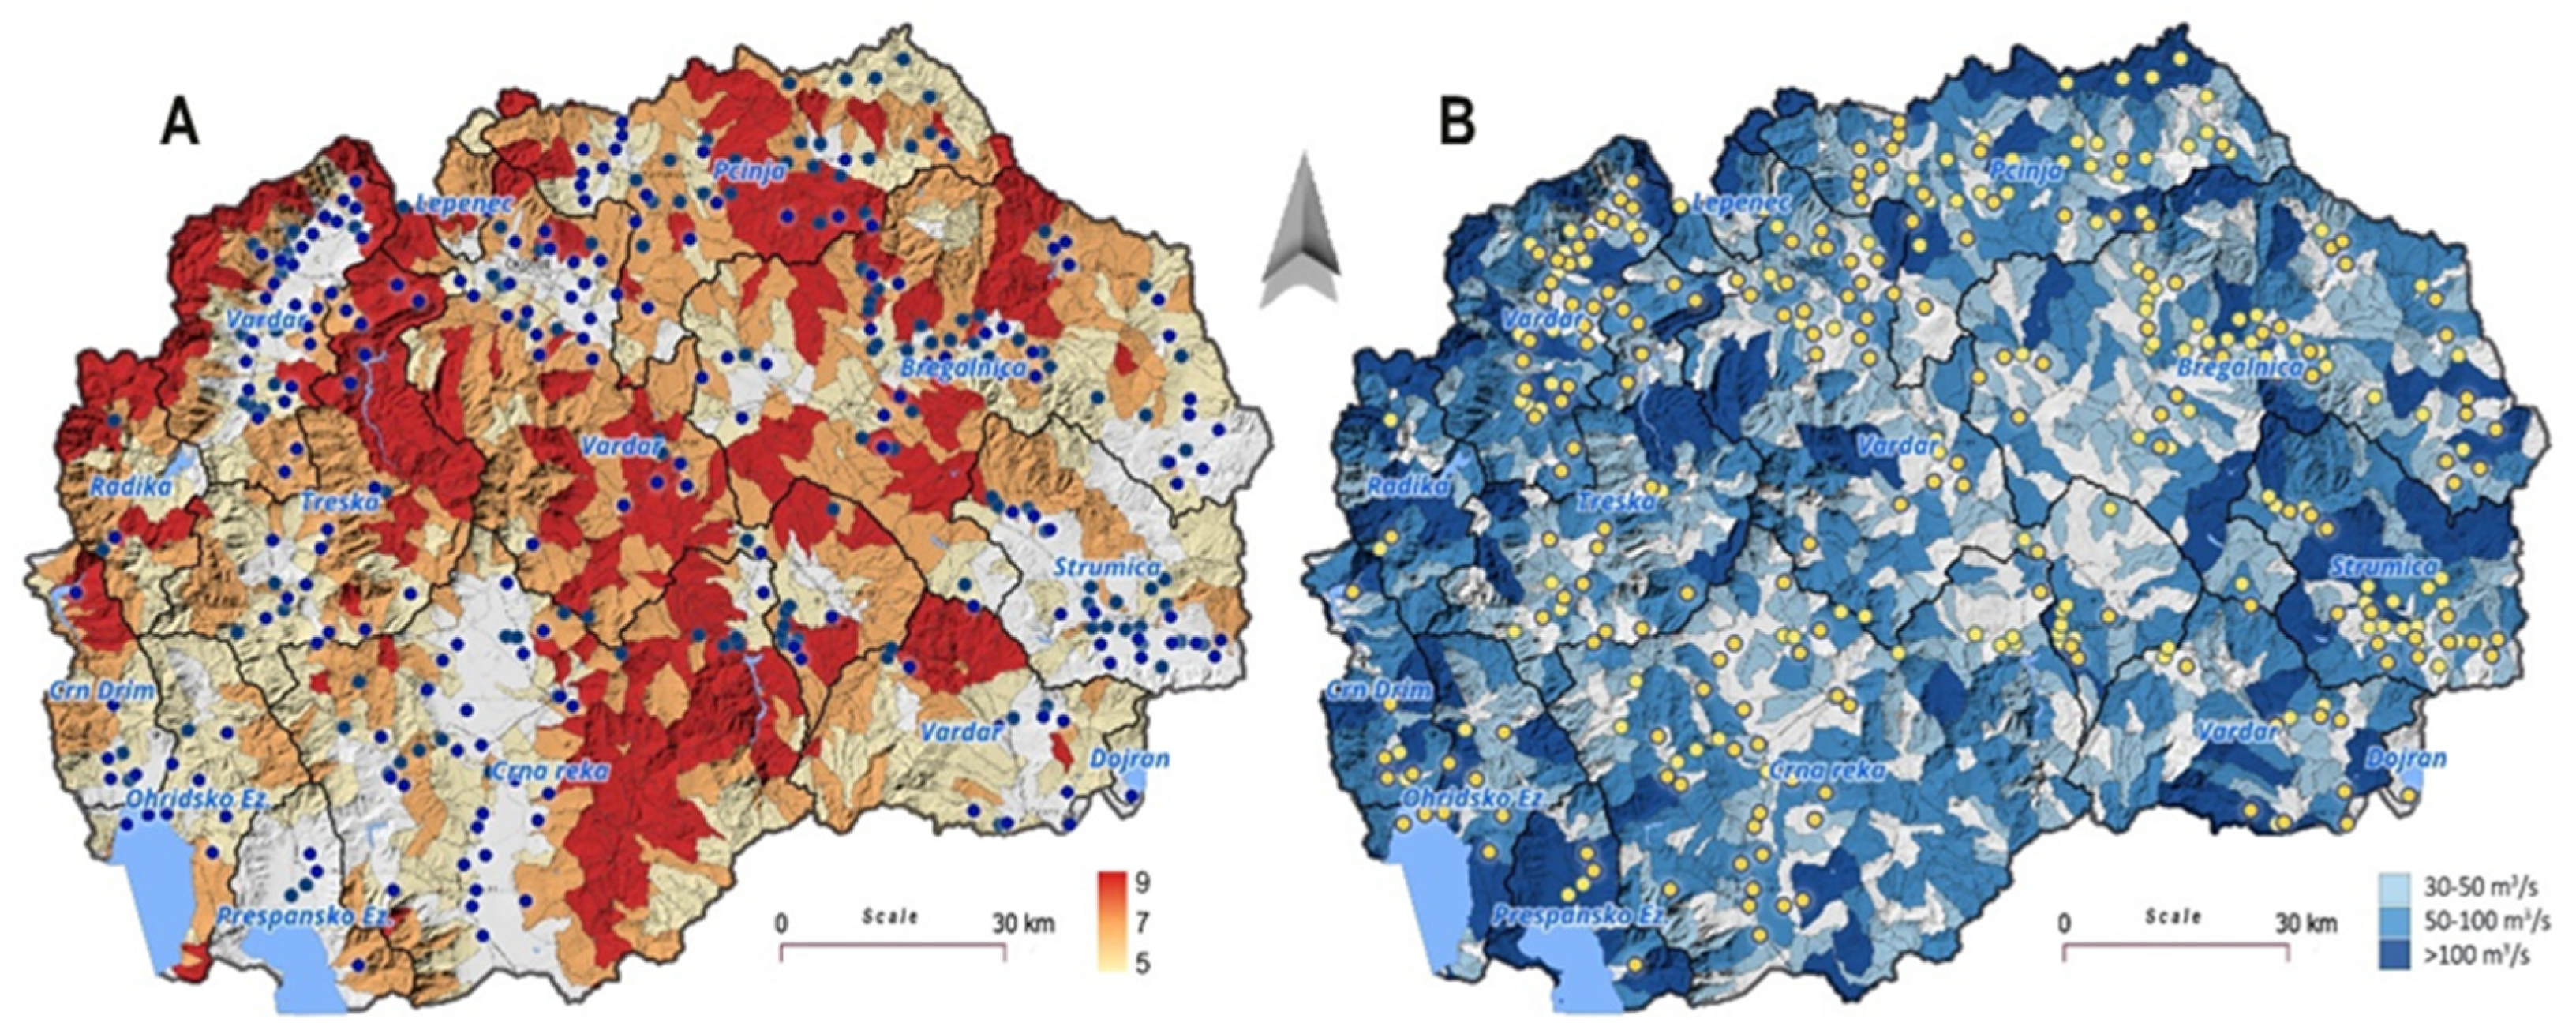
Validating a flash flood potential model, such as the FFPI or any other susceptibility model, is crucial to ensure its reliability and accuracy. The best approach to validating the GEE-based FFPI and peak discharge values is through model comparisons with historical flood records. However, there is no comprehensive and sufficiently accurate database of past flash floods in the country, especially for those in remote areas far from larger settlements. Yet, a map of 300 prominent floods of all types (river, urban, etc.) was recorded between 1960 and 2020 [95]. As this map encompasses all types of registered floods, including flash floods, it is partially helpful for comparison with the catchment-level FFPI and discharge output (Figure 7). Additionally, 28 flash flood records were added to the map based on field data and media information collected between 1995 and 2020; thus, the final map consists of a total of 328 records (Figure 7).
Notably, the catchments classified as having high to very high flash flood susceptibility encompass 52.6% of the area, and they correspond to 63.4% of documented flood events; when areas of moderate susceptibility are included, this figure rises to 80.8%, underscoring a pronounced spatial concordance between FFPI-based susceptibility assessments and the empirical distribution of historical flood occurrences.
Still, these results must be approached cautiously because only a portion of the recorded floods are flash floods, and their locations are simplified (represented as a vector point) on the inventory map. Additionally, some catchments extracted automatically from the Sentinel GLO-30 DEM extend from mountainous areas (with high FFPI) to the plains below (with low FFPI), resulting in a moderate overall FFPI. The upper parts are typically highly susceptible to flash floods, sometimes posing significant risks to the settlements below (as seen in numerous Šar Mountain catchments in the northwest part of the country). In these situations, topographical division into subcatchments can be beneficial. Nevertheless, future upgrades to this inventory with field and remote sensing data will enhance its value for flash flood modeling and validation. The spatial intersection of high flash flood susceptibility zones with critical infrastructure can be effectively analyzed through GIS-based methods, offering essential insights for targeted risk reduction and adaptive spatial planning.
Aside from the previous, combining the discharge of the several catchments that belong to the larger watershed should produce the total discharge of the watershed at the outlet. However, the resulting value will not be real as the maximum long-term daily rainfall is usually concentrated in a smaller local area, and there is also downstream infiltration and evaporation. Also, the peak discharge is heavily changed in rivers with reservoirs or other water retentions in their catchments. Nevertheless, the available maximally recorded discharge data by the State Hydrometeorological Service of 12 rivers during the flash floods for the period 1961–2020 were compared to the model output (Table 6).
The results show that the model values closely agree with the observed data. For instance, the peak discharge of the Lipkovska Reka River (northwest of Kumanovo) during the extreme flood in November 1979 was 110 m3/s, whereas the model output shows 126.8 m3/s. In the first case, the 3-day accumulated rainfall was approximately 120 mm, whereas in the model, the discharge was calculated based on a 90 mm rainfall for 24 h. Similar results were found for the upper part of the river Bregalnica and its tributaries (Kamenička, Orizarska, Kočanska, and Zletovska River), where the difference between observed and modeled data was very low (up to 10%). Additionally, according to [96], the peak recorded discharge of the Kriva Reka River at the Trnovec gauge station was 313 m3/s, while the model predicted 346 m3/s for the same spatial extent. In contrast to the previous, there was a substantial difference in the case of Radika River, which was a result of a heavily changed discharge in its upper part caused by the Mavrovo reservoir and tributaries captured and diverted toward Vrutok hydropower plant in Vardar watershed. For the same reasons, there is a significant difference when comparing observed and modeled data for the large watersheds, including Vardar, Strumica, Treska, Crna, Crn Drim, etc. Thus, the GEE-based FFPI map and the related peak discharge model are reliable for smaller (below 300 km2) and well-preserved catchments without larger reservoirs or hydro constructions.

4. Discussion

The results of this study provide a comprehensive assessment of flash flood susceptibility across North Macedonia, offering critical insights into the spatial variability of flood risk and its underlying drivers. The calculated FFPI values, derived from GEE-based processing and validated with historical records as well as with modeled and recorded peak discharge data, illustrate prominent differences in susceptibility among the country’s major river basins and subcatchments.
The reclassification of FFPI values into five susceptibility classes emphasizes that more than half of the country area, or 45.4%, falls under high to very high susceptibility, while 17.6% exhibits low and very low susceptibility, respectively. As such, the reclassification of FFPI improves interpretability and communication to different audiences such as emergency managers, urban planners, and the public. In addition, it allows for better visualization of spatial patterns and understanding drivers that influence runoff potential and flood vulnerability. For instance, steeper slopes facilitate rapid runoff and reduced infiltration. Steeper slopes in a catchment area have higher FFPI values, resulting in a higher potential for flash floods. On the other hand, areas with higher BSI and reduced vegetation are more prone to erosion. Variations in lithology and soils affect water retention and drainage characteristics, while changes in land use, especially deforestation and urbanization, can increase susceptibility. The weighting of different factors can also be adjusted in conjunction with observed data. In this study, the slope weighed more than the other factors due to the significant impact on runoff and overall flash flood potential. However, the FFPI is a static index and does not account for real-time weather conditions or antecedent soil moisture.
Therefore, while FFPI provides a snapshot of a watershed’s inherent susceptibility to flash flooding, the precipitation data (i.e., rainfall intensity and amount) is dynamic and changes over time. To improve flood risk assessment, it is also essential to consider precipitation forecasts and the integration of FFPI with other tools and models. For instance, CHIRPS, ERA5, and NASA GPM precipitation datasets are available in the GEE and, when combined with the FFPI, can provide a more comprehensive view of accurate and timely flash flood warnings, potentially saving lives and reducing property damage. For example, high-risk zones are mainly concentrated around settlements, where these adverse conditions converge, underscoring the urgent need for targeted flood management strategies, preparedness, and responses. Moreover, urbanization exacerbates flood risk due to the reduced absorption capacity of impervious surfaces. The high-risk nature of these basins demands prioritized interventions, including improved stormwater management infrastructure, afforestation programs, and the enforcement of land use regulations [97,98,99,100].
The validation of the GEE-based FFPI model using historical flash flood event data reinforces its robustness in capturing flash flood dynamics. The strong correlation between high-susceptibility areas and recorded flood events accentuates the model’s predictive reliability. However, discrepancies in rainfall intensity distribution, particularly between urban and rural settings, emphasize the need for continuous updates to meteorological datasets and their integration into future model iterations [101,102,103].
Flash floods typically originate in small headwaters and can progressively affect larger areas, leading to widespread flooding across the entire basin. This highlights the significance of the FFPI model, which facilitates flood risk evaluation across various scales, ranging from smaller subcatchments to whole river basins. By incorporating natural and anthropogenic factors, the model offers a comprehensive framework for identifying susceptible areas and informing effective flood risk management strategies. Flash floods in North Macedonia predominantly occur within small, torrential catchments (less than 100 km2) that lack instrumental hydrological monitoring, where their frequency is highest. Consequently, as shown in our research, the peak discharges can be derived with good accuracy through the combination of maximal precipitation and FFPI-based runoff calculation.
Based on historical data, the spring and autumn months (especially May and November) remain dominant for high-flow events in North Macedonia. This results from prolonged rainfall and intense snow melting on the mountains in the western part of the country, leading to river floods. However, in recent decades, the summer months of July and August have become increasingly associated with intense convective rainfall producing torrential flood events, commonly called flash floods. According to the current climate scenarios, North Macedonia will experience a warmer and drier climate by 2050, with an increase in extreme precipitation events, leading to a heightened risk of flash floods. During the summer, an increase in consecutive dry days followed by extreme rainfall is expected [103].
The flash flood factors used in the FFPI model, such as vegetation, BSI, and LULC (land use and land cover), are sensitive to changes, mainly due to human impact, forest fires, and overall shifts in vegetation cover. These factors can fluctuate over time, influencing the flash flood susceptibility and the model’s accuracy. To improve the FFPI model with dynamic land use changes, near-real-time LULC from Sentinel-2 or Landsat and real-time rainfall data from internet of things (IoT) sensors can be integrated within GEE. Adding land use change predictions (i.e., Land Change Modeler (LCM)), hydrodynamic models for water flow, and machine learning to analyze historical and new flood data will enhance accuracy. In addition, including socioeconomic factors such as population growth, infrastructure, and scenario analysis will further refine risk assessments. These steps will improve the FFPI model’s dynamism, realism, and utility for flood risk management and policy-making in North Macedonia. Additional improvements for handling the inherent uncertainties and vagueness related to reclassification and derivation of FFPI can be implemented by integrating fuzzy sets. Fuzzy sets provide a flexible framework for modeling and reasoning under uncertainty, and offer robust indices that represent the continuous nature of the factors that influence flash floods.
While the GEE-based FFPI, runoff, and discharge models provide a tailored approach to assessing flash flood potential, models like the analytical hierarchy process (AHP), multicriteria evaluation (MCE), and frequency ratio (FR) fulfill complementary roles. Each model possesses distinct advantages: the AHP enables systematic decision-making and elicitation of criteria weights [17]. MCE methods, such as the Boolean overlay and the weighted linear combination (WLC), deliver simplistic aggregation and integration of standardized data with corresponding weights derived by AHP, which can emphasize historical trends for risk assessment. Machine learning techniques, such as random forest, artificial neural network, and support vector machines, handle nonlinear relationships effectively. At the same time, non-parametric decision tree-based methods like classification and regression trees (CART) are used for data-driven predictions from learned patterns and relationships [14,15,16,17,18,19,20,21,22]. Despite that, the FFPI is a powerful predictive tool for flash flood forecasting, especially with implementation in mountainous or steep terrains where traditional hydrologic models may underperform. FFPI can be particularly useful in data-sparse regions with limited datasets and offers a more objective, precise, and computationally efficient approach to mapping flood susceptibility.

5. Conclusions

This study aims to assess flash flood potential across North Macedonia by conducting advanced geospatial analyses of key factors, including slope, soils, erodibility, land cover, and land use. This contribution enhances the current understanding of flood susceptibility at the national level. Utilizing the GEE web-based computational resources, its remote sensing tools, and geospatial datasets, the study identifies areas most susceptible to flash floods, providing valuable insights for assessing susceptibility and implementing flood risk reduction interventions. The FFPI values, due to their simplicity and ease of implementation, provide a robust framework for predicting and preventing flash floods, especially in areas lacking detailed hydrological data. The model’s national application extends the relevance of flood management strategies, particularly in regions with steep slopes, low vegetation cover, and high erosion potential. On a broader scale, the results of this study are valuable for disaster risk management globally, offering a method that can be adapted for use in other regions facing similar challenges due to data scarcity.
Additionally, the scientific contribution of this study is significant, offering a prototype for nationwide flood predictions that could be adapted to other regions with similar challenges. The model has also been successfully hindcasted for historical flood events, bolstering confidence in its application for future hydrological research.
The study’s findings are essential for strengthening flood risk management in North Macedonia. Government institutions can utilize the results to enhance early warning systems, develop sustainable protection measures, and inform spatial planning and environmental policies. Also, the GEE collaboration space with a Google Cloud Project allows for sharing scripts and assets, repositories, and workflows among institutions that could effectively reduce the uncertainties in the model parameters and achieve better accuracy validation at the local level. The FFPI model enables targeted interventions in high-risk areas and supports proactive management in regions vulnerable to future land use and climate changes. Tailored strategies that consider both natural and anthropogenic factors are crucial for effective, region-specific flood mitigation.
The findings of this study have important implications for flood risk management in North Macedonia. By identifying highly susceptible catchments, the study emphasizes the need for targeted interventions and region-specific strategies. It emphasizes the influence of land use changes and climate variability on flash flood occurrence, calling for adaptive and dynamic management approaches. Key recommended measures include installing real-time monitoring systems with IoT sensors, developing early warning systems, and improving urban drainage infrastructure, as exemplified by the 2016 Skopje flood event. The enforcement of strict land use regulations and the promotion of afforestation and reforestation are also essential for reducing runoff and erosion. Public awareness campaigns and community-based initiatives are encouraged to strengthen local preparedness. Additionally, integrating climate projections into planning and fostering institutional collaboration will enhance flood resilience. Several of these measures align with the Spatial Plan of North Macedonia [95], providing a pathway toward more effective disaster risk reduction.
Nevertheless, the study acknowledges certain limitations. While the FFPI model offers valuable insights, its predictive capability can be enhanced by integrating temporal datasets, near-real-time rainfall estimates, weather forecast data (i.e., the NOAA Global Forecast System (GFS) model developed by the National Centers for Environmental Prediction (NCEP)), climate projections, and land use changes. As FFPI relies on static physiographic factors, it does not reflect the dynamic nature of flood risk. Future studies should incorporate hydrodynamic models (e.g., HEC-RAS), more precise soil data using GEE cloud algorithms, discharge per catchment, and real-time rainfall monitoring to refine flood-prone area identification. This dynamic approach will enhance flash flood risk assessments, particularly in the context of climate variability [104]. Additionally, considering socioeconomic factors will contribute to more comprehensive and context-sensitive flood risk analyses, supporting more effective disaster preparedness and management.

Author Contributions

Conceptualization, I.M. and B.A.; methodology, I.M. and B.A.; software, I.M.; validation, I.M.; formal analysis, I.M., B.A., A.V. and P.G.; investigation, I.M. and B.A.; resources, I.M.; data curation, I.M. and B.A.; writing—original draft preparation, B.A.; writing—review and editing, I.M., B.A., A.V. and P.G.; visualization, I.M.; supervision, B.A. and P.G. All authors have read and agreed to the published version of the manuscript.

Funding

This research received no external funding.

Institutional Review Board Statement

Not applicable.

Informed Consent Statement

Not applicable.

Data Availability Statement

The original contributions presented in this study are included in the article. Further inquiries can be directed to the corresponding author.

Acknowledgments

The authors acknowledge the use of Grammarly Premium in the process of translating and improving the clarity and quality of the English language in this manuscript. The authors are grateful to the reviewers whose comments and suggestions greatly improved the manuscript.

Conflicts of Interest

The authors declare no conflicts of interest.

References

  1. Blöschl, G.; Hall, J.; Viglione, A.; Perdigão, R.A.P.; Parajka, J.; Merz, B.; Lun, D.; Arheimer, B.; Aronica, G.T.; Bilibashi, A.; et al. Changing Climate Both Increases and Decreases European River Floods. Nature 2019, 573, 108–111. [Google Scholar] [CrossRef]
  2. Didovets, I.; Krysanova, V.; Bürger, G.; Snizhko, S.; Balabukh, V.; Bronstert, A. Climate Change Impact on Regional Floods in the Carpathian Region. J. Hydrol. Reg. Stud. 2019, 22, 100590. [Google Scholar] [CrossRef]
  3. Dobler, C.; Bürger, G.; Stötter, J. Assessment of Climate Change Impacts on Flood Hazard Potential in the Alpine Lech Water-shed. J. Hydrol. 2012, 460, 29–39. [Google Scholar] [CrossRef]
  4. Kane, S.; Shogren, J.F. Linking Adaptation and Mitigation in Climate Change Policy. Clim. Change 2000, 45, 75–102. [Google Scholar] [CrossRef]
  5. Moragoda, N.; Cohen, S. Climate-Induced Trends in Global Riverine Water Discharge and Suspended Sediment Dynamics in the 21st Century. Glob. Planet. Change 2020, 191, 103199. [Google Scholar] [CrossRef]
  6. Archer, D.R.; Leesch, F.; Harwood, K. Learning from the Extreme River Tyne Flood in January 2005. Water Environ. J. 2006, 21, 133–141. [Google Scholar] [CrossRef]
  7. Borga, M.; Boscolo, P.; Zanon, F.; Sangati, M. Hydrometeorological Analysis of the 29 August 2003 Flash Flood in the Eastern Italian Alps. J. Hydrometeorol. 2007, 8, 1049–1067. [Google Scholar] [CrossRef]
  8. Termeh, S.V.R.; Kornejady, A.; Pourghasemi, H.R.; Keesstra, S. Flood Susceptibility Mapping Using Novel Ensembles of Adaptive Neuro Fuzzy Inference System and Metaheuristic Algorithms. Sci. Total Environ. 2018, 615, 438–451. [Google Scholar] [CrossRef]
  9. Salhotra, Y.Z.; Walker, M. What We Know About the Floods in Central Texas. The New York Times, 20 July 2025. Available online: https://www.nytimes.com/article/texas-floods-kerr-county.html (accessed on 22 July 2025).
  10. European Centre for Medium-Range Weather Forecasts. Storm Boris and European Flooding September 2024; ECMWF: Reading, UK, 2024; Available online: https://www.ecmwf.int/en/about/media-centre/focus/2024/storm-boris-and-european-flooding-september-2024 (accessed on 23 July 2025).
  11. Barredo, J.I. Major Flood Disasters in Europe: 1950–2005. Nat. Hazards 2007, 42, 125–148. [Google Scholar] [CrossRef]
  12. Gaume, E.; Bain, V.; Bernardara, P.; Newinger, O.; Barbuc, M.; Bateman, A.; Blaškovičová, L.; Blöschl, G.; Borga, M.; Dumitrescu, A.; et al. A Collation of Data on European Flash Floods. J. Hydrol. 2009, 367, 70–78. [Google Scholar] [CrossRef]
  13. Costache, R. Flash-Flood Potential Assessment in the Upper and Middle Sector of Prahova River Catchment (Romania): A Comparative Approach between Four Hybrid Models. Sci. Total Environ. 2019, 659, 1115–1134. [Google Scholar] [CrossRef]
  14. Hong, H.; Tsangaratos, P.; Ilia, I.; Liu, J.; Zhu, A.-X.; Chen, W. Application of Fuzzy Weight of Evidence and Data Mining Tech-niques in Construction of Flood Susceptibility Map of Poyang County, China. Sci. Total Environ. 2018, 625, 575–588. [Google Scholar] [CrossRef] [PubMed]
  15. Jacinto, R.; Grosso, N.; Reis, E.; Dias, L.; Santos, F.D.; Garrett, P. Continental Portuguese Territory Flood Susceptibility Index: Contribution to a Susceptibility Index. Nat. Hazards Earth Syst. Sci. 2015, 15, 1907–1919. [Google Scholar] [CrossRef]
  16. Carpenter, T.; Sperfslage, J.; Georgakakos, K.; Sweeney, T.; Fread, D. National Threshold Runoff Estimation Utilizing GIS in Support of Operational Flash Flood Warning Systems. J. Hydrol. 1999, 224, 21–44. [Google Scholar] [CrossRef]
  17. Stefanidis, S.; Stathis, D. Assessment of Flood Hazard Based on Natural and Anthropogenic Factors Using Analytic Hierarchy Process (AHP). Nat. Hazards 2013, 68, 569–585. [Google Scholar] [CrossRef]
  18. Costache, R. Flood Susceptibility Assessment by Using Bivariate Statistics and Machine Learning Models—A Useful Tool for Flood Risk Management. Water Resour. Manag. 2019, 33, 3239–3256. [Google Scholar] [CrossRef]
  19. Youssef, A.M.; Pradhan, B.; Sefry, S.A. Flash Flood Susceptibility Assessment in Jeddah City (Kingdom of Saudi Arabia) Using Bivariate and Multivariate Statistical Models. Environ. Earth Sci. 2016, 75, 12. [Google Scholar] [CrossRef]
  20. Mudashiru, R.B.; Sabtu, N.; Abustan, I.; Balogun, W. Flood Hazard Mapping Methods: A Review. J. Hydrol. 2021, 603 Pt A, 126846. [Google Scholar] [CrossRef]
  21. Ajjur, S.B.; Mogheir, Y.K. Flood Hazard Mapping Using a Multi-Criteria Decision Analysis and GIS (Case Study Gaza Governorate, Palestine). Arab. J. Geosci. 2020, 13, 44. [Google Scholar] [CrossRef]
  22. Popa, M.C.; Peptenatu, D.; Draghici, C.; Diaconu, D.C. Flood Hazard Mapping Using the Flood and Flash-Flood Potential Index in the Buzău River Catchment, Romania. Water 2019, 11, 2116. [Google Scholar] [CrossRef]
  23. Marchi, L.; Borga, M.; Preciso, E.; Gaume, E. Characterisation of Selected Extreme Flash Floods in Europe and Implications for Flood Risk Management. J. Hydrol. 2010, 394, 118–133. [Google Scholar] [CrossRef]
  24. Costache, R.; Pham, Q.B.; Sharifi, E.; Linh, N.T.T.; Abba, S.; Vojtek, M.; Vojteková, J.; Nhi, P.T.T.; Khoi, D.N. Flash-Flood Susceptibility Assessment Using Multi-Criteria Decision Making and Machine Learning Supported by Remote Sensing and GIS Techniques. Remote Sens. 2019, 12, 106. [Google Scholar] [CrossRef]
  25. Aleksova, B.; Milevski, I.; Mijalov, R.; Marković, S.B.; Cvetković, V.M.; Lukić, T. Assessing Risk-Prone Areas in the Kratovska Reka Catchment (North Macedonia) by Integrating Advanced Geospatial Analytics and Flash Flood Potential Index. Open Geosci. 2024, 16, 20220684. [Google Scholar] [CrossRef]
  26. Milevski, I. Natural Hazards in the Republic of Macedonia with Special Emphasis on Flood and Earthquake in Skopje. Geogr. Rev. 2017, 50, 2016. Available online: https://igeografija.mk/reviews/wp-content/uploads/2022/01/GR50-05_NATURAL_HAZARDS_IN.pdf (accessed on 10 March 2025).
  27. Dragičević, S.; Filipović, D. Natural Conditions and Disasters in Planning to Protect Space, 2nd ed.; University of Belgrade—Faculty of Geography: Belgrade, Serbia, 2016. (In Serbian) [Google Scholar]
  28. Gavrilović, L.J. Floods in SR Serbia in the 20th Century—Causes and Consequences; Spec. Issue SGD 1981, No. 52; Serbian Geographical Society: Belgrade, Serbia, 1981. (In Serbian) [Google Scholar]
  29. Petrović, A. Flash Floods in Serbia; Spec. Editions SGD 2021, No. 73.; Serbian Geographical Society: Belgrade, Serbia, 2021; ISBN 978-86-82751-62-5. (In Serbian) [Google Scholar]
  30. Jovanović, D. Application of the Flash Flood Potential Index in Torrential Floods Risk Assessment (FFPI): A Case Study of Svilajnac Municipality. Proc. Fac. Geogr. Univ. Belgrade 2023, 71, 65–78. [Google Scholar] [CrossRef]
  31. Trobec, T. Spatio-Temporal Distribution of Flash Floods in Slovenia. Dela 2016, 46, 5–20. [Google Scholar] [CrossRef]
  32. Durlević, U.; Novković, I.; Lukić, T.; Valjarević, A.; Samardžić, I.; Krstić, F.; Batoćanin, N.; Mijatov, M.; Ćurić, V. Multi-Hazard Susceptibility Assessment: A Case Study—Municipality of Štrpce (Southern Serbia). Open Geosci. 2021, 13, 1414–1431. [Google Scholar] [CrossRef]
  33. Dragičević, S.; Kostadinov, S.; Novković, I.; Momirović, N.; Langović, M.; Stefanović, T.; Radović, M.; Tošić, R. Assessment of Soil Erosion and Torrential Flood Susceptibility: Case Study—Timok River Basin, Serbia. In The Lower Danube River, Hydro-Environmental Issues and Sustainability; Springer: Berlin, Germany, 2022; Chapter 12. [Google Scholar] [CrossRef]
  34. Lazarević, K.; Todosijević, M.; Vulević, T.; Polovina, S.; Momirović, N.; Caković, M. Determination of Flash Flood Hazard Areas in the Likodra Watershed. Water 2023, 15, 2698. [Google Scholar] [CrossRef]
  35. Krvavica, N.; Šiljeg, A.; Horvat, B.; Panđa, L. Pluvial Flash Flood Hazard and Risk Mapping in Croatia: Case Study in the Gospić Catchment. Sustainability 2023, 15, 1197. [Google Scholar] [CrossRef]
  36. Milevski, I.; Dragičević, S.; Radevski, I. GIS and Remote Sensing Based Natural Hazard Modelling of Kriva River Catchment, Republic of Macedonia. Z. Geomorphol. Suppl. 2017, 61, 213–228. [Google Scholar] [CrossRef]
  37. Aleksova, B.; Lukić, T.; Milevski, I.; Spalević, V.; Marković, S.B. Modelling Water Erosion and Mass Movements (Wet) by Using GIS-Based Multi-Hazard Susceptibility Assessment Approaches: A Case Study—Kratovska Reka Catchment (North Macedonia). Atmosphere 2023, 14, 1139. [Google Scholar] [CrossRef]
  38. Aleksova, B.; Lukić, T.; Milevski, I.; Puhar, D.; Marković, S.B. Preliminary Assessment of Geohazards’ Impacts on Geodiversity in the Kratovska Reka Catchment (North Macedonia). Geosciences 2024, 14, 62. [Google Scholar] [CrossRef]
  39. Aleksova, B.; Milevski, I.; Dragićević, S.; Lukić, T. GIS-Based Integrated Multi-Hazard Susceptibility Assessment in Makedonska Kamenica Municipality, North Macedonia. Atmosphere 2024, 15, 774. [Google Scholar] [CrossRef]
  40. Shawaqfah, M.; Almomani, F.; Khatatbeh, A.A. Mapping Flash Flood Potential and Risk Level Using GIS Techniques and the Flash Flood Potential Index (FFPI) in Amman Zarqa Basin of Jordan. Jordan J. Eng. Chem. Ind. 2020, 3, 81–90. [Google Scholar] [CrossRef]
  41. Sabljić, L.; Lukić, T.; Bajić, D.; Marković, S.B.; Spalevic, V.; Cvetković, V.M.; Delić, D.; Adžić, D.; Aleksova, B.; Milevski, I.; et al. Spatio-temporal analysis of flood events using GIS and remote sensing-based approach in the Ukrina River Basin, Bosnia and Herzegovina. Open Geosci. 2025, 17, 20250856. [Google Scholar] [CrossRef]
  42. Tamiminia, H.; Salehi, B.; Mahdianpari, M.; Quackenbush, L.; Adeli, S.; Brisco, B. Google Earth Engine for geo-big data applications: A meta-analysis and systematic review. ISPRS J. Photogramm. Remote Sens. 2020, 164, 152–170. [Google Scholar] [CrossRef]
  43. Khosravi, K.; Shahabi, H.; Pham, B.T.; Adamowski, J.; Shirzadi, A.; Pradhan, B.; Dou, J.; Ly, H.B.; Gróf, G.; Ho, H.L.; et al. A comparative assessment of flood susceptibility modeling using multi-criteria decision-making analysis and machine learning methods. J. Hydrol. 2019, 573, 311–323. [Google Scholar] [CrossRef]
  44. Costache, R.; Pham, Q.B.; Avand, M.; Linh, N.T.T.; Vojtek, M.; Vojteková, J.; Lee, S.; Khoi, D.N.; Nhi, P.T.T.; Dung, T.D. Novel hybrid models between bivariate statistics, artificial neural networks and boosting algorithms for flood susceptibility assessment. J. Environ. Manag. 2020, 265, 110485. [Google Scholar] [CrossRef] [PubMed]
  45. Luu, C.; Pham, B.T.; Phong, T.V.; Costache, R.; Nguyen, H.D.; Amiri, M.; Bui, Q.D.; Nguyen, L.T.; Le, H.V.; Prakash, I.; et al. GIS-based ensemble computational models for flood susceptibility prediction in the Quang Binh Province, Vietnam. J. Hydrol. 2021, 599, 126500. [Google Scholar] [CrossRef]
  46. Johary, R.; Révillion, C.; Catry, T.; Alexandre, C.; Mouquet, P.; Rakotoniaina, S.; Pennober, G.; Rakotondraompiana, S. Detection of Large-Scale Floods Using Google Earth Engine and Google Colab. Remote Sens. 2023, 15, 5368. [Google Scholar] [CrossRef]
  47. Halder, S.; Bose, S. Sustainable flood hazard mapping with GLOF: A Google Earth Engine approach. Nat. Hazards Res. 2024, 4, 573–578. [Google Scholar] [CrossRef]
  48. SELLAMI, E.M.; Rhinane, H. Google Earth Engine and Machine Learning for Flash Flood Exposure Mapping—Case Study: Tetouan, Morocco. Geosciences 2024, 14, 152. [Google Scholar] [CrossRef]
  49. Rahman, M.M.; Islam, M.A. Identifying the effect of monsoon floods on vegetation and land surface temperature by using Google Earth Engine. Environ. Monit. Assess 2023, 195, 834. [Google Scholar]
  50. Rahmati, O.; Pourghasemi, H.R.; Zeinivand, H. Flood susceptibility mapping using frequency ratio and weights-of-evidence models in the Golastan Province, Iran. Geocarto Int. 2016, 31, 42–70. [Google Scholar] [CrossRef]
  51. Kumar Samanta, R.; Bhunia, G.; Shit, P.; Pourghasemi, H.R. Flood susceptibility mapping using geospatial frequency ratio technique: A case study of Subarnarekha River Basin, India. Model. Earth Syst. Environ. 2018, 4, 395–408. [Google Scholar] [CrossRef]
  52. Gaume, E.; Borga, M. Post-flood field investigations in upland catchments after major flash floods: Proposal of a methodology and illustrations. J. Flood Risk Manag. 2008, 1, 175–189. [Google Scholar] [CrossRef]
  53. Giustarini, L.; Chini, M.; Hostache, R.; Pappenberger, F.; Matgen, P. Flood hazard mapping combining hydrodynamic modeling and multi-annual remote sensing data. Remote Sens. 2015, 7, 14200–14226. [Google Scholar] [CrossRef]
  54. Gigović, L.; Pamučar, D.; Bajić, Z.; Drobnjak, S. Application of GIS-interval rough AHP methodology for flood hazard mapping in urban areas. Water 2017, 9, 360. [Google Scholar] [CrossRef]
  55. Petroselli, A.; Vojtek, M.; Vojteková, J. Flood mapping in small ungauged basins: A comparison of different approaches for two case studies in Slovakia. Hydrol. Res. 2019, 50, 379–392. [Google Scholar] [CrossRef]
  56. Stefanidis, S.; Alexandridis, V.; Theodoridou, T. Flood exposure of residential areas and infrastructure in Greece. Hydrology 2022, 9, 145. [Google Scholar] [CrossRef]
  57. Osmanaj, L.; Milevski, I.; Aleksova, B. Integrated Rainfall Modeling and Hydrometeorological Alert System for Extreme Flooding in Kosovo. Preprints 2025, 2025, 071507. [Google Scholar] [CrossRef]
  58. Popescu, N.-C.; Bărbulescu, A. Flood hazard evaluation using a flood potential index. Water 2023, 15, 3533. [Google Scholar] [CrossRef]
  59. Kocsis, I.; Bilașco, Ș.; Irimuș, I.-A.; Dohotar, V.; Rusu, R.; Roșca, S. Flash flood vulnerability mapping based on FFPI using GIS spatial analysis: Case study: Valea Rea catchment area, Romania. Sensors 2022, 22, 3573. [Google Scholar] [CrossRef]
  60. Zaharia, L.; Costache, R.; Prăvălie, R.; Nițu, R.; Patriche, C.V.; Dobre, R. Mapping flood and flooding potential indices: A methodological approach to identifying areas susceptible to flood and flooding risk. Case study: The Prahova catchment (Romania). Front. Earth Sci. 2017, 11, 229–247. [Google Scholar] [CrossRef]
  61. Milevski, I.; Radevski, I.; Dimitrovska, O.; Gorin, S. Digital Model of the Mean Annual Temperature and Precipitation of the Republic of Macedonia. Geogr. Rev. 2015, 48, 33–38. Available online: https://igeografija.mk/reviews/wp-content/uploads/2022/01/GR48-Climate-models_Ivica_Milevski.pdf (accessed on 10 March 2025).
  62. Federal Geological Survey of SFRY. Interpreter of the Basic Geological Map of Socialist Federal Republic of Yugoslavia 100k (Sheet 25 for SR Macedonia); Prof. Fund Fed. Geol. Surv. SFRY: Belgrade, Yugoslavia, 1963–1985. (In Macedonian)
  63. Milevski, I.; Radevski, I.; Dimitrovska, O.; Drogreška, K.; Gorin, S. Study for the Spatial Plan of the Republic of North Macedonia 2021–2040: Natural Characteristics; Tech. No. A90123; Ministry of Environment and Spatial Planning: Skopje, North Macedonia, 2023. [Google Scholar]
  64. Djordjević, M.; Trendafilov, A.; Jelić, D.; Georgievski, S.; Popovski, A. Erosion Map of the Republic of Macedonia—Textual Part; Water Development Institute: Skopje, North Macedonia, 1993. (In Macedonian) [Google Scholar]
  65. Jovanovski, M.; Milevski, I.; Papić, J.B.; Peševski, I.; Markoski, B. Landslides in the Republic of Macedonia Triggered by Extreme Events in 2010. In Geomorphological Impacts of Extreme Weather: Case Studies from Central and Eastern Europe; Denes, L., Ed.; Springer: Berlin, Germany, 2013; pp. 265–280. [Google Scholar] [CrossRef]
  66. Petrović, A.; Kostadinov, S.; Dragićević, S. The Inventory and Characterization of Torrential Flood Phenomenon in Serbia. Pol. J. Environ. Stud. 2014, 23, 823–830. [Google Scholar]
  67. Petrović, A.; Dragićević, S.; Radić, B.; Milanović Pešić, A. Historical Torrential Flood Events in the Kolubara River Basin. Nat. Hazards 2015, 79, 537–547. [Google Scholar] [CrossRef]
  68. Smith, G. Flash Flood Potential: Determining the Hydrologic Response of FFMP Basins to Heavy Rain by Analyzing Their Physiographic Characteristics. 2003. Available online: https://www.cbrfc.noaa.gov/papers/ffp_wpap.pdf (accessed on 29 May 2024).
  69. Prăvălie, R.; Costache, R. The Analysis of the Susceptibility of the Flash-Floods’ Genesis in the Area of the Hydrographical Basin of Basca Chiojdului River. Forum Geogr. 2014, 13, 39–49. [Google Scholar] [CrossRef]
  70. Ristić, R.; Radić, B.; Vasiljević, N. Characteristics of Maximal Discharges on Torrential Watersheds in Serbia. Bull. Serbian Geogr. Soc. 2009, 89, 161–189. [Google Scholar] [CrossRef]
  71. Minea, G.; Iliescu, M.; Dedu, F. Temporal Rainfall Properties at Events Scale in the Curvature Subcarpathians (Romania). Forum Geogr. 2016, 15, 115–123. [Google Scholar] [CrossRef]
  72. Kostadinov, S.; Dragićević, S.; Stefanović, T.; Novković, I.; Petrović, A.M. Torrential Flood Prevention in the Kolubara River Basin. J. Mt. Sci. 2017, 14, 2230–2245. [Google Scholar] [CrossRef]
  73. Zogg, J.; Deitsch, K. The Flash Flood Potential Index at WFO Des Moines, Iowa. 2013. Available online: https://www.weather.gov/media/lmrfc/tech/2016_Vulnerability_Component_FFPI.pdf (accessed on 10 March 2025).
  74. Brewster, J. Development of the Flash Flood Potential Index. 2009. Available online: http://bgmresearch.eas.cornell.edu/research/ERFFW/abstracts/brewster_development_of_the_flash_flood_potent.pdf (accessed on 5 March 2025).
  75. Kruzdlo, R. Flash Flood Potential Index for the Mount Holly Hydrologic Service Area. 2010. Available online: https://www.nj.gov/drbc/library/documents/Flood_Website/flood-warning/user-forums/Krudzlo_NWS.pdf (accessed on 10 March 2025).
  76. Ceru, J. Flash Flood Potential Index (FFPI) for Pennsylvania. In Proceedings of the ESRI Federal GIS Conference, Washington, DC, USA, 22–24 February 2012; Available online: https://proceedings.esri.com/library/userconf/feduc12/papers/user/joeceru.pdf (accessed on 10 March 2025).
  77. Arachchige, R.; Perera, D.J. Mapping Flash Flood Potential Using GIS and the Flash Flood Potential Index (FFPI) in the Turtle River and Forest River Watersheds in North Dakota. Master’s Thesis, University of North Dakota, Grand Forks, ND, USA, 2015. [Google Scholar]
  78. European Space Agency. Copernicus GLO-30 Digital Elevation Model; OpenTopography: San Diego, CA, USA, 2020. [Google Scholar]
  79. European Space Agency. ESA WorldCover 10 m 2021 v100; ESA WorldCover Consortium: Mol, Belgium, 2021. [Google Scholar]
  80. Panagos, P.; Borrelli, P.; Meusburger, K.; van der Zanden, E.H.; Poesen, J.; Alewell, C. Modelling the Effect of Support Practices (P-Factor) on the Reduction of Soil Erosion by Water at European Scale. Environ. Sci. Policy 2015, 51, 23–34. [Google Scholar] [CrossRef]
  81. Zanaga, D.; Van De Kerchove, R.; De Keersmaecker, W.; Souverijns, N.; Brockmann, C.; Quast, R.; Wevers, J.; Grosu, A.; Paccini, A.; Vergnaud, S.; et al. ESA WorldCover 10 m 2020 v100; ESA WorldCover Consortium: Mol, Belgium, 2021. [Google Scholar] [CrossRef]
  82. Poggio, L.; de Sousa, L.M.; Batjes, N.H.; Heuvelink, G.B.M.; Kempen, B.; Ribeiro, E.; Rossiter, D. SoilGrids 2.0: Producing Soil Information for the Globe with Quantified Spatial Uncertainty. SOIL 2021, 7, 217–240. [Google Scholar] [CrossRef]
  83. Wischmeier, W.H.; Smith, D.D. Predicting Rainfall Erosion Losses, A Guide to Conservation Planning; USDA Agricultural Handbook No. 537; U.S. Department of Agriculture: Beltsville, ML, USA, 1978. Available online: https://www.ars.usda.gov/ARSUserFiles/60600505/RUSLE/AH_537%20Predicting%20Rainfall%20Soil%20Losses.pdf (accessed on 15 March 2025).
  84. United States Geological Survey. Sentinel-2 Data Products. 2024. Available online: https://www.usgs.gov/centers/eros/science/usgs-eros-archive-sentinel-2 (accessed on 10 April 2025).
  85. Milevski, I.; Aleksova, B.; Lukić, T.; Dragićević, S.; Valjarević, A. Multi-Hazard Modeling of Erosion and Landslide Susceptibility at the National Scale in the Example of North Macedonia. Open Geosci. 2024, 16, 20220718. [Google Scholar] [CrossRef]
  86. Gorelick, N.; Hancher, M.; Dixon, M.; Ilyushchenko, S.; Thau, D.; Moore, R. Google Earth Engine: Planetary-Scale Geospatial Analysis for Everyone. Remote Sens. Environ. 2017, 202, 18–27. [Google Scholar] [CrossRef]
  87. Zhao, J.; Du, D.; Chen, L.; Liang, X.; Chen, H.; Jin, Y. HA-Net for Bare Soil Extraction Using Optical Remote Sensing Images. Remote Sens. 2024, 16, 3088. [Google Scholar] [CrossRef]
  88. Renard, K.G.; Foster, G.R.; Weesies, G.A.; McCool, D.K.; Yoder, D.C. Predicting Soil Erosion by Water: A Guide to Conservation Planning with the Revised Universal Soil Loss Equation (RUSLE); Agriculture Handbook No. 703; U.S. Department of Agriculture: Washington, DC, USA, 1997. Available online: https://www.tucson.ars.ag.gov/unit/publications/PDFfiles/717.pdf (accessed on 20 May 2025).
  89. Smith, B.K.; Smith, J.A.; Baeck, M.L. Flash Flood–Producing Storm Properties in a Small Urban Watershed. J. Hydrometeorol. 2016, 17, 2631–2647. [Google Scholar] [CrossRef]
  90. Funk, C.; Peterson, P.; Landsfeld, M.; Pedreros, D.; Verdin, J.; Shukla, S.; Husak, G.; Rowland, J.; Harrison, L.; Hoell, A.; et al. The Climate Hazards Infrared Precipitation with Stations—A New Environmental Record for Monitoring Extremes. Sci. Data 2015, 2, 150066. [Google Scholar] [CrossRef]
  91. Hersbach, H.; Bell, B.; Berrisford, P.; Hirahara, S.; Horányi, A.; Muñoz-Sabater, J.; Nicolas, J.; Peubey, C.; Radu, R.; Schepers, D.; et al. The ERA5 global reanalysis. Q. J. R. Meteorol. Soc. 2020, 146, 1999–2049. [Google Scholar] [CrossRef]
  92. Huffman, G.J.; Bolvin, D.T.; Braithwaite, D.; Hsu, K.; Joyce, R.; Kidd, C.; Nelkin, E.J.; Sorooshian, S.; Tan, J.; Xie, P. NASA Global Precipitation Measurement (GPM) Integrated Multi-Satellite Retrievals for GPM (IMERG) Algorithm Theoretical Basis Document (ATBD), Version 06; National Aeronautics and Space Administration (NASA): Greenbelt, MD, USA, 2020. Available online: https://gpm.nasa.gov/sites/default/files/2020-05/IMERG_ATBD_V06.3.pdf (accessed on 27 May 2025).
  93. Merz, R.; Blöschl, G.; Parajka, J. Spatio-Temporal Variability of Event Runoff Coefficients. J. Hydrol. 2006, 331, 591–604. [Google Scholar] [CrossRef]
  94. Gjeshovska, V.; Taseski, G.; Ilioski, B. Heavy Rainfall in the R.N. Macedonia. Sci. J. Civ. Eng. 2021, 10, 19–30. [Google Scholar] [CrossRef]
  95. Dumova-Jovanovska, E.; Cvetovska, M.; Čurilov, S.; Milkova, K.; Bogoevska, S.; Jovanoska Mitrevska, M.; Donevska, K.; Gješovska, V.; Ilioski, B.; Jovanovski, M.; et al. Study for the Spatial Plan of the Republic of North Macedonia: Natural and Technical-Technological Disasters; Tech. No. A91923; Ministry of Environment and Spatial Planning: Skopje, North Macedonia, 2023. [Google Scholar]
  96. Vasileski, D.; Radevski, I. Analysis of High Waters on the Kriva Reka River, Macedonia. Acta Geogr. Slov. 2014, 54, 363–377. [Google Scholar] [CrossRef]
  97. Ministry of Environment and Spatial Planning. Fourth National Climate Change Action Plan; Ministry of Environment and Spatial Planning, GEF, UNDP: Skopje, North Macedonia, 2023. (In Macedonian) [Google Scholar]
  98. Milevski, I.; Dragićević, S.; Georgievska, A. GIS and RS-Based Modelling of Potential Natural Hazard Areas in Pehchevo Municipality, Republic of Macedonia. J. Geogr. Inst. Jovan Cvijić S0ASA 2012, 63, 95–107. [Google Scholar] [CrossRef]
  99. Popovska, C.; Gjeshovska, V.; Ivanoski, D. Floods in Upper Vardar River Basin, May 2006. In Proceedings of the International Conference on Water Observation and Information System for Decision Support BALWOIS, Ohrid, North Macedonia, 23–26 May 2006. [Google Scholar] [CrossRef]
  100. Popovska, C.; Jovanovski, M.; Sekovski, D. Build Back Better Approach to Recovery of Flood-Damaged Transport and Water Infrastructure. In Proceedings of the Water Management and Hydraulic Engineering, Skopje, North Macedonia, 5–7 September 2019. [Google Scholar]
  101. Hydrometeorological Service of the Republic of North Macedonia (UHMR). Annual Report 2023. Available online: https://uhmr.gov.mk/ (accessed on 23 July 2025).
  102. Popovska, C.; Gjeshovska, V. Water Balance Model for Susceptibility Assessment of Water Resources in Strumica River Basin. Irrig. Drain. Syst. Eng. 2014, 3, 1000127. [Google Scholar] [CrossRef]
  103. Djurdjevic, V. Report on Climate Change Projections and Changes in Climate Extremes for the Republic of North Macedonia. In Macedonia’s Fourth National Communication and Third Biennial Update Report on Climate Change under the UNFCCC; Ref. No. IC 44/2019; GEF and UNDP: Skopje, North Macedonia, 2020. [Google Scholar]
  104. Bertola, M.; Castellarin, A.; Viglione, A.; Valtancoli, E.; Blöschl, G. Frequency and Spatial Variability of European Record Floods. Water Resour. Res. 2024, 60, e2023WR036767. [Google Scholar] [CrossRef]
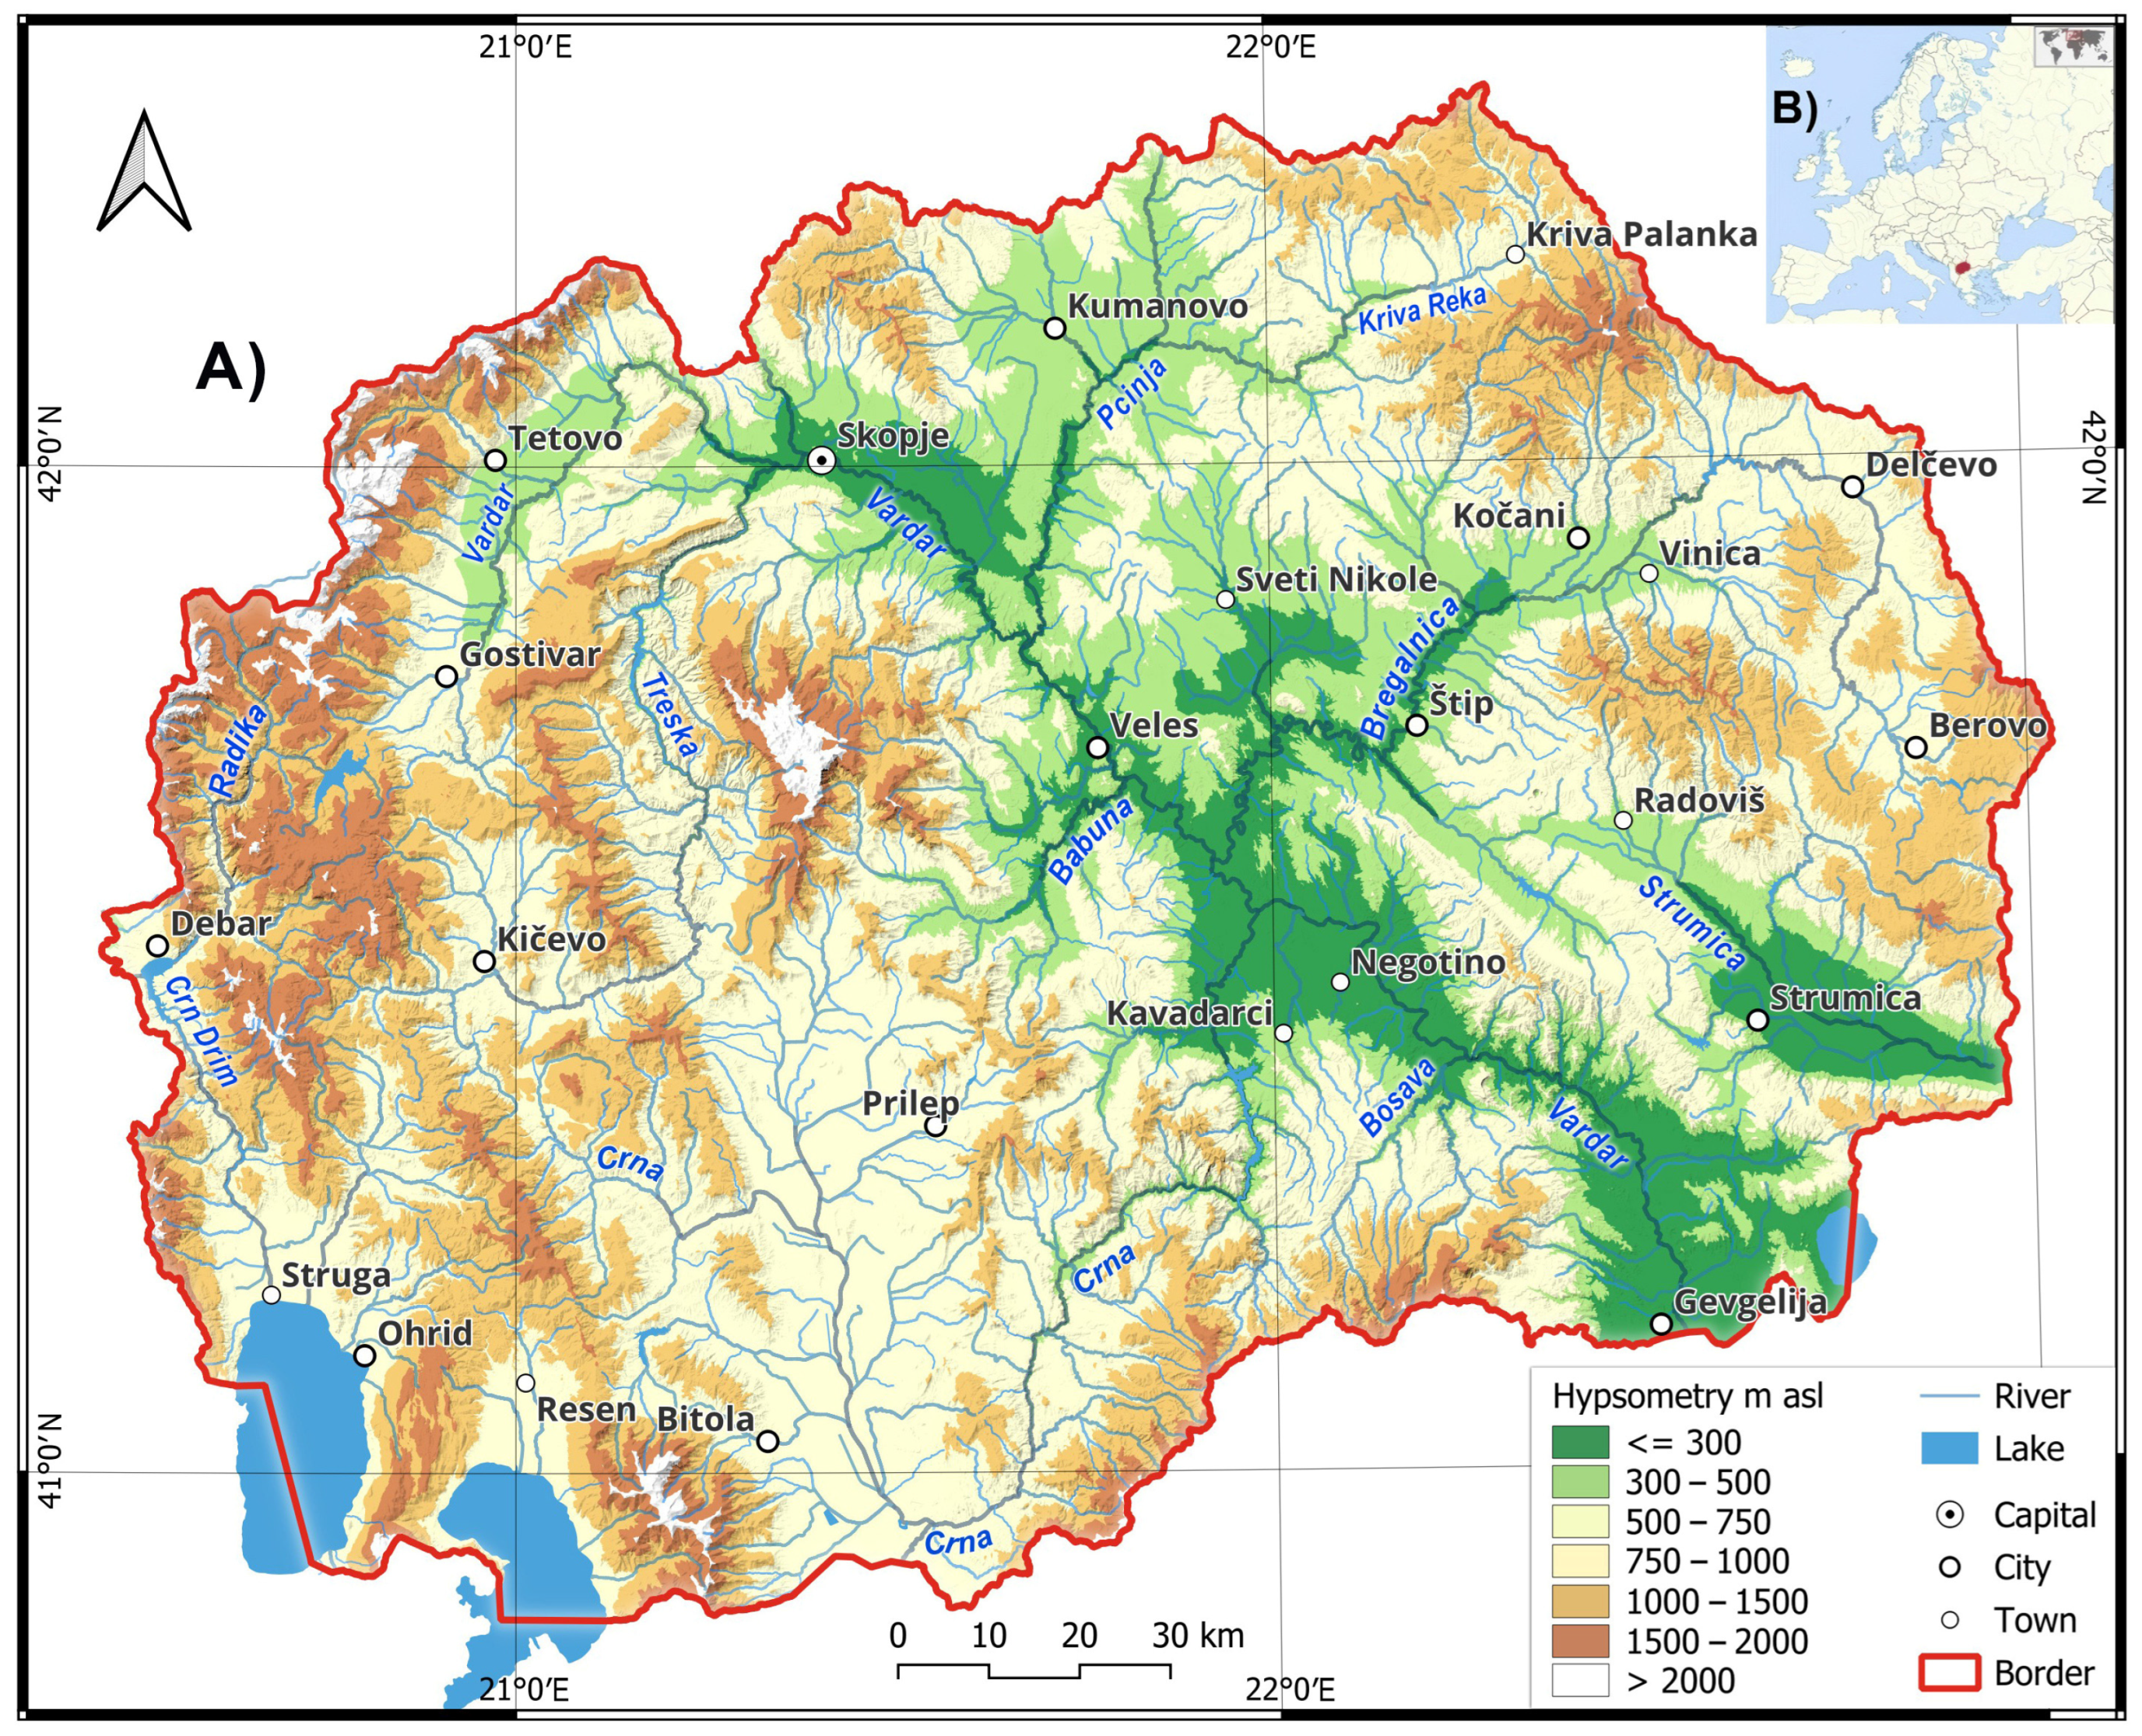
Figure 1. Physical geographical map of North Macedonia (A), and its location in Europe (B).
Atmosphere 16 00945 g001
Figure 2. The hydrographic network of North Macedonia, with the main catchments.
Atmosphere 16 00945 g002
Figure 3. Spatial distribution of key contributing factors used in the FFPI modeling for North Macedonia: (A) slope (M factor), derived from Copernicus GLO-30 DEM and classified from 1 (gentle slopes) to 10 (steep slopes); (B) soil texture (S factor), extracted from SoilGrids clay content layer, normalized from low (1–3) to high (8–10) flash flood susceptibility; (C) land cover (L factor), based on the ESA World Cover 2021 dataset and categorized according to runoff potential from vegetated (1–3) to impervious surfaces (8–10); (D) soil erodibility (E factor), based on K-factor from USLE where higher values (7–10) indicate sparse vegetation and elevated erosion risk.
Atmosphere 16 00945 g003
Figure 4. Map of FFPI (A) and average FFPI values at the catchment level (B) for North Macedonia.
Atmosphere 16 00945 g004
Figure 5. Model of the maximal 24 h precipitation (A) and runoff (B) in North Macedonia.
Atmosphere 16 00945 g005
Figure 6. Peak runoff (A) and discharge (B) on the catchment level in North Macedonia.
Atmosphere 16 00945 g006
Figure 7. Catchments with moderate to high and very high FFPI (A) and with peak discharge over 30 m3/s (B) vs. recorded floods in North Macedonia between 1960 and 2020 (blue/yellow dots).
Atmosphere 16 00945 g007
Table 1. Slope coefficient (M) for North Macedonia.
Coeff. MSlope %Area %
10–312.2
23–66.0
36–95.4
49–125.2
512–155.1
615–185.1
718–215.1
821–245.2
924–305.1
10>30%45.4
Table 2. Land use types (L) from ESA World Cover (2021) [81].
Land Use ClassesValueArea %
Tree cover148.7
Herbaceous wetland20.1
Shrubland31.3
Grassland532.5
Cropland613.5
Built-up81.8
Bare-sparse vegetation100.4
Permanent water bodies-1.7
Total 100.0
Table 3. Flash flood susceptibility distribution.
Flash Flood SusceptibilityValueArea
km2%
Very low2.8–4.52695.010.7
Low4.5–5.04438.517.6
Moderate5.0–5.56635.126.2
High5.5–6.05422.621.4
Very high6.0–9.26096.524.1
All FFPI2.8–9.225,287.7100.0
Lakes-425.31.7
Total country area 25,713100.0
Table 4. Catchment area by average FFPI value and natural breaks classification.
Area %Area km2No.ValuesClass
3.3834.51342.9–4.7Very low
14.33616.11964.7–5.1Low
36.99331.23185.1–5.4Moderate
25.16347.24465.4–5.8High
20.35133.43025.8–7.6Very high
10025,287.713962.9–7.6Total
1.7425.3- Water b.
10025,713 Country area
Table 5. Catchment classes according to the peak discharge during maximum daily rainfall.
Average Area (km2)Total Area (km2)No. of CatchmentsDischarge (m3/s−1)
1.6403.82970–10
17.8450440510–30
25.46412.633730–50
34.98819.326750–100
20.45148.190>100
10025,287.71396All
1.7425.3-Lakes
Table 6. Comparisons of the observed maximal discharge of 12 rivers in North Macedonia (1961–2020) and GEE-based calculation through the rational method.
CatchmentStationObserv. m3/sModel. m3/sArea km2Diff.
Bregalnica (up.)Berovo57.667.3102.01.17
Bregalnica (up.)Budinarci233.0208.2315.60.89
Bregalnica (up.)Očipale396.0382.075.00.96
Kamenička R.M.Kamenica86.186.2118.31.00
Orizarska R.Orizari97.892.4128.20.94
Kočanska R.Gradče62.271.2105.81.14
Zletovska R.Zletovo148.2152.1218.71.03
Lipkovska R.Kumanovo110.0126.8296.21.15
Kriva RekaTrnovac313.0346.3537.41.11
Radika R.Žirovnica262.0427.3375.21.63
Dvoriška R.Dvorište27.735.158.21.27
Radoviška R.Radoviš95.0110.269.61.16
Disclaimer/Publisher’s Note: The statements, opinions and data contained in all publications are solely those of the individual author(s) and contributor(s) and not of MDPI and/or the editor(s). MDPI and/or the editor(s) disclaim responsibility for any injury to people or property resulting from any ideas, methods, instructions or products referred to in the content.