Article

Optimizing Pedestrian-Friendly Spaces in Xi’an’s Residential Streets: Accounting for PM2.5 Exposure

College of Architecture, Chang’an University, Xi’an 710061, China
*
Author to whom correspondence should be addressed.
These authors contributed equally to this work.
Atmosphere 2025, 16(8), 947; https://doi.org/10.3390/atmos16080947
Submission received: 30 June 2025 / Revised: 23 July 2025 / Accepted: 31 July 2025 / Published: 7 August 2025
(This article belongs to the Special Issue Characteristics and Control of Particulate Matter)

Abstract

Urban street canyons in high-density areas exacerbate PM2.5 accumulation, posing significant public health risks. Through integrated empirical and computational methods—including empirical PM2.5 and microclimate measurements, multivariate regression analysis, and high-resolution ENVI-met5.1 simulations—this study quantifies the threshold effects of pedestrian-oriented morphological indicators on PM2.5 exposure in east–west-oriented residential streets. Key findings include the following: (1) the height-to-width ratio (H/W) negatively correlates with exposure, where H/W = 2.0 reduces the peak concentrations by 37–41% relative to H/W = 0.5 through enhanced vertical advection; (2) the Build-To-Line ratio (BTR) exhibits a positive correlation with exposure, with BTR = 63.2% mitigating exposure by 12–15% compared to BTR = 76.8% by reducing aerodynamic stagnation; (3) pollution exposure can be mitigated by enhancing airflow ventilation within street canyons through architectural facade design. These evidence-based morphological thresholds (H/W ≥ 1.5, BTR ≤ 70%) provide actionable strategies for reducing health risks in polluted urban corridors, supporting China to meet its national air quality improvement targets.

1. Introduction

Rapid industrialization and urbanization have resulted in severe air pollution across China, with fine particulate matter (PM2.5) representing a primary pollutant [1]. PM2.5 adsorbs substantial amounts of toxic compounds, penetrates deep into the respiratory system, and significantly compromises public health [2]. In 2016, the global PM2.5 pollution caused 4.1 million premature deaths, 1.1 million of which occurred in China [3]. PM2.5 exposure reflects the integrated pollution concentration, exposure duration, and activity intensity, with higher concentrations indicating elevated health risks. The existing evidence demonstrates that elevated PM2.5 levels exacerbate health impacts, reducing productivity, increasing the disease incidence, and inflating socioeconomic costs, thereby indirectly impairing the urban economic output. Consequently, reducing PM2.5 exposure is imperative for enhancing urban livability, safeguarding public health, and promoting sustainable socioeconomic development.
Streets serve as critical domains for addressing PM2.5 pollution while enhancing walkability. Urban planning research approaches walkability through multiple dimensions: quality of life enhancement [4], urban resilience and network structures [5], street environments and physical activity [6], spatial legibility and urban forms [7], and street network comparisons for urban classification [8]. Urban renewal studies primarily emphasize sustainable development [9]. As essential components of urban public spaces and primary venues for pedestrian activities, streets concurrently constitute major PM2.5 sources due to traffic emissions and resuspended dust [10,11,12,13]. Therefore, rational street design and pollution control are crucial for safeguarding public health and sustainable urban development.
The association between street configurations and PM2.5 concentrations in urban environments involves complex mechanisms, encompassing multidimensional factors such as the geometric morphology, traffic flow, canopy coverage, and building layout. These elements collectively influence pollutant dispersion and retention through interconnected pathways. Recent research has progressively deciphered these relationships: Li et al. [14] quantified the efficacy of green infrastructure typologies in mitigating PM2.5 dispersion along urban corridors using mobile sensing and ENVI-met microclimate modeling, demonstrating a significant exposure reduction for pedestrians. Liu et al. [15] integrated mobile monitoring with machine learning to analyze the sidewalk PM2.5 exposure, proposing evidence-based interventions including ventilation enhancement in walkways, traffic emission controls at the block scale, optimized spatial networks for pedestrian facilities, and real-time air quality broadcasting systems.
Grzędzicka [16] evaluated the existing urban greenery’s capacity to decrease the PM2.5, PM10, and CO2 concentrations via fixed-site monitoring and time-series regression, highlighting species- and size-dependent purification efficiencies. He et al. [17] employed computational fluid dynamics–discrete phase modeling (CFD-DPM) to simulate the PM2.5 dispersion patterns in humid urban blocks, revealing that while taller roadside trees enhance deposition, an excessive canopy density impedes the airflow and increases pedestrian exposure. Karale and Yuan [18] established spatial heterogeneity models using street-view imagery, identifying the building morphology as explaining 33.22% of the PM2.5 exposure variance.
Notably, studies linking walkability to PM2.5 remain limited. Liao et al. [19] revealed synergistic effects between the neighborhood walkability and greenness in reducing the cardiovascular mortality among high-risk populations, though elevated walkability in low-greenness areas paradoxically intensified the pollution hazards. Tong et al. [20] mapped microscale PM2.5 hotspots in walkable spaces to guide healthier route planning in dense cities, while James et al. [21] reported positive walkability–pollution correlations. Critically, whereas prior research established generalized walkability–pollution associations [21], this study uniquely quantifies the threshold effects of morphological indicators (H/W, BTR) on PM2.5 exposure within east–west street canyons under Xi’an-specific wind regimes, thereby addressing a gap in design-oriented mechanistic modeling.
The current research focuses predominantly on the street-level PM2.5 dispersion and walkability–space relationships, leaving the mechanistic connections between walkability indicators and PM2.5 exposure inadequately characterized. This study therefore employs an integrated methodology—combining field measurements, multivariate regression analysis, and ENVI-met simulations—to investigate residential streets in Xi’an with three objectives: (1) to elucidate the mechanisms of the relationship between pedestrian-oriented street indicators and PM2.5 exposure; (2) to develop spatial optimization strategies reducing exposure through indicator adjustments aimed at enhancing urban residents’ health; and (3) to formulate street management and planning strategies targeting air quality improvement. These strategies directly support China to meet the Healthy China 2030 initiative’s key environmental health target: increasing the annual proportion of days meeting air quality standards in prefecture-level cities. The findings provide scientific insights for green livable city construction while helping to meet national health governance goals.

2. Research Methods and PM2.5 Exposure Calculation

2.1. Environmental Characteristics of Xi’an City

2.1.1. Basic Characteristics of Xi’an City

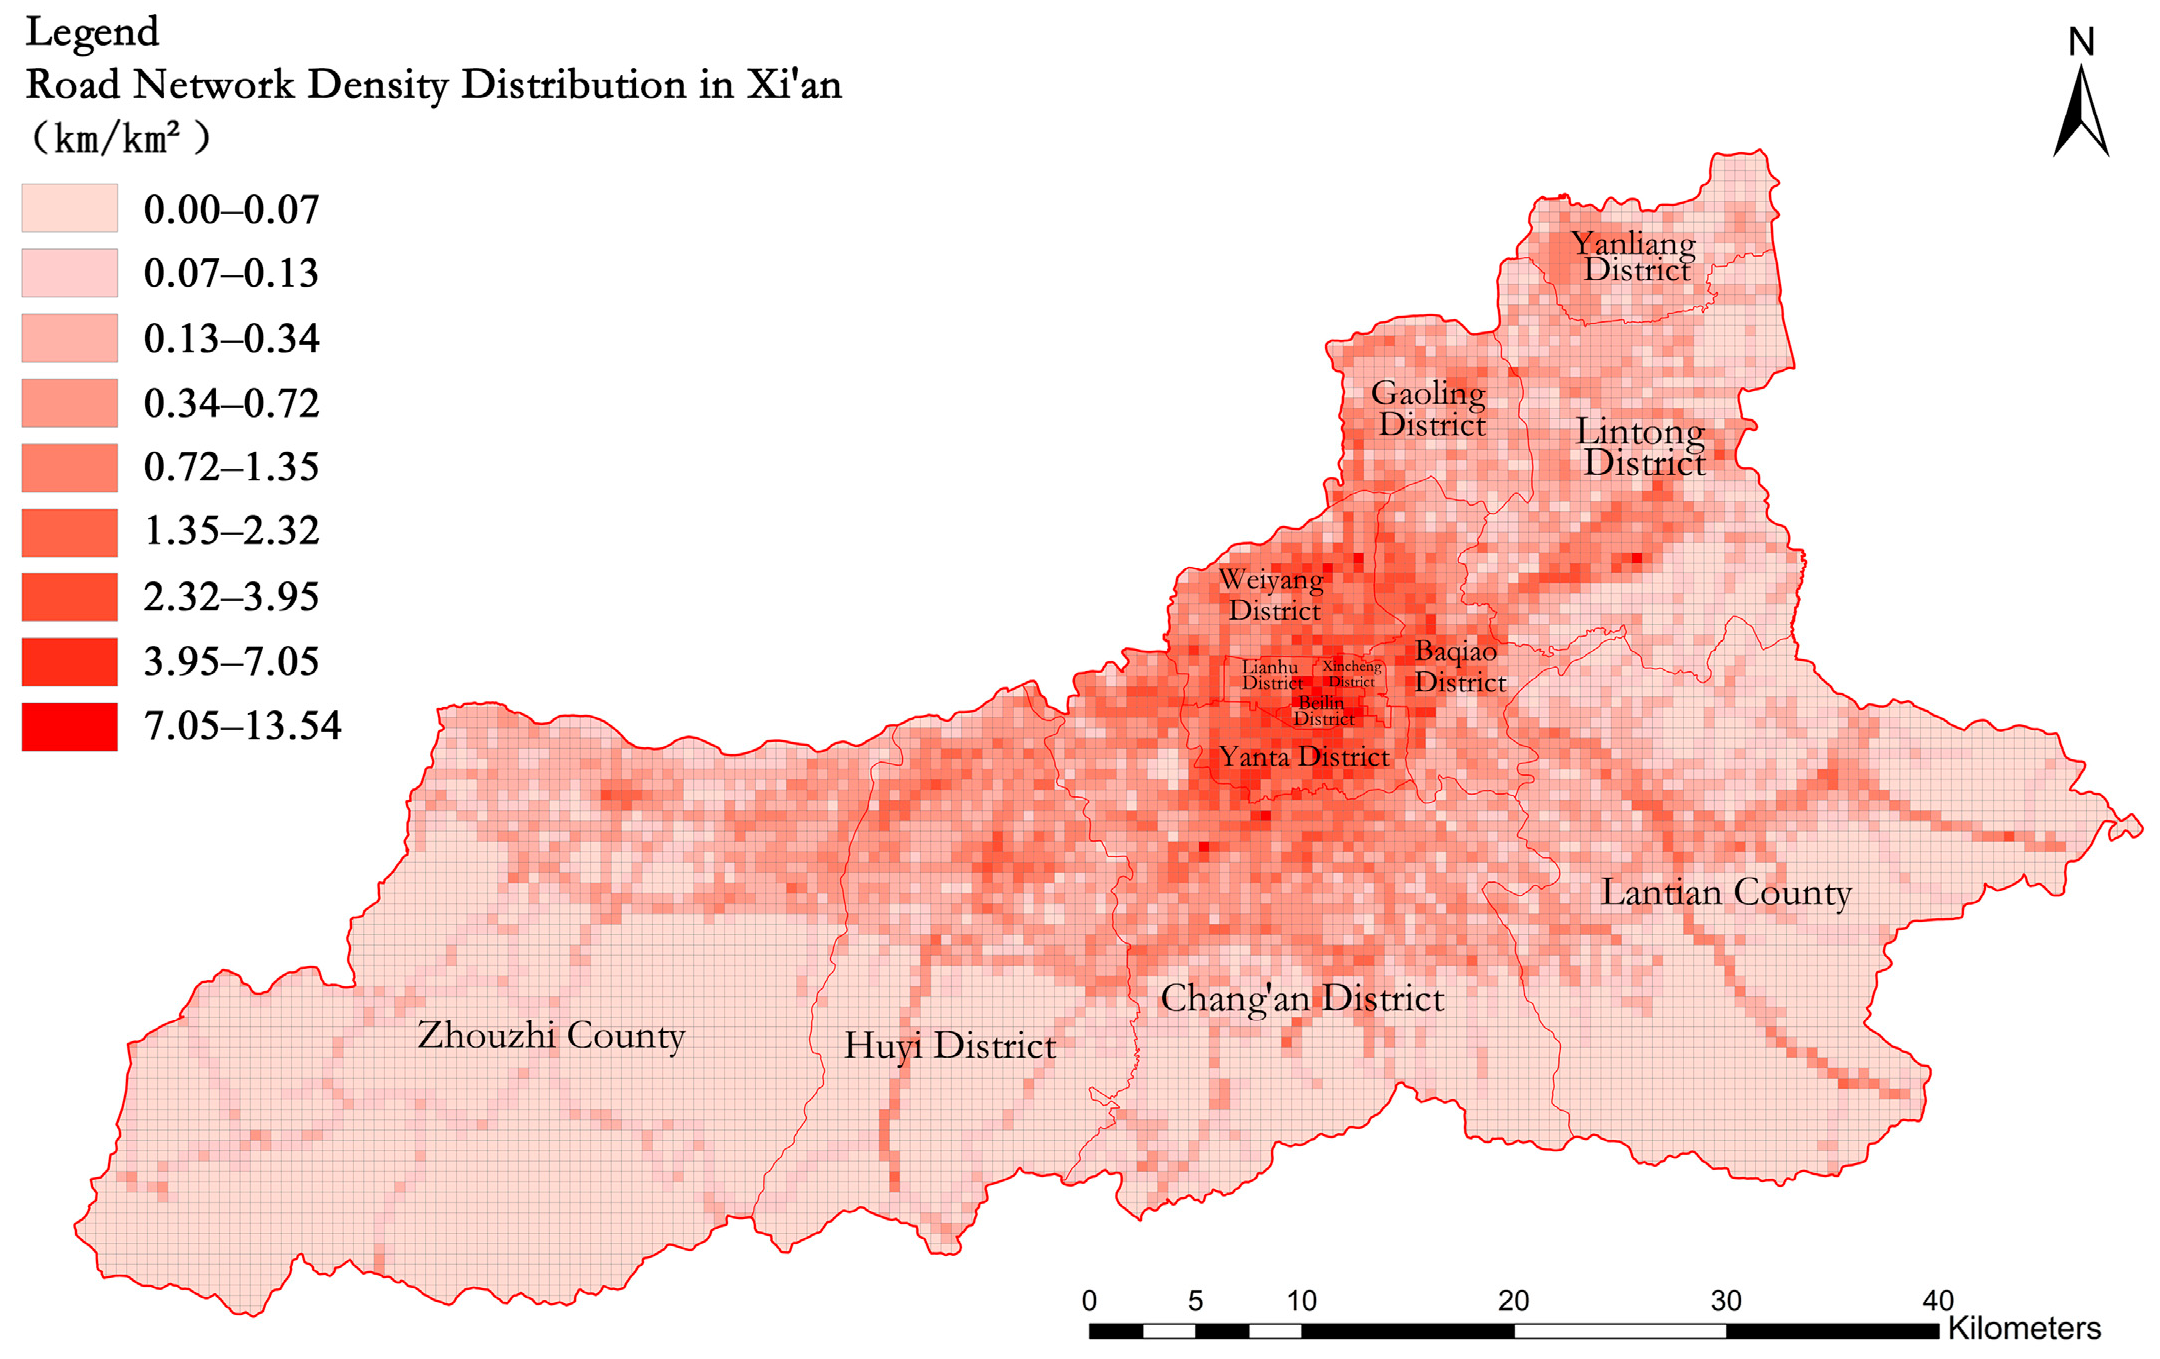
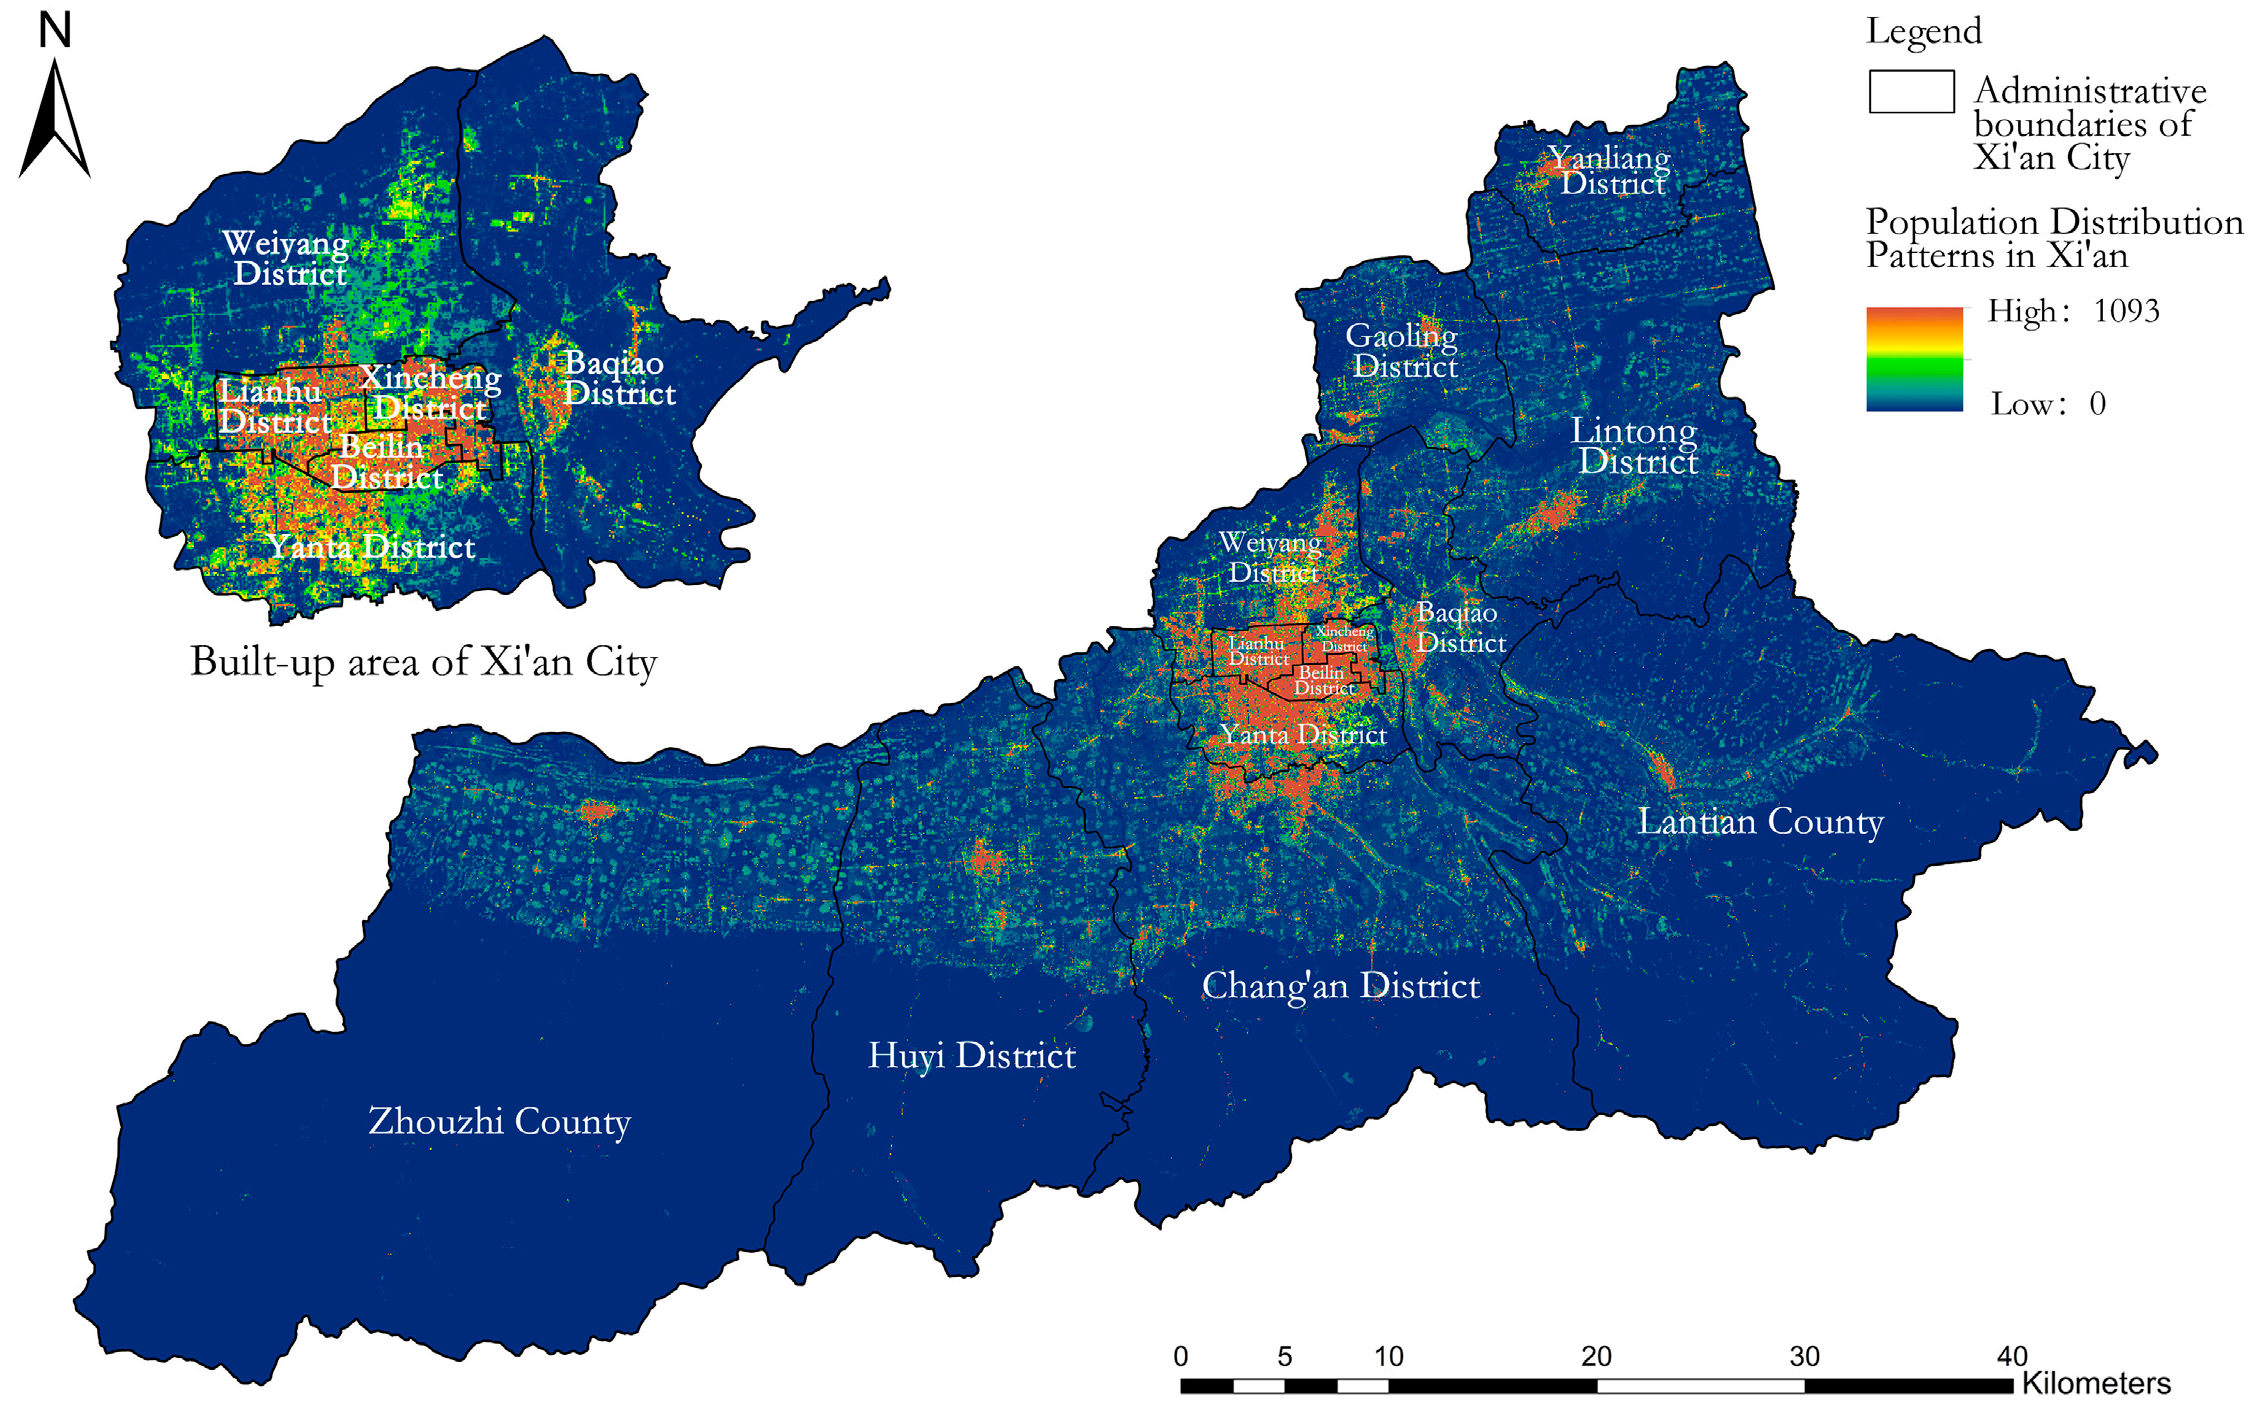
Xi’an (33°39′–34°45′ N, 107°40′–109°49′ E) spans 10,108 km2 in the central Guanzhong Plain [22], demarcated by the Wei River and Loess Plateau to the north and the Qinling Mountains to the south, with a southeast-to-northwest topographic gradient. Analysis of 90 m DEM data (Geospatial Data Cloud) using ArcGIS reveals pronounced elevation variations and defined physiographic boundaries (Figure 1) [23]. The city’s road network exhibits a radial–circumferential structure centered on the historic core, showing significantly higher density and connectivity in built-up areas than peripheral zones when these data are processed through OSM-derived spatial analysis (Figure 2). Population distribution analysis using 100 m resolution 2020 census data (figshare) confirms strong agglomeration in the central urban core and adjacent suburbs, contrasting with low-density settlements in the outer suburbs [24] (Figure 3).

2.1.2. Distribution of PM2.5 Pollution in Xi’an

To characterize the spatiotemporal distribution of the PM2.5 concentrations in Xi’an, we analyzed the seasonal variations during typical winter and summer periods using ArcGIS (Figure 4). Data were obtained from the China High Air Pollutants (CHAPs) dataset—a high-resolution near-surface pollutant database developed by Dr. Wei Jing and Prof. Li Zhanqing’s team, hosted by the National Tibetan Plateau Data Center. Figure 4 reveals significantly elevated PM2.5 concentrations in winter compared to summer, with pollution hotspots clustered in the northeastern region. The urban core also exhibits persistently high concentrations, attributable to dense traffic networks, high-rise building clusters, and pollutant accumulation under stable atmospheric conditions. Conversely, the southwestern region demonstrates markedly lower PM2.5 levels, resulting from its higher elevation, greater vegetation coverage ratio, and minimal industrial emissions, collectively generating distinct spatial heterogeneity.
In summary, Xi’an’s built-up area demonstrates elevated densities in terms of its road network configuration, population distribution, and PM2.5 concentrations. These interconnected factors interact synergistically within the urban environmental matrix. Consequently, this area served as the focal research domain for investigating the PM2.5 exposure dynamics.

2.2. Research on the Current Status of Residential Streets in Built-Up Areas

To standardize the subsequent street simulation studies and planning strategies, we statistically analyzed the morphological parameters of residential streets within Xi’an’s built-up area. Key characteristics—including the street width, length, orientation, building heights, layout patterns, and structural configurations—were quantified to establish empirically grounded spatial street models. Residential street data were sourced from OpenStreetMap, preprocessed, and analyzed in ArcGIS. Following established urban road classification standards, 3919 residential street segments were systematically identified and extracted from the study area.

2.2.1. Street Dimensions and Orientation

Residential streets in Xi’an predominantly comprise urban collector roads and local streets. Consequently, the street widths are generally constrained to ≤30 m, while their length and orientation remain unregulated. To characterize the current morphological parameters of residential streets within Xi’an’s built-up area, we statistically analyzed the street dimensions and orientation. Using ArcGIS, we calculated their width, length, and axial alignment (Figure 5). The results indicate predominant width ranges of 15–20 m and length clusters of 200–400 m and a dominant east–west orientation.

2.2.2. Building Morphology Along Street Corridors

To standardize the modeling for the subsequent simulations, we quantified the building morphology along residential streets, including buildings’ height, spatial configuration, and structural typology. Building vector data for Xi’an—incorporating footprint polygons and elevation attributes—were sourced from the Zenodo database. GIS-based analysis (Figure 6) revealed the following predominant characteristics: (1) predominantly low-rise structures (≤24 m height), (2) gridiron spatial configurations as the primary layout, and (3) slab building typologies as the dominant structural forms.
In summary, residential streets within Xi’an’s built-up area exhibit characteristic morphological parameters: widths predominantly in a range of 15–20 m, lengths concentrated at 200–400 m, and a primary east–west orientation. The building configurations along street corridors are dominated by low-rise (≤24 m height) slab-type structures arranged in linear alignments. Consequently, parametric street models for use in the subsequent simulations were developed based on these empirically derived morphological benchmarks.

2.3. Analysis of PM2.5 Exposure in Xi’an’s Built-Up Area

2.3.1. Calculation Methods for PM2.5 Exposure

The methodologies for quantifying PM2.5 exposure exhibit significant disciplinary heterogeneity. The current population exposure assessment approaches for air pollutants comprise three primary categories: (1) biomedical monitoring of exposure dose–response relationships, (2) individual exposure tracking with spatiotemporal trajectory analysis, and (3) scenario-based exposure modeling [25]. Crucially, dosimetric indicators enable estimation of pollutants’ impacts on the health of specific populations within defined spatiotemporal domains, including the exposure duration, pollutant concentration, and inhalation rates, to quantify the internalized pollutant loads. This study therefore employs the dosimetric assessment framework established by Du and Fu [26] to calculate the daily inhaled PM2.5 mass within street-scale microenvironments. This validated methodology provides scientific evaluation of PM2.5’s health impacts while fulfilling the research objectives.
The calculation of the PM2.5 exposure levels is based on the exposure concentration, exposure time, and inhalation rate. The calculation method is as follows:
DED = Con × RT × ET
In this equation, DED represents the total exposure dose of PM2.5 (e.g., in µg); Con represents the concentration of PM2.5 in the street (µg/m3); RT represents the inhalation rate (m3/h); and ET represents the exposure time (h).

2.3.2. Data Source

This study incorporated three critical datasets for PM2.5 exposure quantification, providing data on the ambient concentration, inhalation rates, and population exposure duration. For Xi’an’s built-up area, these parameters were systematically determined as follows:
(1)
PM2.5 Concentration Data
High-resolution (1 km) PM2.5 concentration data for 2023 were sourced from the China High Air Pollutants (CHAPs) dataset. This nationally representative near-surface pollutant database, developed by Dr. Wei Jing and Prof. Li Zhanqing’s team, is publicly accessible through the National Tibetan Plateau Data Center.
(2)
Inhalation Rate Parameters
The inhalation rates were referenced from the China Population Exposure Parameters Handbook [27], specifically utilizing data for the Shaanxi region (Table 1). This handbook systematically calculates the inhalation rates across genders and age groups under varying activity levels. For this study, three activity classifications—resting, sedentary, and light-intensity—were extracted and applied.
(3)
Exposure Duration Parameters
The population exposure durations were obtained from the Chinese Population Exposure Parameters Handbook, specifically referencing non-transportation outdoor activity metrics for urban residents in Shaanxi Province (Table 1). To standardize the computations, we applied population-weighted daily means across the gender and age cohorts, yielding an average exposure duration of 184 min per day.

2.3.3. Current Spatial Distribution of PM2.5 Exposure in Xi’an’s Built-Up Area

Utilizing the established PM2.5 quantification framework, we computed the exposure levels across Xi’an’s built-up area during the winter and summer seasons using ArcGIS spatial analysis (Figure 7). The results revealed exposure ranges of 11.8–164.61 μg/m3·h/day (winter) and 4.32–55.67 μg/m3·h/day (summer). Unlike the ambient concentration distributions, PM2.5 exposure exhibited centroid-focused clustering patterns, demonstrating a significant dependence on the population density and outdoor activity regimes. Notably, the exposure intensities within Xi’an’s core urban districts (Beilin, Lianhu, and Xincheng) demonstrated critical severity and substantially exceeded the values in other administrative zones, with the winter exposure exceeding the summer values by 2.7- to 3.0-fold.
Consequently, subsequent field investigations targeted east–west-oriented streets in these districts during winter—the peak exposure period—for microenvironmental monitoring and validation.

3. Screening Walkability Indicators and Field-Based Validation

3.1. Preliminary Screening of Walkability Indicators

Walkability serves as a critical metric for assessing urban livability, with direct implications for urban development quality and residents’ well-being. This study adopts walkability indicators derived from the Natural Resources Defense Council’s (NRDC) China Urban Walkability Evaluation Reports (1st–5th editions). Through indicator classification and quantitative analysis, key metrics were systematically refined, as detailed in Figure 8.
The initial 25 indicators from a five-phase report were categorized into 12 quantifiable, controllable variables and 13 qualitative, subjective variables. Given the inherent subjectivity and limited central controllability of qualitative variables, the latter group was excluded. Among the quantifiable variables, traffic safety-focused metrics (“road traffic fatality rate”, “per capita vehicle ownership”) were discarded. Based on Xi’an-specific urban diagnostics, five supplemental indicators were incorporated—the street intersection density, street connectivity, building height variation, building setback variation, and canopy coverage—yielding 15 candidate walkability indicators.
Principal Component Analysis (PCA) reduced the dimensionality by transforming variables into uncorrelated principal components (cumulative variance: 83.24%), with four cross-loading indicators removed to mitigate multicollinearity (Table 2). Eleven indicators were classified as four planning-level and seven design-level metrics. To quantify the linear relationships between these indicators and the PM2.5 exposure, Pearson correlation analysis was selected, its parametric nature being optimal for use with continuous normally distributed variables [28]. At α = 0.01, we found the following:
(1) Planning indicators: The urban road density (r = 0.926, p < 0.01), walking index (r = 0.468), and street intersection density (r = 0.628) showed positive correlations with exposure; the walking accessibility was non-significant (r = 0.201).
(2) Design indicators: The height-to-width ratio (r = 0.668), Building-to-Line ratio (r = 0.568), and canopy coverage (r = 0.594) were positively correlated, while the sidewalk area ratio (r = −0.250) and building height variation (r = −0.899) exhibited inverse relationships. The tree-lined road coverage and setback variation were non-significant.
Three core planning indicators guided street selection for the field measurements, while six design indicators underwent multivariate regression with empirical PM2.5 exposure data.

3.2. Field Measurement Protocol Design

Based on the three core pedestrian-oriented planning indicators (urban road network density, walkability index, and street intersection density) identified in the prior analysis, field survey zones were determined. These indicators demonstrated the peak densities to be in the Beilin, Lianhu, and Xincheng districts (Figure 9), establishing them as the primary field study areas.
Building upon the morphological characterization of residential streets in Xi’an’s built-up area (Section 2.2), which identified predominant dimensions of a 15–20 m width and 200–400 m length with an east–west orientation, we selected six representative streets across three administrative districts (Table 3). Each met the dimensional criteria (width: 15–20 m; length: 200–400 m) and exhibited a comparable road network density, walking index, and street intersection density. Field diagnostics revealed the following recurrent features:
  • Pavement types: Hardscapes vs. green spaces;
  • Plant configurations: Tree, shrub–tree, or tree-shrub-grass assemblages;
  • Height-to-width ratios (H/W): >1, ≈1, or <1.
Measurement points were strategically deployed along each street to capture these morphological variations during the field campaigns.
The PM2.5 concentrations were measured using a calibrated CEL-712 real-time dust monitor, while the temperature, relative humidity, and wind speed were recorded with a TES-1341 thermal anemometer. Both instruments demonstrated high precision (resolution of 0.1 μg/m3 for PM2.5 and 0.1 °C/0.1% RH for microclimate) and stability during the pre-test validation. Prior calibration against national environmental monitoring station data confirmed measurement errors within ±10 μg/m3 over a 48 h collocation period, satisfying rapid assessment requirements (±15% tolerance per EPA-454/R-08-002).
The field campaigns were conducted from 20 to 22 January 2024 (07:00–19:00 daily) under stable meteorological conditions (clear skies; a wind speed < 2 m/s; a persistent NE wind at 45°). All the probes were mounted at a 1.5 m height (respiratory zone) on leeward facades. At each sampling point, triplicate 3 min measurements were averaged to ensure representativeness. Concurrently, the traffic volume (vehicles/min), pedestrian density (persons/10 m2/min), and vegetation parameters (width, species, canopy shading) were documented through timed manual counts and visual surveys. The traffic/pedestrian data were standardized to 10 min intervals to minimize diurnal variation effects.

3.3. Identification of Core Pedestrian-Oriented Metrics

Following the field data collection, we performed multiple regression analysis to quantify the associations between PM2.5 exposure and six pedestrian-oriented design metrics. The statistical modeling integrated exposure data with design indicators, with key outcomes presented in Table 4.
Analysis revealed that among the six pedestrian-oriented design metrics, the height-to-width ratios and Build-to-Line ratios demonstrated statistically significant associations with the PM2.5 exposure levels. Specifically, the height-to-width ratios exhibited a significant negative correlation with PM2.5 exposure, while the Build-to-Line ratios showed a significant positive correlation. Consequently, threshold simulations were conducted for these two parameters in subsequent computational modeling studies.

4. Computational Simulation and Optimization of Pedestrian-Oriented Metrics in High-PM2.5-Exposure Residential Streets

4.1. Parametric Benchmarking: Standard Model Establishment and Threshold Definition

ENVI-met, developed by Bruse [29], simulates urban thermodynamic, aerodynamic, and pollutant dispersion processes through 3D modeling and dynamic multi-scale analysis. The software quantifies the microclimatic impacts of the urban land cover and localized meteorology, with spatial–temporal resolutions suitable for meso–microscale simulations (maximum duration: 48 h) [30].
Based on district-level PM2.5 exposure analysis, Renyi Road (eastern segment) in Beilin District was selected for model validation. This 18 m × 320 m east–west corridor exhibits representative characteristics: a high traffic density and elevated PM2.5 exposure. Pre-simulation validation compared the field-measured versus simulated PM2.5 concentrations to assess the model fidelity. Key parameters are detailed in Table 5.
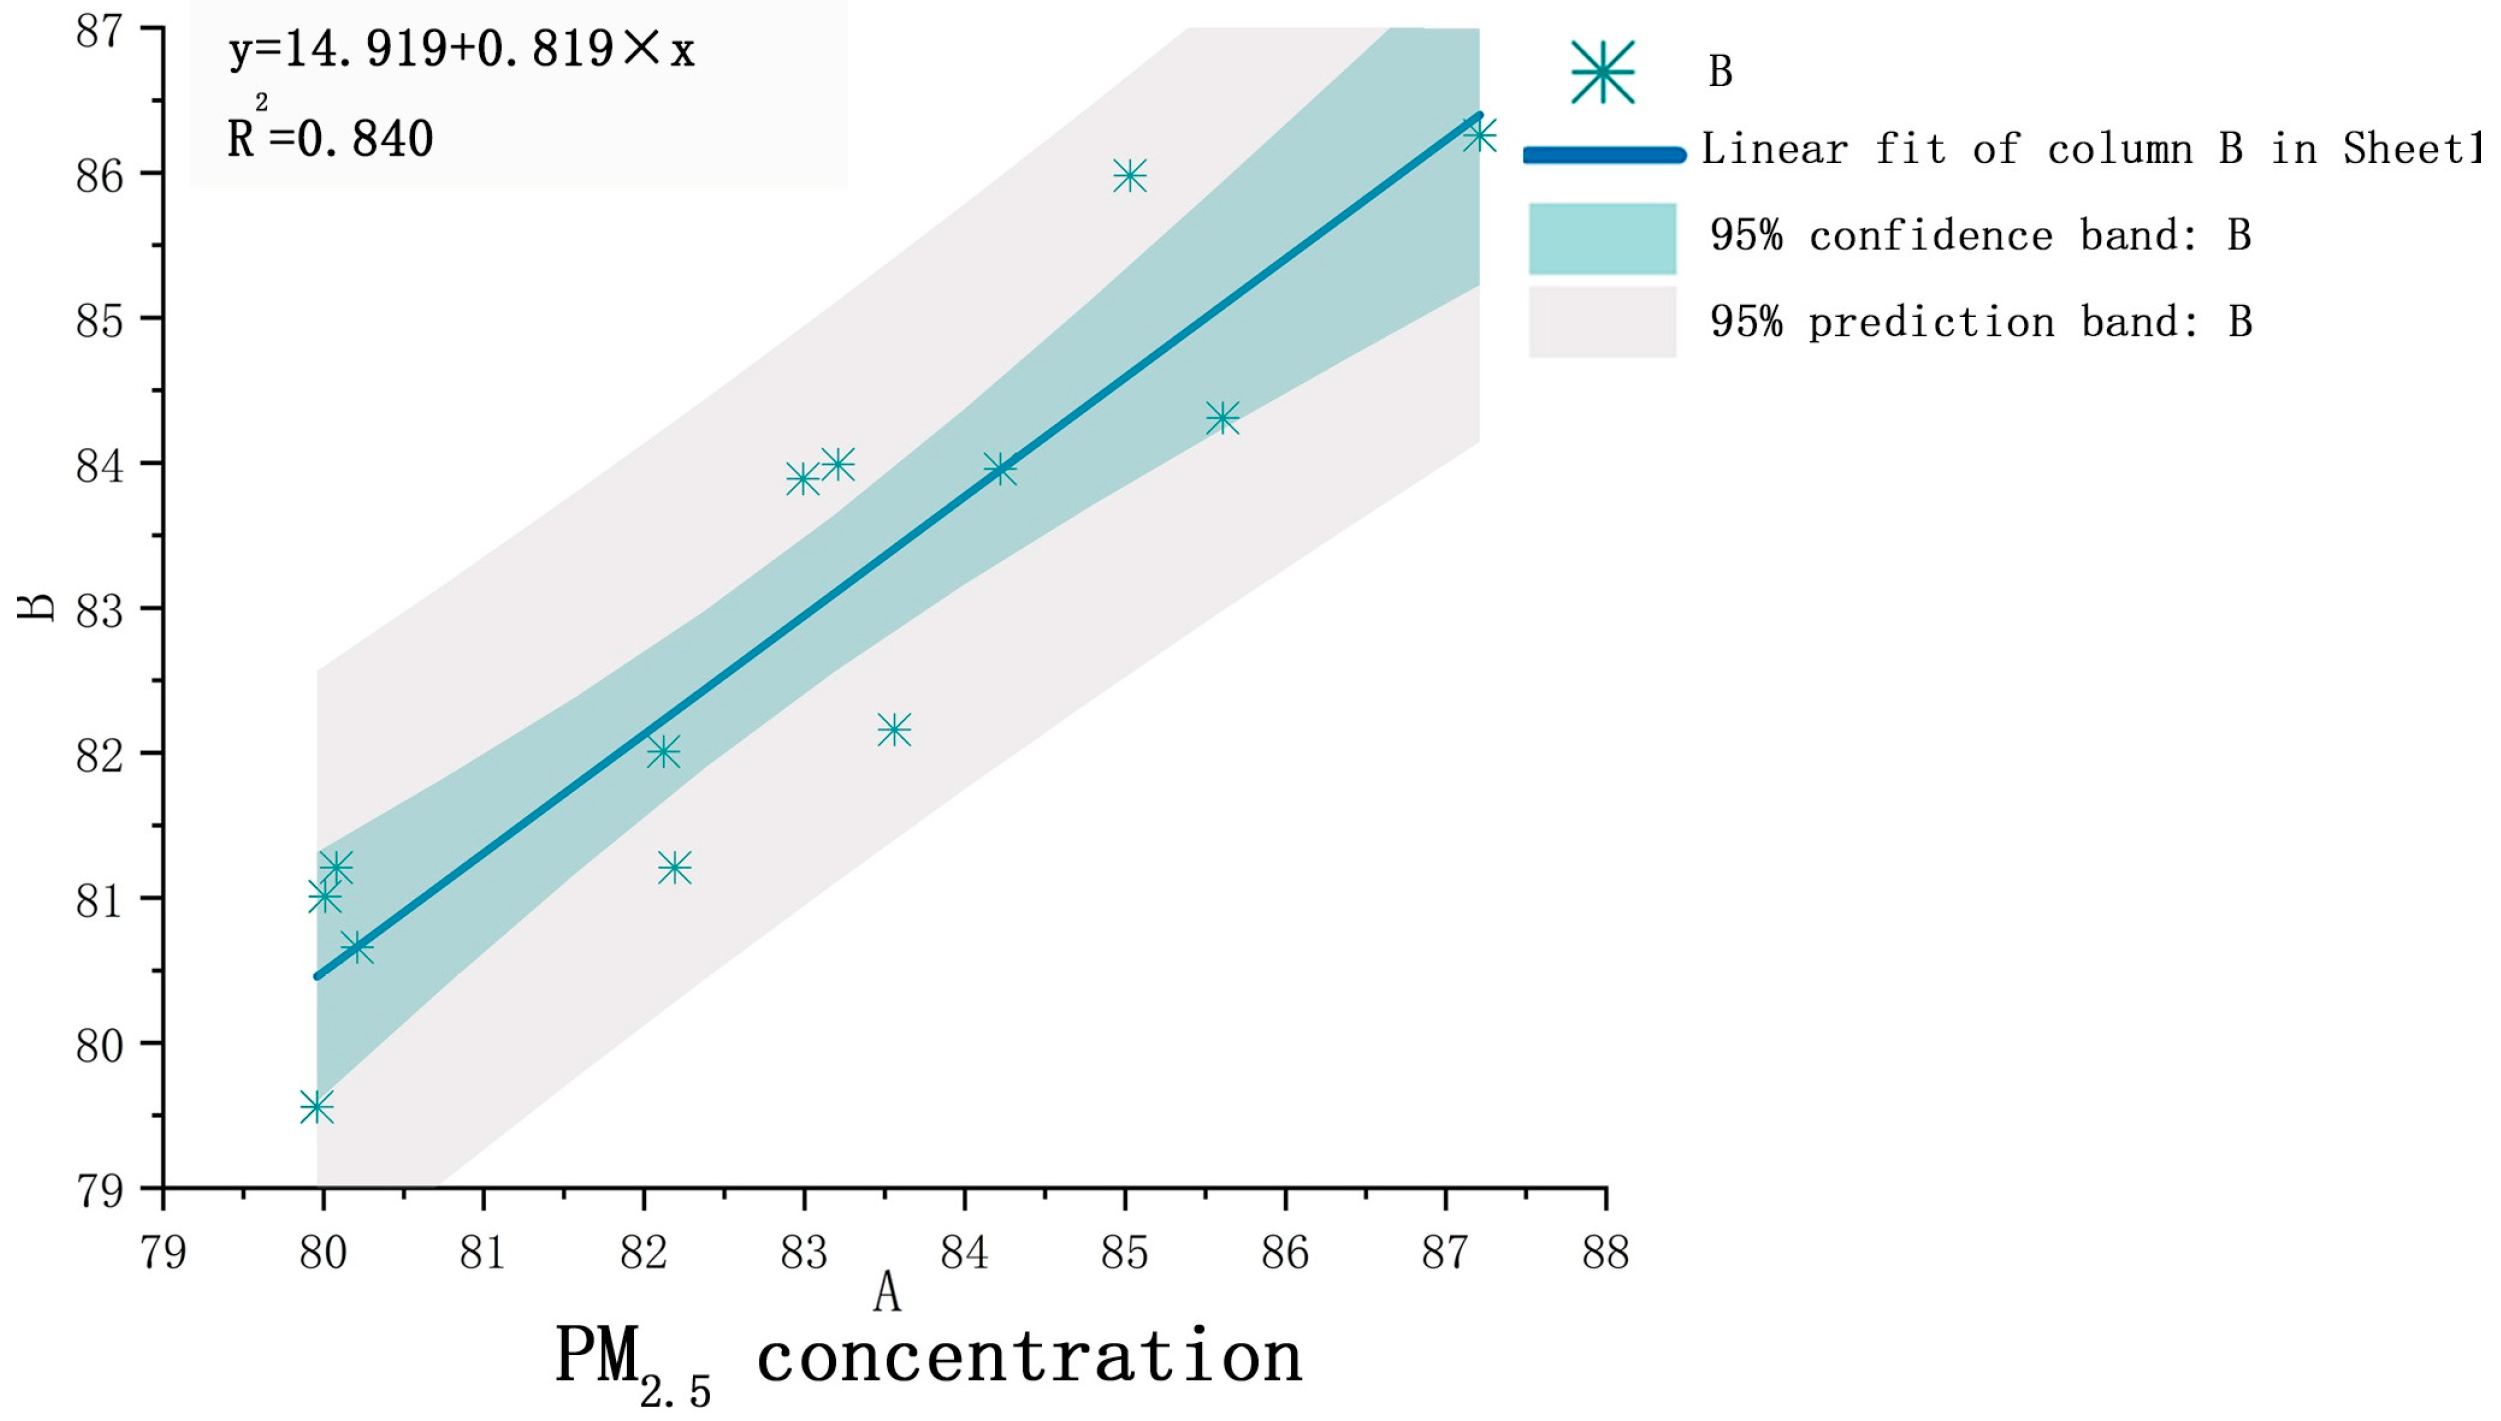
Linear regression demonstrated strong agreement between the observed and simulated PM2.5 concentrations (Figure 10), confirming ENVI-met’s applicability to street canyon dispersion modeling under Xi’an-specific conditions.
Statistical analysis of Xi’an’s residential streets revealed the following predominant morphological characteristics: widths of 15–20 m (18 m modal value) and lengths of 200–400 m (300 m median) with an east–west orientation. Accordingly, the parametric street model was standardized with an 18 m width, 300 m length, and east–west axial alignment. To emulate an authentic urban form, buildings flanking both the street sides and terminal intersections were incorporated, yielding a 400 × 70 m simulation domain.
Intersection curb radii were calibrated at 5 m per the Urban Road Intersection Planning Standard (GB 50647-2011). The building heights and configurations complied with the following:
  • The Unified Standard for Civil Building Design (GB 50352-2005) [31];
  • The Code for Fire Protection Design of Buildings (GB 50016-2014) [32];
  • Empirical survey data for Xi’an’s residential corridors.
This integration produced 24 m high slab-type buildings in a gridiron configuration (Figure 11).

4.2. Spatiotemporal Modeling of Height-to-Width Ratio’s Effects on Pollutant Dispersion

To investigate the impact of the height-to-width ratio (H/W) on the intra-street PM2.5 exposure, parametric simulations were conducted for east–west-oriented residential streets with H/W ratios set at 0.5, 1.0, and 2.0. The computational domain specifications are detailed in Table 6.
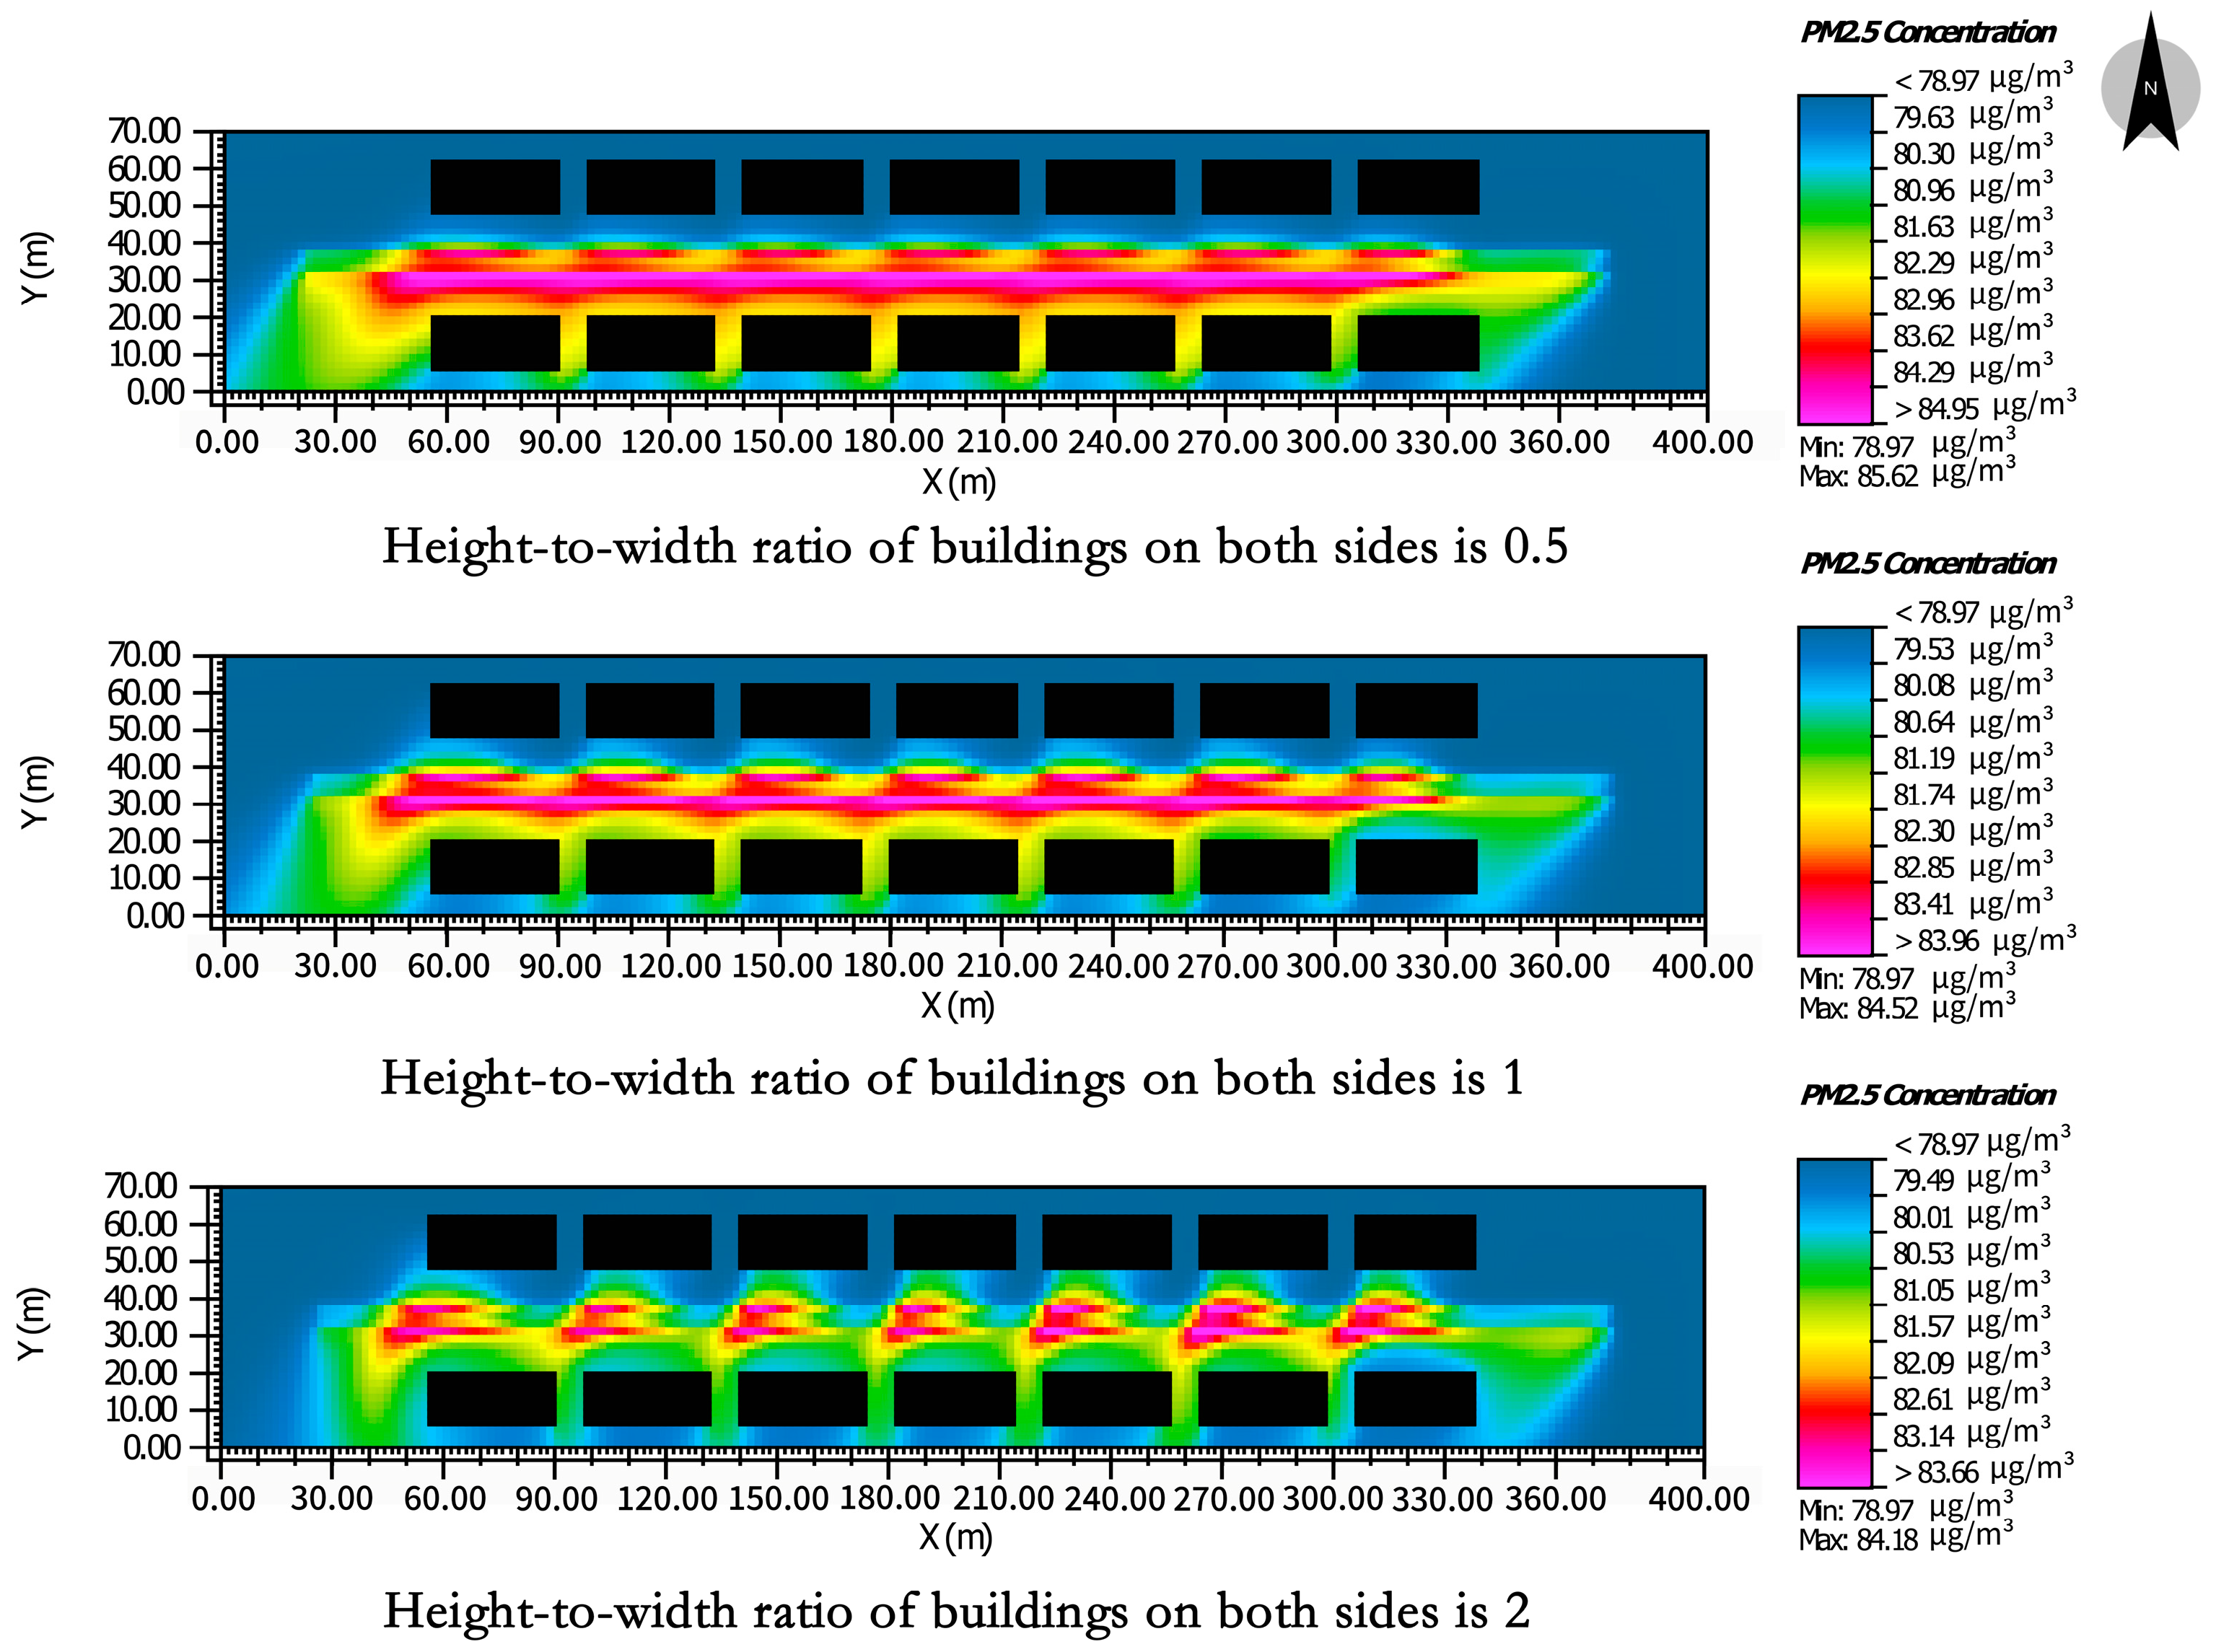
Figure 12 shows the simulated PM2.5 distributions under varying height-to-width ratios (H/W). Planar concentration mapping revealed the following:
  • H/W = 0.5: The peak PM2.5 concentrations occurred within the street canyon, with extensive pollutant dispersion encroaching upon bilateral pedestrian walkways.
  • H/W = 1.0: The concentration decreased by 18–22% (vs. that at H/W = 0.5), with the lateral dispersion attenuated; pollutants primarily accumulated in the central roadway.
  • H/W = 2.0: The concentration declined by 37–41% (vs. that at H/W = 0.5), exhibiting enhanced dispersion efficiency, contracted pollution cores (>50% reduction), and fragmented PM2.5 distribution patterns along the road axis.
These findings demonstrate that increased H/W ratios strengthen pollutant advection, reducing the number of concentrated pollution zones and improving the air quality. Conversely, lower ratios restrict the ventilation efficiency, promoting PM2.5 accumulation in central roadway regions with a concomitant concentration elevation.
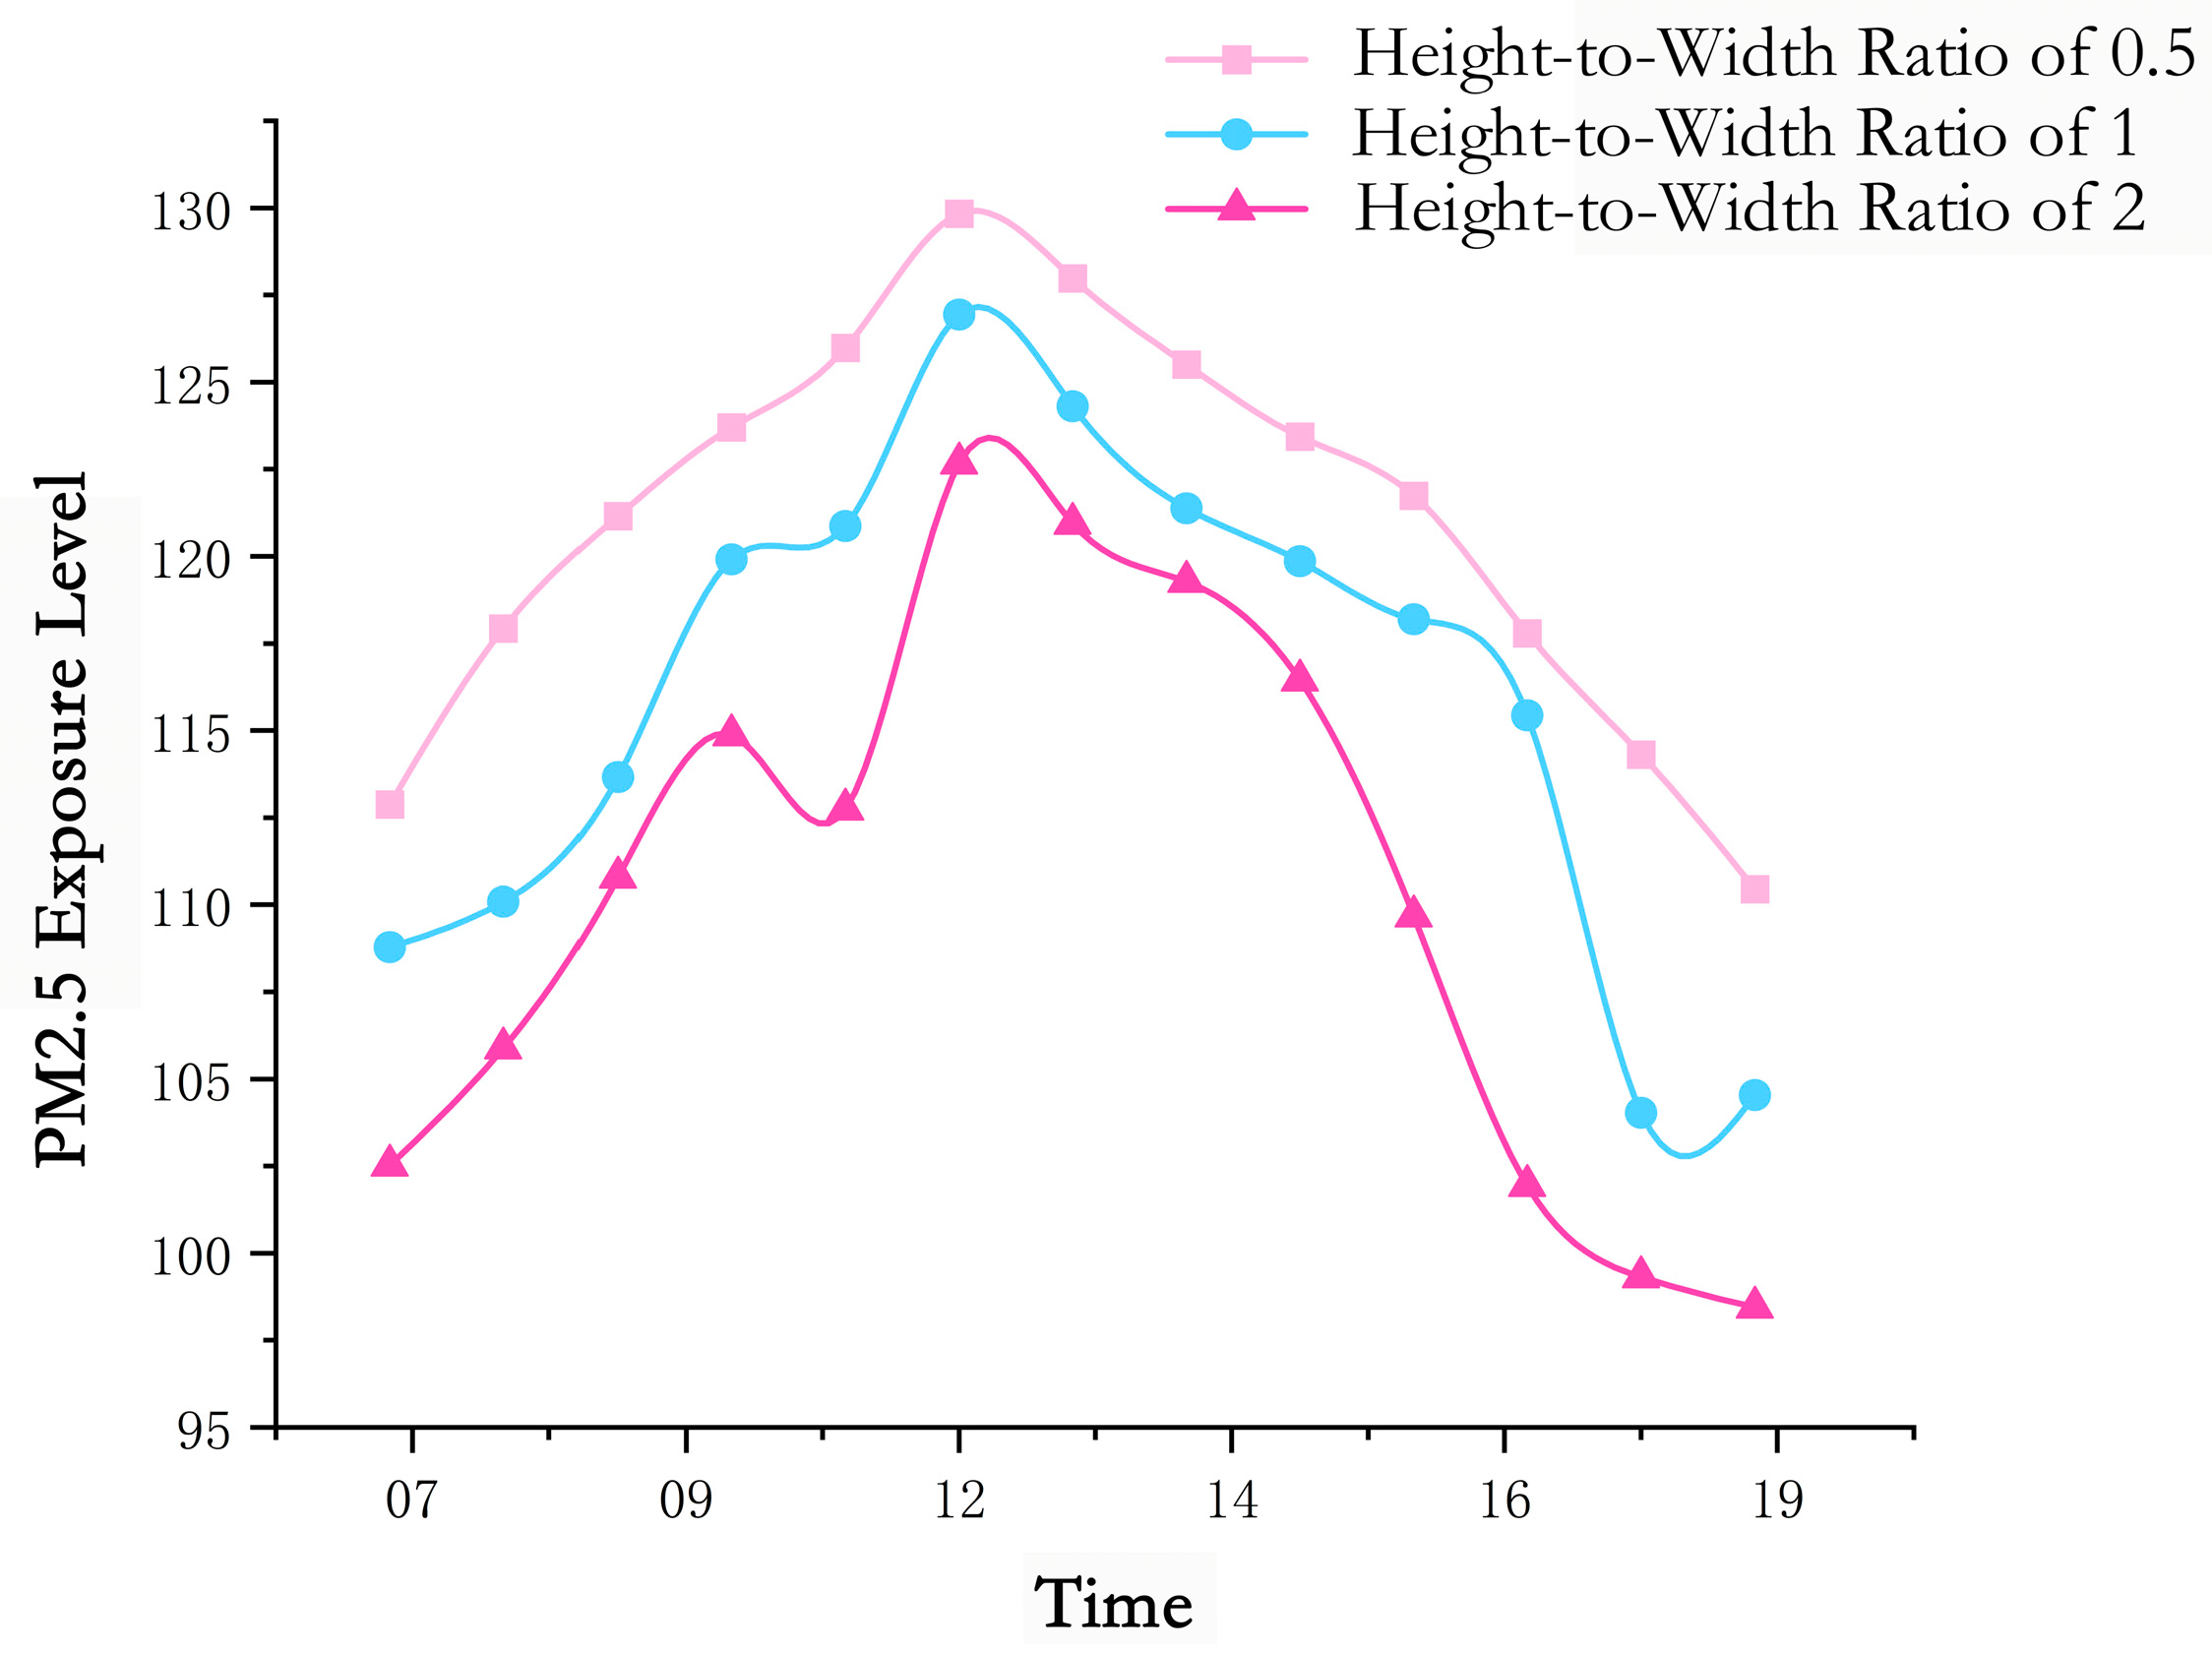
Figure 13 delineates the intra-street PM2.5 exposure trends derived from the concentration simulations. The key findings reveal significant exposure differentials across the height-to-width ratios (H/W):
  • H/W = 0.5: The peak exposure (≈130 μg/m3·h) occurred at 12:00, representing the maximum accumulation.
  • H/W = 1.0: The exposure decreased by 2.3% (peak ≈ 127 μg/m3·h at 12:00) with moderate spatial variability.
  • H/W = 2.0: Minimal exposure levels manifested (peak ≈ 123 μg/m3·h at 12:00), demonstrating a 5.4% reduction in exposure compared to that at H/W = 0.5.
This inverse exposure–H/W relationship underscores the canyon geometry’s critical role in determining the pollutant dispersion efficiency.

4.3. Build-to-Line Ratio Dynamics in Street Canyon Exposure Simulations

To quantify the impact of the Build-to-Line ratios on the intra-street PM2.5 exposure, parametric variations (9 m, 12 m, and 15 m spacings) were implemented in the east–west residential street models. Aligned with residential fire safety codes (Class II fire resistance), the minimum spacing was calibrated at 9 m. Corresponding Build-to-Line ratios of 76.8%, 70.0%, and 63.2% were derived for each configuration, with the full specifications documented in Table 7.
Figure 14 presents the simulated PM2.5 distributions under varying Build-to-Line ratios. Our key observations revealed the following:
  • Build-to-Line ratios = 63.2%: PM2.5 exhibited a fragmented distribution concentrated in the central roadway with minimal lateral dispersion to the sidewalks.
  • Build-to-Line ratios = 70.0%: The pollutant coherence increased, expanding the contamination zones toward bilateral pedestrian corridors.
  • Build-to-Line ratios = 76.8%: Continuous pollution plumes developed, fully encroaching upon the sidewalks due to restricted vertical advection and 31% reduced ventilation efficiency.
This demonstrates an inverse relationship between the Build-to-Line ratios and dispersion capacity: lower continuity enhances pollutant scavenging, whereas higher continuity promotes accumulation through attenuated airflow vorticity.
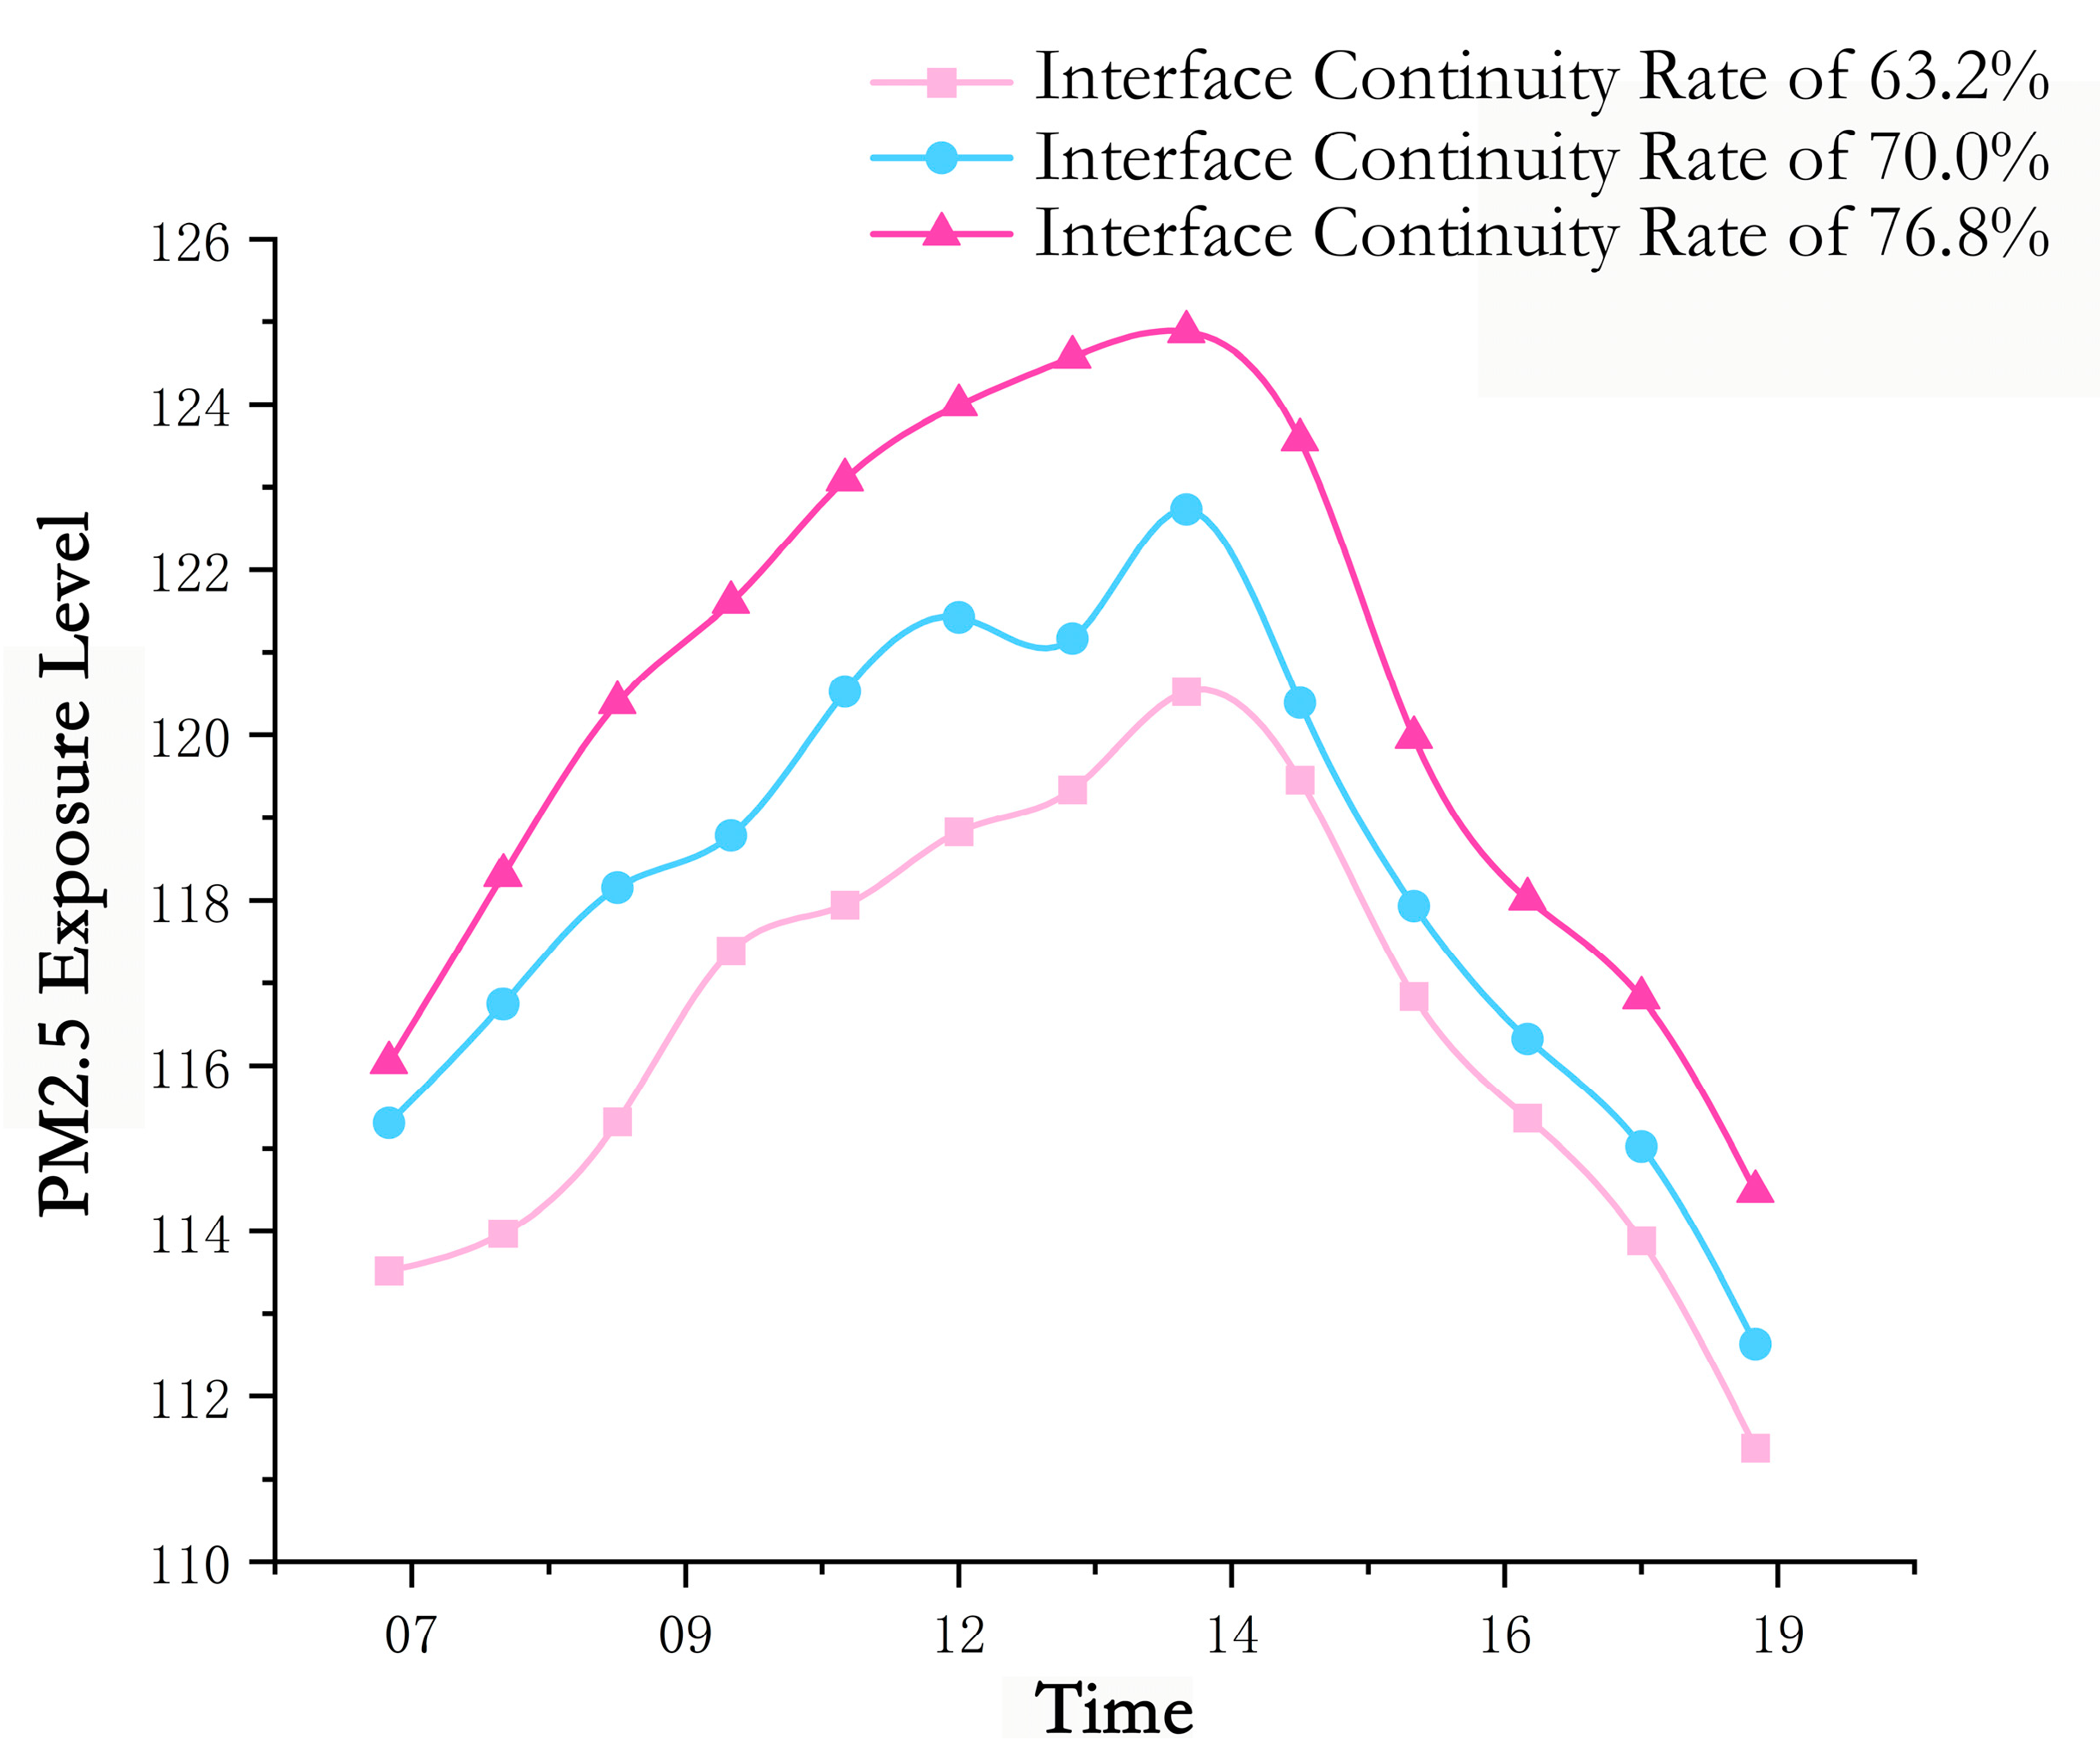
Figure 15 delineates the longitudinal PM2.5 exposure trends derived from the concentration simulations. While consistent spatial patterns emerged across the streets, significant exposure differentials manifested under varying Build-to-Line ratios. Specifically, we found the following:
  • The maximum exposure occurred at Build-to-Line ratios = 76.8%;
  • Intermediate exposure at Build-to-Line ratios = 70%;
  • The minimum exposure at Build-to-Line ratios = 63.2%.
This demonstrates a positive correlation between the Build-to-Line ratios and intra-canyon pollutant retention, wherein elevated continuity amplifies aerodynamic stagnation, thereby increasing the PM2.5 exposure in east–west-oriented streets.

4.4. Sensitivity Analysis of PM2.5 Exposure to Interactive Effects of Height-to-Width Ratio and Building-to-Line Ratio

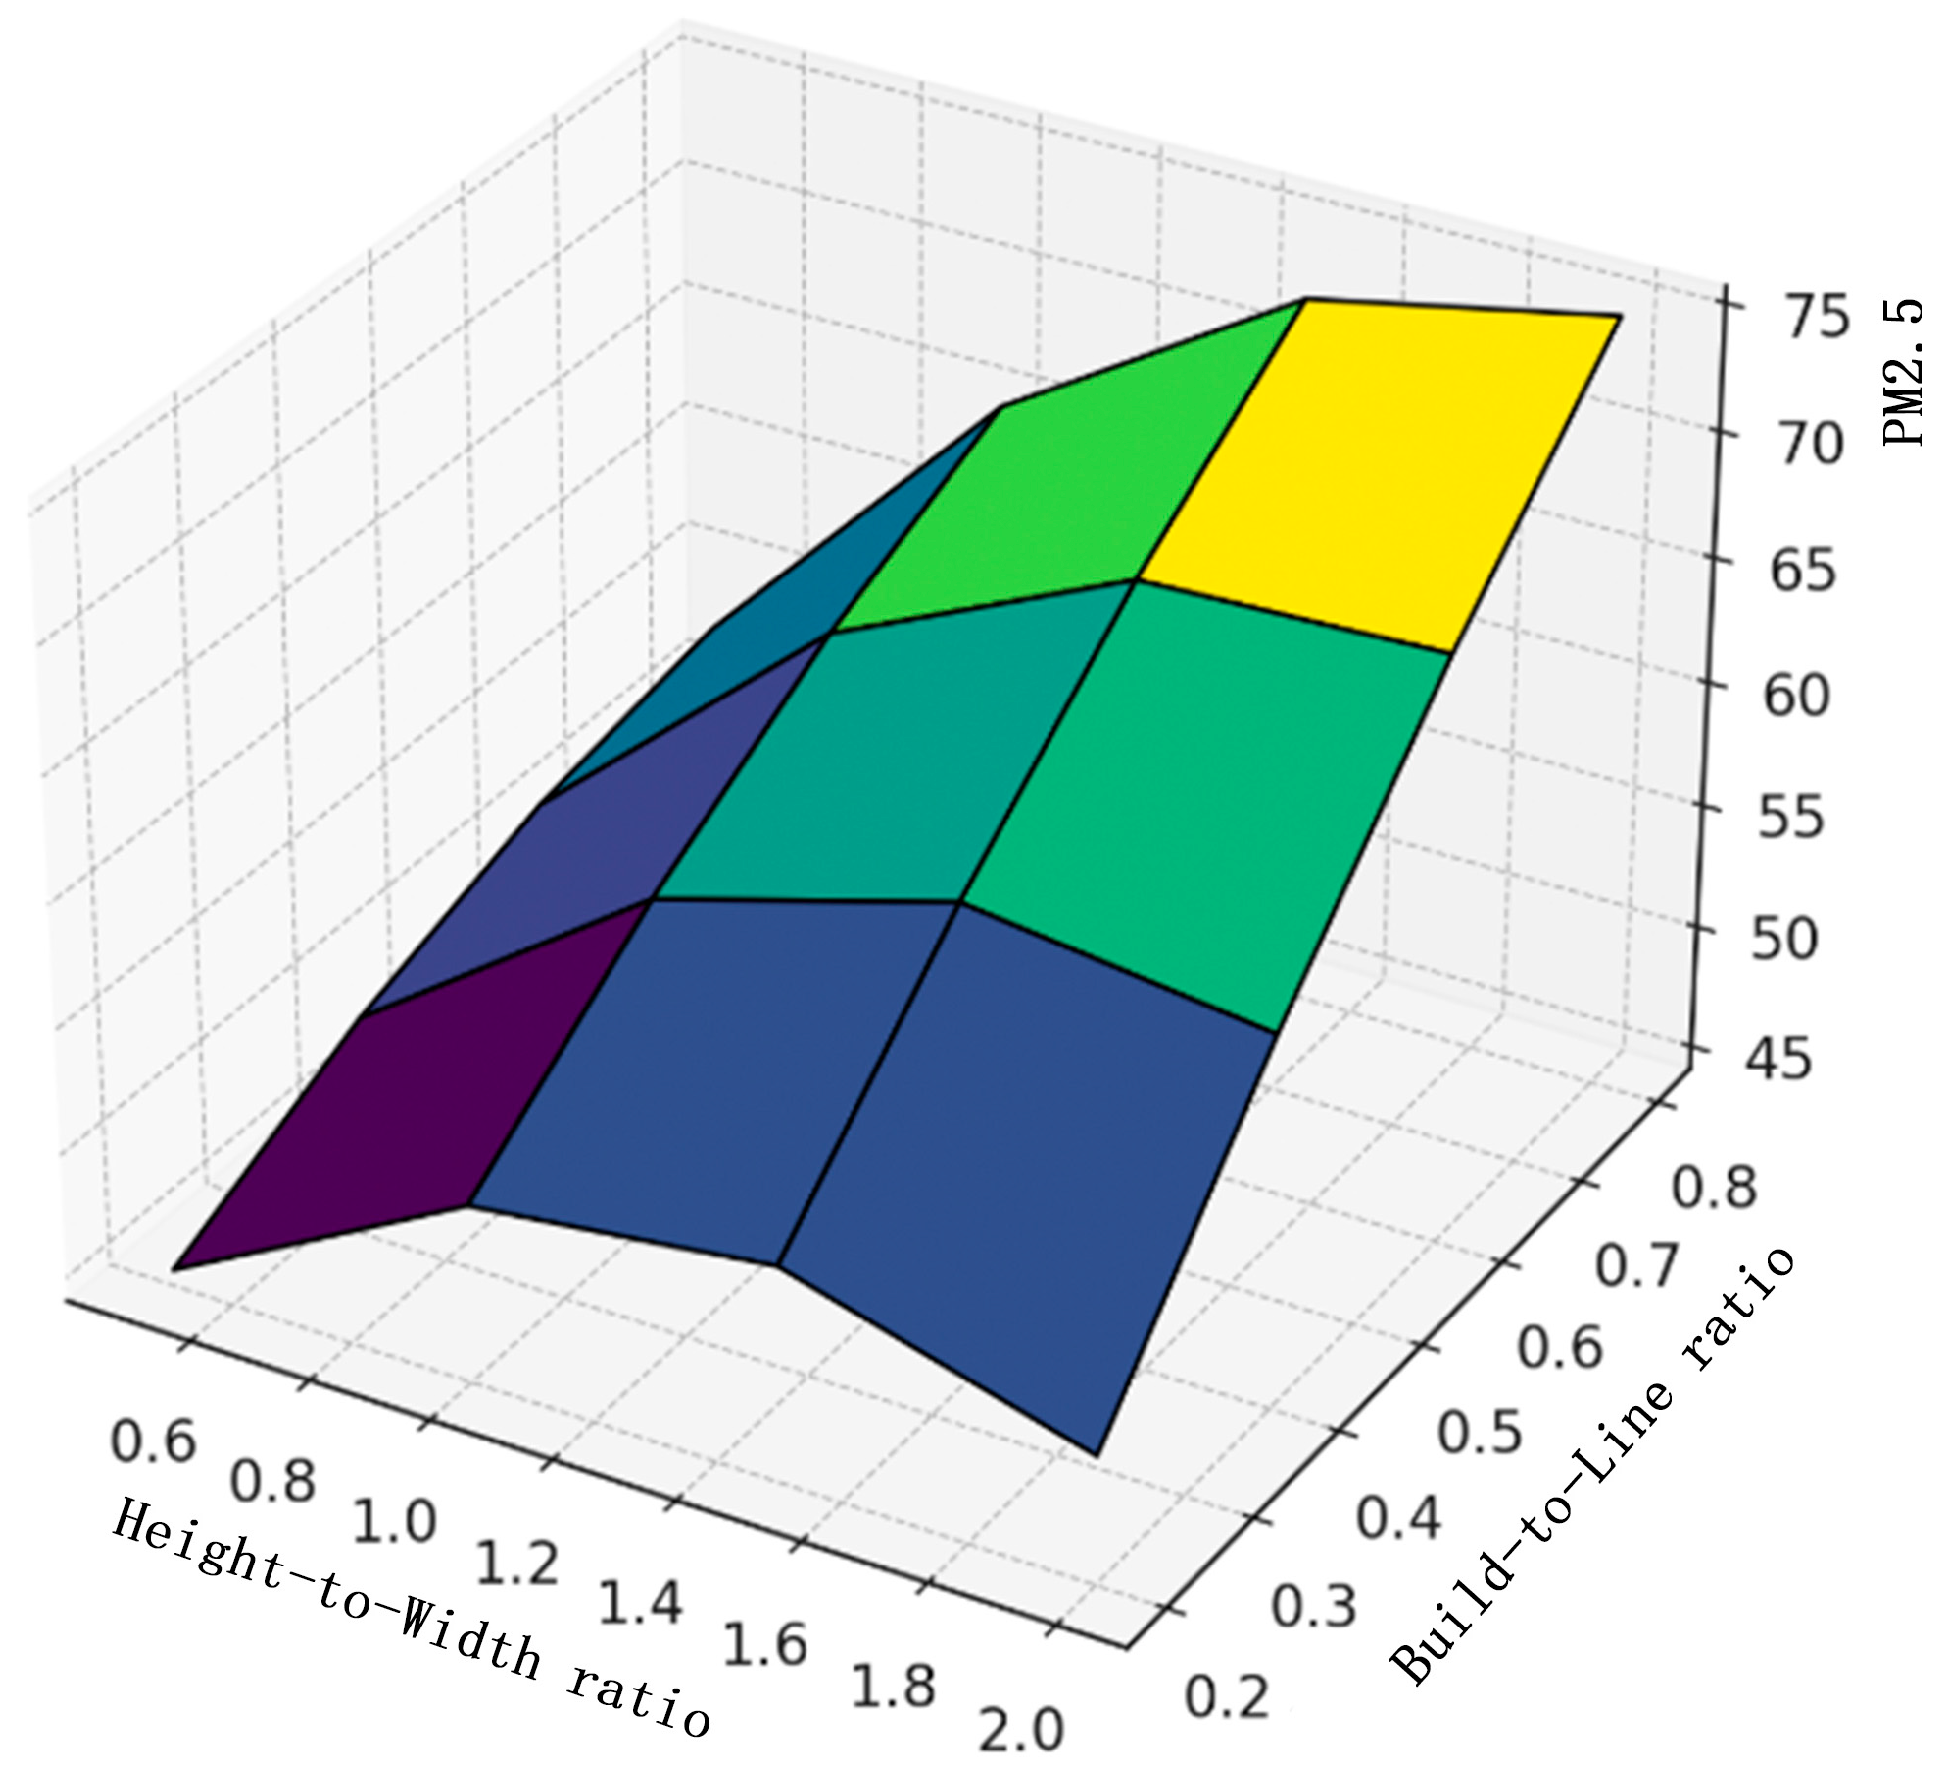
To unravel the synergistic impacts of the street spatial elements, this study conducted a sensitivity analysis on typical cross-sections to evaluate the interactive effects of the height-to-width ratio (H/W) and Building-to-Line ratio (BTR) (Figure 16). The results reveal the pronounced nonlinear response of the PM2.5 exposure:
  • The minimum exposure occurred at H/W ≈ 1.2 and BTR ≈ 0.6;
  • Significantly elevated exposure manifested under high-density enclosures (BTR > 0.8) or low-BTR scenarios (BTR < 0.4) combined with strong architectural confinement, where the pollutant stagnation intensified by 12.7–18.3%.
This non-additive synergy demonstrates that H/W-BTR interactions exert greater control over pollutant dispersion than linear superposition of individual variables (e.g., 23% greater optimization efficacy at BTR = 0.6 and H/W = 1.2 versus that with single-factor adjustments). The analysis thus validated the parametric rationality of the subsequent model optimization and underscored the necessity of incorporating coupled urban design variables in air exposure risk assessments.

4.5. Evidence-Based Interventions for Walkability Enhancement in Polluted Residential Corridors

The east–west street orientation forms an acute angle with Xi’an’s prevailing northeast winds, impeding effective pollutant dispersion and promoting PM2.5 accumulation within street canyons. The simulation results demonstrate that among the two core pedestrian-oriented metrics,
  • The height-to-width ratio (H/W) constitutes the primary contributor to ventilation enhancement, achieving the most significant PM2.5 exposure reduction;
  • The Build-to-Line ratio secondarily influences the inter-building airflow dynamics, with a lower Build-to-Line ratio attenuating aerodynamic stagnation to reduce the exposure by 12–15%.
Informed by these findings, Table 8 presents evidence-based optimization strategies for east–west residential streets.

5. Discussion

5.1. Implications

The ENVI-met-simulated exposure variations demonstrate consistency with the established models: Jon et al. [33] revealed, using OpenFOAM, that enhancing the canyon asymmetry (via DBHA) improves the ventilation efficacy and reduces pollutants, while Hao et al. [34] refined the EPA-endorsed CAL3QHC model by optimizing line-source calculations, achieving precise simulation of intersection-scale contaminant dispersion. These results align with our observed sensitivity trends, yet ENVI-met’s unique integration of microclimate dynamics and plant transpiration renders it particularly suited to highly vegetated East Asian cities. Our threshold simulations for living streets identified the height-to-width ratio as the dominant negative predictor of PM2.5 exposure, with H/W = 0.5 generating peak contamination and extensive sidewalk dispersion. Increasing the H/W ratio to 2 reduced the exposure by 19.2% while redirecting pollutants toward building gaps, a phenomenon amplified at higher ratios. Conversely, the Building-to-Line ratio exhibited a positive correlation with exposure: BTR = 63.2% produced intermittent roadway-concentrated PM2.5, whereas BTR > 76.8% expanded the polluted areas toward sidewalks due to diminished airflow. Consequently, the H/W ratio and BTR emerged as critical tools for mitigating street-level PM2.5 pollution.
Translating these structural insights into actionable policies necessitates the embedding of exposure control within urban governance frameworks. We advocate for establishing “exposure-sensitivity zoning” in regulatory plans to enforce differentiated management of high-risk corridors; implementing pedestrian-centric exposure grading to prioritize street retrofits; and deploying integrated data systems (remote sensing/monitoring/behavioral modeling) to optimize ventilation pathways and microclimatic design. Multi-tiered implementation—spanning regulations, standards, and projects—enables structural exposure reduction and advances health-oriented urban governance.

5.2. Limitations

This study systematically deciphered the mechanisms influencing the relationship between urban walkability metrics and PM2.5 exposure, proposing optimization strategies for residential streets that largely achieved the research objectives. The limitations arising from temporal and spatial constraints merit consideration for further refinement: (1) The singular focus on PM2.5 overlooked co-pollutants like NO2 (traffic emission-dependent) and O3 (photochemically produced under high solar irradiance), whose dispersion dynamics diverge significantly from those of PM2.5 under varying meteorology conditions. (2) The exposure assessment was hampered by a limited spatiotemporal resolution in the population activity data; future work should incorporate real-time mobility tracking to enhance the exposure measurement accuracy and individual adaptability. (3) While the simulations prioritized Xi’an’s prevailing NW winter winds to target high-exposure scenarios, cities with complex wind regimes require site-specific meteorological coupling within dynamic boundary models. (4) Furthermore, although the H/W ratio and BTR were identified as the dominant morphological controls, the variable isolation approach neglected synergistic interactions with the traffic flow and vegetation. Advancing multipollutant monitoring integrated with multivariate simulation frameworks will elucidate interactive mechanisms for comprehensive street air quality enhancement.

6. Conclusions

This study first analyzed Xi’an’s environmental characteristics to delineate its built-up area as the research scope, then assessed the PM2.5 exposure levels within this zone to identify high-exposure hotspots. Core pedestrian-oriented metrics were subsequently selected and investigated through integrated field measurements, data analytics, and simulations of high-exposure residential streets. This multi-method approach revealed the coupling mechanisms between key street morphology indicators—the height-to-width ratio (H/W) and Build-to-Line ratio—and the PM2.5 exposure dynamics. Building on these findings, we proposed evidence-based street design optimization strategies for east–west-oriented residential corridors.
Based on these street design optimization strategies, the research outcomes can be directly applied to optimize planning and renovation practices for urban livable street spaces, delivering substantive contributions toward meeting the ‘Healthy China 2030’ environmental health targets through measurable PM2.5 exposure reduction. Implementation of the identified morphological thresholds (H/W ≥ 1.5, BTR ≤ 70%) reduces the peak PM2.5 exposure by 37–41% compared to the baseline conditions (H/W = 0.5). This research fundamentally addresses the public health implications of PM2.5 exposure, elucidating the operational thresholds through which residential street spatial elements influence pollutant dispersion. This provides scientific foundations for prioritizing key indicators and spatial configuration strategies in pedestrian-centric street design. The outcomes offer transferable methodologies for renovating residential street networks and contribute actionable tools to urban healthy environment initiatives, ultimately supporting sustainable urban development paradigms aligned with national health governance frameworks.

Author Contributions

Conceptualization, X.M. and H.X.; methodology, H.X.; software, H.X.; validation, H.X., J.W. and X.M.; formal analysis, H.X. and X.M.; investigation, H.X. and J.W.; resources, H.X. and X.M.; data curation, H.X. and J.W.; writing—original draft preparation, H.X.; writing—review and editing, H.X.; visualization, H.X.; supervision, X.M.; project administration, X.M. and H.X.; funding acquisition, X.M. All authors have read and agreed to the published version of the manuscript.

Funding

This work was supported by the Natural Science Foundation of Shaanxi Province, China (No. 2024JC-YBMS-389); the Fundamental Research Funds for the Central University Fund, CHD (Project No. 300102415604); Central University Fund, CHD (Project No. 300102415602); the Special Youth Project for Philosophy and Social Sciences Research of Shaanxi (No. 2024QN039); and the National Natural Science Foundation of China (No. 51908039).

Institutional Review Board Statement

This statement is not included.

Informed Consent Statement

This statement is not included.

Data Availability Statement

The original contributions presented in this study are included in the article. Further inquiries can be directed to the corresponding author(s).

Conflicts of Interest

The authors declare no conflict of interest.

References

  1. Wang, B.; Yuan, Q.; Yang, Q.; Zhu, L.; Li, T.; Zhang, L. Estimate hourly PM2.5 concentrations fromHimawari-8TOA reflectance directly using geo-intelligent long short-term memory network. Environ. Pollut. 2021, 271, 116327. [Google Scholar] [CrossRef]
  2. Deryugina, T.; Heutel, G.; Miller, N.H.; Molitor, D.; Reif, J. The mortality and medical costs of air pollution: Evidence from changes in wind direction. Am. Econ. Rev. 2019, 109, 4178–4219. [Google Scholar] [CrossRef]
  3. Li, Y.; Xu, Y.F.; Yuan, M.H.; Su, F.C.; Wang, S.B.; Wang, K.; Zhang, R.Q. High-Resolution Grid-Based Assessment of PM2.5 Exposure Concentrations and Associated Health Risks for Urban Residents in Zhengzhou, China. Environ. Sci. 2023, 44, 1911–1923. [Google Scholar]
  4. Wen, L.; Kenworthy, J.; Marinova, D. Higher Density Environments and the Critical Role of City Streets as Public Open Spaces. Sustainability 2020, 12, 8896. [Google Scholar] [CrossRef]
  5. Sharifi, A. Resilient urban forms: A review of literature on streets and street networks. Build. Environ. 2019, 147, 171–187. [Google Scholar] [CrossRef]
  6. Wen, Y.; Liu, B.B.; Li, Y.L.; Zhao, L. A Review of Research on the Impact of Urban Street Environment on Physical Activity: A Comparison between China and Developed Countries. Buildings 2024, 14, 1779. [Google Scholar] [CrossRef]
  7. Boeing, G. Spatial Information and the Legibility of Urban Form: Big Data in Urban Morphology. Int. J. Inf. Manag. 2021, 56, 102013. [Google Scholar] [CrossRef]
  8. Strano, E.; Viana, M.; Da Fontoura Costa, L.; Cardillo, A.; Porta, S.; Latora, V. Urban Street Networks: A Comparative Analysis of Ten European Cities. Environ. Plan. B Plan. Des. 2013, 40, 1071–1086. [Google Scholar] [CrossRef]
  9. Rui, J.; Othengrafen, F. Examining the Role of Innovative Streets in Enhancing Urban Mobility and Livability for Sustainable Urban Transition: A Review. Sustainability 2023, 15, 5709. [Google Scholar] [CrossRef]
  10. Fraser, M.P.; Yue, Z.W.; Buzcu, B. Source apportionment of fine particulate matter in Houston, TX, using organic molecular markers. Atmos. Environ. 2003, 37, 2117–2123. [Google Scholar] [CrossRef]
  11. Wang, B.; Wu, J.; Xu, X.; Li, Y. Hourly population exposure index for PM2.5 in urban street canyons. Urban Clim. 2022, 45, 101242. [Google Scholar] [CrossRef]
  12. Pant, P.; Harrison, R.M. Estimation of the contribution of road traffic emissions to particulate matter concentrations from field measurements: A review. Atmos. Environ. 2013, 77, 78–97. [Google Scholar] [CrossRef]
  13. Rakowska, A.; Wong, K.C.; Townsend, T.; Chan, K.L.; Westerdahl, D.; Ng, S.; Močnik, G.; Drinovec, L.; Ning, Z. Impact of traffic volume and composition on the air quality and pedestrian exposure in urban street canyon. Atmos. Environ. 2014, 98, 260–270. [Google Scholar] [CrossRef]
  14. Li, L.; Zheng, M.Q.; Zhang, J.; Li, C.; Ren, Y.; Jin, X.; Chen, J. Effects of green infrastructure on the dispersion of PM2.5 and human exposure on urban roads. Environ. Res. 2023, 223, 115493. [Google Scholar] [CrossRef]
  15. Liu, B.; Xu, Y.J.; Wang, G.Y.; Xie, J.M. Research on street environment optimization based on sidewalk PM2.5 exposure analysis. In Proceedings of the Green-Wisdom-Integration-Proceedings of the 2021/2022 China Urban Transportation Planning Annual Conference, Shanghai, China, 17–18 November 2022; Academic Committee of Urban Transportation Planning, China Society of Urban Planning, China Academy of Urban Planning and Design, Institute of Urban Transportation: Beijing, China, 2022; p. 17. [Google Scholar]
  16. Grzędzicka, E. Is the existing urban greenery enough to cope with current concentrations of PM2.5, PM10 and CO2? Atmos. Pollut. Res. 2019, 10, 219–233. [Google Scholar] [CrossRef]
  17. He, H.Y.; Zhu, Y.S.; Liu, L.; Liu, J. Effects of roadside trees three-dimensional morphology characteristics on traffic-related PM2.5 distribution in hot-humid urban blocks. Urban Clim. 2023, 49, 101448. [Google Scholar] [CrossRef]
  18. Karale, Y.; Yuan, M. How May Building Morphology Influence Pedestrians’ Exposure to PM2.5? Appl. Sci. 2024, 14, 5149. [Google Scholar] [CrossRef]
  19. Liao, N.S.; Van Den Eeden, S.K.; Sidney, S.; Deosaransingh, K.; Schwartz, J.; Uong, S.P.; Alexeeff, S.E. Joint associations between neighborhood walkability, greenness, and particulate air pollution on cardiovascular mortality among adults with a history of stroke or acute myocardial infarction. Environ. Epidemiol. 2022, 6, e200. [Google Scholar] [CrossRef]
  20. Tong, C.Z.; Shi, Z.C.; Shi, W.Z.; Zhao, P.; Zhang, A. Mapping Microscale PM2.5 Distribution on Walkable Roads in a High-Density City. IEEE J. Sel. Top. Appl. Earth Obs. Remote Sens. 2021, 14, 6855–6870. [Google Scholar] [CrossRef]
  21. James, P.; Hart, J.E.; Laden, F. Neighborhood walkability and particulate air pollution in a nationwide cohort of women. Environ. Res. 2015, 142, 703–711. [Google Scholar] [CrossRef] [PubMed]
  22. Li, H.M.; Li, S.M.; Zhang, F.; Shang, Y.; Qiu, Y.; Xun, B.; Wang, J.; Wang, S. Analysis of Three-Dimensional Green Volume and Ecological Benefits of Different Green Space Types in Xi’an City. Res. Environ. Sci. 2025, 38, 59–67. [Google Scholar]
  23. Ma, Y.X.; Cong, H.; Zhou, W.B.; Zhang, H. Landscape Pattern of Land Use Dynamic Development and Driving Force in Xi’an. J. Northwest For. Univ. 2017, 32, 186–192. [Google Scholar]
  24. Zhao, X.Z.; Li, M.X.; Feng, H.Z.; Li, T.; Rui, Y. The Population distribution and spatial structurin Xi’an City between 2000 and 2010. J. Northwest Univ. (Nat. Sci. Ed.) 2017, 47, 127–131. [Google Scholar]
  25. Lin, Y.C.; Sun, S.W.; Pan, Y.; Liu, C.Q.; Zhou, P. Spatio-temporal evolution, spatio-temporal clustering and risk prevention and control of PM2.5 exposure risk in China from 2001 to 2016. Hubei Agric. Sci. 2024, 63, 247–253, 260. [Google Scholar]
  26. Du, X.; Fu, L.X.; Zhu, H.C.; Cong, Q.; Hu, S.X.; Wu, J.; Xu, X.S. Exposure Assessment of Vehicle Exhaust Pollution in Wuhan, Hubei. J. Environ. Health 2010, 27, 241–243. [Google Scholar]
  27. Ministry of Ecology and Environment of the People’s Republic of China. China Population Exposure Parameters Handbook (Adults); China Environmental Science Press: Beijing, China, 2016.
  28. Denuit, M.; Trufin, J. Model selection with Pearson’s correlation, concentration and Lorenz curves under autocalibration. Eur. Actuar. J. 2023, 13, 871–878. [Google Scholar] [CrossRef]
  29. Qian, D.X.; Hu, Y.; Xiao, X.D.; Wang, L.F. Cutting-edge research on numerical simulation of urban microclimate—Taking ENVI-met as an example. Anhui Archit. 2023, 30, 12–14. [Google Scholar] [CrossRef]
  30. Yang, S.M.; Yi, H.L.; Wu, Y.L.; Luo, J.C.; Dai, S.P.; Tan, G.W. Simulation Research on Spatial Microclimate of thePlant Community inErsha Island Park Based on ENVI-met. Chin. J. Trop. Agric. 2023, 43, 68–76. [Google Scholar]
  31. GB 50352-2005; Unified Standard for Design of Civil Buildings. Ministry of Housing and Urban-Rural Development of the People’s Republic of China: Beijing, China, 2005.
  32. GB 50016-2014; Code for Fire Protection Design of Buildings. Ministry of Housing and Urban-Rural Development of the People’s Republic of China: Beijing, China, 2014.
  33. Jon, K.S.; Jong, S.I.; Ri, S.H.; Ko, J.Y.; Ko, S.G.; Kim, H.; Ryang, T.S.; Sin, C.H. Effects of increasing the degree of building height asymmetry on ventilation and pollutant dispersion within street canyons. Energy Built Environ. 2024, 5, 727–740. [Google Scholar] [CrossRef]
  34. Hao, W.N.; Guo, X.Y.; Li, J.W.; Dong, H.Z.; Chen, N. Research on vehicle exhaust dispersion modeling at urban signal intersection. J. Zhejiang Univ. Technol. 2017, 45, 94–98. [Google Scholar]
Figure 1. Geographic location of Xi’an.
Atmosphere 16 00947 g001
Figure 2. Road network density in Xi’an.
Atmosphere 16 00947 g002
Figure 3. Population distribution patterns in Xi’an.
Atmosphere 16 00947 g003
Figure 4. Spatiotemporal distribution of PM2.5 concentrations: winter (left) vs. summer (right) in Xi’an.
Atmosphere 16 00947 g004
Figure 5. Morphometric analysis of residential streets in Xi’an’s built-up area.
Atmosphere 16 00947 g005
Figure 6. Building morphology along residential streets in Xi’an’s built-up area.
Atmosphere 16 00947 g006
Figure 7. Seasonal PM2.5 exposure patterns in Xi’an’s built-up area.
Atmosphere 16 00947 g007
Figure 8. Walkability metric screening workflow.
Atmosphere 16 00947 g008
Figure 9. High-density zones for pedestrian-oriented planning metrics.
Atmosphere 16 00947 g009
Figure 10. Linear regression of observed vs. simulated PM2.5 concentrations.
Atmosphere 16 00947 g010
Figure 11. Parametric configuration of standardized street model.
Atmosphere 16 00947 g011
Figure 12. Simulated PM2.5 concentrations under varying height-to-width ratios.
Atmosphere 16 00947 g012
Figure 13. Calculated PM2.5 exposure levels under varying height-to-width ratios.
Atmosphere 16 00947 g013
Figure 14. Simulated PM2.5 concentrations under varying Build-to-Line ratios.
Atmosphere 16 00947 g014
Figure 15. Calculated PM2.5 exposure levels under varying Build-to-Line ratios.
Atmosphere 16 00947 g015
Figure 16. Sensitivity analysis of PM2.5 exposure to interactive effects of height-to-width ratio and Building-to-Line ratio.
Atmosphere 16 00947 g016
Table 1. Population exposure parameters for Shaanxi region (source: China Population Exposure Parameters Handbook).
Shaanxi ProvinceShort-Term Respiratory Rate of the Population (L/min)Time Spent on Outdoor Activities Not Related to Transportation (min/d)Recommended Duration of
Outdoor Activities (min/d)
RestingSittingLight Activity
Male6.37.59.4213185
Female5.16.17.6191172
18–44 years old5.86.98.7188173
45–59 years old5.87.08.7191188
60–79 years old4.75.67.0168180
80 years old and above4.25.16.4129140
Average5.46.58.1184180
Table 2. Component matrix of walkability indicators (varimax rotation).
Component 1Component 2Component 3Component 4
Shaded Street Coverage 0.899
Canopy Coverage Ratio 0.928
Walking Accessibility 0.823
Walking Score 0.739
Sidewalk Area Ratio 0.867
Air Quality Index (AQI) 0.7680.752
Urban Road Scale/Hierarchy 0.8760.689
Height-to-Width Ratio 0.968
Building-to-Line Ratio (BTR) 0.866
Building Height Variation 0.803
Building Setback Variation 0.767
Street Connectivity0.8230.677
Walking Score0.6520.762
Road Network Density0.798
Table 3. Field measurement streets in Xi’an’s built-up area.
Street NameRoad Network DensityWalkability IndexStreet Intersection DensityStreet WidthStreet Length
East Section of Renyi Road
(Beilin District)
3.95–7.0590359.97–473.1118 m320 m
Yandian Street
(Lianhu District)
3.95–7.0595359.97–473.1118 m280 m
Tangfang Street
(Lianhu District)
3.95–7.0595359.97–473.1118 m360 m
Liangjia Paifang Street
(Lianhu District)
3.95–7.0595359.97–473.1118 m300 m
Middle Section of West First Road
(Xincheng District)
3.95–7.0595359.97–473.1118 m330 m
West Section of East Seventh Road
(Xincheng District)
3.95–7.0593359.97–473.1118 m360 m
Table 4. Multiple regression analysis of PM2.5 exposure and core pedestrian-oriented design metrics.
Predictor VariableNon-Standardized CoefficientStandardized CoefficienttSignificanceR2Adjusted
R2
BStandard ErrorBeta
Pedestrian walkway area ratio−0.0380.001−0.123−0.2900.7070.8990.896
Tree-lined road coverage ratio−0.0420.001−0.289−5.772a-0.05
Height-to-width
ratio
−0.8210.042−0.68919.312<0.001
Build-to-line
ratio
2.3120.0820.70124.371<0.001
Tree canopy coverage ratio0.0850.0010.2317.1910.051
Building height stagger ratio−0.0630.001−0.295−7.521a-0.05
Table 5. Street model parameter settings.
ParameterValue/Specification
Street nameRenyi Road (eastern segment)
Coordinates34.26° N, 108.95° E
Start of simulation20 January 2024, 00:00 (UTC + 8)
Duration12 h
Grid resolution1 × 1 × 1 m
Grid dimensions400 (x) × 70 (y) × 30 (z)
VegetationTurfgrass (0.15 m); shrubs (1.0 m); arbor (10.0 m)
Pavement materialsLightweight concrete; vegetated soil
Wind speed2.4 m·s−1
Wind direction45° (NE)
Air temperatureMax: 4.3 °C; min: 0.6 °C
Relative humidityMax: 75%; min: 43.2%
Background PM2.5 79.5 µg·m−3
Table 6. Parametric modeling of street canyon configurations with varying height-to-width ratios.
Street OrientationAspect RatioBuilding HeightElevation Diagram
0.59 mAtmosphere 16 00947 i001
East–west orientation118 mAtmosphere 16 00947 i002
236 mAtmosphere 16 00947 i003
Table 7. Parametric modeling of street canyon configurations with varying build-to-line ratios.
Street OrientationBuild-to-Line RatiosBuilding Length and SpacingPlan View
63.2%Building of length 28 m, spacing of 15 mAtmosphere 16 00947 i004
East–west orientation70%Building length of 31 m, spacing of 12 mAtmosphere 16 00947 i005
76.8%Building length of 34 m, spacing of 9 mAtmosphere 16 00947 i006
Table 8. Framework for optimizing walkability metrics in residential streets.
Street CharacteristicsOptimization Strategy
Poor ventilationIncrease the height-to-width ratios of streets and
reduce the Build-to-Line ratios
Walkability design indicators that need to be regulated
Height-to-width ratiosBuild-to-Line ratios
Increase height-to-width ratiosReduce Build-to-Line ratios
For existing streets where significant alterations to height-to-width ratios or Build-to-Line ratios are constrained, secondary interventions can enhance airflow through architectural facade treatments. Strategically deployed balconies, undulating surface geometries, or angled curtain walls induce localized pressure gradients that increase near-ground ventilation, thereby reducing PM2.5 exposure concentrations within street canyons.
Disclaimer/Publisher’s Note: The statements, opinions and data contained in all publications are solely those of the individual author(s) and contributor(s) and not of MDPI and/or the editor(s). MDPI and/or the editor(s) disclaim responsibility for any injury to people or property resulting from any ideas, methods, instructions or products referred to in the content.