Abstract
Longnan is the largest olive cultivation area in China. The unique microclimates in Longnan make it an ideal testing ground for climate-resilient cultivation strategies with broader applications across similar regions, yet predictive models linking weather to oil quality remain scarce. This study establishes a climate suitability evaluation model for olive cultivation in central Longnan based on meteorological data and olive quality data in the Fotanggou planting base. Four key climatic factors are identified: cumulative sunshine hours during the fruit coloring to ripening period, average temperature during the fruit coloring to harvesting period, number of cloudy and rainy days during the harvesting period, and relative humidity during the fruit setting to fruit enlargement period. Olive oil quality is graded into three levels (Excellent III, Good II, Fair I) based on acidity, linoleic acid, and peroxide value using K-means clustering. A climate suitability index is developed by integrating these factors, with weights determined via principal component analysis. The model is validated against an olive quality report from the Dabao planting base, showing an 80% match rate. From 1991 to 2023, 87.9% of years exhibit suitable or moderately suitable conditions, with 100% of years in the past decade (2014–2023) reaching “Good” or “Excellent” levels. This model provides a scientific basis for evaluating and predicting olive oil quality, supporting sustainable olive industry development in Longnan. This model provides policymakers and farmers with actionable insights to ensure the long-term sustainability of olive industry amid climate uncertainty.
1. Introduction
Olive is widely noted for its high content of unsaturated fatty acids, antioxidant substances, and rich nutrients, and it has unique medicinal, edible, skin care, and other effects. The olive industry not only occupies an important position in the Mediterranean region but also includes extensive olive cultivation in some regions of China with a suitable climate, such as Gansu Province, which promotes agricultural economic development [1,2,3].
The cultivation of olive has certain requirements for temperature, sunshine, precipitation, and other climatic factors, which directly affect the oil accumulation and quality formation of olive [4,5]. Temperature acts as the main driver of olive tree phenology by regulating the release from the endo-dormancy period, after the accumulation of adequate cold units during wintertime, and the release from the eco-dormancy period, whose duration is dependent on forcing units cumulated from the end of endo-dormancy to the flowering stage [6,7]. An olive tree typically cannot withstand temperatures below −8 °C for more than one week. Very high summer temperatures may also limit its yield performance, namely, maximum temperatures higher than ~30 °C, and its photosynthetic rate when exceeding 40 °C.
Another very important climatic factor is precipitation [8]. Although olive trees are drought-tolerant species, their distribution in arid zones is limited by annual precipitation lower than 350 mm, and water availability is still considered an important resource to improve final yields. Other atmospheric factors, such as solar radiation, relative humidity, and wind, also affect the productivity of olive groves [9]. For example, olive trees should not be planted in wind-affected areas because cold and wet winds in spring can reduce the fertilization of flowers and fruit growth. In addition, high summer temperatures often lead to fruit drop, whereas dry winds tend to promote premature ripening and fruit wilting. Climatic conditions not only affect the growth of olive oil but also affect the chemical composition and sensory quality of olive oil. Therefore, it is necessary to determine the influence of climatic conditions on olive quality.
Climatic suitability of crops refers to the unique quality characteristics of crops produced under specific climatic conditions due to climatic factors [10]. Climate factors, including temperature, precipitation, sunlight, and humidity, not only directly affect the growth cycle of crops, but also affect the nutritional composition and taste of plants by regulating their physiological processes [11,12,13]. Therefore, understanding the relationship between climate factors and the quality of agricultural products has important guiding significance for agricultural production management, and helps to promote the brand and high quality of agricultural products in a specific region. In addition, with the increasing impact of climate change, rising global temperatures and frequent extreme weather events pose threats to the production and quality of agricultural products [14,15,16]. Under this background, the climate suitability evaluation of agricultural products is particularly important. The study of climate factors can help the agricultural sector to predict the potential impact of climate conditions on the quality of agricultural products and formulate corresponding adaptation measures [17,18,19].
The special climatic conditions in Longnan, Gansu Province provide a unique environment for the growth and quality of olive [1]. Longnan in Gansu Province is located in the transition zone from the subtropical zone to the north temperate zone, with a humid climate, abundant sunshine, abundant rainfall, and a frost-free period of more than 240 days, making Longnan one of the best suitable areas for olive production in China [2,3]. Longnan in Gansu Province has an olive planting area of 68,034 ha (21,337 ha at the young tree stage, 26,186 ha at the initial fruit stage and 20,510 ha at the full fruit stage) in Wudu District, Wen County, and Dangchang County, with a fresh fruit output of 54,000 tons and a comprehensive output value of CNY 4.5 billion, ranking first in China in terms of planting area, output, and output value.
Research regarding the following issues remains inconclusive: What are the key climatic factors influencing olive oil quality in Longnan? How can these factors be integrated into a quantitative climate suitability evaluation model? Therefore, the study represents the first attempt to establish a climate suitability evaluation index for olive in Longnan, Gansu Province by using meteorological, olive quality, and phenological observation data, through clustering and principal component analysis. The study aims to establish a novel evaluation framework for climatic suitability assessment in olive cultivation systems and make the evaluation framework adaptable to other regions via localized data.
2. Materials and Methods
2.1. Study Area
Olive samples from 13 planting bases in Wudu District, Longnan City, Gansu Province, China are used in this study (Figure 1a). All planting bases are located in the plains region of Wudu District (Figure 1b). This region lies in the transition zone between the northern subtropical semi-humid climate and the warm temperate semi-arid climate, characterized by a mild climate and distinct seasons [20]. Most olive groves in Longnan follow conventional management practices. Seven planting bases are owned by the Longnan Xiangyu Olive Oil Co., Ltd. (Longnan, China) with a total area of about 260 ha. The Fotanggou planting base (100,801.37 m2/10.08 ha) has a meteorological observation station (33°21′58′′ N, 105°01′48′′ E, 1086 m) located in the center of the planting base, which can accurately monitor the meteorological condition of the planting base (Figure 1c,e). Thus, the Fotanggou meteorological observation is used to represent the meteorological condition of the 7 planting bases. In addition, 6 planting bases are owned by Gansu Shiguang Olive Technology Co., Ltd. (Longnan, China) with a total area of about 175 ha. The Dabao meteorological observation (33°24′03′′ N, 104°53′30′′ E, 1036 m) inside the planting base is used to represent the meteorological condition of the 6 planting bases (Figure 1d). In this study, we establish the evaluation model by using the meteorological data and olive quality data from Fotanggou in Parts 3.1–3.5, and we verify the model by using data from Dabao in Part 3.6.
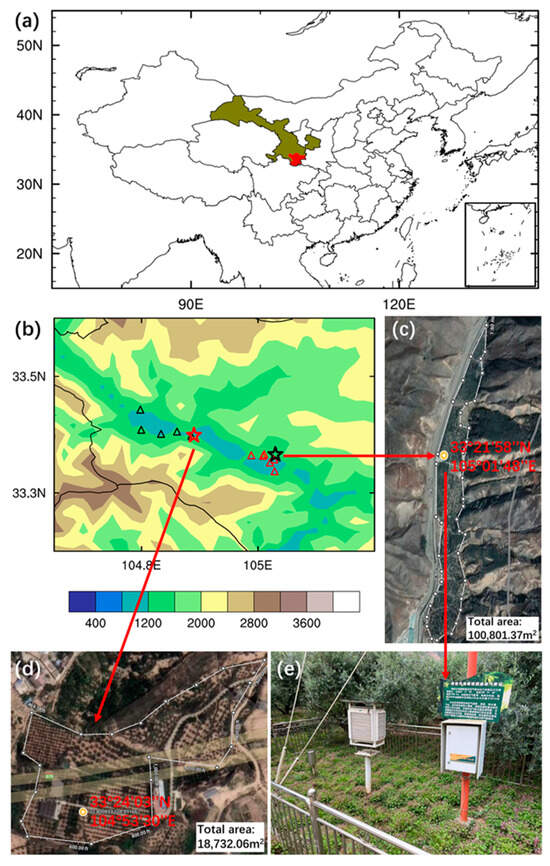
Figure 1.
(a) Map of China. Gansu Province is shown by green shading and Longnan City is shown by red shading. (b) Spatial distribution of elevation (m) in Wudu District, Longnan City, Gansu Province, and 13 olive samples’ locations. Red triangle and black star indicate planting base owned by Longnan Xiangyu Olive Oil Co., Ltd. (Longnan, China). Black triangle and red star indicate planting base owned by Gansu Shiguang Olive Technology Co., Ltd. (Longnan, China). Black and red star indicate the Fotanggou and Dabao planting base with meteorological observation station, respectively. (c) Fotanggou planting base in Google Map. (d) Dabao planting base in Google Map. The yellow stars in (c,d) show the position of Fotanggou meteorological observation station and Dabao meteorological observation station, respectively. (e) Fotanggou meteorological observation station in the planting base.
2.2. Data and Methods
The meteorological data from observational stations include daily maximum and minimum temperatures, relative humidity, precipitation, and sunshine during 1991–2023. Missing values were interpolated based on the observation data from the National Basic Meteorological Station. Figure 2 shows the long-term climate conditions of Fotanggou. From 1991 to 2020, the average annual temperature was 15.3 °C. The highest recorded extreme temperature was 38.6 °C (in 1996), and the lowest was −8.6°C (in 1991). The annual average temperature, annual average minimum temperature, and annual average maximum temperature in the study area all show a significant increasing trend, with climate trends of 0.3 °C, 0.3 °C, and 0.4 °C per 10 years, respectively. The correlation coefficients are 0.510, 0.556, and 0.636, all passing the 0.01 significance test, with the rise in the annual average minimum temperature being the most significant. The average annual precipitation is 469.3 mm, showing a significant increasing trend, with a precipitation trend rate of 33.5 mm per 10 years and a correlation coefficient of 0.393, passing the 0.05 significance test. The average annual sunshine duration is 1914.0 h, showing a decreasing trend, but the change is not significant. The Dabao planting base exhibits similar climate conditions.
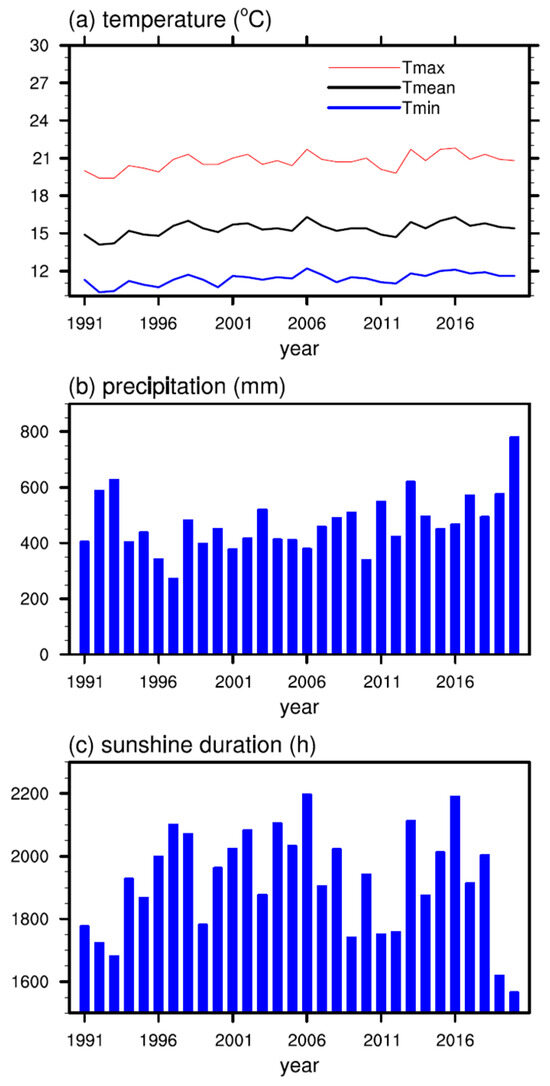
Figure 2.
(a) Annual average temperature, annual average minimum temperature, and annual average maximum temperature (°C), (b) precipitation (mm), and (c) sunshine duration (h) at the Fotanggou station from 1991 to 2020.
The olive physicochemical quality data in the 7 planting bases including Fotanggou during 2013–2022 were provided by the Longnan Xiangyu Olive Oil Co., Ltd. (Longnan, China). The evaluation of the physicochemical quality indicators of olive oil primarily includes acidity value, oleic acid, linoleic acid, peroxide value, and ultraviolet absorbance. Gansu Shiguang Olive Technology Co., Ltd. (Longnan, China) provided the olive physicochemical quality data in Dabao and the other 5 planting bases including acidity value during 2013–2022, which is used to verify the model in Part 3.6. By analyzing the interannual variation of the main quality indicators of Longnan olive oil from 2013 to 2022 at Fotanggou, it can be observed that the acidity, oleic acid, and peroxide value show a fluctuating downward trend, while linoleic acid and ultraviolet absorbance exhibit an upward trend (Figure 3). Among these, the most important influencing factors during the growth and development of the olive trees are acidity, oleic acid, and peroxide value. The lower the acidity, the better the oil quality; the higher the linoleic acid, the better the oil quality; and the lower the peroxide value, the fresher the oil. The physicochemical quality testing is based on GB/T 23347-2021 [21]. Based on the collected meteorological data and physicochemical quality data, we identify the key climate factors, which are proved to have significant effect on crop quality [6,22,23]. We constructed a comprehensive climate suitability index, like previous studies. Holzkämper et al. (2013) and Gourdji et al. (2015) constructed the climate suitability index by an empirical method and regression method, separately [24,25], but we implemented a principal component analysis method. The flow diagram summarizing the model development process is shown in Figure 4.
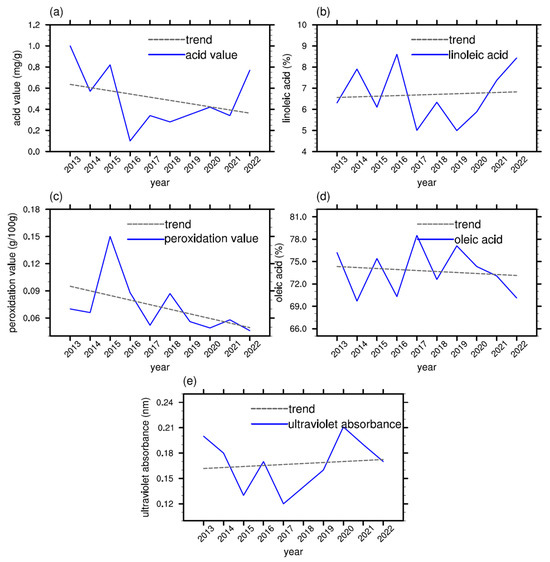
Figure 3.
Interannual variation (blue line) and linear trend (gray dashed line) of (a) acidity (mg/g), (b) linoleic acid (%), (c) peroxide value (g/100 g), (d) oleic acid (%), and (e) ultraviolet absorbance (nm) at Fotanggou planting base from 2013 to 2022.
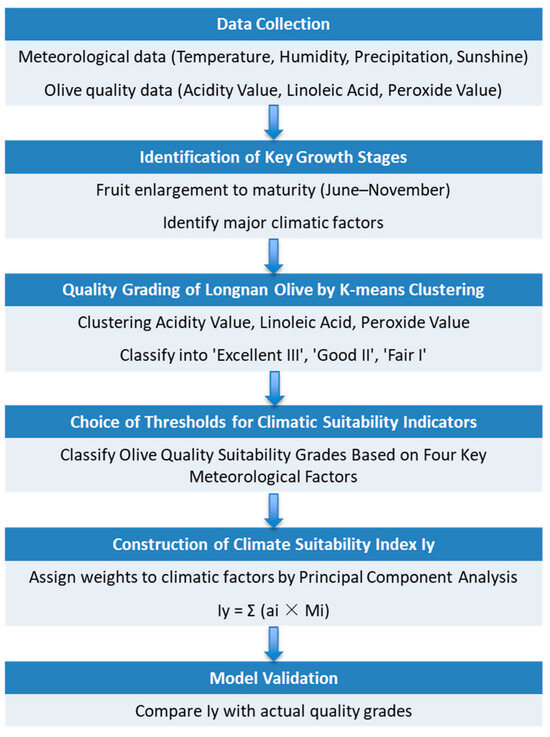
Figure 4.
Flow diagram of model development process.
3. Results
3.1. Identification of Key Growth Stages Affecting the Climate and Physicochemical Quality of Longnan Olive Oil
The intrinsic quality growth and development of olive oil are closely related to meteorological factors such as temperature, sunlight, humidity, and precipitation. From August to November, the main stages of fruit enlargement to ripening and harvesting occur, which is also the key period for the formation of olive oil quality. We selected eight associated meteorological factors as candidate indicators for evaluating the climate quality of Longnan olive oil from 42 preliminary meteorological factors (See Supplementary Materials). These selected factors have significant correlation with olive quality. These factors directly influence olive phenology, and they also satisfy expert judgment. A correlation analysis was conducted between these factors and the various quality indicators of olive oil. Table 1 shows the final selection of climate factors such as temperature, precipitation, and relative humidity that are significantly correlated with the quality indicators of acidity value, linoleic acid, and peroxide value in olive oil.

Table 1.
Correlation coefficients between different meteorological factors and olive oil quality indicators in Fotanggou planting base from 2013 to 2022.
From Table 1, the sunshine hours from early September to late October are significantly positively correlated with the acidity and peroxide value of olive oil. The sunshine hours from late October to mid-November show a significant positive correlation with olive acidity, while the number of rainy days during the same period is significantly negatively correlated with acidity. The average temperature from early September to late October, the average temperature from early June to late August and the average temperature from early July to mid-September is positively correlated with the peroxide value and linoleic acid. This is because, from the fruit setting to the maturity stage (early June to late October), the temperature should not fall below 18 °C. From the results of oil content measurements at different harvest times, it can be observed that when the temperature is ≥20 °C, the oil content increases. However, once the daily average temperature drops below 10 °C, the increase in oil content slows down, and it begins to decrease after approximately 20 days.
On the other hand, linoleic acid is also negatively correlated with the relative humidity from early June to late August and from early July to mid-September. The annual average relative humidity in major olive oil-producing regions of the world is 40–65%, while the relative humidity at the study site is approximately 53–62%, with the monthly average relative humidity ranging from 48 to 67%. According to Kong et al. (2019) [1], olive oil cultivation requires six months of relative humidity below 60%. Therefore, the relative humidity during the main fruiting period is the primary factor affecting the quality of the olives.
In addition, olive trees are a strongly photophilic species and are best suited for regions with annual sunshine hours of at least 1000 h, typically requiring over 1500 h. This is especially critical during the key fruit formation period (June–July), where sunlight is very important for development. Insufficient sunlight inhibits the physiological activities of olive trees, weakening the assimilation process, reducing photosynthetic products, lowering fruit yield, and affecting the oil content of the fruit.
3.2. Quality Grading of Longnan Olive Oil
The quality testing data and grading results for Longnan olive oil from 2013 to 2022 are shown in Table 2. K-means clustering analysis was performed on the acidity values, resulting in two cluster centers at 0.40 and 0.85. A value of Ac ≤ 0.40 corresponds to “Excellent III”, 0.40 < Ac ≤ 0.85 corresponds to “Good II”, and Ac > 0.85 corresponds to “Fair I”. For linoleic acid content, K-means clustering analysis was performed, yielding two cluster centers at 8.08 and 5.77. Linoleic acid levels of Li ≤ 8.08 are classified as “Excellent III”, 5.77 < Li ≤ 8.08 as “Good II”, and Li < 5.77 as “Fair I”. For oxidation value, K-means clustering analysis was also performed, yielding two cluster centers at 0.06 and 0.09. The peroxide value is divided into three levels: Pe ≤ 0.07, 0.07 < Pe ≤ 0.09, and Pe > 0.09, corresponding to “Excellent III”, “Good II”, and “Fair I”, respectively, as shown in Table 3. As shown in Table 2, from 2013 to 2022, the rate of “III” (“II” and above) of acidity value, peroxide value, and linoleic acid of Longnan olive oil are 50% (90%), 70% (90%), and 20% (80%), indicating the good quality of olive oil in Longnan.

Table 2.
Olive oil quality testing data at Fotanggou planting base from 2013 to 2022.

Table 3.
Grading of quality indicators for olive oil.
3.3. Choice of Thresholds for Climatic Suitability Indicators
The key growth stages for Longnan olive oil quality are as follows: fruit setting to fruit enlargement (early June to late August), fruit coloring to maturity (early September to late October), and harvest period (late October to mid-November). Combining the four key meteorological factors closely related to olive oil quality—sunshine duration from September to October, the number of cloudy and rainy days from late October to mid-November, average temperature from September to October, and relative humidity from early June to late August—cluster analysis was performed on these critical meteorological factors. Based on the grades of acid value, linoleic acid content, and peroxide value, the thresholds for these four climatic quality evaluation indicators were determined, as shown in Table 4. The suitable temperature is ≤18.1 °C, which aligns with the studies in the Mediterranean, such as 13–15.69 °C in Turkey [18] and approximately 15 °C in Spain [22].

Table 4.
Classification of olive oil quality suitability grades based on four key meteorological factors.
To illustrate the selection of thresholds for each climatic suitability indicator and their indicative role in olive oil quality, scatter plots of meteorological factors against acid value were first presented based on observational data from 2013 to 2022. For the indicator Ss (Figure 5a), when the climate suitability is rated as “Suitable III”, 80% of the acid values are classified as “Excellent III”. When the indicator is rated as “Moderately Suitable II”, 50% of the acid values are classified as “Good I”. For the indicator Cr (Figure 5b), when the climate suitability is rated as III, 100% of the acid values are classified as III. When the indicator is rated as II, 75% of the acid values are classified as II. For the indicator T (Figure 5c), when the climate suitability is rated as III, 80% of the acid values are classified as III. For the indicator Rh (Figure 5d), when the climate suitability is rated as III, 80% of the acid values are classified as III. When the indicator is rated as II, 75% of the acid values are classified as II. Overall, the classification of climatic suitability grades shows a good correspondence with the quality grades of olive oil acid values.
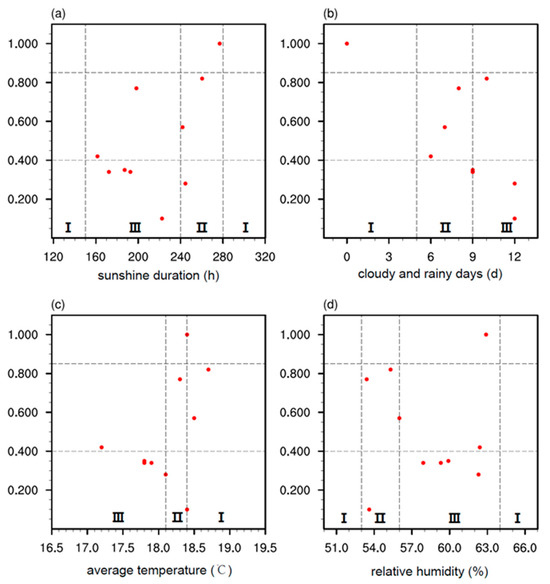
Figure 5.
Distribution of acidity value and corresponding climatic indicators for Longnan olive oil from 2013 to 2022. (a) Sunlight duration (hours) from September to October, (b) Number of rainy days (days) from late October to mid-November, (c) Average temperature (°C) from September to October, (d) Relative humidity (%) from early June to late August. The gray dashed lines represent the grading standards.
Based on observational data from 2013 to 2022, this study also presents scatter plots of meteorological factors against peroxide value. For the indicator Ss (Figure 6a), when the climate suitability is rated as III, 71% of the peroxide values are classified as III. For the indicator Cr (Figure 6b), when the climate suitability is rated as III, 50% of the peroxide values are classified as III. For the indicator T (Figure 6c), when the climate suitability is rated as III, 67% of the peroxide values are classified as III. When the indicator is rated as II, 67% of the peroxide values are classified as II. For the indicator Rh (Figure 6d), when the climate suitability is rated as III, 86% of the peroxide values are classified as III. Therefore, the classification of climatic suitability grades also shows a good correspondence with the quality grades of olive oil peroxide values.
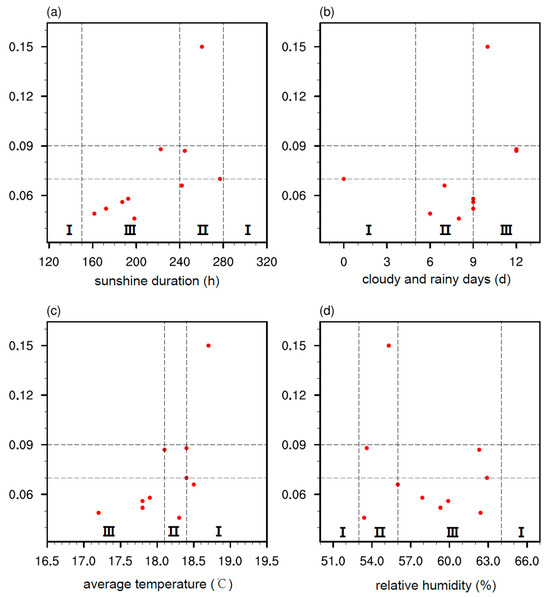
Figure 6.
Distribution of peroxide value and corresponding climatic indicators for Longnan olive oil from 2013 to 2022. (a) Sunlight duration (hours) from September to October, (b) Number of rainy days (days) from late October to mid-November, (c) Average temperature (°C) from September to October, (d) Relative humidity (%) from early June to late August. The gray dashed lines represent the grading standards.
In addition, scatter plots of meteorological factors against linoleic acid content were also presented. For the indicator Ss (Figure 7a), when the climate suitability is rated as II, 80% of the linoleic acid content values are classified as II. For the indicator Cr (Figure 7b), when the climate suitability is rated as II, 50% of the linoleic acid content values are classified as II. Overall, although the correspondence between climatic suitability grades and the quality grades of linoleic acid content in olive oil is not as strong as that observed for the other two olive oil quality indicators (acid value and peroxide value), it still provides a certain level of indication.
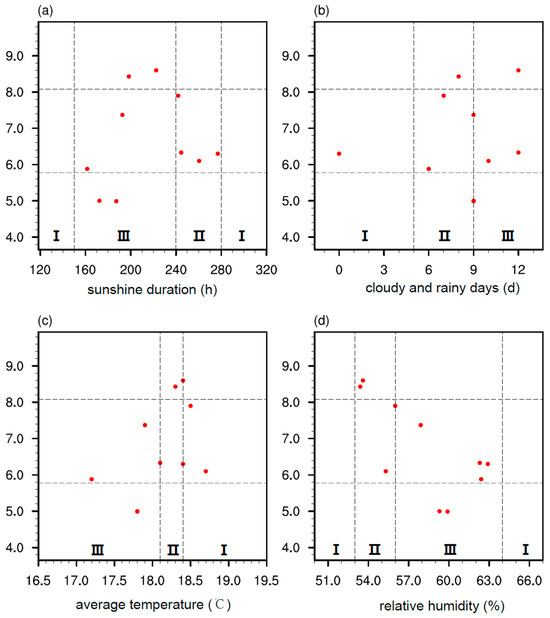
Figure 7.
Distribution of linoleic acid content and corresponding climatic indicators for Longnan olive oil from 2013 to 2022. (a) Sunlight duration (hours) from September to October, (b) Number of rainy days (days) from late October to mid-November, (c) Average temperature (°C) from September to October, (d) Relative humidity (%) from early June to late August. The gray dashed lines represent the grading standards.
Overall, the choice of the thresholds of the four climate indicators levels shows good consistency with the distribution of olive oil acidity levels, indicating meaningful guidance for olive oil acidity and quality.
3.4. The Climate Suitability Evaluation Model for Olive Oil
To demonstrate the combined effect of the four key meteorological factors influencing olive oil quality, a climate suitability evaluation index in every year for olive oil in Longnan, denoted as Iy, was constructed based on these four factors.
In the formula: Mi—The grade value of the i-th climatic suitability indicator, where “III” is assigned a value of 3, “II” a value of 2, and “I” a value of 1. ai—The weight coefficient of the i-th climatic quality indicator, where a1 to a4 correspond to the weight coefficients of Ss, Cr, T, and Rh, respectively. The weight coefficients were determined based on the principal component analysis (PCA) of the four meteorological factors (Ss, Cr, T, Rh) using SPSS software (version 22), with data from observations between 1991 and 2022. Specifically, the weight coefficients are as follows: weight coefficient for Ss: 0.32, weight coefficient for Cr: 0.23, weight coefficient for T: 0.28, and weight coefficient for Rh: 0.17. Sunshine duration is the most heavily weighted factor (0.32), which corroborates Fraga et al.’s (2021) emphasis on solar radiation in olive quality formation [7].
Correspondingly, the climate quality assessment is based on the climatic suitability index Iy, which is divided into three levels: Suitable (III), Moderately Suitable (II), and General (I). The comprehensive climate quality index Iy for Longnan olive oil from 1991 to 2022 was subjected to K-means clustering analysis, yielding two cluster centers: 2.4 and 1.8. The correspondence between these levels and climate quality, as well as the quality of Longnan olive oil, was analyzed. According to the clustering results, the 32-year values of Iy were categorized into three classes: Iy > 2.4, 1.8 ≤ Iy < 2.4, and Iy < 1.8, corresponding to the three levels of Longnan olive oil quality: “Excellent III,” “Good II,” and “Fair and Below I,” as shown in Table 5.

Table 5.
Classification and evaluation index of olive oil quality.
Using the meteorological data from the Fotanggou Special Agricultural Meteorological Observation Station in Wudu District from 2013 to 2023, the climatic suitability index Iy for the critical growth period of Longnan olive oil quality was calculated annually, as shown in Figure 8. When comparing the annual climate quality indices with the olive oil quality over the past decade, the years with suitable climate conditions corresponded to the years with “Excellent” olive oil quality for 5 years (a match rate of 83.3%). The years with suitable climate conditions corresponded to the years with “Good” olive oil quality for 4 years (a match rate of 80%). The year with general climate conditions corresponded to the year with “Fair” olive oil quality for 1 year (a match rate of 100%). Therefore, the Iy during the critical growth period represents a good indicator for the quality grade of olive oil at harvest.
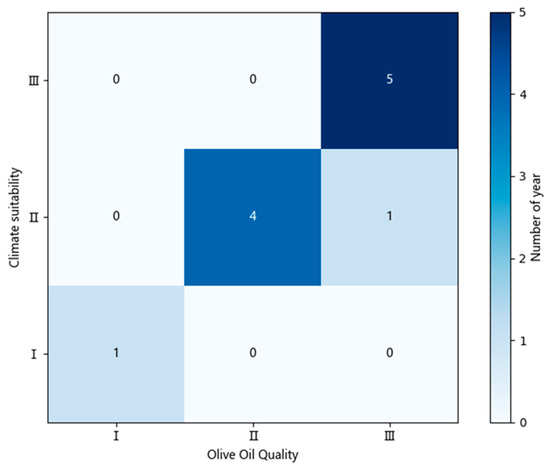
Figure 8.
Heatmap of climate quality evaluation index for olive oil (2013–2023).
3.5. Model Application
As indicated by the above analysis, the period from June 1st to November 20th is crucial for determining the quality of Longnan olive oil. The four meteorological factors—Ss (sunshine duration), Cr (number of cloudy and rainy days), T (average temperature), and Rh (relative humidity)—significantly influence its quality. Based on the climatological averages of these four indicators from 1991 to 2023, as shown in Table 6, the climatic grade levels derived from these averages are II, III, III, and III, respectively. The calculated Iy value is 2.68 (Grade III), which indicates that the overall climatic conditions are suitable for olive cultivation.

Table 6.
The climatology of meteorological factors and suitability grades.
The annual olive oil climate suitability index established based on the evaluation model from 1991 to 2023 is shown in Figure 9. Over the past 33 years, there were 15 years (45.5%) with Iy > 2.4, reaching Grade III, and 29 years (87.9%) with Iy ≥ 1.8, reaching Grade II or above. Particularly in the last decade (2014–2023), the average value of the Longnan olive oil climate quality evaluation index Iy was 2.2, reaching Grade II. There were 6 years with Grade III climate quality: 2016–2021, accounting for 60% of the decade. All 10 years reached Grade II or above, with a rate of 100%.
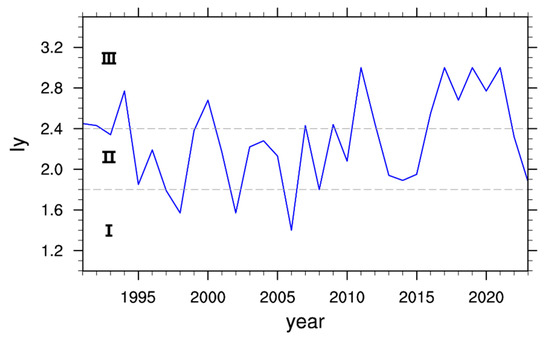
Figure 9.
Time series of Iy during 1991–2023; gray dash lines denote the threshold value of Iy classification.
In summary, based on the observational results from the Fotanggou Special Agricultural Meteorological Station in Wudu District, over the past 33 years, the climate conditions during the critical growth period of olive oil have been favorable for olive cultivation. Especially over the past ten years, with increasing temperature and precipitation, the climate conditions for olive oil cultivation have consistently been of high quality. The model’s classification of climatic suitability aligns with documented yield reports and farmer recollections of favorable production periods, particularly the consistent “Good-to-Excellent” ratings (2014–2023) corresponding to regional yield stability and premium oil production trends.
3.6. Applicability in Dabao Planting Base
Figure 10 shows Iy based on meteorological observation in the Dabao planting base and acid value provided by Gansu Shiguang Olive Technology Co., Ltd. (Longnan, China) during 2013–2022. The climate suitability evaluation index (Iy) and olive oil quality generally exhibit a negative relationship. During 2013–2022, there were 6 years (60%) with Iy > 2.4, reaching Grade III, and 4 years (40%) with 2.4 ≥ Iy ≥ 1.8, reaching Grade II. The ratio corresponds well with the grade of olive oil quality. The climate suitability evaluation index (Iy) established by the above method can indicate the olive quality in 8 years except 2016 and 2022. Therefore, the evaluation model is applicable to the Dabao planting base. Note that the Dabao planting base is near to the Fotanggou planting base with a 13 km distance, so the model is applicable to both. If the method is used for another planting base, the weight coefficient of climatic quality indicator (ai) should be changed based on the nearest meteorological observation. While the climate suitability model demonstrates strong predictive power for olive oil quality in Longnan, non-climatic factors, such as soil and agronomic practices, extreme weather events, and cultivar-specific responses, may also contribute to observed variations.
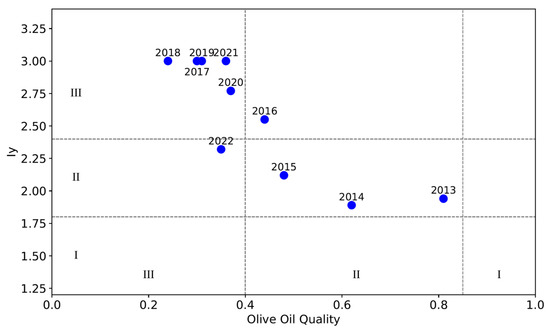
Figure 10.
Scatter diagram of Iy and olive oil quality in Dabao planting base during 2013–2022.
4. Discussion
The climate suitability evaluation model developed in this study provides a robust framework for assessing the impact of climatic conditions on olive oil quality in Longnan, China. The results highlight Longnan’s suitability for olive cultivation, particularly in the past decade, where climatic conditions consistently supported high-quality production.
The evaluation model is established by four key climatic factors—sunshine duration, average temperature, cloudy days, and relative humidity—that significantly influence olive oil quality. The findings align with Mediterranean studies but show region-specific difference. For instance, our temperature thresholds (≤18.1 °C during the fruit coloring period to harvesting period) align with the Mediterranean, such as 13–15.69 °C in Turkey [18] and approximately 15 °C in Spain [22], while a suitable rain amount for olive in Longnan is less than in the Mediterranean [8,26]. Our finding that sunshine duration is the most heavily weighted factor (a1 = 0.32) corroborates Fraga et al.’s (2021) emphasis on solar radiation in olive quality formation [7].
Unlike traditional yield-focused models [9,13], our study prioritizes oil quality metrics (acidity, linoleic acid, peroxide value) and employs PCA to dynamically weight climatic factors, enhancing precision. This approach advances Holzkämper et al.’s empirical methods [24] and Gourdji et al.’s regression-based indices [25]. The model’s validation across two planting bases (Fotanggou and Dabao) further confirms its robustness for local applications, offering a replicable framework for other crops.
The climate suitability model developed in this study offers significant implications. For Longnan’s olive industry, this model enhances climate-smart olive cultivation by guiding optimal planting zones and harvest timing through phenological-stage-specific climatic thresholds. This model can not only be used to assess olive oil quality but also to be integrated into early warning systems or seasonal forecasting tools via real-time monitoring of key factors, e.g., sunshine hours and temperature, thereby providing a scientific reference for irrigation planning and improving olive oil quality and ensuring the economic benefits of this crop. Beyond local applications, the model’s framework can be adapted to other specialty crops and regions by recalibrating the PCA weights with local climate data, offering a versatile tool for climate-resilient agriculture worldwide.
While this study provides valuable insights into climate-quality relationships, several limitations point to important future research directions. In addition to the average climatic conditions during the olive growing period, extreme weather events such as heavy rain, extreme temperatures, and hail can also affect olive oil quality. Since the evaluation model established in this study only considers the average climatic conditions during the growing period and does not include the impact of extreme weather and other meteorological disasters, it is necessary to continuously improve the model indicators in the future to enhance the refinement and incorporate with disaster risk modules [14,23,27]. The prediction of olive is complex since factors such as pests, landscape complexity, agrochemical inputs, and presence of native flora can have a positive or negative effect on the olive oil quality. These advancements would transform the current framework into a more comprehensive decision-support tool for sustainable agriculture under changing climatic conditions.
5. Conclusions
Based on observational data from the agricultural meteorological stations in the Fotanggou and Dabao planting bases, Wudu, Longnan, China, and the olive oil quality inspection reports provided by Longnan Xiangyu and Gansu Shiguang Olive Oil Co., Ltd. (Longnan, China), this study established a climate suitability evaluation model for olive oil. The reliability of the model and its indicative effect for regional olive quality was assessed. The main conclusions drawn from this study are as follows:
- (1)
- From August to November is the primary stage for olive fruit expansion to maturation and harvesting, and it is also the critical period for quality formation. Among the 42 candidate meteorological factors, the cumulative sunshine duration during the fruit coloring period to maturity period (September to October), the average temperature during the fruit coloring period to harvesting period (September to October), the number of cloudy and rainy days during the harvesting period (October 21 to November 20), and the relative humidity during the fruit setting period to fruit expansion period (June to August) show high correlation with the formation of key olive oil qualities. These factors are important for the olive tree functions and the growth of the olive fruit; thus, these factors are identified as the key meteorological factors influencing olive oil quality formation.
- (2)
- Based on the four key factors mentioned above, a climatic suitability evaluation model for Longnan olive oil was constructed and the climatic suitability index Iy was developed. An evaluation of the model index from 2014 to 2023 revealed that over the past decade, the match rate between suitable climate conditions and years with “Excellent” olive oil quality was 83.3%. The match rates for other quality grades were also above 80%. It is verified that the model is applicable in the Dabao planting base in Longnan. Therefore, the Iy during the critical growth period represents a good indicator for the quality grade of olive oil at harvest. The model is applicable globally by calibrating weights via PCA using local meteorological data and cultivar-specific phenology data.
- (3)
- Through the analysis of the Iy index from 1991 to 2023, it was found that over the past 32 years, there were 29 years (87.9%) with climatic conditions suitable or moderately suitable for olive cultivation. Especially in the most recent decade, this figure reached 100%. This indicates that selecting the Longnan, Gansu as a specialized olive oil production area has significant scientific and demonstrative value. However, it is explicitly noted that genetic improvements, agricultural inputs, and storage techniques may have improved the olive quality, particularly in recent years.
Supplementary Materials
The following supporting information can be downloaded at: https://www.mdpi.com/article/10.3390/atmos16080948/s1, Table S1: 42 Preliminary Meteorological Indicators for Climate Quality Evaluation of Olive in Longnan.
Author Contributions
Conceptualization, L.L. and Y.M.; Formal analysis, L.L.; Methodology, L.L. and Y.M.; Software, L.L. and Y.N.; Writing—original draft, L.L. and Y.M.; Writing—review and editing, Y.N. All authors have read and agreed to the published version of the manuscript.
Funding
This research was funded by the project on the climatic suitability zoning and simulation experiment of characteristic agricultural products in Longnan, the project on the analysis and assessment of climate resources and the meteorological disaster risk zoning of characteristic agricultural products in Longnan, the project on the scientific research and technological breakthroughs as well as promotion of greening of exposed gullies and slopes in the northern part of Wudu District, Longnan, and the Wuxi University Research Start-up Fund for Introduced Talents (Grant No.2024r039).
Institutional Review Board Statement
Not applicable.
Informed Consent Statement
Not applicable.
Data Availability Statement
The data that support the findings of this study are available on request from the corresponding author, Li Liu.
Conflicts of Interest
The authors declare no conflicts of interest. The funders had no role in the design of the study; in the collection, analyses, or interpretation of data; in the writing of the manuscript; or in the decision to publish the results.
Abbreviations
The following abbreviations are used in this manuscript:
| Ac | Acidity value |
| Cr | Cloudy and rainy days |
| Iy | The yearly comprehensive climate quality index |
| Li | Linoleic acid |
| Pe | Peroxide value |
| Rh | Relative humidity |
| Ss | Sunshine duration |
| T | Average temperature |
References
- Kong, W.; Han, R.; Liu, N.; Bai, W.; Ma, J.; Bai, X.; Liang, J.; Wang, J.; Zhang, J. Dynamic Assessment of the Fruit Quality of Olives Cultivated in Longnan (China) during Ripening. Sci. Hortic. 2019, 253, 8–16. [Google Scholar] [CrossRef]
- Wang, J.; Ma, L.; Gómez-del-Campo, M.; Zhang, D.; Deng, Y.; Jia, Z. Youth Tree Behavior of Olive (Olea europaea L.) Cultivars in Wudu, China: Cold and Drought Resistance, Growth, Fruit Production, and Oil Quality. Sci. Hortic. 2018, 236, 106–122. [Google Scholar] [CrossRef]
- Wang, J.; Zhang, D.; Farooqi, T.J.A.; Ma, L.; Deng, Y.; Jia, Z. The Olive (Olea europaea L.) Industry in China: Its Status, Opportunities and Challenges. Agrofor. Syst. 2019, 93, 395–417. [Google Scholar] [CrossRef]
- Grattan, S.R.; Berenguer, M.J.; Connell, J.H.; Polito, V.S.; Vossen, P.M. Olive Oil Production as Influenced by Different Quantities of Applied Water. Agric. Water Manag. 2006, 85, 133–140. [Google Scholar] [CrossRef]
- Rallo, L.; Díez, C.M.; Morales-Sillero, A.; Miho, H.; Priego-Capote, F.; Rallo, P. Quality of Olives: A Focus on Agricultural Preharvest Factors. Sci. Hortic. 2018, 233, 491–509. [Google Scholar] [CrossRef]
- Fraga, H.; Pinto, J.G.; Viola, F.; Santos, J.A. Climate Change Projections for Olive Yields in the Mediterranean Basin. Int. J. Climatol. 2020, 40, 769–781. [Google Scholar] [CrossRef]
- Fraga, H.; Moriondo, M.; Leolini, L.; Santos, J.A. Mediterranean Olive Orchards under Climate Change: A Review of Future Impacts and Adaptation Strategies. Agronomy 2021, 11, 56. [Google Scholar] [CrossRef]
- Gómez-Rico, A.; Salvador, M.D.; Moriana, A.; Pérez, D.; Olmedilla, N.; Ribas, F.; Fregapane, G. Influence of Different Irrigation Strategies in a Traditional Cornicabra Cv. Olive Orchard on Virgin Olive Oil Composition and Quality. Food Chem. 2007, 100, 568–578. [Google Scholar] [CrossRef]
- Salomone, R.; Ioppolo, G. Environmental Impacts of Olive Oil Production: A Life Cycle Assessment Case Study in the Province of Messina (Sicily). J. Clean. Prod. 2012, 28, 88–100. [Google Scholar] [CrossRef]
- He, Q.; Zhou, G. The Climatic Suitability for Maize Cultivation in China. Chin. Sci. Bull. 2012, 57, 395–403. [Google Scholar] [CrossRef]
- Pan, Y.; Yang, R.; Qiu, J.; Wang, J.; Wu, J. Forty-Year Spatio-Temporal Dynamics of Agricultural Climate Suitability in China Reveal Shifted Major Crop Production Areas. CATENA 2023, 226, 107073. [Google Scholar] [CrossRef]
- Viola, F.; Caracciolo, D.; Pumo, D.; Noto, L.V.; Loggia, G.L. Future Climate Forcings and Olive Yield in a Mediterranean Orchard. Water 2014, 6, 1562–1580. [Google Scholar] [CrossRef]
- Wu, D.; Wang, P.; Huo, Z.; Yuan, X.; Jiang, H.; Yang, J.; Tang, J.; Ma, Y. Changes in Climate Suitability for Oil-Tea (C. Oleifera Abel) Production in China under Historical and Future Climate Conditions. Agric. For. Meteorol. 2022, 316, 108843. [Google Scholar] [CrossRef]
- Arenas-Castro, S.; Gonçalves, J.F.; Moreno, M.; Villar, R. Projected Climate Changes Are Expected to Decrease the Suitability and Production of Olive Varieties in Southern Spain. Sci. Total Environ. 2020, 709, 136161. [Google Scholar] [CrossRef]
- Özdel, M.M.; Ustaoğlu, B.; Cürebal, İ. Modeling of the Potential Distribution Areas Suitable for Olive (Olea europaea L.) in Türkiye from a Climate Change Perspective. Agriculture 2024, 14, 1629. [Google Scholar] [CrossRef]
- Verma, S.; Singh, A.; Pradhan, S.S.; Kushuwaha, M. Impact of Climate Change on Agriculture: A Review. Int. J. Environ. Clim. Change 2024, 14, 615–620. [Google Scholar] [CrossRef]
- Lv, T.; Peng, S.; Liu, B.; Liu, Y.; Ding, Y. Planting Suitability of China’s Main Grain Crops under Future Climate Change. Field Crops Res. 2023, 302, 109112. [Google Scholar] [CrossRef]
- Ozalp, A.Y.; Akinci, H. Evaluation of Land Suitability for Olive (Olea europaea L.) Cultivation Using the Random Forest Algorithm. Agriculture 2023, 13, 1208. [Google Scholar] [CrossRef]
- Bilgilioğlu, S.S. Land Suitability Assessment for Olive Cultivation Using GIS and Multi-Criteria Decision-Making in Mersin City, Turkey. Arab. J. Geosci. 2021, 14, 2434. [Google Scholar] [CrossRef]
- Wen, X.; Wu, X.; Gao, M. Spatiotemporal Variability of Temperature and Precipitation in Gansu Province (Northwest China) during 1951–2015. Atmos. Res. 2017, 197, 132–149. [Google Scholar] [CrossRef]
- GB/T 23347-2021; Olive Oil and Olive Pomace Oil. National Standardization Administration: Beijing, China, 2021. (In Chinese)
- Pérez-López, D.; Ribas, F.; Moriana, A.; Rapoport, H.F.; De Juan, A. Influence of Temperature on the Growth and Development of Olive (Olea europaea L.) Trees. J. Hortic. Sci. Biotechnol. 2008, 83, 171–176. [Google Scholar] [CrossRef]
- Gratsea, M.; Varotsos, K.V.; López-Nevado, J.; López-Feria, S.; Giannakopoulos, C. Assessing the Long-Term Impact of Climate Change on Olive Crops and Olive Fly in Andalusia, Spain, through Climate Indices and Return Period Analysis. Clim. Serv. 2022, 28, 100325. [Google Scholar] [CrossRef]
- Holzkämper, A.; Calanca, P.; Fuhrer, J. Identifying Climatic Limitations to Grain Maize Yield Potentials Using a Suitability Evaluation Approach. Agric. For. Meteorol. 2013, 168, 149–159. [Google Scholar] [CrossRef]
- Góm Gourdji, S.; Läderach, P.; Valle, A.M.; Martinez, C.Z.; Lobell, D.B. Historical Climate Trends, Deforestation, and Maize and Bean Yields in Nicaragua. Agric. For. Meteorol. 2015, 200, 270–281. [Google Scholar] [CrossRef]
- Gómez, J.A.; Giráldez, J.V.; Fereres, E. Rainfall Interception by Olive Trees in Relation to Leaf Area. Agric. Water Manag. 2001, 49, 65–76. [Google Scholar] [CrossRef]
- Martins, S.; Pereira, S.; Dinis, L.-T.; Brito, C. Enhancing Olive Cultivation Resilience: Sustainable Long-Term and Short-Term Adaptation Strategies to Alleviate Climate Change Impacts. Horticulturae 2024, 10, 1066. [Google Scholar] [CrossRef]
Disclaimer/Publisher’s Note: The statements, opinions and data contained in all publications are solely those of the individual author(s) and contributor(s) and not of MDPI and/or the editor(s). MDPI and/or the editor(s) disclaim responsibility for any injury to people or property resulting from any ideas, methods, instructions or products referred to in the content. |
© 2025 by the authors. Licensee MDPI, Basel, Switzerland. This article is an open access article distributed under the terms and conditions of the Creative Commons Attribution (CC BY) license (https://creativecommons.org/licenses/by/4.0/).