Abstract
A new generation of compact radon detectors with high sensitivity and fine spatial resolution (1–2 cm scale) was used to investigate indoor radon distribution and identify potential entry pathways. Solid-state nuclear track detectors (Kodak-Pathe LR-115 type II, Dosirad, France), combined with activated carbon fabric (ACC-5092-10), enabled sensitive, spatially resolved radon measurements. Two case studies were conducted: Case 1 involves a room with elevated radon levels suspected to originate from the floor. Case 2 involves a house with persistently high indoor radon concentrations despite active basement ventilation. In the first case, radon emission from the floor was found to be highly inhomogeneous, with concentrations varying by more than a factor of four. In the second, unexpectedly high radon levels were detected at electrical switches and outlets on walls in the living space, suggesting radon transport through wall voids and entry via non-hermetic electrical fittings. These novel detectors facilitate fine-scale mapping of indoor radon concentrations, revealing ingress routes that were previously undetectable. Their use can significantly enhance radon diagnostics and support the development of more effective mitigation strategies.
1. Introduction
Radon-222 (222Rn), a proven carcinogen [1] and the second leading cause of lung cancer after smoking [2], has long attracted attention due to its health risks associated with indoor exposure in dwellings and workplaces [3]. The development of radon measurement methods and instruments for typical indoor concentration levels has a history spanning several decades [4]. In contrast, interest in measuring the low radon concentrations of outdoor air has emerged more recently, primarily over the past decade. This growing interest has been driven by findings that outdoor radon levels can aid in delineating radon priority areas [5,6]—a requirement under a European Council Directive [7] and can also contribute to climate change research [8,9,10,11]. These developments have further stimulated technical and methodological innovations [12,13], enabling quantitative measurements of radon concentrations as low as 1 Bq m−3 or even lower [12,13,14].
Some newly developed instruments are active, relatively large, and primarily intended for climate-related research applications [8,12,13]. Another direction, extensively advanced in recent years, focuses on small, highly sensitive radon detectors with local spatial sensitivity [14].
Activated carbon’s high radon adsorption capacity has been recognized for over a century [15] and widely applied in radon sampling and measurement [4,16]. The concept of coupling activated carbon with alpha-particle detectors to achieve high detection sensitivity was first explored in the 1990s [17,18,19]. However, progress was limited by the adverse influence of humidity [20,21,22] and temperature sensitivity [23,24], restricting activated carbon-based methods primarily to short-term (2–7 days) sampling followed by analysis via liquid scintillation counting or gamma spectrometry.
More recently, activated carbon fabrics have been investigated as adsorbers/radiators in conjunction with alpha-particle detectors [25,26,27]. These fabrics not only offer excellent radon adsorption capacity, but their textile nature makes them especially convenient for integration with various detector types. Certain fabrics maintain high radon adsorption capacity even when saturated with water [28,29]. Furthermore, the development of a novel “compensation module” that mitigates humidity and temperature effects [14] has enabled long-term radon detection using this approach.
The sensitivity of this new generation of radon detectors has been shown to surpass that of conventional detectors by one to two orders of magnitude for the same exposure duration [30]. Radon concentrations as low as 10 Bq m−3, or even lower, can now be reliably measured by passive detectors within less than one week of exposure [30]. In addition to outdoor monitoring, this advancement opens up new possibilities in areas that conventional methods have struggled to address. For example, such detectors were recently employed to study radon distribution near the soil–air interface, yielding novel insights [31].
A particularly promising application of these novel detectors is radon diagnostics in buildings. In the European Union, the reference level is set for annual average indoor radon concentration in dwellings and workplaces, which should not exceed 300 Bq m−3 in any of the member states. The above reference-level remediation measures should be considered [7]. While the identification of radon-exceeding dwellings relies on long-term measurements to assess annual averages [2], effective mitigation design requires short-term diagnostic measurements [32,33,34]. These diagnostics help investigate indoor radon distribution and identify entry pathways—crucial for the development of efficient mitigation strategies [34].
The latest advancements in radon detection fill a critical gap in current diagnostic practices. These detectors can be extremely compact (1–2 cm), and their local sensitivity, in which signals correlate directly with radon concentration at the point of placement, enables high-resolution mapping of indoor radon distributions. This allows for the detection of previously unidentified, including unconventional, radon ingress routes.
In this work, the newly developed radon detectors were used to investigate radon ingress pathways in two case studies:
- Case 1 involved a room with elevated radon levels. The detectors were deployed to map radon release from the floor at fine spatial resolution.
- Case 2 involved a house where mitigation efforts yielded inconsistent results. The detectors helped identify previously unrecognized radon entry routes, including an unusual pathway that conventional diagnostic methods likely would have missed.
Both cases highlight diagnostic challenges that conventional radon measurement techniques struggle to address, demonstrating the added value of these new-generation detectors.
2. Materials and Methods
The core method employed involved the use of activated carbon fabric ACC-5092-10 (Kynol Europe GmbH, Hamburg, Germany) coupled with a solid-state nuclear track detector, Kodak Pathe LR-115 type II (Figure 1). The ACC-5092-10 fabric has demonstrated excellent radon adsorption capacity [14,30], and notably, it maintains high adsorption capacity across the full range of relative humidity (RH), from 0% to 100% [28,29].
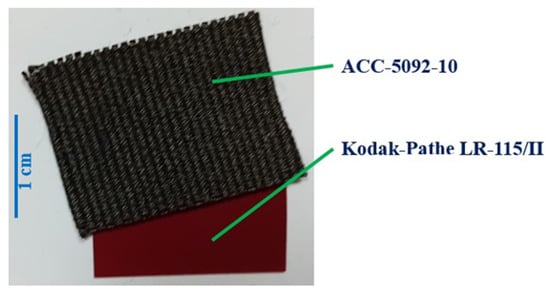
Figure 1.
Photograph of the detector. A simple configuration, coupling activated carbon fabric (ACC-5092-10) with a solid-state nuclear track detector (Kodak Pathe LR-115 type II), results in a highly sensitive radon detector with local spatial resolution.
In this setup, the fabric acts as both an adsorber and a radiator: radon and its short-lived progeny adsorbed onto the fabric emit alpha particles, which can strike the surface of the adjacent track detector and create latent tracks. To make these tracks visible, chemical etching is applied. For Kodak Pathe LR-115 type II, etching is performed using a 10% NaOH solution at 60 °C for 100 min, followed by a 30 min rinse in agitated water and a final 2 min wash in a still 50% ethanol solution. After drying, tracks are counted visually under a microscope. The net track density (i.e., the number of tracks per unit detector area, with background subtracted) is then determined.
Radon may diffuse into the fabric before being captured by a nanometric trap. The energy of alpha particles emitted by 222Rn and its progeny is reduced due to absorption within the material. However, the detector used can register alpha tracks over a relatively broad energy range (1.5–4.2 MeV) and at incidence angles up to 60° from the normal [35,36], enabling the detection of a substantial fraction of alpha particles emitted within the adsorber volume.
To calculate the average radon activity concentration (measured in Bq m−3), the calibration factor (CF—defined as the ratio of net track density to the integrated radon activity concentration) is required. The determination of CF under various temperature and humidity conditions is described in detail elsewhere [14,29,30]. The average radon activity concentration cA over an exposure time t is then calculated using the following equation:
where n is the net track density. The background track density of the detectors used in this study was determined to be 20 ± 3 tracks cm−2. The uncertainty in track density arises from the Poisson statistics associated with the number of tracks counted. The CF used in Equation (1) must be adjusted according to the average temperature and RH during the exposure period, as detailed in [14,30]. As shown in [30], CF remains constant within the RH range of 0–50%. Between RH 50% and 60%, the CF decreases gradually by a factor of 2.5 and then stabilizes again for RH levels between 60% and 100%.
Sensitivity estimates presented in [30] demonstrate that the ACC-5092-10 fabric coupled with Kodak Pathe LR-115 type II detectors achieves a sensitivity 5 to 12 times higher than that of conventional passive radon detectors currently in use. The compact size of these detectors (1–2 cm) and their local sensitivity allow for detailed mapping of radon distribution at a fine spatial scale. This capability is especially valuable for identifying radon entry routes and for mapping radon release patterns on floors, which can indicate specific points of ingress.
The detectors used in this study were also evaluated for sensitivity to thoron (220Rn) using laboratory calibration equipment, as described in [37]. It was found that the calibration factor for thoron is approximately 20% of that for radon. To assess potential thoron interference at the studied locations, grab sampling measurements of both radon and thoron were conducted using the AlphaGUARD PQ 2000 PRO RnTn monitor (Saphymo/Bertin Instruments, Frankfurt am Main, Germany).
Two case studies were carried out. The first involved a room with a floor area of 16.7 m2 (4.5 × 3.7 m), where the annual average radon concentration exceeded the Bulgarian reference level of 300 Bq m−3 [38]. Retrospective measurements using CD/DVDs indicated an average concentration of 650 Bq m−3 [39]. An increase in radon levels was observed following an energy-efficiency retrofit conducted in 2011 [39]. Beneath the room was a ~1 m thick layer of porous slag, directly in contact with the ground, over which a layer of putty supported the wooden floor (parquet). There was no basement or other void beneath the room.
To map radon release from the floor, 20 detectors were placed directly on the floor in a grid layout (Figure 2), forming squares of 0.9 × 0.9 m (one detector per square), and exposed for 92 h (in April 2025) under closed-door and closed-window conditions. Additionally, two detectors were positioned approximately 1 m above the floor on bookshelves at different locations within the room, and one control detector was placed in another “normal” room without elevated radon levels. During exposure, the average temperature was 24 °C and RH ranged from 42% to 44%.

Figure 2.
A labeled detector is placed on the wooden floor of the room (Case 1).
The minimum detectable activity concentration (MDAC) for this exposure time and environmental conditions, calculated according to the algorithm in [30], was approximately 20 Bq m−3. The algorithm is based on the ISO 11929 standard [40] and determines the minimum activity concentration that can be measured with 95% statistical confidence.
The second case involved a house with a complex and controversial history of indoor radon behavior following mitigation efforts. For over five years, indoor radon concentrations were continuously monitored using a home radon monitor (Model 2950 Wave Radon—Smart Radon Detector with Humidity & Temperature Sensor, Airthings Wave Plus, Airthings Ltd., Oslo, Norway). During this period, radon concentrations in the living space (ground floor) ranged between 400 and 1200 Bq m−3, while concentrations in the basement were 1.5 to 1.8 times higher. Control grab sampling measurements performed with the AlphaGUARD monitor confirmed these values. The average radon concentration was 410 ± 52 Bq m−3 in the living space and 750 ± 60 Bq m−3 in the basement, yielding a basement-to-living space ratio of 1.83 ± 0.28.
Based on both local observations and global experience, radon exhalation from the ground beneath the basement was initially considered the primary source of indoor radon. Consequently, the first mitigation attempt involved active basement ventilation. While this reduced radon concentrations in the basement to 20–50 Bq m−3, levels in the living space remained largely unchanged (300–1100 Bq m−3), casting doubt on the original assumption that the basement floor was the main radon entry route. This prompted an investigation into possible alternative, less typical pathways for radon ingress.
To explore this, 18 detectors were placed at various locations on floors and walls (Figure 3), along pipe routes, and near electrical outlets and switches (Figure 4). The detectors were exposed for 66 h under closed-door and closed-window conditions, with basement ventilation switched off. The average temperature during the exposure period was 24 °C and RH was 73%. The MDAC under these conditions, calculated using the method described in [30], was approximately 30 Bq m−3.
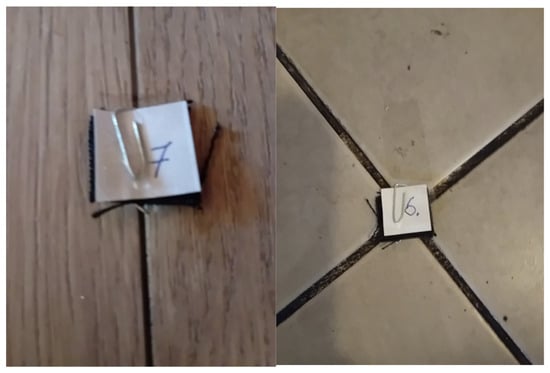
Figure 3.
Placement of labeled detectors on the floors of the house investigated in Case 2.
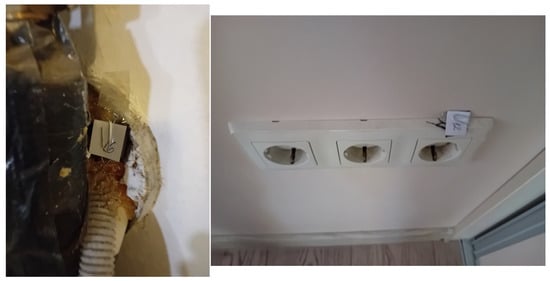
Figure 4.
Labeled detectors fixed along pipe routes (left) and on electrical outlets and switches (right) in Case 2.
3. Results
3.1. Fine Radon Distribution on the Floor of the Studied Room (Case 1)
Gamma radiation in the room was measured at 141 nGy h−1 (equivalent to an exposure rate of 16 µR h−1), consistent with typical background levels for the location. Grab sampling of radon and thoron near the floor, between squares A1 and B1, indicated radon concentrations around 900 Bq m−3, while thoron was undetectable by the instrument. This supports the conclusion that thoron contributes negligibly to the measured signal and can be disregarded in this study. Since no elevated radioactivity was found in the building materials, radon exhalation from the ground beneath the room remains the most likely dominant source.
The radon distribution is shown in Figure 5. As observed, radon concentrations vary widely across the floor, which we interpret as spatial variation in radon release from the floor surface. While floor radon release appears to be the primary indoor source, it is clearly not homogeneous, with most emissions concentrated in the area marked in red. This detailed mapping could provide valuable guidance for designing an effective mitigation strategy for the room.
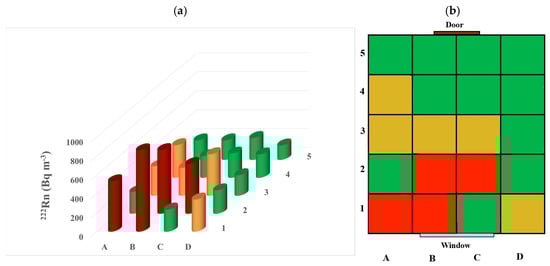
Figure 5.
(a) Radon distribution on the floor of the room in Case 1. (b) Schematic layout of the floor showing colored spots indicating elevated radon levels: (■) >500 Bq m−3, (■) 300–500 Bq m−3, (■) <300 Bq m−3. The room is 4.5 m long (from door to window) and 3.7 m wide.
Besides detectors placed in contact with the floor, two others were placed close to the window and the door, at wooden shelves at height of about 1 m. Another detector was placed in a “normal” room without elevated radon levels. The detector placed in square D1 showed 448 ± 44 Bq m−3, that in square A5 showed 258 ± 27 Bq m−3, and that in the “normal” room showed 32 ± 6 Bq m−3.
3.2. Unusual Routes of Entry in the House Studied (Case 2)
Radon measurements using the described detectors were conducted at various points on floors (including the basement), walls, pipe routes, and electrical switches and outlets. The results are presented in Figure 6.
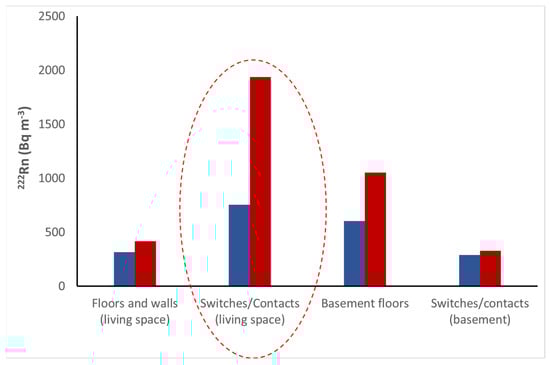
Figure 6.
Radon distribution at various locations throughout the house (Case 2). Maximum (■) and average (■) radon concentrations are illustrated. The number of switches/contacts tested was 6 in the living space and 3 in the basement. The red dotted circle delineates the locations of highest radon concentrations, which are possibly the major radon entry pathways.
Surprisingly, the highest radon concentrations, interpreted as the greatest radon release, were detected at electrical switches and outlets, particularly those located indoors, in the living space, on the outer walls of the house. The next highest radon levels were found on the basement floor, with peak concentration observed near a visible crack in the floor slab. However, even at this crack, radon activity was approximately half the level measured at the electrical outlets, where the absolute maximum radon concentration of 1940 ± 170 Bq m−3 was recorded. A plan of the house is shown in Figure 7.
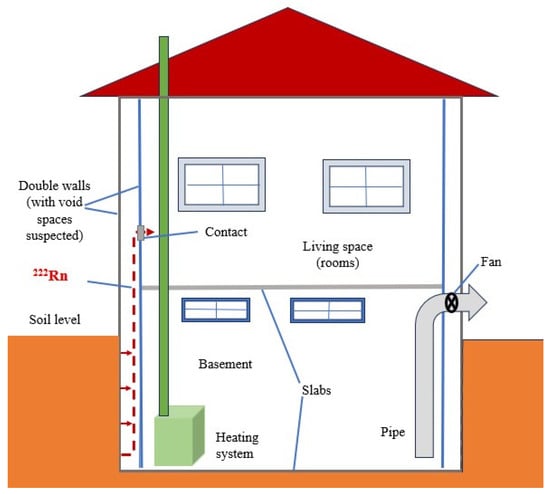
Figure 7.
Plan of the house (Case 2) and basement ventilation system. The basement is accessible from the living space via a door and staircase. The dashed line indicates a possible radon entry pathway into the indoor space.
Notably, the radon concentrations in electrical switches/outlets on internal walls, including those in the basement, were not elevated. In the basement, there were no electric switches or outlets on the outer walls.
Thoron concentrations measured near the floors and walls were below the detection limit. Given the detectors’ significantly lower sensitivity to thoron compared to radon, thoron interference was considered negligible, and the measured net track density was attributed to radon.
Gamma radiation levels inside the house were consistent with typical outdoor background values (air kerma rate of 130 nGy h−1, equivalent to an exposure rate of 15 µR h−1) and showed no increase near floors or walls, thereby ruling out building materials as a likely source of elevated indoor radon.
4. Discussion
In both cases studied, significant variability in radon levels was observed. The basic assumption in ranking radon sources is that local concentrations near a source or point of radon release increase proportionally to the strength of that source. At greater distances, concentrations tend to homogenize due to diffusion and convective mixing, but within just a few centimeters of the source, elevated concentrations persist. Even outdoors, where air mixing is generally rapid, radon levels are higher close to the ground surface and decrease with height under stable weather conditions [31].
The common assumption that radon concentration within a room is relatively homogeneous does not hold true when measurements are taken in close proximity to surfaces such as floors, pipe routes, or electrical switches and outlets from which radon is emitted. Elevated concentrations near these points indicate increased radon entry at these locations. Radon release is not uniform, and concentrations remain higher close to points of entry, as distance is required for diffusion and convective mixing to homogenize the air. This highlights the importance of studying radon distribution in indoor air at a fine spatial scale, especially in larger rooms or where uneven radon entry is suspected. Further detailed studies on this topic are planned.
In the first case, the dominant radon source was exhalation from the ground beneath the room, penetrating through the slag layer under the floor. Large variations in radon concentration on the floor were observed (Figure 5a), with elevated levels concentrated in an area of a few square meters near the window (Figure 5b). Future mitigation efforts, such as the placement of suction points for active soil depressurization or installation of radon barriers, should focus on this area. Another noteworthy observation is that radon concentrations measured about 1 m above the floor were also uneven. For example, at point D1, near the “high-radon” spot on the floor, radon concentration was about 70% higher than at a more distant point situated at a square (A5) with lower floor concentrations. The room was relatively small and was kept closed with no occupants during measurements, likely resulting in limited convective mixing. Under normal-occupancy conditions, this inhomogeneity is less likely, as doors and windows are opened and people’s movement generates turbulent mixing. Nonetheless, it would be valuable to investigate radon distribution in indoor air under varying occupancy and ventilation conditions.
In the second case, a surprising result was that active ventilation of the basement reduced radon levels there to 20–50 Bq m−3, but radon concentrations in the living space remained largely unchanged. This suggests that exhalation from the ground beneath the basement was not the main radon source for the living areas. A recent study reported a correlation between indoor radon levels and floor types [41], with the highest concentrations associated with parquet flooring, followed by ceramic tiles, vinyl flooring, and the lowest with laminate. In our study, parquet was present in Case 1 (Figure 2), while laminate was used in the living area of Case 2 (Figure 3, left), and ceramic tiles were installed in the kitchen, bathroom, and basement of Case 2 (Figure 3, right). However, drawing conclusions based solely on floor type is problematic in our case, as flooring materials vary not only between buildings but also between different levels (e.g., basement vs. living area), and an atypical radon entry pathway was identified in Case 2.
Measurements of local radon concentrations indoors in Case 2 revealed significant radon release from some electrical outlets and switches. Additionally, under certain meteorological conditions, some airflows could sometimes be felt emanating from these electrical fittings. The house was relatively new, featuring energy-efficient insulation on outer walls and evidence of void spaces within these walls. These voids may act as “radon collectors”, channeling radon that then enters the interior through openings such as electrical switches/outlets (Figure 7). The exact transport pathway of radon through void spaces remains unknown. It is possible that electrical cables are laid within insulation tubes, which may facilitate radon migration from the soil. Elevated radon levels were not detected at electrical outlets or switches on internal walls, including those in the basement, likely because internal walls are monolithic and do not contact the ground. Designing an effective and cost-efficient mitigation system for this unusual radon entry pathway poses a challenge. Several possible solutions have been discussed with national and international experts in radon mitigation.
5. Conclusions
Innovative, highly sensitive radon detectors with local spatial resolution have demonstrated significant potential for advanced radon diagnostics. In a room with radon entry through the floor, they revealed a distinct spatial pattern featuring a localized zone of elevated radon release—crucial information for targeted mitigation efforts. Similarly, in a house where radon levels persisted despite standard mitigation, these detectors identified an unusual ingress pathway through electrical switches and outlets, likely connected to voids within the outer walls.
These findings highlight that indoor radon distribution is often highly heterogeneous and that conventional methods may overlook critical points of radon entry. The fine-scale diagnostics enabled by the innovative detectors used improve the accuracy of radon source identification and facilitate the development of more effective and cost-efficient mitigation strategies.
Future work will focus on expanding the application of these detectors in building surveys and further investigating complex radon ingress mechanisms, particularly in modern energy-efficient buildings with atypical structural features.
Author Contributions
Conceptualization, D.P.; methodology, D.P. and D.D.; software, D.P.; validation, D.D.; formal analysis, D.P.; investigation, D.D. and D.P.; resources, D.P.; data curation, D.D.; writing—original draft preparation, D.P.; writing—review and editing, D.P.; visualization, D.P. and D.D.; supervision, D.P.; project administration, D.P.; funding acquisition, D.P. All authors have read and agreed to the published version of the manuscript.
Funding
This study was financed by the European Union-Next Generation EU, through the National Recovery and Resilience Plan of the Republic of Bulgaria, project № BG-RRP-2.004-0008-C01 and by the Bulgarian National Science Fund under contract KP-06-N58/9 (22 November 2021).
Institutional Review Board Statement
Not applicable.
Informed Consent Statement
Not applicable.
Data Availability Statement
Data will be made available on reasonable request.
Acknowledgments
The authors are grateful to Alexander Stamenkov for providing past radon data for the house (Case 2) and technical assistance on the spot.
Conflicts of Interest
The authors declare no conflicts of interest.
References
- International Agency for Research on Cancer (IARC). IARC Monographs on the Evaluation of Carcinogen Risks to Humans; IARC Monographs: Lyon, France, 1988; Volume 43. [Google Scholar]
- World Health Organization. WHO Handbook on Indoor Radon: A Public Health Perspective; Zeeb, H., Shannoun, F., Eds.; WHO Publications: Geneva, Switzerland, 2009. [Google Scholar]
- United Nations Scientific Committee on the Effects of Atomic Radiation (UNSCEAR). Sources of Ionizing Radiation; United Nations Scientific Committee on the Effects of Atomic Radiation Report to the General Assembly. Volume I: Sources; UN: New York, NY, USA, 2008. [Google Scholar]
- George, A. State-of-the-Art Instruments for Measuring Radon/thoron and Their Progeny in Dwellings—A Review. Health Phys. 1996, 70, 451–463. [Google Scholar] [CrossRef] [PubMed]
- Celikovic, I.; Pantelic, G.; Vukanac, I.; Nikolic, J.K.; Živanovic, M.; Cinelli, G.; Gruber, V.; Baumann, S.; Poncela, L.S.Q.; Rabago, D. Outdoor Radon as a Tool to Estimate Radon Priority Areas—A Literature Overview. Int. J. Environ. Res. Public Health 2022, 19, 662. [Google Scholar] [CrossRef] [PubMed]
- Celikovic, I.; Pantelic, G.; Vukanac, I.; Nikolic, J.K.; Živanovic, M.; Cinelli, G.; Gruber, V.; Baumann, S.; Ciotoli, G.; Poncela, L.S.Q.; et al. Overview of Radon Flux Characteristics, Measurements, Models and Its Potential Use for the Estimation of Radon Priority Areas. Atmosphere 2022, 13, 2005. [Google Scholar] [CrossRef]
- Council of the European Union. Council Directive 2013/59/EURATOM of 5 December 2013. Off. J. Eur. Union 2014, 103. [Google Scholar]
- TraceRADON. Available online: http://traceradon-empir.eu (accessed on 18 May 2025).
- Grossi, C.; Arnold, D.; Adame, J.A.; López-Coto, I.; Bolívar, J.P.; de la Morena, B.A.; Vargas, A. Atmospheric 222Rn concentration and source term at El Arenosillo 100 m meteorological tower in southwest Spain. Radiat. Meas. 2012, 47, 149–162. [Google Scholar] [CrossRef]
- Röttger, S.; Röttger, A.; Grossi, C.; Vargas, A.; Karstens, U.; Cinelli, G.; Chung, E.; Kikaj, D.; Rennick, C.; Mertes, F.; et al. Radon metrology for use in climate change observation and radiation protection at the environmental level. Adv. Geosci. 2022, 57, 37–47. [Google Scholar] [CrossRef]
- Fialova, E.; Otahal, P.P.S.; Vosahlik, J.; Mazanova, M. Equipment for testing measuring devices at a low-level radon activity concentration. Int. J. Environ. Res. Public Health 2020, 17, 1904. [Google Scholar] [CrossRef]
- Grossi, C.; Vogel, F.R.; Curcoll, R.; Àgueda, A.; Vargas, A.; Rodó, X.; Morguí, J.-A. Study of the daily and seasonal atmospheric CH4 mixing ratio variability in a rural Spanish region using 222Rn tracer. Atmos. Chem. Phys. 2018, 18, 5847–5860. [Google Scholar] [CrossRef]
- Chambers, S.D.; Hong, S.-B.; Williams, A.G.; Crawford, J.; Griffiths, A.D.; Park, S.-J. Characterising terrestrial influences on Antarctic air masses using Radon-222 measurements at King George Island. Atmos. Phys. Chem. 2014, 14, 9903–9916. [Google Scholar] [CrossRef]
- Pressyanov, D. New generation of highly sensitive radon detectors based on activated carbon with compensated temperature dependence. Sci. Rep. 2022, 12, 8479. [Google Scholar] [CrossRef] [PubMed]
- Rutherford, E. Adsorption of radioactive emanations by charcoal. Nature 1906, 76, 634. [Google Scholar]
- Cohen, B.L.; Cohen, E.S. Theory and practice of radon monitoring with charcoal adsorption. Health Phys. 1983, 45, 501–508. [Google Scholar] [CrossRef]
- Sutej, T.; Ilic, R.; Krizman, M. A new technique for radon measurement based on a combination of a track-etch detector and activated charcoal. Nucl. Tracks Radiat. Meas. 1991, 19, 423–424. [Google Scholar] [CrossRef]
- Cosma, C.; Van Deynse, A.; Poffijn, A. Studies on radon adsorption characteristics of different charcoals used as amplifiers for the track detectors. Radiat. Meas. 1999, 31, 351–354. [Google Scholar] [CrossRef]
- Van Deynse, A.; Cosma, C.; Poffijn, A. A passive radon dosimeter based on the combination of a track etch detector and activated charcoal. Radiat. Meas. 1999, 31, 325–330. [Google Scholar] [CrossRef]
- Scarpita, S.C. Factors Affecting the Estimation of Indoor Radon Using Passive Activated Charcoal Canisters. Ph.D. Dissertation, New York University, New York, NY, USA, 1990. [Google Scholar]
- Mphaga, K.V.; Mbonane, T.P.; Utembe, W.; Rathebe, P.C. Short-Term vs. Long-Term: A Critical Review of Indoor Radon Measurement Techniques. Sensors 2024, 24, 4575. [Google Scholar] [CrossRef]
- Scarpitta, S.C.; Harley, N.H. An improved 222Rn canister using a two-stage charcoal system. Health Phys. 1991, 60, 177–187. [Google Scholar] [CrossRef] [PubMed]
- Zikovski, L. Temperature dependence of adsorption coefficients of 222Rn on activated charcoal determined by adsorption-desorption method. Health Phys. 2001, 80, 175–176. [Google Scholar] [CrossRef]
- Cooper, A.; Le, T.N.; Iimoto, T.; Kosako, T. Temperature calibration formula for activated charcoal radon collectors. J. Environ. Radioact. 2011, 102, 60–63. [Google Scholar] [CrossRef]
- Tommasino, L.; Tommasino, M.C.; Viola, P. Radon-film-badges by solid radiators to complement track detector-based radon monitors. Radiat. Meas. 2009, 44, 719–723. [Google Scholar] [CrossRef]
- Sohrabi, M.; Ghahremani, M. Novel panorama megasize environmental radon monitor. Radiat. Phys. Chem. 2021, 181, 109325. [Google Scholar] [CrossRef]
- Sohrabi, M. Concentration and duration dependence of a new prototype polycarbonate/activated-carbon fabric individual and environmental radon monitor. J. Instrum. 2018, 13, P11012. [Google Scholar] [CrossRef]
- Sullivan, P.D.; Stone, B.R.; Hashisho, Z.; Rood, M.J. Water adsorption with hysteresis effect onto microporous activated carbon fabrics. Adsorpion 2007, 13, 173–189. [Google Scholar] [CrossRef]
- Pressyanov, D.; Momchilov, M.; Georgiev, P. Influence of humidity on activated carbon fabrics scheduled for use in high sensitivity radon detectors. Appl. Radiat. Isot. 2023, 200, 110941. [Google Scholar] [CrossRef]
- Pressyanov, D.; Dimitrov, D. The sensitivity of Innovative techniques for measuring low levels of radon in the environment using passive detectors. J. Environ. Radioact. 2024, 277, 107461. [Google Scholar] [CrossRef]
- Pressyanov, D.; Zajonchovska, V.; Dimitrov, D. Examining radon levels in soil gas and atmospheric air near the soil–air interface. Eur. Phys. J. Spec. Top. 2025, 1–8. [Google Scholar] [CrossRef]
- Froňka, A.; Moučka, L.; Čechák, T. Application of the advanced radon diagnosis methods in the indoor building environment Get access Arrow. Radiat. Prot. Dosim. 2008, 130, 72–75. [Google Scholar] [CrossRef] [PubMed]
- Khan, S.M.; Gomes, J.; Krewski, D.R. Radon interventions around the globe: A systematic review. Heliyon 2019, 5, e01737. [Google Scholar] [CrossRef]
- Cosma, C.; Papp, B.; Cucos (Dinu), A.; Sainz, C. Testing radon mitigation techniques in a pilot house from Băiţa-Ştei radon prone area (Romania). J. Environ. Radioact. 2015, 140, 141–147. [Google Scholar] [CrossRef] [PubMed]
- Ginev, G. Energy-Angular Response of Detector LR-115/II for Detection of Alpha Particles. Master’s Thesis, St. Kliment Ohridski University of Sofia, Sofia, Bulgaria, 1996. [Google Scholar]
- Barillon, R. Contribution a la Detection de Particules Alpha Par Detecteurs Solides de Traces Nucleaires e Application a la Mesure du Radon. Ph.D. Thesis, Universite de Franche-Comte, Besançon, France, 1994. [Google Scholar]
- Pressyanov, D.; Mitev, K.; Georgiev, S.; Dimitrova, I.; Kolev, J. Laboratory facility to create reference radon+thoron atmosphere under dynamic exposure conditions. J. Environ. Radioact. 2017, 166, 181–187. [Google Scholar] [CrossRef]
- Regulation on Radiation Protection Standards. Off. State J. Bulg. 2018, 16. (In Bulgarian)
- Pressyanov, D.; Dimitrov, D.; Dimitrova, I. Energy-efficient reconstructions and indoor radon: The impact assessed by CDs/DVDs. J. Environ. Radioact. 2015, 143, 76–79. [Google Scholar] [CrossRef] [PubMed]
- ISO 11929-1:2019; Determination of the Characteristic Limits (Decision Threshold, Detection Limit and Limits of the Coverage Interval) for Measurements of Ionizing Radiation—Fundamentals and Application. International Organization for Standardization: Geneva, Switzerland, 2019.
- Gulan, L.; Stajic, J.M.; Spasic, D.; Forkapic, S. Radon levels and indoor air quality after application of thermal retrofit measures—A case study. Air Qual. Atmos. Health 2023, 16, 363–373. [Google Scholar] [CrossRef] [PubMed]
Disclaimer/Publisher’s Note: The statements, opinions and data contained in all publications are solely those of the individual author(s) and contributor(s) and not of MDPI and/or the editor(s). MDPI and/or the editor(s) disclaim responsibility for any injury to people or property resulting from any ideas, methods, instructions or products referred to in the content. |
© 2025 by the authors. Licensee MDPI, Basel, Switzerland. This article is an open access article distributed under the terms and conditions of the Creative Commons Attribution (CC BY) license (https://creativecommons.org/licenses/by/4.0/).