Article

Can the Building Make a Difference to User’s Health in Indoor Environments? The Influence of PM2.5 Vertical Distribution on the IAQ of a Student House over Two Periods in Milan in 2024

1
Design & Health Lab, Department Architecture, Built Environment and Construction Engineering, Politecnico di Milano, Via G. Ponzio 31‚ 20133 Milan, Italy
2
Department of Environment and Health, Italian National Institute of Health (Istituto Superiore di Sanità), 00161 Rome, Italy
*
Author to whom correspondence should be addressed.
Atmosphere 2025, 16(8), 936; https://doi.org/10.3390/atmos16080936
Submission received: 20 June 2025 / Revised: 28 July 2025 / Accepted: 1 August 2025 / Published: 4 August 2025
(This article belongs to the Special Issue Air Quality in Metropolitan Areas and Megacities (Second Edition))

Abstract

This study investigates indoor and outdoor air quality monitoring in a student dormitory located in northern Milan (Italy) using low-cost sensors. This research compares two monitoring periods in June and October 2024 to examine common PM2.5 vertical patterns and differences at the building level, as well as their influence on the indoor spaces at the corresponding positions. In each period, around 30 sensors were installed at various heights and orientations across indoor and outdoor spots for 2 weeks to capture spatial variations around the building. Meanwhile, qualitative surveys on occupation presence, satisfaction, and well-being were distributed in selected rooms. The analysis of PM2.5 data reveals that the building’s lower floors tended to have slightly higher outdoor PM2.5 concentrations, while the upper floors generally had lower PM2.5 indoor/outdoor (I/O) ratios, with the top-floor rooms often below 1. High outdoor humidity reduced PM infiltration, but when outdoor PM fell below 20 µg/m3 in these two periods, indoor sources became dominant, especially on the lower floors. Air pressure I/O differences had minimal impact on PM2.5 I/O ratios, though slightly positive indoor pressure might help prevent indoor PM infiltration. Lower ventilation in Period-2 possibly contributed to more reported symptoms, especially in rooms with higher PM from shared kitchens. While outdoor air quality affects IAQ, occupant behavior—especially window opening and ventilation management—remains crucial in minimizing indoor pollutants. Users can also manage exposure by ventilating at night based on comfort and avoiding periods of high outdoor PM.

1. Introduction

At the international level, indoor air quality (IAQ) is attracting more and more attention as it is estimated that most people spend more than 80% of their lifetime indoors, and this is particularly relevant in residential environments where individuals live more than 65% of their time, with vulnerable populations and remote workers (e.g., those engaged in smart working [1]) spending even more time indoors [2,3,4], and air quality is an important aspect of a healthy living environment. However, when discussing IAQ in urban areas, it is impossible to ignore the influence of outdoor air pollution as the urban buildings are immersed in an urban atmosphere mixed with emissions from various sources.
This research is related to one of the multiple monitoring activities conducted in 2024 in some student houses, aiming to analyze the impact of the spatial distribution of urban air pollution on IAQ in residential buildings, with a focus on users’ well-being, comparing the indoor and outdoor pollutant concentrations. The collection of data by monitoring and questionnaires is authorized by the Ethical Committee of Politecnico di Milano and by the representatives of Campus Life (staff related to the student houses’ management) of the same university.
This paper includes the analysis of the data in two representative periods in 2024 from the monitoring activities mentioned above. The first period extended from the 5th to the 19th of June 2024, when there was a dust intrusion event reported [5], as Figure 1 shows. The second period extended from the 16th to the 30th of October 2024 in the same facility. The monitored site was not in the range of the dust intrusion path, so the influence was not severe, but it still left evidence during the monitoring period. The comparison of these two periods helps us to identify the common phenomena of indoor and outdoor PM distributions.
The dust forecast associated with the sandstorm was published on 11 June 2024, and the northern part of Italy was not on the path of the sandstorm, as can be seen in Figure 1. On 12 June, during the daily checks on the devices in the facilities, there were already a few spots of red dust leftovers on the surface of the external devices, with water stains after the rains, and the sky appeared brown in color. This dust was not observed during any other monitoring period.

1.1. Literature Review Content and Previous Research on PM Vertical Distribution

In terms of the vertical PM distribution pattern, there have been many previous studies, but most of them were in the field of atmospheric research, which covers the height level of 500 to 1000 m above ground. A few studies have conducted monitoring at the surface level, close to the height of buildings, but they have many limitations.
Regarding the previous research, some studies recorded that the PM level at the surface level (in the range lower than 100 m above ground) had a decreasing trend when height increased. Babaan et al. conducted PM2.5 monitoring using an unmanned aerial vehicle (UAV) on 22 March 2017 in Metro Manila, Philippines (14°35′ N, 121°01′ E) [6]. All data were collected during a single flight, lasting 14 min and 41 s, in the late morning (although the exact time of day was not specified). Their results showed that PM2.5 concentrations varied with altitudes between 100 and 400 m. These results showed decreasing trends from 70 m to 180 m, from around 6.7 to 5.2 µg/m3; then, they showed an increase to 7.8 at around 260 m, followed by a continuously decrease to 4.0 µg/m3 until around 430 m. For the surface level, the results showed a decreasing trend under 200 m; however, the overall variation was relatively minor, ranging from 4 to 8 µg/m3. Since the measurements represented only a brief 15 min window, the data were limited in capturing broader temporal or meteorological variations.
However, these trends are not fixed as there has also been research that found a higher level at the ground height than at the higher spots. In 2020, Choomanee et al. found that PM levels tended to increase with height from 30 to 110 m during the monsoon season in Bangkok, Thailand (13.85° N, 100.57° E) [7]. Although a positive correlation between height and PM2.5 concentration was observed in both the daytime and the nighttime, the daytime PM2.5 average levels increased from around 7 µg/m3 at 30 m (with 95% data from 4.5 to 9.7 µg/m3 range) to 10 µg/m3 at 110 m (with 95% data from 5.5 to 14 µg/m3), and the nighttime average levels increased from 5 µg/m3 at 30 m (from 4 to 7.8 µg/m3) to 7.5 µg/m3 at 110 m (from 5 to 11 µg/m3). The overall concentration ranged from 5 to 15 µg/m3, with only about 5 µg/m3 of variation. This subtle and commonly occurring variation, likely influenced by frequent precipitation during the monsoon period, rendered the findings less conclusive in demonstrating a distinct vertical distribution of PM2.5.
It was also found that the dynamic distribution pattern varies at different periods of the day. The PM has a higher concentration at ground level during the nighttime, and it reverses during the daytime. In 2015, Han et al. performed continuous PM2.5 monitoring over two weeks in the winter of 2009 using a meteorological tower in Tianjin, China (39°04′ N, 117°12′ E), at different height levels: ground, 40 m, 120 m, and 220 m [8]. Daily patterns across different heights revealed a consistent trend: PM2.5 concentrations increased in the evening, peaking at 100 to 110 µg/m3 at approximately 7:30 a.m., and decreased during daytime hours till around 60 to 75 µg/m3 at around 5:00 p.m., aligning with sunrise and sunset times, respectively (UTC+08:00). Meanwhile, higher monitoring altitudes corresponded to higher PM2.5 levels during the day, whereas the opposite trend—lower concentrations at higher altitudes—was observed during the evening and nighttime hours.
In a subsequent study, in 2018, Han et al. also found that precipitation during haze and fog (HF) events removes PM2.5 to a greater degree at a higher level than at the ground level [9]. They conducted monitoring from 29th December 2016 to 11th January 2017 in Tianjin, using the meteorological tower, at different height levels: ground, 120 m, and 200 m. This period coincided with a heavy HF event. PM2.5 concentrations during this time were significantly higher than those recorded in the Philippines and Thailand, peaking at nearly 500 µg/m3. The elevated concentrations were likely attributable to the HF event, the region’s status as a major industrial hub, and the seasonally low atmospheric boundary layer (ABL) during winter. With the two rainy periods recorded, on sunny days, the PM2.5 levels were always higher than those at the ground at 200 m levels around, and during rainy days, the ground level had higher results than the high points at 120 and 200 m.
In 2019, Lu et al. found the fluctuation of PM2.5 at different height levels under 1000 m above ground and at different times of the day [10]. They carried out PM2.5 monitoring on five individual days between August 2014 and February 2015 in Lin’an (China, 30.23° N, 119.71° E). On each day, four separate UAV (unmanned aerial vehicle) flights were conducted, ranging from early morning to late afternoon, with flights covering heights from the ground to 1000 m, reading every 100 m. Data from these flights consistently showed that PM2.5 concentrations decreased with the increasing altitude. Notably, the early morning flights, especially during the winter season, revealed both higher PM2.5 levels and greater vertical variability. Throughout the daytime, the concentrations stabilized but continued to exhibit a decreasing trend with increasing height. Although these results were different from those of Han et al., with reversed distribution trends [8], the data by Lu et al. still recorded the influence of ABL height variations [10].
Samad et al. introduced a tethered balloon system to monitor PM2.5 concentrations on the 8th and 9th July 2020 in Stuttgart (Germany, 48°46′ N, 9°10′ E), monitoring constantly within a height of 500 m [11]. Their research showed the changes of the ABL during its formation and dissociations with the changes in PM2.5 concentration, which follows the theory of the boundary layer with mixed air pollutants [8,12,13]. During the evening and nighttime, the PM2.5 level kept increasing with the decrease in height, especially at the surface level below 100 m. Then, during the daytime, in the morning, the PM changed between 8:00 a.m. to 12:00 p.m., increasing at a higher level above 300 m, showing the influences of convection with solar exposures in the morning, and the decrease at the lower level was due to the rise of the inversion layer (IL) and the increase in the ABL.
In addition, there are a few studies at the surface level with buildings and street canyons. In the study conducted in 2023 by Miao et al., continuous monitoring was carried out in Shenyang (China, 41°46′ N, 123°24′ E) within a single building at three different heights—1.5 m, 27 m, and 69 m above ground level—over the span of one year, divided into four seasonal periods [14]. The results showed that the average concentrations of both PM2.5 and PM10 were significantly higher during the winter season compared to the other three seasons. Notably, in all seasons, concentrations were highest at 69 m, followed by the ground level (1.5 m), and lowest at the intermediate height of 27 m.
There were another two studies by Cichowicz and Dobrzański, one in 2020 monitoring indoor and outdoor façades, facing north and south, inside a university building with an height of around 30 m [15], and another in 2021, with UAV monitoring the urban district close to a local factory in Lodz (Poland, 51°46′ N 19°27′ E) [16]. In the results from 2020, two in three series of data on different days showed negative trends between PM2.5 and a height of 30 m, with variations at different heights; and another series of data shows a uniform level at all height points [15]. In addition, they included the indoor data in the common spaces of the building. The indoor data basically followed the outdoor levels at all heights and were slightly lower than the outside data. In addition, in their work in 2021, monitoring with a UAV in the district close to a local factory, at a height within 50 m, showed a different result: the higher the altitude, the higher the PM2.5 concentrations, with a constant increase trend [16]. In summary, the vertical distribution of PM2.5 does not have a fixed trend with the increase in height in the urban area, which depends on the weather and climate of the regions, the time of the year, and the days with the variation of the ABL, as well as the source of the PM emissions. However, we can see in the studies that ground levels within 20 m tend to have a higher level in the building scale range, even if the level within 100 m is at similar levels to those of the entire atmospheric distribution.
Moreover, the studies on the urban vertical pollutants distribution usually did not include indoor monitoring results, as building floors represent only a small portion of the atmosphere. It was difficult to account for the indoor factors in the air pollutant data, especially with limited devices and different monitoring methods for indoor and outdoor monitoring. Also, there has been little research focusing simultaneously on the vertical distribution of ambient PM and IAQ, and the monitoring approaches for indoor and outdoor air quality differ significantly.

1.2. The Aim of This Research

This research aims to present the results of the current stage of the air quality monitoring activity inside the student accommodation facility and the influence of PM2.5′s vertical distribution patterns at different building height levels on the IAQ in the residential buildings. By analyzing the data from this facility as a case study, we found some common PM2.5 distribution patterns and their indoor influence on different floors, along with the involvement of other environmental parameters.
Furthermore, this study attempts to determine how these distribution patterns can affect the occupants’ well-being and health in indoor settings, as well as how we might improve the architectural strategies.

2. Methods

This research carried out monitoring activities in two periods (Period-1 from the 5th to the 19th of June 2024, and Period-2 from the 16th to the 30th of October 2024) in a student residence managed by Politecnico di Milano. The monitoring activities in each period deployed approximately 30 devices equipped with low-cost sensors, measuring the air quality condition across various floors and orientations of the building, with paired indoor and outdoor measurements from each selected room. This quantitative data was complemented by the survey results regarding the occupancy status of users in the selected rooms, along with their recent health condition and perception of the IAQ during the monitored periods.

2.1. The Student House as the Fieldwork Site

The measurement was conducted in a student accommodation, located in the northwest area of Milan, consisting of 2 building blocks, with 1 lower block, 4 floors high, and 1 tower, 11 floors high, and a semi-underground basement.
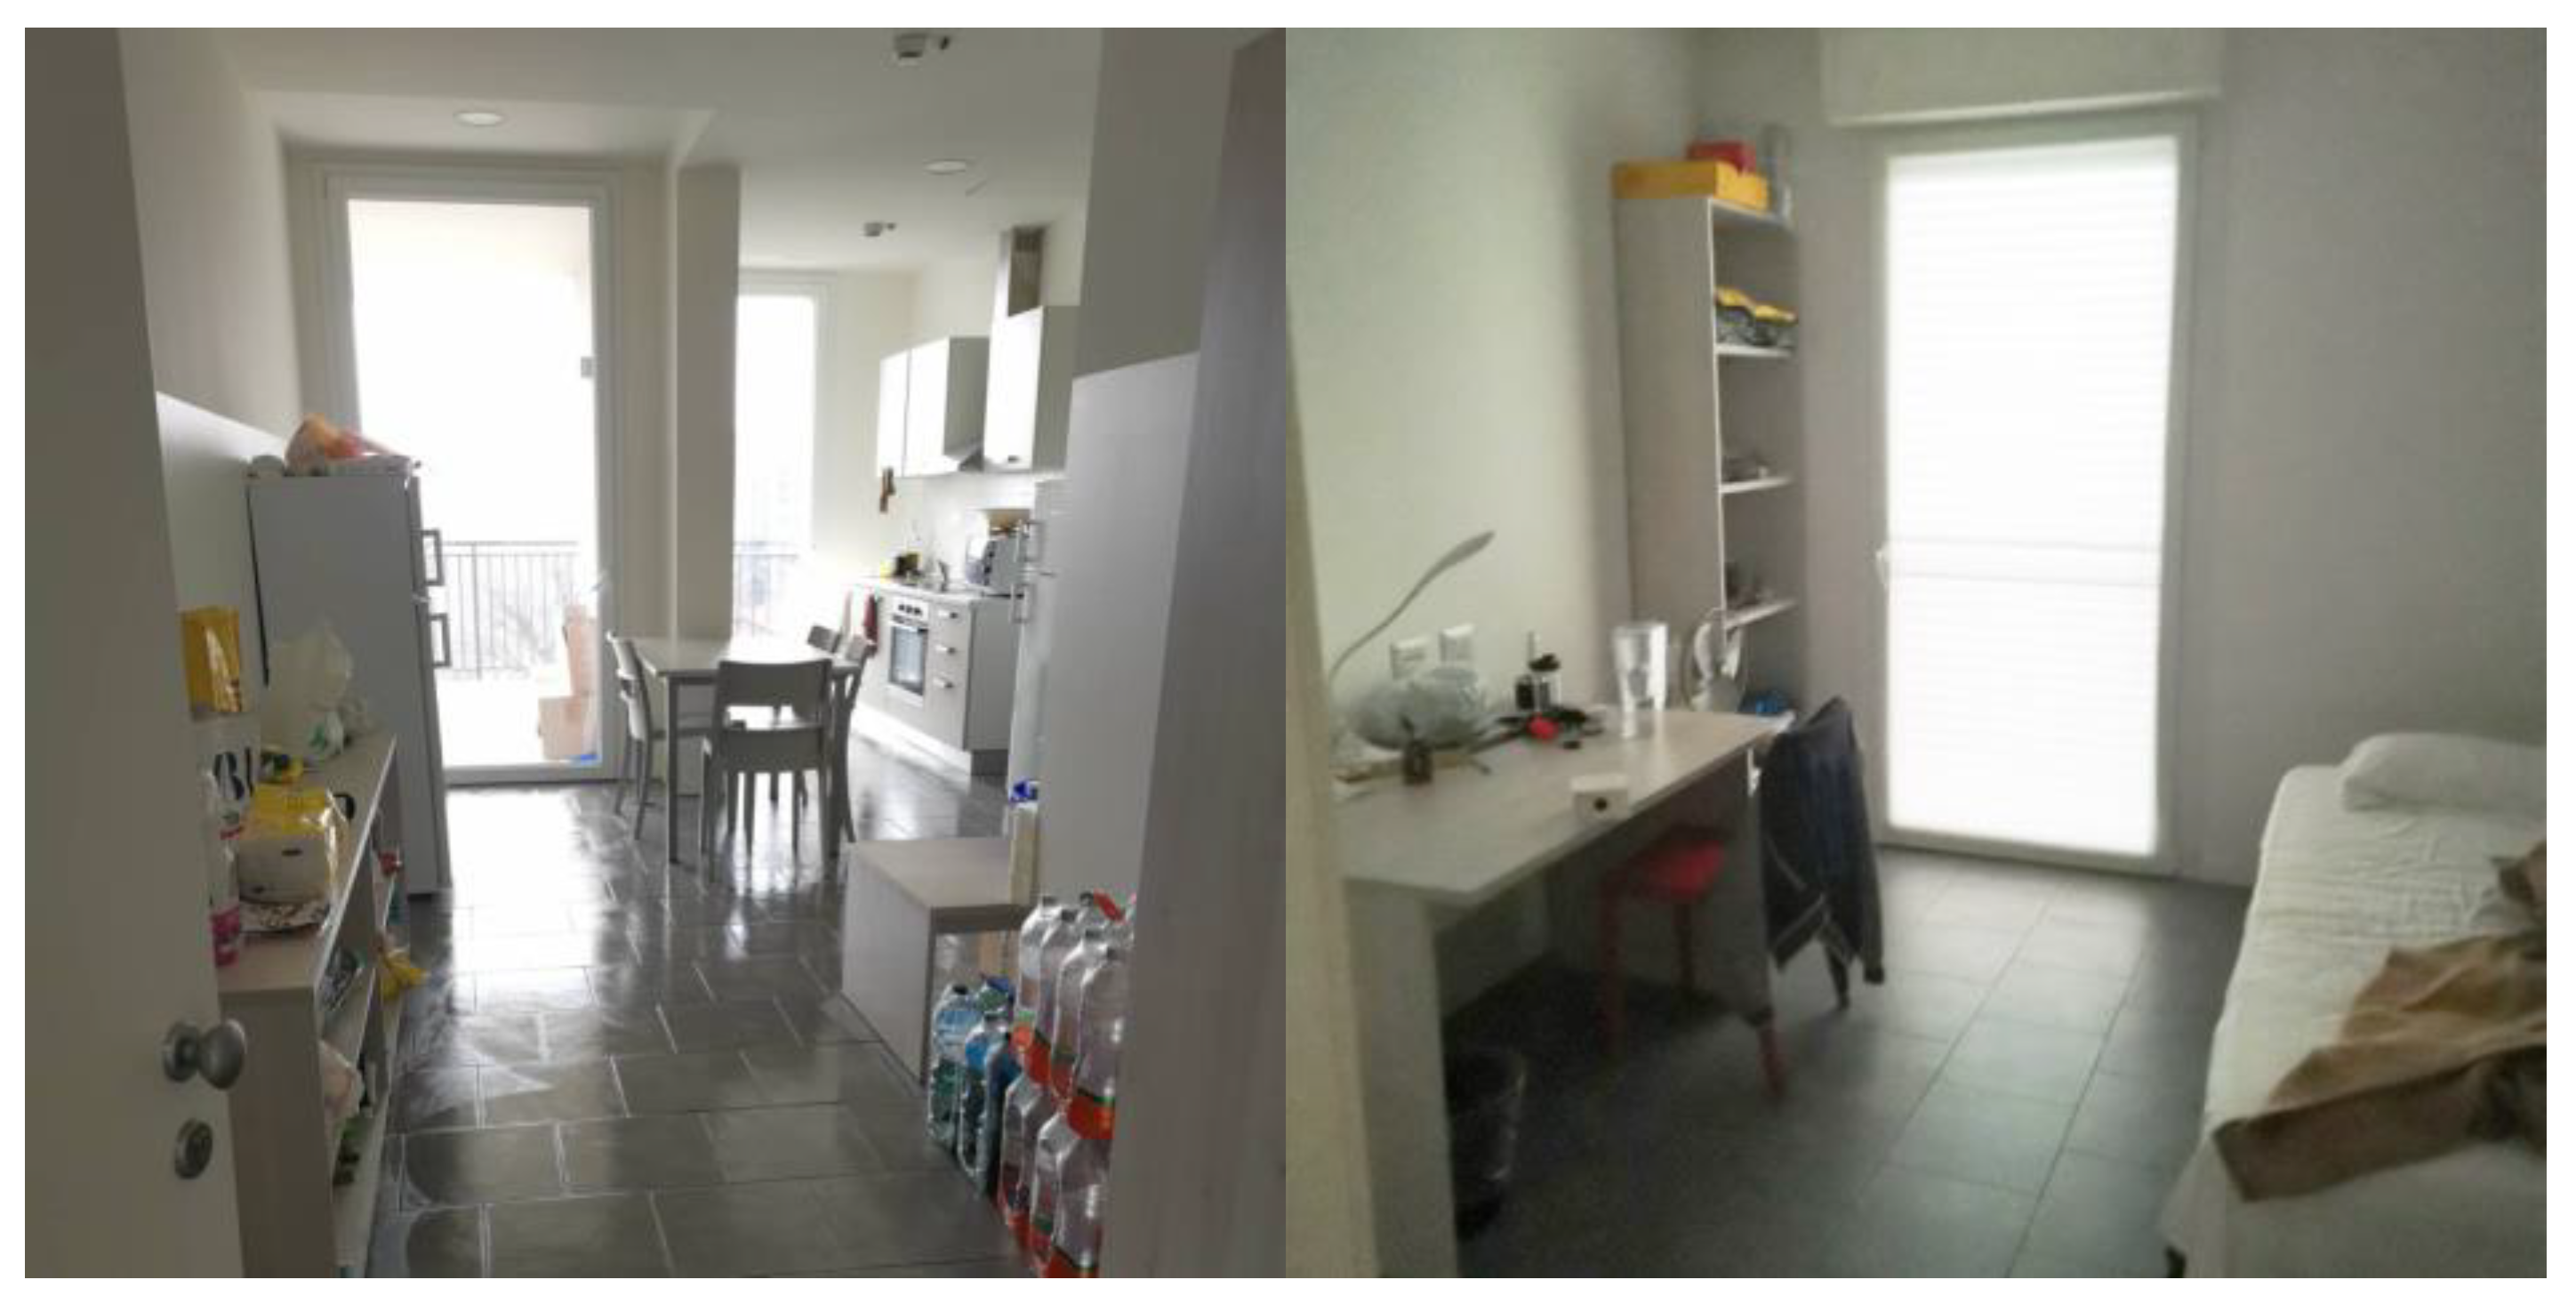
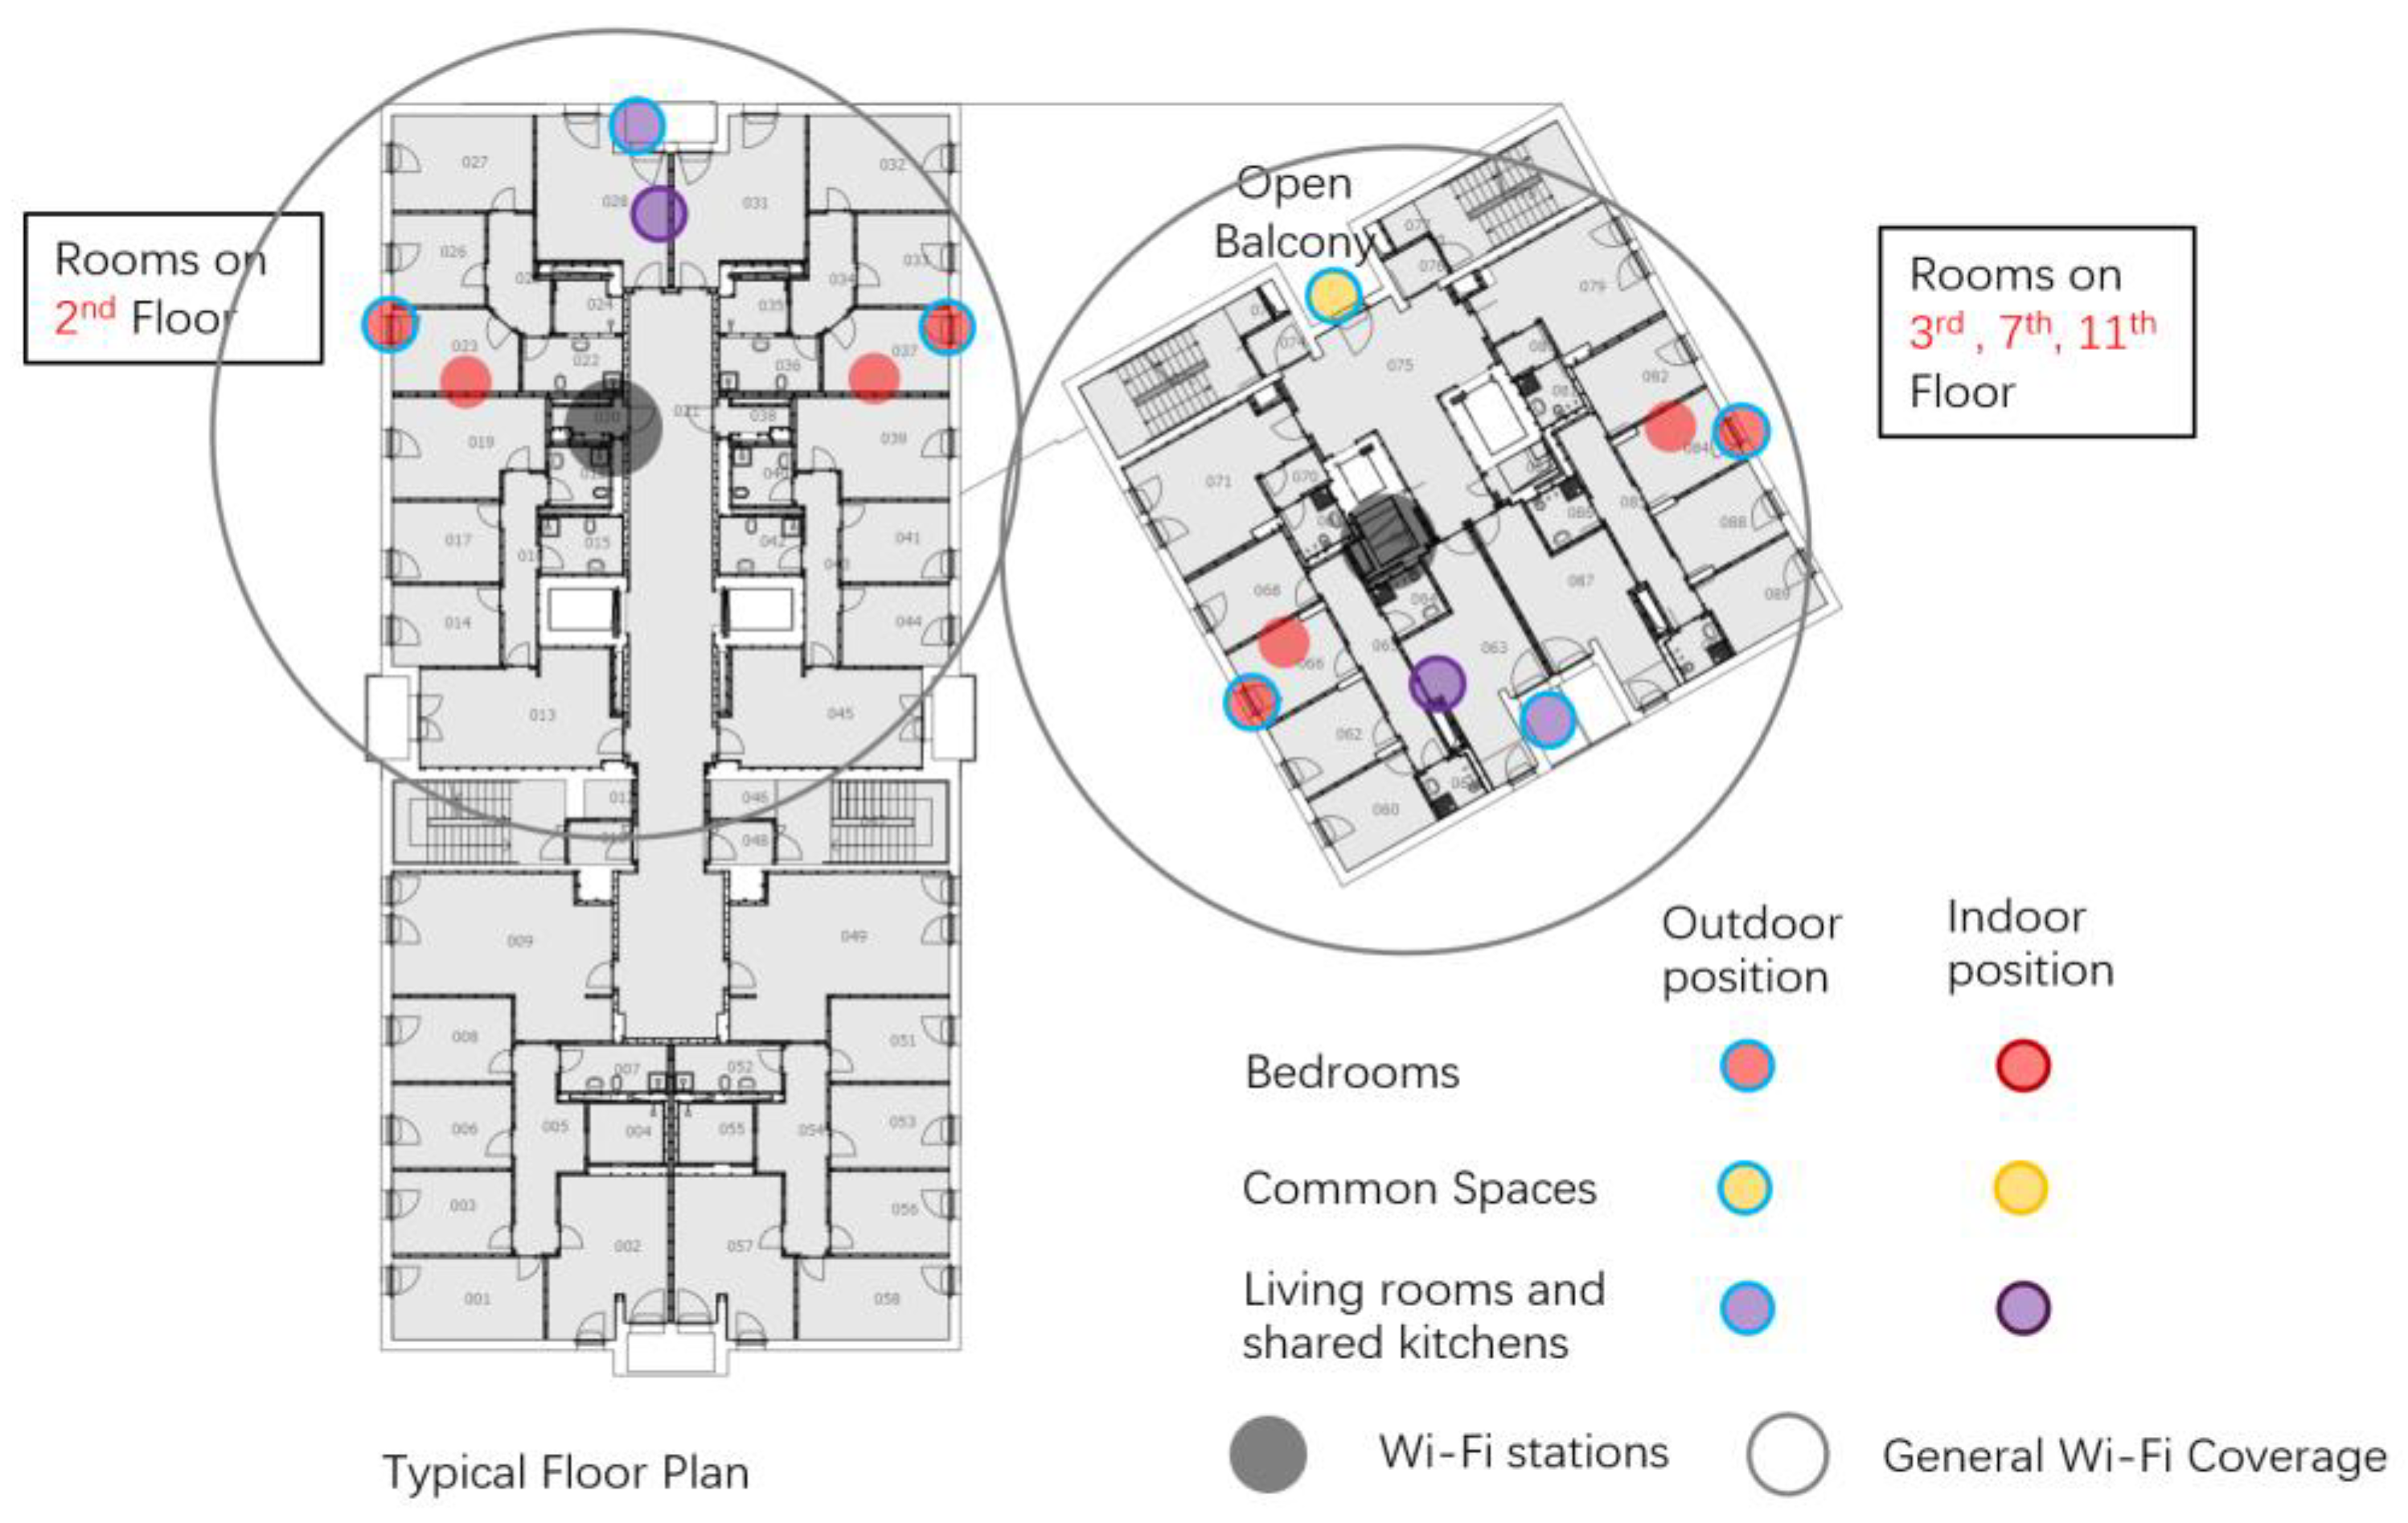
In the student accommodation, according to the standards defined by the Italian Ministry of University and Research [17], each unit contains single-occupancy bedrooms and a shared living room with a cooking area (Figure 2 and Figure 3), shared by 4 to 6 students per unit. The living rooms in each unit are usually around 20 to 25 m2, with 1 sofa, 1 table and 4 to 6 chairs for dining, 1 closet for storage, 1 refrigerator for the residents in 1 unit, 1 microwave, and 1 induction cooker for 4 spots combined with an oven beneath and a range hood above. No open-flame cookers are installed. Most living rooms are connected to an open-air balcony. The bedrooms selected for monitoring are similar in dimensions and layout, as Figure 2 shows. They are typically furnished with a single bed, a closet, a bookshelf, and a desk [18].
The HVAC system in the facility is divided into ventilation with cooling and heating, respectively, centrally controlled by each unit and the central system in the entire facility. According to the manager of this facility and the site inspections during the installation of devices, in Period-1, neither the cooling nor the heating was operational; and in Period-2, the heating started working based on the urban heating calendar of Comune di Milano [19]. The central heating calendar was from 15 October 2024 to 15 April 2025, every day from 5:00 a.m. to 11:00 p.m., and for the student house, the upper limit for heating was around 19 °C.
Another additional but important piece of information about this student house was that the months of July and August were the end of the academic year; therefore, this is the period when the student residence has a resident turnover. The regulation of the student house requires changes of residents around every half a year to provide accommodations for new students. This means the residents in Period-1 in June were partly different from those in Period-2, with different daily schedules and living habits, which may influence the IAQ results.

2.2. Monitoring Devices, Measurement Parameters, and Calibration

We deployed devices assembled with low-cost sensors based on a comprehensive systematic review of sensor specifications and residential applications [20]. Details of the sensor configurations involved are provided in Table 1. The device was designed to record the following parameters: (1) SCD41 by Sensirion for temperature (T), relative humidity (RH), and carbon dioxide (CO2); (2) BME680 by Bosch for air pressure (AP); (3) PMS5003T by Plantower for PM2.5 and PM10. There were other parameters that are excluded from the scope of this study.
The devices deployed were calibrated using a reference device, a portable weather station branded “FengTu”, with all the measurement devices and reference devices co-located together on the same table for 2 weeks. The calibration of parameters employed linear regression for T, RH, and AP, and decision tree regression for the CO2, PM2.5, and PM10 to calibrate the data from the sensors according to the data from the reference device.
For the calibration of all the parameters and devices, the RMSE (root mean squared error) was calculated between the measured data and calibrated data, relative to the reference data. The calibrations of T, RH, and AP used linear regression, with the average RMSE among all 33 devices calibrated from 1.3444 to 0.4342 °C for T, from 5.7684 to 1.2586% for RH, and from 2.7218 to 2.5520 hPa for AP. As for the CO2, PM2.5, and PM10, random forest regression was applied for calibration, with the mean RMSE from 236.6440 to 99.0231 ppm for CO2, from 8.7222 to 3.0782 µg/m3 for PM2.5, and from 7.2817 to 3.8731 µg/m3 for PM10.
The calibration process was limited in covering the full range in the fieldwork, which may lead to inaccurate readings outside of the covered range. For example, the indoor humidity with the natural ventilation varies from 40 to 80% during the calibration period, so the condition of high outdoor RH exceeding 85% during the rainy period may not be calibrated accurately. Similarly, with CO2, the concentration range of CO2 extended from 400 to 2000 ppm during the calibration periods, but in the fieldwork, monitoring briefly exceeded 2300 ppm, which may not be accurately calibrated.

2.3. The 2 Monitoring Periods and Monitoring Spot Selection

The data included in this work were collected from two periods: from the 5th to the 19th of June 2024 (Period-1), and from the 16th to the 30th of October 2024 (Period-2). These two periods were selected because during these period, most residents were present in the facility, avoiding the long university holiday periods.
The selection of monitored rooms aims to cover the various floors and orientations with different solar exposures within the limited number of devices and budget. Concerning the monitoring activity in progress, in this student house, there were 31 devices deployed, including in 2 bedrooms and 1 kitchen on the 2nd, 3rd, 7th and 11th floors, respectively, and the other sensors were located on the public balcony and public space at the ground level [24], as Figure 3 shows.
The measurement spots on the ground floor were inside and outside the lobby and were included in Period-1 in June but were not guaranteed in Period-2 in October because the spots on the ground floor, especially the outdoor points, were public spaces with smoking areas, and the devices were often deliberately removed.

2.4. Device Deployment and Data Collection Workflow

The device deployment followed the same workflow in these two periods in the facility. Before each monitoring period, private Wi-Fi stations and routers were deployed in the technical rooms of each building to cover the internet access range of all the selected measurement spots. There are 2 private modems for the 2 building blocks, respectively; then, the routers extend the range of Wi-Fi vertically to the selected floors to cover the deployed devices.
The monitoring devices record data at intervals of 30 min, and they are connected to the private Wi-Fi set in the technical rooms of the building to send the readings to the online database ThingSpeak, and the monitoring process in each period lasts for 2 weeks. The readings will be checked online every day during the 2-week monitoring periods, and only when the readings stop will there be interventions to fix the problems. Most of the time, the living conditions of each room and unit were not interrupted during the 2 monitoring periods.
The monitoring period of 2 weeks with a 30 min interval was a compromise decision due to the technical limitations of the devices, which had to work with a battery-powered supply. This point will be explained in the limitations section at the end of this paper.

2.5. Survey on the Internal Occupancy Condition

Based on the general methodology approved by the Ethical Committee of Politecnico di Milano, during the monitoring activity, questionnaires were distributed to all the selected bedrooms and kitchens for all residents involved. The paper survey aimed to record the occupancy conditions during the monitoring period and to interpret the results of the monitored data. Referring to a previous research project developed by Laghezza et al. [25], the questionnaire includes 4 main sessions within 20 questions, including the demographic information of the occupants, the occupancy schedule over the 2-week period, the ventilation operation conditions, and the other indoor activities. An example of a questionnaire for the bedroom can be found in the Supplementary Materials. In the two periods, the survey was conducted in the same way, with 8 copies of questionnaires delivered to bedrooms and 16 for the users sharing the kitchens.
In the survey, there are instructions about how to complete the questionnaire and return it. The distribution of the questionnaire was conducted on the first day of monitoring inside the facilities, during the device installation period. They are designed to be completed at the end of the monitoring period to record the occupancy conditions, perceptions of IAQ, and accidental incidents during the weeks [26]. In the last few days before the last day of monitoring, the questionnaires were supposed to be returned to the reception desk of the facilities as the general methodology defines.

2.6. The Reference Levels of the Environmental Parameters and Involved Air Pollutants

In the following sections, the diagrams present the reference level for the comfort band for the indoor thermal conditions of temperature and relative humidity, as well as the air pollutants included. These reference levels are displayed as horizontal lines in the diagrams, facilitating the interpretation of the variation of parameters.
The range of the comfort band for temperature was calculated based on the historical mean monthly air temperature of Milan in June and October via the algorithm by ASHRAE (pp. 11–13) [27], with 80% acceptance, from 21.65 to 28.65 °C for June and from 18.92 to 25.92 °C for October in the indoor spaces in Milan. The range for RH is also based on ASHRAE [27,28], from 40 to 60%.
The reference levels for air pollutants are taken from the author’s previous work [29], which summarizes the air pollutants’ reference levels from the air quality guidelines from international institutions. For CO2, 1000 ppm is taken as the reference level, as mentioned in many IAQ guidelines [29,30,31,32,33,34], and 2000 ppm is regarded as the level with interventions, which is not a universally acknowledged level but can be considered as a reference line, as mentioned in the air quality guidelines from the UK [32] and Germany [31]. Regarding PM2.5, it takes 40 μg/m3 as the 8-h reference and 25 μg/m3 as the 1-day reference [35,36]; and for PM10, it takes 90 μg/m3 as the 8-h reference and 50 μg/m3 as the 1-day reference [35,36,37,38,39,40,41,42,43,44,45,46,47]. As the monitoring results represent data within only 2 weeks, the long-term reference level for 1 year is not included in the diagrams.

3. Results from Monitoring Devices and Questionnaires

3.1. The General Results of Indoor and Outdoor Data from the Two Periods

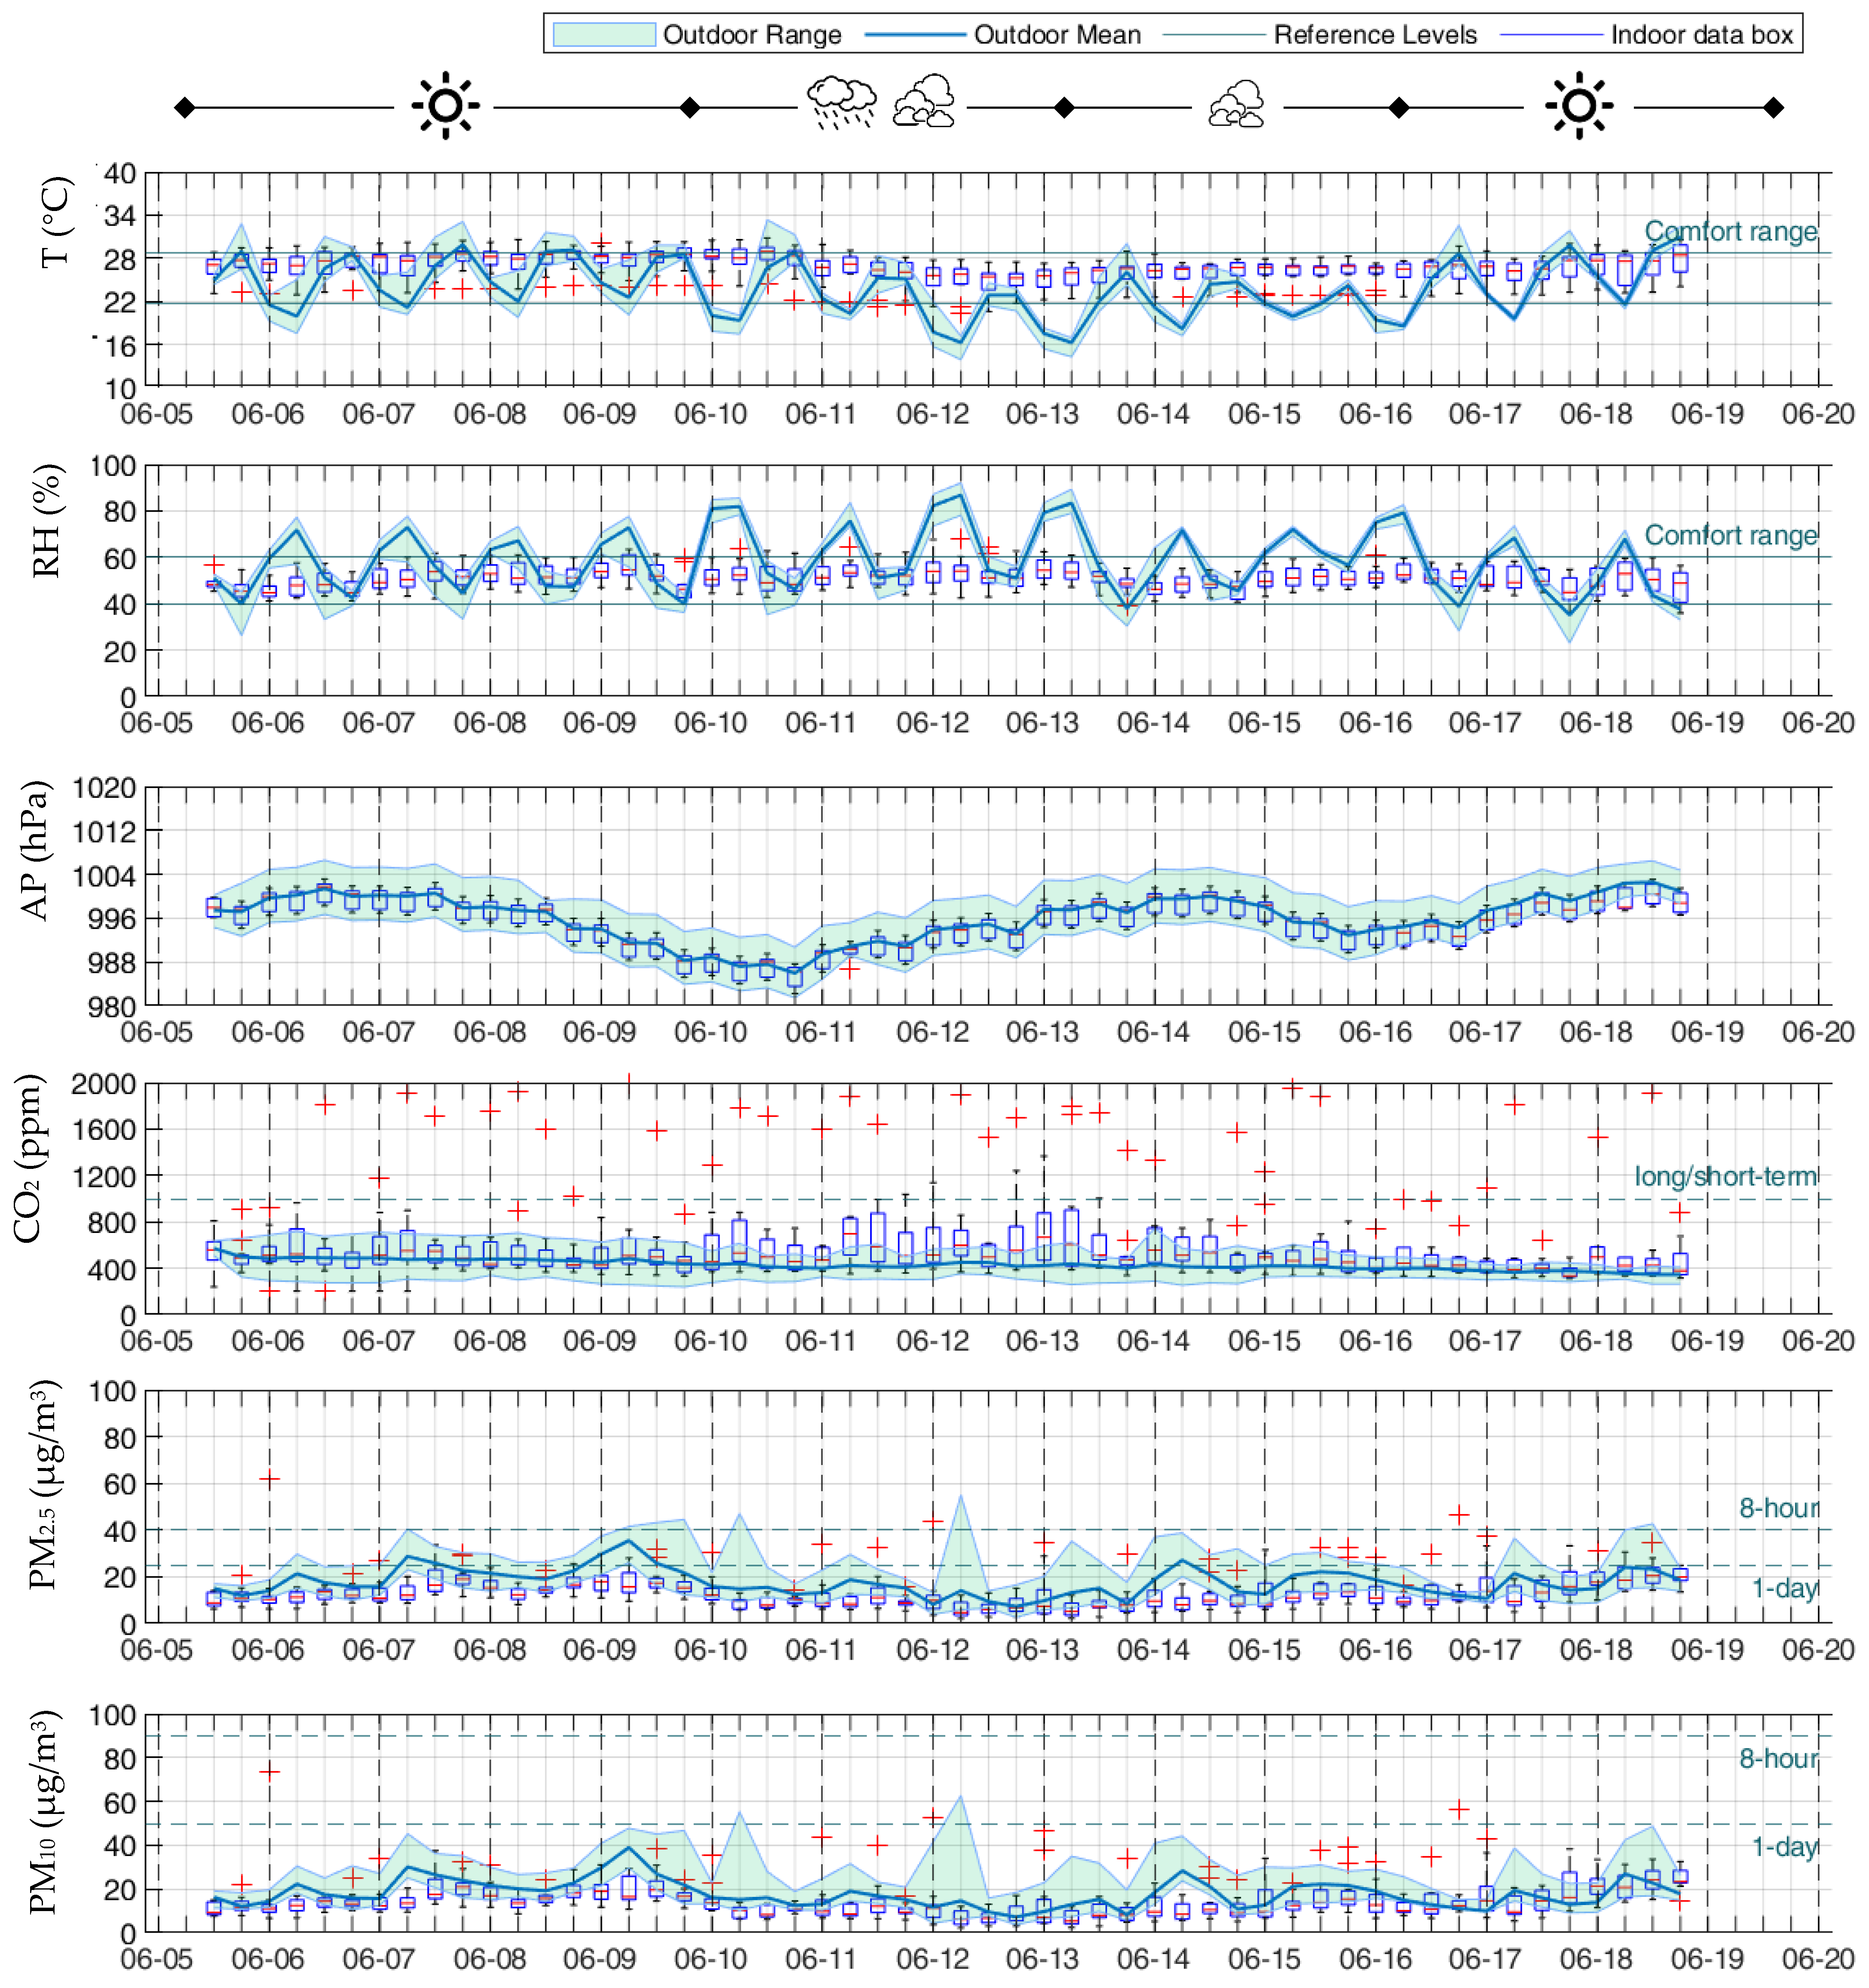
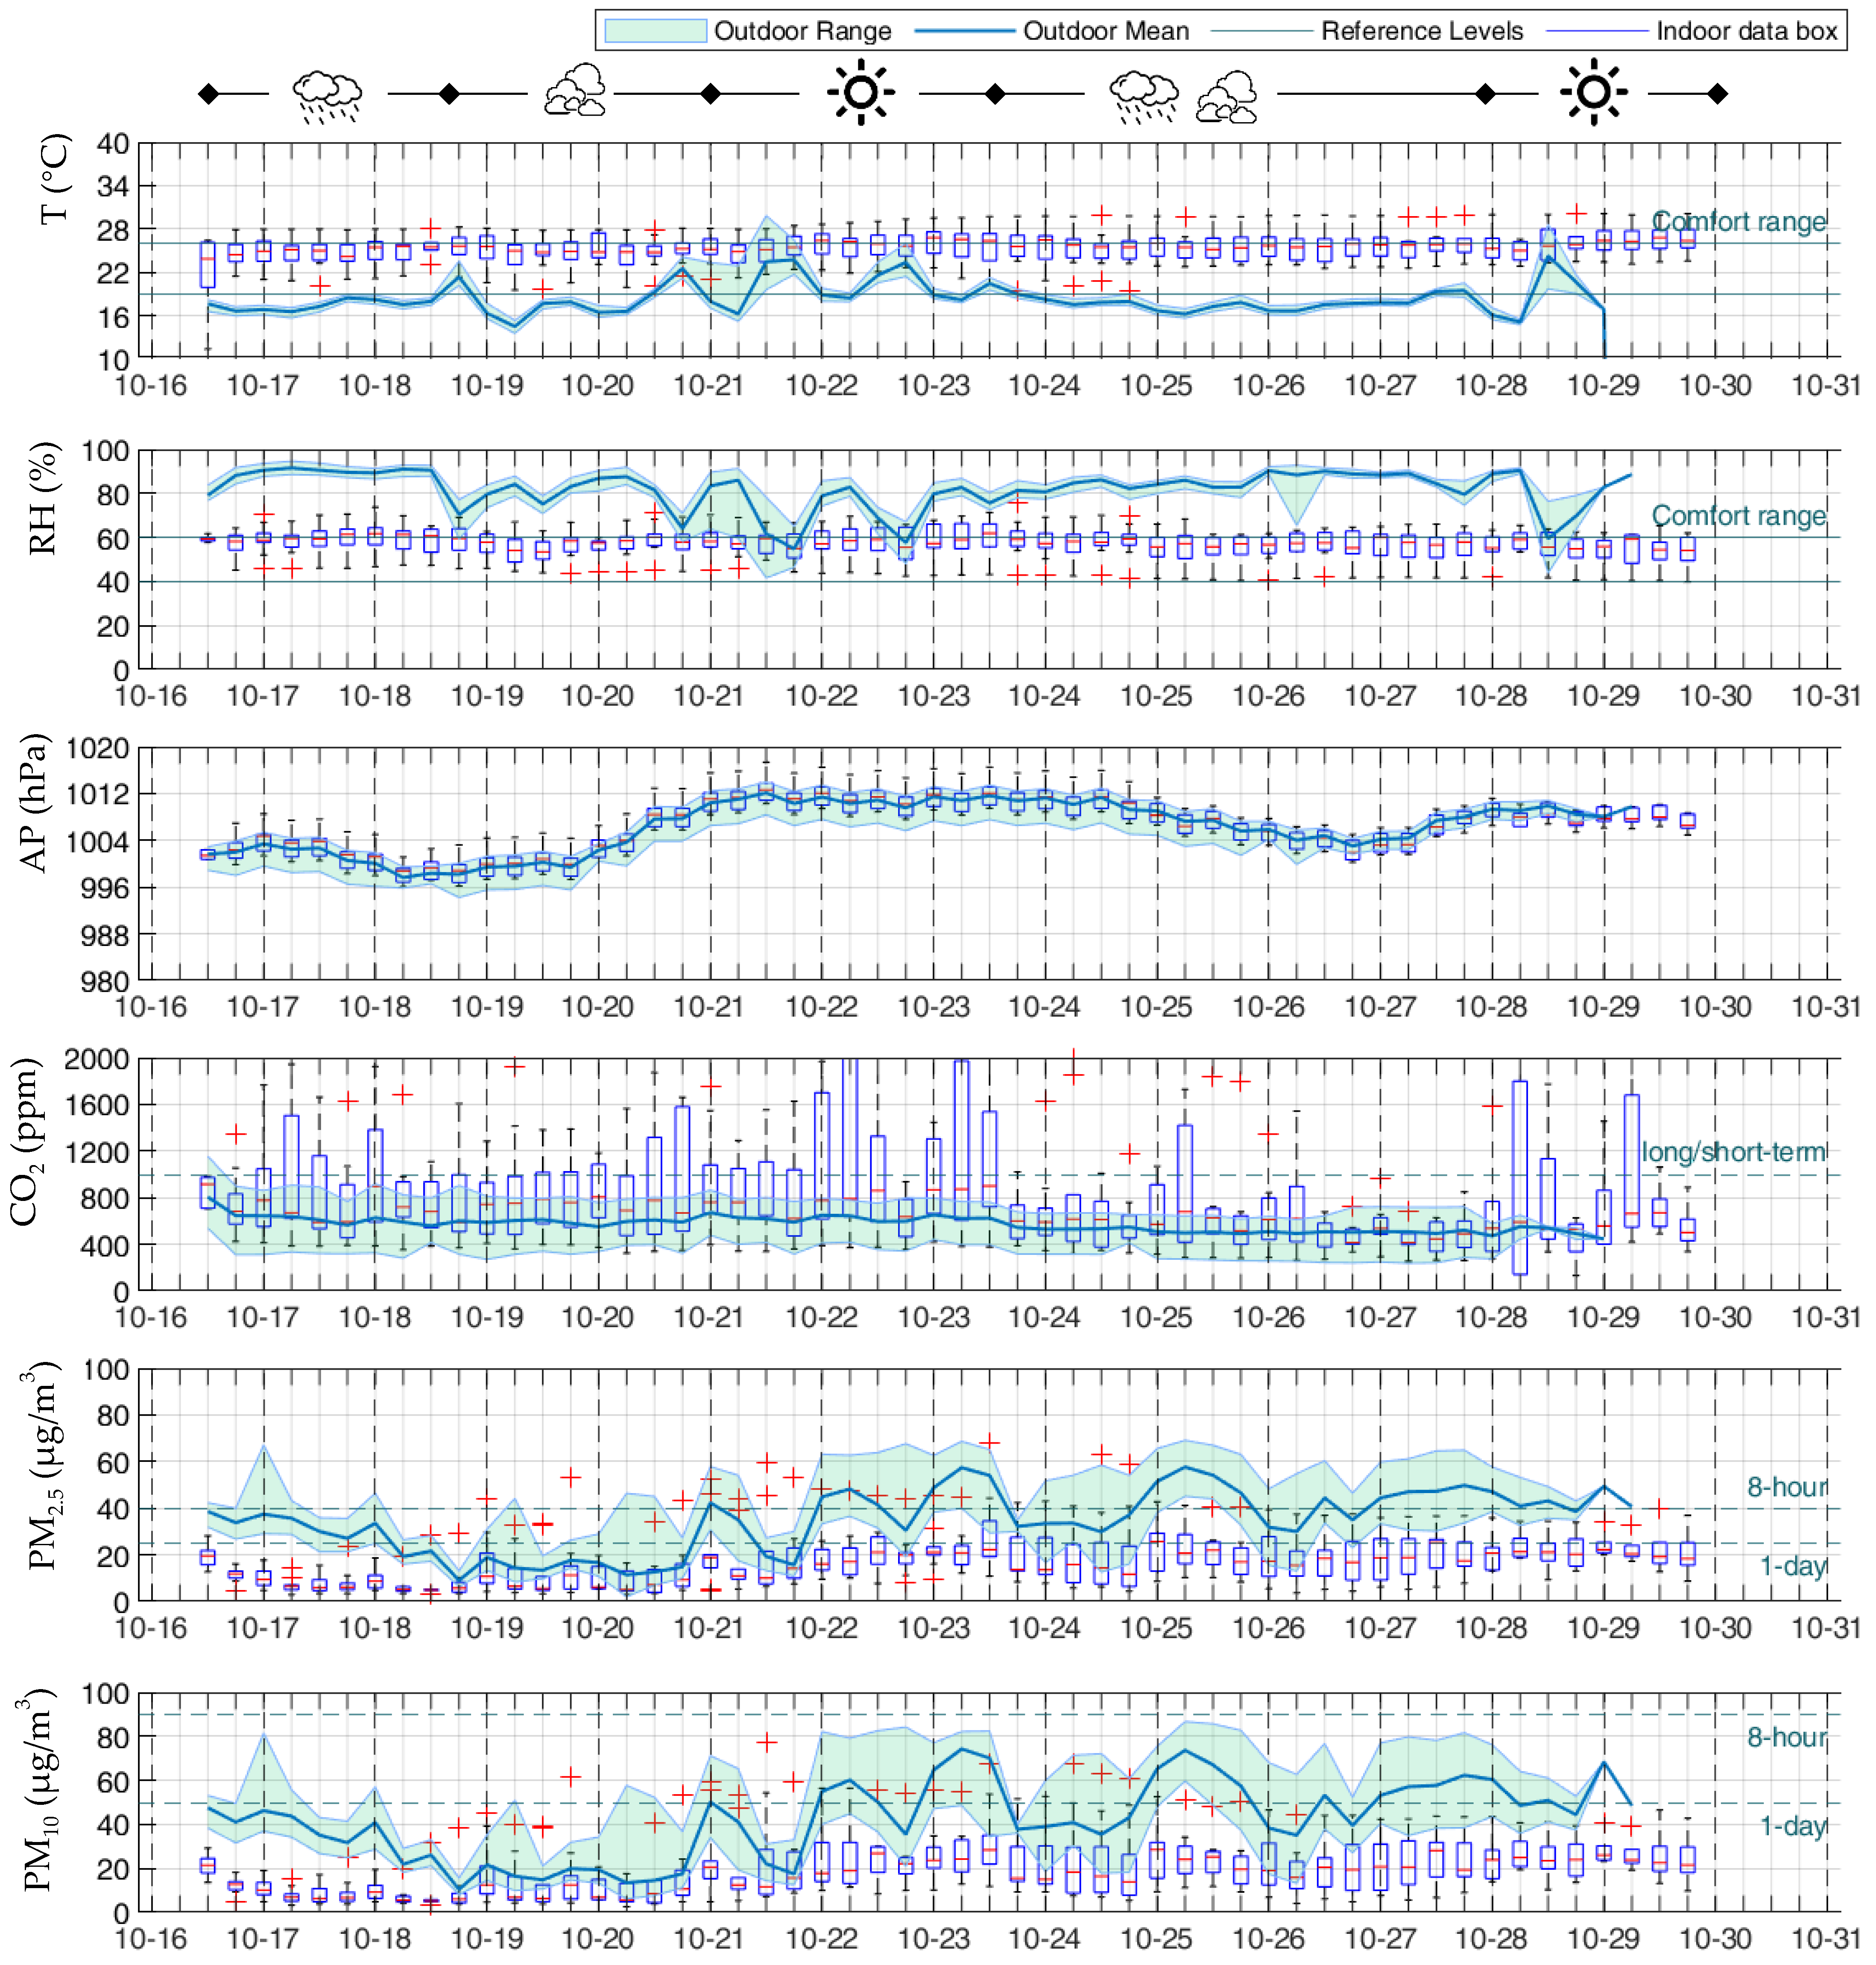
The results from the two monitoring periods are displayed in Figure 4 (for Period-1: 5th to 19th June, with the dust intrusion) and Figure 5 (for Period-2: 16th to 30th October). The data from these two figures summarize all the devices at various locations over a 6-h average and for indoors (in boxplot) and outdoors (in area plot), respectively, reflecting the general climate conditions during these two periods.

3.1.1. Environmental Parameters and Weather Conditions

Rainy days occurred during both monitoring periods. In Period-1, rainfall mainly occurred between 10th and 14th June, when the external RH reached more than 80%. In Period-2, there was intermittent rainfall, from 16th to 21st and from 23rd to 28th October, in which the rain was not constant and was, most of the time, mostly cloudy with elevated RH and AP levels.
The outdoor temperature in Period-1 in June was higher than that in Period-2 in October due to the seasonal changes, but the indoor temperature was always in the thermal comfort range as the central heating was operational in October in the facilities. In both periods, there were a few rooms that experienced overheating indoors when the indoor temperature exceeded the upper limit of the comfort range.
As for the AP, both periods had similar trends: the decrease in AP occurred during the same periods as the precipitations (e.g., 10 June in Period-1 and 18–20 and 25–27 October in Period-2). In Period-2, the AP was generally higher than in Period-1, likely due to the seasonal change and low air temperature.

3.1.2. CO2 Variations in the Two Periods

Indoor CO2 levels exhibited similar patterns across the two periods. The daily peaks of CO2 were usually in the early morning, decreased during the daytime, and then rose again at night, reflecting the typical occupancy pattern of a residential building.
However, CO2 concentrations were generally higher in Period-2, both outdoors and indoors. The outdoor CO2 level even reached 600 to 800 ppm continuously from 16th to 23rd October, likely contributing to elevated indoor CO2 concentrations. The rains, heating and other factors (such as the insect issues mentioned in the questionnaire) limited window opening for fresh air, resulting in indoor CO2 levels frequently exceeding the reference level during these weeks.

3.1.3. PM Levels in the Two Periods

The outdoor PM2.5 and PM10 levels in Period-2 were significantly higher than those in Period-1, likely due to the seasonal difference with higher pollutant levels in the cold seasons [48,49], even if there was no more influence from the dust intrusion.
As the forecast shows in Figure 1, although it passed by Milan with visible residues, the dust intrusion did not cause severe air pollution issues, and it had less influence than the seasonal changes, compared to the PM levels, in the two periods.
Apart from these seasonal changes, the precipitation and the daily variation were the other two major influential factors: the daily variation of PM had a negative correlation with T, which is especially clear on sunny days, and followed the daily variation of ABL [8,12].
As for the precipitations, on the one hand, the increase in PM may have contributed to rainfall, as the aerosol particles can also act as cloud condensation nuclei (CCN) [50,51] (e.g., 6th to 9th June in Period-1 and 21th to 23rd October in Period-2). On the other hand, the rainfall subsequently reduced PM concentrations. However, when the general ambient PM was at a high level from 23rd to 28th October in Period-2, the temporary precipitation was not sufficient to significantly reduce the ambient PM, suggesting that seasonal factors were the dominant influencing factors.

3.2. Results from the Questionnaires

Regarding the responses to the questionnaires, in Period-1 (June), there were four responses from the bedrooms and two responses from two shared kitchens; and in Period-2 (October), there were six responses from bedrooms and nine from the shared kitchens. The response rate was low in Period-1. In Period-2, additional efforts were made to encourage participation by contacting more residents, resulting in a higher response rate.
The questionnaires only covered a limited number of rooms equipped with monitoring devices. The low response rate may introduce bias and may not accurately reflect the overall occupant perceptions during each period. The lack of responses was not only due to disinterest or forgetfulness but also to the absence of occupants during the monitoring periods. Some rooms were unoccupied during the studied periods, either because residents were away or because the rooms were awaiting new tenants.

3.2.1. Users’ Basic Information

As the facility is a university-provided student accommodation, most of the residents were students in both periods. As Figure 6 shows, the demographic information indicates that residents were between 20 and 30 years old, varying from bachelor to PhD students, with one exception noted as “Diploma” standing out from the given options in Period-1.
In both periods, all the responses were from male students, as Figure 6b shows. This was not intentional, as the rooms were selected based on their locations in the floor plans and the student assignment was mixed.
According to the responses, daily time spent in the facility ranged from 9 to 18 h, with most students staying approximately 13 to 14 h in their unit (either in the bedroom or the kitchen). These daily durations were based on weekly schedules and did not include short periods spent away, such as weekends, which were not included in these hours.

3.2.2. User’s Perception and Reported Symptoms

In line with the indoor monitoring data shown in Figure 4 and Figure 5, in both periods, most of the responses reported “Warm” with slight overheating, especially in the bedrooms. This was likely because the bedrooms were for a single person, with smaller dimensions than the kitchen, and typically had less ventilation after occupancy and internal activities (e.g., cooking and occupants’ entering and leaving through the kitchens).
Overheating issues were also attributed to the rain and high RH in both periods, as reported in the dissatisfaction session (Figure 7b). Additionally, one respondent from Period-2 noted that they could not open the window for fresh air due to the presence of insects.
Alongside complaints regarding the warm indoor space and high RH, the reported dissatisfaction with IAQ and odor was partly explained by a user’s comment that the smell from the kitchen also entered the bedrooms.

3.2.3. The Reported Symptoms from the Two Periods

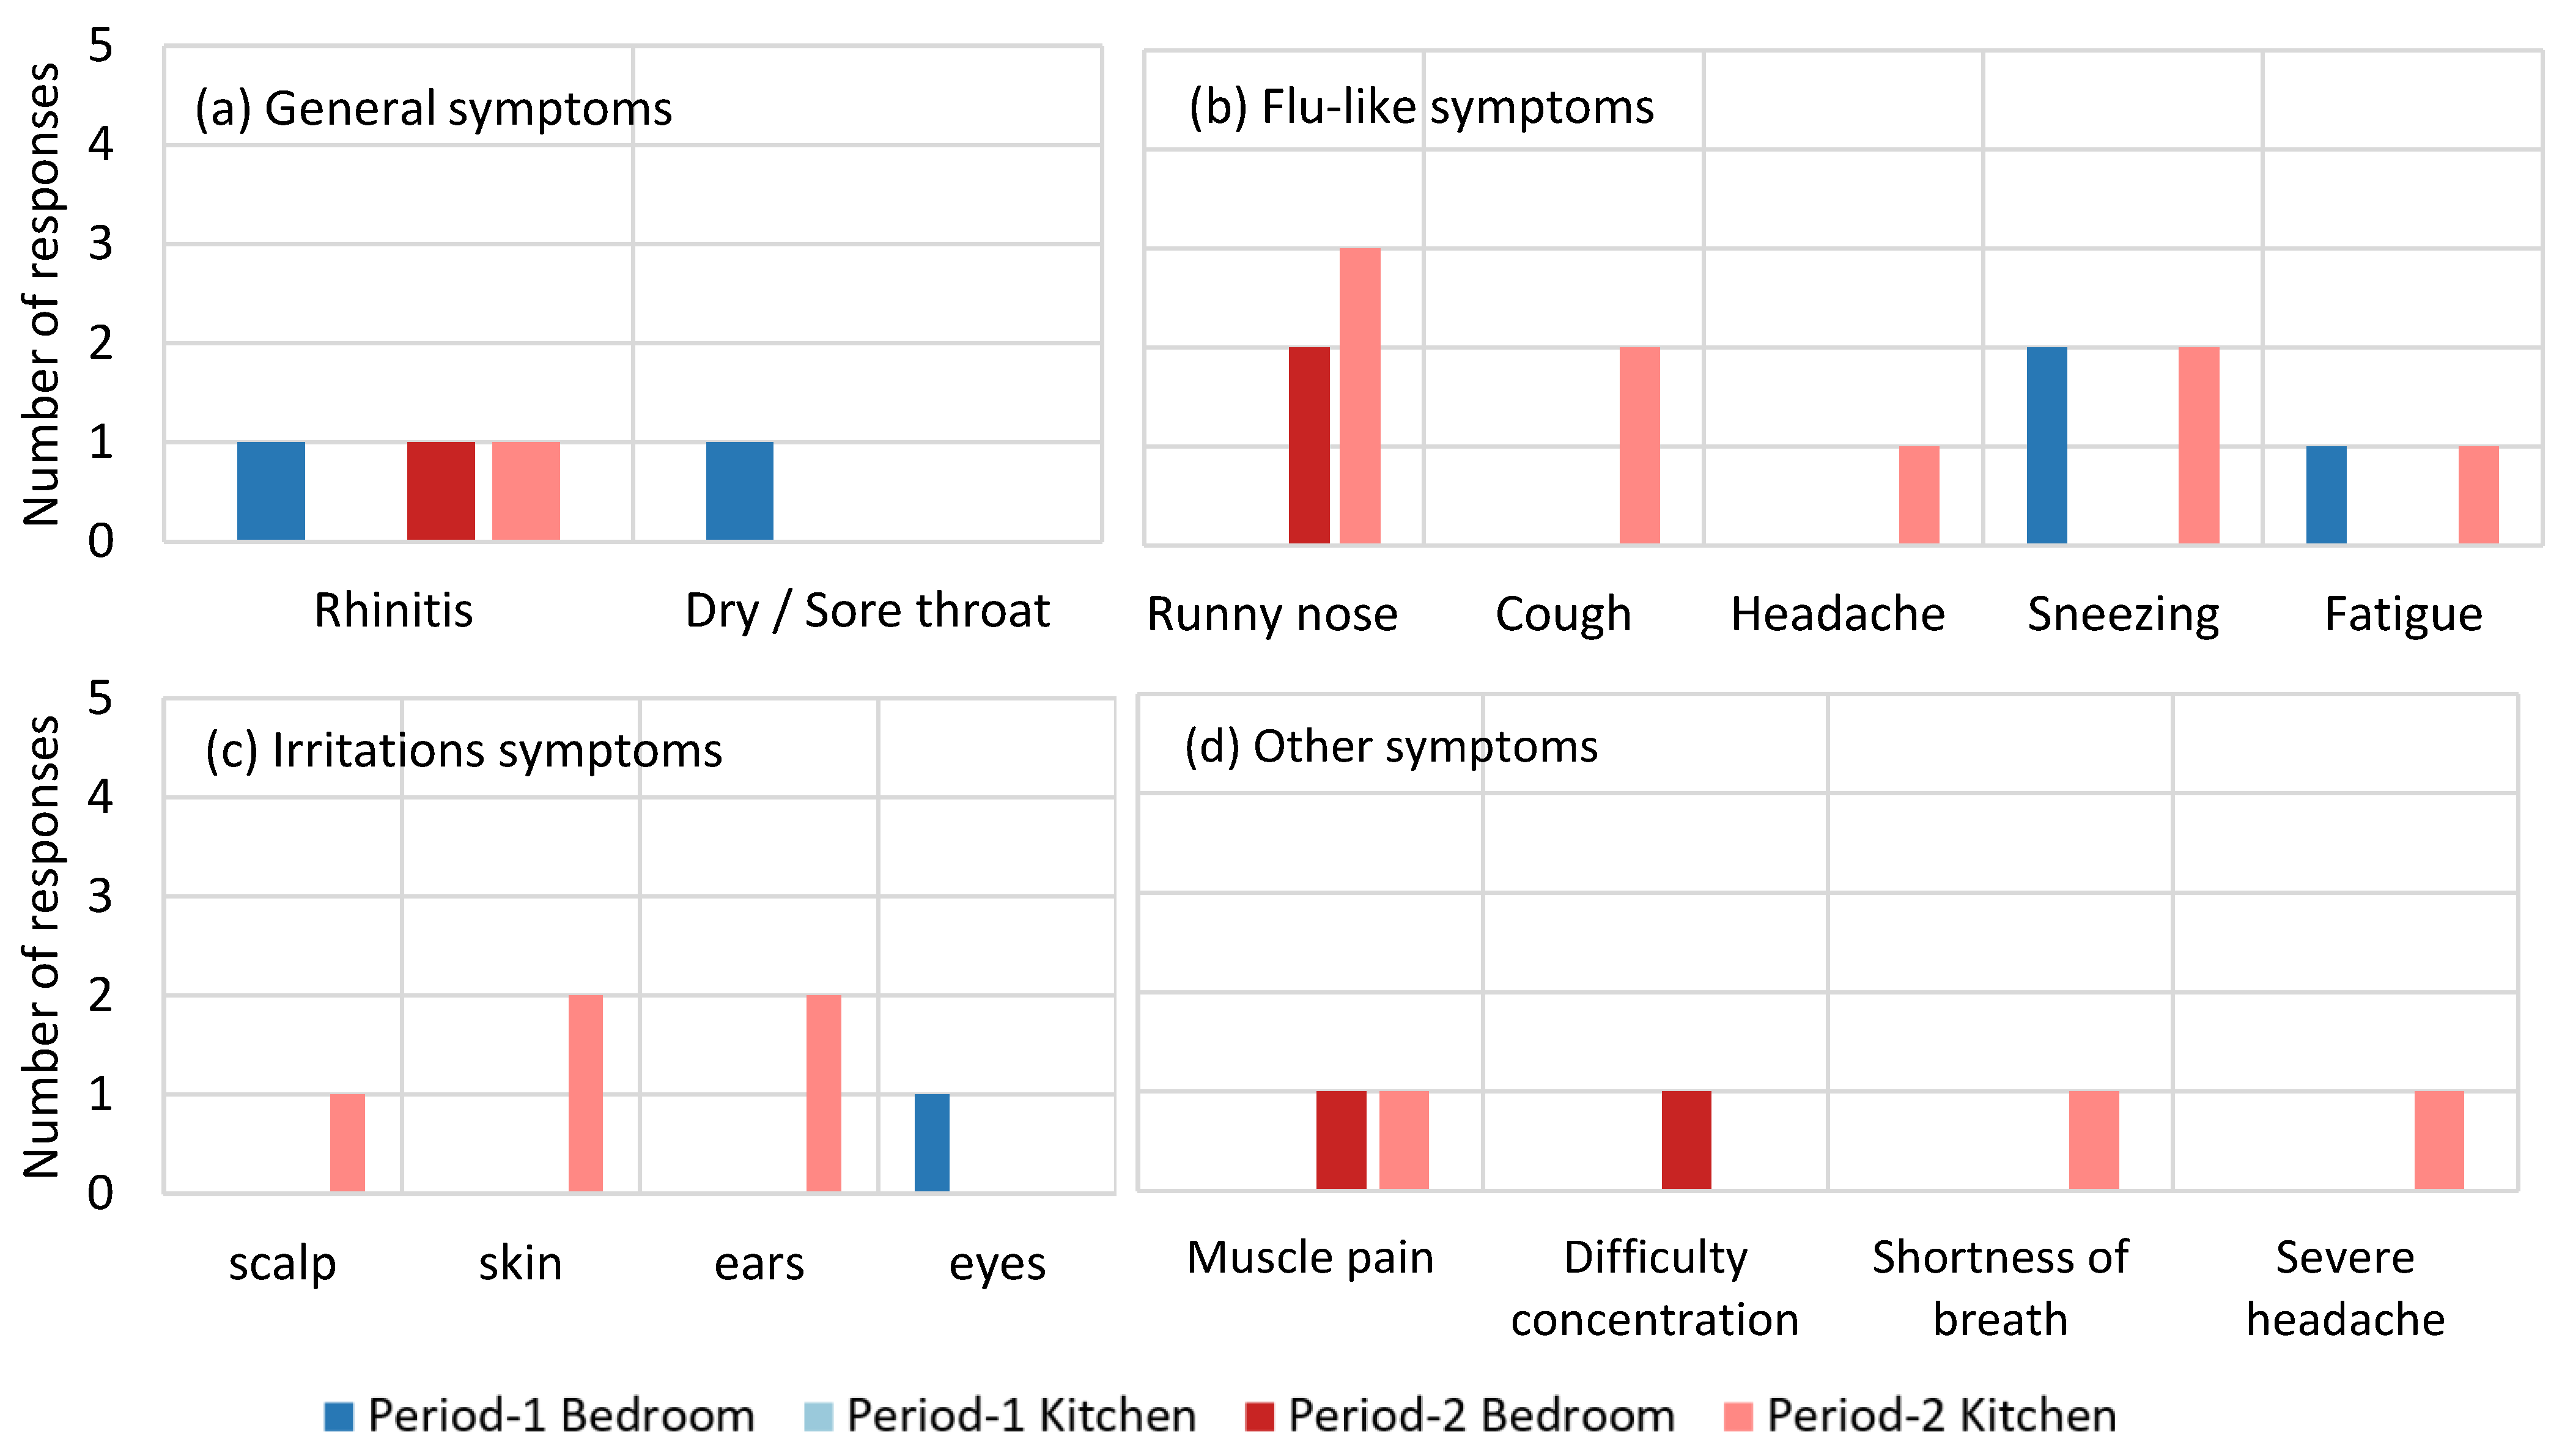
The questionnaire also recorded whether the users had any symptoms during the two-week monitoring periods (Figure 8). The results are presented according to the symptom categories mentioned in Section 2.5.
Although the questionnaires were separated into students in the selected bedrooms and students in the kitchens, they were all using their private bedrooms and the shared kitchens during the monitoring periods. Therefore, the reported symptoms can be interpreted as common incidents of the building or their units, rather than being specific to either the kitchen or the bedrooms.
In Period-1, two out of four respondents from bedrooms reported their symptoms, while neither of the two kitchen respondents reported any symptoms.
In Period-2, three out of six bedroom respondents reported their symptoms, and eight out of nine kitchen respondents reported two to four of their symptoms. More flu-like symptoms, like runny nose, coughing, and sneezing, were reported in Period-2 across rooms and units located on the 2nd, 3rd, 7th, and 11th floors, with one to two reports on each floor, respectively.
Due to the limited response rate in Period-1, it is difficult to determine whether there were healthcare issues during the two periods.
Although the symptoms can be related to the IAQ, they were also related to their recent activities, personal living habits and work from university, and seasonal incidents like flu, etc., which were not recorded in this research. Therefore, it is not possible to conclusively attribute these symptoms to air quality.

4. Discussion

Based on the monitoring data and questionnaire results, the data have been categorized into key topics and analyzed in the following subchapters. These include outdoor distributions, indoor/outdoor relationships, and the potential indoor influence on questionnaire responses.
Due to the limited amount of data and fieldwork cases in this project at this stage, many findings remain hypothetical. Further validation will be necessary in future research.

4.1. The PM2.5 Vertical Distribution and Its I/O Ratio

4.1.1. The PM2.5 Vertical Distribution

The vertical distributions of PM2.5 are displayed with the hourly average values from all outdoor devices of each measured floor. The interpolated results are shown in Figure 9, in which Figure 9a,b denote Period-1 and Period-2, respectively.
Although the overall PM2.5 level in Period-2 was significantly higher, there are still differences in the distributions. For Period-1m with the dust intrusion, the PM2.5 tended to reach a higher level at the lower floor (0~10 m), particularly during the precipitation period from 11th to 14th June. This pattern is consistent with the findings of Han et al. (2018), who reported similar behavior during rainfall during the HF event [9].
In contrast, during Period-2 in October, absent the dust intrusion, the PM reached very high levels due to seasonal factors. Higher concentrations were recorded on the 11th floor, followed by ground-level measurements (below 10 m), with the lowest concentrations observed on the middle floors. This occurred regardless of the weather conditions, which differed slightly from those in Period-1. The PM increase between 21st to 23rd October was expected following the shift from rainy and cloudy conditions to sunny days. Between 23rd and 26th October, the intermittent precipitation temporarily removed the PM, leading to the lower PM2.5 level at the lower altitudes, and rose again when the precipitation ceased.
The elevated PM concentrations in Period-2 compared to Period-1 were likely driven by seasonal changes, such as lower ambient temperature and lower ABL height [52,53]. Additionally, the shorter daytime and cloudy weather weakened the vertical daily convection that could keep the emissions high at the ground level. There were no other recorded reasons or events leading to the high PM level in Period-2.
A limitation of the data, as mentioned in Section 2.4, lies in the 30 min reading intervals, which may have missed short-term spikes from instant emissions, such as the smoking on the open balcony or quick cooking periods, between readings. Despite this limitation, these results reflect the common trends during the monitored periods of the covered spots.

4.1.2. Indoor PM2.5 Level and Lower I/O Ratio at the Higher Floor

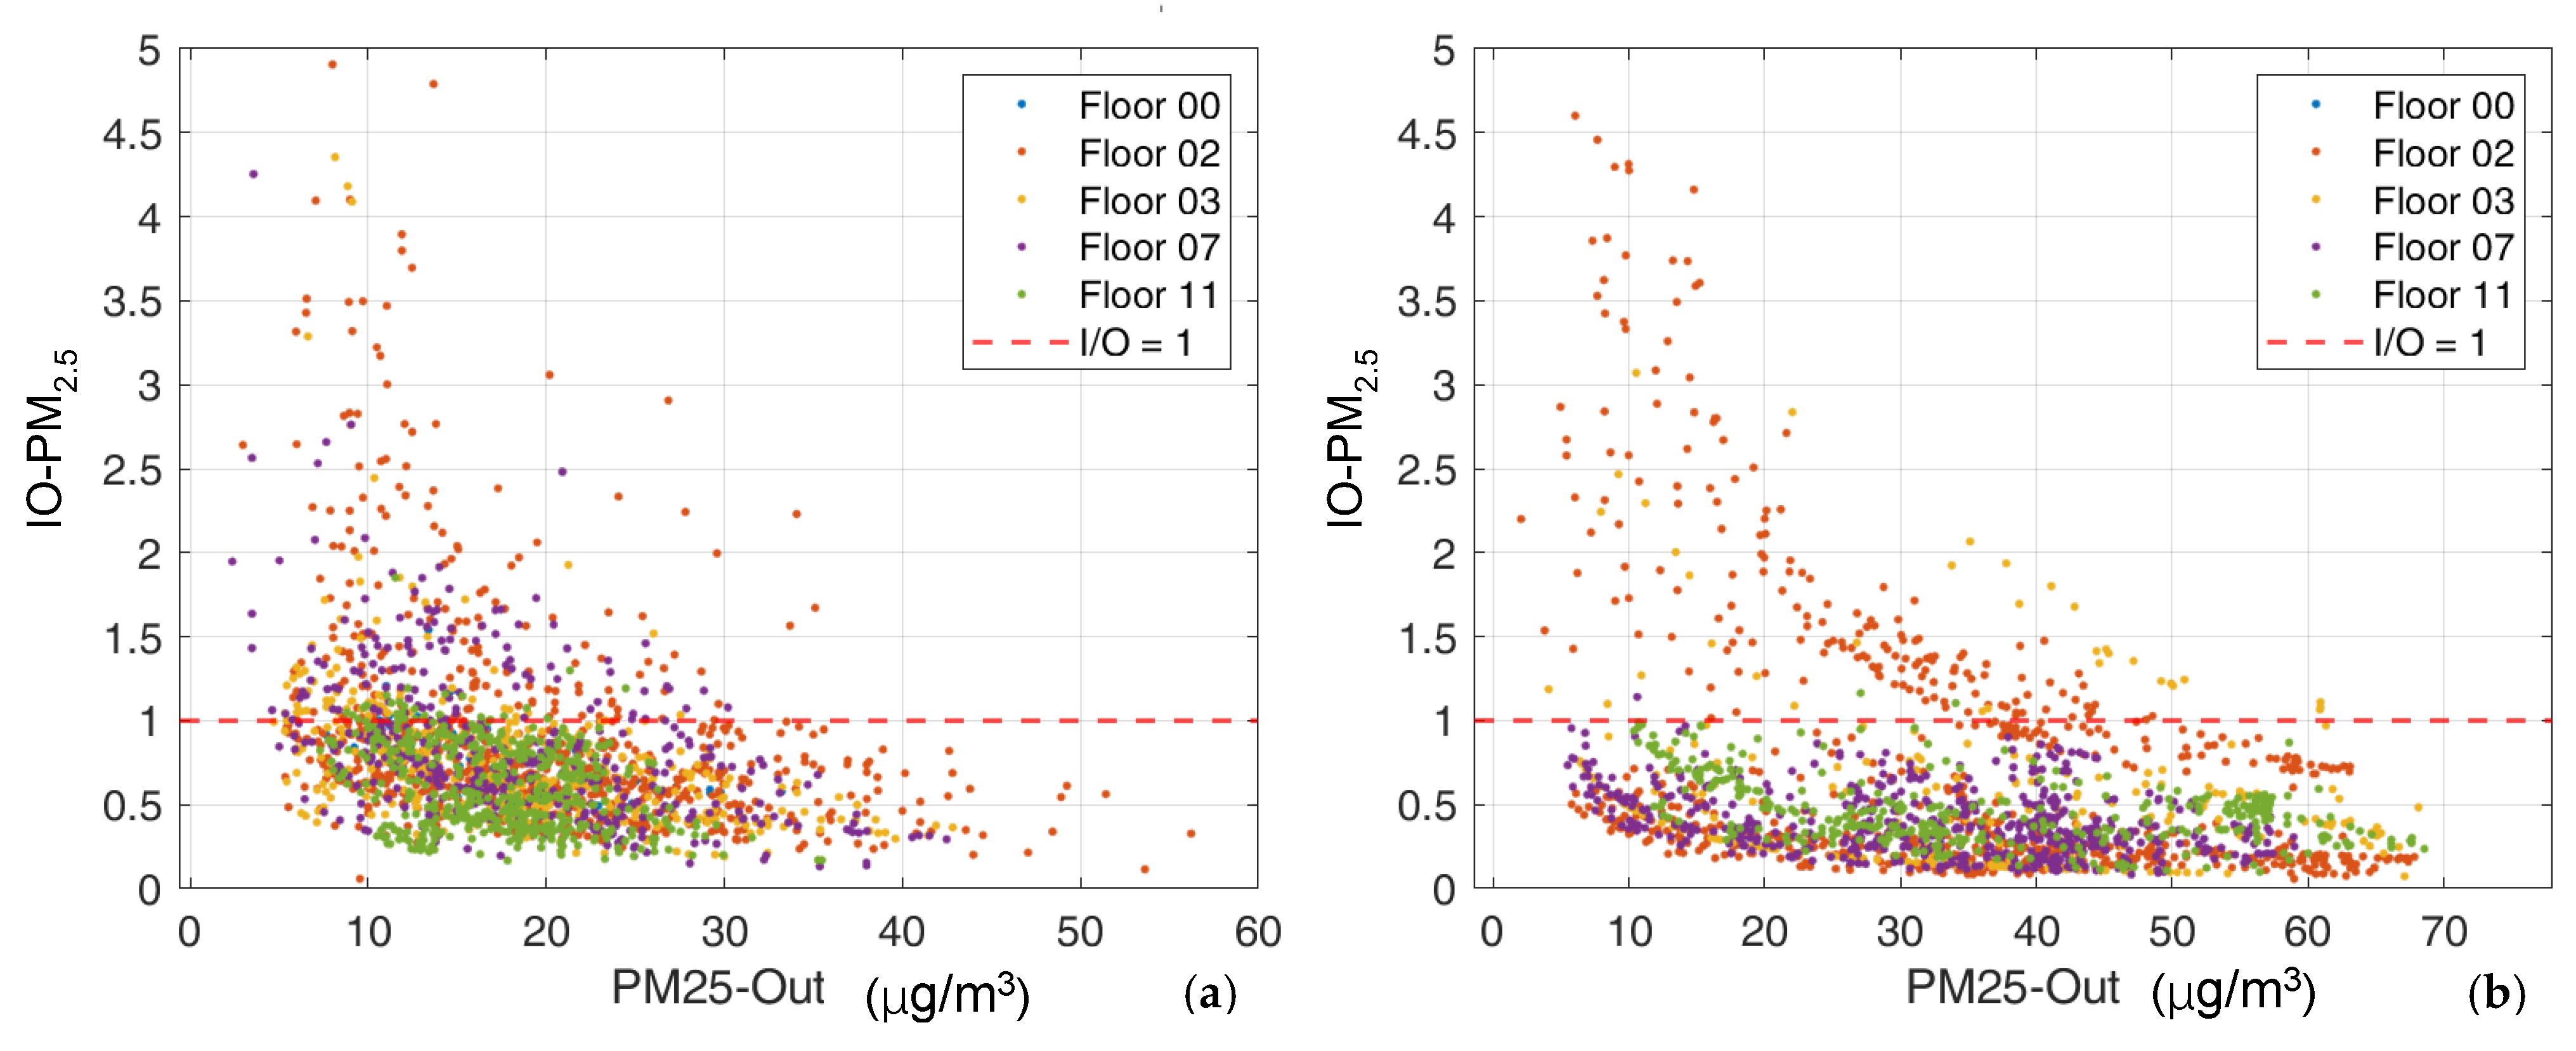
Regarding indoor PM conditions, although the overall PM2.5 concentrations in Period-2 were significantly higher than those in Period-1, the I/O (indoor/outdoor) ratios of these two periods had similar results with common features, as Figure 10 shows the scatter plot of the I/O ratio of PM2.5 versus outdoor PM2.5 on different floors.
In both periods, the I/O ratio of PM2.5 and outdoor PM level showed similar trends: the high PM2.5 I/O ratio tended to appear when the outdoor PM2.5 levels were higher, regardless of floor height.
Furthermore, the data indicate that the higher floor tended to have a lower PM2.5 I/O ratio in both cases. Specifically, the results from the 11th floor (green points) mostly remained below the PM2.5 I/O ratio of 1, followed by the 7th floor (purple points) and then the 2nd and 3rd floors.
In Period-2, the prolonged precipitation contributed to consistently lower I/O ratios of PM2.5 across various rooms with values below 0.5. This was one of the main differences from the data from Period-1, which included around half of the sunny days in the monitored 2-week period.
One of the hypothetical explanations for the existence of a higher I/O ratio at the lower floor is the coverage of the surrounding environment. As illustrated in Figure 11, the surrounding greenery and buildings were close to the height of the fourth to sixth floors. These obstructions may reduce outdoor PM2.5 concentrations at lower levels, thereby increasing the calculated I/O ratios for those floors.
This higher indoor PM2.5 I/O ratio on the lower floor might be attributed to a baseline level of indoor PM level generated by residential activities (similar to the environmental CO2 levels), or to the accumulation caused by the inward air infiltrations, which helped maintain the indoor PM2.5 level at a relatively stable concentration. Meanwhile, the I/O ratio tended to increase when the outdoor PM was lower.
Although a few spikes in the I/O ratio were observed following cooking activities in the kitchens, most rooms exhibited similar trends overall.

4.2. PM2.5 I/O Ratio with Occupancy and Ventilation

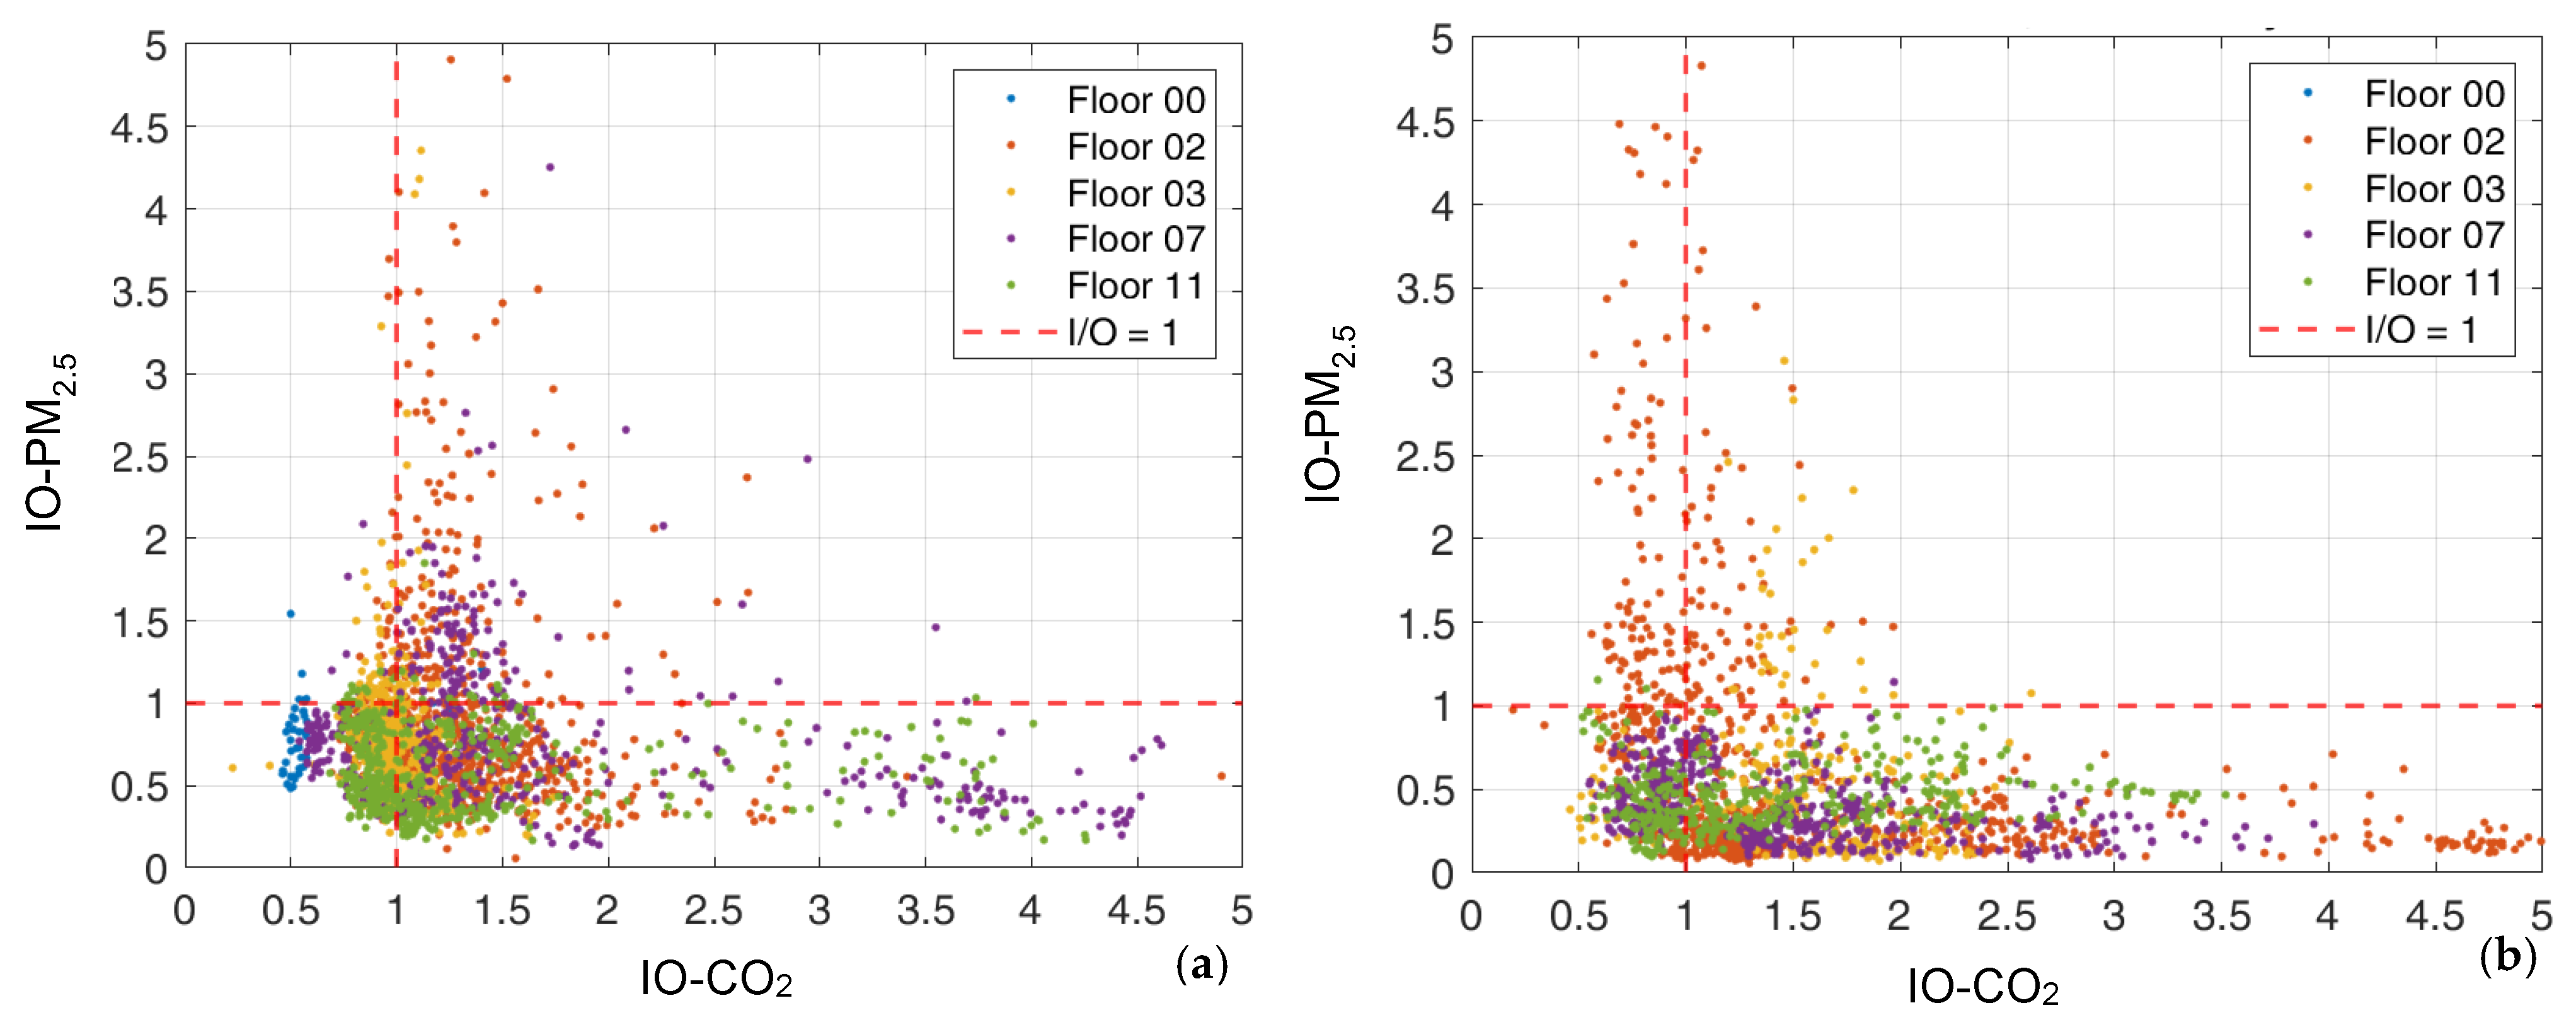
As the survey did not record the window operations and ventilation of the room hour by hour, the I/O ratio of CO2 was considered an indirect indicator of occupancy and ventilation, as the outdoor CO2 levels were usually at a similar level for all the spots and showed less variation than the indoor CO2 levels. By comparing the I/O ratio of CO2 and PM2.5, as Figure 12 shows, how the occupancy and room ventilation influenced the PM levels becomes evident.
When the I/O ratio of CO2 ranged from 0.5 to 1, it likely indicated that rooms were unoccupied, or the room was fully ventilated. As the room temperature was sometimes higher than outside, the CO2 I/O ratio could be lower than 1. When the CO2 I/O was ranged from 1 to 2, it likely indicated occupancy with some level of ventilation (it could also indicate the transitional period of CO2 in the rooms, but usually just by a few points). When the CO2 I/O ratio exceeded 2, it typically indicated that the occupants had stayed in the room with windows closed for at least 2 h. These thresholds were not accurately calculated, as the actual occupancy conditions were more complex and dynamic, but they serve as a helpful reference for interpreting the trends in Figure 12.
The CO2 I/O ratio was used as a proxy for ventilation or window operations, mainly due to the lack of appropriate tools with which to record the actual window usage frequency, timing, and schedule inside the selected rooms. This highlights a potential direction for future methodological improvements.
In Period-2, there were more instances of limited ventilation, primarily due to the precipitation, indoor heating, and the concern about insects. During this period in the rooms, the PM2.5 I/O ratio tended to remain at low levels across all the floors. A similar pattern was observed in Period-1, but only for a short period and in part of the rooms, as there was less rainfall and other issues limiting ventilation. When the I/O ratio of CO2 was lower than 2, the PM2.5 I/O ratio tended to be higher, particularly on the lower floors.
Also, in both periods, Figure 12 shows that regardless of the occupancy and ventilation conditions, and despite the weather conditions outdoors, the rooms on the 11th floor had lower PM2.5 I/O ratios.
Another difference in Period-1 during the sand intrusion event was that the 7th floor also presented higher PM2.5 I/O ratios, and there were several instances where both the I/O ratios of CO2 and PM2.5 were simultaneously elevated.

4.3. The I/O Ratio of PM2.5 and the RH Changes from Weather Conditions

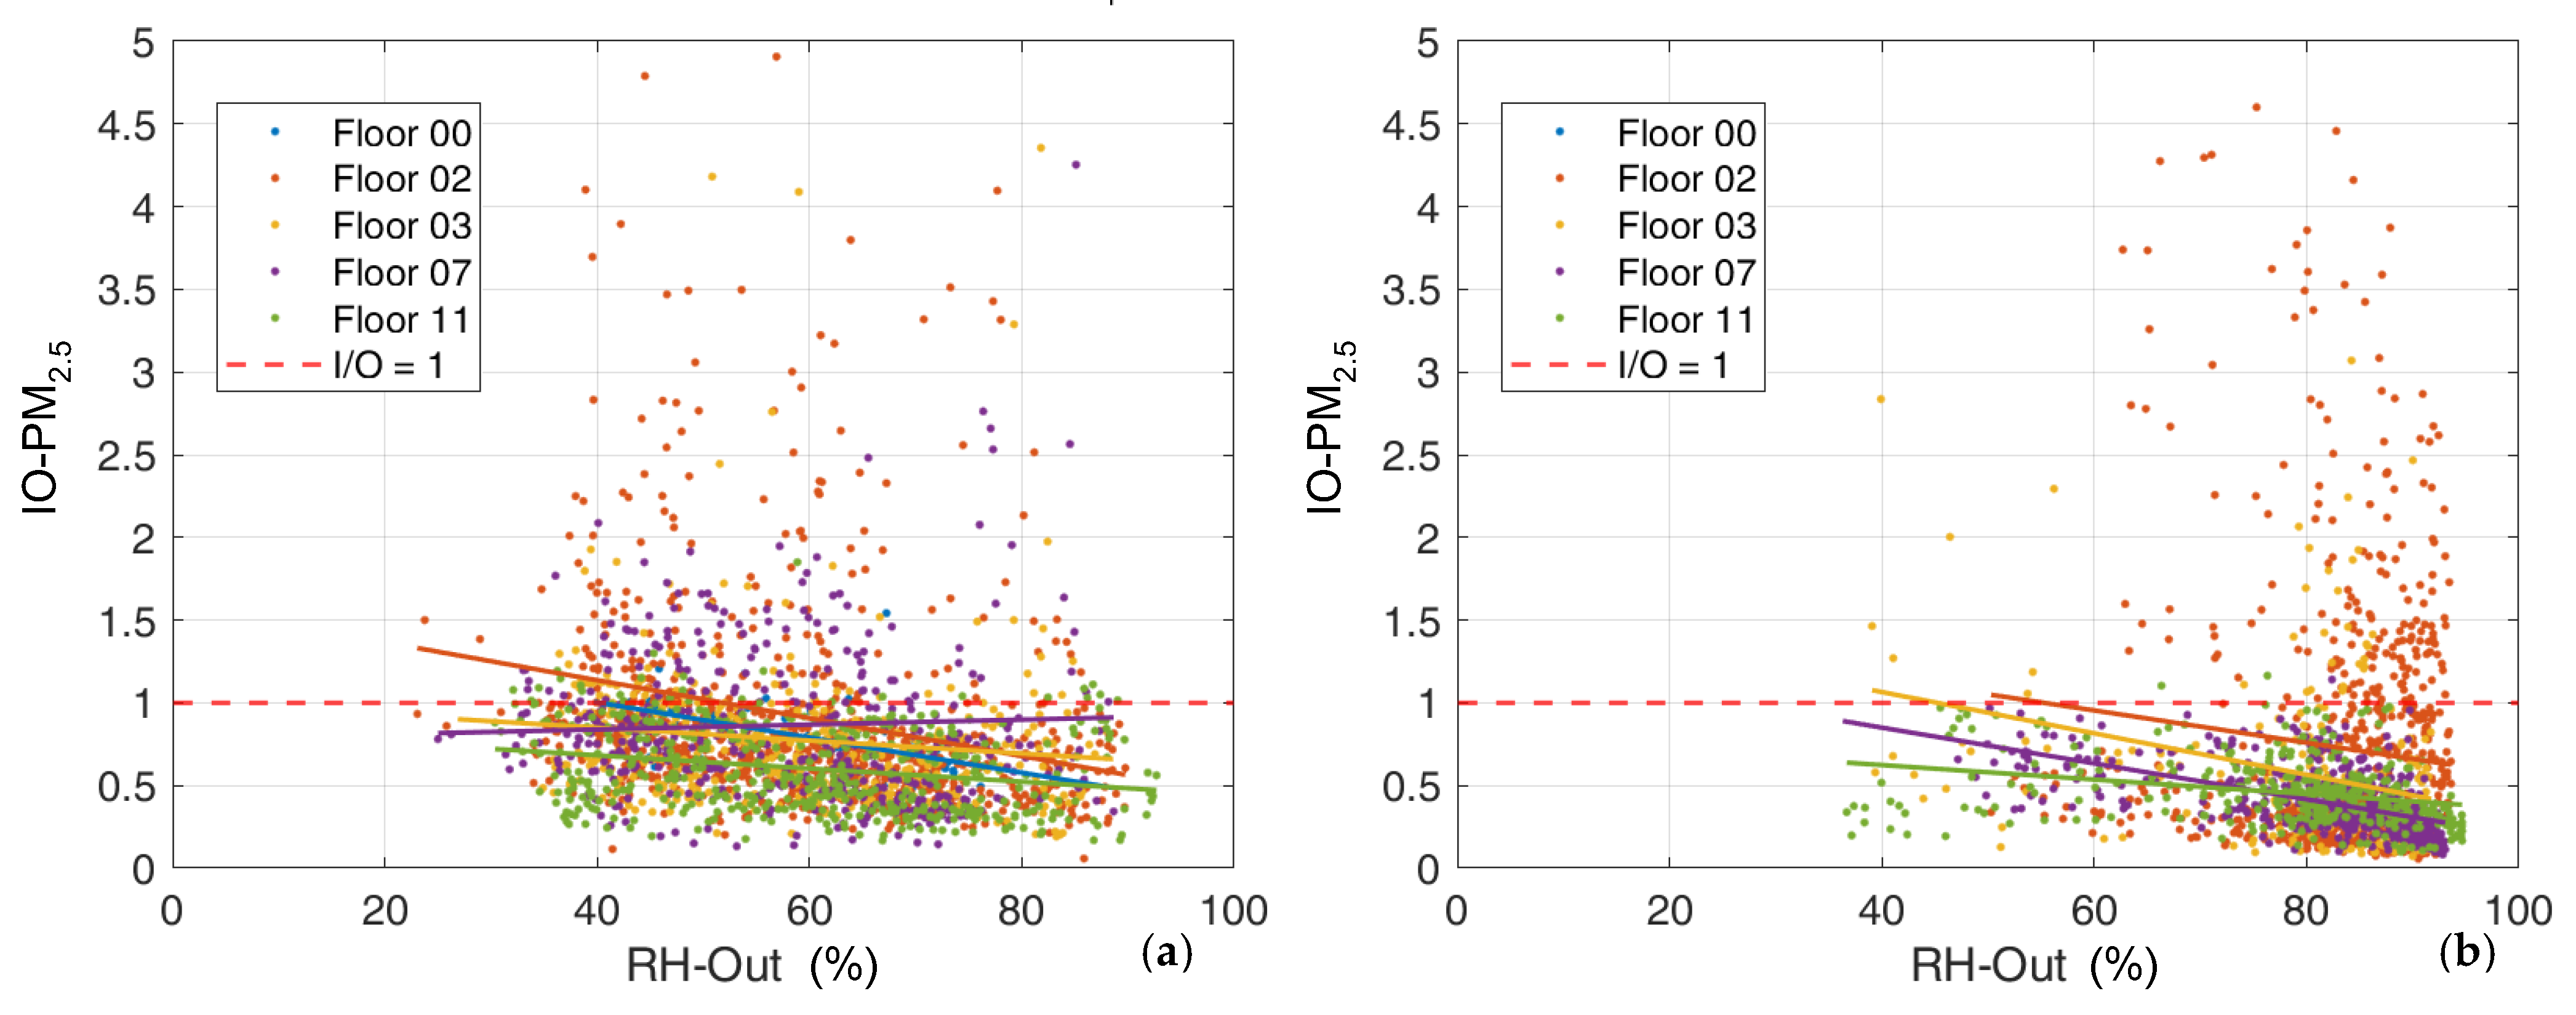
As shown in Section 3.1 and Section 4.1, the rainy weather was effective in removing the airborne PM when the recorded outdoor RH exceeded approximately 85% to 90%. The RH level has no direct correlation with the PM2.5 I/O ratio (Figure 13), which was consistent with the findings of Miller et al. (2017) [54], but the rain and higher ambient RH contributed to a slightly lower average PM2.5 concentration in most of the floors. Then, when the outdoor PM2.5 reaches a significantly lower level, this I/O ratio tends to rebound due to the indoor PM sources, as shown on the second and third floor in Figure 13b and discussed in Section 4.1.
Humidification has been considered as one of the solutions for reducing the indoor PM by maintaining the indoor RH in the range of 60% to 70% [55], but in reality, when the outdoor PM levels are high, the deposition from the humidity is far from effective for the indoor space.

4.4. Indoor/Outdoor AP Differences and PM2.5

Similarly to the RH and weather influence mentioned above, the difference between indoor and outdoor air pressure (I/O ratio of AP) did not significantly influence PM infiltration into the rooms in these cases. PM2.5 is an aerosol with a long suspension time and moves via convection [56], unlike gaseous pollutants [50,57].
The air pressure between each floor showed a clear gradient, with the higher floor having the lower air pressure, regardless of changes in overall outdoor air pressure during the 2-week period. But on each floor, the I/O ratio of AP was close to 1 (within ±0.4%) in both periods, as shown in Figure 14, with each cluster of data corresponding to a different pair of devices and orientations.
Among all pairs of data, most of them had the AP I/O ratio slightly lower than 1, meaning the inward air exchange or potential infiltrations in those rooms.
Each cluster of data shows the vertically extended spindle shape, which means the AP I/O ratio for each pair varied in a relatively narrow range and was stable during the 2 weeks under the prevalent wind direction. But the variation of the PM2.5 I/O ratio changed, sometimes exceeding and sometimes falling below 1. This means the AP I/O ratio lower than 1 does not necessarily result in PM infiltration, and the variation of ambient PM levels was more dominant in the I/O ratios.
One other interesting aspect is that when the AP I/O ratio was higher than 1, the indoor AP was higher than outdoors, and the PM2.5 I/O ratio tended to be lower than 1 in both periods and on most floors, suggesting that the positive indoor AP may benefit in minimizing the indoor PM level. This point was not proven in the data from these two cases because there were only a few rooms in each period that had an AP I/O ratio higher than 1, and the reason for the appearance of positive AP was not recorded, especially when no mechanical ventilation was working in both periods.
This is similar to the function of providing positive air pressure into the fire escape stairwell for keeping the smoke outside, and it could be a feasible solution for regions with frequent high ambient PM levels. Also, in building layout design, by arranging the more frequently occupied rooms based on the local prevalent wind direction, it is possible to generate this positive internal AP with natural ventilation, and the common space with lower occupant density or more greenery could be located as the inlet of air and then supported by mechanical ventilation.

4.5. Daily Features of PM2.5 I/O Ratio

Some previous research has identified that ambient PM2.5 has diurnal variation patterns [8,58]. Also, the monitoring data in the two periods in this work demonstrated this daily trend, as Figure 4 and Figure 5 show in Section 3.1 above. On most days without precipitation, there were peaks of ambient PM2.5 in the morning around sunrise, then this decreased due to the convection driven by solar heating and increasing ABL height [8,12]. Sometimes, there could be second peaks in the early evening around the commuting time, as found by Hart et al., but this depends on the climate, urban activities, and weather conditions [58].
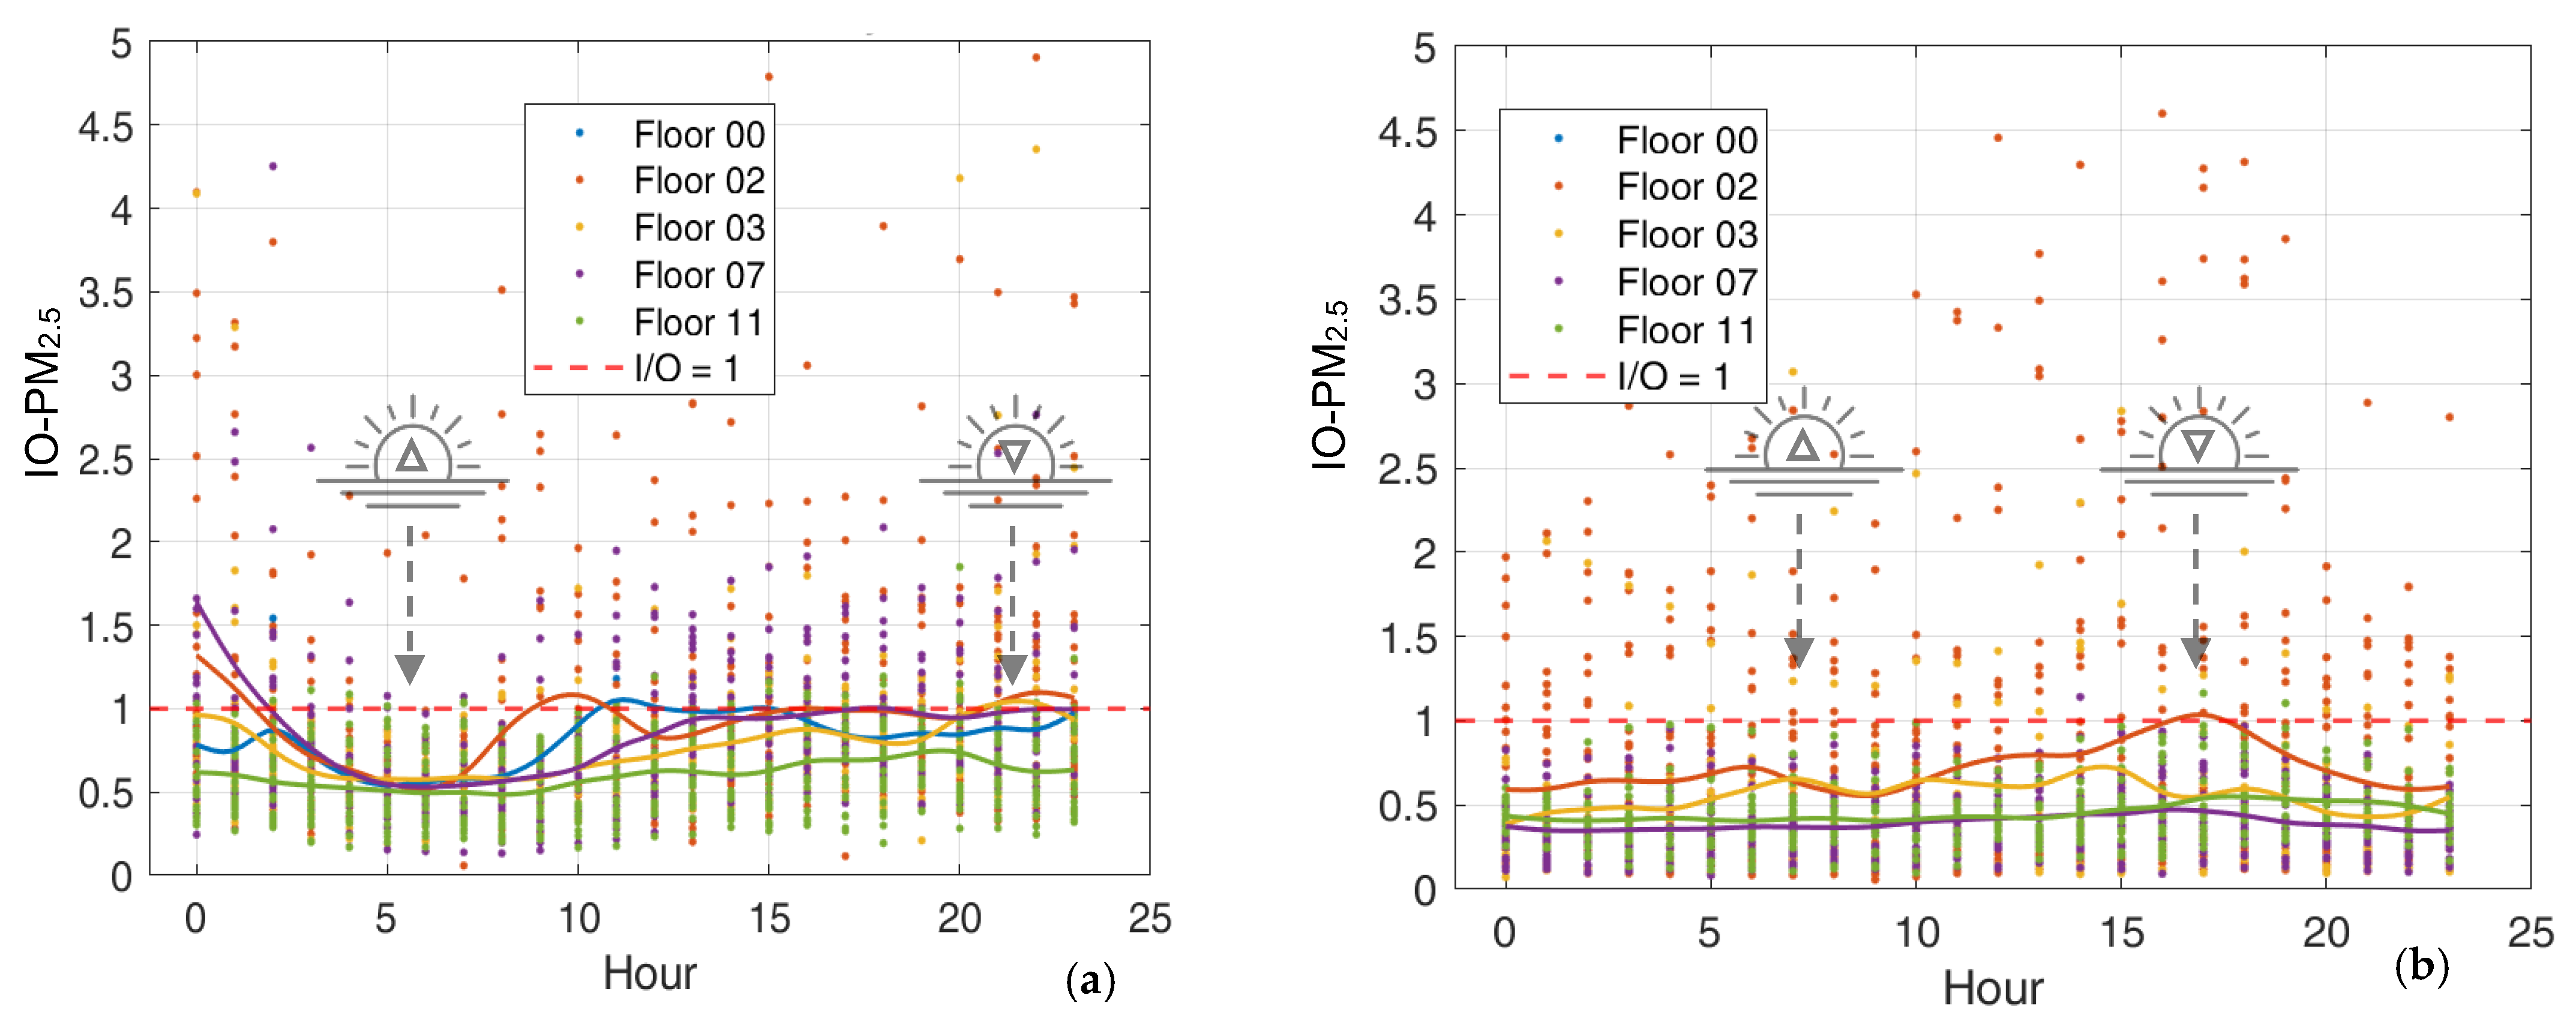
This daily trend is also partly reflected in the daily pattern of the PM2.5 I/O ratio (Figure 15). During Period-1 in June, this PM2.5 I/O ratio reached its daily minimum between 5:00 a.m. and 7:00 a.m. (with sunrise around 5:30 a.m. in June in Milan). This pattern, in this period, occurred in most of the rooms across the five monitored floors and under various weather conditions during the monitoring weeks. On the one hand, it may be attributed to the peaks of the outdoor PM2.5 levels in the morning (see Figure 4 and Figure 5). On the other hand, the reduced indoor activities at night stabilized the indoor PM and led to a decrease in its level. For the rest of the day, the average PM2.5 I/O ratio fluctuated close to 1, with the ratio on the 11th floor being lower than those on other floors.
However, this pattern was still present but less pronounced in the data from Period-2 in October. In Figure 15b, similar troughs occurred between 7:00 and 10:00 a.m. (with sunrise between 7:30 a.m. to 8:00 a.m. in late October in Milan) on the lower floors (second and third), with a possible peak near sunset. However, the prolonged rainfall and extended periods of window closure normalized these variations.
This daily PM2.5 I/O ratio pattern correlated with daily ambient PM variations and could be integrated into the smart building design through dynamic daily natural ventilation control to minimize the impact of ambient PM.

4.6. The Reported Symptoms and IAQ from the Survey and Suggestions to Residents

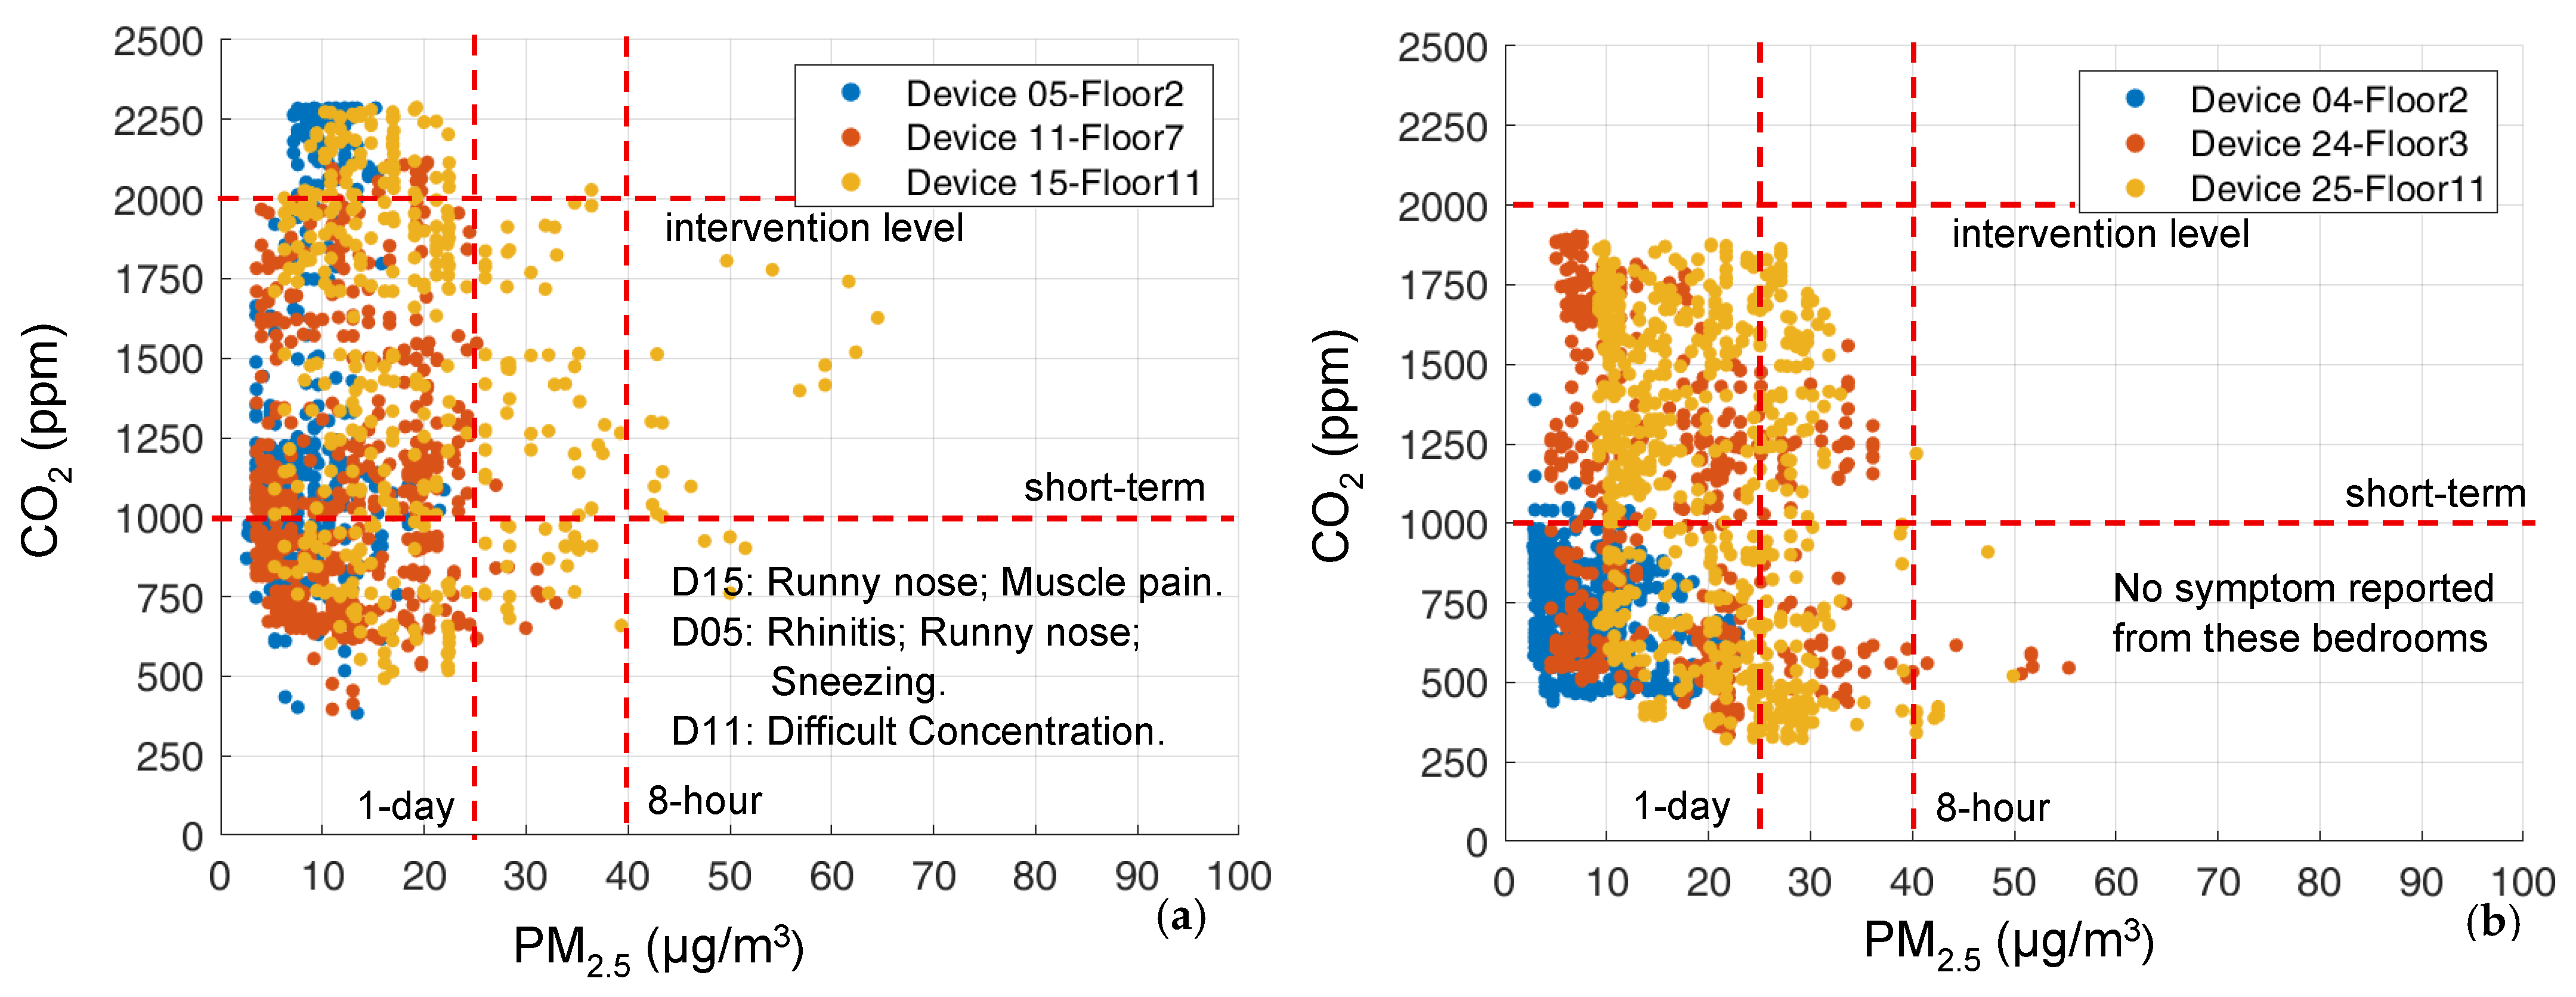
In terms of the health-related symptoms reported in the survey and the corresponding IAQ during both periods, as argued in Section 3.2, the collected data had significant limitations in interpreting the direct correlations between these symptoms and IAQ. However, considering the pollutants involved, namely, indoor CO2 and PM, some possible explanations can be inferred, as shown in Figure 16.
In Period-1, due to the low response rate and limited symptom reports, it is challenging to relate the IAQ to symptoms based on only 2 responses, which reported rhinitis, dry/sore throat, sneezing, fatigue, and eye irritation. By looking into the data from the specific room of these two responses, they were from the bedrooms on the second and seventh floors, respectively, with CO2 and PM2.5 below the short-term reference level in both rooms.
Therefore, the current dataset and low response rate are too limited to provide the validated results regarding the relationship between IAQ and the reported symptoms. The following findings represent a possible hypothesis based on the IAQ records associated with the reported symptoms.
In Period-2, due to the prolonged precipitation, heating operation, insect presence, and other factors, inadequate ventilation was the main issue noted, as shown in Figure 16b, resulting in the elevated indoor CO2 and PM2.5 levels.

4.6.1. The Bedrooms with Symptom Reports in Period-2

The IAQ conditions in the rooms with questionnaire responses were evaluated (Figure 17). Most of the time, the PM2.5 levels remained within the reference short-term range, but five out of six of these rooms presented elevated CO2 levels in more than half of the time over the two weeks. Among the rooms with symptoms reported (Figure 17a), the three rooms were located on different floors, making cross-infection of influenza between occupants unlikely, and all three rooms experienced periods when CO2 levels exceeded 2000 ppm, indicating prolonged occupancy and inadequate ventilation for fresh air supply.

4.6.2. The Kitchens with Symptom Reports in Period-2

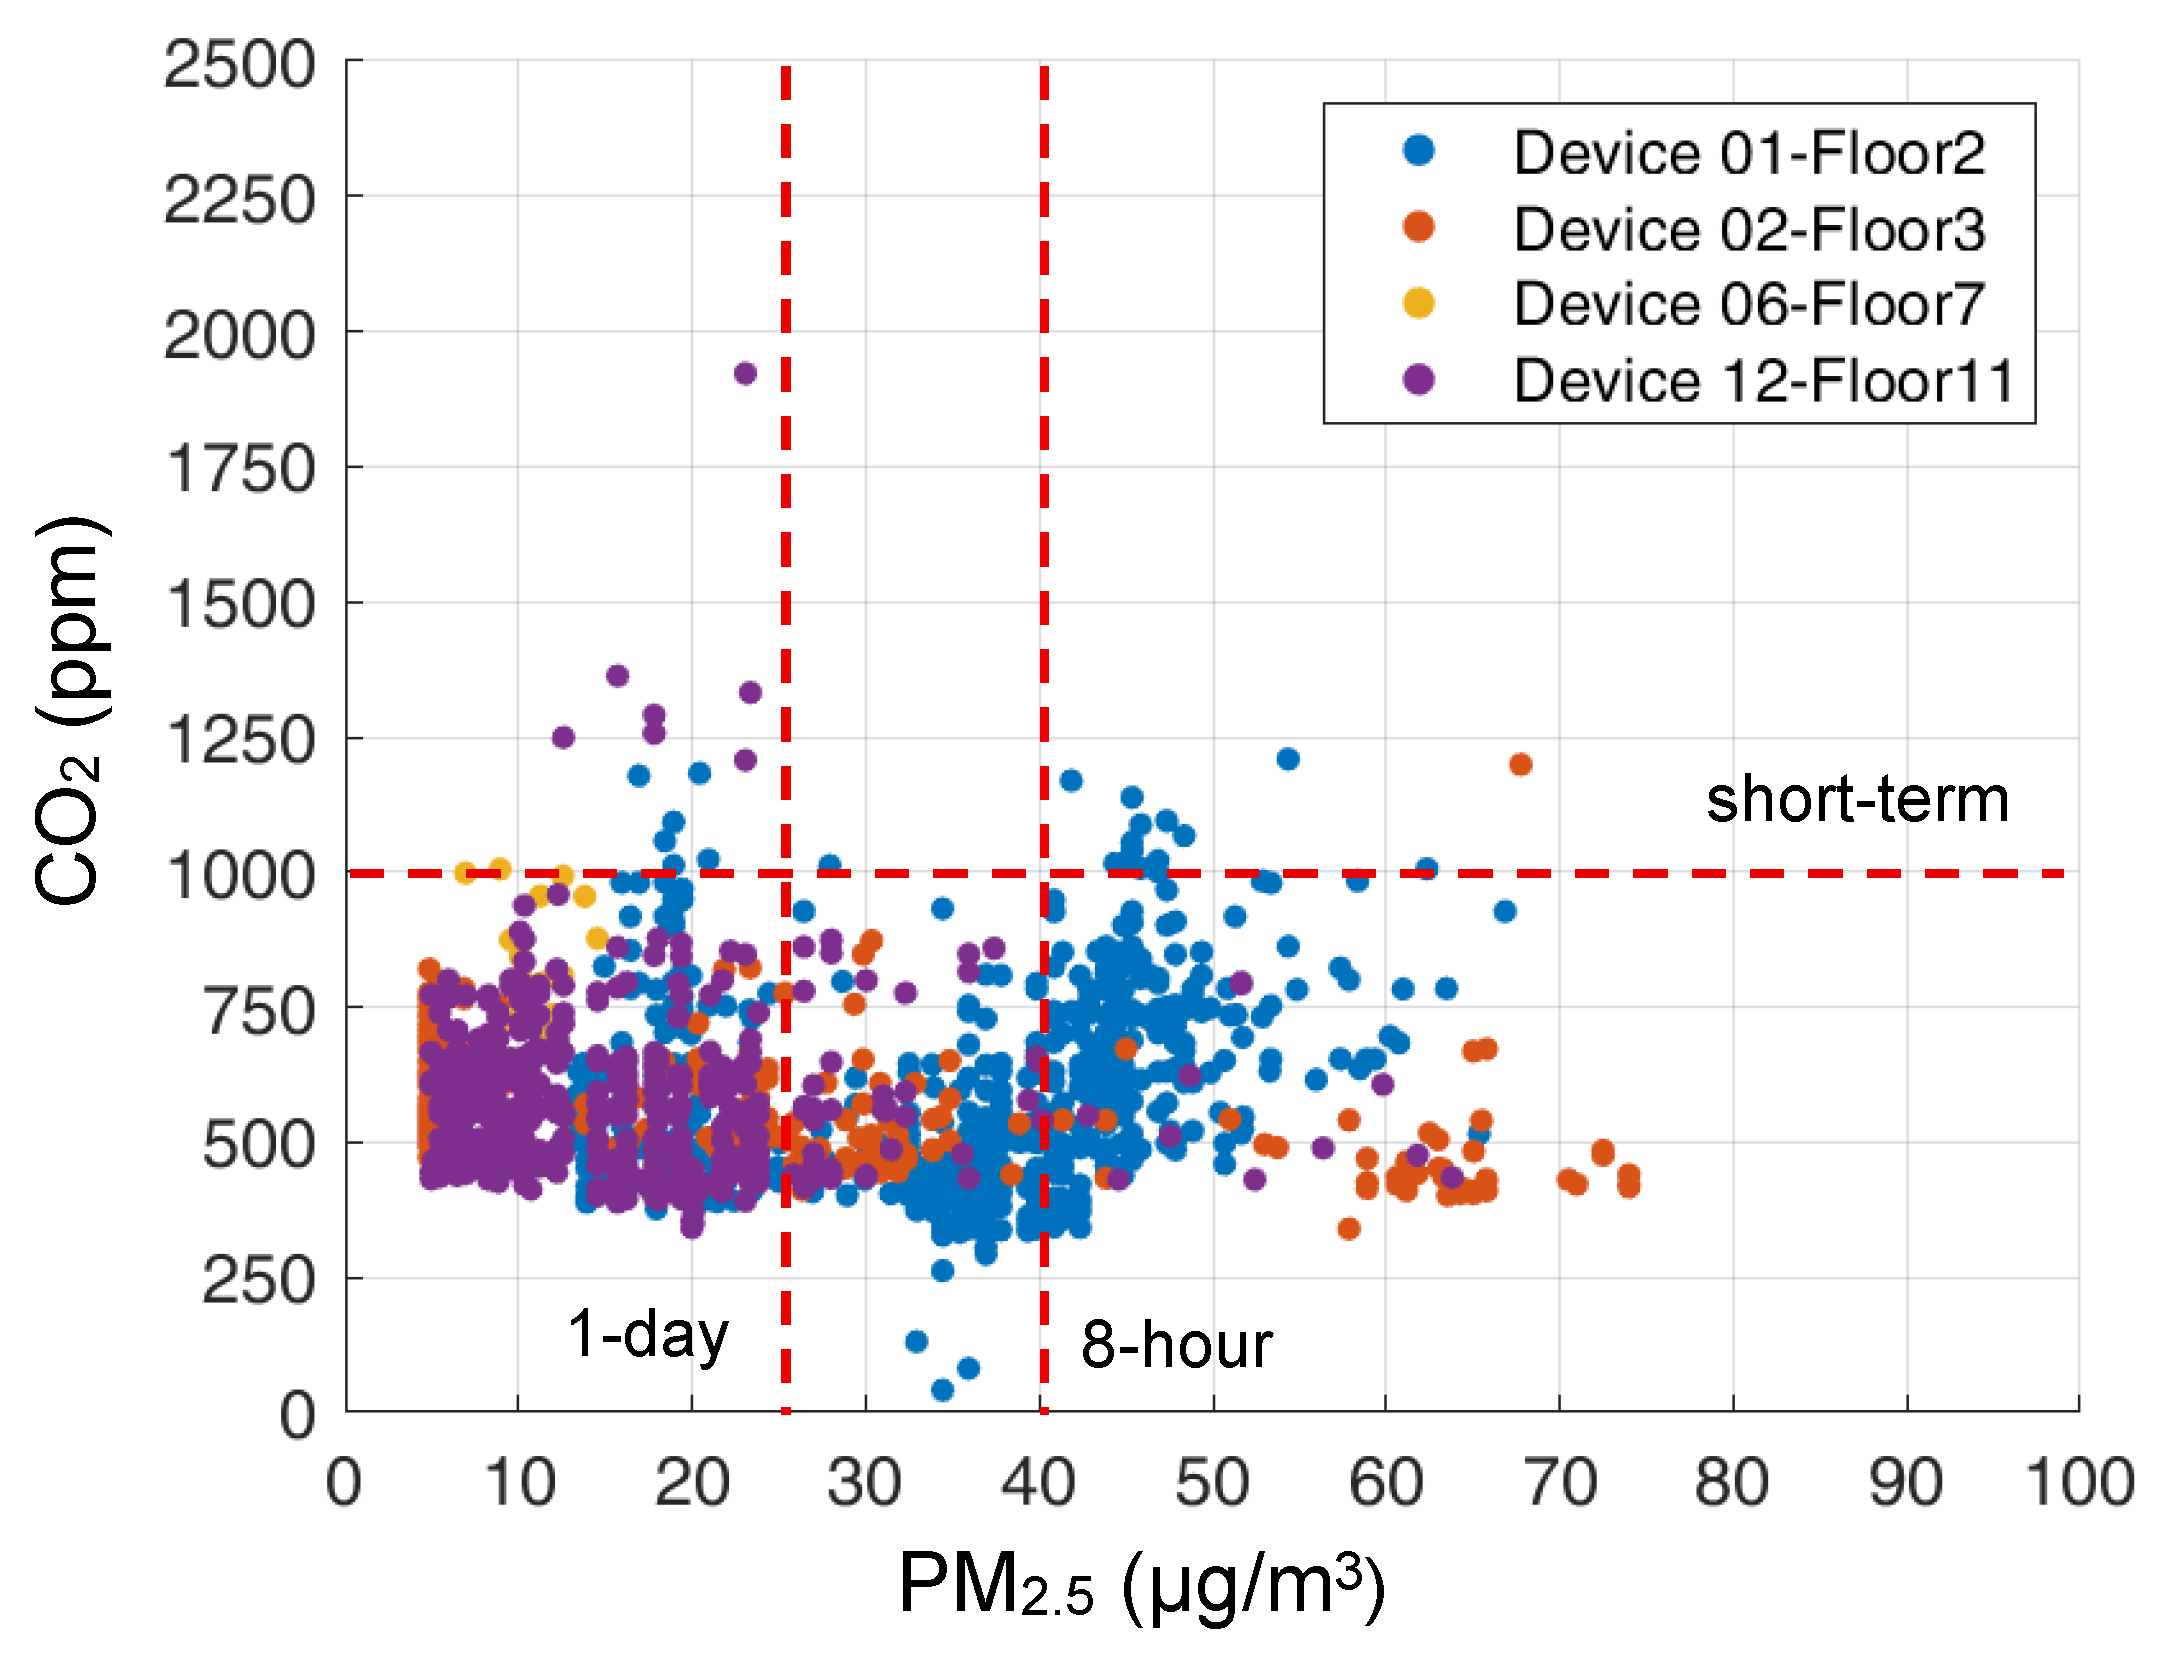
In Period-2, four kitchens were included, and one of the rooms (with device 12) had no valid response. In the three kitchens, each of the three kitchens had three responses from users who shared that kitchen.
Based on Figure 18, which shows the IAQ condition in kitchens, and Table 2, which shows the reported symptoms, the units with a higher PM level in a shared kitchen tended to exhibit respiratory symptoms such as sneezing and runny nose.
However, the association in kitchens was less clear than in bedrooms since the users who responded regarding the kitchen spent only 2 to 4 h in their kitchens, spending more time in their own bedroom, for which the corresponding data were unavailable. Moreover, if there was a seasonal flu that led to similar respiratory symptoms in one of the units, the current data would make it difficult to distinguish between flu-related and IAQ-related symptoms.
Additional samples and extended monitoring are necessary to confirm these correlations between the IAQ data and reported symptoms in future studies.

4.6.3. Suggestions Based on IAQ Conditions Observed

Based on the IAQ records in the two periods, although health-related symptom responses were limited, overexposure to the elevated air pollution level in their daily lives was evident in both periods. For the regions with similar climates, several recommendations may be applicable to residential environments.
Night Ventilation Before Sleep
One common issue that could be highlighted is the exposure to elevated CO2 concentrations in most bedrooms. The sleeping period (around 11:00 p.m. to 7:00 a.m.) was the typical time when the CO2 accumulated continuously in most of the bedrooms observed in the two periods, frequently exceeding 2000 ppm and even higher during the rainy days and the period with heating. Ventilation for fresh air is clearly necessary, but considering the decreasing temperature and rising PM levels during the night (as Figure 4 and Figure 5 show), the period just before bedtime would be the most suitable time for ventilating bedrooms. Natural ventilation for 15 to 30 min is sufficient to reduce indoor CO2 levels, while the outdoor PM are at a relatively low level during those times.
This night ventilation is also a sustainable and energy-efficient solution for the summer period, as the temperature continues to drop throughout the evening and night, and the ambient temperatures at midnight before the sleeping period usually decrease to a comfortable thermal level.
Cooking Emission Accumulation in Other Rooms
In terms of the kitchen, post-cooking ventilation is essential. However, more importantly, it is necessary to prevent cooking emissions from spreading into the other rooms, as reported in several questionnaire responses. When bedrooms and internal corridors are poorly ventilated, the cooking-related emissions can accumulate in other areas.
This issue is also closely related to the layout of the building and the direction of airflow. If the air path passes through the kitchen first, the polluted air may pass through the adjacent rooms. The practical solution for this case is to close the door of the kitchen during the cooking period and to ensure proper ventilation within the kitchen.
Furthermore, the range hoods in this building (which may be the same as in many other Italian regions) do not expel the exhaust air outdoors but rather recirculate it through filters placed above the induction stove, as Figure 19 shows. As a result, the emitted gases and particles from cooking were not removed effectively.
Although this is not the main topic of this work and there is no direct data for further analysis, this could be an interesting topic of IAQ and architecture research in the Italian context.

5. Conclusions and Limitations

5.1. Final Considerations

This study presents the results of two periods of monitoring activity in a student residence in Milan in June and October 2024, along with the corresponding occupant surveys carried out in each period. Despite the occasional differences in climate conditions between these two periods, several common patterns were identified, particularly in the vertical distribution of particulate matter (PM) and its influence on indoor air quality (IAQ).
During Period-1, a dust intrusion event passed near Milan, but fortunately, the city was at the edge of its path. In contrast, Period-2 experienced consistently higher PM levels overall, with elevated concentrations lasting longer than those observed during the intrusion event in Period-1.
In both periods, the average ambient PM levels tended to be slightly higher on the lower floors compared to the middle floors. PM concentrations on the top floor varied, sometimes being higher and sometimes lower than those on other floors. These variations may be attributed to the influence of the surrounding building environment.
The daily variation in outdoor PM2.5 and PM10 generally aligns with the findings in other atmospheric studies on the ABL and air pollution, even though it was just at the ground level and the building-level scale, a small part of the atmosphere.
Regarding indoor PM concentrations, both monitoring periods showed that higher floors tended to have lower I/O ratios of PM2.5, with the top floor in this building having an I/O ratio lower than 1 most of the time.
The higher outdoor RH level was associated with a lower I/O ratio of PM. But when the ambient PM concentration dropped below a certain level (around 20 µg/m3 in these cases), the indoor concentration often exceeded the outdoor level. This level of indoor PM was from basic indoor activities, excluding high-emission activities like cooking or smoking.
The I/O ratio of AP in each room varied over a small range, showing little variation across rooms, regardless of floor level, and had minimal impact on the I/O ratio of PM2.5. However, in the cases where the indoor space had positive AP, the PM2.5 I/O ratio tended to remain below 1, which is a potentially effective strategy in layout design or supporting mechanical ventilation.
The average PM2.5 I/O ratio in these two periods on each floor, partly due to the ambient PM2.5 variations, shows daily variation features with the lowest points around the time of sunrise then rebounding during the daytime.
According to the responses from the questionnaire, both periods revealed complaints related to overheating. High humidity caused by rainfall was frequently mentioned as a contributing factor, despite indoor temperatures remaining within the comfort range. In Period-2, the central heating system was on, and the stuffy indoor air due to the lack of ventilation during the rainy days also contributed to thermal discomfort.
Although the survey response rate in Period-1 was insufficient to establish a correlation between IAQ and the reported symptoms, the lack of natural ventilation in Period-2 may have contributed to the higher number of reported symptoms, alongside seasonal influenza. Furthermore, rooms with elevated PM levels connected to the shared kitchens were associated with a higher incidence of reported respiratory symptoms.
Although outdoor air quality was an important factor influencing IAQ, human activities were still essential in preventing the input, accumulation, and concentration of air pollutants inside the room via control of the window and balcony opening and natural ventilation. As also noted in previous studies [59], this paper highlights the significant impact of user behavior on well-being and health in indoor settings and how source control and window opening can serve as a key strategy in preventive healthcare.
In addition, residential occupants can take advantage of the nighttime ventilation before sleep, based on their thermal comfort needs and avoid the periods of high PM exposure during the day.
Since residential spaces are highly private, the IAQ management primarily depends on the residents and their living habits. Residents can perceive the heat, odor, and humidity, but are often unaware of changes in common air pollutants. Daily ventilation actions following the daily air pollutant patterns, with window operations, can improve the IAQ condition. These daily and seasonal ventilation patterns can also be incorporated into the ventilation system design of the building to improve the living spaces of the residents who lack awareness of IAQ.

5.2. Limitations and Future Developments

This project, at the current stage, only covered two weeks inside one student’s house as the case study. Although this will capture some commonalities, differences could emerge in cases with different locations, surroundings, seasons, weather, and climates. More comparisons with long-term monitoring would improve the reliability of our findings across many of the topics discussed. Also, due to this limitation with respect to the number of cases and data, the findings are hypothetical condition and require more cases for validation.
During the monitoring activity, there were many limitations and troubles identified, which influenced the condition of the data, like the users accidentally stopping the deployed indoor sensors or the malfunction of internet services, leading to the failure of data collection.
The facilities did not provide permission to use the electricity plugs for the devices’ energy supply, and also, the outdoor measurement deployment points are on the windowsills outside the windows, so all the devices must use batteries for their energy supply. The battery supply limits the monitoring intervals to 30 min and the monitoring periods to 2 weeks, which misses many subtle variations in this work. The monitoring over longer periods with shorter intervals could help in specifying instant indoor emissions, such as cooking and cleaning. These require more support from the facilities and optimization of the devices for outdoor monitoring.
For recording a more accurate window operation and ventilation schedule, the direct recording of the window operation or measurement of air exchange volumes, such as via a motion sensor on the windows, is essential in obtaining accurate results for the indoor air exchange rate, rather than using the CO2 I/O ratio as a proxy.
The arranged monitoring period mainly depended on the availability of the facility and residents, so it was hard to predict or avoid some unwanted weather conditions, like rain.
The low survey response rate in Period-1 made it hard for our study to reflect the occupants’ feedback. This was improved in Period-2, but in general, the replies rely on the availability of the residents and their willingness to participate.
Monitoring over only 2 weeks was not sufficiently long to describe many findings, and in the future, more results will be added following further monitoring activities.

Supplementary Materials

The following supporting information can be downloaded at https://www.mdpi.com/article/10.3390/atmos16080936/s1: Figure S1: The research permission and consent from Campus Life; Figure S2: The approval from the Ethical Committee; Figure S3: An example of the questionnaire.

Author Contributions

Conceptualization, Y.Y.; methodology, M.G. and Y.Y.; validation, G.S. and S.C.; formal analysis, Y.Y.; investigation, Y.Y.; resources, G.S. and Y.Y.; data curation, Y.Y.; writing—original draft preparation, Y.Y. and M.G.; writing—review and editing, M.G. and G.S.; supervision, M.G. and S.C.; project administration, S.C.; funding acquisition, Y.Y. All authors have read and agreed to the published version of the manuscript.

Funding

This research refers to the state of the art of a PhD thesis, already in progress, by Yong Yu (PhD program in Architecture, Built environment and Construction engineering at Politecnico di Milano). His scholarship is funded by the China Scholarship Council, with the funding number 202108420048.

Institutional Review Board Statement

Not applicable.

Informed Consent Statement

Informed consent was obtained from all subjects involved in this study.

Data Availability Statement

Due to privacy requirements from the student facility management department of Campus Life and the Ethical Committee from Politecnico di Milano, the data presented in this study are available on request from the corresponding author.

Acknowledgments

As the researchers in this work, the authors are grateful to the staff working in dormitory management, including those of Campus Life of Politecnico di Milan, who provided significant support in the methodology design of both the monitoring and the survey. Meanwhile, many thanks are due to the director of the accommodation facility, who helped to organize the monitoring activities and to establish communication with all the residents involved.

Conflicts of Interest

The authors declare no conflicts of interest.

Abbreviations

The following abbreviations are used in this manuscript:
ABLAtmosphere Boundary Layer
APAir Pressure
CAMSCopernicus Atmosphere Monitoring Service
CCNCloud Condensation Nuclei
CO2Carbon Dioxide
HFHaze and Fog
IAQIndoor Air Quality
ILInversion Layer
I/OIndoor and Outdoor
PM10Particulate Matter 10 μm or less
PM2.5Particulate Matter 2.5 μm or less
RHRelative Humidity
SLSurface Layer
TTemperature
UAVUnmanned Aerial Vehicle

References

  1. Morganti, A.; Brambilla, A.; Aguglia, A.; Amerio, A.; Miletto, N.; Parodi, N.; Porcelli, C.; Odone, A.; Costanza, A.; Signorelli, C.; et al. Effect of Housing Quality on the Mental Health of University Students during the COVID-19 Lockdown. Int. J. Environ. Res. Public Health 2022, 19, 2918. [Google Scholar] [CrossRef]
  2. Leech, J.A.; Nelson, W.C.; Burnett, R.T.; Aaron, S.; Raizenne, M.E. It’s about time: A comparison of Canadian and American time-activity patterns. J. Expos. Anal. Environ. Epidemiol. 2002, 12, 427–432. [Google Scholar] [CrossRef]
  3. Brasche, S.; Bischof, W. Daily time spent indoors in German homes—Baseline data for the assessment of indoor exposure of German occupants. Int. J. Hyg. Environ. Health 2005, 208, 247–253. [Google Scholar] [CrossRef]
  4. Klepeis, N.E.; Nelson, W.C.; Ott, W.R.; Robinson, J.P.; Tsang, A.M.; Switzer, P.; Behar, J.V.; Hern, S.C.; Engelmann, W.H. The National Human Activity Pattern Survey (NHAPS): A resource for assessing exposure to environmental pollutants. J. Expos. Anal. Environ. Epidemiol. 2001, 11, 231–252. [Google Scholar] [CrossRef]
  5. Lopez, N. Copernicus: Saharan Dust Strongly Affects Air Quality in Eastern Mediterranean. Available online: https://atmosphere.copernicus.eu/copernicus-saharan-dust-strongly-affects-air-quality-eastern-mediterranean (accessed on 3 March 2025).
  6. Babaan, J.B.; Ballori, J.P.; Tamondong, A.M.; Ramos, R.V.; Ostrea, P.M. Estimation of PM 2.5 vertical distribution using customized UAV and mobile sensors in Brgy. UP Campus, Diliman, Quezon City. In Proceedings of the 2018 International Conference on Geomatic and Geospatial Technology: Geospatial and Disaster Risk Management, GGT 2018, Kuala Lumpur, Malaysia, 3–5 September 2018; pp. 89–103. [Google Scholar] [CrossRef]
  7. Choomanee, P.; Bualert, S.; Thongyen, T.; Salao, S.; Szymanski, W.W.; Rungratanaubon, T. Vertical variation of carbonaceous aerosols within the PM2.5 fraction in Bangkok, Thailand. Aerosol Air Qual. Res. 2020, 20, 43–52. [Google Scholar] [CrossRef]
  8. Han, S.; Zhang, Y.; Wu, J.; Zhang, X.; Tian, Y.; Wang, Y.; Ding, J.; Yan, W.; Bi, X.; Shi, G.; et al. Evaluation of regional background particulate matter concentration based on vertical distribution characteristics. Atmos. Chem. Phys. 2015, 15, 11165–11177. [Google Scholar] [CrossRef]
  9. Han, S.Q.; Hao, T.Y.; Zhang, M.; Yao, Q.; Liu, J.L.; Cai, Z.Y.; Li, X.J. Observation Analysis on Microphysics Characteristics of Long-lasting Severe Fog and Haze Episode at Urban Canopy Top. Aerosol Air Qual. Res. 2018, 18, 2475–2486. [Google Scholar] [CrossRef]
  10. Lu, S.J.; Wang, D.S.; Wang, Z.Y.; Li, B.; Peng, Z.R.; Li, X.B.; Gao, Y. Investigating the Role of Meteorological Factors in the Vertical Variation in PM2.5 by Unmanned Aerial Vehicle Measurement. Aerosol Air Qual. Res. 2019, 19, 1493–1507. [Google Scholar] [CrossRef]
  11. Samad, A.; Vogt, U.; Panta, A.; Uprety, D. Vertical distribution of particulate matter, black carbon and ultra-fine particles in Stuttgart, Germany. Atmos. Pollut. Res. 2020, 11, 1441–1450. [Google Scholar] [CrossRef]
  12. Piironen, A. Atmospheric Boundary Layer Structure. Available online: http://lidar.ssec.wisc.edu/papers/akp_thes/node6.htm (accessed on 13 May 2022).
  13. Huang, X.; Huang, J.; Ren, C.; Wang, J.; Wang, H.; Wang, J.; Yu, H.; Chen, J.; Gao, J.; Ding, A. Chemical Boundary Layer and Its Impact on Air Pollution in Northern China. Environ. Sci. Technol. Lett. 2020, 7, 826–832. [Google Scholar] [CrossRef]
  14. Miao, C.; Yu, S.; Zhang, Y.; Hu, Y.; He, X.; Chen, W. Assessing outdoor air quality vertically in an urban street canyon and its response to microclimatic factors. J. Environ. Sci. 2023, 124, 923–932. [Google Scholar] [CrossRef]
  15. Cichowicz, R.; Dobrzański, M. Indoor and Outdoor Concentrations of Particulate Matter and Gaseous Pollutants on Different Floors of a University Building: A Case Study. J. Ecol. Eng. 2020, 22, 162–173. [Google Scholar] [CrossRef]
  16. Cichowicz, R.; Dobrzanski, M. 3D spatial analysis of particulate matter (PM10, PM2.5 and PM1.0) and gaseous pollutants (H2S, SO2 and VOC) in urban areas surrounding a large heat and power plant. Energies 2021, 14, 4070. [Google Scholar] [CrossRef]
  17. Castaldo, G.; Gambaro, M.; Mussinelli, E.; Tartaglia, A. The Quality of the Project and the MIUR Standards for the Control and Funding of Buildings for Education and Training. In Buildings for Education: A Multidisciplinary Overview of the Design of School Buildings; Della Torre, S., Bocciarelli, M., Daglio, L., Neri, R., Eds.; Springer International Publishing: Cham, Switzerland, 2020; pp. 117–125. [Google Scholar] [CrossRef]
  18. Baiardi, L.; Ciaramella, A.; Bellintani, S. A Development and Management Model for “Smart” Temporary Residences. In Regeneration of the Built Environment from a Circular Economy Perspective; Della Torre, S., Cattaneo, S., Lenzi, C., Zanelli, A., Eds.; Springer International Publishing: Cham, Switzerland, 2020; pp. 337–346. [Google Scholar] [CrossRef]
  19. Comune di Milano. Calendario di Accensione Degli Impianti di Riscaldamento. Available online: https://www.comune.milano.it/aree-tematiche/ambiente/energia/calendario-accensione-impianti (accessed on 20 May 2025).
  20. Yu, Y.; Gola, M.; Settimo, G.; Buffoli, M.; Capolongo, S. Feasibility and Affordability of Low-Cost Air Sensors with Internet of Things for Indoor Air Quality Monitoring in Residential Buildings: Systematic Review on Sensor Information and Residential Applications, with Experience-Based Discussions. Atmosphere 2024, 15, 1170. [Google Scholar] [CrossRef]
  21. Sensirion. SCD4x. 2023. Available online: https://sensirion.com/media/documents/48C4B7FB/64C134E7/Sensirion_SCD4x_Datasheet.pdf (accessed on 28 August 2024).
  22. BOSCH. BME680-Datasheet. 2024. Available online: https://www.bosch-sensortec.com/media/boschsensortec/downloads/datasheets/bst-bme680-ds001.pdf (accessed on 30 April 2024).
  23. Yong, Z. Digital Universal Particle Concentration Sensor PMS5003 Series Data Manual. 2016. Available online: https://www.aqmd.gov/docs/default-source/aq-spec/resources-page/plantower-pms5003-manual_v2-3.pdf?sfvrsn=2 (accessed on 28 August 2024).
  24. Levra Levron, A.; Marino, D.; Pollo, R. Refurbishment of Social housing: A survey of the building stock owned by ATC Torino. TECHNE J. Technol. Archit. Environ. 2016, 12, 199–206. [Google Scholar] [CrossRef]
  25. Laghezza, A.; Yu, Y.; Settimo, G.; Capolongo, S.; Gola, M. How to evaluate the indoor air quality through users’ perception and low-cost sensors: A methodology for defining how to match the qualitative and quantitative analysis in indoor working spaces, as a strategy for promoting health. In Proceedings of the INDOOR AIR 2024-Conference Program and Proceedings, Honolulu, HI, USA, 7–11 July 2024. [Google Scholar]
  26. Riva, A.; Rebecchi, A.; Capolongo, S.; Gola, M. Can Homes Affect Well-Being? A Scoping Review among Housing Conditions, Indoor Environmental Quality, and Mental Health Outcomes. Int. J. Environ. Res. Public Health 2022, 19, 15975. [Google Scholar] [CrossRef]
  27. ANSI/ASHRAE Standard 55-2023; Thermal Environmental Conditions for Human Occupancy. American Society of Heating Refrigerating and Air-Conditioning Engineers (ASHRAE): Peachtree Corners, GA, USA; American National Standards Institute (ANSI): Washington, DC, USA, 2023. Available online: https://www.ashrae.org/technical-resources/bookstore/standard-55-thermal-environmental-conditions-for-human-occupancy (accessed on 30 June 2024).
  28. American Society of Heating Refrigerating and Air-Conditioning Engineers (ASHRAE). 2016 Ashrae Handbook—HVAC Systems and Equipment. Humidifiers 2016; ASHRAE: Peachtree Corners, GA, USA, 2016; Available online: https://www.ashrae.org/advertising/handbook-advertising/systems (accessed on 15 September 2023).
  29. Settimo, G.; Yu, Y.; Gola, M.; Buffoli, M.; Capolongo, S. Challenges in IAQ for Indoor Spaces: A Comparison of the Reference Guideline Values of Indoor Air Pollutants from the Governments and International Institutions. Atmosphere 2023, 14, 633. [Google Scholar] [CrossRef]
  30. World Health Organization (WHO) Regional Office for Europe. Air Quality Guidelines for Europe, 2nd ed.; World Health Organization Regional Office for Europe: Copenhagen, Denmark, 2000. [Google Scholar]
  31. Umwelt Bundesamt (UB). Zur Gesundheitlichen Bewertung der Innenraumluft setzt der AIR Richtwerte, Hygienische Leitwerte Sowie Risikobezogene Leitwerte Fest. Available online: https://www.umweltbundesamt.de/themen/gesundheit/kommissionen-arbeitsgruppen/ausschuss-fuer-innenraumrichtwerte#ausschuss-fur-innenraumrichtwerte-air (accessed on 23 February 2023).
  32. Government of the United Kingdom (HM Goverment). The Building Regulations 2010 Materials and Workmanship Approved Document 7 (July 2021 Edition). 2021. Available online: https://assets.publishing.service.gov.uk/media/6717d29438149ce9d09e3862/The_Merged_Approved_Documents_Oct24.pdf (accessed on 20 May 2023).
  33. Public Health England. Indoor Air Quality Guidelines for Selected Volatile Organic Compounds (VOCs) in the UK. 2019. Available online: https://assets.publishing.service.gov.uk/government/uploads/system/uploads/attachment_data/file/831319/VO__statement_Final_12092019_CS__1_.pdf (accessed on 15 September 2022).
  34. Education & Skills Funding Agency. Building Bulletin 101. Guidelines on Ventilation, Thermal Comfort and Indoor Air Quality in Schools: Government Response to Public Consultation. 2018. Available online: https://assets.publishing.service.gov.uk/government/uploads/system/uploads/attachment_data/file/735652/BB101_Consultation_response.pdf (accessed on 15 September 2022).
  35. Ministry of Labour and Social Inclusion. Regulations Concerning the Design and Layout of Workplaces and Work Premises (the Workplace Regulations). 2013. Available online: https://lovdata.no/dokument/SFE/forskrift/2011-12-06-1356 (accessed on 15 September 2022).
  36. Minister of Health and Social Welfare. Ordinance of the Minister of Health and Social Welfare of March 12, 1996 on Acceptable Concentrations and Intensity of Adverse to Health Agents, Secreted by Construction Materials, Equipment and Fittings in Rooms Designed to Accommodate People. Polish Monitor No. 19 of 1996. Item. 23 1996. Available online: https://www.ilo.org/dyn/natlex/natlex4.detail?p_lang=en&p_isn=99664 (accessed on 10 September 2022).
  37. French Agency for Food Environmental and Occupational Health & Safety (ANSES). Indoor Air Quality Guidelines (IAQGs). Available online: https://www.anses.fr/en/content/indoor-air-quality-guidelines-iaqgs (accessed on 28 April 2022).
  38. Légifrance. LOI n° 2010-788 du 12 Juillet 2010 Portant Engagement National Pour L’environnement. 2010. Available online: https://www.legifrance.gouv.fr/jorf/id/JORFTEXT000022470434 (accessed on 15 June 2022).
  39. Légifrance. Décret n° 2011-1727 du 2 Décembre 2011 Relatif Aux Valeurs-Guides Pour L’air Intérieur Pour le Formaldéhyde et le Benzène. 2011. Available online: https://www.legifrance.gouv.fr/eli/decret/2011/12/2/DEVP1116199D/jo/texte (accessed on 16 June 2022).
  40. Légifrance. Décret n° 2015-1000 du 17 Août 2015 Relatif aux Modalités de Surveillance de la Qualité de L’air Intérieur Dans Certains Établissements Recevant du Public. 2015. Available online: https://www.legifrance.gouv.fr/eli/decret/2015/8/17/DEVP1406204D/jo/texte (accessed on 15 June 2022).
  41. Légifrance. Décret n° 2015-1926 du 30 Décembre 2015 Modifiant le Décret n° 2012-14 du 5 Janvier 2012 Relatif À L’évaluation des Moyens D’aération et À la Mesure des Polluants Effectuées au Titre de la Surveillance de la Qualité de L’air Intérieur de Certains Établissements Recevant du Public. 2015. Available online: https://www.legifrance.gouv.fr/loda/id/JORFTEXT000031741934 (accessed on 15 June 2022).
  42. Légifrance. Arrêté du 1er Juin 2016 Relatif aux Modalités de Surveillance de la Qualité de L’air Intérieur Dans Certains Établissements Recevant du Public. 2016. Available online: https://www.legifrance.gouv.fr/loda/id/JORFTEXT000032630331 (accessed on 15 June 2022).
  43. Légifrance. Décret n° 2022-1689 du 27 Décembre 2022 Modifiant le Code de L’environnement en Matière de Surveillance de la Qualité de L’air Intérieur. 2022. Available online: https://www.legifrance.gouv.fr/jorf/id/JORFTEXT000046829320 (accessed on 20 January 2023).
  44. Légifrance. Décret n° 2022-1690 du 27 Décembre 2022 Modifiant le Décret n° 2012-14 du 5 Janvier 2012 Relatif à L’évaluation des Moyens D’aération et À la Mesure des Polluants Effectuées au Titre de la Surveillance de la Qualité de L’air Intérieur de Certains Établissements Recevant du Public. 2022. Available online: https://www.legifrance.gouv.fr/jorf/id/JORFTEXT000046829352 (accessed on 20 January 2023).
  45. Légifrance. Arrêté du 27 Décembre 2022 Modifiant L’arrêté du 1er Juin 2016 Relatif aux Modalités de Surveillance de la Qualité de L’air Intérieur dans Certains Établissements Recevant du Public. 2022. Available online: https://www.legifrance.gouv.fr/jorf/id/JORFTEXT000046829603 (accessed on 20 January 2023).
  46. Health Council of the Netherlands. Indoor Air Quality in Primary Schools: And the Value of Carbon Dioxide as An Indicator of Air Quality. 2010. Available online: https://www.healthcouncil.nl/documents/advisory-reports/2010/04/29/indoor-air-quality-in-primary-schools. (accessed on 24 September 2022).
  47. Commonwealth of Australia and States and Territories of Australia (CASTA). Indoor Air Quality. 2021. Available online: https://www.abcb.gov.au/sites/default/files/resources/2021/Handbook-Indoor-Air-Quality.pdf (accessed on 20 June 2022).
  48. Mentese, S.; Rad, A.Y.; Arisoy, M.; Güllü, G. Multiple comparisons of organic, microbial, and fine particulate pollutants in typical indoor environments: Diurnal and seasonal variations. J. Air Waste Manag. Assoc. 2012, 62, 1380–1393. [Google Scholar] [CrossRef]
  49. Vardoulakis, S.; Giagloglou, E.; Steinle, S.; Davis, A.; Sleeuwenhoek, A.; Galea, K.S.; Dixon, K.; Crawford, J.O. Indoor exposure to selected air pollutants in the home environment: A systematic review. Int. J. Environ. Res. Public Health 2020, 17, 8972. [Google Scholar] [CrossRef]
  50. Levin, Z.; Cotton, W.R. Aerosol Pollution Impact on Precipitation: A Scientific Review; Springer: Dordrecht, The Netherlands, 2009; pp. 1–386. [Google Scholar] [CrossRef]
  51. Twomey, S. Pollution and the planetary albedo. Atmos. Environ. Part A Gen. Top. 1974, 8, 1251–1256. [Google Scholar] [CrossRef]
  52. Stull, R.B. An Introduction to Boundary Layer Meteorology; Springer: Dordrecht, The Netherlands, 1988. [Google Scholar]
  53. Bakas, N.A.; Fotiadi, A.; Kariofillidi, S. Climatology of the boundary layer height and of the wind field over Greece. Atmosphere 2020, 11, 910. [Google Scholar] [CrossRef]
  54. Miller, S.L.; Facciola, N.A.; Toohey, D.; Zhai, J. Ultrafine and fine particulate matter inside and outside of mechanically ventilated buildings. Int. J. Environ. Res. Public Health 2017, 14, 128. [Google Scholar] [CrossRef] [PubMed]
  55. Zhang, J.; Zhou, Z.; Wang, C.; Xue, K.; Liu, Y.; Fang, M.; Zuo, J.; Sheng, Y. Research on the Influence of Indoor Relative Humidity on PM2.5 Concentration in Residential Buildings. In Proceedings of the 5th Annual International Workshop on Materials Science and Engineering, IWMSE 2019, Changsha, China, 17–18 May 2019. [Google Scholar] [CrossRef]
  56. Hinds, W.C.; Zhu, Y. Aerosol Technology: Properties, Behavior, and Measurement of Airborne Particles, 3rd ed.; Wiley: Hoboken, NJ, USA, 2022; p. 425. [Google Scholar]
  57. World Health Organization (WHO). WHO Global air Quality Guidelines: Particulate Matter (PM2.5 and PM10), Ozone, Nitrogen Dioxide, Sulfur Dioxide and Carbon Monoxide; World Health Organization: Geneva, Switzerland, 2021. [Google Scholar]
  58. Hart, R.; Liang, L.; Dong, P. Monitoring, mapping, and modeling spatial–temporal patterns of PM2.5 for improved understanding of air pollution dynamics using portable sensing technologies. Int. J. Environ. Res. Public Health 2020, 17, 4914. [Google Scholar] [CrossRef] [PubMed]
  59. Gola, M.; Settimo, G.; Capolongo, S. No Impacts on Users’ Health: How Indoor Air Quality Assessments Can Promote Health and Prevent Disease. In Internet of Things; Springer Science and Business Media Deutschland GmbH: Berlin/Heidelberg, Germany, 2022; pp. 43–54. [Google Scholar] [CrossRef]
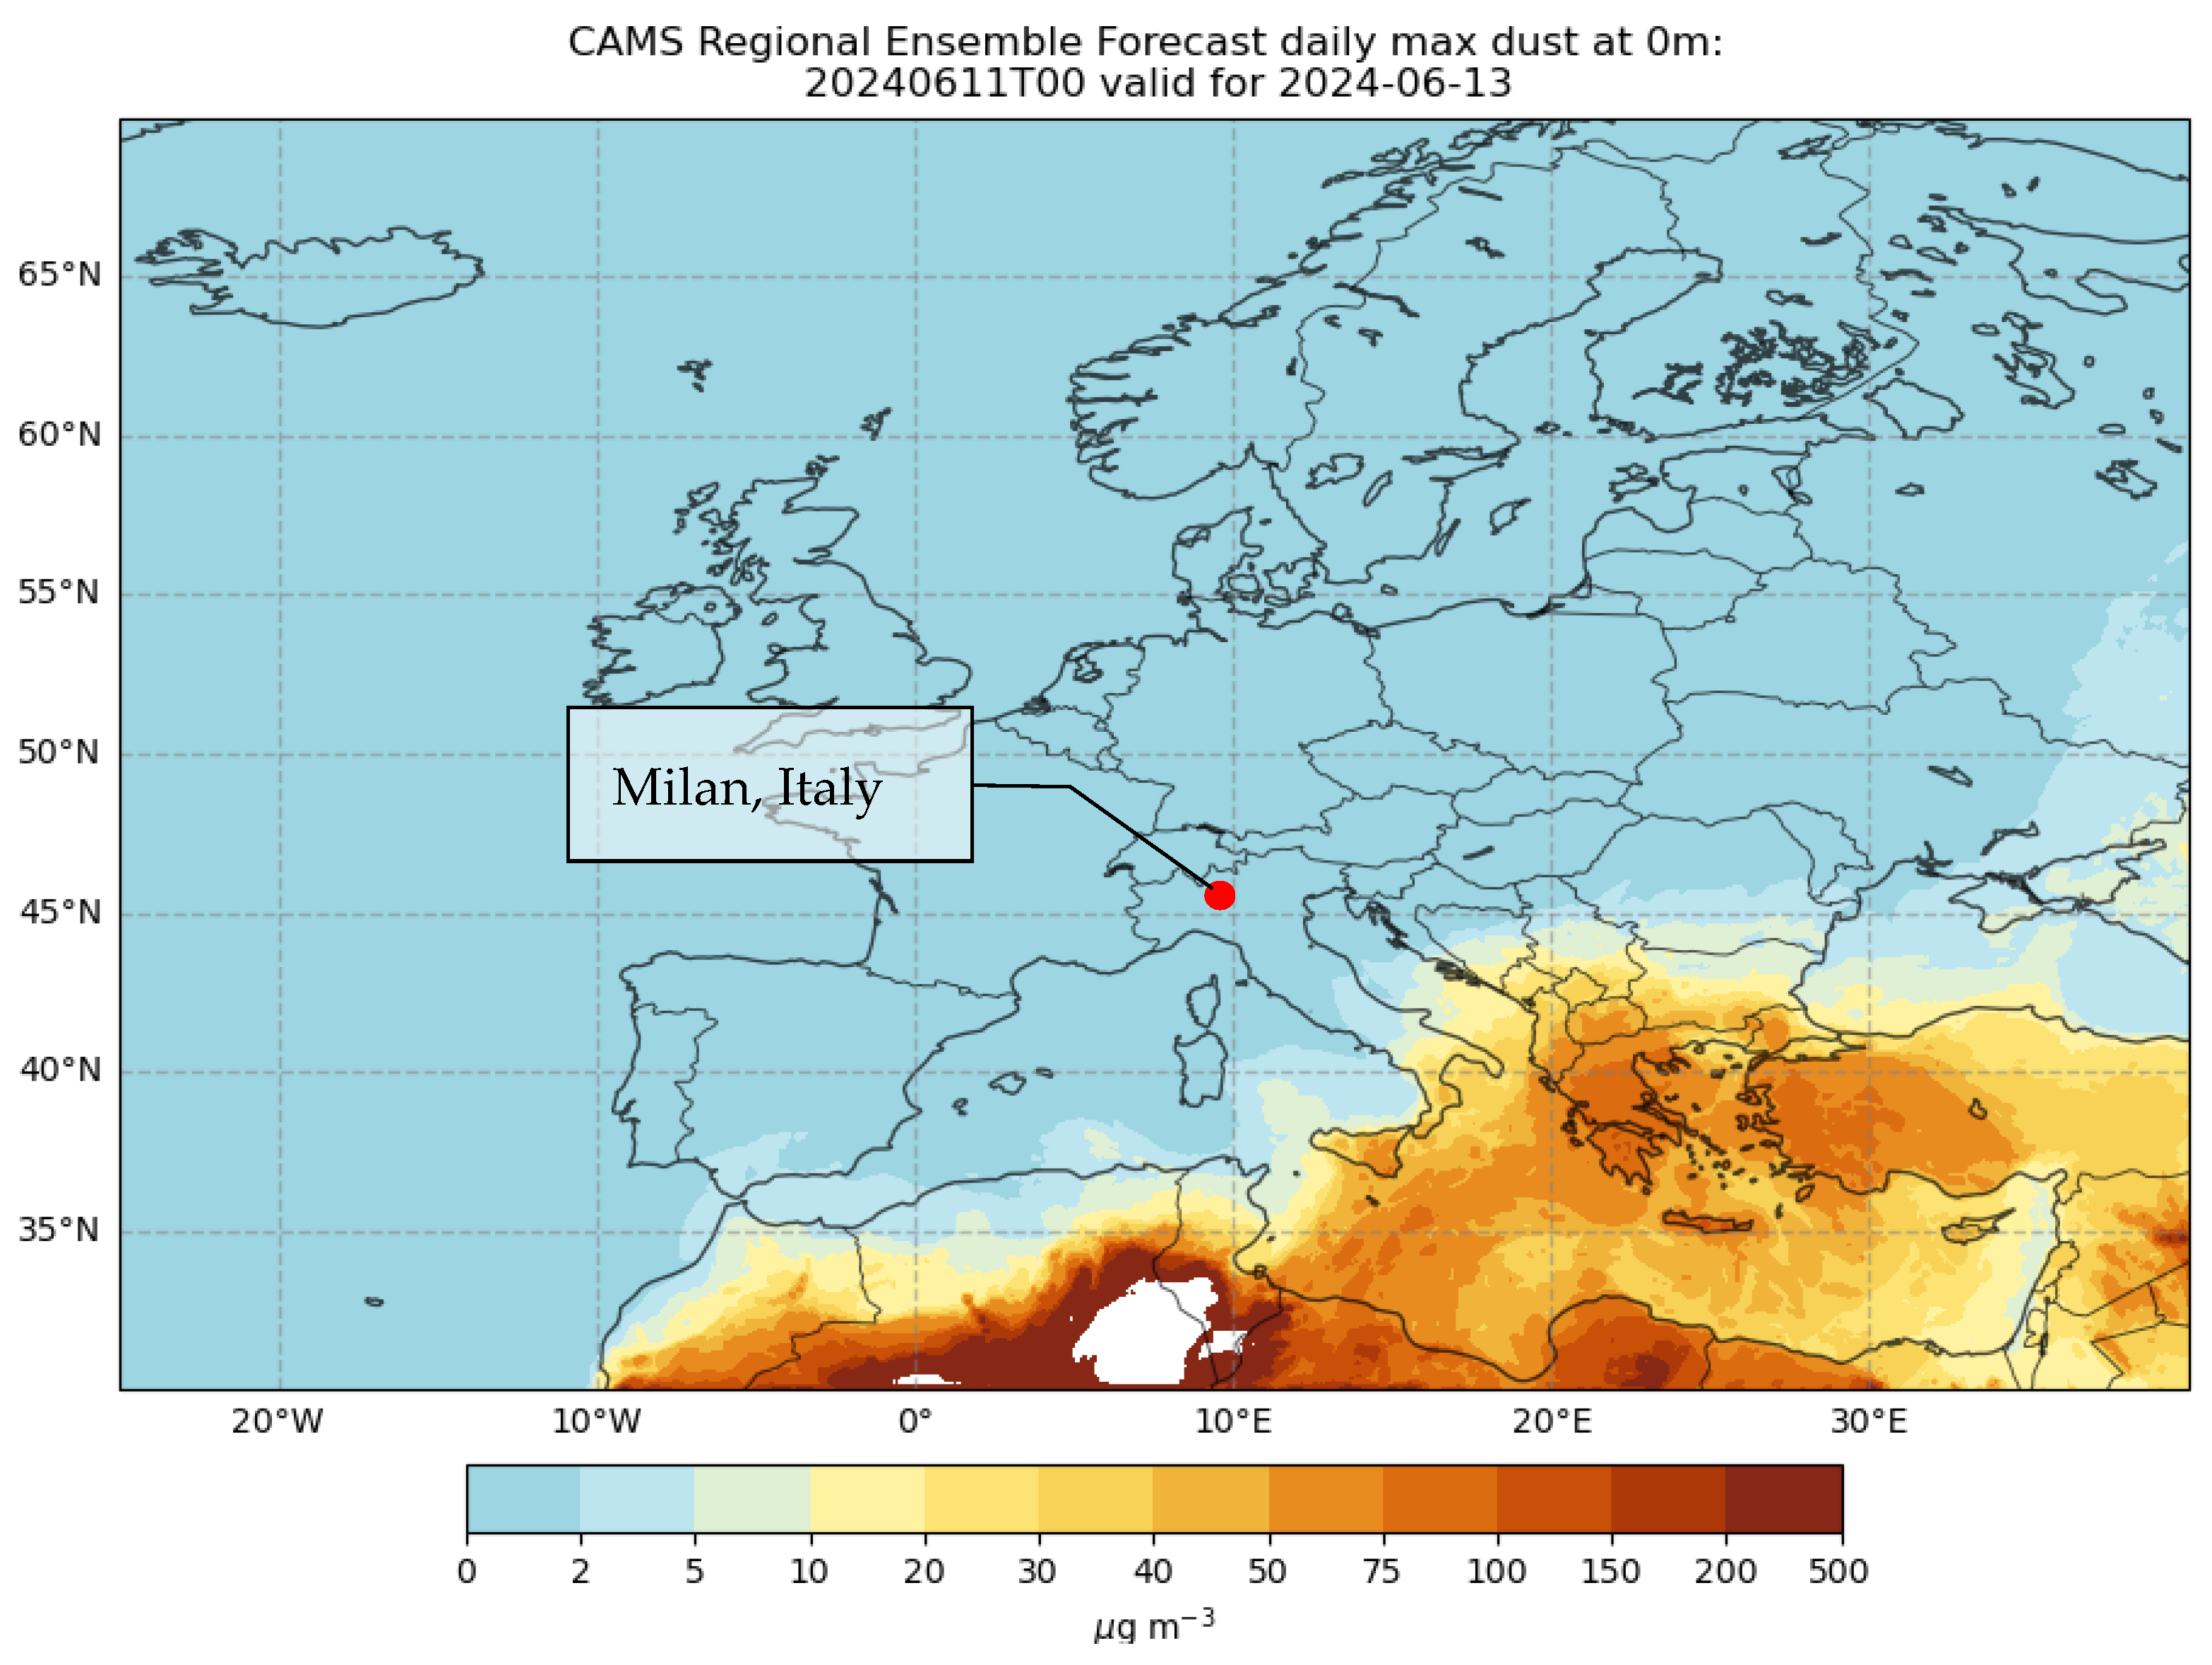
Figure 1. The sandstorm forecast by CAMS [5]. Image source: Copernicus Atmosphere Monitoring Service (CAMS), implemented by ECMWF. © European Union, 2024. Licensed under CC BY 4.0. The adaptation by author added the location of Milan in the image.
Atmosphere 16 00936 g001
Figure 2. The example images of the internal layout of the kitchens (left) and bedrooms (right).
Atmosphere 16 00936 g002
Figure 3. The device deployment positions in the building (figure elaborated by the authors).
Atmosphere 16 00936 g003
Figure 4. The 6 h average indoor (in boxplot) and outdoor data (in area plot) from the monitoring of Period-1. The red marks with “+” are the outliers of the corresponding hours.
Atmosphere 16 00936 g004
Figure 5. The 6 h average indoor (in boxplot) and outdoor data (in area plot) from the monitoring of Period-2. The red marks with “+” are the outliers of the corresponding hours.
Atmosphere 16 00936 g005
Figure 6. The information of the users with responses.
Atmosphere 16 00936 g006
Figure 7. Responses of user perceptions (a) and dissatisfaction reports (b).
Atmosphere 16 00936 g007
Figure 8. The reported symptoms in four categories from the survey in the two periods.
Atmosphere 16 00936 g008
Figure 9. The vertical outdoor distributions of hourly mean PM2.5 in Period-1 (a) and Period-2 (b). The blank parts denote missing data due to the limitations of the internet, users’ interruptions, and the time of monitoring.
Atmosphere 16 00936 g009
Figure 10. The outdoor PM2.5 levels vs. PM2.5 I/O ratio in both periods: June (a); October (b).
Atmosphere 16 00936 g010
Figure 11. Images of the surroundings with trees and buildings, three to five floors high, with picture (a) taken on 9 April 2024 and pictures (b,c) taken on 26 March 2025.
Atmosphere 16 00936 g011
Figure 12. The I/O ratio of CO2 vs. PM2.5 in both periods of June (a) and October (b).
Atmosphere 16 00936 g012
Figure 13. The outdoor RH vs. PM2.5 I/O ratio in Period-1 in June (a) and Period-2 in October (b).
Atmosphere 16 00936 g013
Figure 14. The I/O ratio, AP vs. PM2.5, in both periods: May (a); October (b).
Atmosphere 16 00936 g014
Figure 15. The I/O ratio of PM2.5 in Period-1 in June (a) and Period-2 in October (b), with the lines for the hourly mean level for each floor presented in the colors corresponding to their points. The arrow with sun icon refers to the general time of sunrise and sunset in each period.
Atmosphere 16 00936 g015
Figure 16. The indoor CO2 and PM2.5 concentrations in Period-1 (a) and Period-2 (b).
Atmosphere 16 00936 g016
Figure 17. The CO2 and PM2.5 concentrations from the bedrooms with the symptoms (a) and without the symptoms (b) reported in the survey.
Atmosphere 16 00936 g017
Figure 18. The CO2 and PM2.5 concentrations from the four kitchens, with D01, D02, and D06 from the room, with three responses, respectively, and D12 had no responses to the questionnaires.
Atmosphere 16 00936 g018
Figure 19. One of the kitchens and its range hood for cooking.
Atmosphere 16 00936 g019
Table 1. The configuration of the included sensors.
TypeRef.TargetRangeAccuracyImages
1SCD41 3[21]CO2400 to 5000 ppm±50 ppm + 2.5%Atmosphere 16 00936 i001
Temperature−10 to 60 °C±0.8 °C
Humidity0 to 100%±6%
2BME680 1[22]Air pressure 300 to 1100 hPa±0.12 hpaAtmosphere 16 00936 i002
3PMS
5003T 1,2
[23]PM2.50 to 500 µg/m3±10%Atmosphere 16 00936 i003
PM100 to 500 µg/m3±10%
Notes. 1 The additional readings of temperature and humidity from BME680 and PMS5003T are not included as the results. 2 PMS5003T can also measure particle numbers and PM1, but they are not included in this work as these parameters were not covered by the reference device in the calibration process [23]. 3 The SCD41 sensor mainly covers a range from 400 to 5000 ppm, but its output covers 0 to 40,000 ppm [21], with lower accuracy outside of the indicated range.
Table 2. The reported symptoms in the survey, and no responses from the room with device number 12.
Device NumberColor in Figure 18Symptoms Report from Each Unit
Response-1Response-2Response-3
D01Atmosphere 16 00936 i004
  • Irritation of scalp.
  • Irritation of skin;
  • Difficulty in concentration
  • Rhinitis;
  • Runny nose;
  • Sneezing.
D02Atmosphere 16 00936 i005
  • Runny nose.
  • Cough;
  • Runny nose;
  • Shortness of breath;
  • Headache;
  • Sneezing;
  • Severe headache;
  • Muscle pain.
  • Sneezing.
D06Atmosphere 16 00936 i006No Problem reported
  • Irritation of ears.
  • Cough;
  • Fatigue;
  • Irritation of ears.
D12Atmosphere 16 00936 i007No response from this room
Note: The room with device 06 had one reply, with no symptoms reported in the questionnaire. In the room with device 12, there were no questionnaire replies.
Disclaimer/Publisher’s Note: The statements, opinions and data contained in all publications are solely those of the individual author(s) and contributor(s) and not of MDPI and/or the editor(s). MDPI and/or the editor(s) disclaim responsibility for any injury to people or property resulting from any ideas, methods, instructions or products referred to in the content.