Article

Impact of Radar Data Assimilation on the Simulation of Typhoon Morakot

1
College of Atmospheric Science, Chengdu University of Information Technology, Chengdu 610225, China
2
Institute of Atmospheric Physics, Chinese Academy of Sciences, Beijing 100029, China
*
Author to whom correspondence should be addressed.
Atmosphere 2025, 16(8), 910; https://doi.org/10.3390/atmos16080910
Submission received: 20 May 2025 / Revised: 18 July 2025 / Accepted: 21 July 2025 / Published: 28 July 2025
(This article belongs to the Section Atmospheric Techniques, Instruments, and Modeling)

Abstract

The high spatial resolution of radar data enables the detailed resolution of typhoon vortices and their embedded structures; the assimilation of radar data in the initialization of numerical weather prediction exerts an important influence on the forecasting of typhoon track, intensity, and structures up to at least 12 h. For the case of typhoon Morakot (2009), Taiwan radar data was assimilated to adjust the dynamic and thermodynamic structures of the vortex in the model initialization by the three-dimensional variation data assimilation system in the Advanced Region Prediction System (ARPS). The radial wind was directly assimilated to tune the original unbalanced velocity fields through a 3-dimensional variation method, and complex cloud analysis was conducted by using the reflectivity data. The influence of radar data assimilation on typhoon prediction was examined at the stages of Morakot landing on Taiwan Island and subsequently going inland. The results showed that the assimilation made some improvement in the prediction of vortex intensity, track, and structures in the initialization and subsequent forecast. For example, besides deepening the central sea level pressure and enhancing the maximum surface wind speed, the radar data assimilation corrected the typhoon center movement to the best track and adjusted the size and inner-core structure of the vortex to be close to the observations. It was also shown that the specific humidity adjustment in the cloud analysis procedure during the assimilation time window played an important role, producing more hydrometeors and tuning the unbalanced moisture and temperature fields. The neighborhood-based ETS revealed that the assimilation with the specific humidity adjustment was propitious in improving forecast skill, specifically for smaller-scale reflectivity at the stage of Morakot landing, and for larger-scale reflectivity at the stage of Morakot going inland. The calculation of the intensity-scale skill score of the hourly precipitation forecast showed the assimilation with the specific humidity adjustment performed skillful forecasting for the spatial forecast-error scales of 30–160 km.

1. Introduction

Accurate prediction of landfalling typhoons has been a key subject in atmospheric sciences for a long time. Generally, poor initialization accounts for adverse consequences for hurricane-intensity prediction. How to improve the initialization of typhoon vortex structure is of concern to meteorologists. A common way to generate the initial typhoon vortex is by interpolating the analysis of the National Centers for Environmental Prediction (NCEP) Global Forecast System (GFS). Aberson pointed out that the initiation method may be helpful for typhoon track forecast but is limited in improving the prediction of typhoon intensity [1]. Extensive research confirms radar data’s impact on optimizing vortex representation in model initialization, directly benefiting typhoon structure and intensity forecasts. The development of dynamically–thermodynamically balanced typhoon vortices requires radar data assimilation, capitalizing on its superior spatiotemporal resolution. So far, great progress has been made in applying radar data to typhoon/hurricane forecasting [2]. The assimilation of Jindo radar observations (South Korea) by Xiao et al. yielded substantial gains in short-range precipitation prediction accuracy for Typhoon Rusa (2002) [3]. With the Navy’s Coupled Ocean Atmosphere Mesoscale Prediction System (COAMPS) [4], Zhao and Jin [5] illustrated that the assimilation of radar reflectivity and radial velocity data produced an improved forecast of the inner core and outer rainbands of Hurricane Isabel (2003). Modeling investigations leveraging radar data were highlighted by Houze et al. as critical for probing how rainband–primary vortex interactions drive hurricane intensity variations [6]. Zhao and Xue’s 4 km resolution assimilation of WSR-88D radial wind/reflectivity data significantly advanced prediction capabilities for the structural characteristics, intensity, and track of landfall of Hurricane Ike (2008), establishing radar data’s functional value in hurricane forecasting [7].
Hurricane research is witnessing an expanding utilization of airborne Doppler radar (ADR) data, building upon conventional ground-based radar assimilation frameworks [8]. Emerging studies have successfully integrated ADR observations into typhoon forecasting numerical models. Employing the Weather Research and Forecasting (WRF) three-dimensional data assimilation system, Xiao et al. incorporated ADR observations to reconstruct the dynamic and thermodynamic framework of the hurricane vortex during model initialization [9]. Their findings demonstrate the significant potential of ADR-based vortex initialization in reducing hurricane intensity forecast biases with tractable computational demands. Pu et al. quantified the contributions of airborne radar observations to short-term predictive simulations of Hurricane Dennis’ (2005) trajectory and intensity evolution [10]. Their analysis demonstrated that assimilating radar reflectivity data substantially modified the thermodynamic and hydrometeor fields of the initial vortex, consequently enhancing precipitation forecast fidelity.
Enhanced spatial fidelity in simulations derived from high-resolution analyses reveals fine-scale dynamics and thermodynamics governing vortex organization, eyewall structure, and adjacent spiral rainbands [11,12]. Advancements in high-resolution numerical weather forecasting necessitate more sophisticated verification methodologies for comprehensive forecast skill assessment [13]. Two principal categories encapsulate newly developed verification approaches: filtering and displacement methods. The filtering verification domain prioritizes neighborhood and scale-separation frameworks for predictive skill assessment [14,15,16,17].
Neighborhood verification quantifies equivalent threat score (ETS) metrics across grid cells within defined radial domains surrounding observation points. The neighborhood-based ETS (denoted by <ETS>r) relaxes the criteria for ‘‘hits’’ (i.e., correct forecasts) by considering grid points within a specified radius. The <ETS>r demonstrates unique diagnostic utility through adjustable neighborhood dimensions, enabling multi-scale assessment of predictive skill [18]. As a canonical scale-separation methodology, the intensity-scale (IS) technique diagnoses scale- and intensity-dependent forecast-error characteristics relative to observations, quantifying predictive skill through bivariate functions of error scale and magnitude. Such scales correlate directly with distinct meteorological phenomena, including synoptic-scale frontal systems and convective-scale shower events. The point-to-point difference between the binary fields of forecast and observation is taken to obtain binary error fields. These error fields are subsequently separated into the sum of different scale components using a two-dimensional Haar wavelet decomposition, and a skill score based on the mean squared error of these images is evaluated for each scale component and intensity threshold. One important difference between the neighborhood and scale-separation approaches is that the neighborhood methods apply progressive smoothing across expanding scales, preserving macroscale information from the original field in filtered outputs.
In this study, we will initialize the simulation of typhoon Morakot (2009) by assimilating the radar data. We focus on the stage of Morakot landing on Taiwan and subsequently going inland. The 3-dimensional variation (3DVAR) assimilation of high-resolution radar data is hypothesized to refine initial vortex representation and enhance downstream predictive skill for Typhoon Morakot’s intensity evolution and structural characteristics. We further examined the prediction performance of Morakot by using neighborhood-based and intensity-scale verification approaches. Section 2 presents a synoptic overview of Typhoon Morakot (2009) and corresponding radar observations. The data assimilation methodology and numerical experiment designs are detailed in Section 3. Section 4 documents assimilation outcomes, while Section 5 elucidates subsequent forecast analyses. Section 6 synthesizes the principal findings and conclusions.

2. Typhoon Review and Radar Observations

2.1. Morakot Review

Typhoon Morakot (2009), which landed on Taiwan Island at midnight 7 August 2009, is considered one of the most destructive typhoons in the history of Taiwan. As shown in Figure 1, a monsoon trough-initiated tropical depression development approximately 1000 km east of the Philippines was captured by the Japan Meteorological Agency (JMA) early 2 August 2009. By 3 August, the system underwent tropical transition, achieving tropical storm intensity with sub-40 m s−1 maximum sustained winds (MSW), prompting the JMA designation “Morakot” [19]. JMA elevated Morakot to typhoon status by 5 August 2009. Morakot with an MSWP of 39 m s−1 landed near Hualien, Taiwan, at 1200 UTC 8 August and brought record-breaking heavy rainfall over the entire southern region of Taiwan Island. Within a 24 h window, Morakot traversed the Taiwan Strait while undergoing a downgrade to severe tropical storm intensity. Following secondary landfall near Taizhou, Zhejiang, at 0800 UTC 9 August, Morakot underwent gradual decay with sustained inland penetration. Dissipation of Morakot’s post-tropical remnants was finalized over inland China by 1200 UTC 11 August. Morakot remained on the mainland for about three days and produced up to 1240 mm of rainfall in Zhejiang province.

2.2. Taiwan Radar Observation

We focus on the stages of Morakot’s landing on Taiwan Island and subsequent inland path between 1200 UTC 7 August and 0000 UTC 8 August 2009. The Taiwan radar data used in this study were provided by the official meteorological authority in Taiwan. They underwent rigorous quality control (including the removal of sea clutter, noise reduction, and Doppler velocity de-aliasing) to ensure data reliability and were applied to the assimilation system after professional preprocessing. Figure 2 presents the observation of composite reflectivity from the four radars. It can be seen that a strong echo band in a partial ring pattern is located at the southern and eastern outer sides of Taiwan Island. At 1200 UTC 7 August, Morakot centered at the sea surface in the east of Taiwan Island, and a high-value echo region with a northwest–southeast orientation lay at the southwestern edge of Taiwan Island, resulting from the convergence of a dry northwestern flow and moist southwestern flow. Another strong echo band with a north–south orientation appeared on the windward slope of Taiwan’s central mountains due to the northwestern flow being blocked by the mountains. When Morakot approached Taiwan at 1500 UTC 7 August, the strong echo band near the southern edge of Taiwan Island was orientated northeastward, and both the echo bands on the windward slope and in the north of Taiwan developed. At 1800 UTC 7 August when Morakot made landfall near Hualien, Taiwan, the echo band in the eye wall stretched northward a bit, and its semi-ring pattern became clearer. As a result of the northwestern flow deposition on the windward slope, the north–south echo band in the south of Taiwan Island intensified and became broader. At 0000 UTC 8 August, Morakot centered in the northern region of Taiwan Island, and the southern eye wall overlapped the southern region of the island. The echo structure in the eye wall was organized well. The intensified eastern echo band in a semi-ring pattern was associated with the strong southwestern flow.

3. Assimilation Strategy and Experiment Designs

The radial wind and reflectivity data from the four radars went through quality control to eliminate reflections of sea surface, remove noise, and unfold Doppler velocity. A three-dimensional variation assimilation of the radial wind and a complex cloud analysis utilizing the reflectivity were conducted using the ARPS3DVAR module [20] of the ARPS model [21,22].

3.1. ARPS3DVAR and Assimilation of Radar Data

The assimilation module ARPS3DVAR built into the framework of ARPS is composed of a 3DVAR system initially developed by Gao et al. [20] and a complex cloud analysis (CCA) system, which is an important component of the ARPS Data Analysis System (ADAS) that has evolved from that in the Local Analysis and Prediction System (LAPS) through modification and improvement [23]. The CCA methodology detects clouds via reflectivity thresholds (typically 10 dBZ), retrieves precipitation types (rain/snow/graupel) [24], computes hydrometeor mixing ratios using moist-adiabatic assumptions and empirical relations, and adjusts temperature profiles via latent heating. This process enables a physically consistent “hot start” [25], drastically reducing model spin-up time. To handle multi-scale/multi-source observations, ARPS3DVAR employs recursive filters for background error covariance and multiple analysis passes with scale-dependent filtering. Critically, CCA-derived vertical velocities (based on cloud typing) are excluded from initialization (cldwopt = 0) to avoid spurious convection [25,26]. The integrated system has proven effective for thunderstorm-resolving simulations [24,27].
Radial velocity and reflectivity observations were assimilated intermittently (30 min cycles) within a 3 h assimilation window via ARPS 3DVAR, generating initial conditions for Typhoon Morakot simulations. It is expected that the high-resolution assimilation of radar data, beneficial for obtaining the most useful meso- or small-scale information, is helpful for improving the initialization of Morakot’s dynamic and thermodynamic fields and the forecasting of Morakot’s landing on Taiwan Island. ARPS3DVAR directly ingests radar radial velocity observations, whereas the cloud analysis module retrieves hydrometeor distributions from reflectivity and ancillary cloud data, dynamically modifying in-cloud thermodynamic profiles. The Ferrier analysis scheme for rainwater, snow, and graupel was used in the cloud analysis procedure because it captured the major hydrometeor process and was relatively reliable.

3.2. ARPS Model and Domain Configurations

The ARPS model was employed to simulate Typhoon Morakot (2009) at the stage of its landing on Taiwan Island and subsequent inland path. Developed by the CAPS at OU [21], this model is a compressible, three-dimensional, and nonhydrostatic system. It utilizes height-based terrain-following coordinates and expresses its governing equations in flux form. It adopts the leap-frog time scheme as well as the fourth-order momentum advection and positive definite scalar advection schemes. For the case of Morakot, the center of the non-nest fixed domain was located at (24° N, 121° E), and the grid dimensions were 803 × 803 × 53 with a 2.5 km horizontal grid space and 420 m mean vertical layer space. The activated physical parameterization schemes consisted of the Lin simple ice microphysics scheme, the atmospheric radiation transfer parameterization scheme, and the two-layer Force-restore soil model.

3.3. Experimental Designs

The NCEP/GFS analysis and forecast with a horizontal resolution of 0.5o were employed to generate the background and external forcing lateral boundary conditions for the simulation of Morakot, respectively. Five experiments were preformed: the control run (CNTL), which used the NCEP/GFS analysis as the initial condition without radar data assimilation; the second sensitive experiment (ExpVr), which intermittently assimilated the radial wind data of radars instead of reflectivity; the third experiment (ExpZ), uniquely assimilating the reflectivity data of radars; the fourth sensitive experiment (ExpAll), assimilating both the radial wind and reflectivity; and the fifth sensitive experiment (ExpAllNqv), which was the same as ExpAll except for the adjustment of specific humidity in the cloud analysis procedure. The difference between ExpAll and ExpAllNqv is the specific humidity adjustment in the assimilation, which may provide insight into the important roles that moisture plays in the development of typhoons.
The above five experiments were initiated at 1200 UTC 7 August 2009 and ended at 0000 UTC 8 August 2009. CNTL integrated for 12 h, and the four sensitive experiments ExpVr, ExpZ, ExpAll, and ExpAllNqv performed a 9 h forecast following a 3 h intermittent assimilation time window with a 30 min cycle. All experiments dumped the model output data every 1 h.

4. Assimilation Results of Radar Data

Figure 3 displays the sea level pressure (SLP) and horizontal wind at 850 hPa recorded at the conclusion of the assimilation time window (1500 UTC on 7 August 2009). All experiments showed a maximum horizontal wind speed region in the southeastern quadrant of the vortex where the strong southwestern flow transported more moisture to the eye walls. The cyclonic circulations at 850 hPa in the four sensitive experiments are strengthened with the region of wind speed over 40 m s−1 broader than that in CNTL. Besides the intensified wind speeds, the low-pressure centers in ExpVr, ExpZ, ExpAll, and ExpAllNqv decreased to 968 hPa, 972 hPa, 964 hPa, and 968 hPa, respectively, after assimilating radar data. The low-pressure center in ExpAll was much closer to the observation (958 hPa) than that in CNTL (976 hPa), indicating that the specific humidity adjustment in the cloud analysis procedure was capable of effectively decreasing the central pressure.
The differences between the sensitive experiments and CNTL are shown in Figure 4. The two maximum increment regions of 850 hPa wind speed lay at the west and east edges of Taiwan Island. Another larger increment region appeared in the southeastern quadrant of the eye wall, indicating the enforced southwestern flow due to the radar data assimilation. In addition, a notable outward increment flow in ExpVr, ExpAll, and ExpAllNqv existed in the southwestern quadrant of the eye wall due to the radial wind assimilation. The 850 hPa wind speed increment of ExpAll versus CNTL was larger than those of the other sensitive experiments. The maximum SLP differences between the sensitive experiments and CNTL were located around the inner-core region adjacent to the east coast of Taiwan. The SLP decrement of ExpAll versus CNTL, up to less than −14 hPa, was the most remarkable.
The vertical cross-sections of horizontal wind along the low-pressure center are presented in Figure 5. There were two strong wind bands in the northern and southern eye walls, respectively. The typhoon vortex circulation in CNTL was weak, and the distance between the two maximum wind bands (namely, the diameter of the typhoon eye) was too large. In the sensitive experiments, the maximum wind speed in the southern eye wall located in the low-level troposphere was enforced and larger than that appearing around 500–400 hPa in the northern eye wall. The inner-core diameter decreased, and some asymmetry structure became apparent in ExpVr, ExpAll, and ExpAllNqv versus ExpZ and CNTL. Furthermore, the distribution pattern of horizontal wind was characterized by the small-scale motions within the vortex. The recovery of the compact vortex structure may be attributed to assimilating the radial wind data of radars. The cross sections of variable increments are shown in Figure 6. The horizontal wind speed increments in ExpVr, ExpAll, and ExpAllNqv versus CNTL extend up to the upper-level troposphere due to assimilating the radar data, especially the radial wind data. The vertical motions in the eye wall were enforced, as well as the high values of horizontal wind speed at 850 hPa in the southern eye wall and 600 hPa in the northern eye wall. The exclusive assimilation of reflectivity (ExpZ) only exerted a little influence on the wind speed and vertical motion in the southern eye wall.
The precipitable water and equivalent potential temperature increments of the sensitive experiments versus CNTL are presented in Figure 7 and Figure 8. Compared to ExpVr and ExpAllNqv, ExpZ and ExpAll assimilated to produce more precipitable water over the inner-core region (Figure 7), indicating that the assimilation with the specific humidity adjustment led to a notable increase in specific humidity and moisturized the vortex. In both ExpVr and ExpAllNqv, the slight temperature increments within the vortex area resulted from covariance with the typhoon environment (not displayed). In ExpAllNqv, a positive temperature increment was located near 250 hPa, and there was a negative layer of temperature increment in the middle troposphere. After assimilating the reflectivity data with the specific humidity adjustment, the temperature increments became remarkable in the vortex. For example, the assimilation in ExpAll produced a vertical structure of a positive temperature increment in the upper-level troposphere with a peak around 300 hPa, warming the inner core. The temperature and moisture increments in ExpZ and ExpAll gave rise to a remarkable increment in equivalent potential temperature over the inner core, stretching upwards to the tropopause (Figure 8). This may be associated with a latent heat release through cloud microphysical processes due to the increase in moisture. On the whole, assimilating radar data not only enhances the three-dimensional dynamic structure but also facilitates the development of the vortex’s warm-core structure. Notably, ExpAll with the specific humidity adjustment produced a warmer upper-level core.
The resulting reflectivity at the end of the assimilation time window in the five experiments is presented in Figure 9. The composite reflectivity among the experiments was distinctively different. Compared to the composite reflectivity in CNTL and ExpVr, ExpAll produced more precipitable hydrometeors and better recovered composite reflectivity to match the observation after the assimilation with the specific humidity adjustment. The strong echo bands in ExpAll, especially the echo bands on the windward slope and lee slopes of Taiwan’s central mountains, were closer to the observation. On the other hand, the messy echo regions of ExpAll north of 27oN were the derived product of the assimilation of radial wind and reflectivity with the specific humidity adjustment because they were beyond the coverage of radars. The strong echo bands in CNTL and ExpVr, presenting ring patterns, were narrower than those in ExpZ, ExpAll and ExpAllNqv, and a little different from the observation. Overall, it was demonstrated that the reflectivity assimilation made the maximum and location of composite reflectivity closely match the observation.

5. Result of Forecast

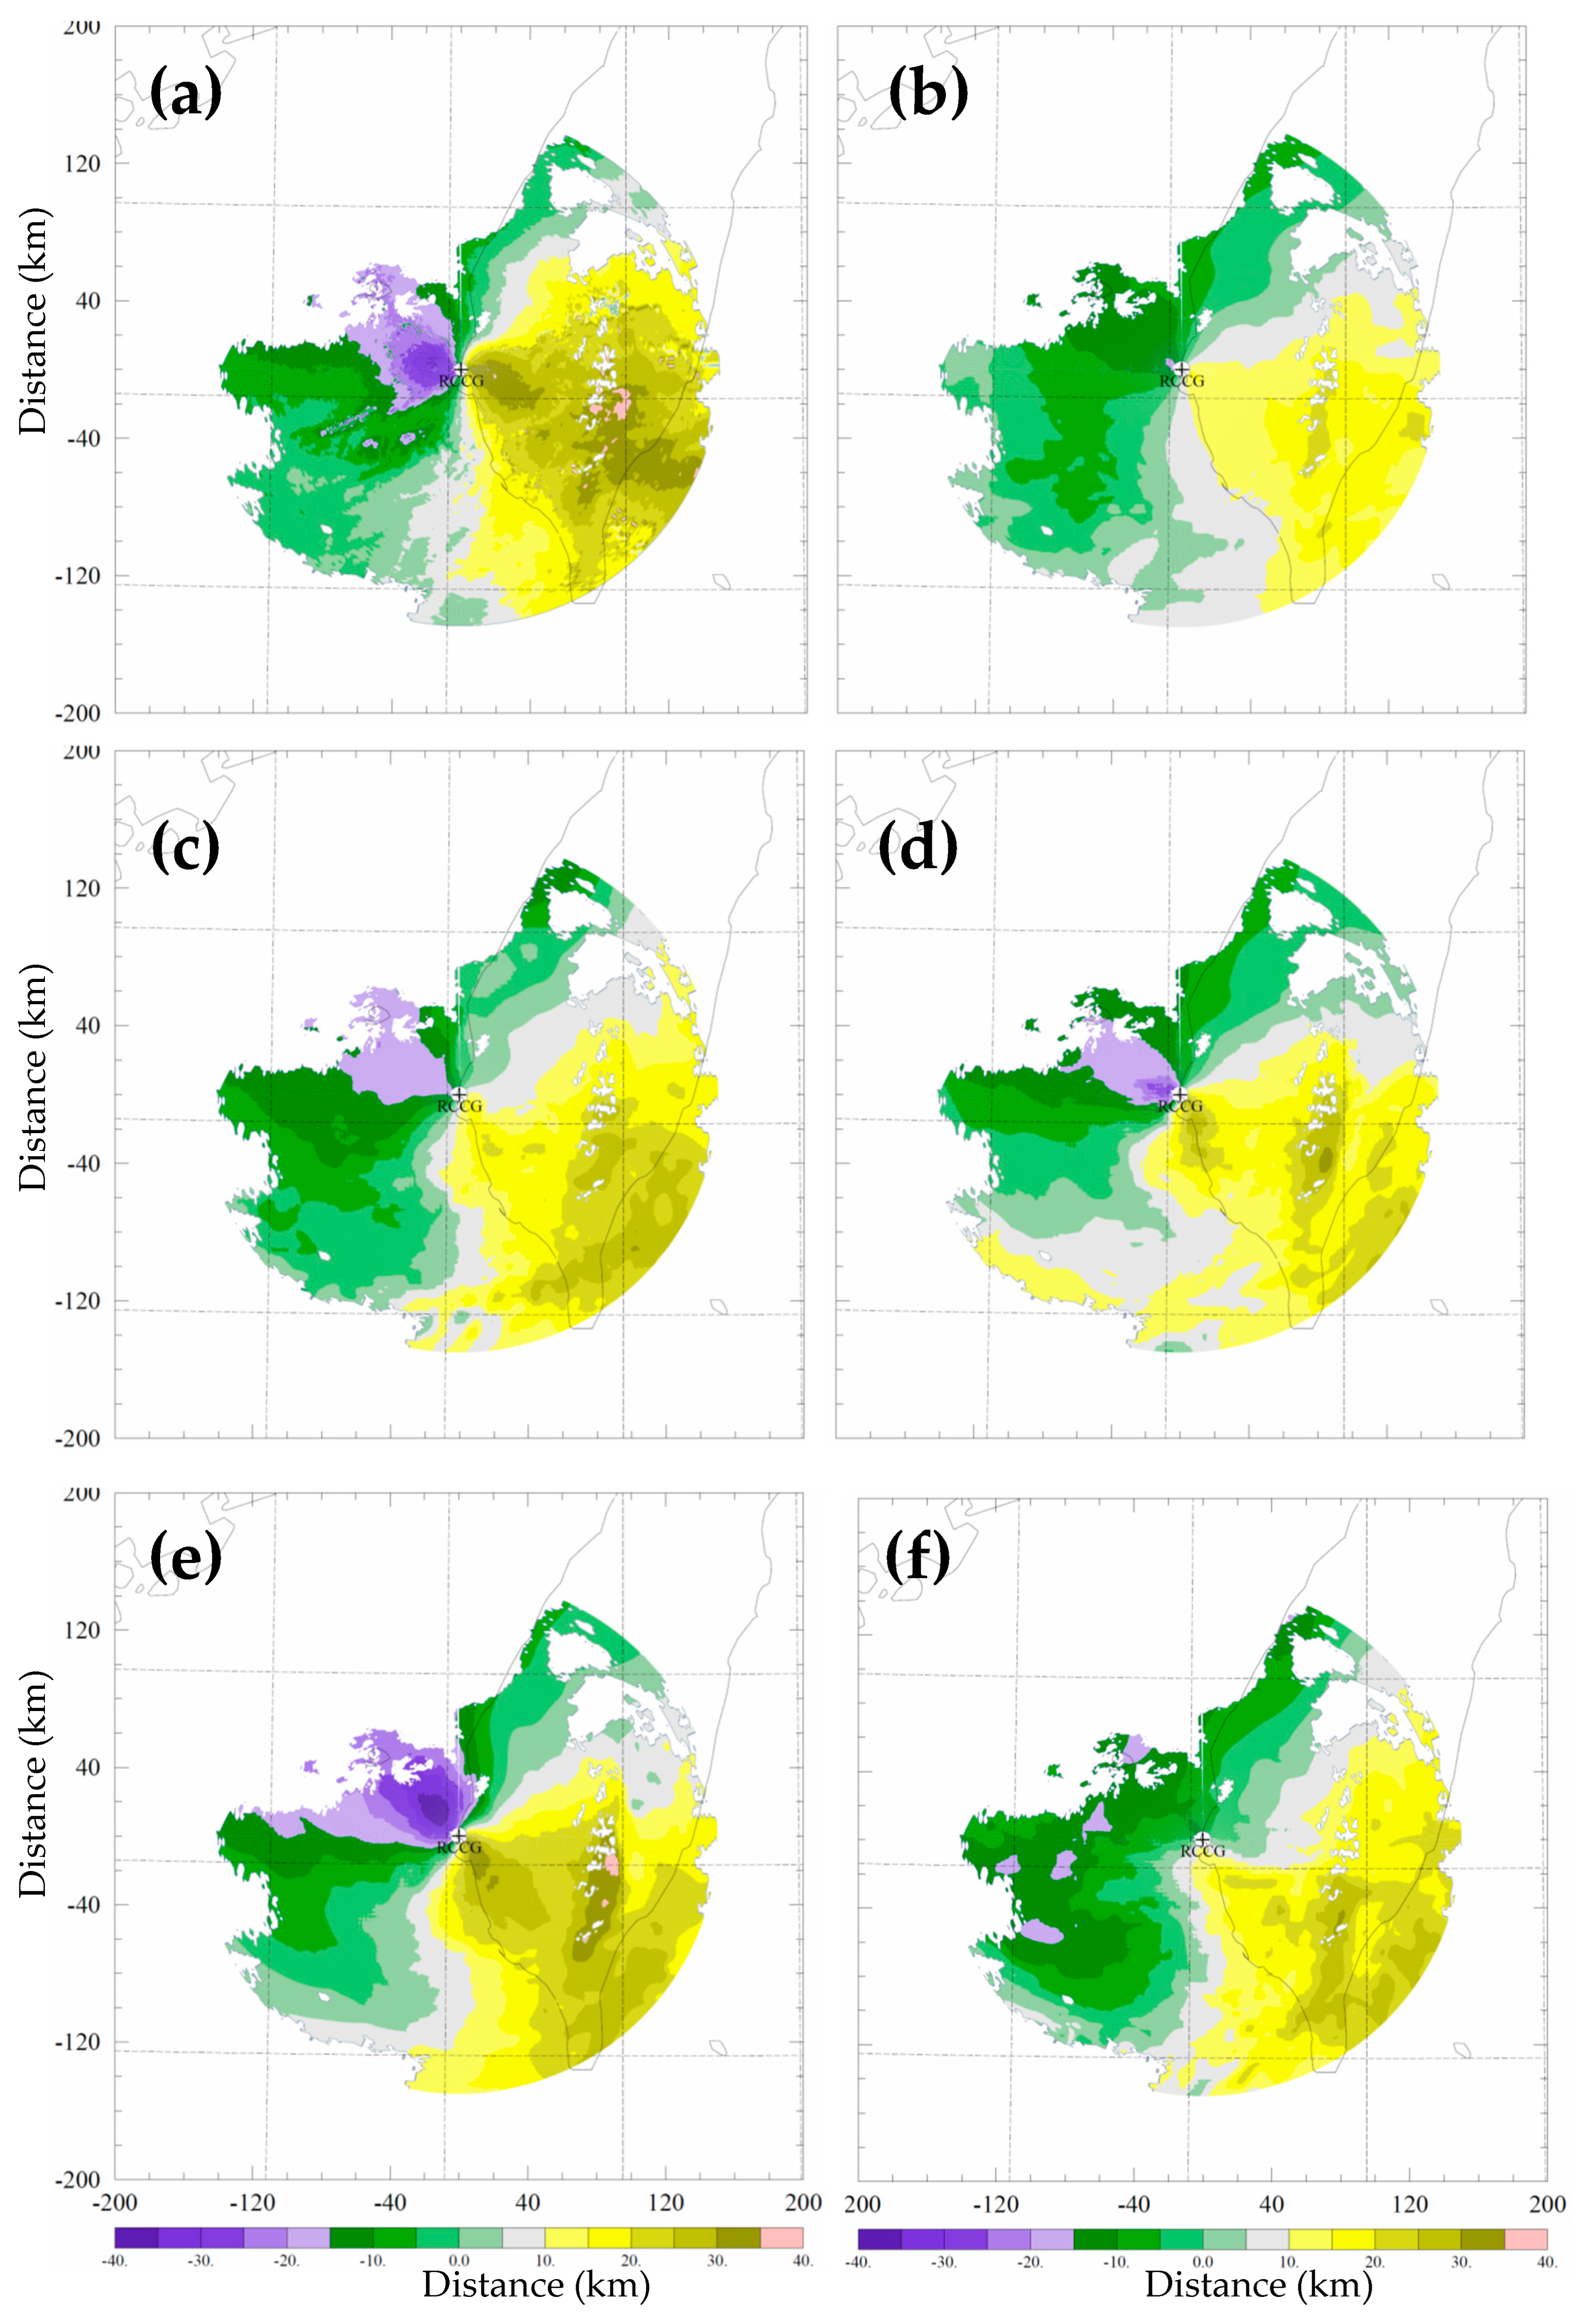
5.1. Radial Wind Forecast

To illustrate the forecast performance of radial wind, the predicted radial winds at the elevation angle of 2.4° with the same center point as RCCG were produced from the model output data via a radar emulator and are presented in Figure 10. It was clear that the observation of the positive speed region was confined to the first and fourth quadrants around the center point, and the maximum positive speed region was located near the southern area of Taiwan Island. The observation of the negative speed region appeared in the second and third quadrants. The maximum negative speed was close to the center point in the second quadrant. Among the five experiments, the intensity and distribution patterns of the positive and negative speed regions in ExpAll were the closest to the observation, especially the maximum negative speed region near the center point. ExpZ performed a similar forecast of radial wind with a smaller intensity than ExpAll. Although the distribution pattern of positive and negative speed regions in CNTL, ExpVr, and ExpAllNqv was also similar to the observation, their maximum negative values were much weaker than the observation. It can be seen that the specific humidity adjustment in the assimilation positively influenced the radial wind forecast.

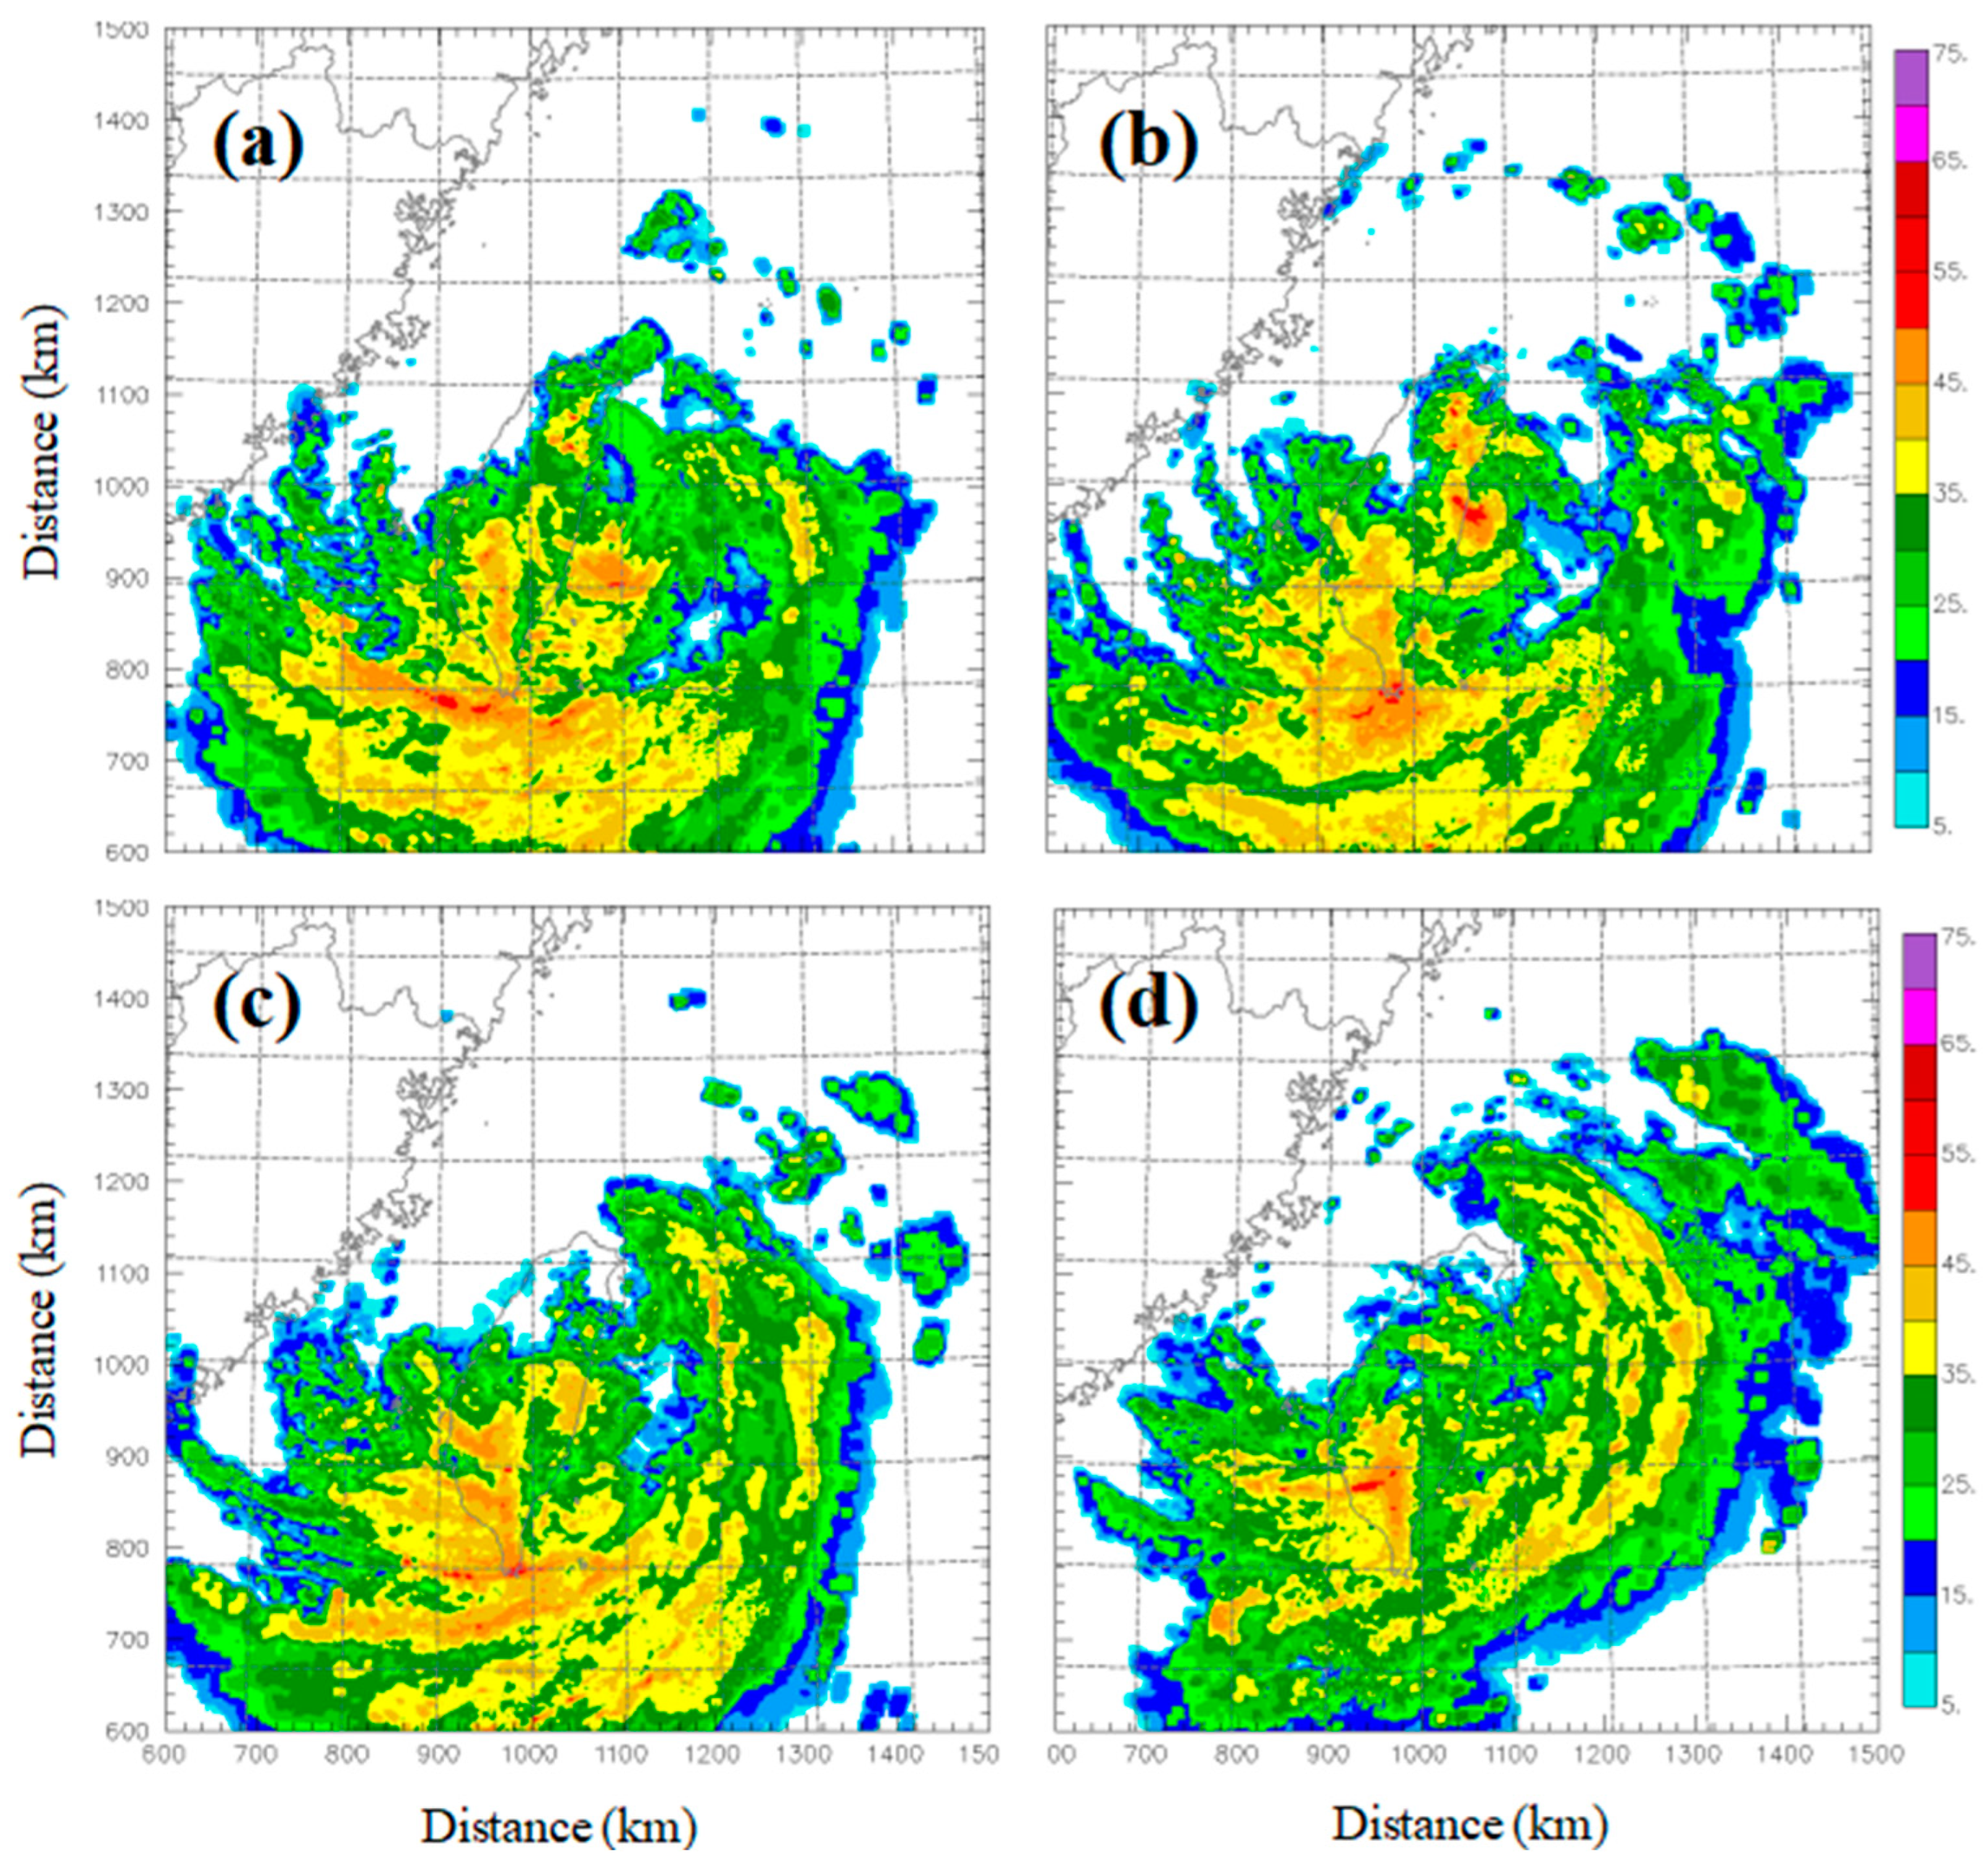
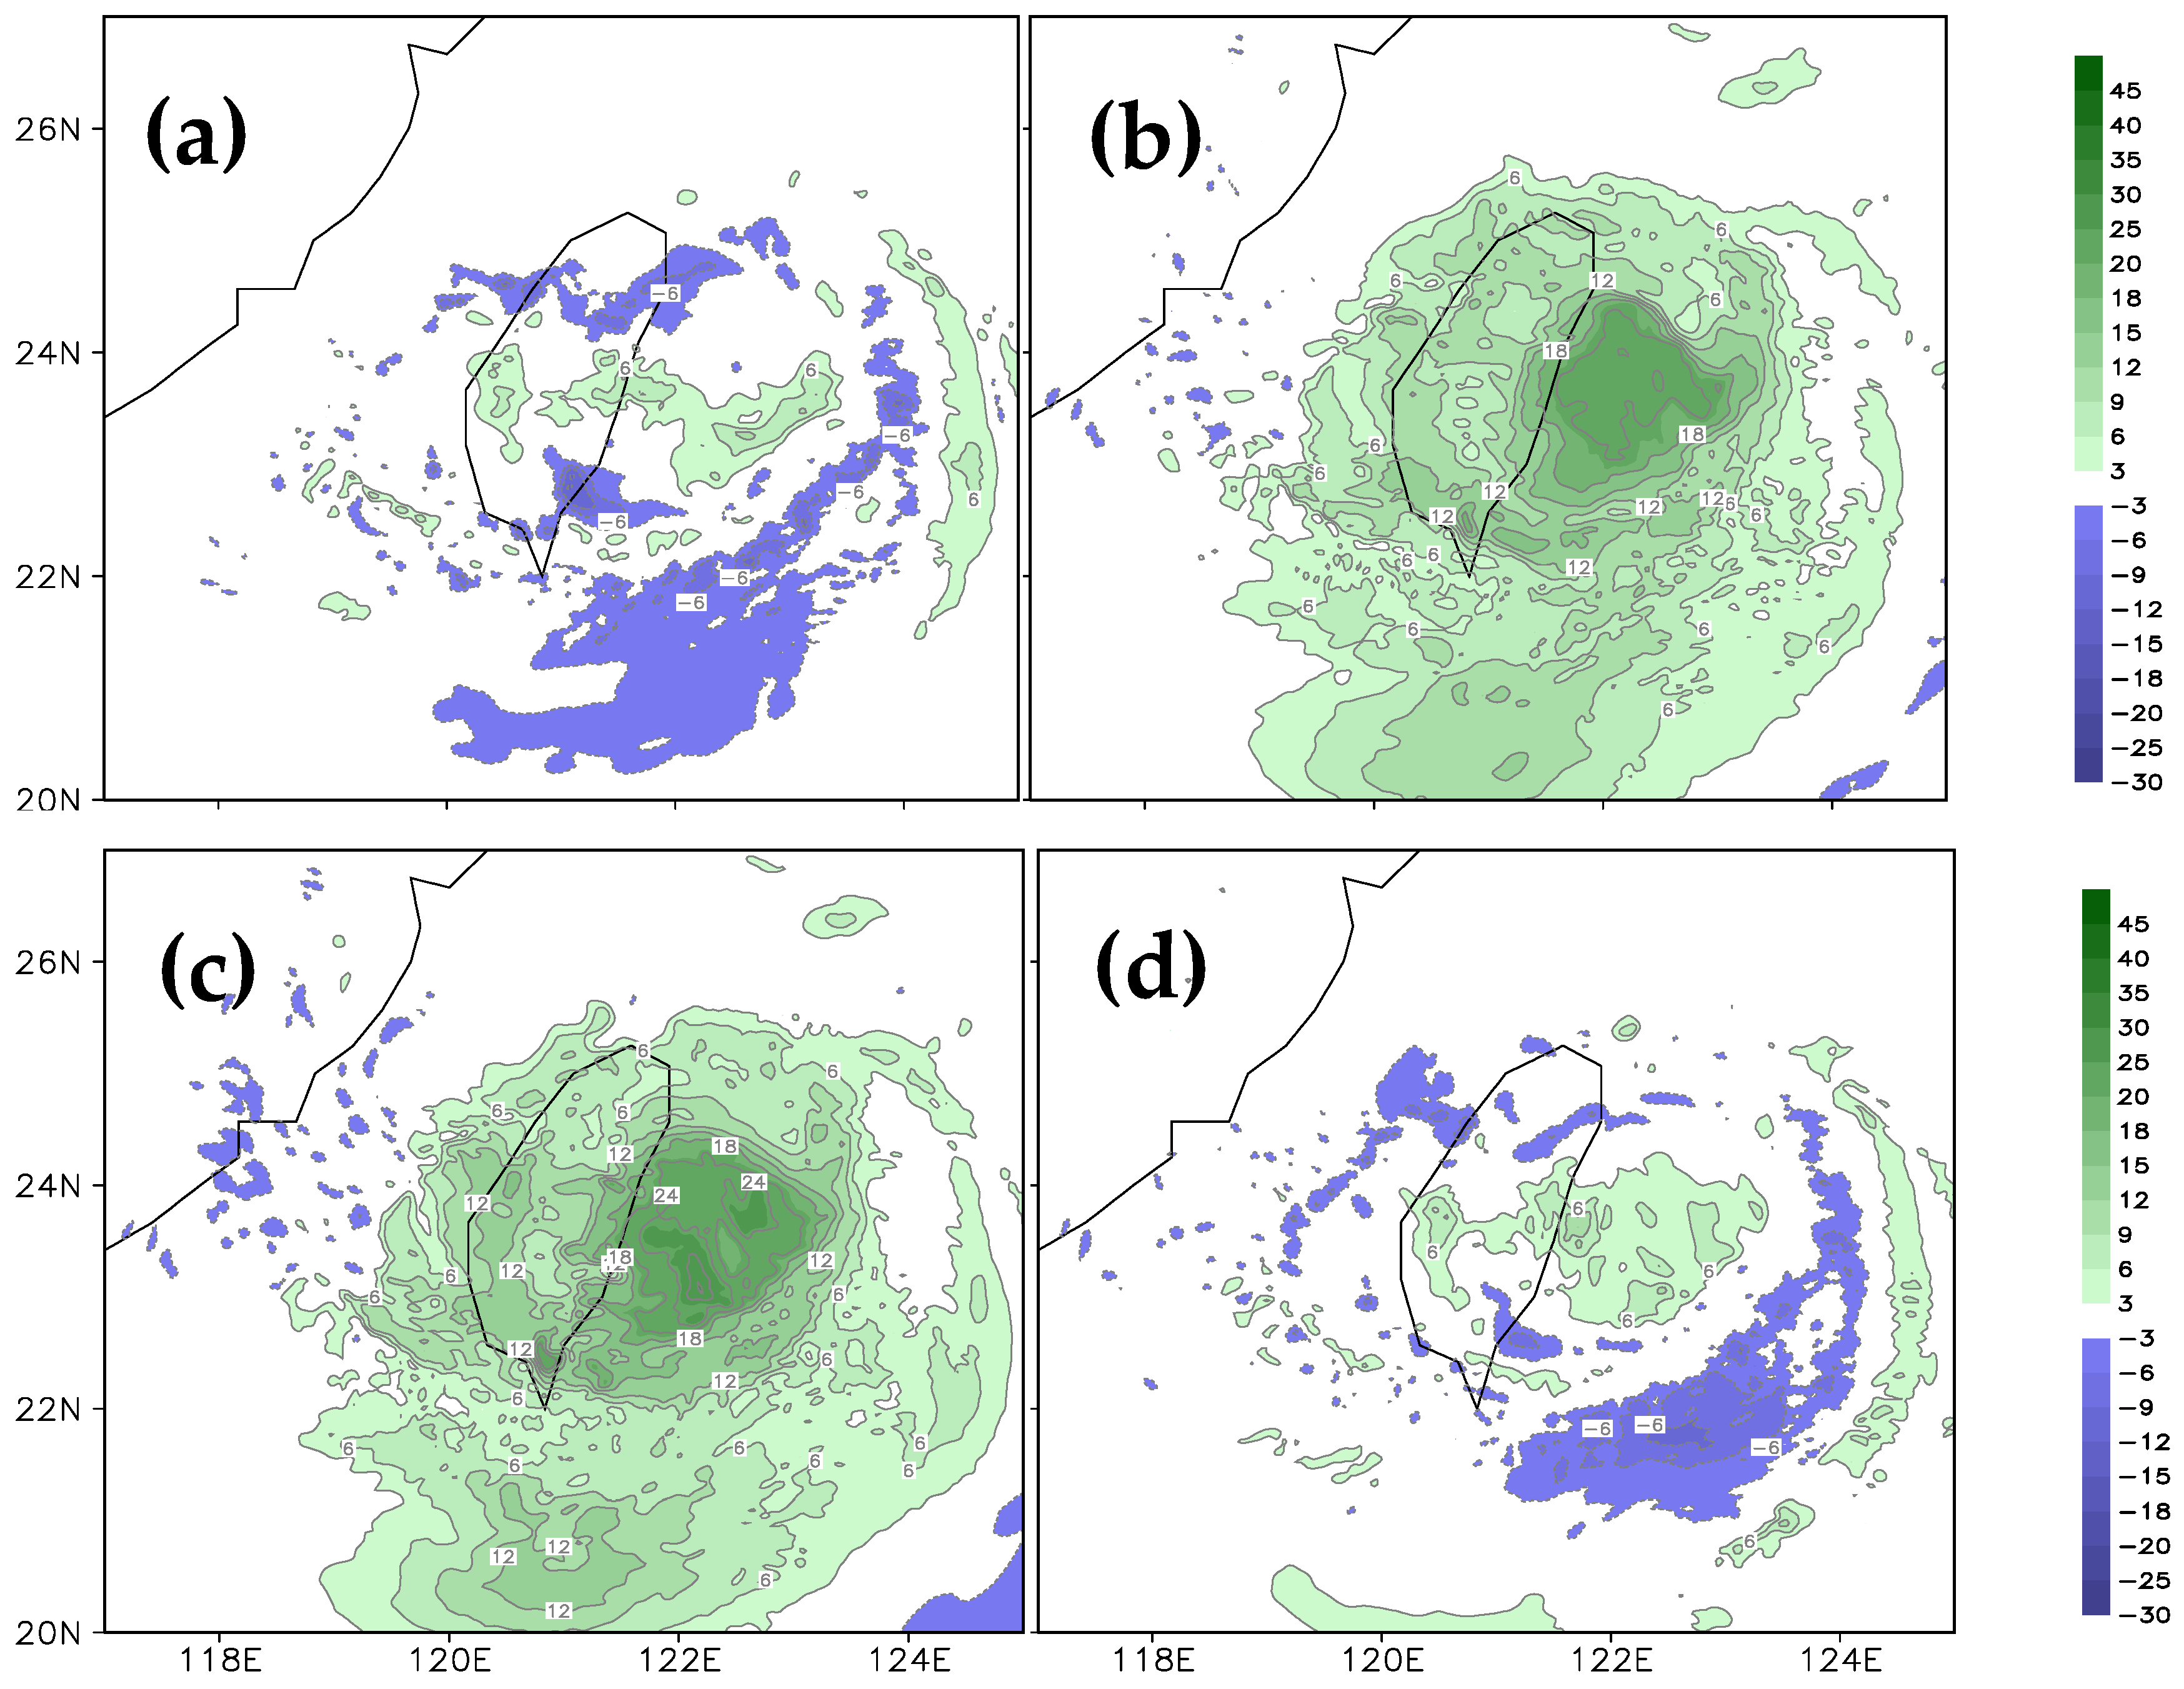
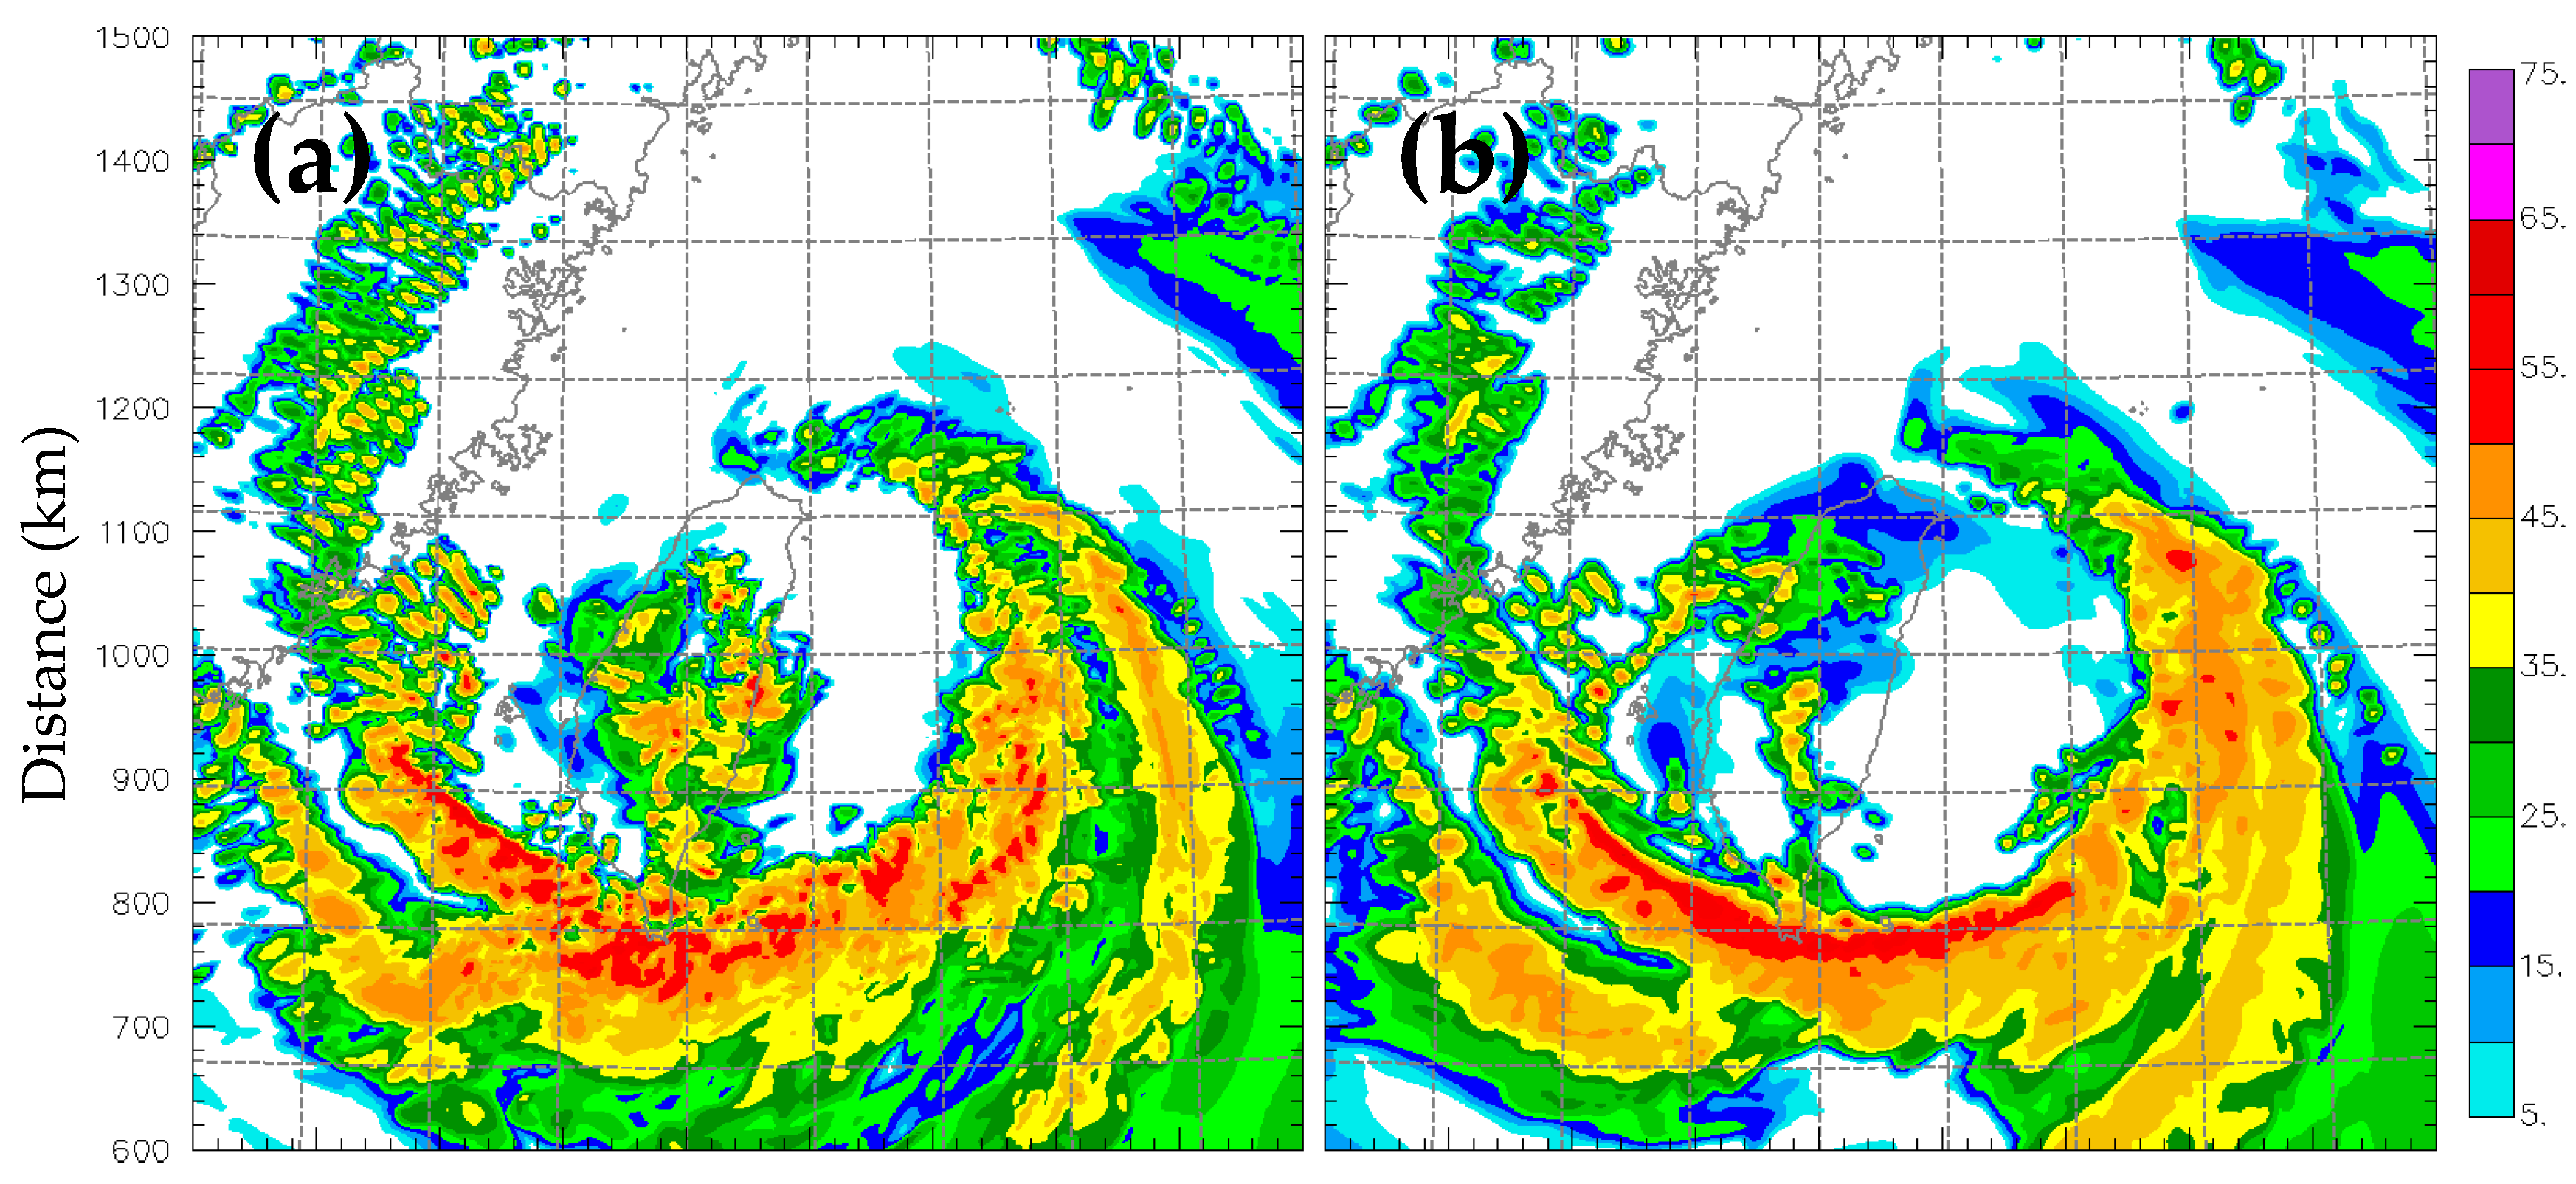
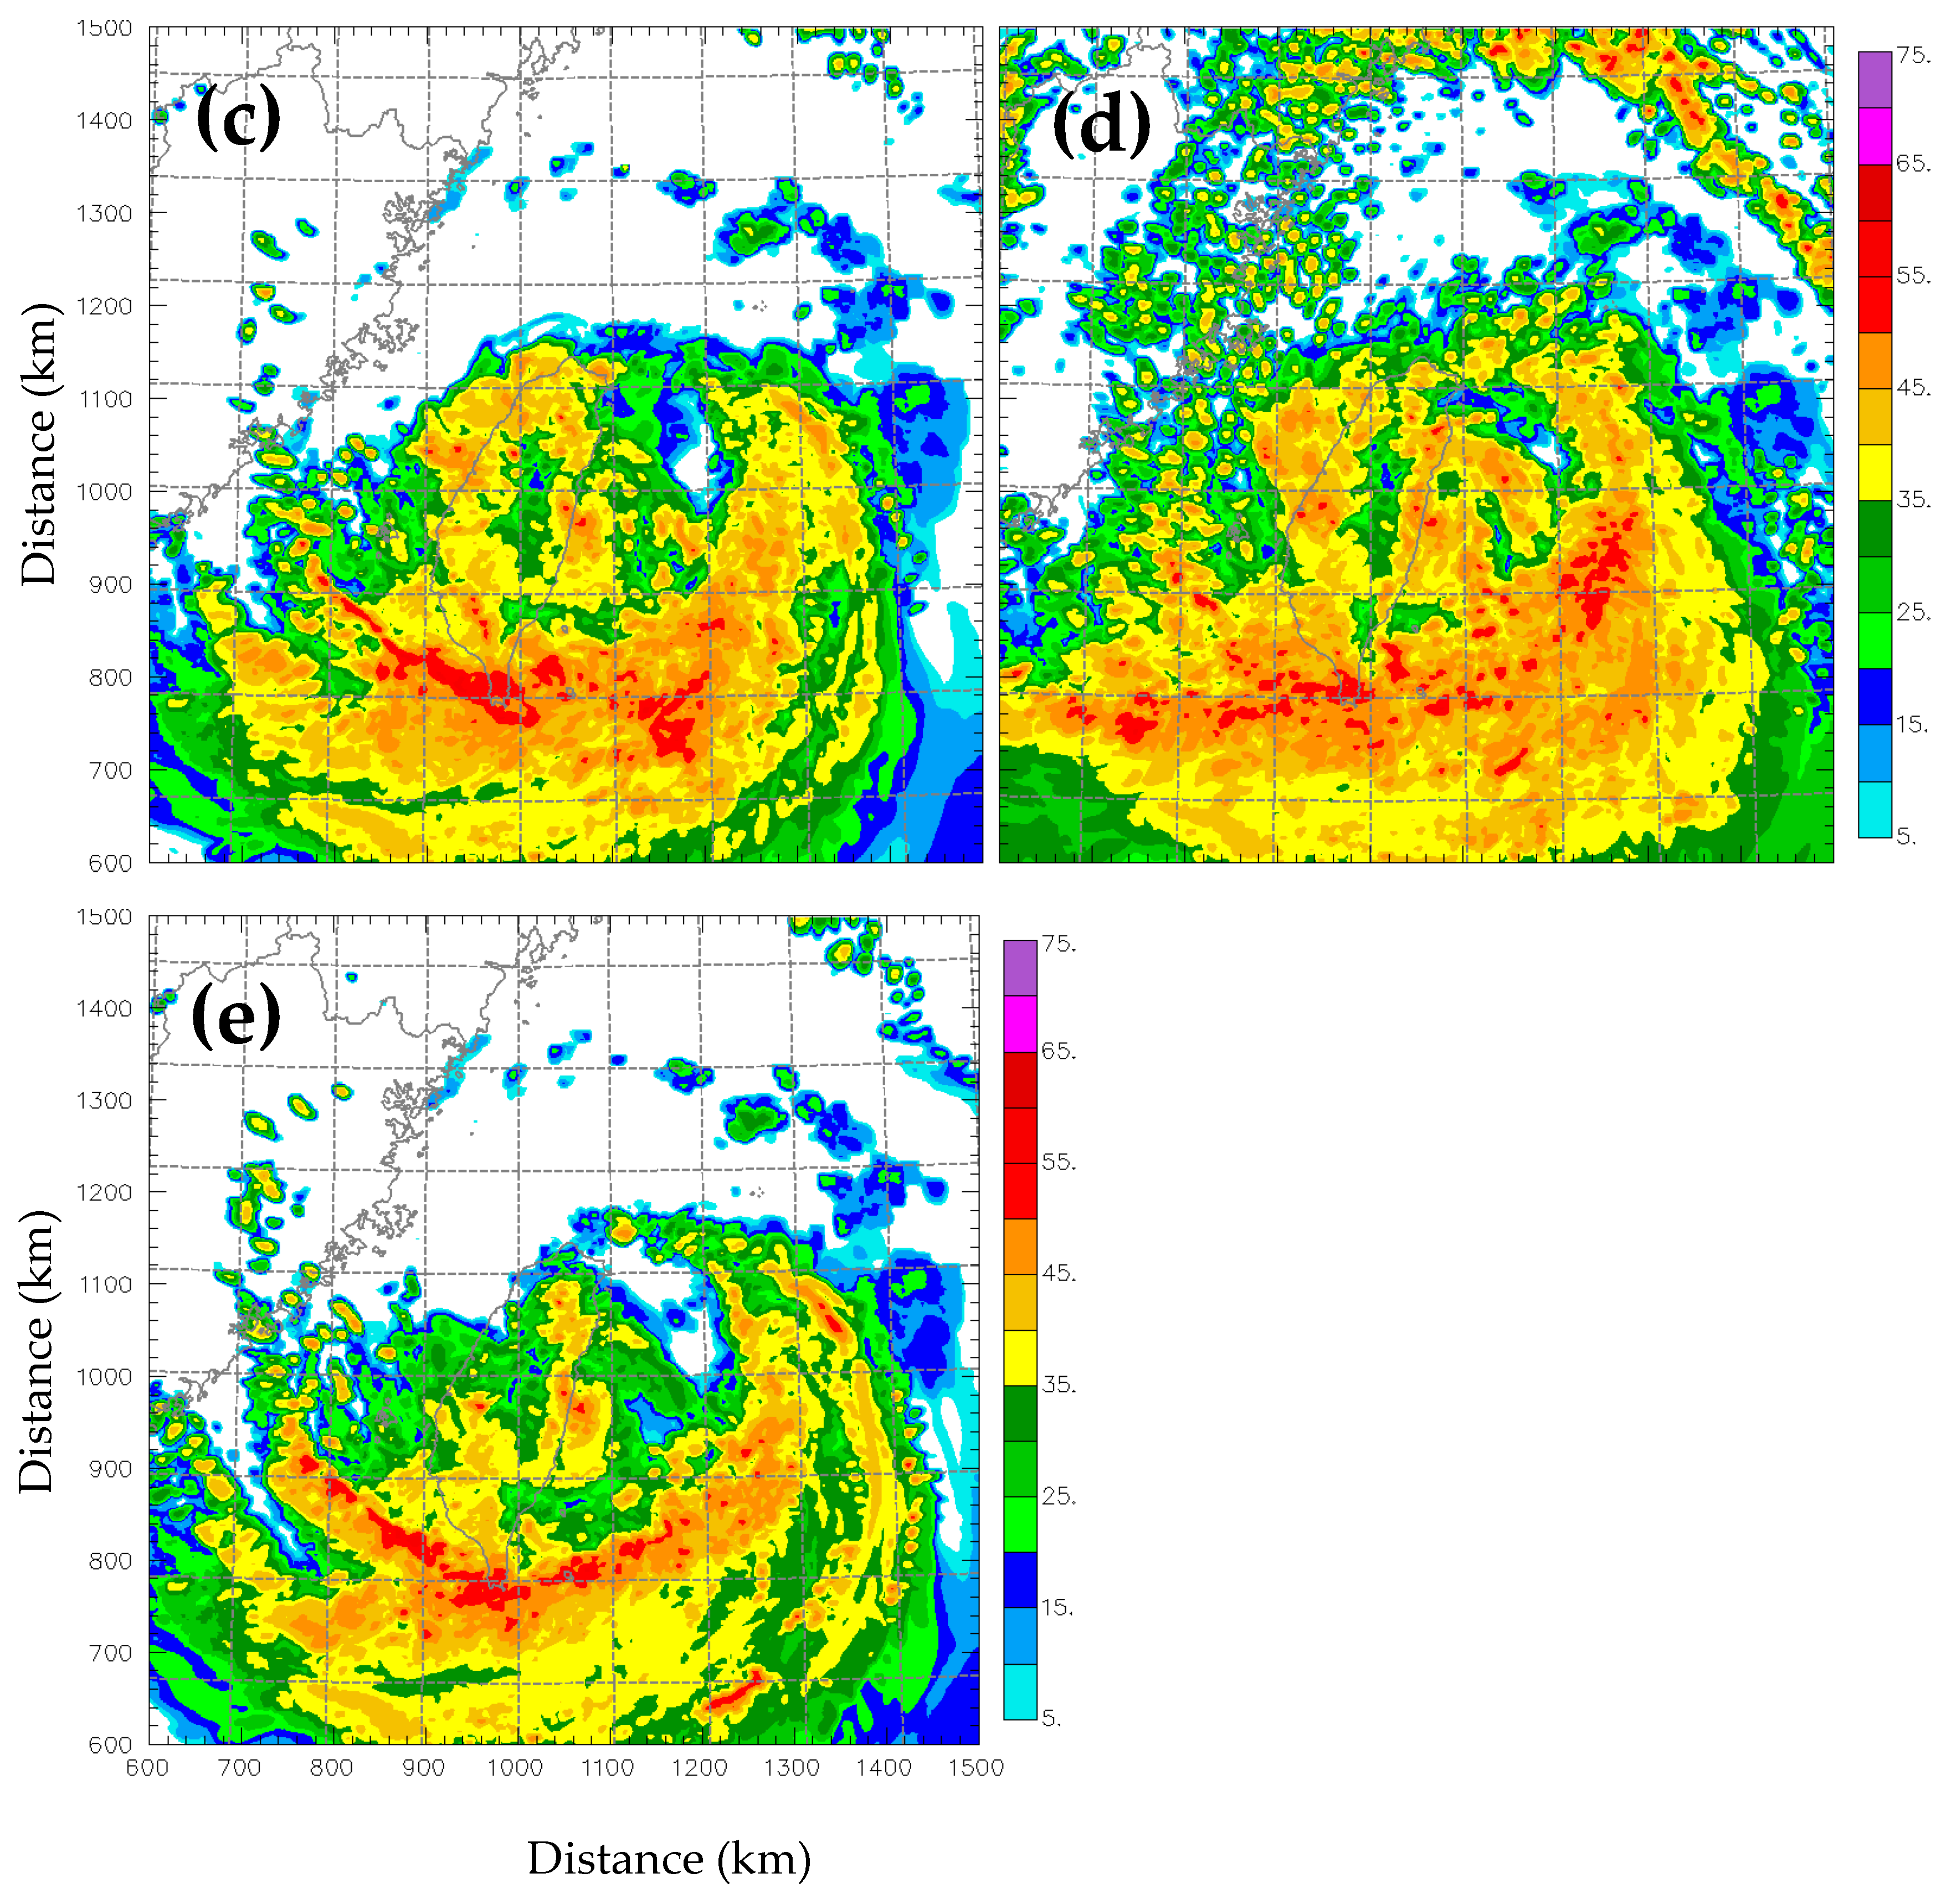
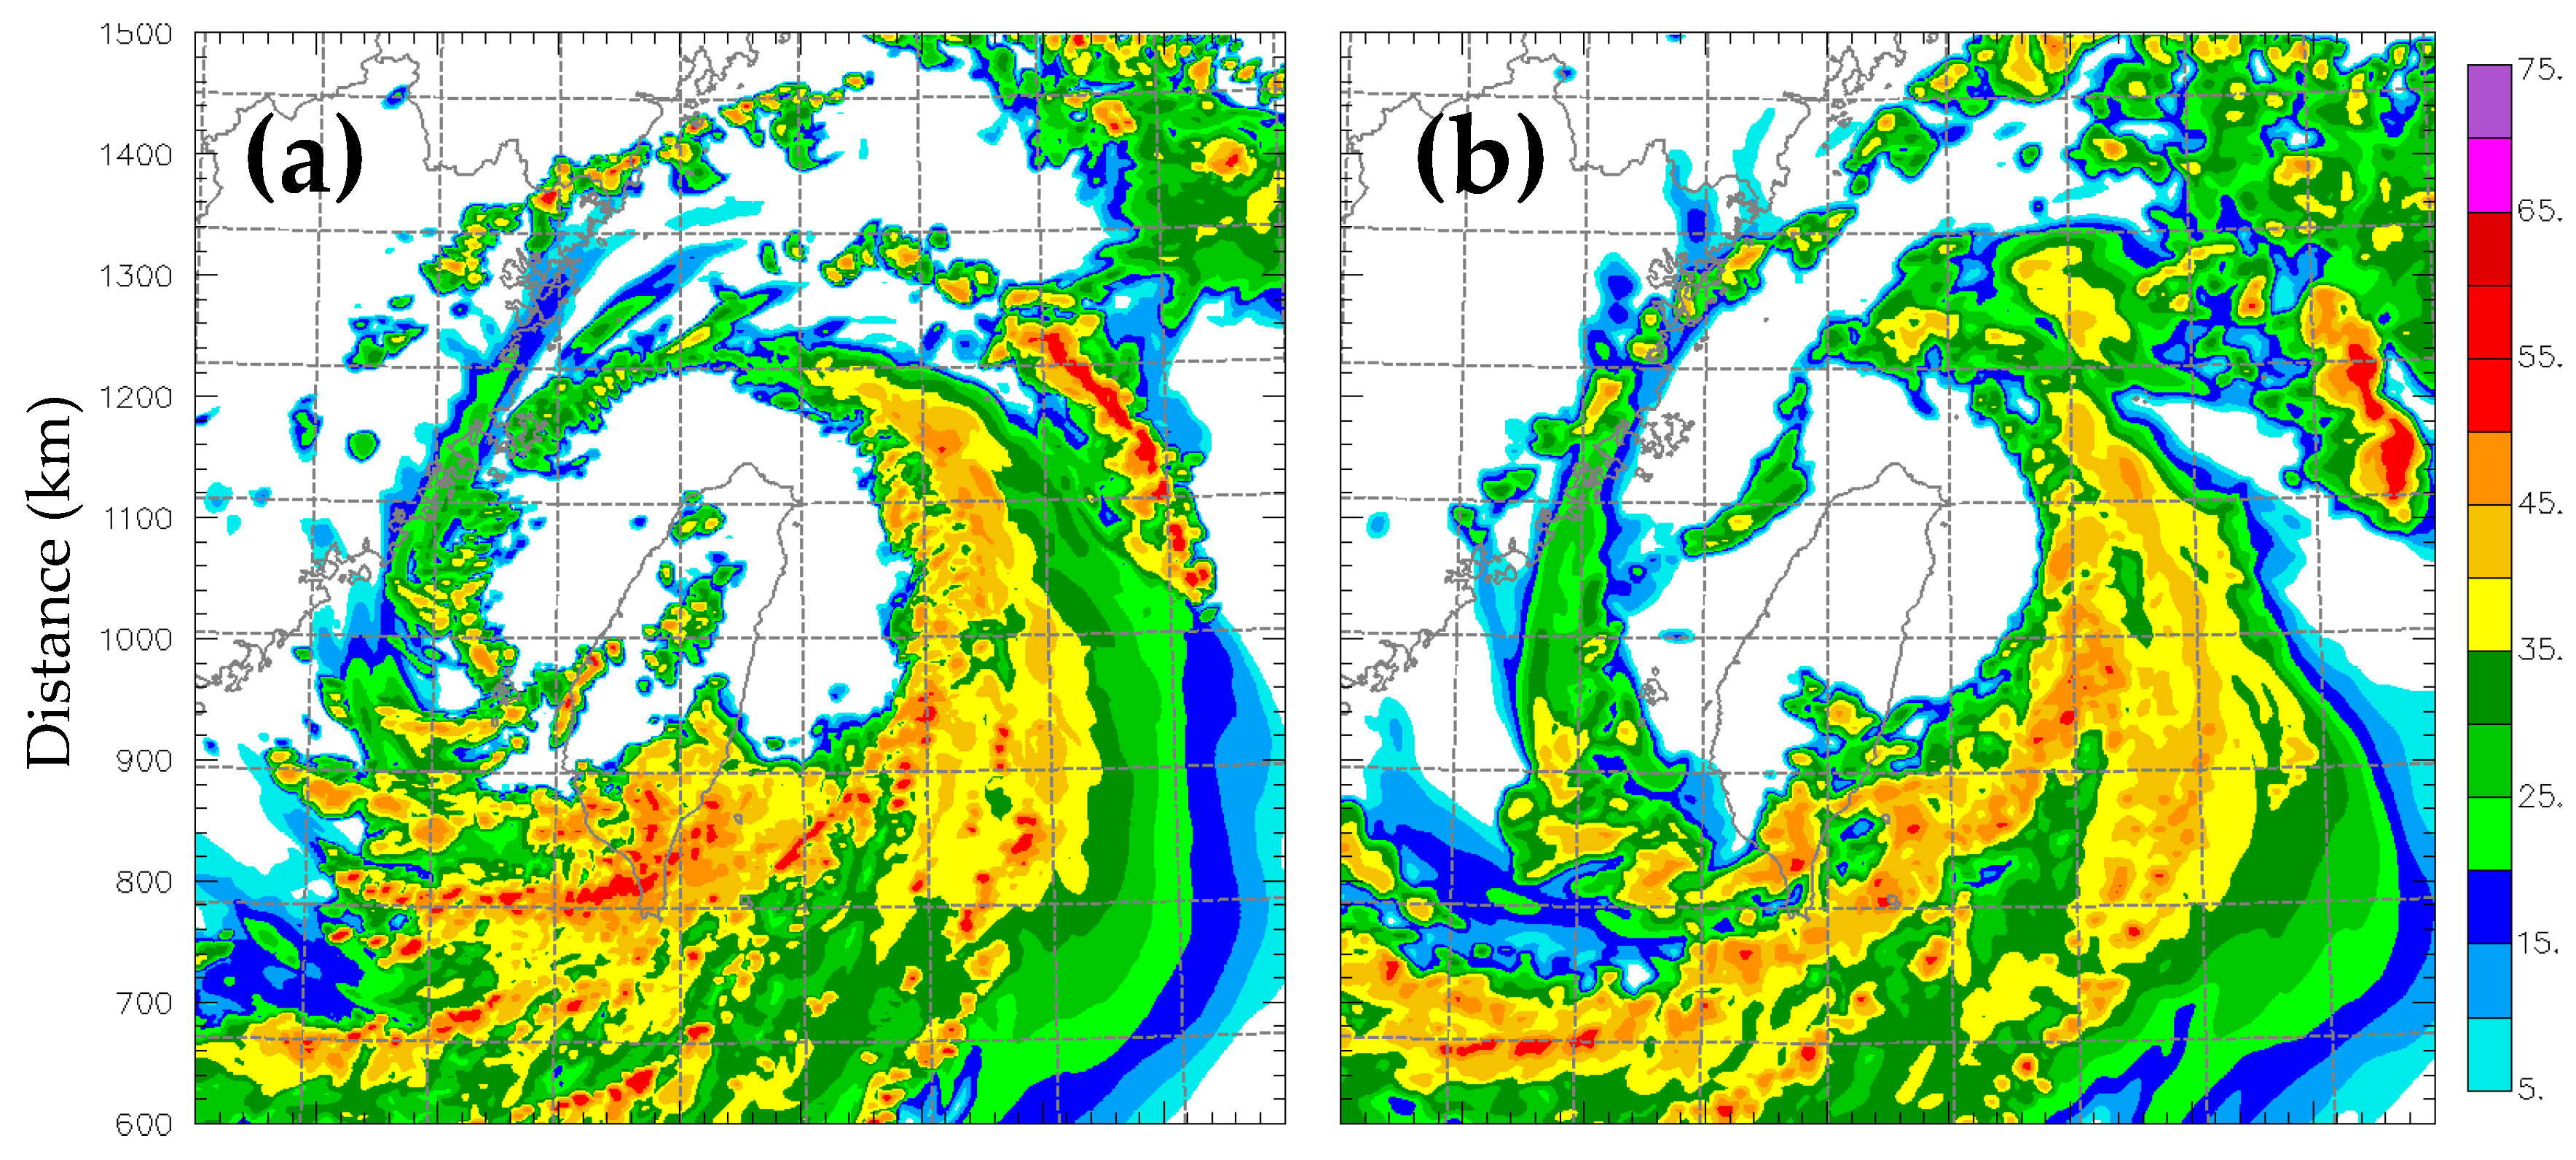
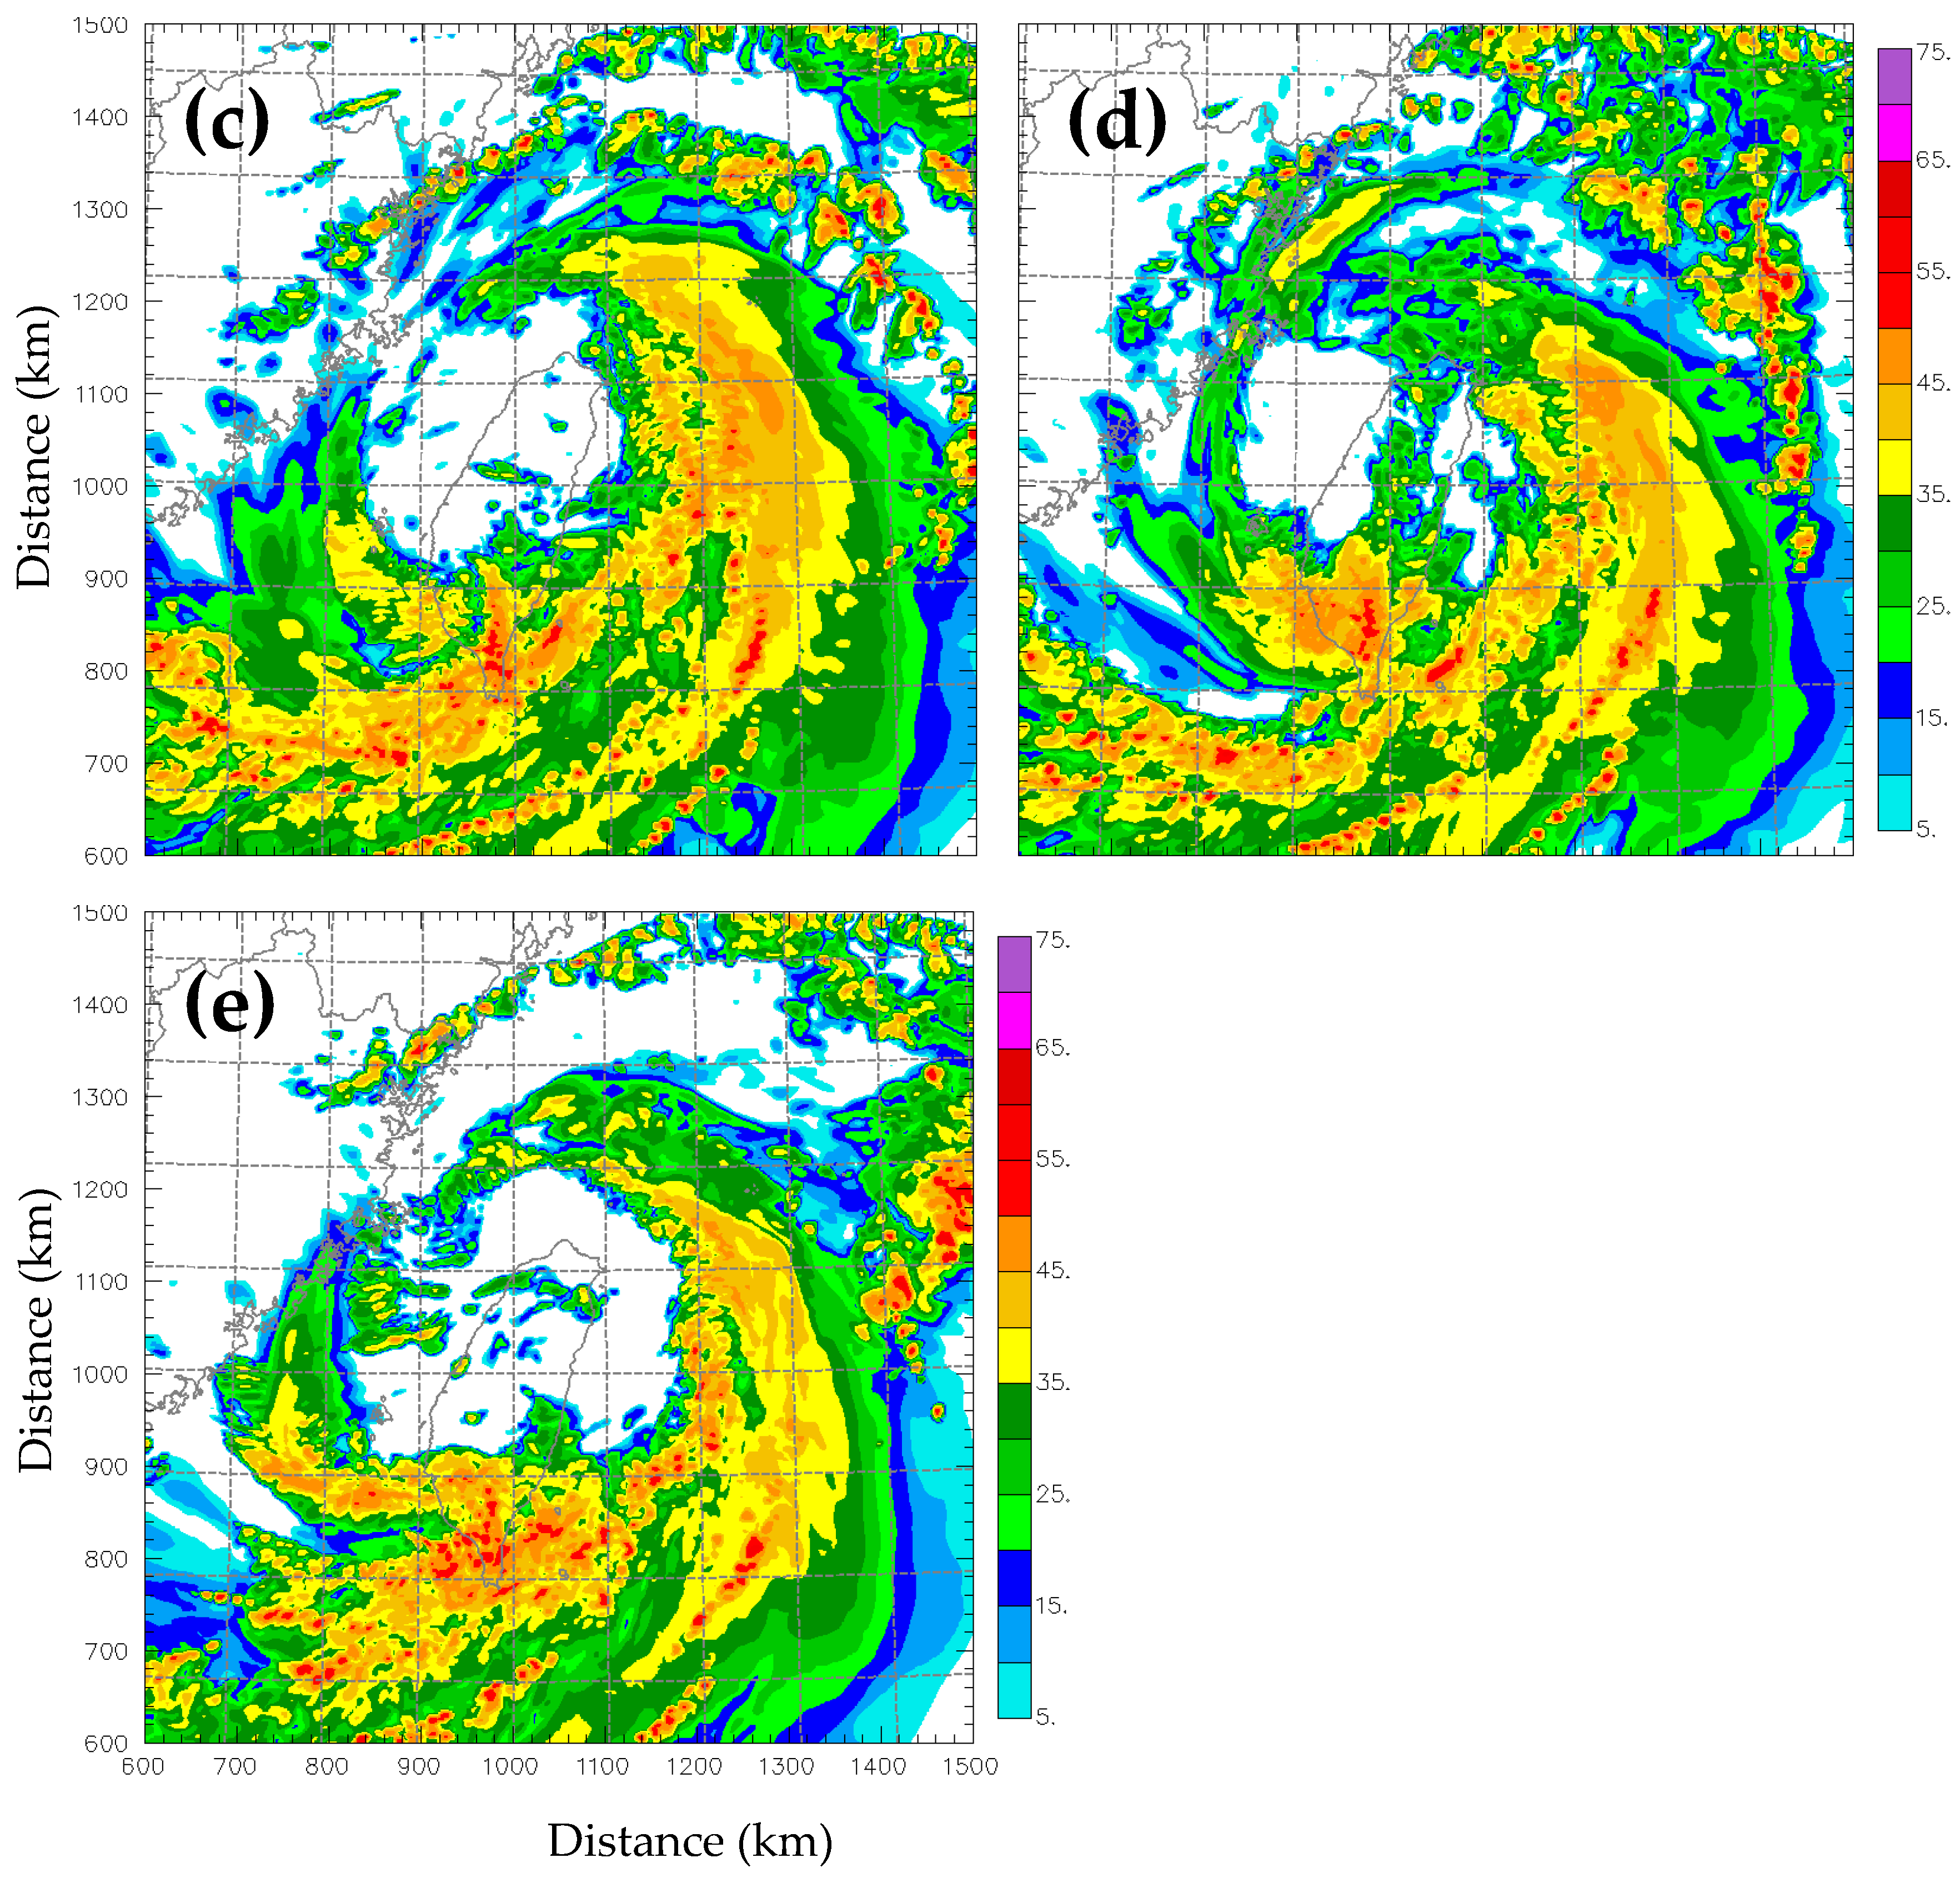
5.2. Reflectivity Forecast

The impact of the assimilation on the predicted composite reflectivity was examined. As shown in Figure 11, by 0000 UTC 8 August, the typhoon vortex remained over Taiwan Island and developed a more axis-asymmetric structure. The strong echo bands in the five experiments presented a ring pattern surrounding Taiwan Island and resembled the observation. The eye wall regions in all the experiments were filled with high-value composite reflectivity, and all forecasts still exhibited reflectivity-free eyes. The strongest echo bands in the five experiments were located on the southern and southeastern eye walls, corresponding to the outer spiral rainband, presumably due to the stronger moisture transportation by the large-scale southwest flow. The general patterns of composite reflectivity in the four sensitive forecasts were similar, and ExpAll presented the echo band closest to the observation. The ring-shaped echo bands in ExpVr and ExpZ were neither occlusive nor stronger than the observation, indicating a poor organization of the typhoon vortex. On the contrary, CNTL, ExpAllNqv, and ExpAll recovered occlusive well-organized structures of composite reflectivity. Compared with the other four experiments, ExpAll reproduced a stronger and tighter echo band matching most of the observation as well as the compact eye walls embedded in the vortex. All experiments exhibited spiral structures of echo bands in the eye wall collecting toward the inner core. The echo on the windward slope of Taiwan’s central mountains was distinctive. The mountain played an important role in blocking the southwestern flow or forming a convergent region so that a broad echo region formed over the windward slope. Compared to the observation, ExpAll gave a realistic distribution of composite reflectivity on the windward slope. In addition, the echo band on the outside of the northeastern eye wall in ExpAll matched the observation. However, a messy illusive echo region appeared on the northeastern corner outside of the eye walls in all experiments. Overall, the assimilation with the specific humidity adjustment exerted a positive influence on the prediction of precipitable hydrometeors and reflectivity.
In order to quantitatively verify the reflectivity forecast, the grid-to-grid equitable threat score (ETS) for the instantaneous composite reflectivity at the threshold of 25 dBz was calculated and is presented in Figure 12. It was shown that among all the experiments, CNTL gained the lowest ETS until 2300 UTC 7 August, and ExpAll obtained the highest ETS during the whole forecast period. The ETSs of ExpVr, ExpZ, and ExpAllNqv were in-between. This means that the assimilation of radial wind and reflectivity with the specific humidity adjustment was helpful in improving the forecast skill of reflectivity. These quantitative results are in agreement with our earlier diagnostics. After 2200 UTC 7 August, the ETSs of ExpVr and ExpAllNqv decreased, indicating the diminishing impact of the assimilation without the specific humidity adjustment.

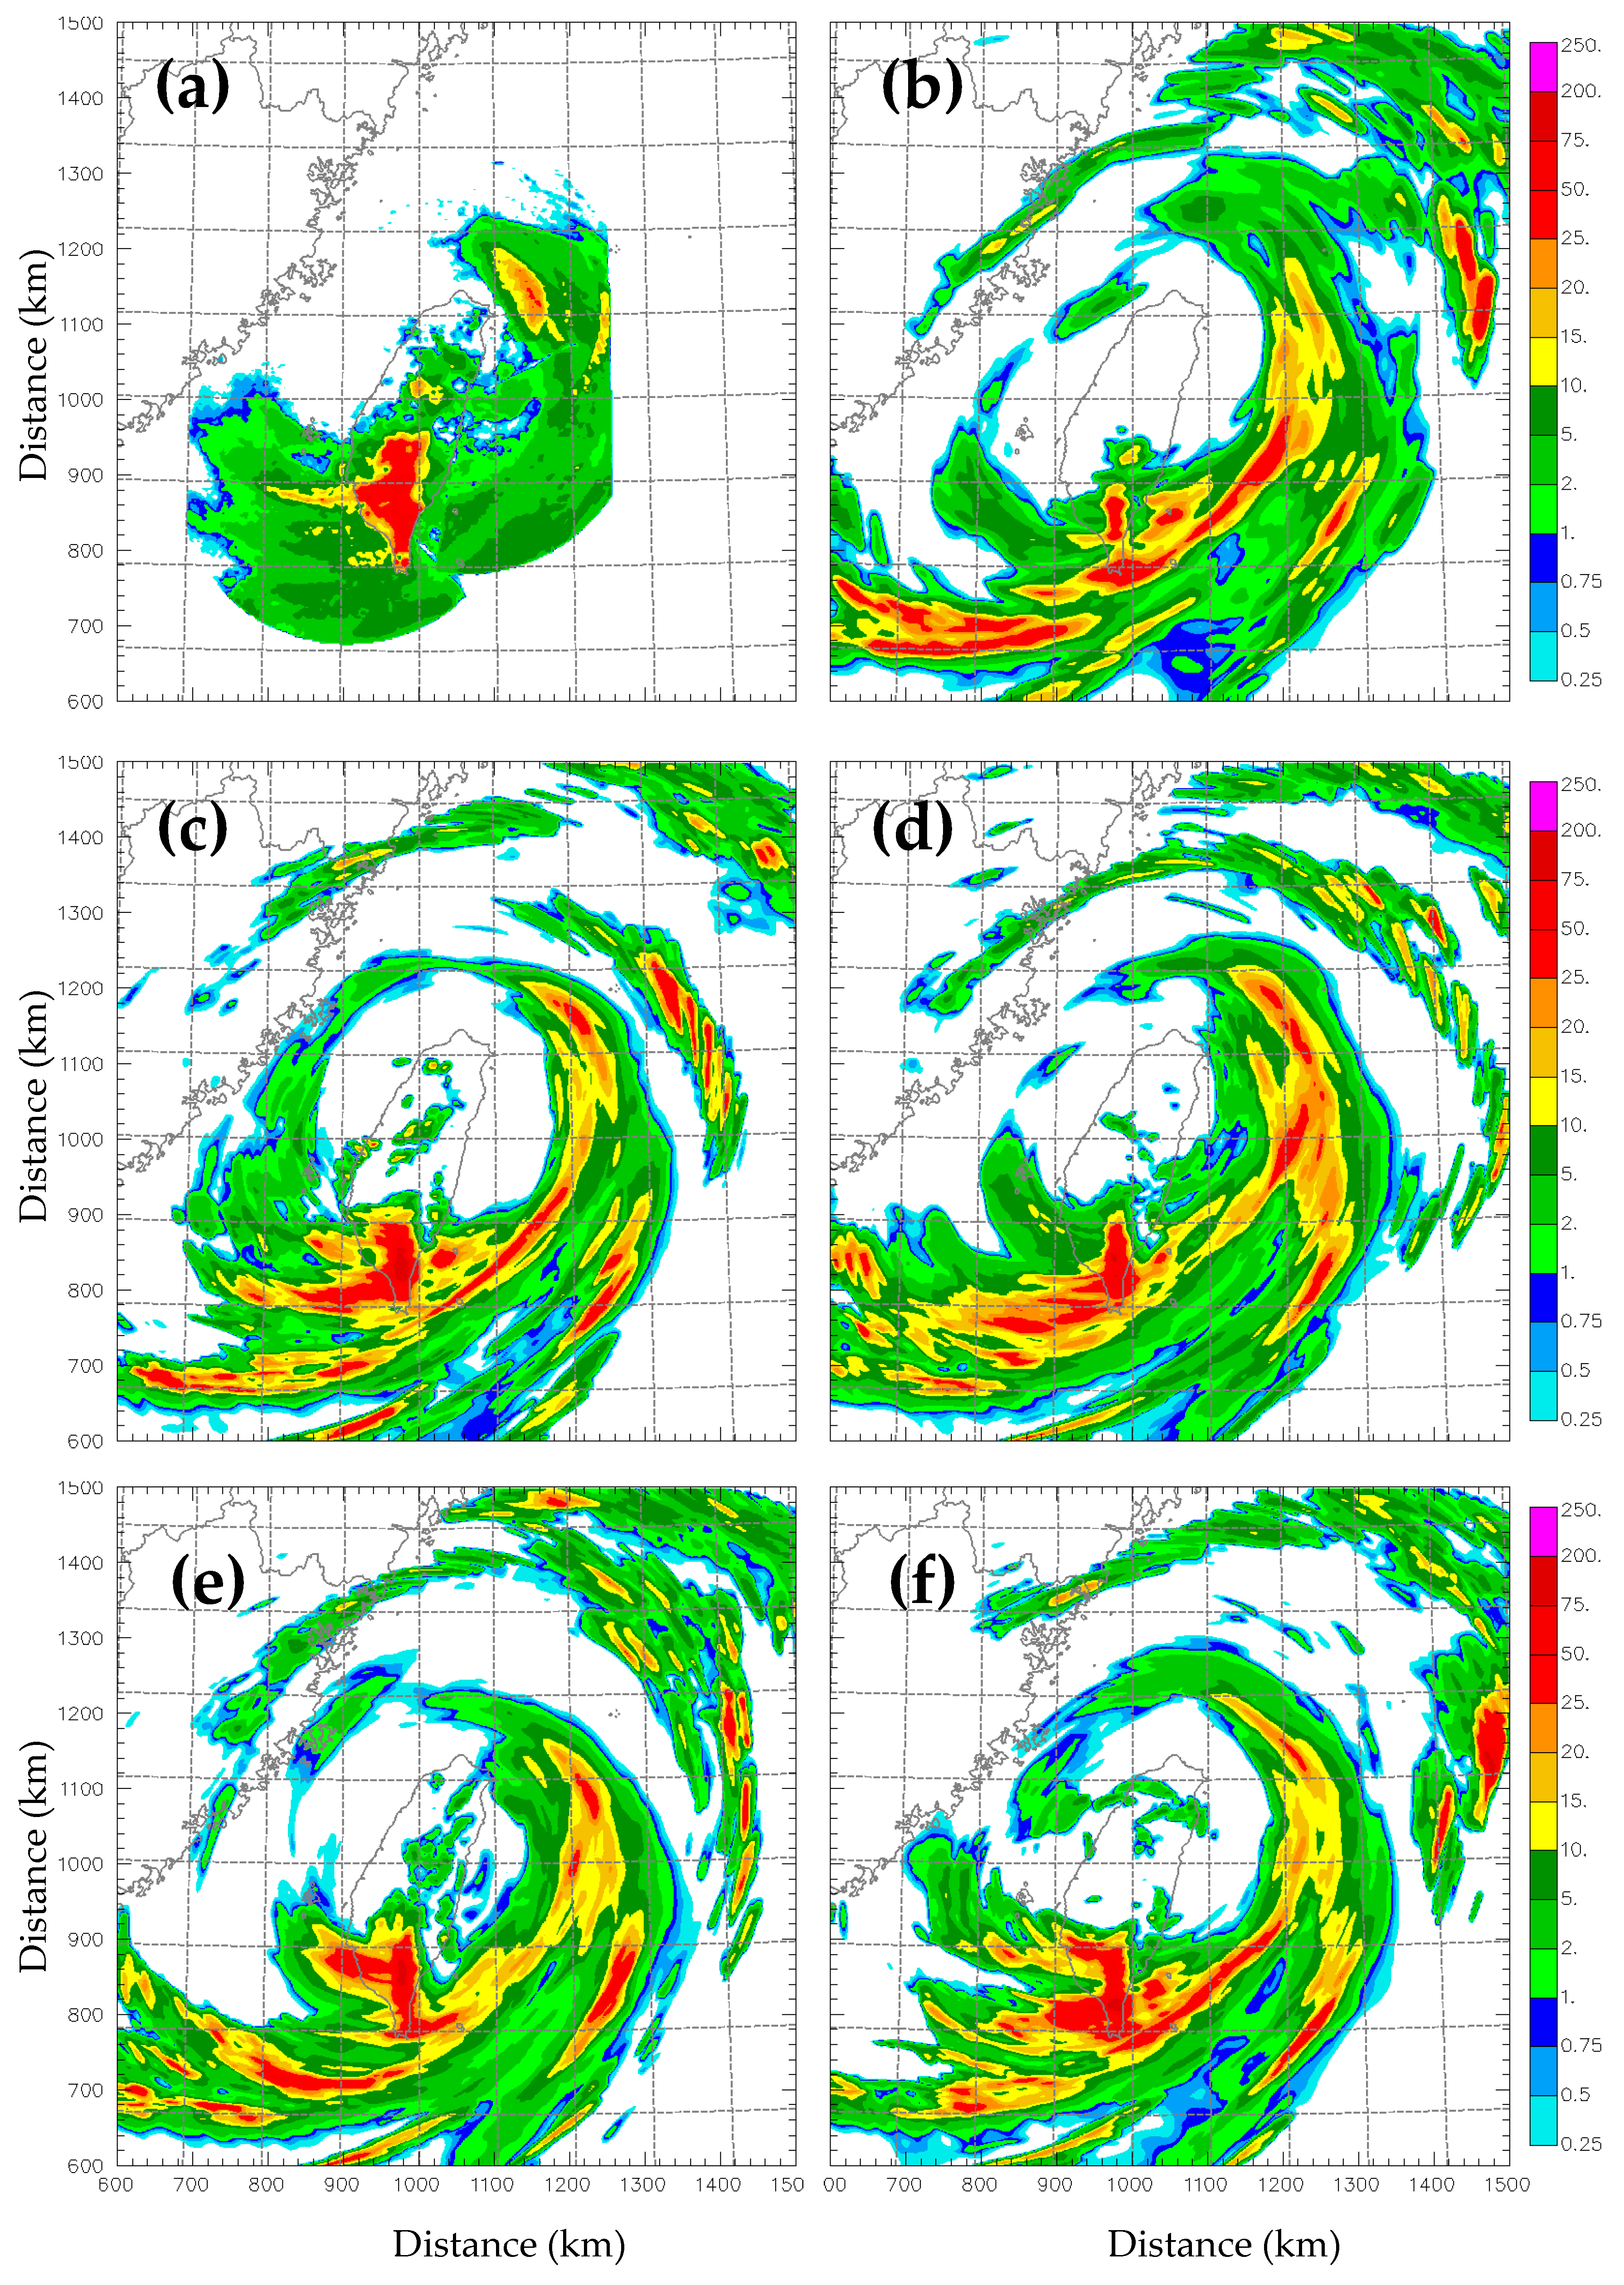
5.3. Hourly Precipitation Forecast

The predicted hourly precipitation was compared with the quantitative precipitation estimates (QPEs) derived from Level II radar data. As shown in Figure 13, all the experiments distinctively overestimated the observation of hourly precipitation, especially the strong precipitation band on the windward slope of Taiwan’s central mountains. The predicted hourly precipitation presented a ring pattern with a tail stretching to the sea surface in the southwest of Taiwan Island, which was close to the location of the high-value QPE region but was much stronger than the observation, which may be a result of the enhanced transportation of moisture to the eye wall by the strong southwestern flow. Hourly precipitation forecasts saw improvements in the sensitivity experiments, particularly in ExpAll (Figure 13e), despite the predicted rainbands being somewhat stronger than the observed ones. Besides this, the strong precipitation in the northeast of Taiwan Island was reflected in ExpAll, although it was a bit weaker than the observation. These results manifested that the assimilation with the specific humidity adjustment was in favor of the hourly precipitation forecast.
The grid-to-grid ETS of the hourly precipitation prediction at the 10 mm threshold was calculated and is presented in Figure 14. Among all the experiments, ExpAll obtained the highest ETS in the whole period. During the period of 1600 UTC 7 August–1900 UTC 7 August, the ETS of CNTL was the lowest, while ExpVr, ExpZ, and ExpAllNqv gained scores in between CNTL and ExpAll. After 1900 UTC 7 August, the ETSs of ExpVr, ExpZ, and ExpAllNqv became close to CNTL, but ExpAll still had the highest score. This further demonstrates that the assimilation with the specific humidity adjustment was helpful in improving the skill of the hourly precipitation forecast. It should be noted that the ETS values of the four sensitivity experiments dropped rapidly during the first few hours and then rose gradually. This phenomenon is attributed to the imbalance of the analyzed variables and the subsequent adjustments made to these variables to better align with the model’s dynamics and physics.

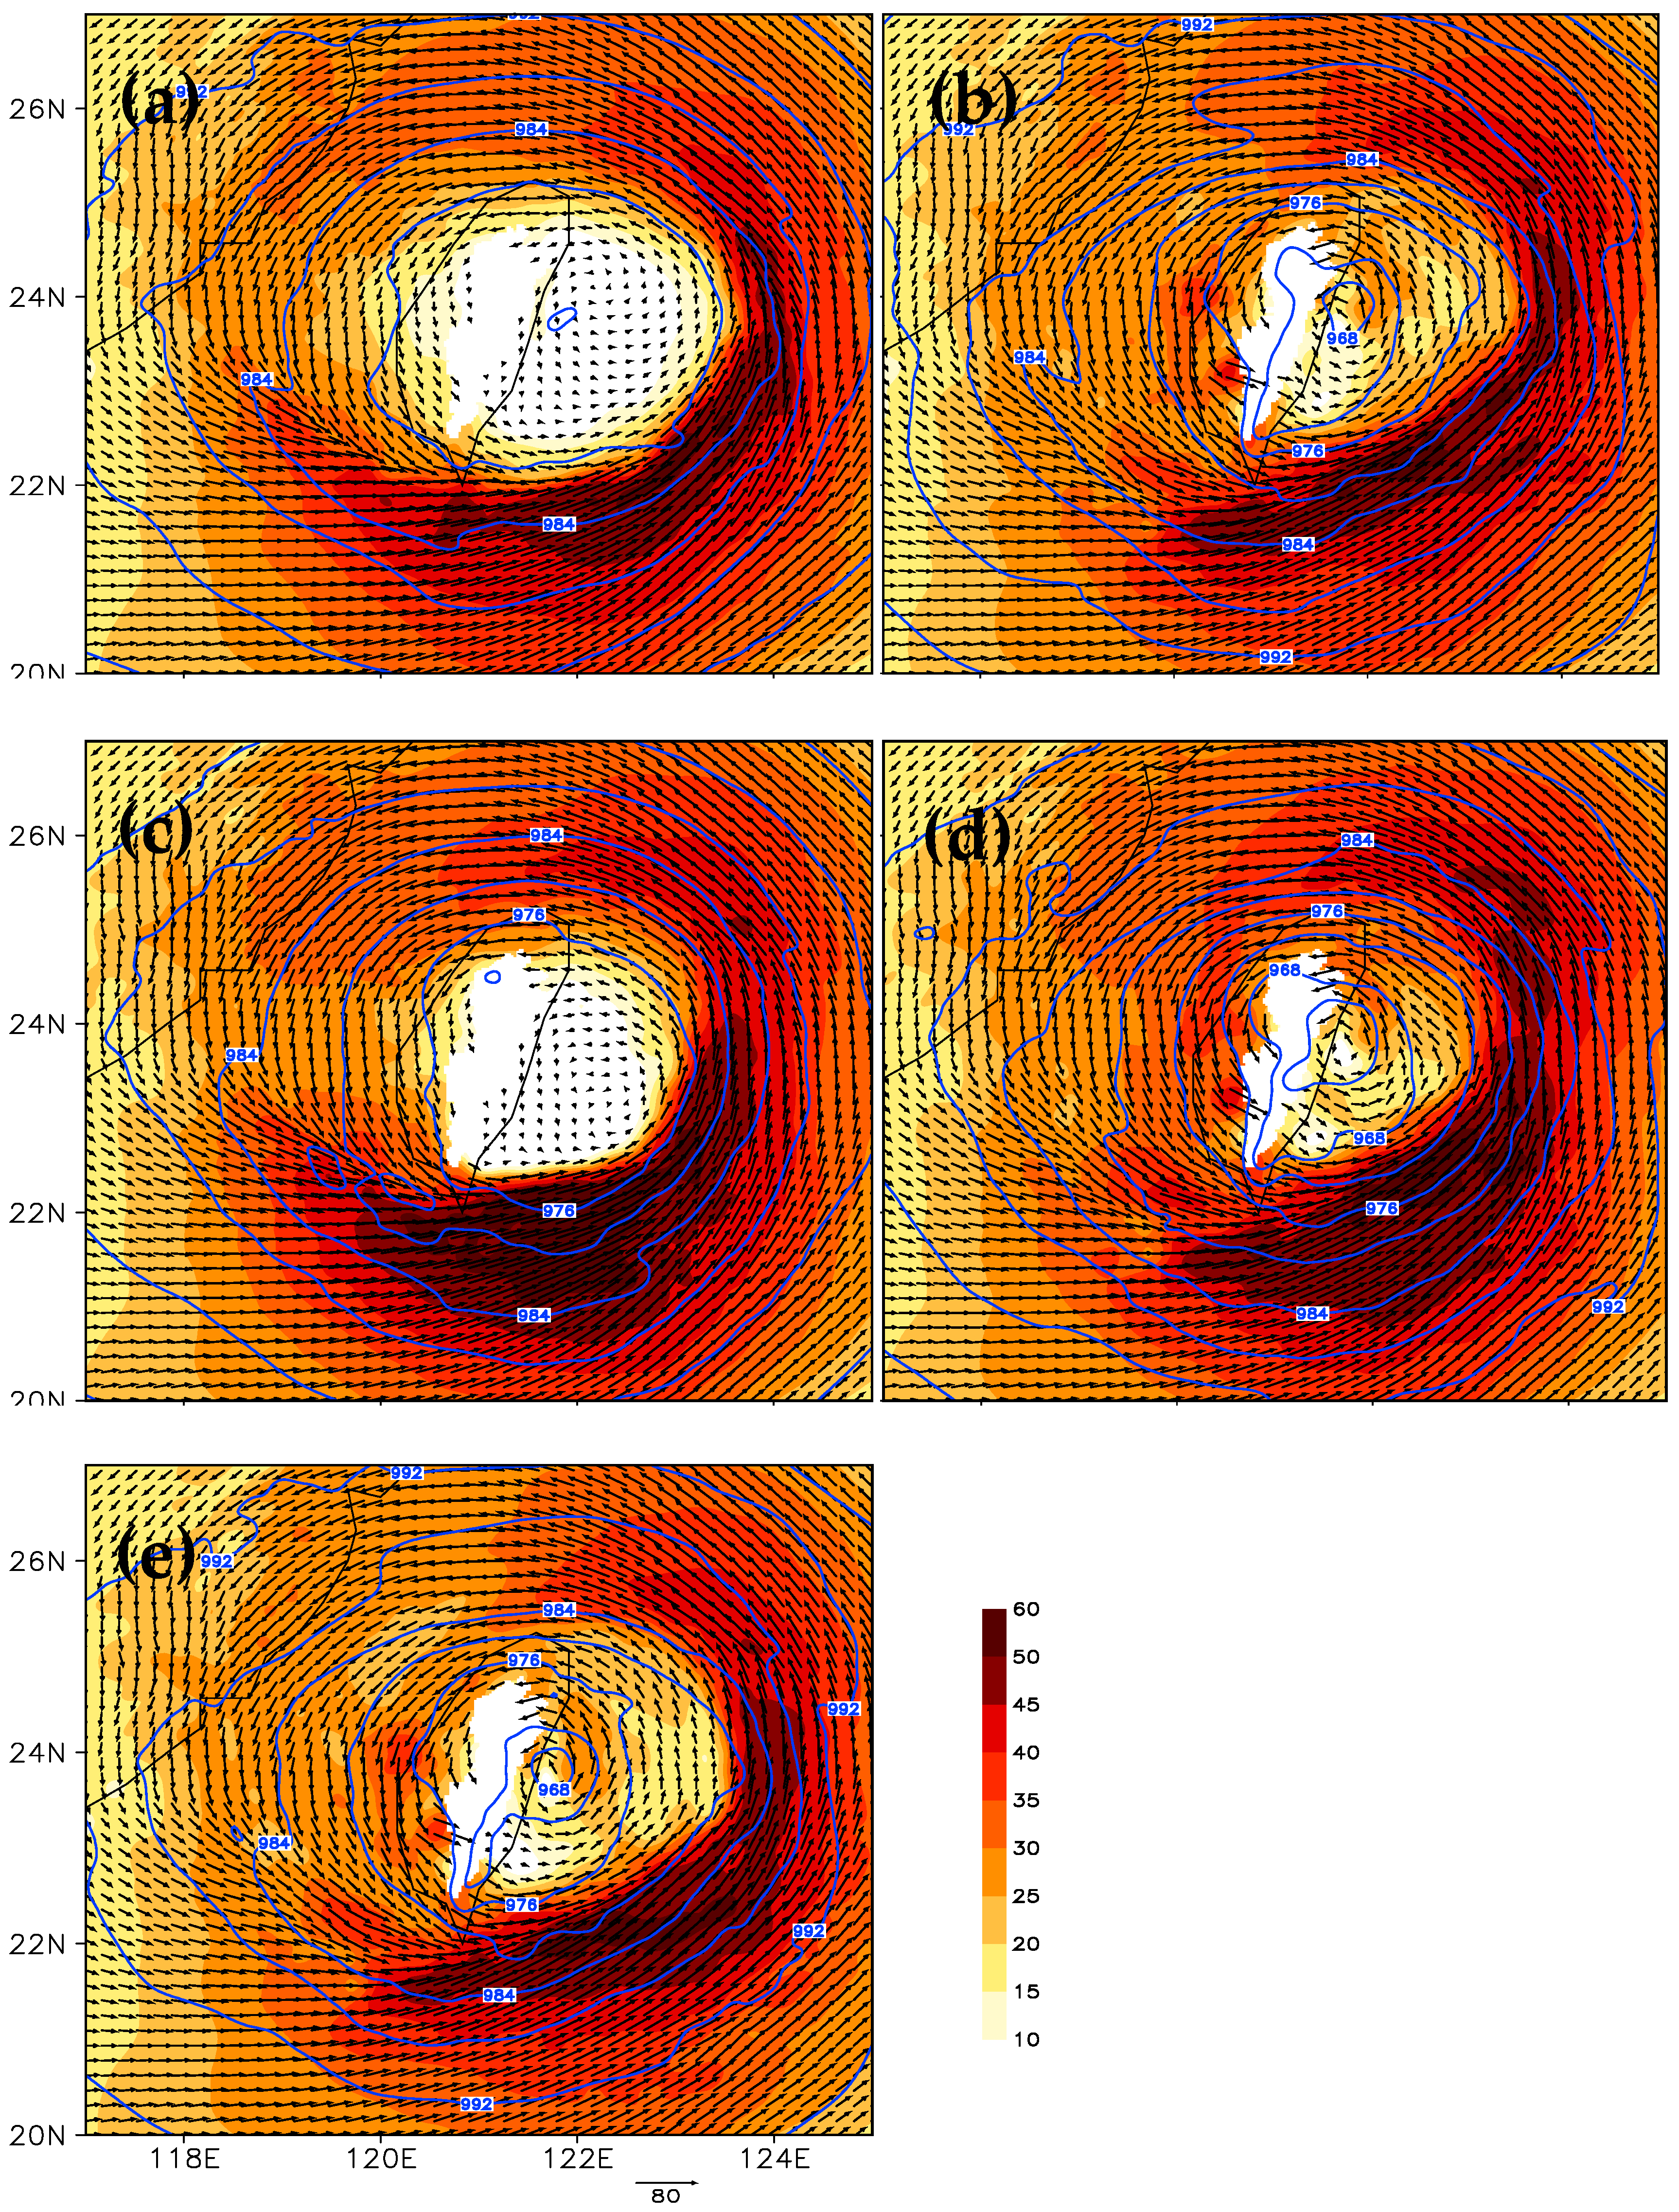
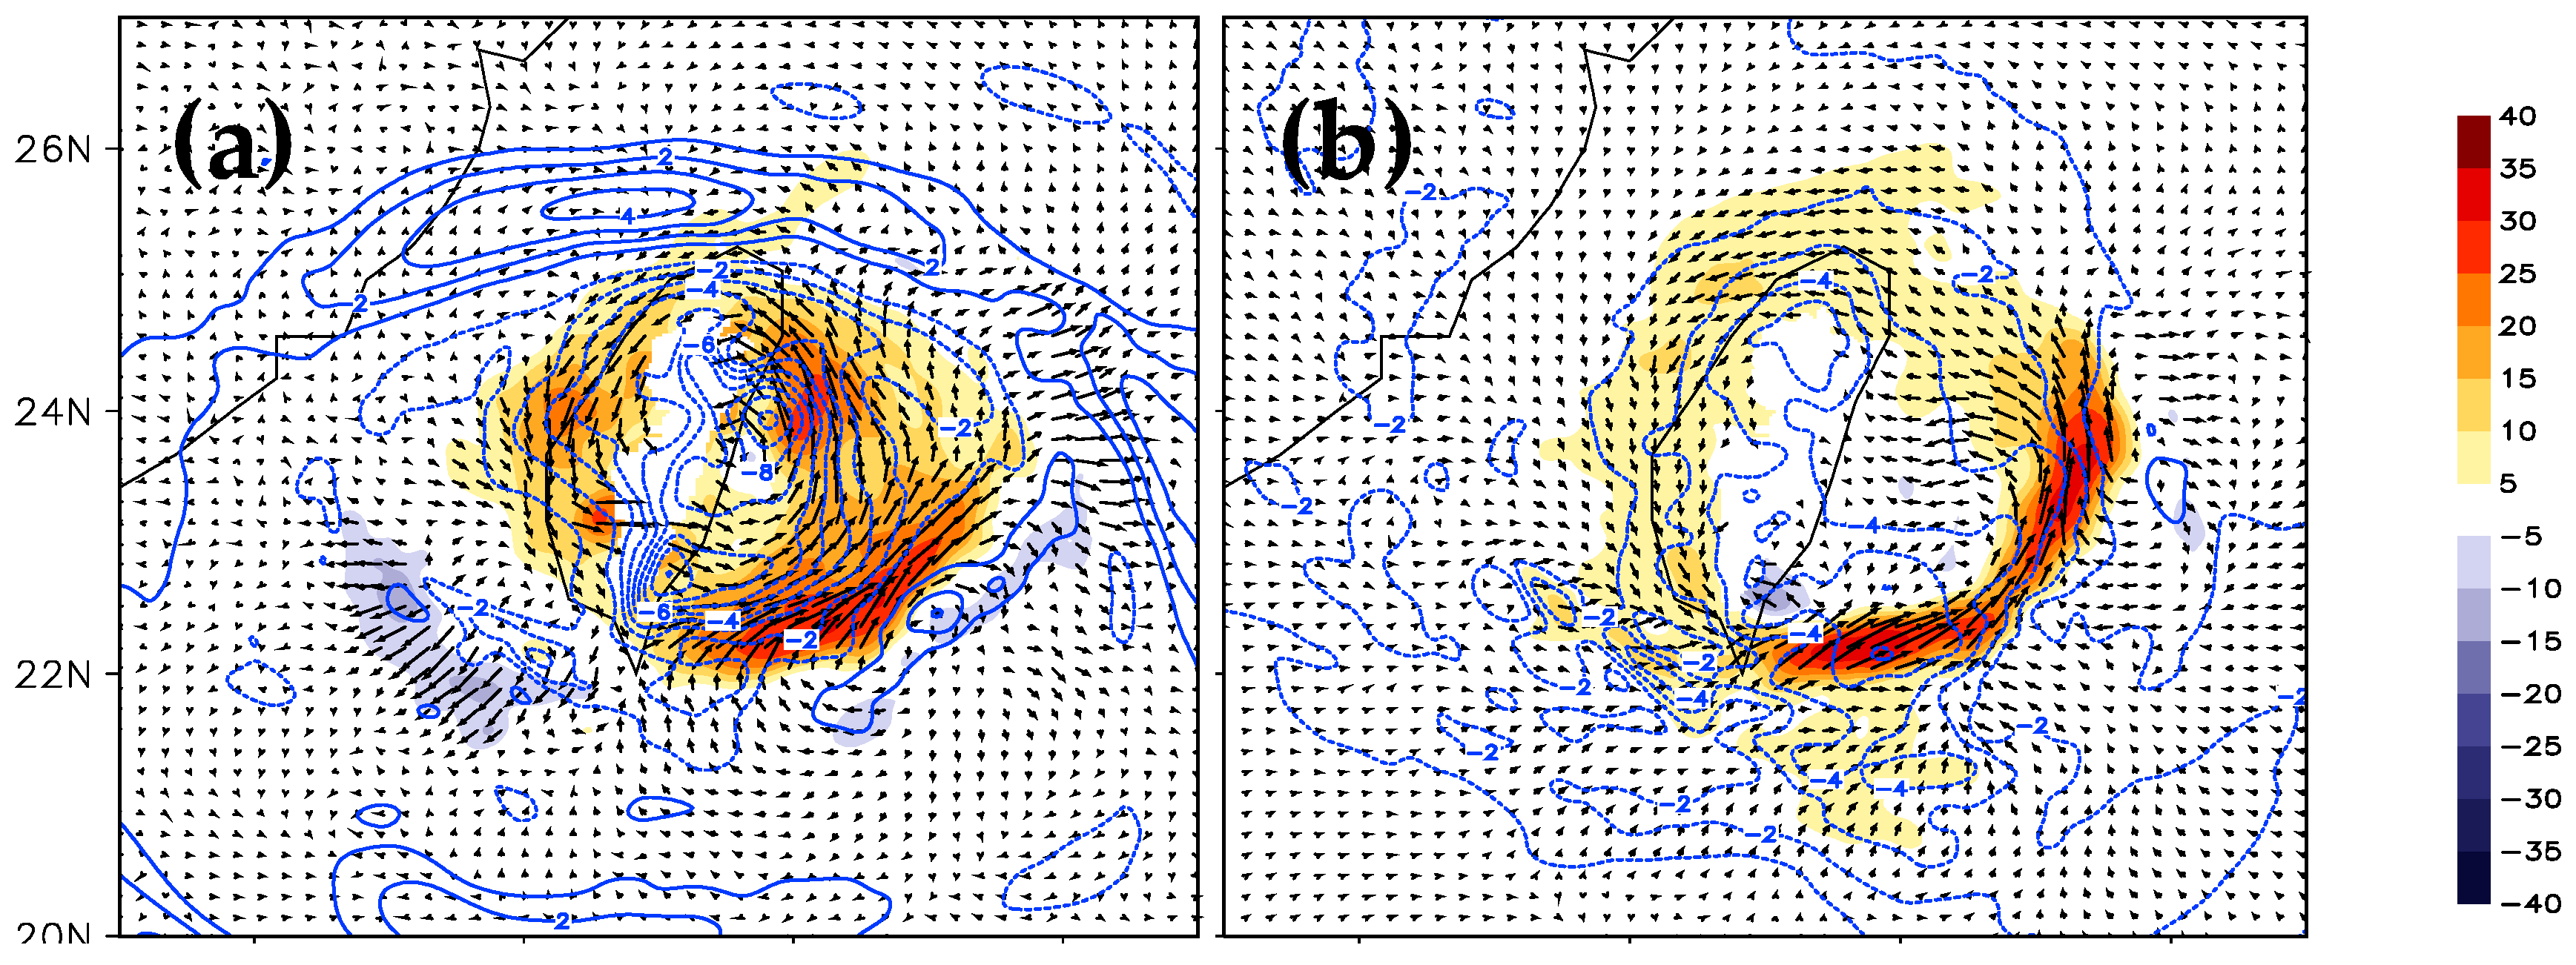
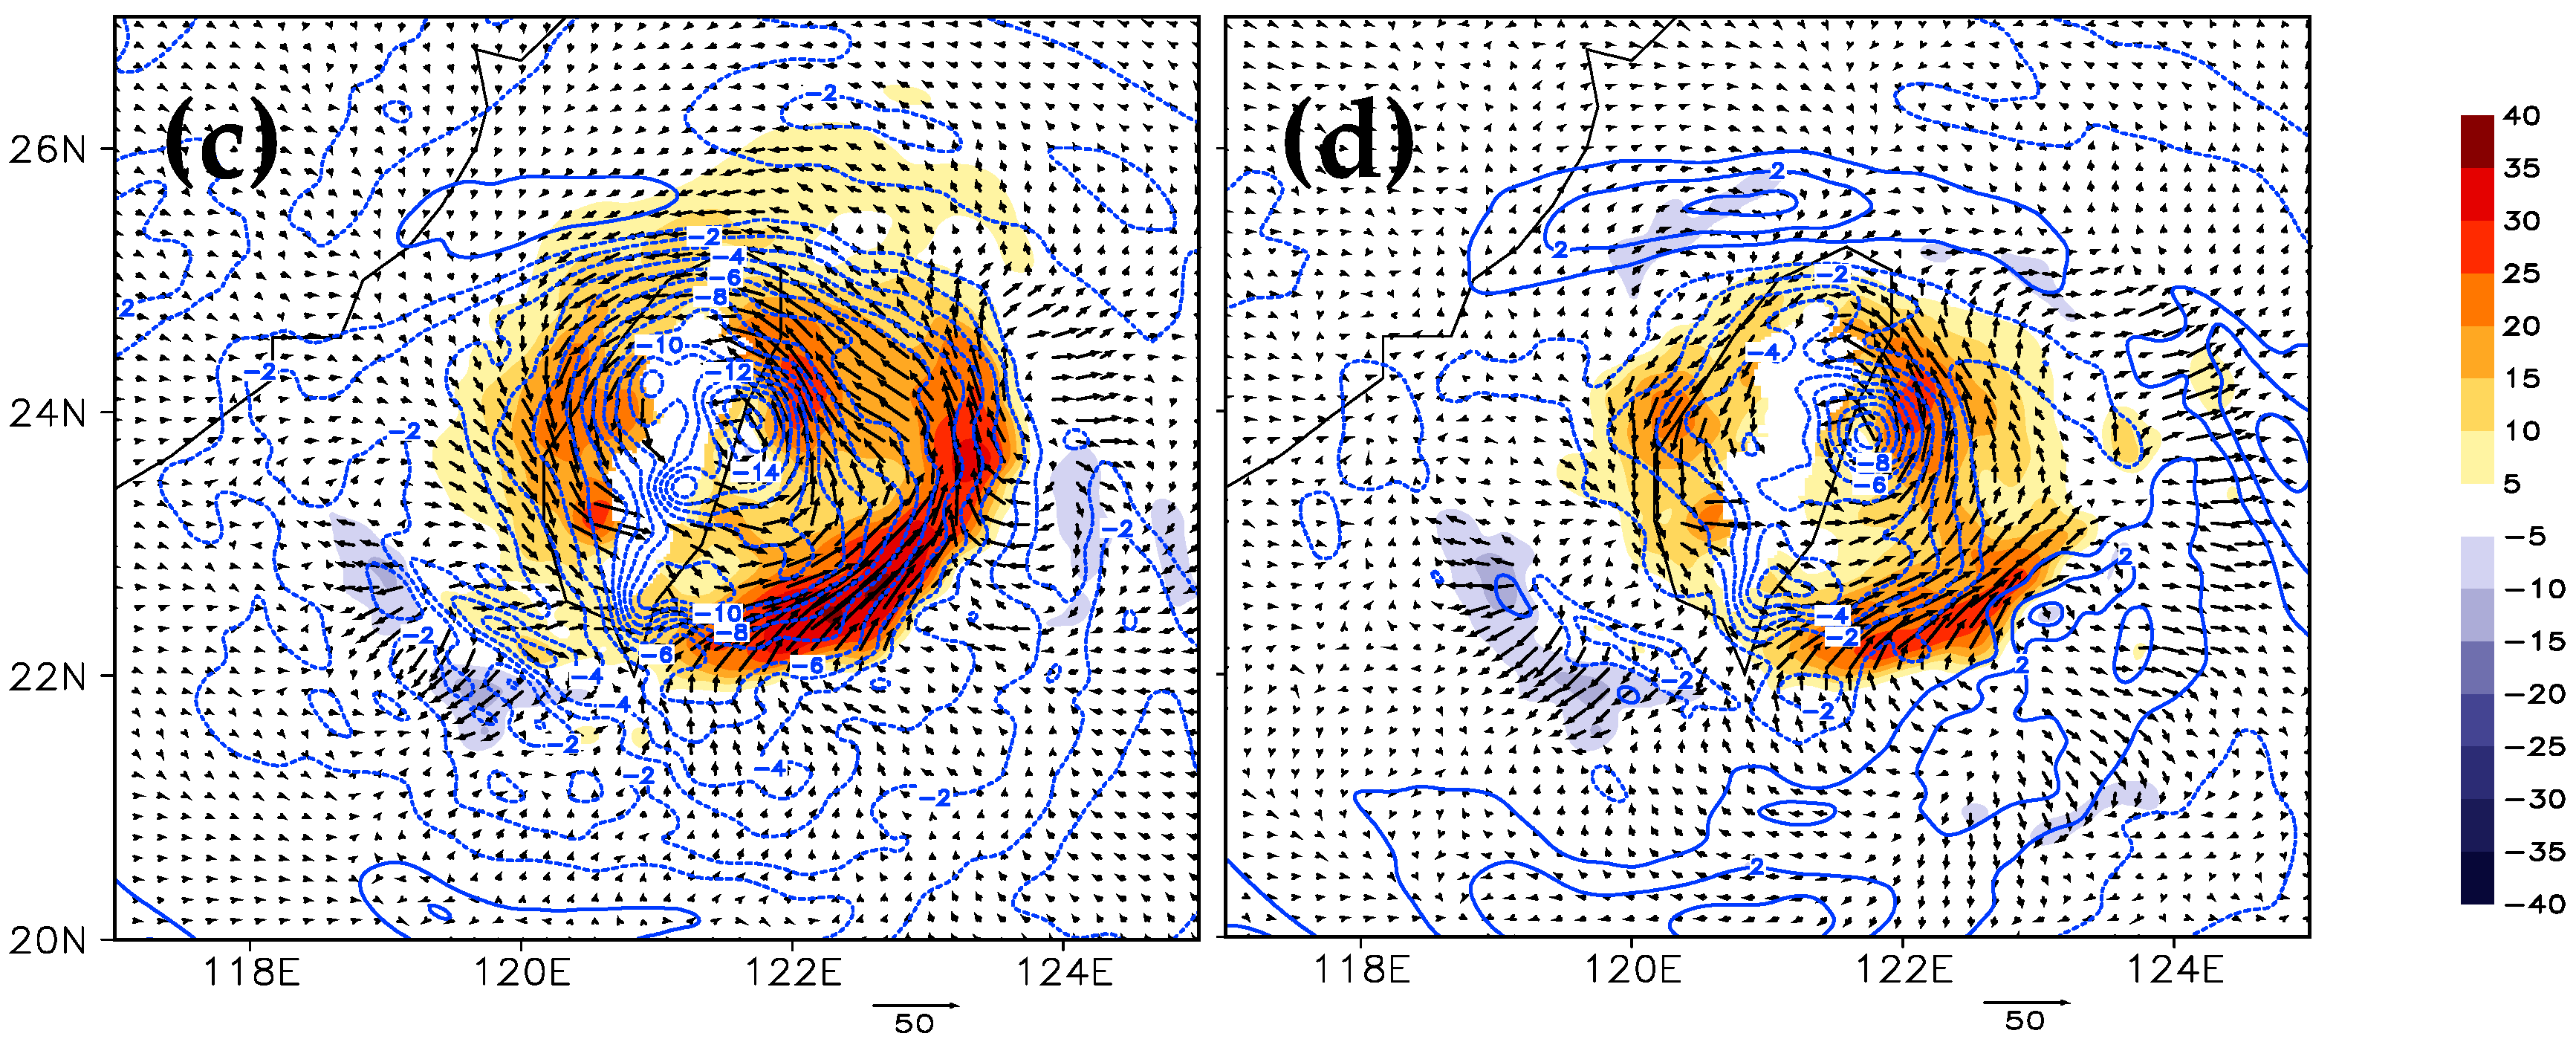
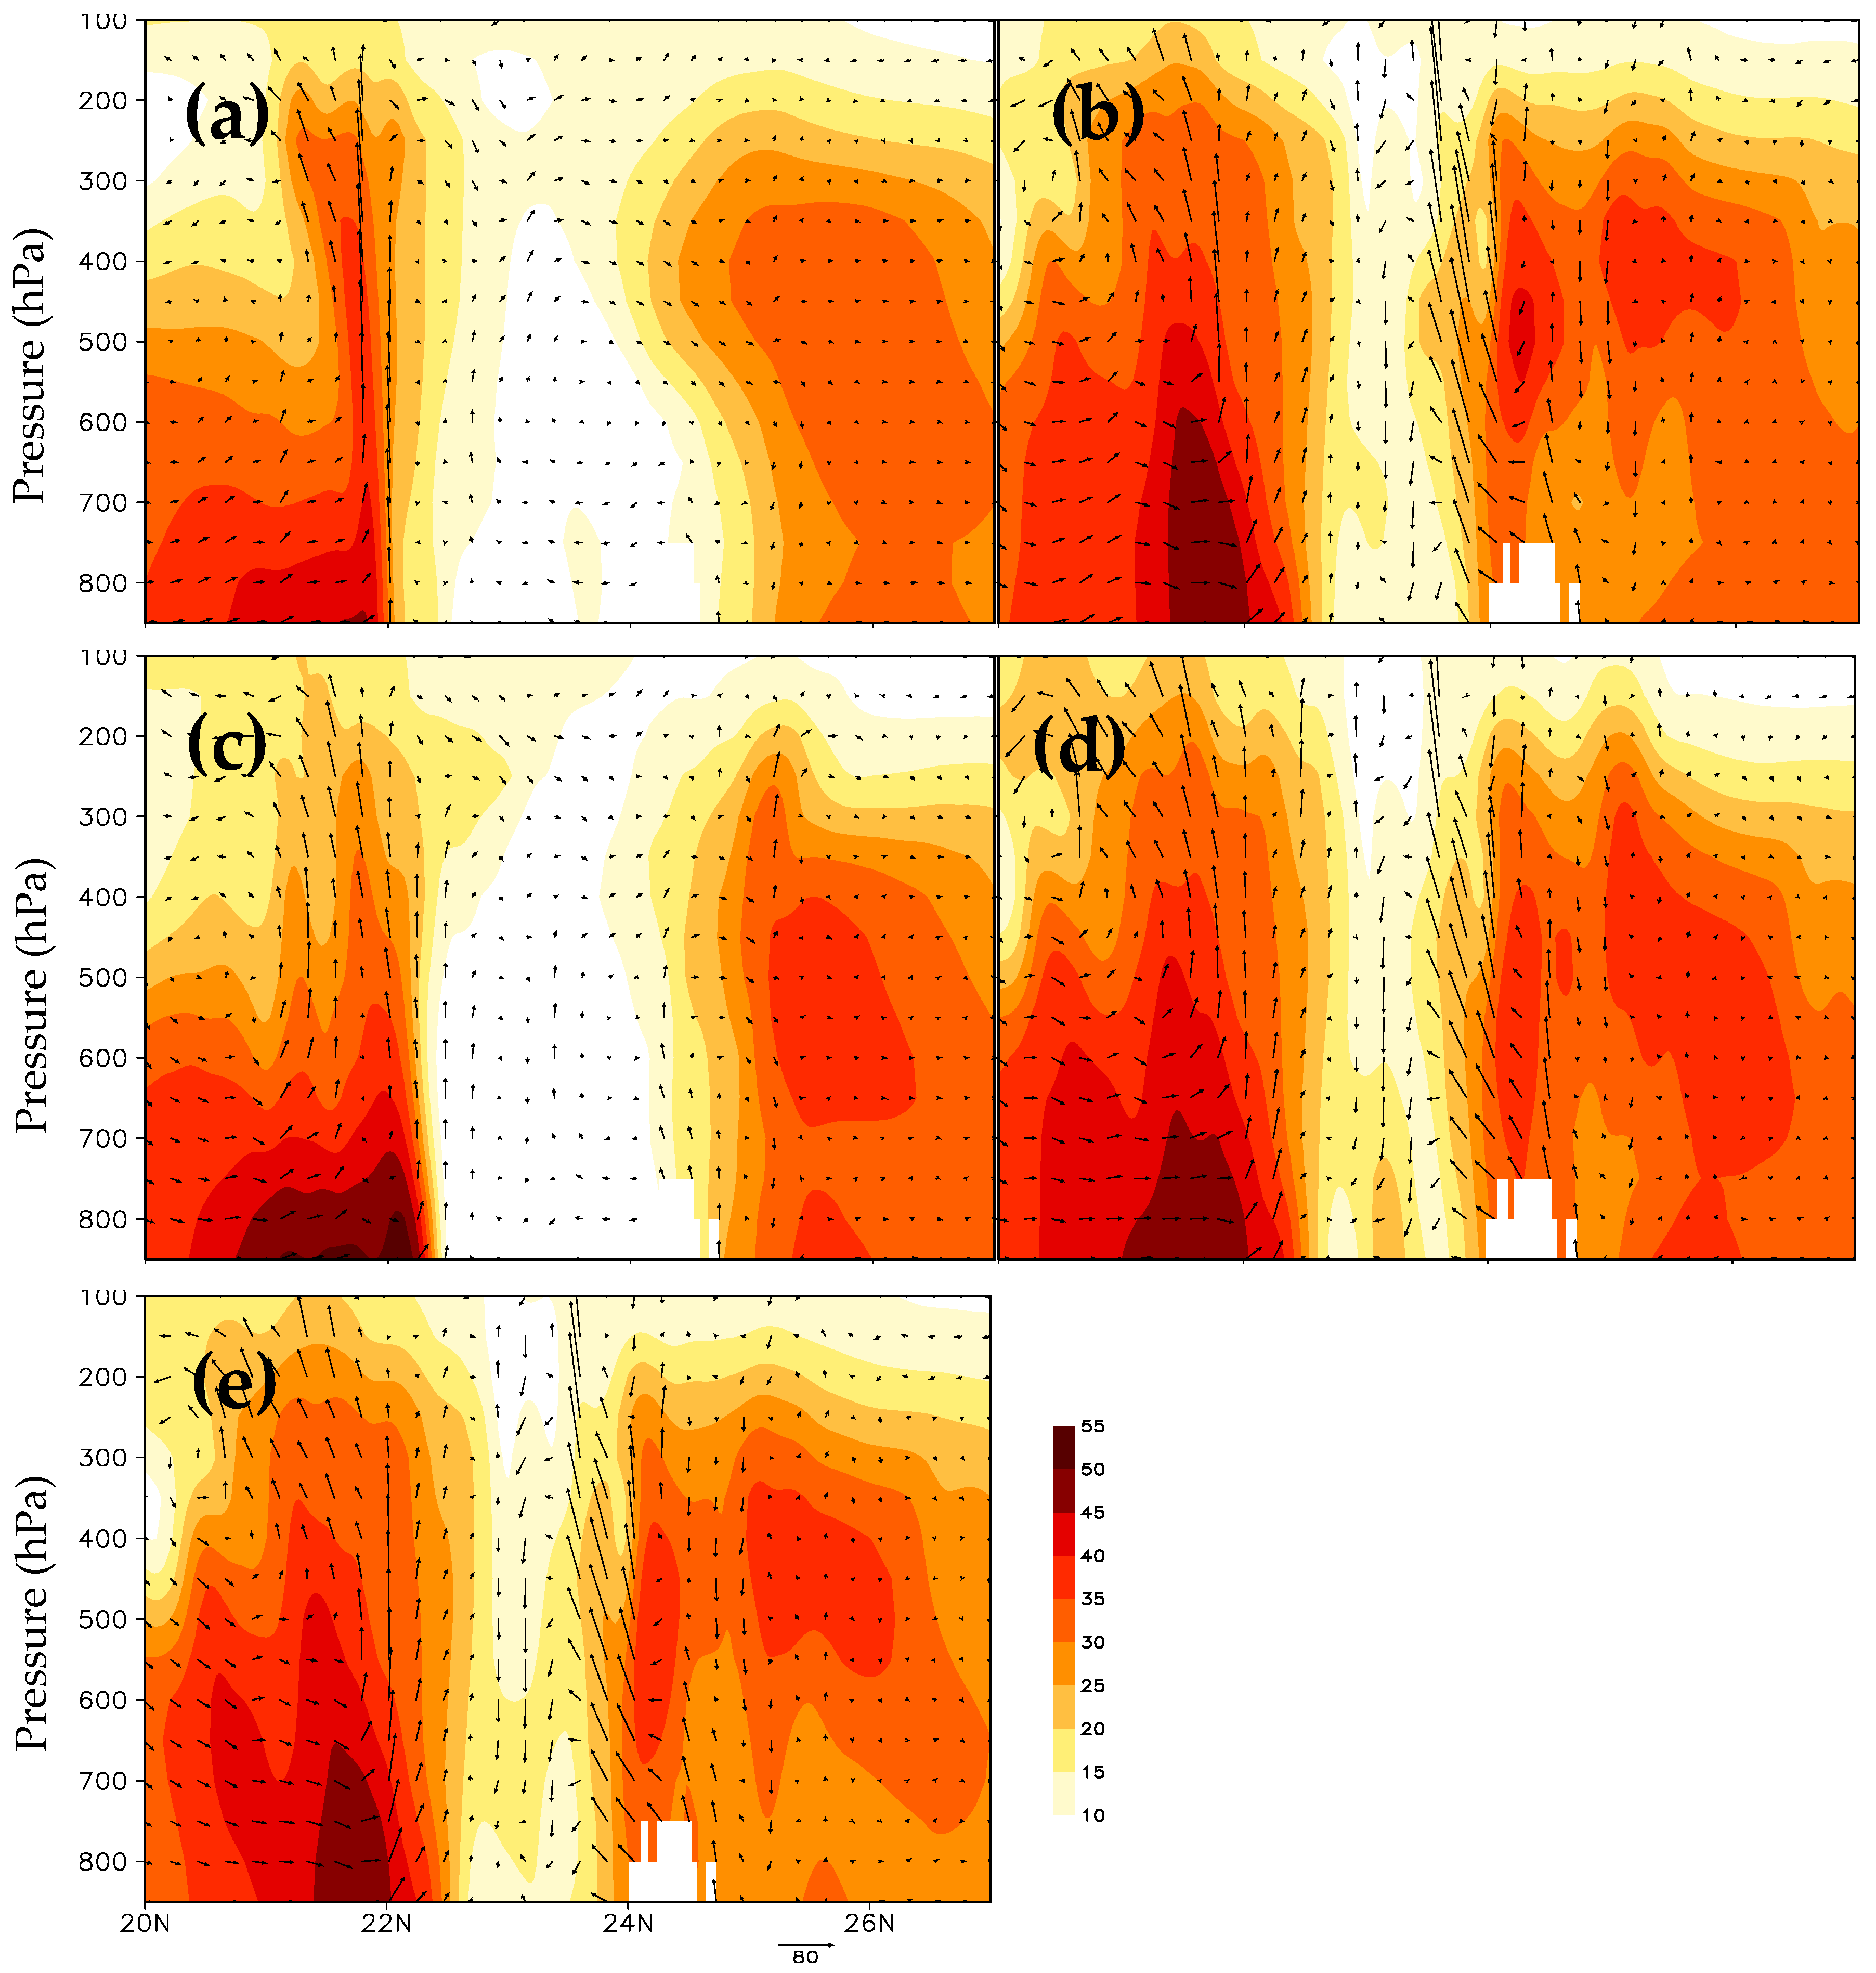
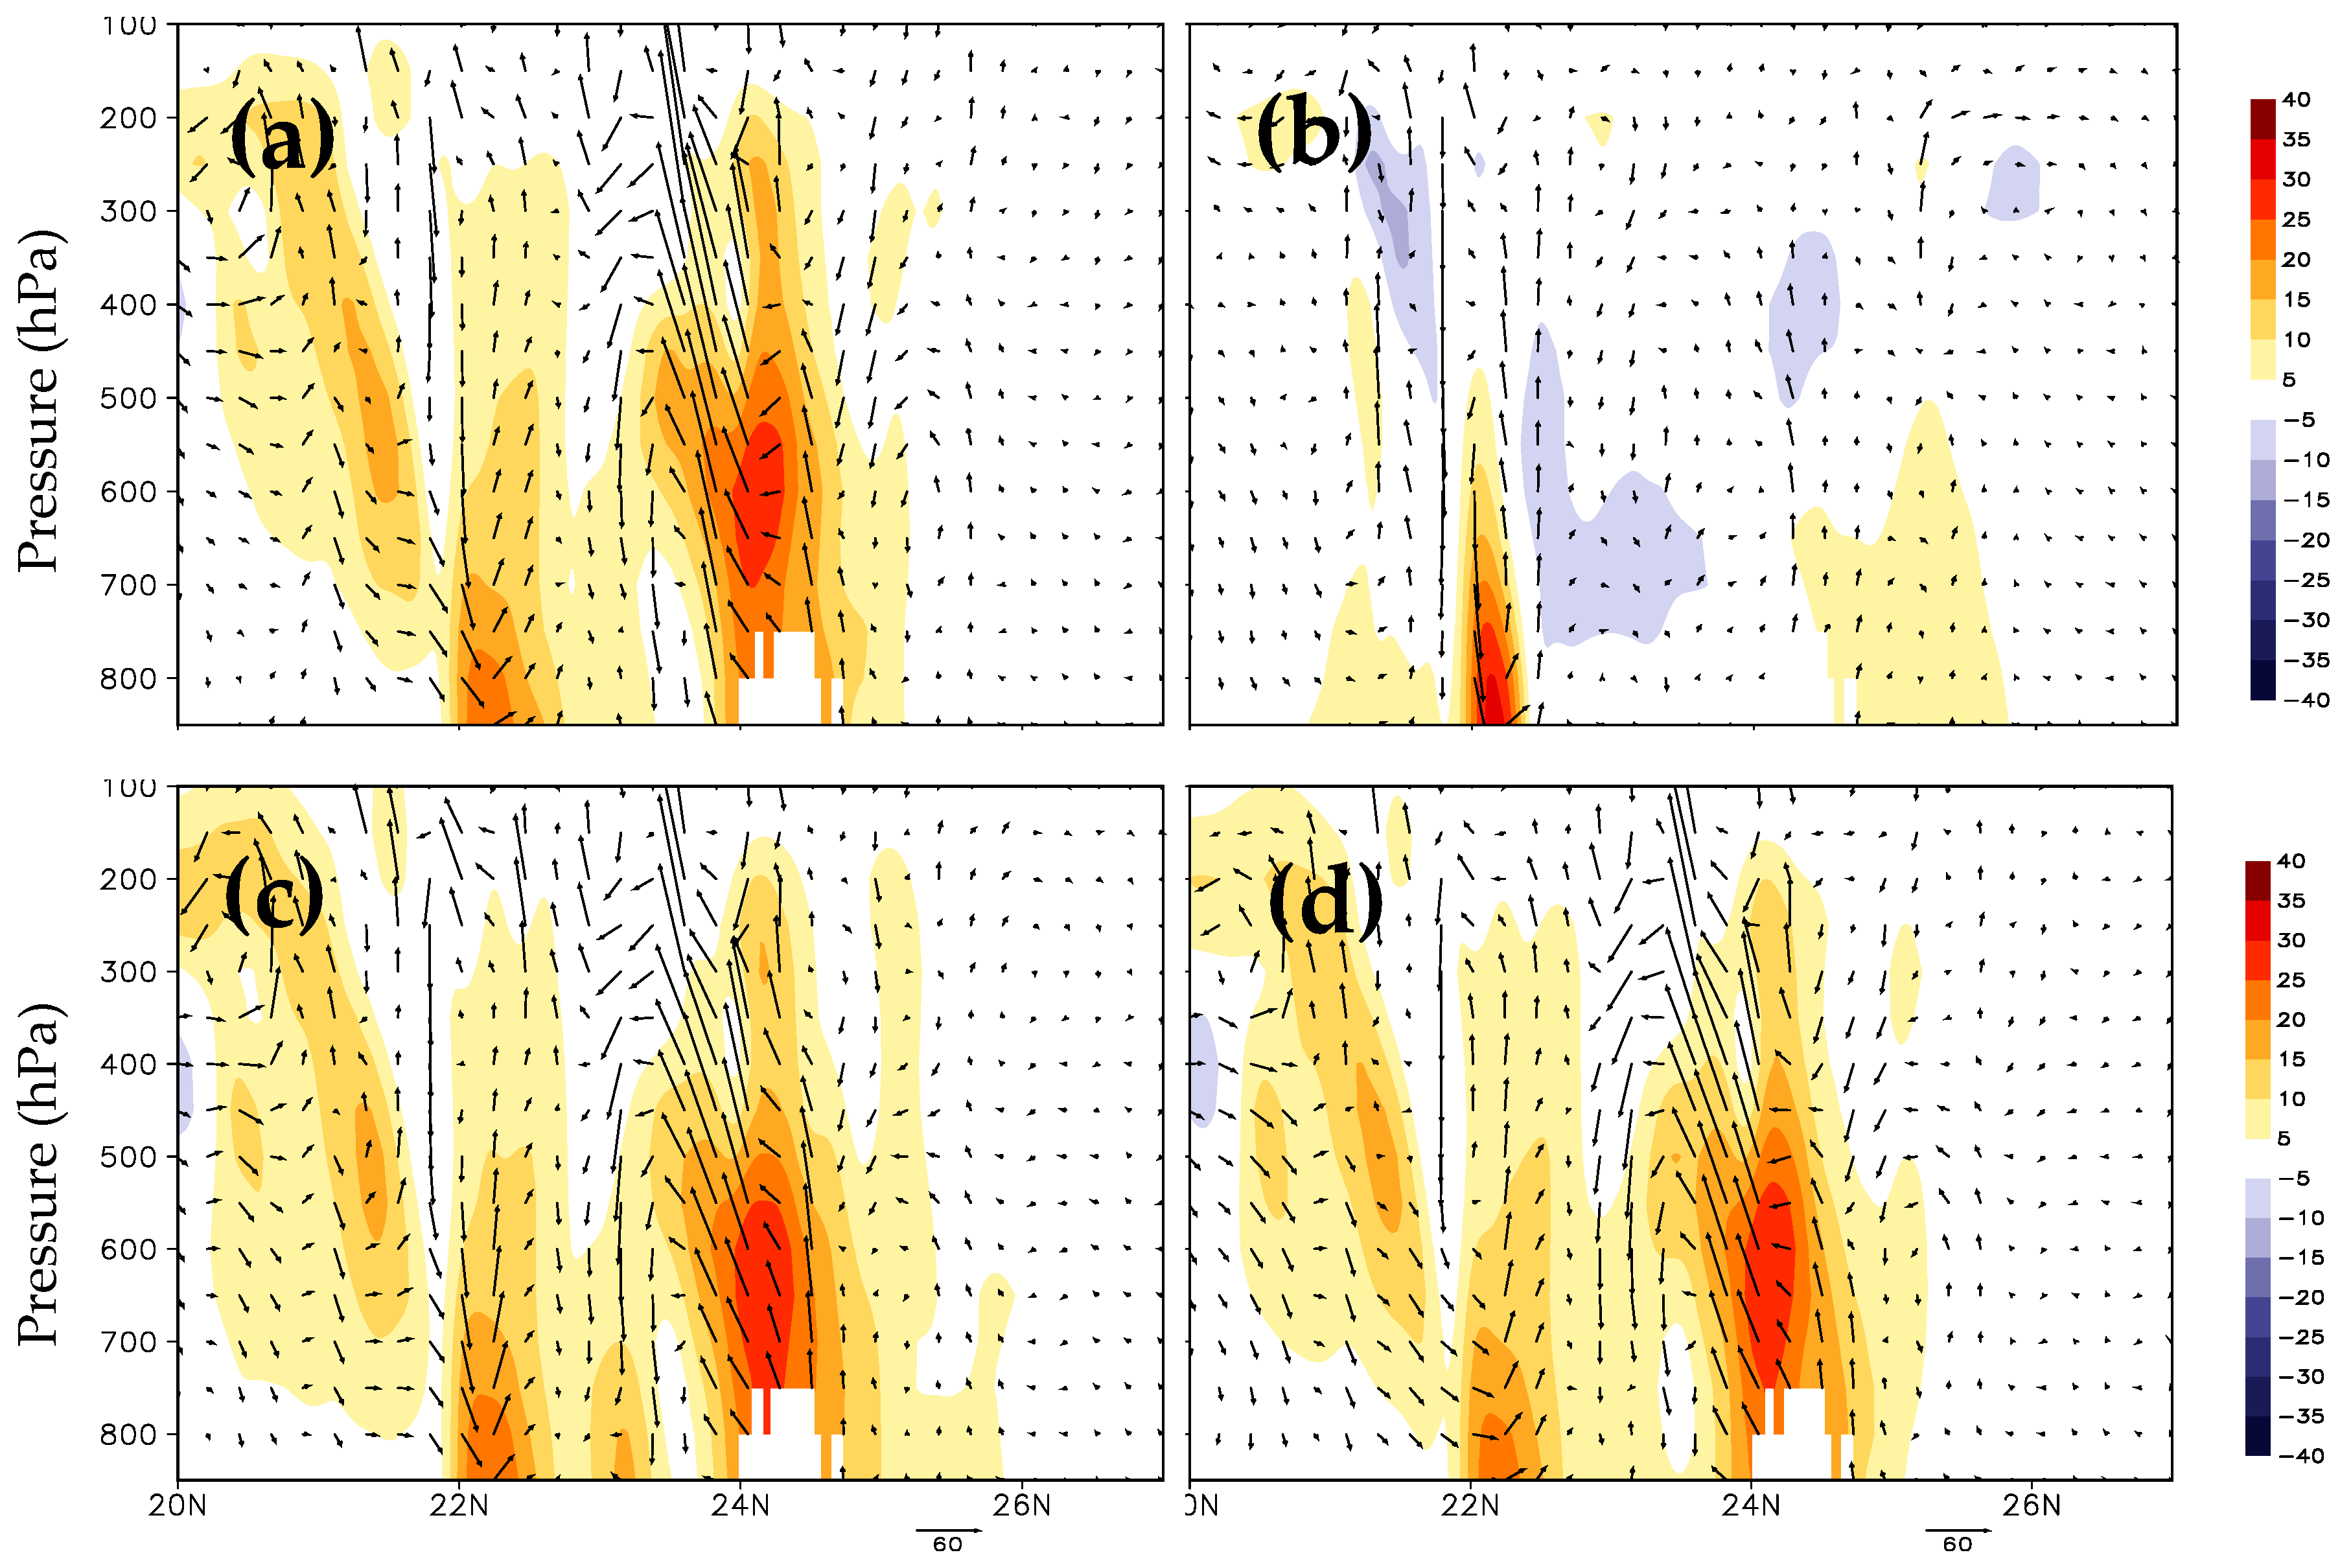
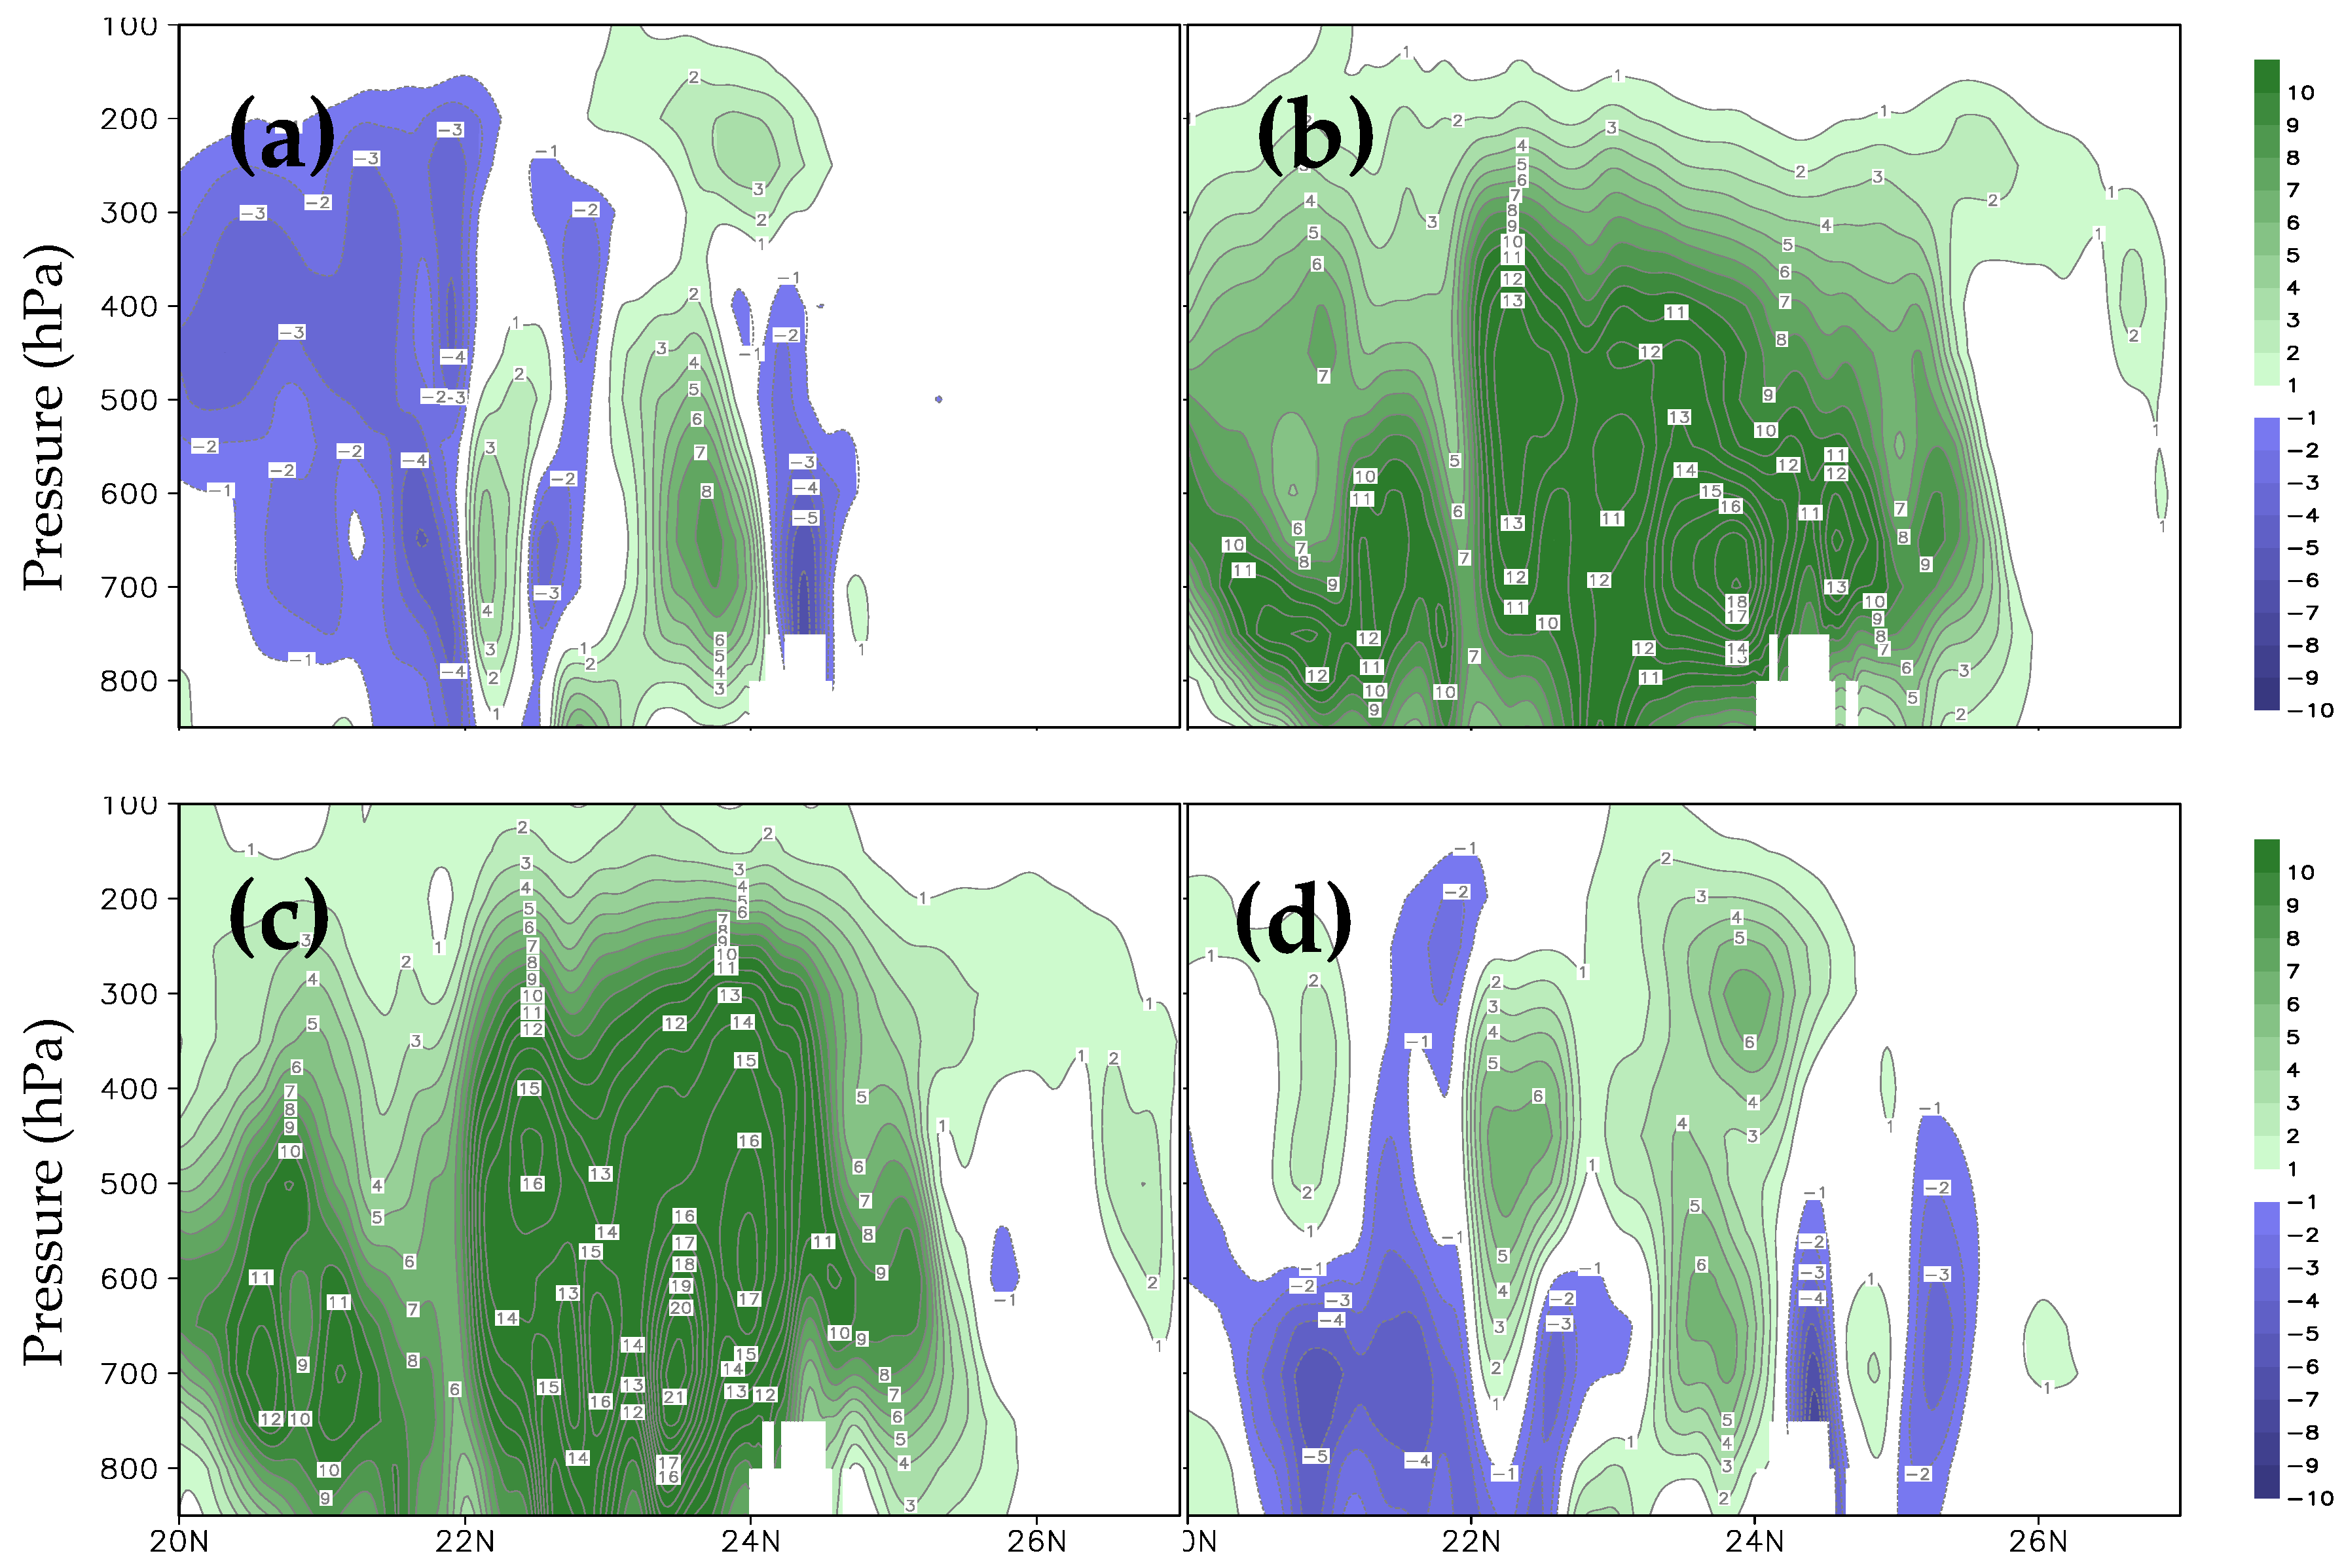
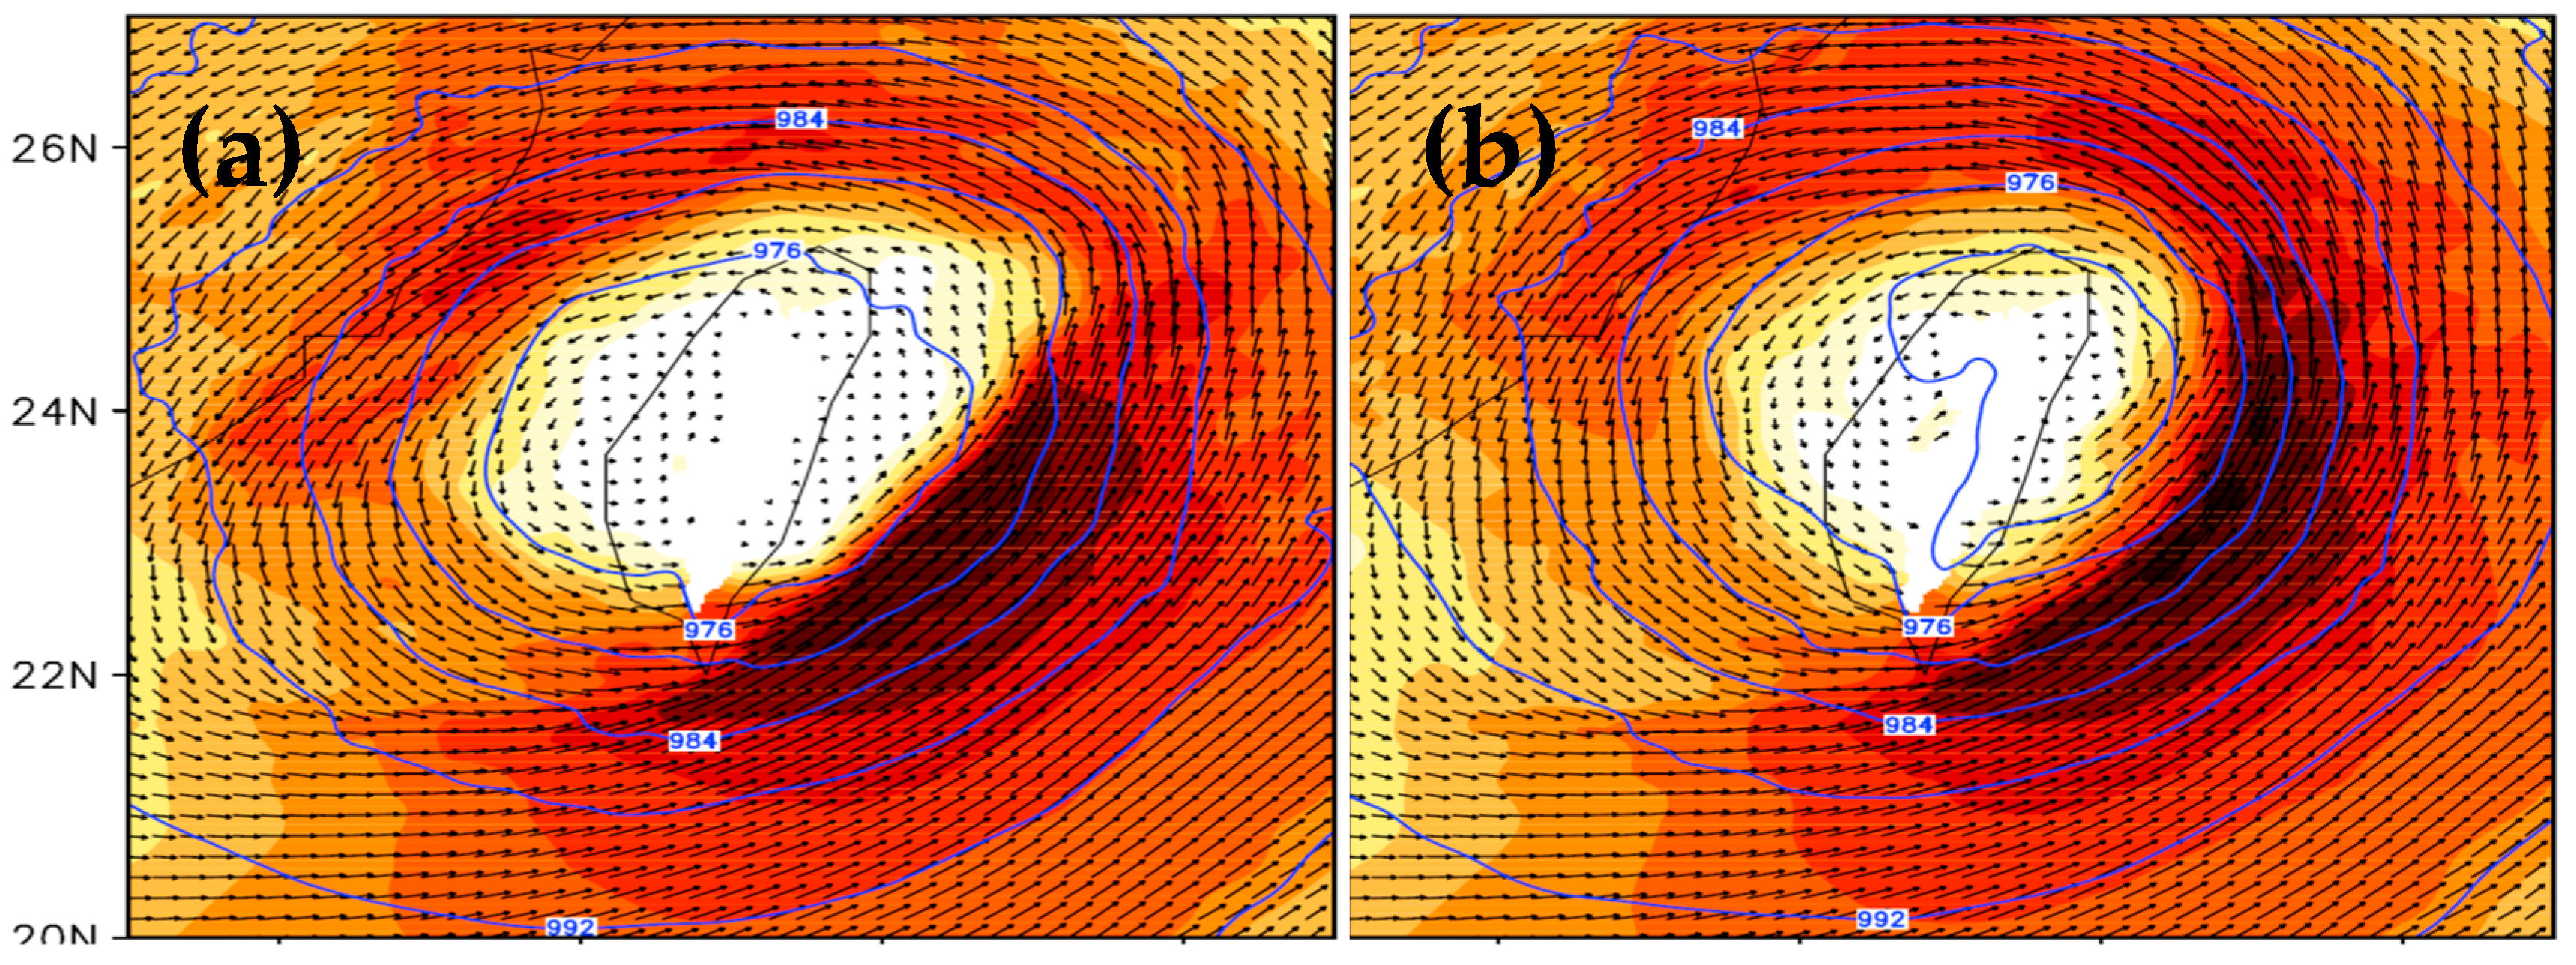
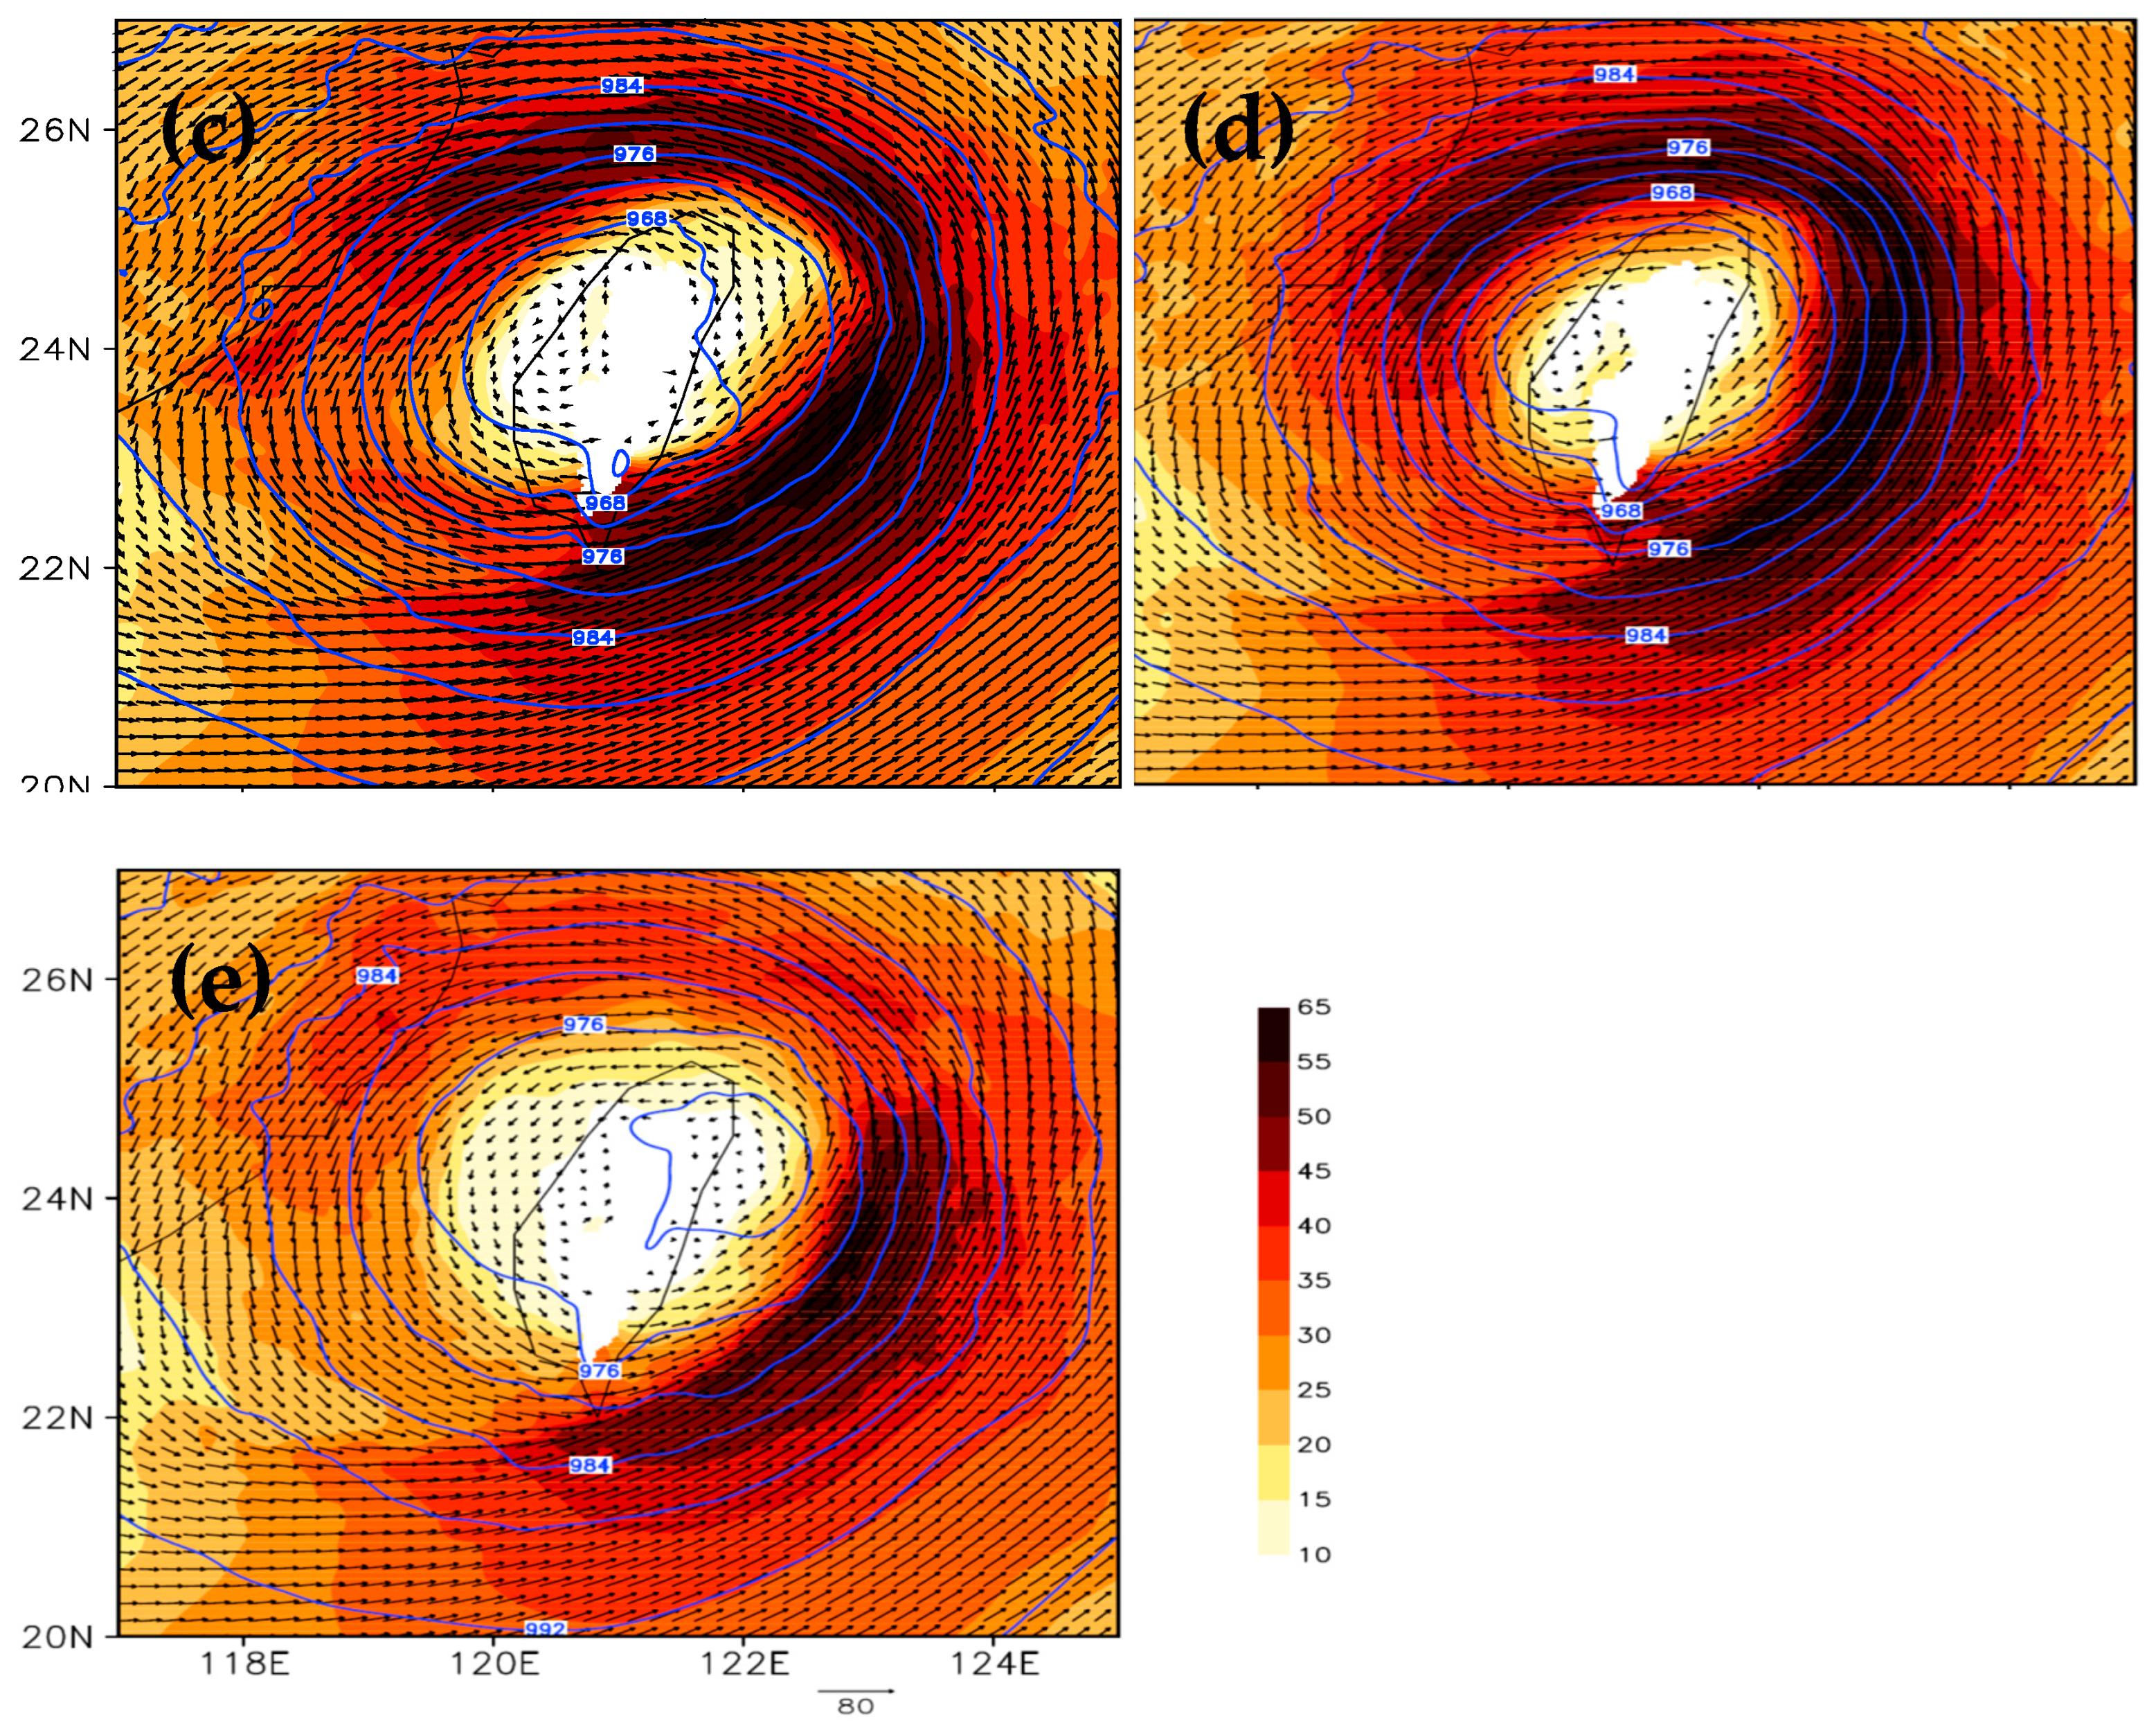
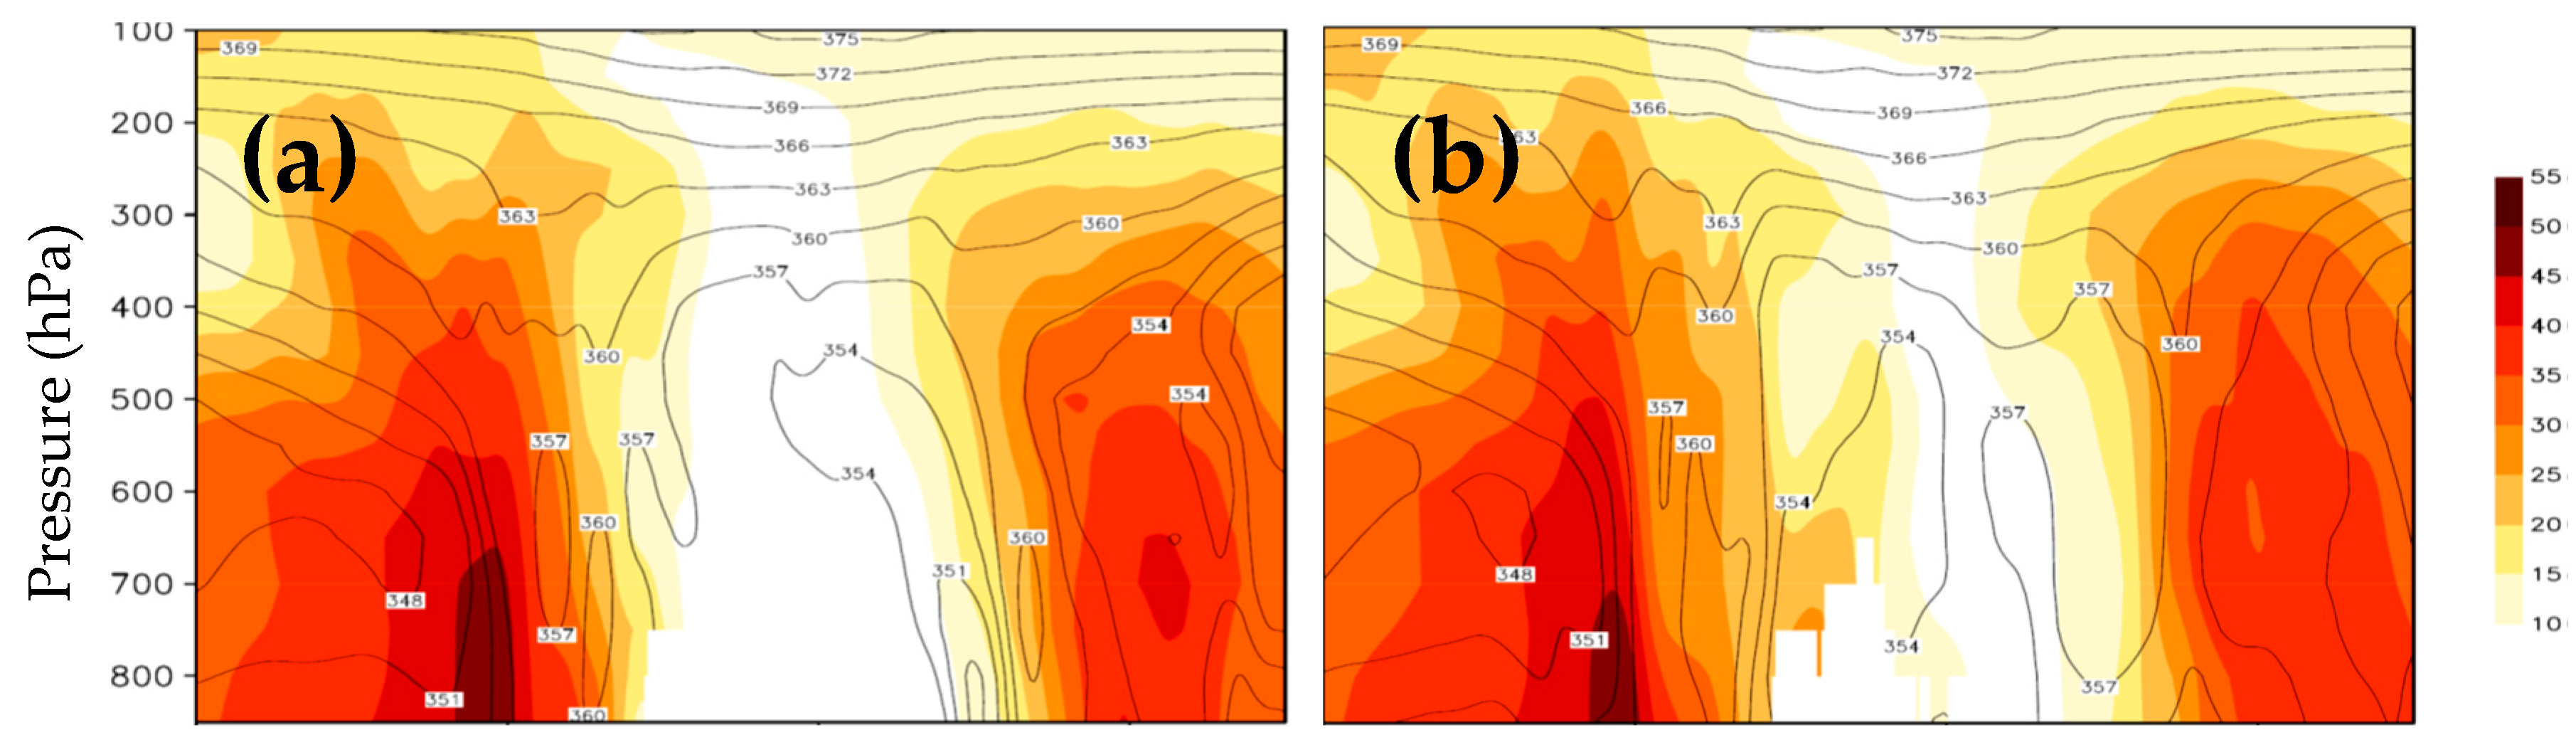
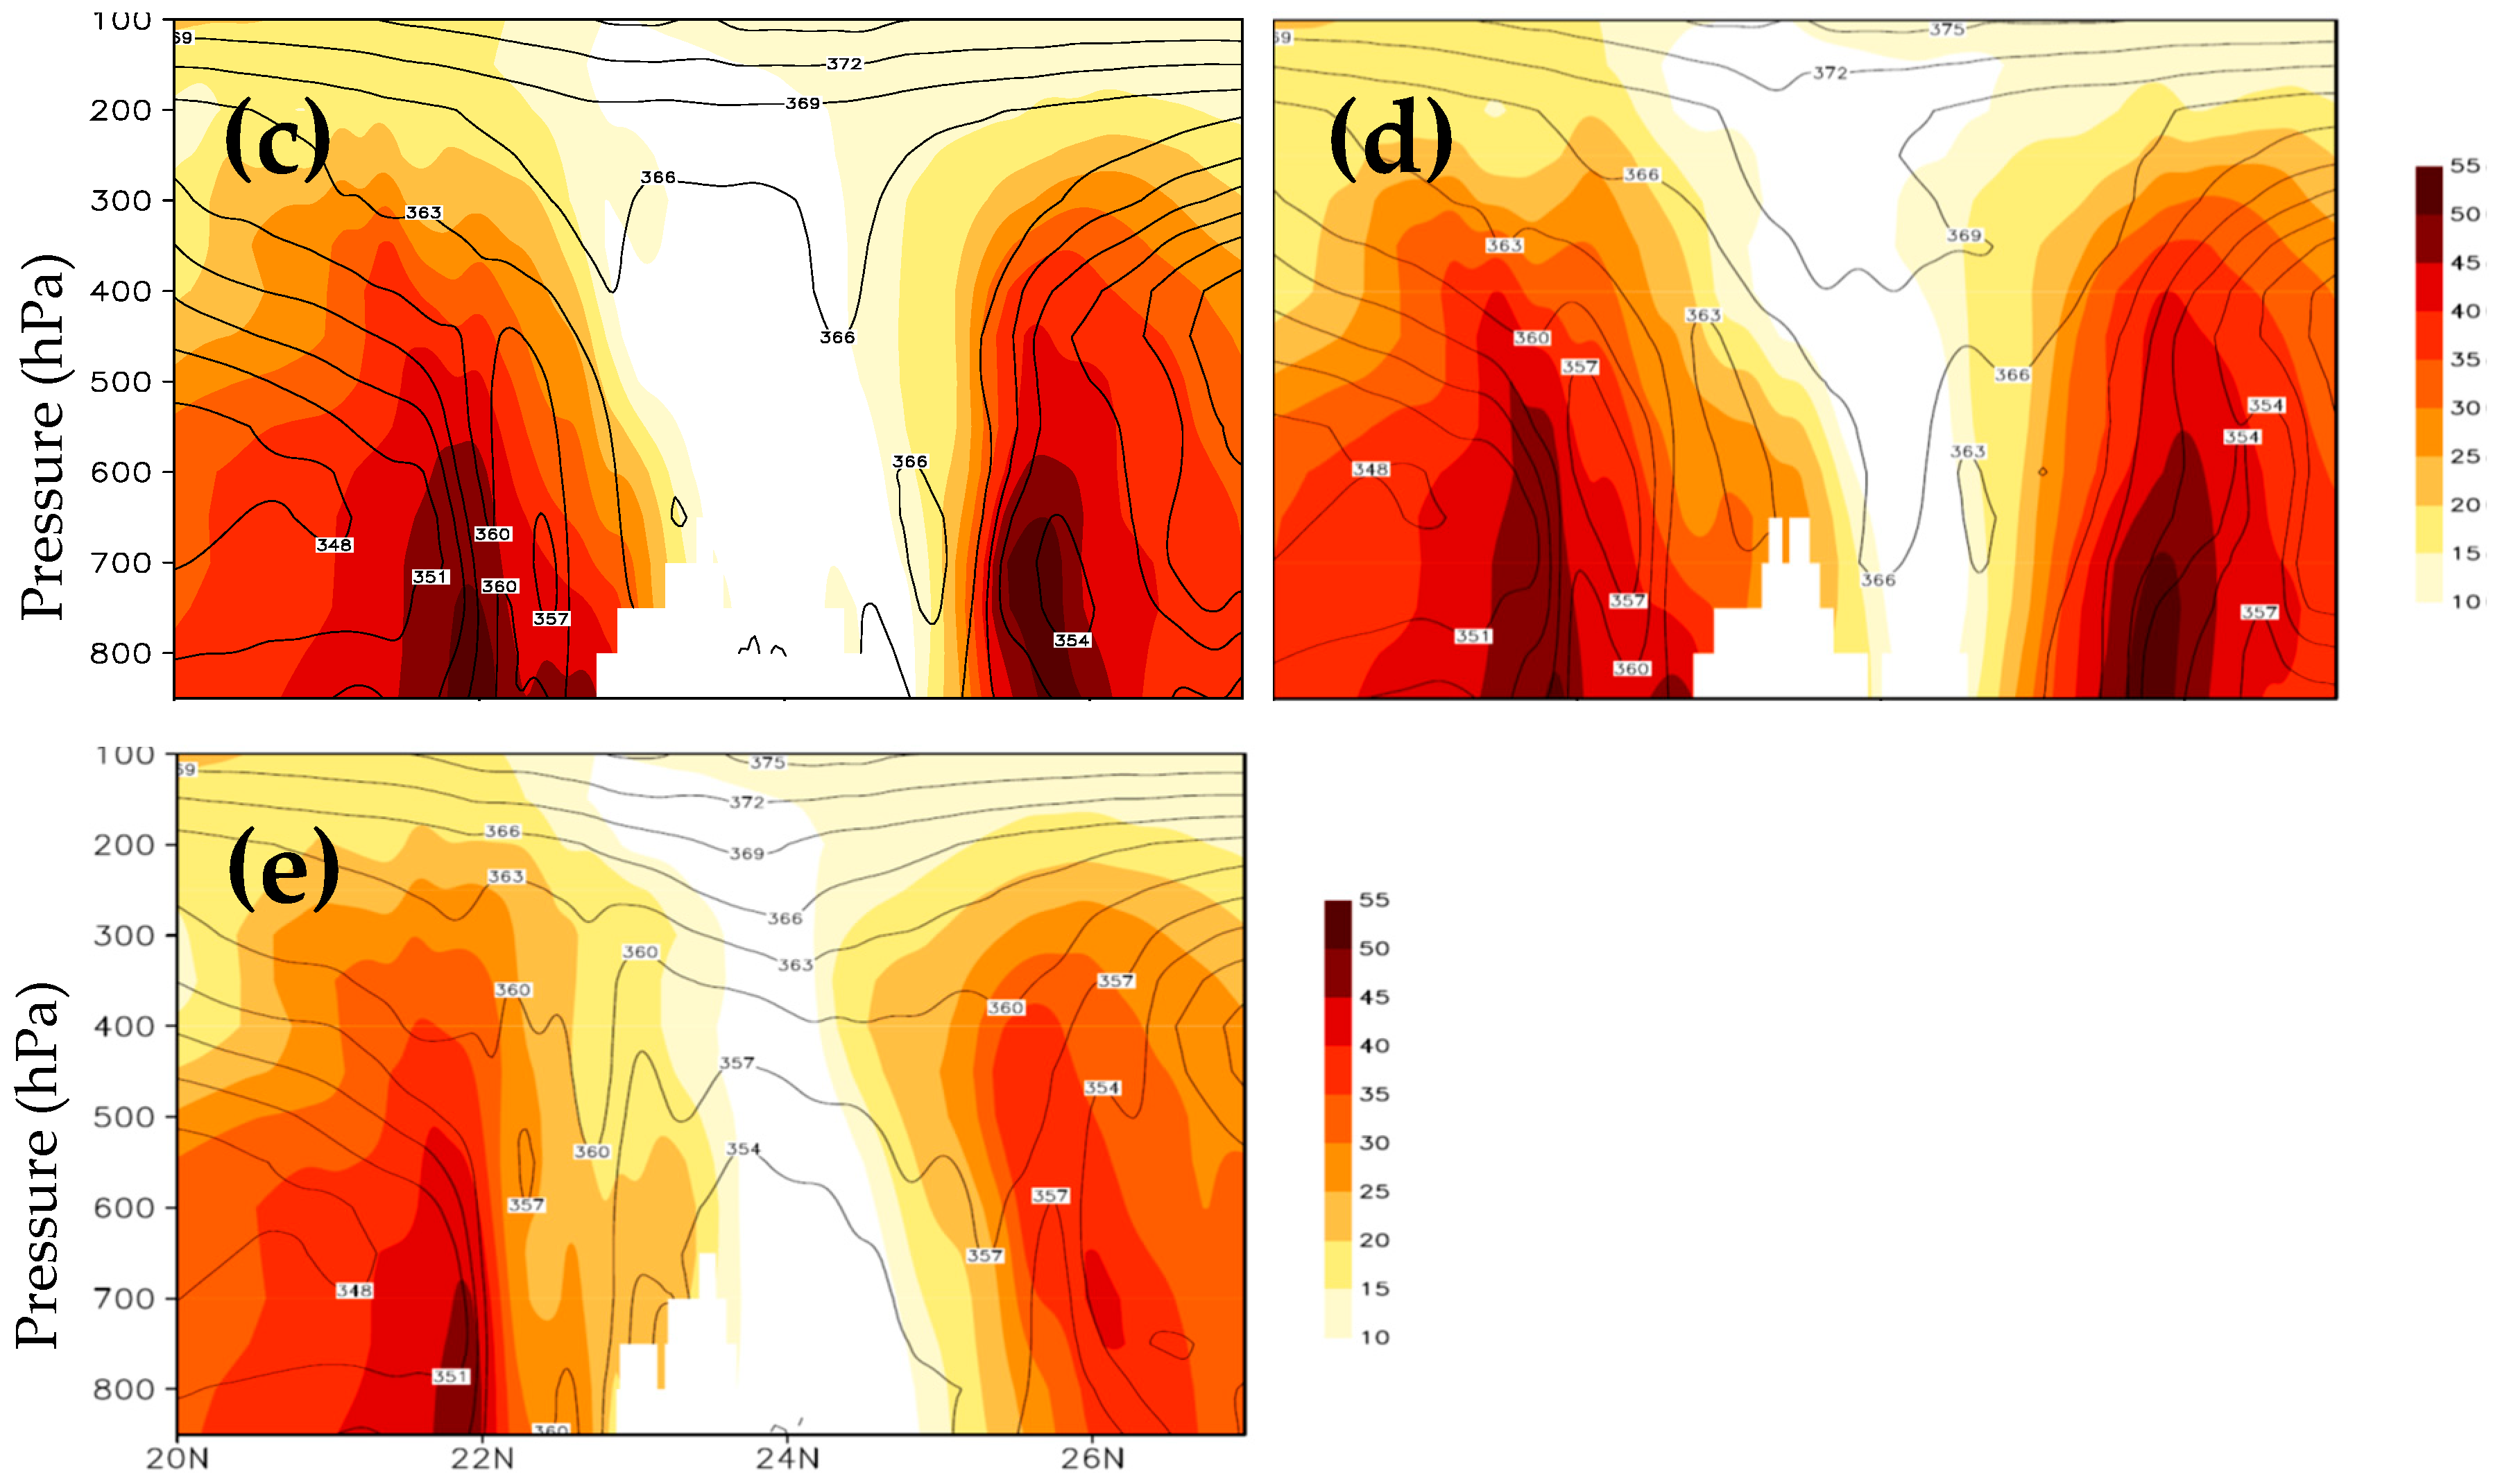
5.4. Hurricane Structure

This section is devoted to demonstrating how assimilation affects the forecasting of typhoon structure. The SLP and 850 hPa wind of all experiments at 2100 UTC 7 August are presented in Figure 15. The SLPs in the five experiments showed quite different patterns. Although all of the SLPs in the sensitive experiments were not close to the observation (965 hPa), the assimilation resulted in a better SLP forecast than CNTL. The differences of the predicted wind among all the experiments were explicit. CNTL, ExpVr, and ExpAllNqv produced a strong wind speed band in the southeastern eye wall. ExpZ and ExpAll enhanced the horizontal wind speed in the eye wall and made the strong wind band compacter and tighter in the southeastern, northeastern, and northwestern quadrants around the typhoon vortex. The wind structure in ExpZ and ExpAll presented a smaller diameter of the inner core than that of CNTL, ExpVr, and ExpAllNqv, in which the inner core of CNTL was the weakest.
The cross sections of equivalent potential temperature and horizontal wind speed along 21oE at 2100 UTC 7 August are shown in Figure 16. Consistent with the results shown in Figure 15, the inner core was effectively reduced in the four sensitive experiments. CNTL, with the background of GFS analysis, cannot enhance the fine structures of the inner core. In ExpAll, there was an inner core showing a front-like structure with a vertical-plume, high-value surface of equivalent potential temperature stretching downward. In addition, after the assimilation of radial wind and reflectivity with the specific humidity adjustment, ExpAll gave rise to an outward slope of wind speed surface and a further increase in intensity in the southern and northern eye walls.

5.5. Typhoon Track and Intensity

The typhoon track and intensity of the five experiments are presented in Figure 17. There is an initial track position departure of 40 km in CNTL. The initial track positions in ExpVr, ExpZ, ExpAll, and ExpAllNqv were adjusted closer to the position of the best track. In the subsequent forecast, all experiments were biased to the west of the best track, but the four sensitive experiments had less track error than CNTL. ExpAll followed the best track until 2100 UTC 7 August and then turned to the west of the best track at 0000 UTC 8 August.
Compared to CNTL, ExpVr and ExpAllNqv made little improvement in central sea level pressure (CSLP) and MSWP predictions, although the predicted CSLP was still not as intense as the observation.
The assimilation with the specific humidity adjustment (ExpAll) led to a deeper CSLP. The CSLP error of ExpAll reduced from 6 hPa at 1500 UTC 7 August to −1 hPa at 1800 UTC, and then further reduced to −7 hPa at 0000 UTC 8 August. It indicates that the assimilation with the specific humidity adjustment effectively decreased the CSLP. So it seems logical that the periodical intermittent assimilation with the specific humidity adjustment was essential for properly initializing the rapidly intensifying typhoon. The sensitive experiments, especially ExpAll, showed an improvement in MSW prediction due to the assimilation after Morakot landed on Taiwan Island at 1800 UTC 7 August. CNTL, ExpVr, ExpZ, and ExpAllNqv produced a weaker MSWP than the observation, while the MSWP in ExpAll was stronger and closer to the observation during 1800 UTC–2100 UTC 7 August. It was obvious that the current correlation between CSLP and MSW was relatively weak in ExpAll.
The above verification revealed that the assimilation of radar data benefited the prediction of typhoon track and intensity. The differences in CSLP and MSWP between ExpAll and ExpAllNqv implied that the increments in the dynamical and thermodynamic fields in the vortex produced by the assimilation with the specific humidity adjustment resulted in correspondingly low-pressure and strong wind speed responses. CSLP and MSWP were influenced by prompting the water substance conversion of microphysical processes and lateral heat release.

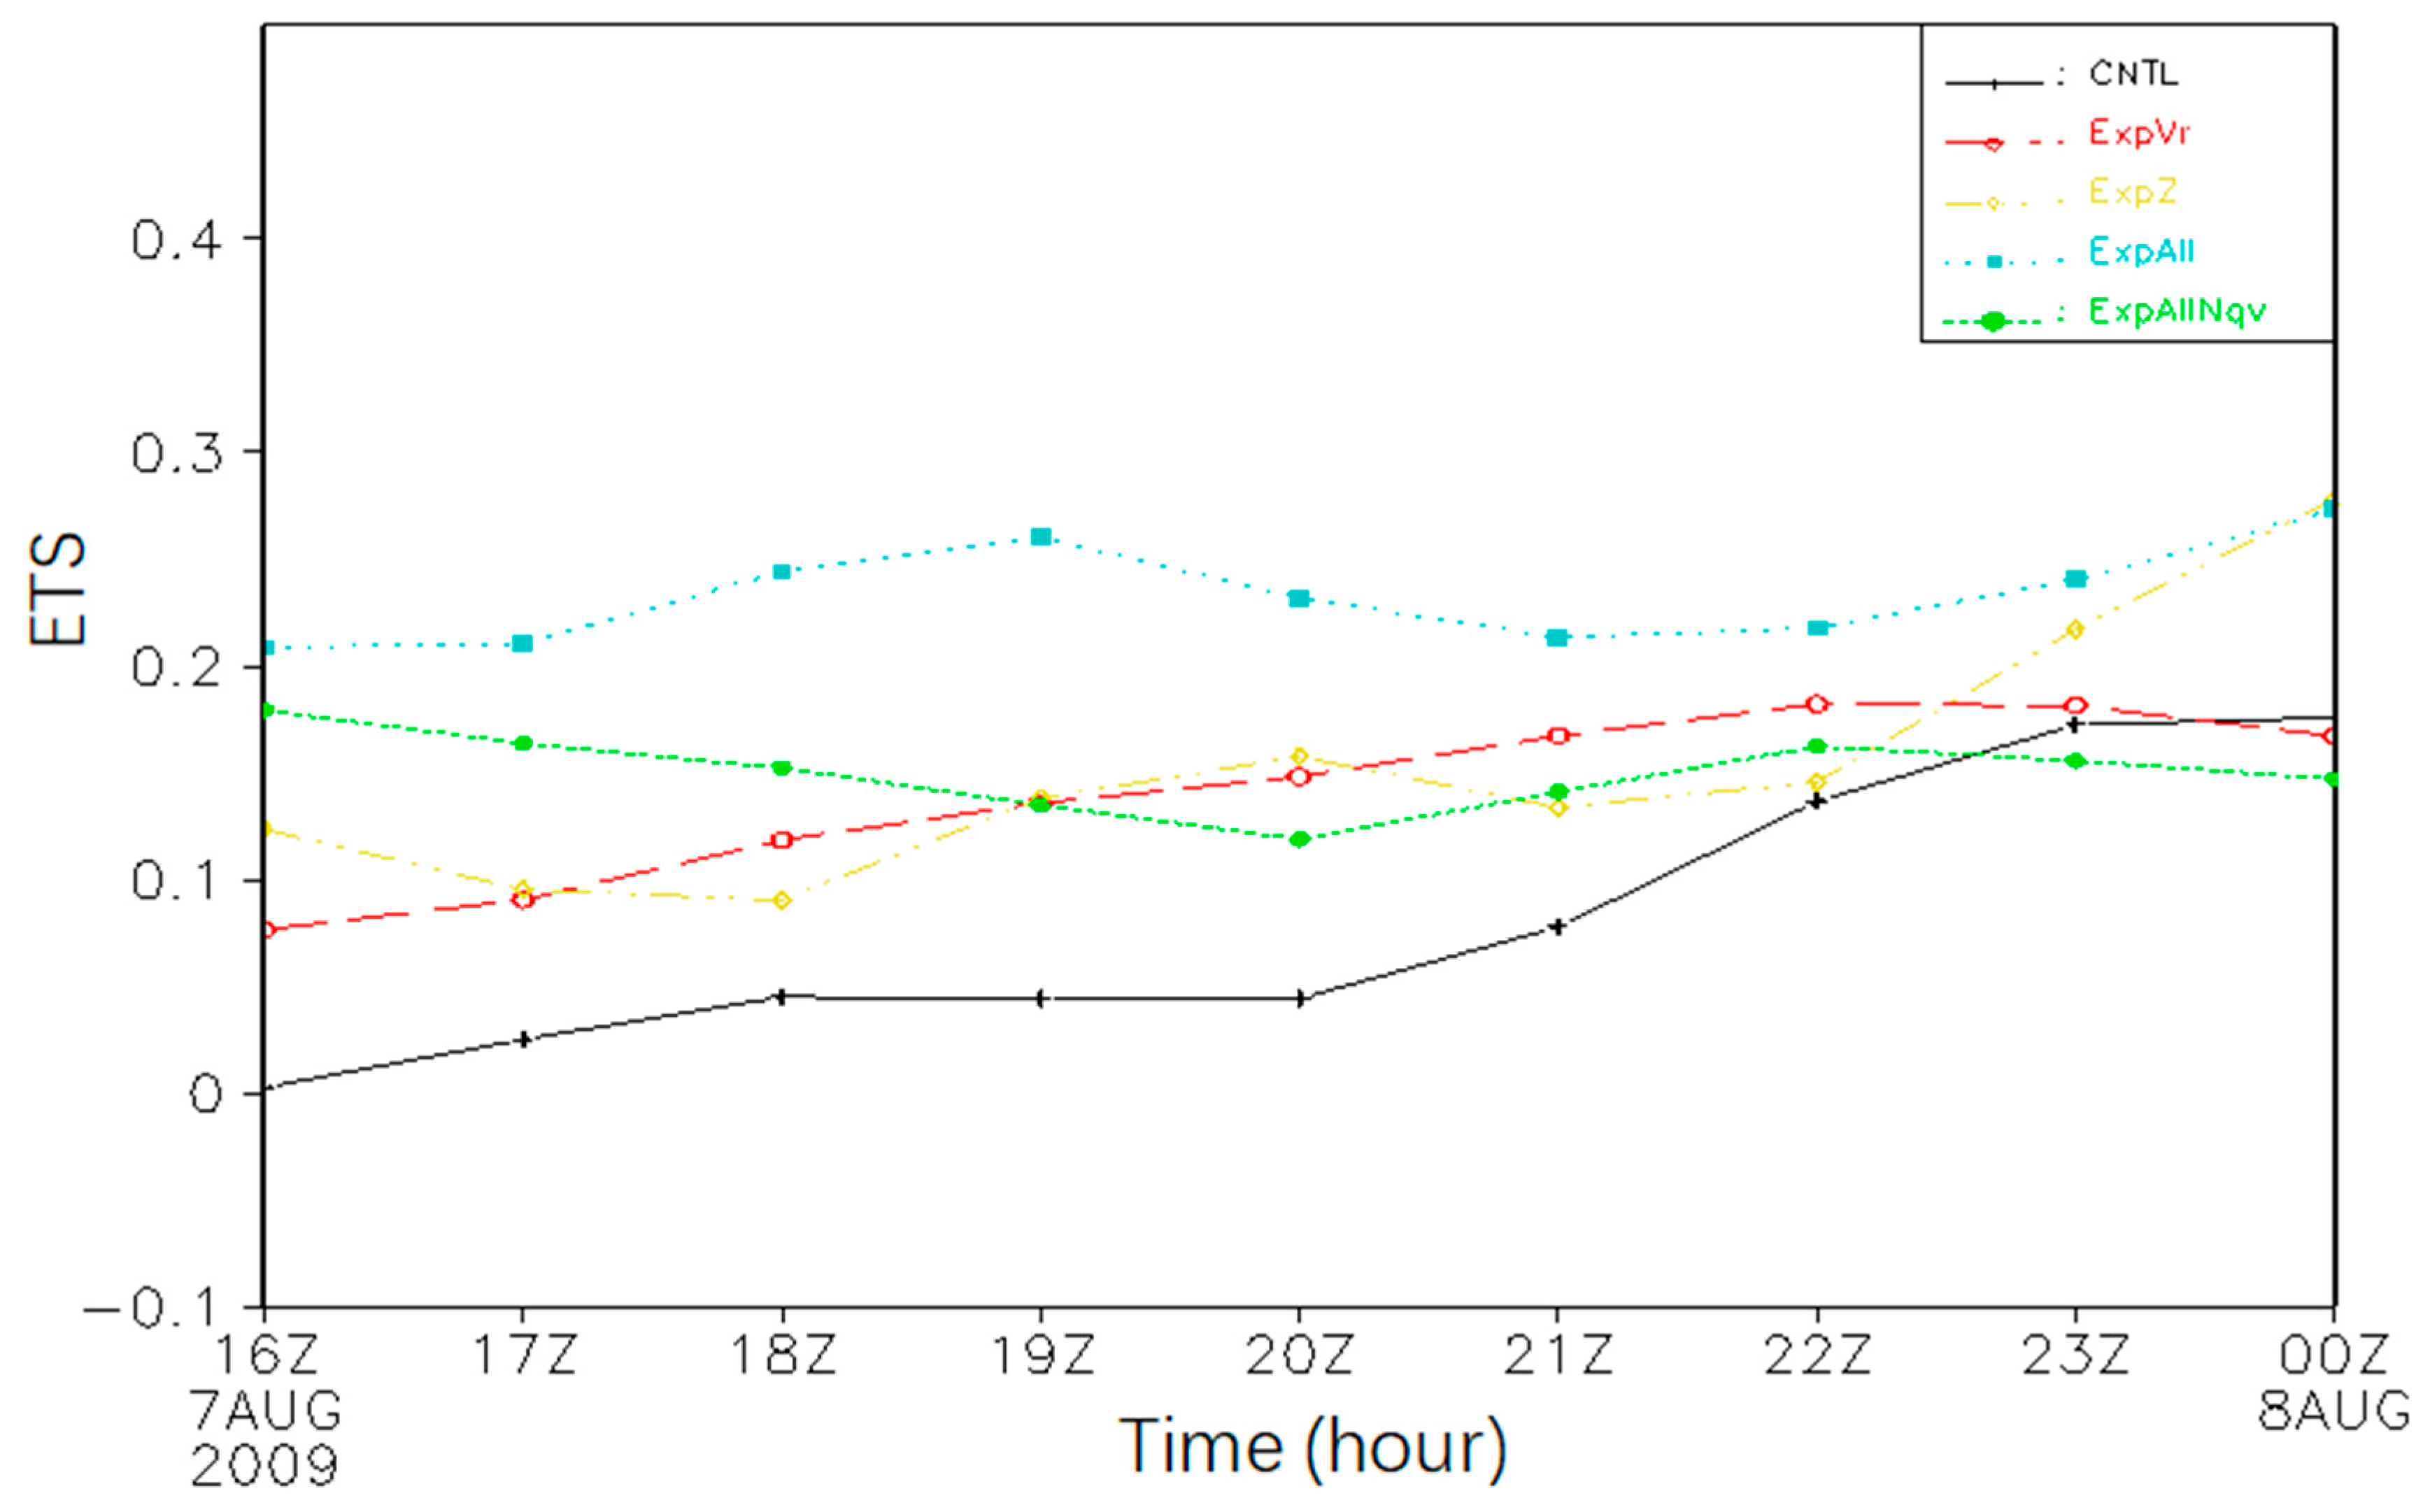
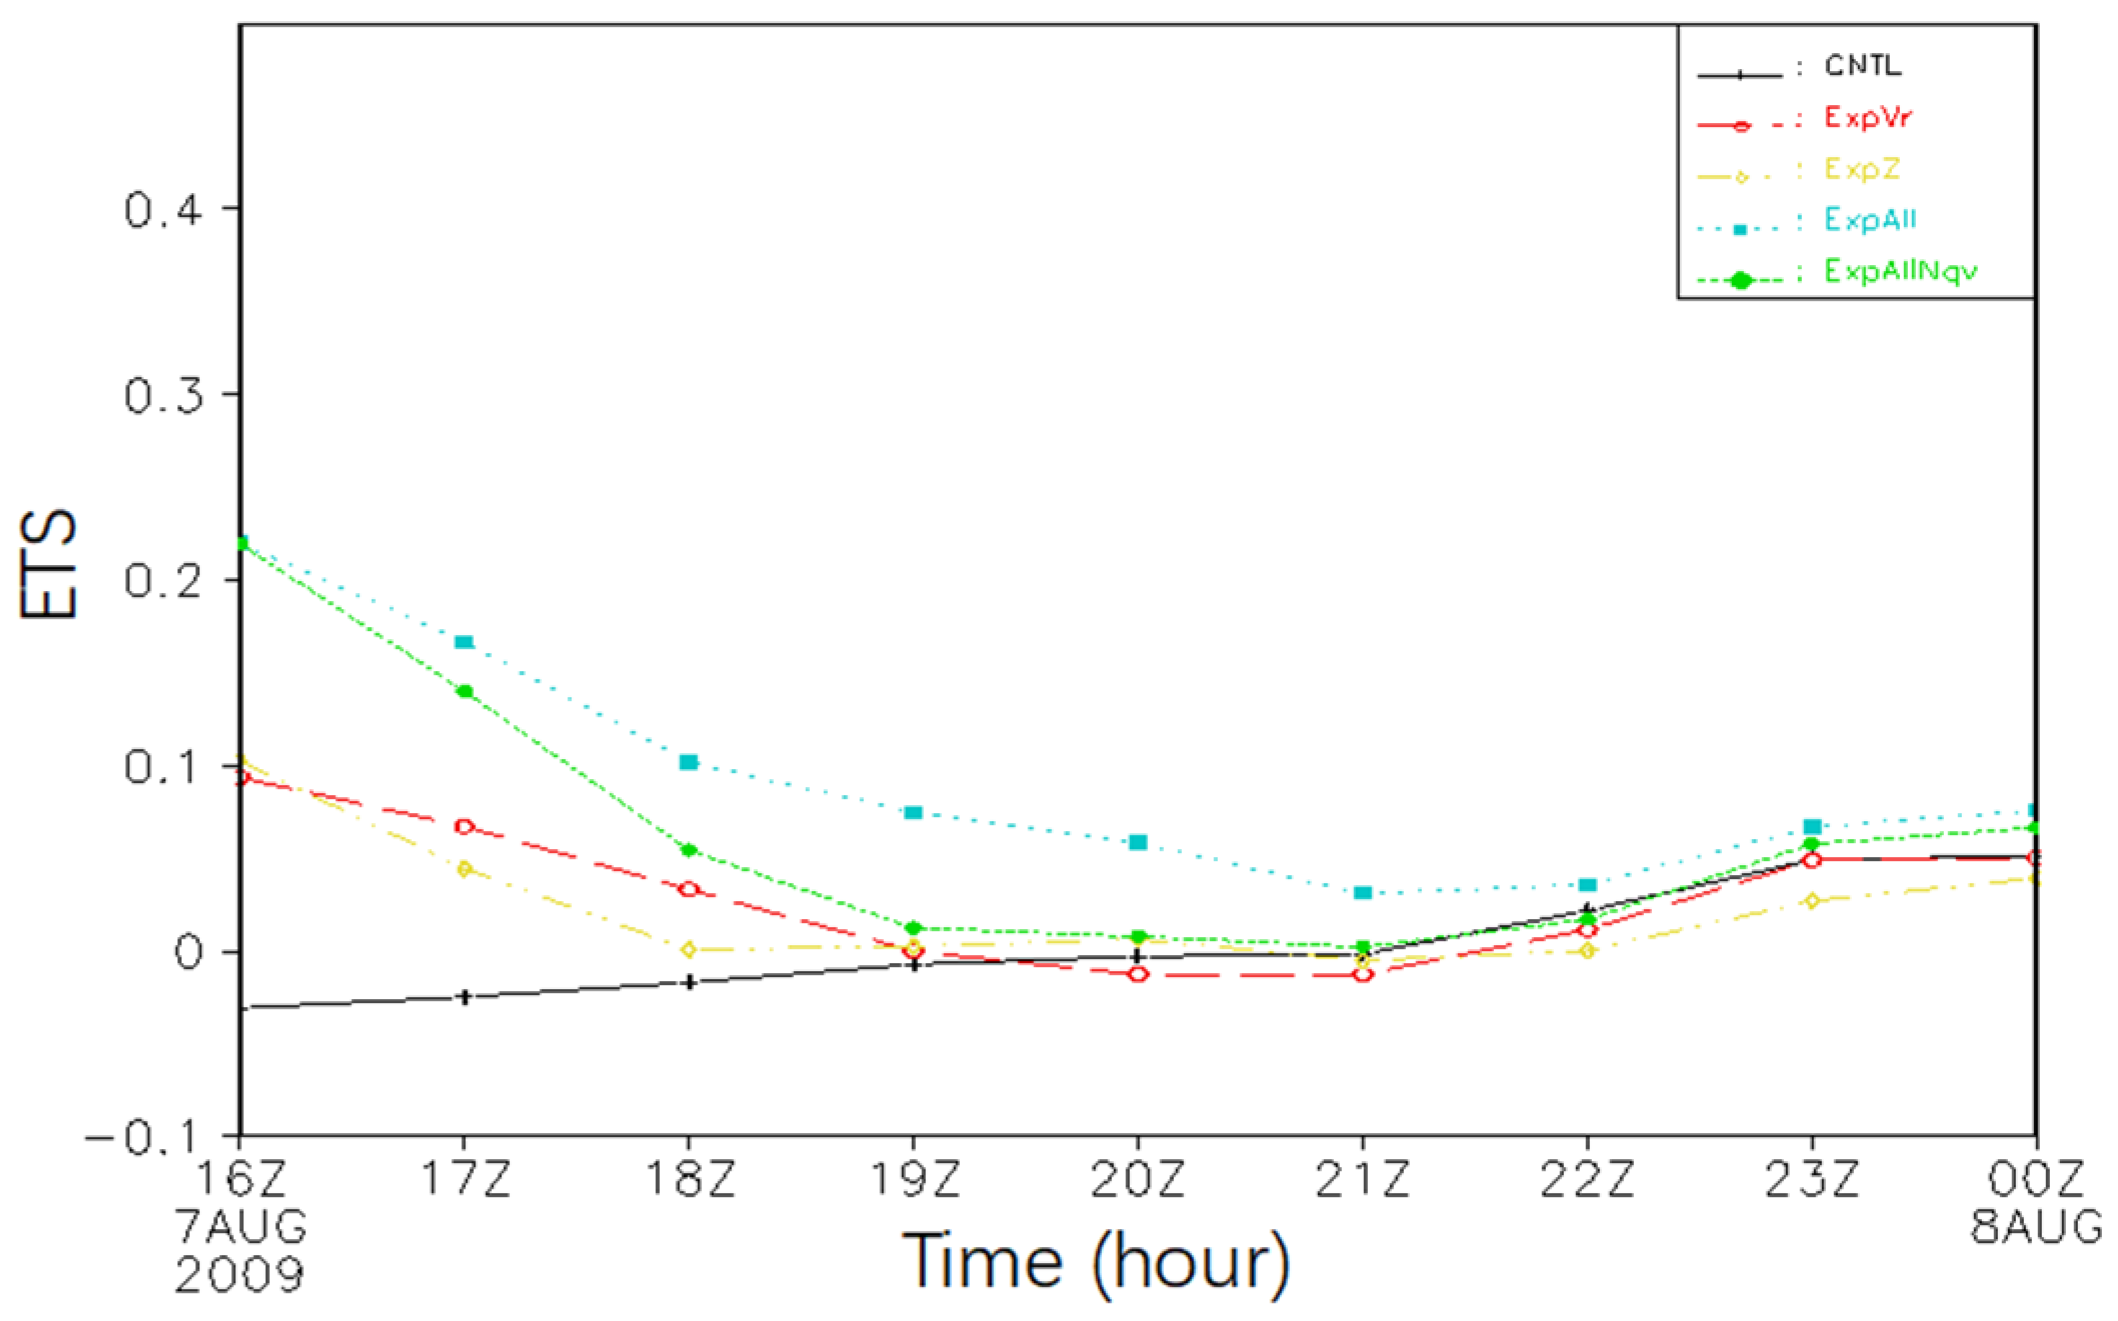
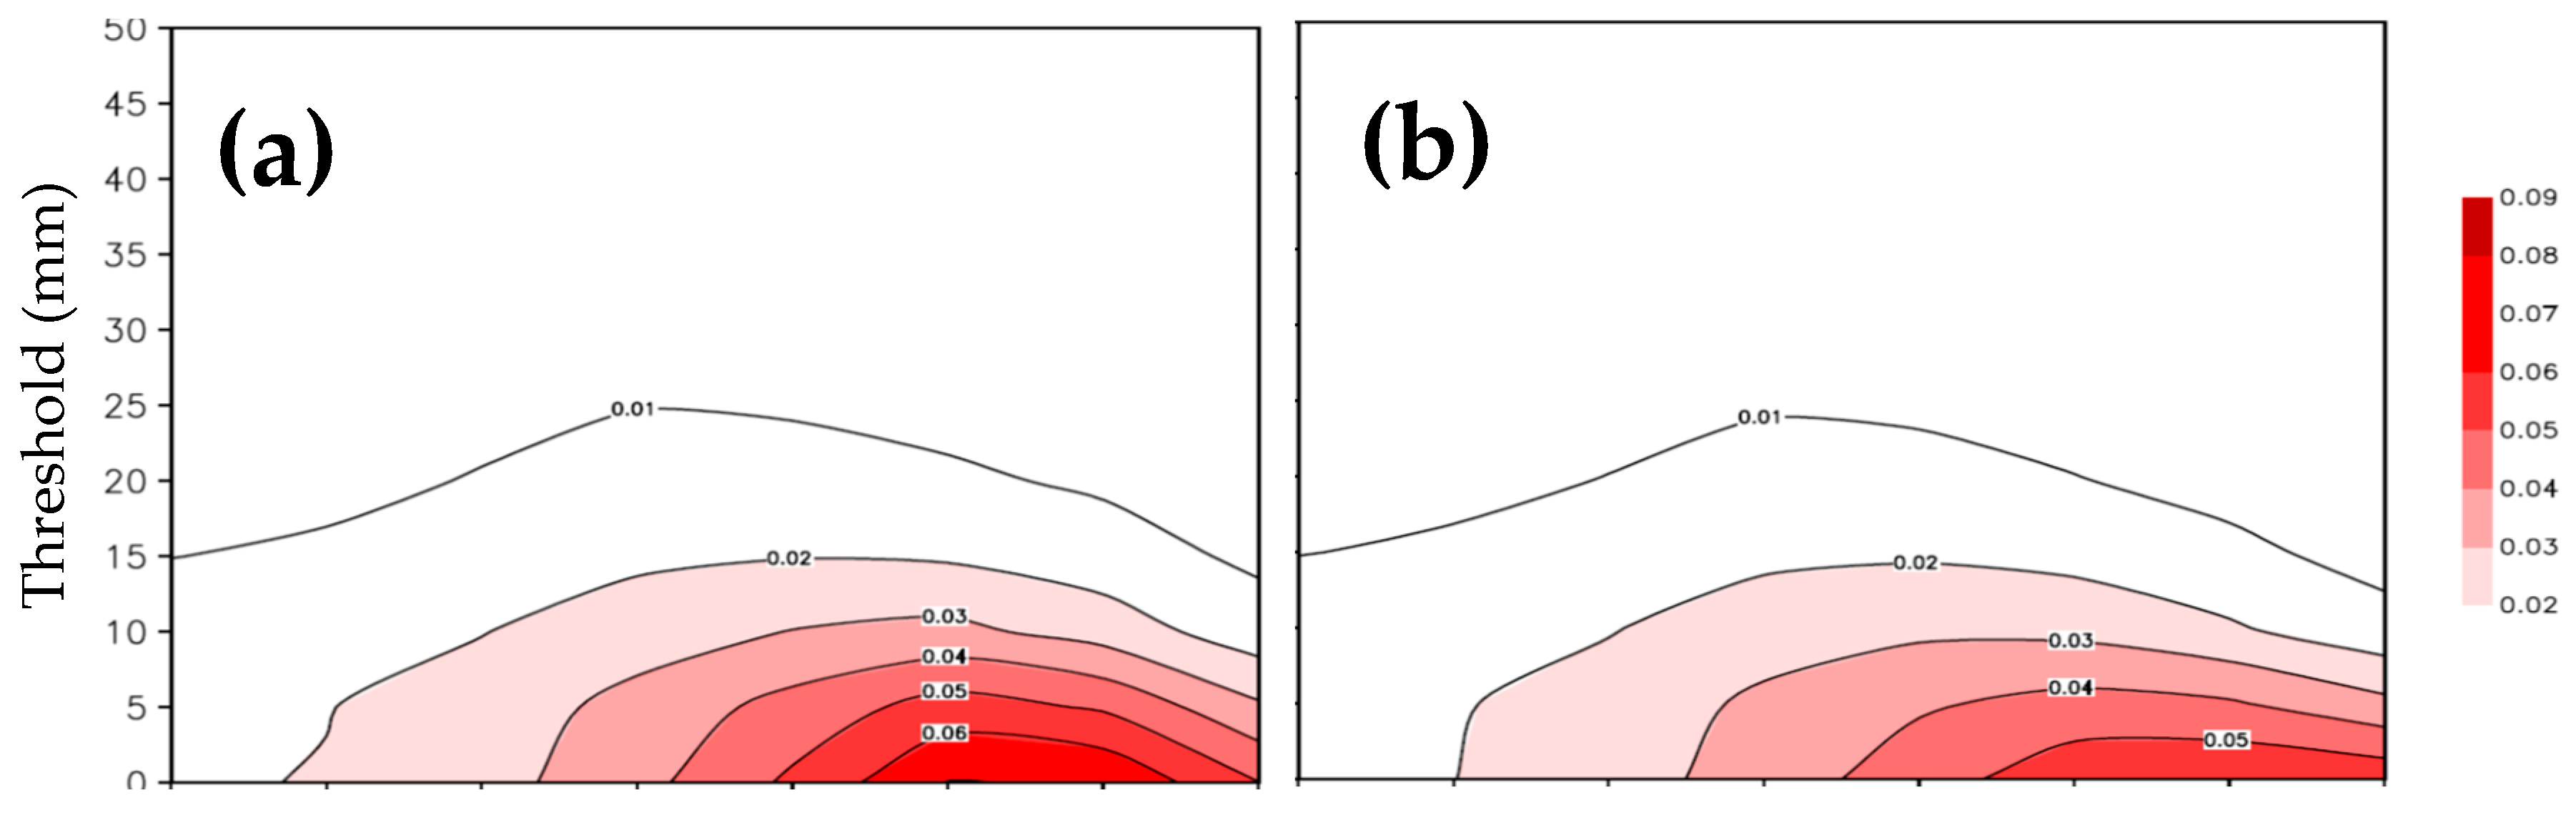
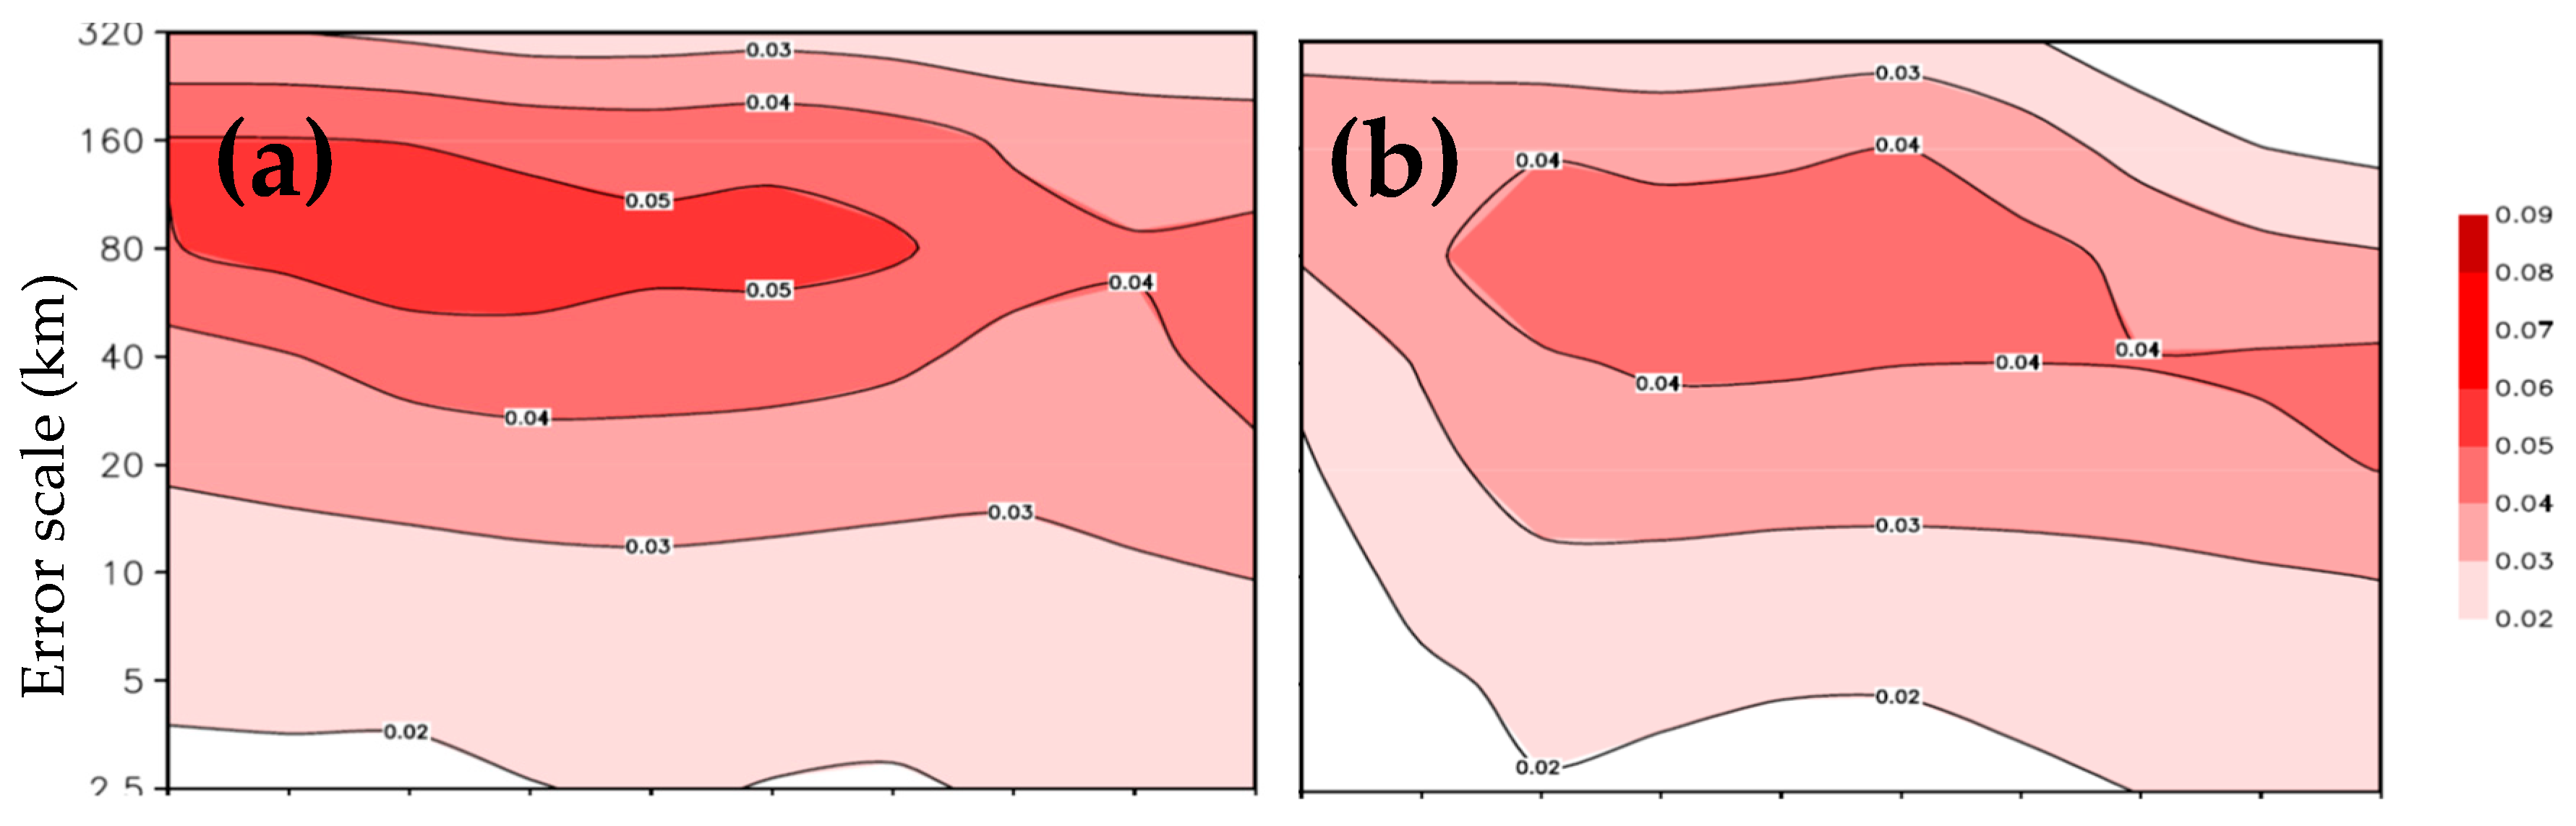
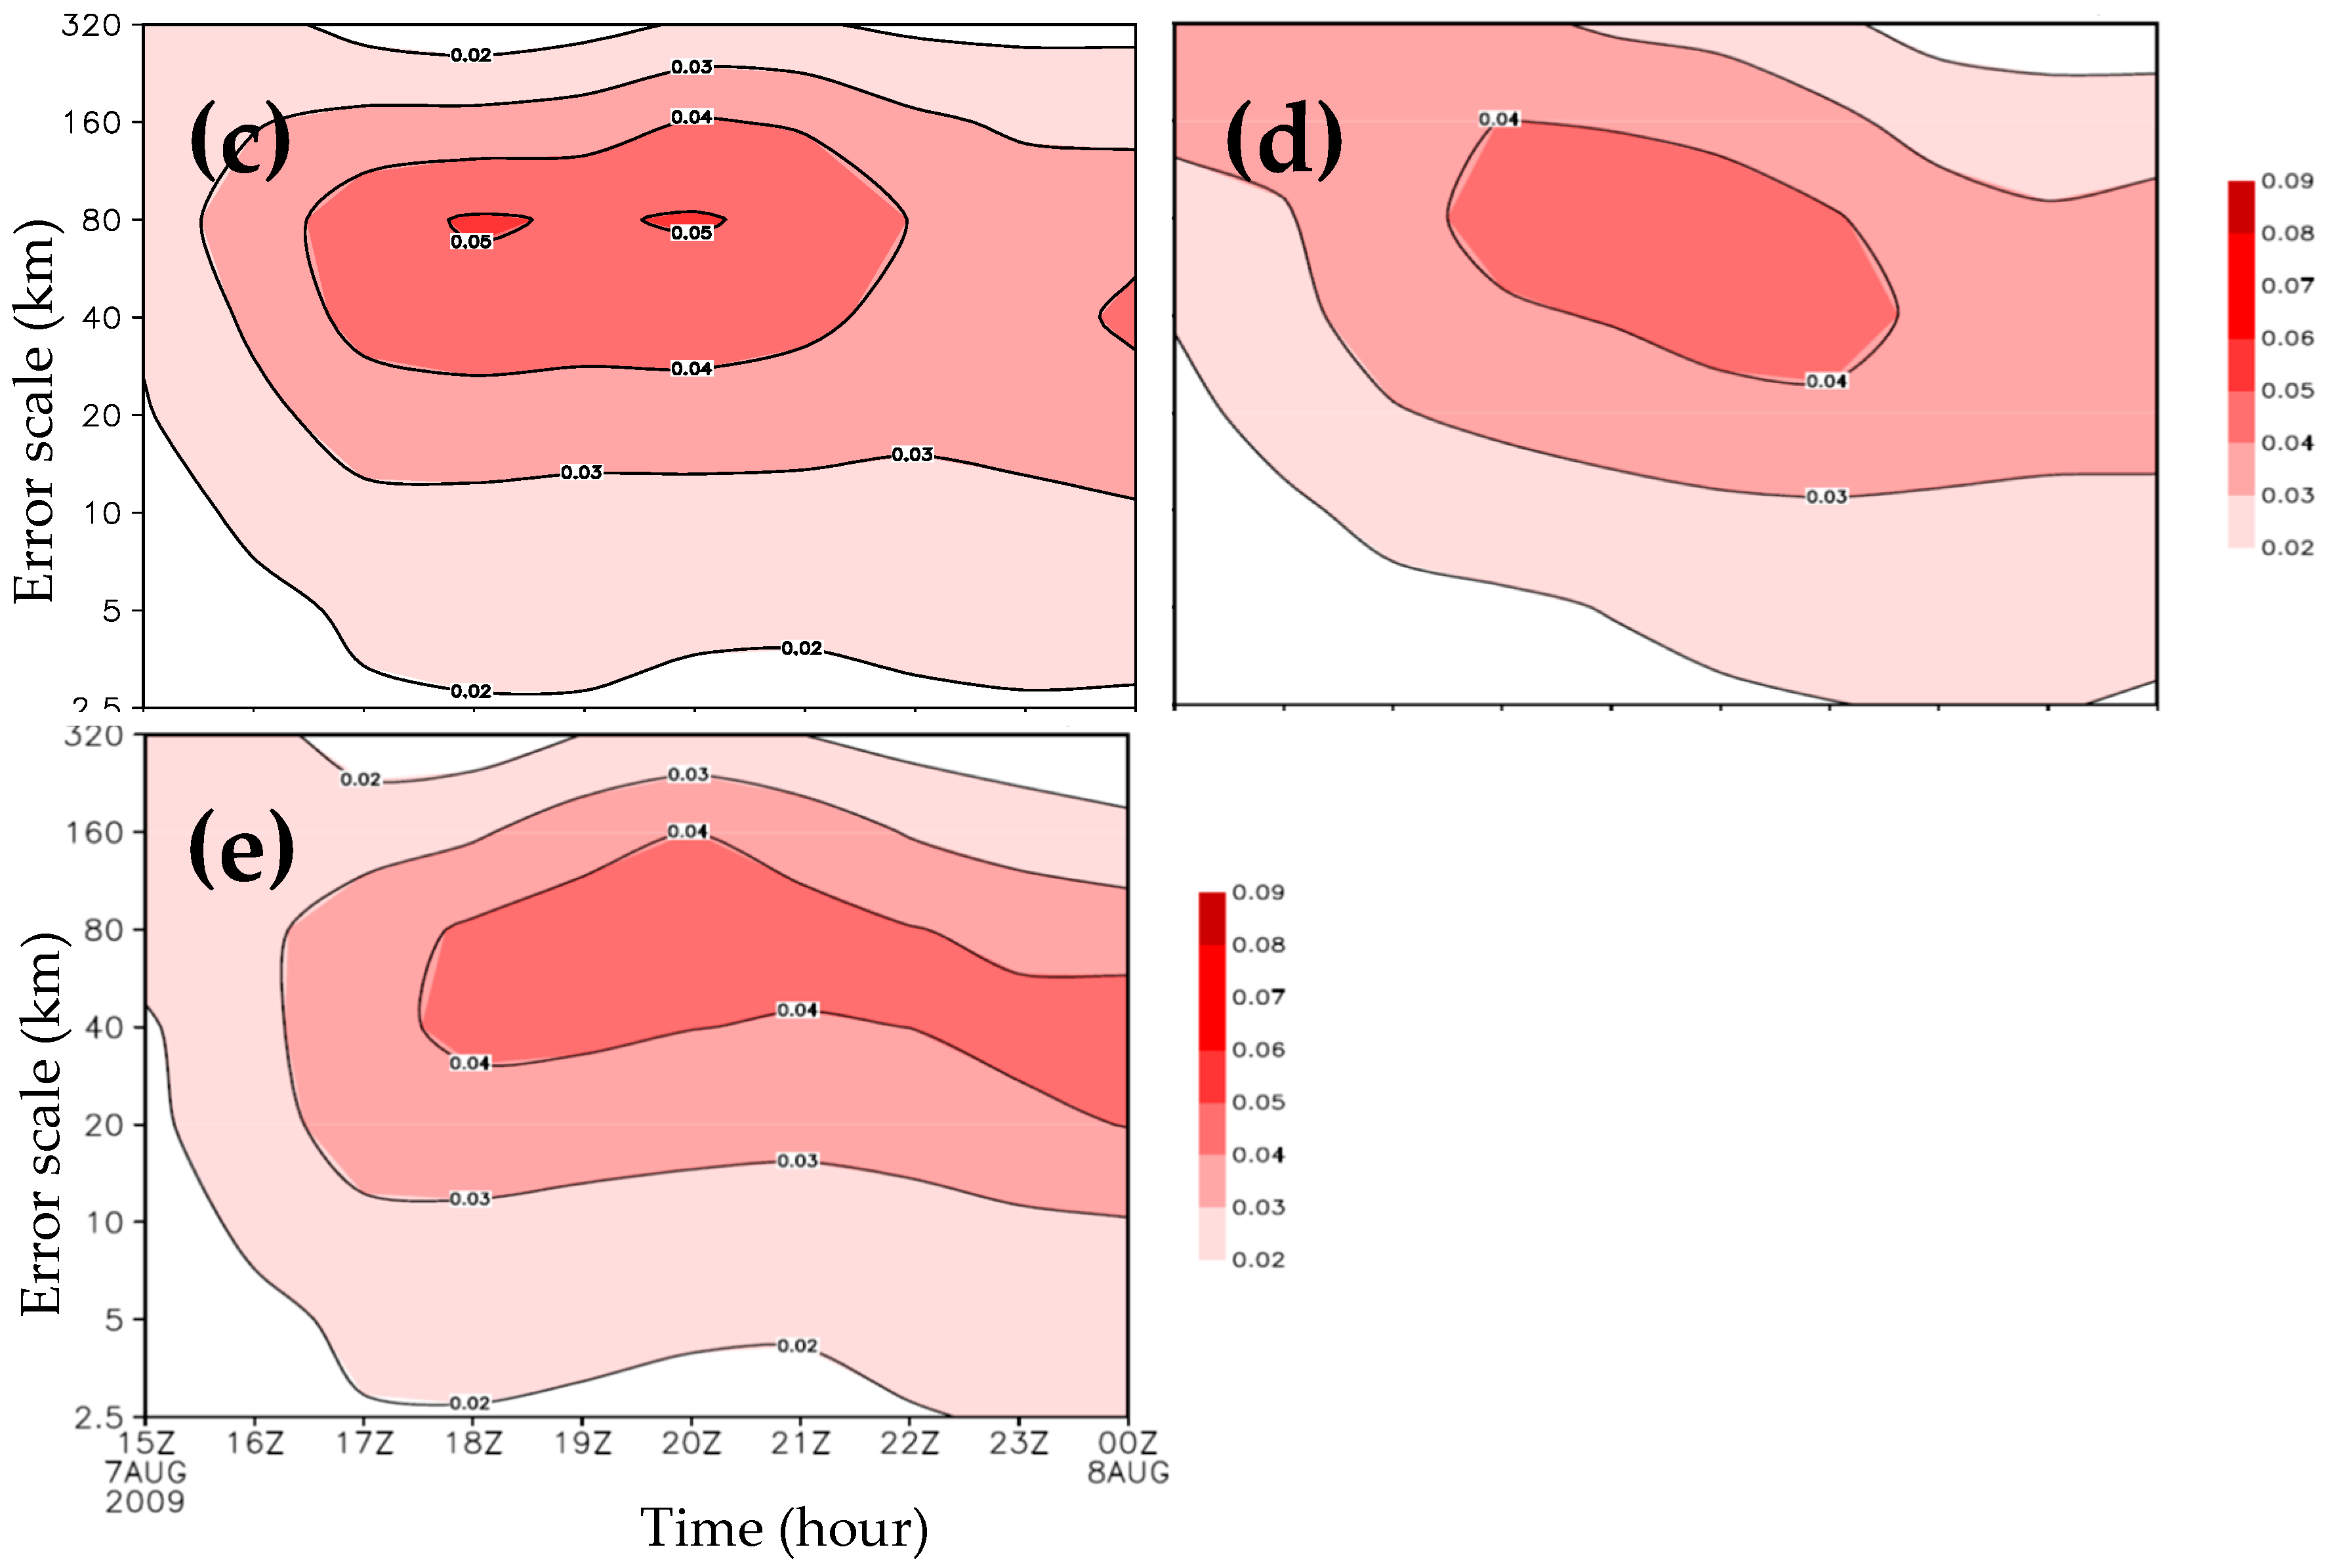
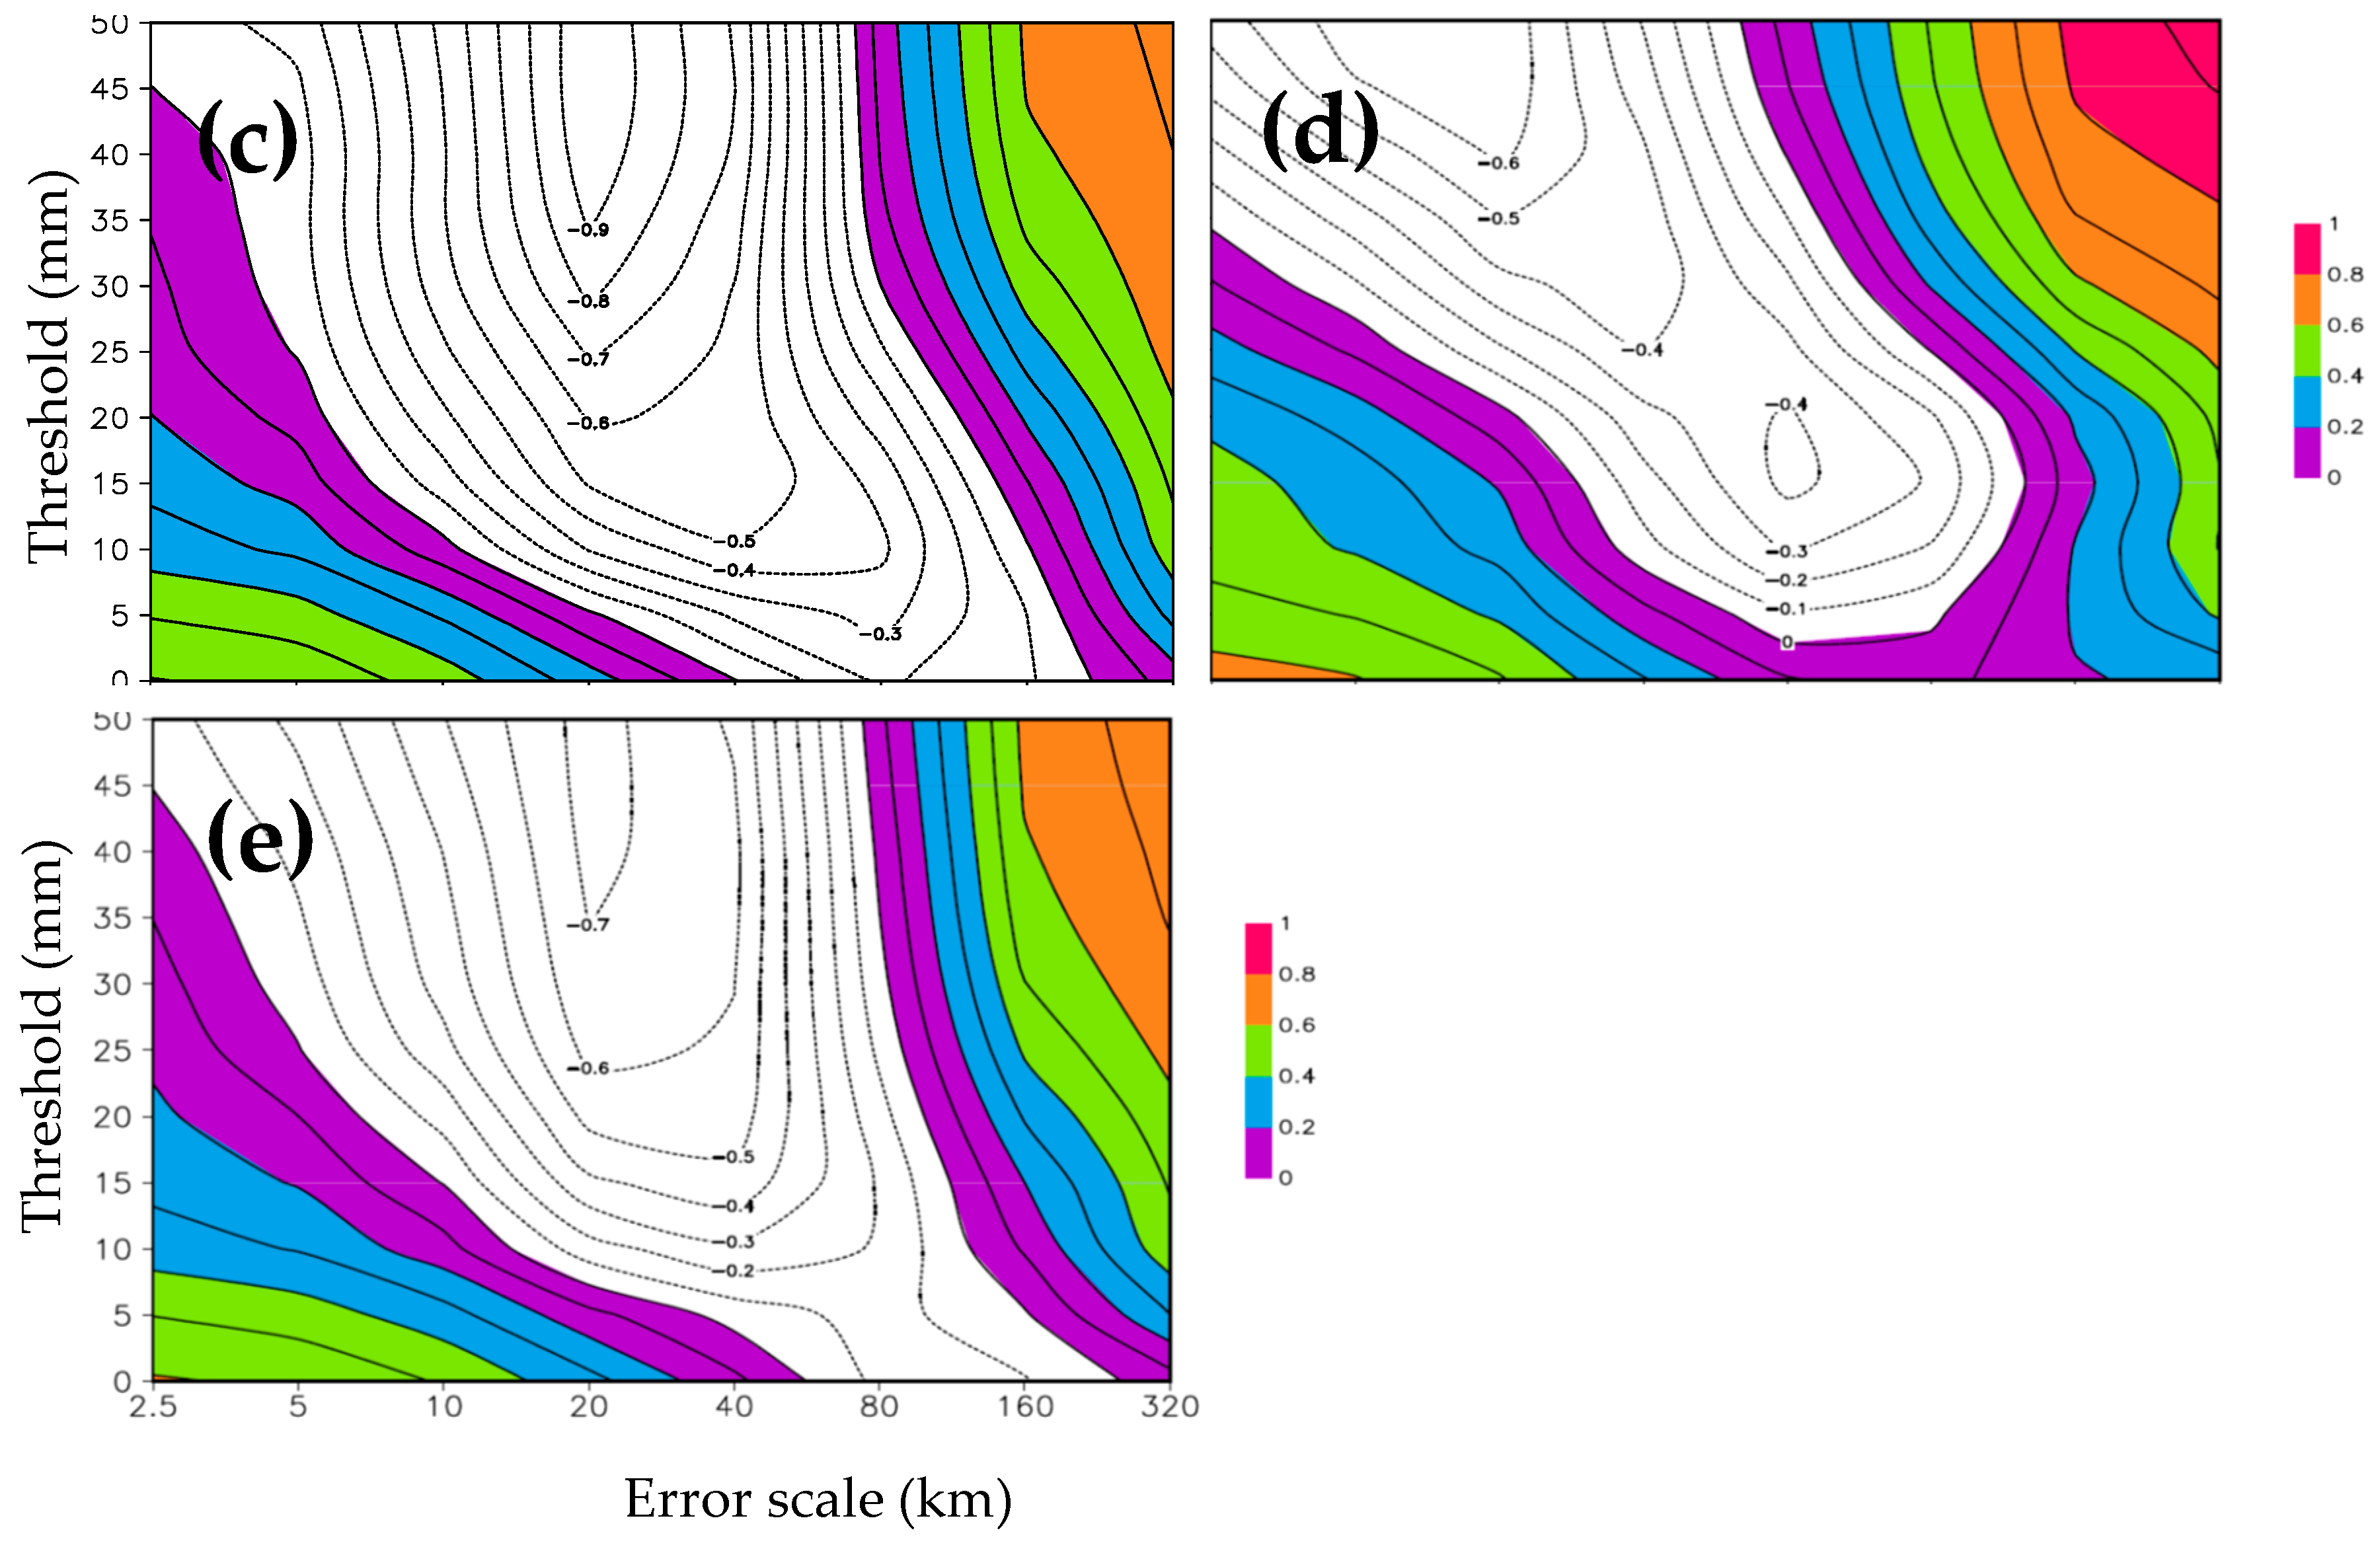
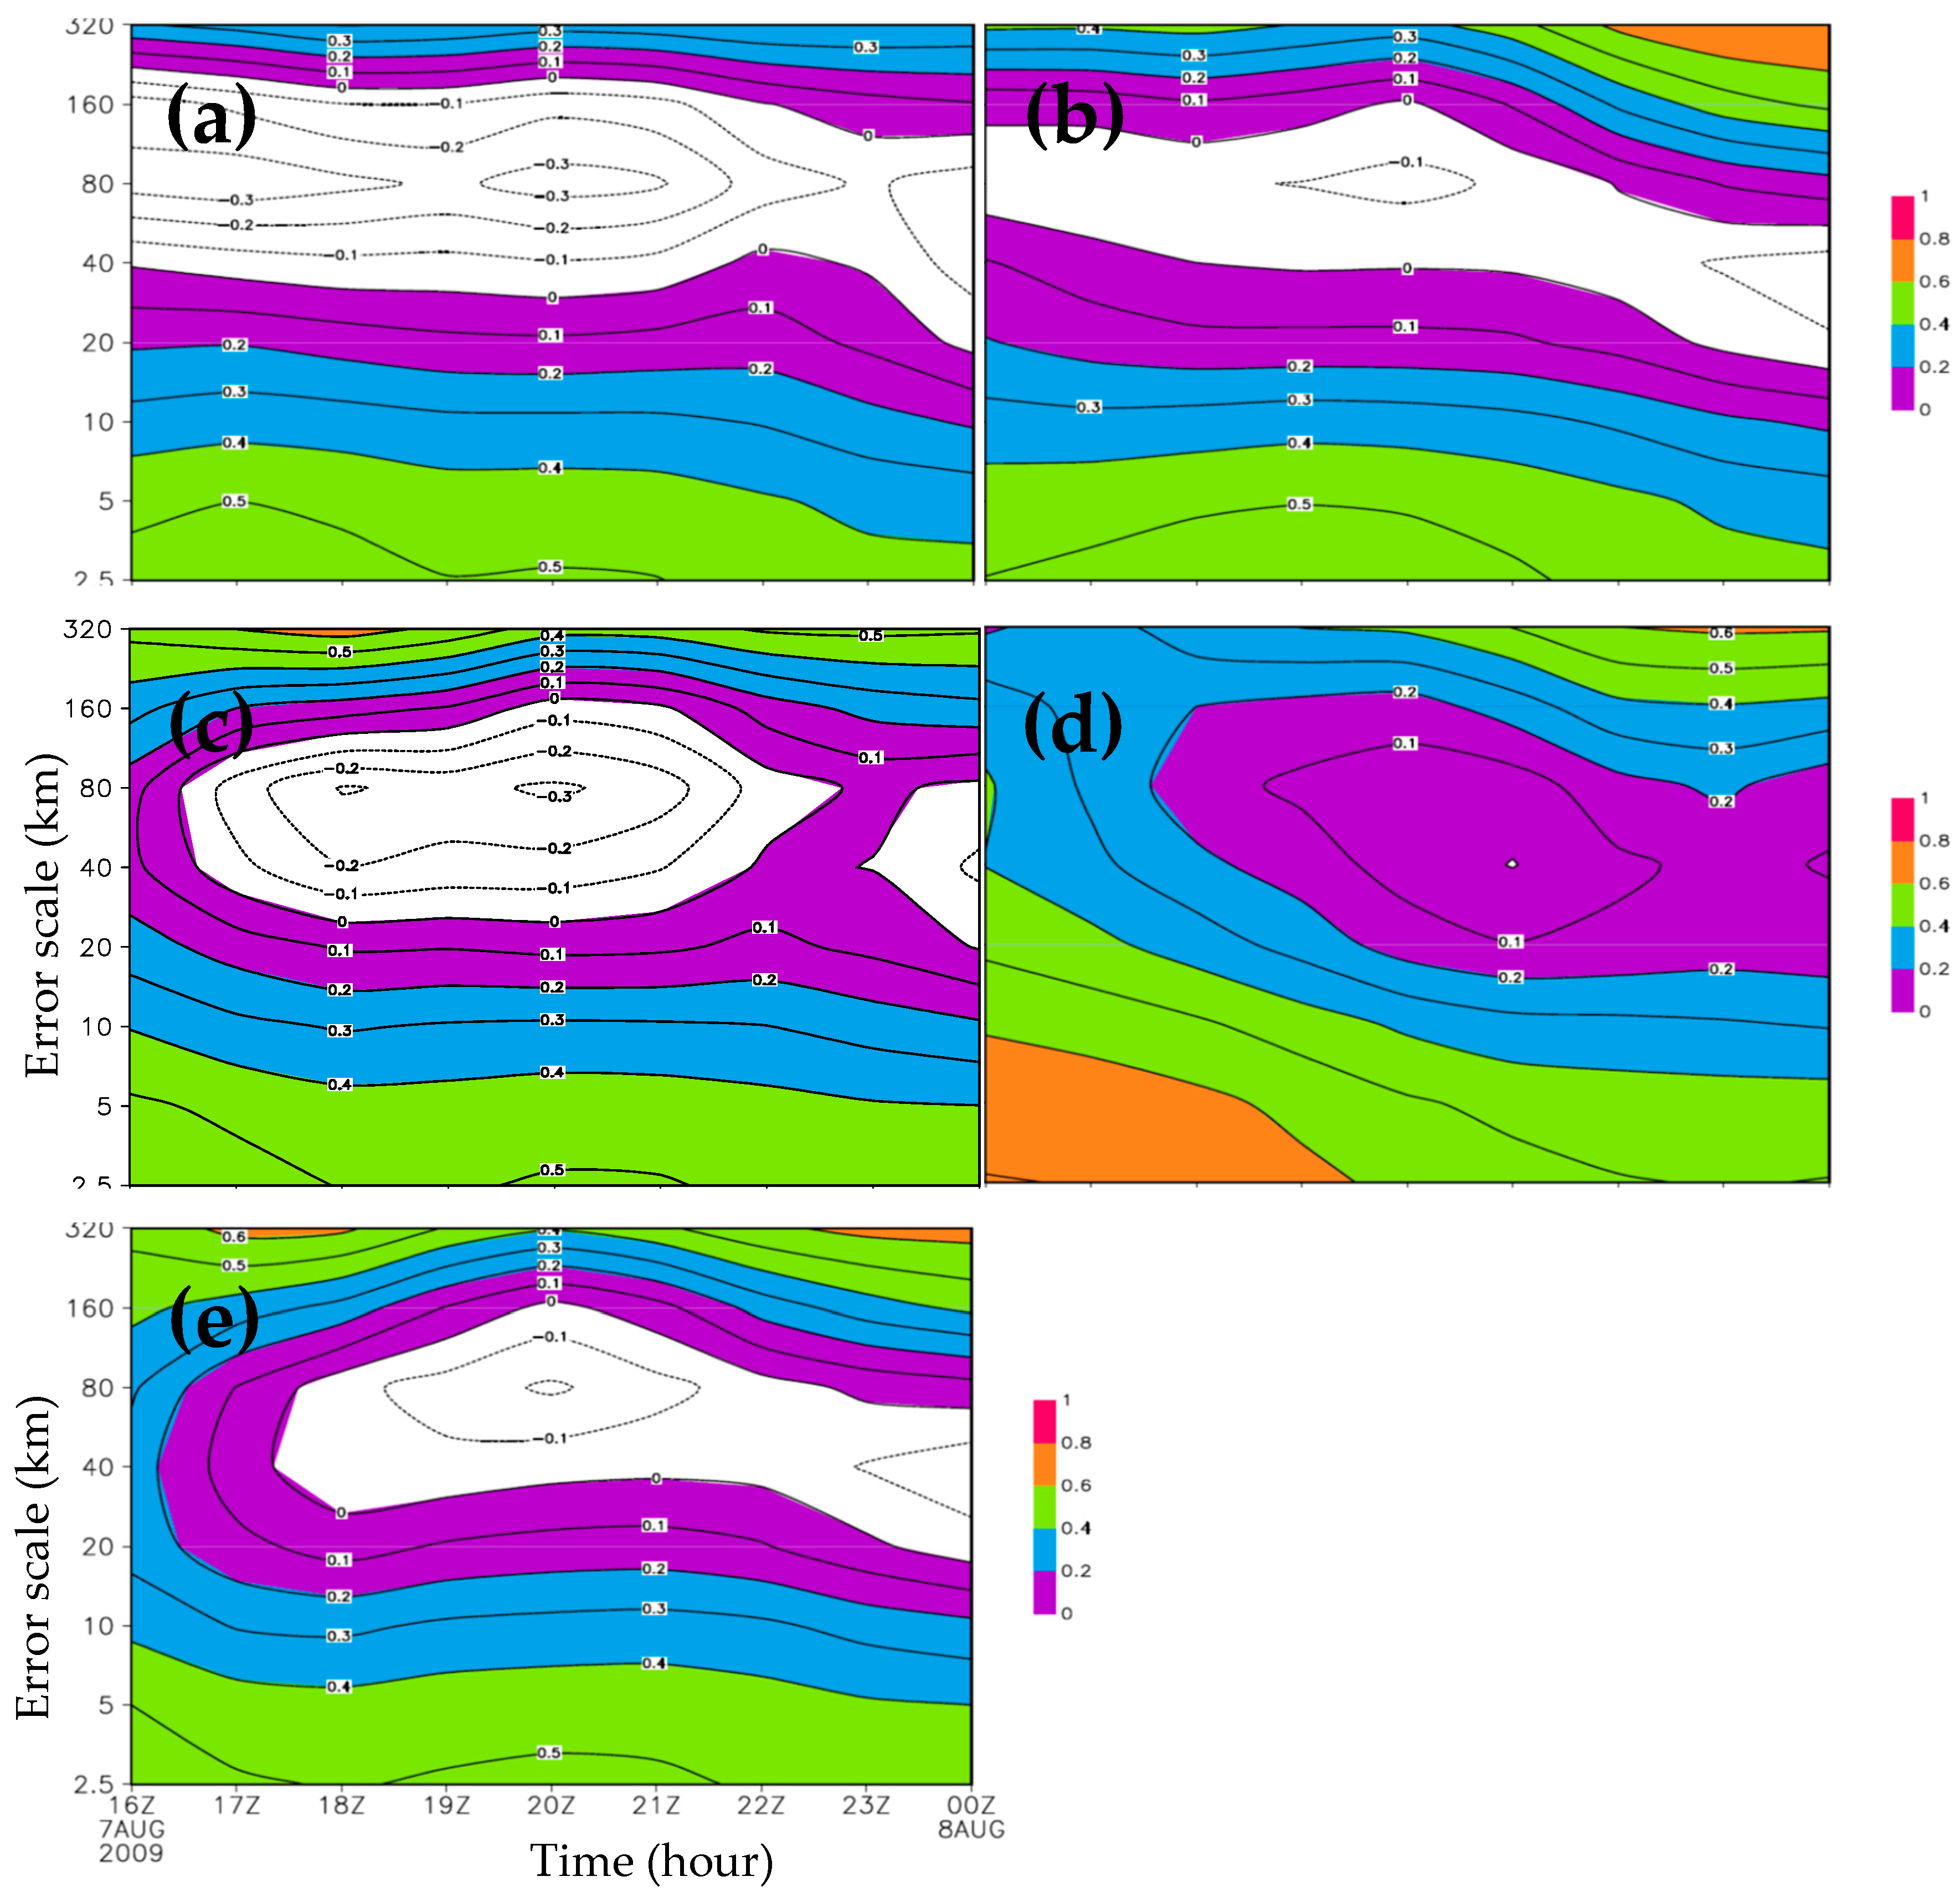
5.6. Intensity-Scale Skill Score

In this section, we calculated the mean square error (MSE) and intensity-scale (IS) skill score to analyze the prediction performance for decomposed spatial error scales and intensity (threshold). The definition of MSE is given by
M S E u = b + c n ,
where and represent the false alarms and misses when the forecast (F) and observation (O) surpass the threshold, while denotes the total count of sampled events. For each threshold, the sum of for each scale component decomposed by the wavelet is equal to the of the original binary fields, namely,
M S E u = l = 1 L + 1 M S E u , l ,
where L is the total scale number of wavelet decomposition. Based on this, the IS skill score was evaluated by
I S u , l = 1 M S E u , l M S E u , r a n d / L + 1 ,
where is the MSE for a biased random binary forecast and the observation fields, and is given by
M S E u , r a n d ~ B s 1 s + s 1 B s
where is the frequency bias index and is the sample climatology. As is evident from Equation (4), the IS skill score assesses forecast performance in relation to both the intensity and spatial scale of forecast errors compared to observations. A positive IS skill score indicates a skillful forecast, while a negative value signifies a lack of forecasting skill.
The of hourly precipitation with different thresholds and spatial scales of forecast error at 2100 UTC 7 August is presented in Figure 18. It was shown that the high value of in CNTL mainly appeared at the low threshold (<15 mm) for the forecast-error scales of 80–160 km. After assimilating radar data, the four sensitive experiments decreased the maximum of. The maximum of in ExpAll was the smallest among the five experiments and corresponded to the smaller forecast-error scale of 40–80 km. This indicated that the assimilation with the specific humidity adjustment was capable of reducing and shrinking the spatial scale of forecast error. In general, the reduction observed at higher thresholds can be attributed to the lower baseline frequency of more intense precipitation events, rather than any enhancement in predictive capability. The temporal trend of for hourly precipitation forecast at the threshold of 5 mm (Figure 19) showed that the high-value in CNTL appeared for the forecast-error scales of 80–160 km during 1500 UTC–2100 UTC 7 August. The high-value of the four sensitive experiments corresponding to the error scales of 40–160 km was smaller than that of CNTL. It was noted that the high-value area of in ExpAll shrank and appeared at the stage of Morakot landing on Taiwan Island between 1800 UTC and 2100 UTC 7 August.
Figure 20 illustrates how the IS skill score for hourly precipitation forecasts varies with the threshold u and the spatial scale l of forecast errors. Across all experiments, the IS skill score at high thresholds turned out to be negative when the spatial error scale was small (l < 40 km), meaning the forecasts performed worse than random ones. For forecast-error scales smaller than 40 km, the higher the threshold, the lower the IS skill score of hourly precipitation forecast in all the experiments. For forecast-error scales larger than 160 km, the higher the threshold, the higher the IS skill score of hourly precipitation forecast. The error scales of the unskillful forecast decreased with the increase in threshold. It was evident that the assimilation experiment the with specific humidity adjustment (ExpAll) enhanced the IS skill score in two scenarios: first, for low thresholds under error scales where other experiments showed no skill, and second, for high thresholds with large error scales. Regarding small-scale forecast errors, the negative skill at higher thresholds became less pronounced. For the small scales of forecast error, the negative skill became smaller at higher thresholds because the large MSEu,l for the intense (rarer) events gave the worst skill of hourly precipitation forecast.
As it was shown in Figure 21, the MSEu,l at the hourly precipitation threshold 5 mm for the spatial error scales of 30–160 km decreased the forecast skill over the whole forecast period in CNTL, ExpVr, ExpZ and ExpAllNqv. The coverage of skillful forecasting in ExpVr and ExpAllNqv was broader than CNTL. ExpAll presented skillful hourly precipitation forecasting over the whole period. Although ExpAll gained the lowest positive IS skill score for the forecast-error scales of 40–160 km during 1900 UTC–2200 UTC 7 August due to a large MSE, ExpAll improved the forecast skill for the scales for which CNTL, ExpVr, ExpZ, and ExpAllNqv were unskillful. The larger forecast-error scales (l ≥ 160 km) and smaller forecast-error scales (l < 30 km) corresponded to the positive skill score due to the smaller hourly precipitation forecast. The differentiation of forecast skill across spatial error scales ranging from 30 to 160 km revealed a distinction between meso-scale and convective precipitation events. Convective precipitation features, like rain cells, have spatial scales smaller than 30 km, and forecasts of such small-scale events are often affected by displacement errors, which undermine the forecast skill. In contrast, meso-scale features—typically larger than 160 km in scale—are generally well-captured by the forecasts; despite the presence of small-scale displacement errors, these events contribute to the positive skill of the forecasts.

6. Summary and Discussion

The capability of radar data assimilation to improve typhoon simulation by using ARPS3DVAR was examined for Typhoon Morakot (2009). The radial wind and reflectivity after quality control were intermittently assimilated in a 3 h assimilation time window at 30 min intervals. Focusing on the stage of Morakot landing on Taiwan Island and subsequently going inland, five experiments were conducted: a control run (CNTL) with the background of NCEP/GFS analysis, a sensitive experiment (ExpVr) with the radial wind assimilation, a sensitive experiment (ExpZ) with the reflectivity assimilation, a sensitive experiment (ExpAll) with the combined radial wind and reflectivity assimilation, and a sensitive experiment (ExpAllNqv) the same as ExpAll except for the specific humidity adjustment in the cloud analysis procedure. The results of the experiments are outlined in the following three points:
  • Simulations incorporating radar data assimilation enhanced the representation of the typhoon vortex structure both at the conclusion of the assimilation time window and throughout the following 9 h forecast period. The typhoon intensity and track forecasts also benefited from the assimilation.
  • The specific humidity adjustment in the cloud analysis procedure retrieved more moisture of the hurricane vortex in the assimilation time window. This produced more reasonable responses in other dynamic and thermodynamic variables. The composite reflectivity and rainbands were also favorably reorganized and appear more realistic due to tuning specific humidity.
  • The assimilation improved the neighborhood-based ETS for the smaller spatial scales at the stage of Morakot landing, and for the larger scales of forecast error at the stage of Morakot going inland. The assimilation with the specific humidity adjustment (ExpAll) also demonstrated skillful forecasting in precipitation forecasting for the spatial forecast-error scales of 30–160 km for which CNTL, ExpVr, ExpZ, and ExpAllNqv proved unskillful.
To evaluate the impact of the specific humidity adjustment in the cloud analysis procedure, ExpAllNqv, the same as ExpAll except for the specific humidity adjustment, was conducted. The findings mentioned above indicated that the impact of assimilating reflectivity diminished when the moisture field was not adjusted during the cloud analysis process. An excessively deep convective stratiform layer pressure (CSLP) was observed in ExpAll, which could presumably be attributed to the excessive moisture input within the assimilation time window and the consequent excessive lateral heating. This inference was supported by the absence of such an overly deep CSLP in ExpAllNqv. Hence, further adjustments to the cloud analysis procedure might lead to better precipitation forecast performance. While the specific mechanisms identified were crucial for this case, their generalizability to other typhoons requires further investigation.
Future efforts should prioritize refining the moisture adjustment scheme within the cloud analysis procedure. Implementing dynamic constraints on latent heat release or developing a hybrid assimilation approach that integrates satellite-based humidity profiles could mitigate the over-deepening of CSLP identified in ExpAll, thereby enhancing precipitation forecast accuracy.
This study illustrates the potential for improving typhoon forecasts by using the assimilation of radar data through ARPS3DVAR. The typhoon was generally well-observed by the ground-based radars deployed along the coasts of Taiwan Island when it was approaching Taiwan. Thus, assimilating radar data holds significant value for enhancing the forecasting of landing typhoons, which in turn helps mitigate the losses of life and property in coastal areas.

Author Contributions

Writing—original draft, L.R.; Writing—review & editing, C.W. All authors have read and agreed to the published version of the manuscript.

Funding

This research was funded by the National Natural Science Foundation of China (41175060 and 41075098) and the National Basic Research Program of China (2009CB421505).

Institutional Review Board Statement

Not applicable.

Informed Consent Statement

Not applicable.

Data Availability Statement

The raw data used in this study cannot be made publicly available due to privacy protection restrictions.

Acknowledgments

We are grateful to Kefeng Zhu, Lei ting for their help in our experiments. We also express our appreciation to the team for supplying the typhoon radar data used in this study.

Conflicts of Interest

The authors declare no conflict of interest.

Abbreviations

The following abbreviations are used in this manuscript:
ARPSAdvanced Region Prediction System
NCEPNational Centers for Environmental Prediction
GFSGlobal Forecast System
COAMPSCoupled Ocean Atmosphere Mesoscale Prediction System
ADRDoppler Radar
WRFWeather Research and Forecasting
ETSEquivalent Threat Score
ISIntensity-Scale
3DVAR3-Dimensional Variation
JMAJapan Meteorological Agency
MSWPMaximum Surface Wind Speed
CCAComplex Cloud Analysis
ADASARPS Data Analysis System
LAPSLocal Analysis and Prediction System
CNTLControl Run
CSLPCentral Sea Level Pressure
SLPSea Level Pressure

References

  1. Aberson, S. Targeted observations to improve operational tropical cyclone track forecast guidance. Mon. Wea. Rev. 2003, 131, 1613–1628. [Google Scholar] [CrossRef]
  2. Elsberry, R.L. Achievement of USWRP hurricane landfall research goal. Bull. Am. Meteor. Soc. 2005, 86, 643–645. [Google Scholar] [CrossRef]
  3. Xiao, Q.; Sun, J. Multiple-radar data assimilation and short-range quantitative precipitation forecasting of a squall line observed during IHOP_2002. Mon. Wea. Rev. 2007, 135, 3381–3404. [Google Scholar] [CrossRef]
  4. Hsin-Hung, L.; Lin, P.L.; Xiao, Q.; Kuo, Y.H. Effect of Doppler Radial Velocity Data Assimilation on the Simulation of a Typhoon Approaching Taiwan: A Case Study of Typhoon Aere (2004). Terr. Atmos. Ocean. Sci. 2011, 22, 3. [Google Scholar]
  5. Zhao, Q.; Jin, Y. High-resolution radar data assimilation for Hurricane Isabel (2003) at landfall. Bull. Am. Meteor. Soc. 2008, 89, 1355–1372. [Google Scholar] [CrossRef]
  6. Houze, R.A., Jr.; Chen, S.S.; Lee, W.C.; Rogers, R.F.; Moore, J.A.; Stossmeister, G.J.; Bell, M.M.; Cetrone, J.; Zhao, W.; Brodzik, S.R. The hurricane rainband and intensity change experiment—Observations and modeling of Hurricanes Katrina, Ophelia, and Rita. Bull. Am. Meteor. Soc. 2006, 87, 1503–1521. [Google Scholar] [CrossRef]
  7. Zhao, K.; Xue, M. Assimilation of coastal Doppler radar data with the ARPS 3DVAR and cloud analysis for the prediction of Hurricane Ike (2008). Geophys. Res. Lett. 2009, 36, L12803. [Google Scholar] [CrossRef]
  8. Marks, F.D. State of the science: Radar view of tropical cyclones. Meteorol. Monogr. 2003, 30, 33–74. [Google Scholar] [CrossRef]
  9. Xiao, Q.; Zhang, X.; Davis, C.; Tuttle, J.; Holland, G.; Fitzpatrick, P.J. Experiments of Hurricane Initialization with Airborne Doppler Radar Data for the Advanced Research Hurricane WRF (AHW). Model. Mon. Wea. Rev. 2009, 137, 2758–2777. [Google Scholar] [CrossRef]
  10. Pu, Z.; Li, X.; Sun, J. Impact of Airborne Doppler Radar Data Assimilation on the Numerical Simulation of Intensity Changes of Hurricane Dennis near a Landfall. J. Atmos. Sci. 2009, 66, 3351–3365. [Google Scholar] [CrossRef]
  11. Yau, M.K.; Liu, Y.; Zhang, D.L.; Chen, Y. A multiscale numerical study of Hurricane Andrew (1992). Part VI: Smallscale inner-core structures and wind streaks. Mon. Wea. Rev. 2004, 132, 1410–1433. [Google Scholar] [CrossRef]
  12. Braun, S.A.; Montgomery, M.T.; Pu, Z. High-resolution simulation of Hurricane Bonnie (1998). Part I: The organization of eyewall vertical motion. J. Atmos. Sci. 2006, 63, 19–42. [Google Scholar] [CrossRef]
  13. Gilleland, E.; Ahijevych, D.; Brown, B.G.; Casati, B.; Ebert, E.E. Intercomparison of Spatial Forecast Verification Methods. Wea. Forecast. 2009, 24, 1416–1430. [Google Scholar] [CrossRef]
  14. Clark, A.J.; Gallus, W.A., Jr.; Weisman, M.L. Neighborhood-Based Verification of Precipitation Forecasts from Convection-Allowing NCAR WRF Model Simulations and the Operational NAM. Wea. Forecast. 2010, 25, 1495–1509. [Google Scholar] [CrossRef]
  15. Casati, B.; Ross, G.; Stephenson, D.B. A new intensityscale approach for the verification of spatial precipitation forecasts. Meteor. Appl. 2004, 11, 141–154. [Google Scholar] [CrossRef]
  16. Casati, B. New Developments of the Intensity-Scale Technique within the Spatial Verification Methods Intercomparison Project. Weather. Forecast. 2010, 25, 113–143. [Google Scholar] [CrossRef]
  17. Wilks, D.S. Forecast Verification; Elsevier BV: Amsterdam, The Netherlands, 2019. [Google Scholar]
  18. Ebert, E.E. Neighborhood verification: A strategy for rewarding close forecasts. Wea. Forecast. 2009, 24, 1498–1510. [Google Scholar] [CrossRef]
  19. Wang, M.; Xue, M.; Zhao, K. The Impact of T-TREC-retrieved Wind and Radial Velocity Data Assimilation using EnKF and Effects of Assimilation Window on the Analysis and Prediction of Typhoon Jangmi (2008): T-TREC-retrieved Winds EnKF Assimilation. J. Geophys. Res. Atmos. 2016, 121, 259–277. [Google Scholar] [CrossRef]
  20. Gao, J.; Xue, M.; Brewster, K.; Droegemeier, K.K. A three-dimensional variational data analysis method with recursive filter for Doppler radars. J. Atmos. Ocean. Technol. 2004, 21, 457–469. [Google Scholar] [CrossRef]
  21. Xue, M.; Droegemeier, K.K.; Wong, V.; Shapiro, A.; Brewster, K.; Carr, F.; Weber, D.; Liu, Y.; Wang, D.-H. The dvanced Regional Prediction System (ARPS)—A multiscale nonhydrostatic atmospheric simulation and prediction tool. Part II: Model physics and applications, Meteorol. Atmos. Phys. 2001, 76, 143–165. [Google Scholar] [CrossRef]
  22. Xue, M.; Wang, D.-H.; Gao, J.-D.; Brewster, K.; Droegemeier, K.K. The Advanced Regional Prediction System (ARPS), storm-scale numerical weather prediction and data assimilation. Meteorol. Atmos. Phys. 2003, 82, 139–170. [Google Scholar] [CrossRef]
  23. Zhang, J. Moisture Diabatic Initialization Based on Radar Satellite Observation. Ph D. Thesis, University of Oklahoma, Norman, Oklahoma, 1999; 194p. [Google Scholar]
  24. Smith, P.L., Jr.; Myers, C.G.; Orville, H.D. Radar reflectivity factor calculations in numerical cloud models using bulk parameterization of precipitation. J. Appl. Meteor. 1975, 14, 1156–1165. [Google Scholar] [CrossRef]
  25. Zhuang, Z.; Jiang, Y.; Tian, W.; Huang, L.; Li, X.; Deng, L. Hourly Rapid Updating Assimilation Forecast System of CMA-MESO and Preliminary Analysis of Short-term Forecasting Effect. Chin. J. Atmos. Sci. 2023, 47, 925–942. (In Chinese) [Google Scholar]
  26. Ming, H.; Xue, M.; Gao, J.; Brewster, K. 3DVAR and Cloud Analysis with WSR-88D Level-II Data for the Prediction of the Fort Worth Texas Tornadic Thunderstorms Part II: Impact of Radial Velocity Analysis via 3DVAR. Mon. Wea. Rev. 2006, 134, 699–721. [Google Scholar]
  27. Ming, H.; Xue, M.; Brewster, K. 3DVAR and Cloud Analysis with WSR-88D Level-II Data for the Prediction of the Fort Worth, Texas, Tornadic Thunderstorms. Part I: Cloud Analysis and Its Impact. Mon. Wea. Rev. 2006, 134, 675–698. [Google Scholar]
Figure 1. Typhoon Morakot’s best track between 3 August 2009 and 11 August 2009 (located every 6 h).
Atmosphere 16 00910 g001
Figure 2. The observation of composite reflectivity (dBz) at (a) 1200 UTC 7 August, (b) 1500 UTC 7 August, (c) 1800 UTC 7 August, and (d) 0000 UTC 8 August 2009.
Atmosphere 16 00910 g002
Figure 3. The sea level pressure (contour, hPa), horizontal wind vector (arrow), and horizontal wind speed (shade, m s−1) at 850 hPa at 1500 UTC 7 August 2009 in (a) CNTL, (b) ExpVr, (c) ExpZ, (d) ExpAll, and (e) ExpAllNqv.
Atmosphere 16 00910 g003
Figure 4. The differences in sea level pressure (contour, hPa), horizontal wind vector (arrow), and wind speed (shade, m s−1) (a) between ExpVr and CNTL, (b) between ExpZ and CNTL, (c) between ExpAll and CNTL, and (d) between ExpAllNqv and CNTL at 850 hPa at 1500 UTC 7 August 2009.
Atmosphere 16 00910 g004aAtmosphere 16 00910 g004b
Figure 5. The meridional-vertical wind vector (arrow) and horizontal wind speed (shade, m s−1) in the cross sections along 121oE at 1500 UTC 7 August 2009 in (a) CNTL, (b) ExpVr, (c) ExpZ, (d) ExpAll, and (e) ExpAllNqv. The blank bar denotes the pressure level beneath the ground surface.
Atmosphere 16 00910 g005
Figure 6. The differences in meridional-vertical wind vector (arrow) and horizontal wind speed (shade, m s−1) in the cross sections along 121.5oE at 1500 UTC 7 August 2009 (a) between ExpVr and CNTL, (b) between ExpZ and CNTL, (c) between ExpAll and CNTL, and (d) between ExpAllNqv and CNTL. The blank bar denotes the pressure level beneath the ground surface.
Atmosphere 16 00910 g006
Figure 7. The differences in precipitable water (shade, kg m−2) at 1500 UTC 7 August 2009 (a) between ExpVr and CNTL, (b) between ExpZ and CNTL, (c) between ExpAll and CNTL, and (d) between ExpAllNqv and CNTL.
Atmosphere 16 00910 g007
Figure 8. The differences in equivalent potential temperature (shade, K) (a) between ExpVr and CNTL, (b) between ExpZ and CNTL, (c) between ExpAll and CNTL, and (d) between ExpAllNqv and CNTL in the cross sections along 121.5oE at 1500 UTC 7 August 2009. The blank bar denotes the pressure level beneath the ground surface.
Atmosphere 16 00910 g008
Figure 9. The composite reflectivity (shade, dBz) at 1500 UTC 7 August 2009 in (a) CNTL, (b) ExpVr, (c) ExpZ, (d) ExpAll, and (e) ExpAllNqv.
Atmosphere 16 00910 g009aAtmosphere 16 00910 g009b
Figure 10. The radial winds (shade, m s-1) at an elevation angle of 2.4° of (a) the observation, (b) CNTL, (c) ExpVr, (d) ExpZ, (e) ExpAll, and (f) ExpAllNqv located around RCCG at 0000 UTC 8 August 2009.
Atmosphere 16 00910 g010
Figure 11. The composite reflectivity forecasts (shade, dBz) in (a) CNTL, (b) ExpVr, (c) ExpZ, (d) ExpAll and (e) ExpAllNqv. valid at 0000 UTC 8 August 2009.
Atmosphere 16 00910 g011aAtmosphere 16 00910 g011b
Figure 12. The grid-to-grid ETS of composite reflectivity forecast at the threshold of 25 dBz between 16 UTC 7 August 2009 and 00 UTC 8 August 2009.
Atmosphere 16 00910 g012
Figure 13. The observation (a) and forecasts of hourly precipitation in (b) CNTL, (c) ExpVr, (d) ExpZ, (e) ExpAll, and (f) ExpAllNqv (shade, mm) at 0000 UTC 8 August 2009.
Atmosphere 16 00910 g013
Figure 14. The grid-to-grid ETS of hourly precipitation forecast at the threshold of 10 mm between 16 UTC 7 August 2009 and 00 UTC 8 August 2009.
Atmosphere 16 00910 g014
Figure 15. The forecasts of sea level pressure (contour, hPa), horizontal wind vector (arrow, m s−1), and wind speed (shade, m s−1) at 850 hPa in (a) CNTL, (b) ExpVr, (c) ExpZ, (d) ExpAll, and (e) ExpAllNqv valid at 2100 UTC 7 August 2009.
Atmosphere 16 00910 g015aAtmosphere 16 00910 g015b
Figure 16. The forecasts of equivalent potential temperature (contour, K) and horizontal wind speed (shade, m s−1) in (a) CNTL, (b) ExpVr, (c) ExpZ, (d) ExpAll, and (e) ExpAllNqv in the cross sections along 121.5° E at 2100 UTC 7 August 2009. The blank bar denotes the pressure level beneath the ground surface.
Atmosphere 16 00910 g016aAtmosphere 16 00910 g016b
Figure 17. The forecast of typhoon track (a), CSLP ((c), hPa), and MSWP ((e), m s−1) and the errors of typhoon track ((b), km), CSLP ((d), hPa), and MSWP ((f), m s−1) against the observations valid from 1500 UTC 7 August to 0000 UTC 8 August 2009.
Atmosphere 16 00910 g017aAtmosphere 16 00910 g017b
Figure 18. The MSEu,l of the hourly precipitation forecast in (a) CNTL, (b) ExpVr, (c) ExpZ, (d) ExpAll, and (e) ExpAllNqv at 2100 UTC 7 August 2009.
Atmosphere 16 00910 g018aAtmosphere 16 00910 g018b
Figure 19. The temporal variation in the MSEu,l of the hourly precipitation forecast at the threshold of 5 mm in (a) CNTL, (b) ExpVr, (c) ExpZ, (d) ExpAll, and (e) ExpAllNqv.
Atmosphere 16 00910 g019aAtmosphere 16 00910 g019b
Figure 20. The IS skill score of the hourly precipitation forecast in (a) CNTL, (b) ExpVr, (c) ExpZ, (d) ExpAll, and (e) ExpAllNqv at 2100 UTC 7 August 2009.
Atmosphere 16 00910 g020aAtmosphere 16 00910 g020b
Figure 21. The temporal variation in the IS skill score of the hourly precipitation forecast at the threshold of 5 mm with error scale in (a) CNTL, (b) ExpVr, (c) ExpZ, (d) ExpAll, and (e) ExpAllNqv.
Atmosphere 16 00910 g021
Disclaimer/Publisher’s Note: The statements, opinions and data contained in all publications are solely those of the individual author(s) and contributor(s) and not of MDPI and/or the editor(s). MDPI and/or the editor(s) disclaim responsibility for any injury to people or property resulting from any ideas, methods, instructions or products referred to in the content.

