Article

Evaluating Policy Interventions for Air Quality During a National Sports Event with Machine Learning and Causal Framework

1
School of Ecology and Environment, Zhengzhou University, Zhengzhou 450001, China
2
Research Institute of Environmental Sciences, Zhengzhou University, Zhengzhou 450001, China
3
Department of Management, University of Birmingham, Edgbaston, Birmingham B15 2TT, UK
4
China Metallurgical Industry Planning and Research Institute, Beijing 100013, China
5
School of Geography, Earth and Environmental Sciences, University of Birmingham, Edgbaston, Birmingham B15 2TT, UK
*
Author to whom correspondence should be addressed.
Atmosphere 2025, 16(5), 557; https://doi.org/10.3390/atmos16050557
Submission received: 7 April 2025 / Revised: 27 April 2025 / Accepted: 1 May 2025 / Published: 7 May 2025

Abstract

:
Short-term control measures are often implemented during major events to improve air quality and protect public health. In preparation for the 11th National Traditional Games of Ethnic Minorities of China (denoted as “NMG”), held from 8 to 16 September 2019 in Zhengzhou, China, the authorities introduced several air pollution control measures, including traffic restrictions and dust control. In the study presented herein, we applied automated machine learning-based weather normalisation combined with an augmented synthetic control method (ASCM) to evaluate the effectiveness of these interventions. Our results show that the impacts of the NMG control measures were not uniform, varying significantly across pollutants and monitoring stations. On average, nitrogen dioxide (NO2) concentrations decreased by 8.6% and those of coarse particles (PM10) decreased by 3.0%. However, the interventions had little overall effect on fine particles (PM2.5), despite clear reductions observed at the traffic site, where NO2 and PM2.5 levels decreased by 7.2 and 5.2 μg m−3, respectively. These reductions accounted for 56.3% of the NMG policy’s effect on NO2 concentration and 73.2% of its effect on PM2.5 concentration at the traffic site. Notably, the control measures led to an increase in ozone (O3) concentrations. Our results demonstrate the moderate effect of the short-term NMG intervention, emphasising the necessity for holistic strategies that address pollutant interactions, such as nitrogen oxides (NOX) and volatile organic compounds (VOCs), as well as location-specific variability to achieve sustained air quality improvements.

1. Introduction

Large-scale events, such as sports games, national parades, and summits, can substantially deteriorate air quality and increase carbon emissions, due to the influx of visitors and the rise in air and ground traffic volumes [1]. During such events, both the general public and specific groups, such as athletes, may face higher health risks. Frequent short-term inhalation of air pollutants has been shown to negatively impact cardiovascular and respiratory health, mirroring the adverse effects of long-term exposure [2,3]. Athletes, in particular, are vulnerable because their increased ventilation rates during exercise lead to greater pollutant intake, bypassing nasal filtration and depositing pollutants deeper into the respiratory tract [4,5]. Studies consistently show that air pollution can significantly impair athletic performance [6,7]. It is important to monitor and maintain air quality during these events to protect the health of both attendees and the residents in the host city. Consequently, in China, regional governments often implement temporary pollution control measures to ensure air quality for sports events [8,9]. These measures include factory shutdowns, halting construction activities, vehicle restrictions, and enhanced public transportation, resulting in reduced emissions during events such as the 2010 Guangzhou Asian Games [10,11], the 2014 Nanjing Youth Olympics [12,13], the 7th Military World Games [14,15], and 2022 Olympic Winter Games [16,17].
The 11th National Traditional Games of Ethnic Minorities of China (denoted as “NMG” hereafter) was a major comprehensive sports event held in Zhengzhou, a central plain city of China, from the 8th to the 16th of September 2019. This event involved 34 participating delegations and over 7000 athletes. To enhance air quality during the NMG, Zhengzhou and its surrounding regions implemented a series of air pollution control measures in advance. These measures, detailed on the provincial government’s website and the PKULAW database of Peking University (https://www.pkulaw.cn/) (accessed on 26 May 2024), focused on environmental remediation along urban expressways, comprehensive greening initiatives, and rigorous dust control protocols. Specific actions included night-time segmented control of construction waste transport vehicles, stricter regulation of diesel truck restrictions, enhanced greening, such as street trees replanting, bans on outdoor barbecues, and ensuring compliance of cooking smoke from night market stalls with emissions standards. During the NMG, certain citizens were granted leave, and traffic restrictions were enforced. The NMG offers a valuable natural experimental scenario to explore the effects of emission controls on reducing atmospheric pollutants in the central plain region of China, where research on the effects of such policies lags behind that in more developed areas.
However, evaluating the effectiveness of these control measures on air quality improvement is complex. Prior research on policy effects and air pollution has largely been observational [18,19,20], making it susceptible to confounding factors [21]. Many assessments rely on process-based air quality models and emission inventories [16,22,23], which, while useful, introduce several layers of uncertainty. Emission inventories, for example, though improved in accuracy over recent decades, remain challenging to quantify precisely in China due to the diverse emission sources, complex technology mixes, and inadequate reliable measurements [24,25,26,27,28]. These uncertainties can be further compounded by data gaps, making it difficult to isolate the true impact of temporary interventions on pollutant levels. Since meteorological variations can overshadow the environmental benefits of pollution control actions [29,30], advanced machine learning methods, such as Random Forests (RF), have proven effective in decoupling meteorological influences from pollutant concentration trends [31,32]. Additionally, the synthetic control method (SCM) provides a robust comparative framework for assessing intervention efficacy by constructing counterfactual scenarios [33]. By reducing reliance on uncertain emission inventories and accounting for meteorological variability, these methods could enhance the reliability of policy impact assessments [27,34,35].
Building on these approaches, in the study presented herein, we applied a combined automated machine learning method for weather normalisation and an augmented synthetic control method (ASCM, for building the business-as-usual condition) framework to evaluate the effectiveness of the air quality interventions implemented during the NMG event. We also introduced a traffic increment metric to evaluate the traffic-related pollution above urban background levels [36,37]. This metric offers a deeper understanding of the relationship between event-related traffic and air quality. Our findings highlight both the benefits and limitations of the NMG control measures, presenting a multidimensional analysis that contributes to the existing body of knowledge. This research serves as a foundation for more refined, evidence-based policy design in future events, ultimately aiding in the protection of public health, especially among vulnerable groups.

2. Methodology

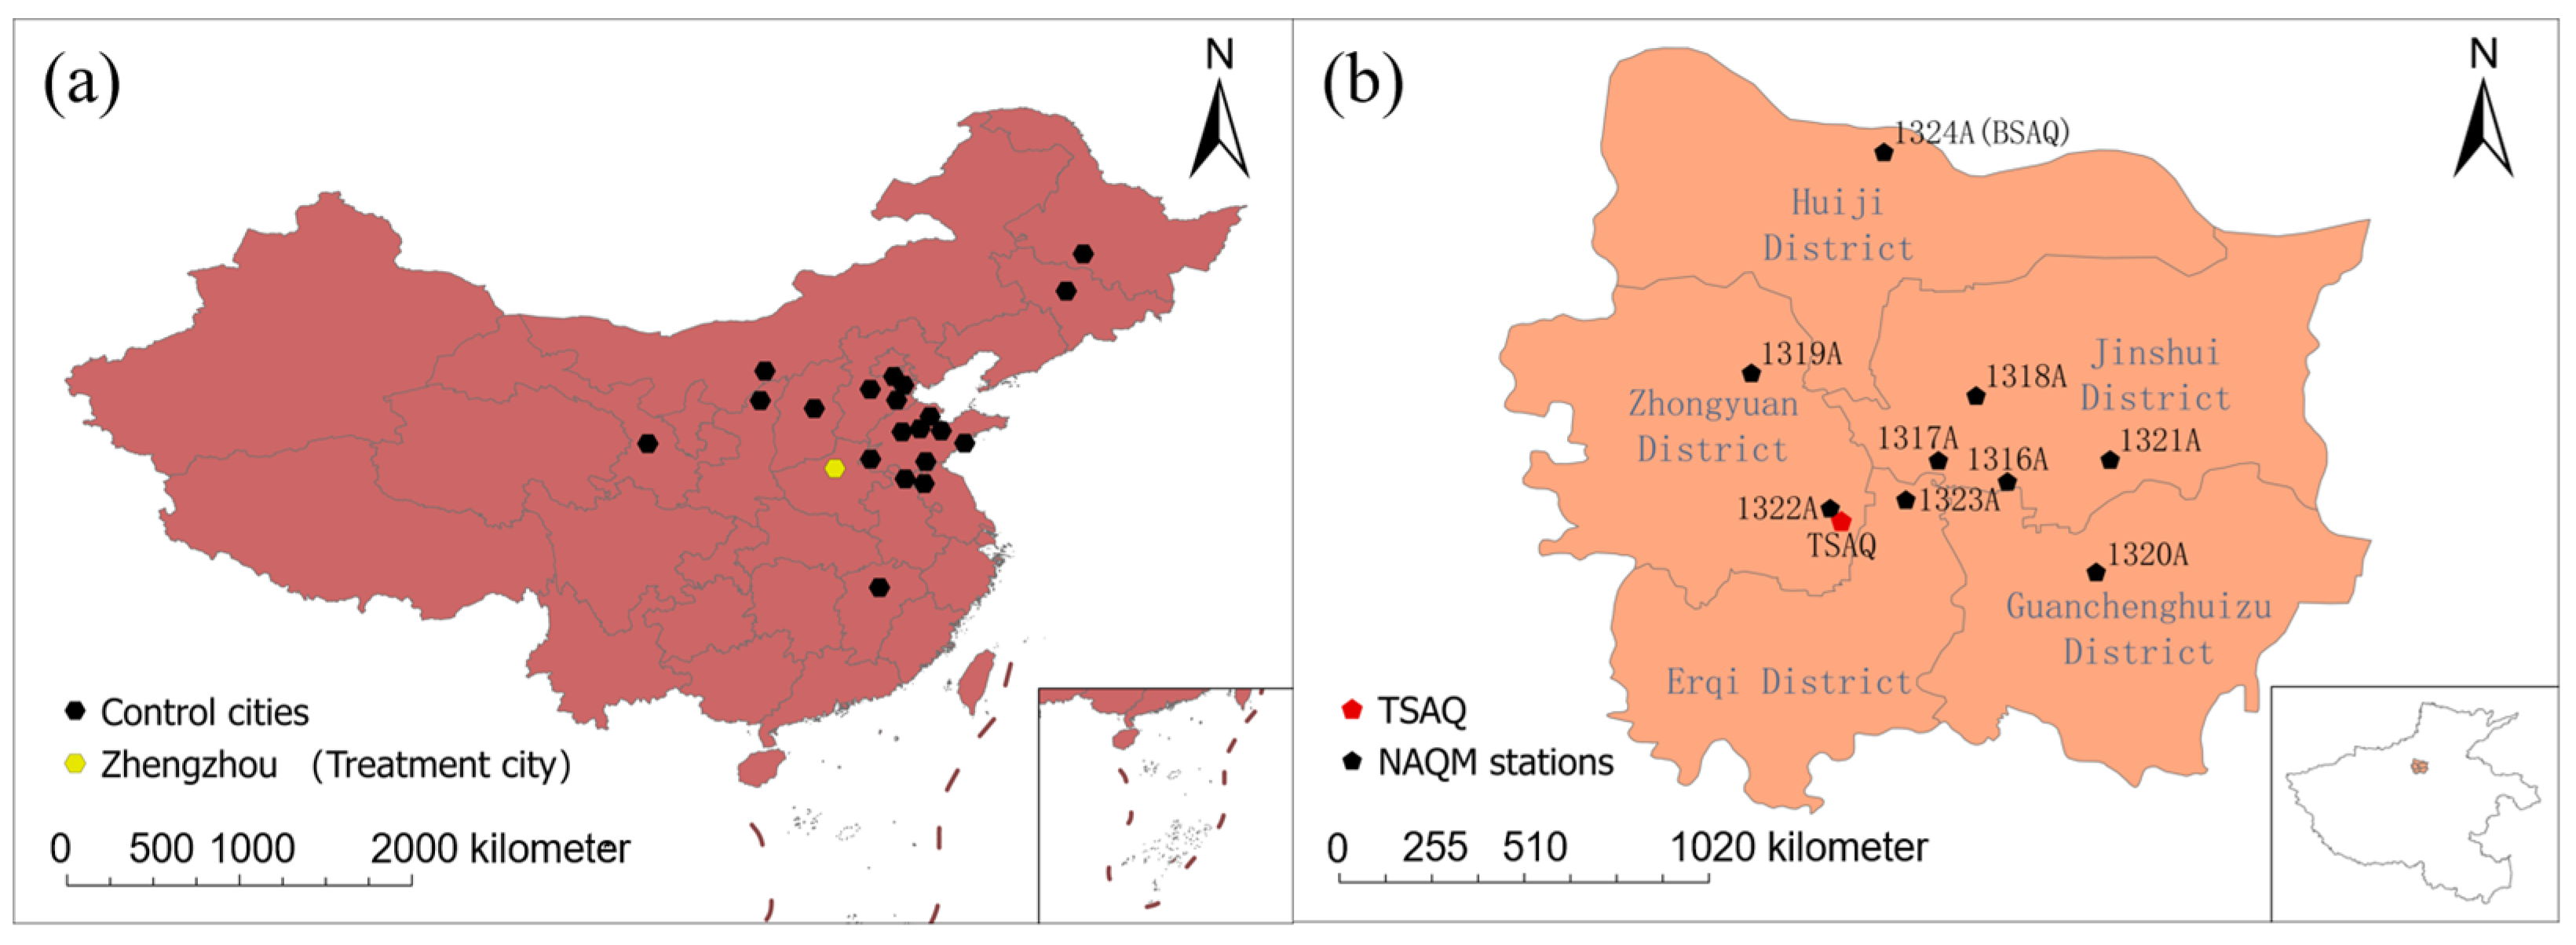
2.1. Quasi-Natural Experimental Designs

In this study, the quasi-natural experiment design was employed to evaluate the potential causal impacts of the NMG control policy on air quality in Zhengzhou, the provincial capital of Henan, China. Air pollutant monitoring stations located within Zhengzhou, which were subject to policy interventions during the NMG, were designed as treated sites, while stations in other Chinese cities without similar interventions served as control sites. The ASCM was used to generate synthetic trends based on control sites to represent the “business-as-usual (BAU)” conditions in Zhengzhou, had the NMG interventions not occurred. The differences between air quality at treated sites and these BAU trends allow us to evaluate the effectiveness of the NMG-related policies.
For the control sites, we selected 20 cities across China (Figure 1a, Table 1) based on the following criteria: (1) cities with comparable GDP and population size to Zhengzhou and (2) cities that did not implement any significant air pollution control measures during the NMG policy window and were not affected by the interventions in Zhengzhou. To further reduce the influence of long-distance pollutant transport, all control cities were located outside Henan Province and at a sufficient distance from the air quality monitoring sites in Zhengzhou. These selected control sites enabled the construction of synthetic pollution trends for a BAU comparison to assess the impact of NMG interventions on air quality in Zhengzhou.
Nine national air quality monitoring (NAQM) stations within the China National Environmental Monitoring Network are located across different districts of Zhengzhou (Figure 1b). The NAQM stations are categorised by their locations as follows: Yanchang (1316A) and Heyida (1323A) in the business district; Zhengfangji (1317A) and Shijiancezhan (1322A) in the residential area, Yinhangxuexiao (1318A), Gongshuigongsi (1319A), Jingkaiquguanwei (1320A), and Sishiqizhong (1321A) in a cultural and educational area, and the Gangli Reservoir (1324A) in a suburban area. Except for the background station for air quality monitoring 1324A (hereafter referred to as “BSAQ”), the other eight urban stations represent the general urban air quality of Zhengzhou. In addition, a municipal monitoring station located at the intersection of Longhai Road and Qinling Road, a heavily trafficked area with an average of 30,000 vehicles per day in 2019, was used to assess the impact of traffic-related pollution. By comparing pollution levels at this traffic station for air quality monitoring (denoted as “TSAQ”) with the BSAQ, we quantified the additional pollution attributed to traffic beyond the baseline urban pollution levels.

2.2. Data Source

Hourly data of nitrogen dioxide (NO2), ozone (O3), fine particles (PM2.5), and particulate matter with an aerodynamic diameter of less than 10 micrometres (PM10) from 2017 to 2019 at the nine NAQM stations in Zhengzhou and urban average data from control cities were obtained from the China National Environmental Monitoring Network website (https://www.cnemc.cn/) (accessed on 26 May 2024). NO2 and O3 were measured using the chemiluminescence method (TEI Model 42i from Thermo Fisher Scientific Inc., Waltham, MA, USA, or EC9841 from Ecotech Pty Ltd., Knoxfield, VIC, Australia) and the UV-spectrophotometry method (TEI model 49i from Thermo Fisher Scientific Inc., Waltham, MA, USA, or EC9810 from Ecotech Pty Ltd., Knoxfield, VIC, Australia), while PM2.5 and PM10 were measured using the micro oscillating balance method (TEOM from Rupprecht & Patashnick Co., Inc., Albany, NY, USA) and the β absorption method (BAM 1020 from Met One Instrument Inc., Grants Pass, OR, USA or Tianhong Co., Wuhan, China or Xianhe Co., Zhejiang, China) [38]. Hourly data on nitrogen oxide (NO), NO2, O3, PM2.5, and PM10 concentrations from 2018 to 2019 at the TSAQ were collected following ambient air quality standards (GB3095-2012) [39]. A smart sensor (Wavetronix LLC, Springville, UT, USA) was used to measure hourly traffic volume at the TSAQ. Hourly meteorological data, including wind speed, wind direction, temperature, atmospheric pressure, and relative humidity, were obtained from the National Oceanic and Atmospheric Administration (NOAA) using the “worldMet” R package (version 0.9.9), developed by [40].

2.3. Weather Normalisation

To accurately assess the impact of the NMG policy on air quality, it is important to account for the influence of meteorological conditions. A machine learning-based weather normalisation approach was employed through the aqpet R package to remove the variability caused by meteorological factors such as temperature, wind speed, and humidity [41]. We constructed a gradient boosting machine (GBM) model using H2O.ai’s Automatic Machine Learning (AutoML) framework, which automates hyperparameter selection and streamlining tasks from preprocessing to model evaluation [42]. Such an approach has been recently applied to atmospheric and environmental research [43]. For model construction, we randomly designated 80% of the original data for training and used the remaining 20% for testing. Up to 30 models were generated for each pollutant at each monitoring station, with the GBM model exhibiting the lowest root mean square error (RMSE) chosen for further analysis. Detailed information on this method is shown in the Supplementary Materials.

2.4. Augmented Synthetic Control Method

Studies across various fields have applied the synthetic control method (SCM) to evaluate policy impacts [44,45]. The SCM constructs an artificial treatment unit, or “synthetic city”, by averaging outcome variables from a group of control cities to replicate the trend of those values in the treatment city without policy implementation. The augmented synthetic control method (ASCM), which incorporates a ridge regression model, improves upon SCM by addressing biases due to imperfect pre-intervention fit and correcting the original SCM estimate [46]. The ridge ASCM has been shown in previous studies to significantly enhance the pre-treatment match compared to using uniform weights across cities within the control group [35]. As mentioned above, the overall objective of the ASCM is to establish a BAU scenario, which serves as a baseline for comparison. The BAU scenario depicts the expected conditions without any intervention affecting air quality, offering a reference point for assessing the actual impact of policy measures for the NMG event. The analysis included a pre-intervention period (Pre-NMG) from 15 June 2019 to 31 July 2019, prior to the implementation of the NMG policy, and a post-intervention period (During-NMG) from 1 August 2019 to 16 September 2019, following the introduction of the policy. Detailed information is provided in the Supplementary Materials.

3. Results and Discussion

3.1. Weather-Normalised Concentration Trends

From 2018 to 2019, weather-normalised concentrations of NO2, O3, PM2.5, and PM10 in Zhengzhou showed an overall downward trend (Figure 2 and Figures S1–S8). In urban areas (i.e., averaged pollutant concentrations from NAQM stations, excluding the BSAQ), there were reductions in the annual mean concentrations of NO2 (from 49.3 to 45.1 μg m−3 8.4%), PM2.5 (from 68.8 to 62.2 μg m−3, 9.7%), and PM10 (from 120.5 to 109.2 μg m−3, 9.4%), with only a slight decrease in O3 (from 62.4 to 61.9 μg m−3, 0.8%). Daily paired sample t-test results indicated that the decreases in NO2, PM2.5, and PM10 weather-normalised concentrations in 2019 relative to 2018 were statistically significant (p < 0.001). These reductions are consistent with the broader national trend in air pollutant emissions reported from 2014 to 2019 [47]. At the TSAQ, the annual mean concentrations of NO2 and PM10 showed a decrease of 9.6% from 78.0 to 70.5 μg m−3 and 6.4% from 127.8 to 119.7 μg m−3, respectively, followed by a smaller reduction in PM2.5 from 73.5 to 72.0 μg m−3 (2%). O3 levels, however, showed little change, less than one percent. The relatively smaller decrease in PM2.5 at the TSAQ compared to urban stations suggests that traffic emissions may not be the main contributor of PM2.5 in Zhengzhou [48].
At the BSAQ, the annual mean concentrations of PM2.5 showed the largest decrease from 54.1 to 48.7 μg m−3 (10.0%), while NO2 and O3 saw more modest decreases of 3.8% and 1.7%, respectively. PM10 levels remained nearly constant (0.2%). The significant decrease in PM2.5 at the BSAQ may be affected by the ban on open-air straw burning and other agricultural control measures implemented in Henan Province since 2018 [49]. In addition, the “Clean Winter Heating Plan (2017–2020)” issued by China in 2017 (replacing coal with electricity and gas, encouraging the phase-out of coal-fired boilers, enhancing coal quality control, etc.) and the “West to East Heat Transmission” project issued in 2018 in Zhengzhou (heating system upgrades) may have played a certain positive role in reducing concentrations of PM2.5 and nitrogen oxides (NOX) [50]. These effects were especially evident in winter, with PM2.5 concentrations decreasing by 21.0% and 23.0% at NAQM urban stations and the BSAQ, respectively.
The trends of air pollutants in Zhengzhou exhibited clear seasonal patterns in 2018 and 2019 (Figures S5–S8). The winter-high and summer-low concentrations of NO2, PM2.5, and PM10 were mainly attributed to the high emissions from artificial heating in colder months [51,52]. In contrast, O3 showed an inverse seasonal trend, with higher levels in summer and lower in winter, consistent with the trends reported by [53]. This pattern is largely driven by stronger solar radiation in summer, which accelerates photochemical reactions and increases O3 production rates [51,54].
As expected, NO2 concentrations at the TSAQ were significantly higher than at the BSAQ, reflecting the substantial contribution of urban traffic [55]. Higher NO levels at the TSAQ (Figure S9) promote titration reactions [56], leading to lower O3 concentrations compared to those at the BSAQ. In addition, similar PM2.5 levels were found at the TSAQ and BSAQ, and this could be attributed to the regional transport around Zhengzhou [57]. Slightly higher PM10 levels at the TSAQ compared to the BSAQ may be related to on-road emissions [58,59].

3.2. NMG Policy Impact on Air Quality

Using the ASCM method, we established a counterfactual BAU scenario for weather-normalised air pollutant concentrations. This scenario represents conditions without the implementation of the NMG policy, allowing for a comparison with actual pollutant levels during the event. The NMG policy’s effects on key pollutants (NO2, O3, PM10, and PM2.5) were assessed by comparing percentage (Figure 3) and absolute differences (Figure S10) at the eight NAQM urban stations, TSAQ, and BSAQ in Zhengzhou.

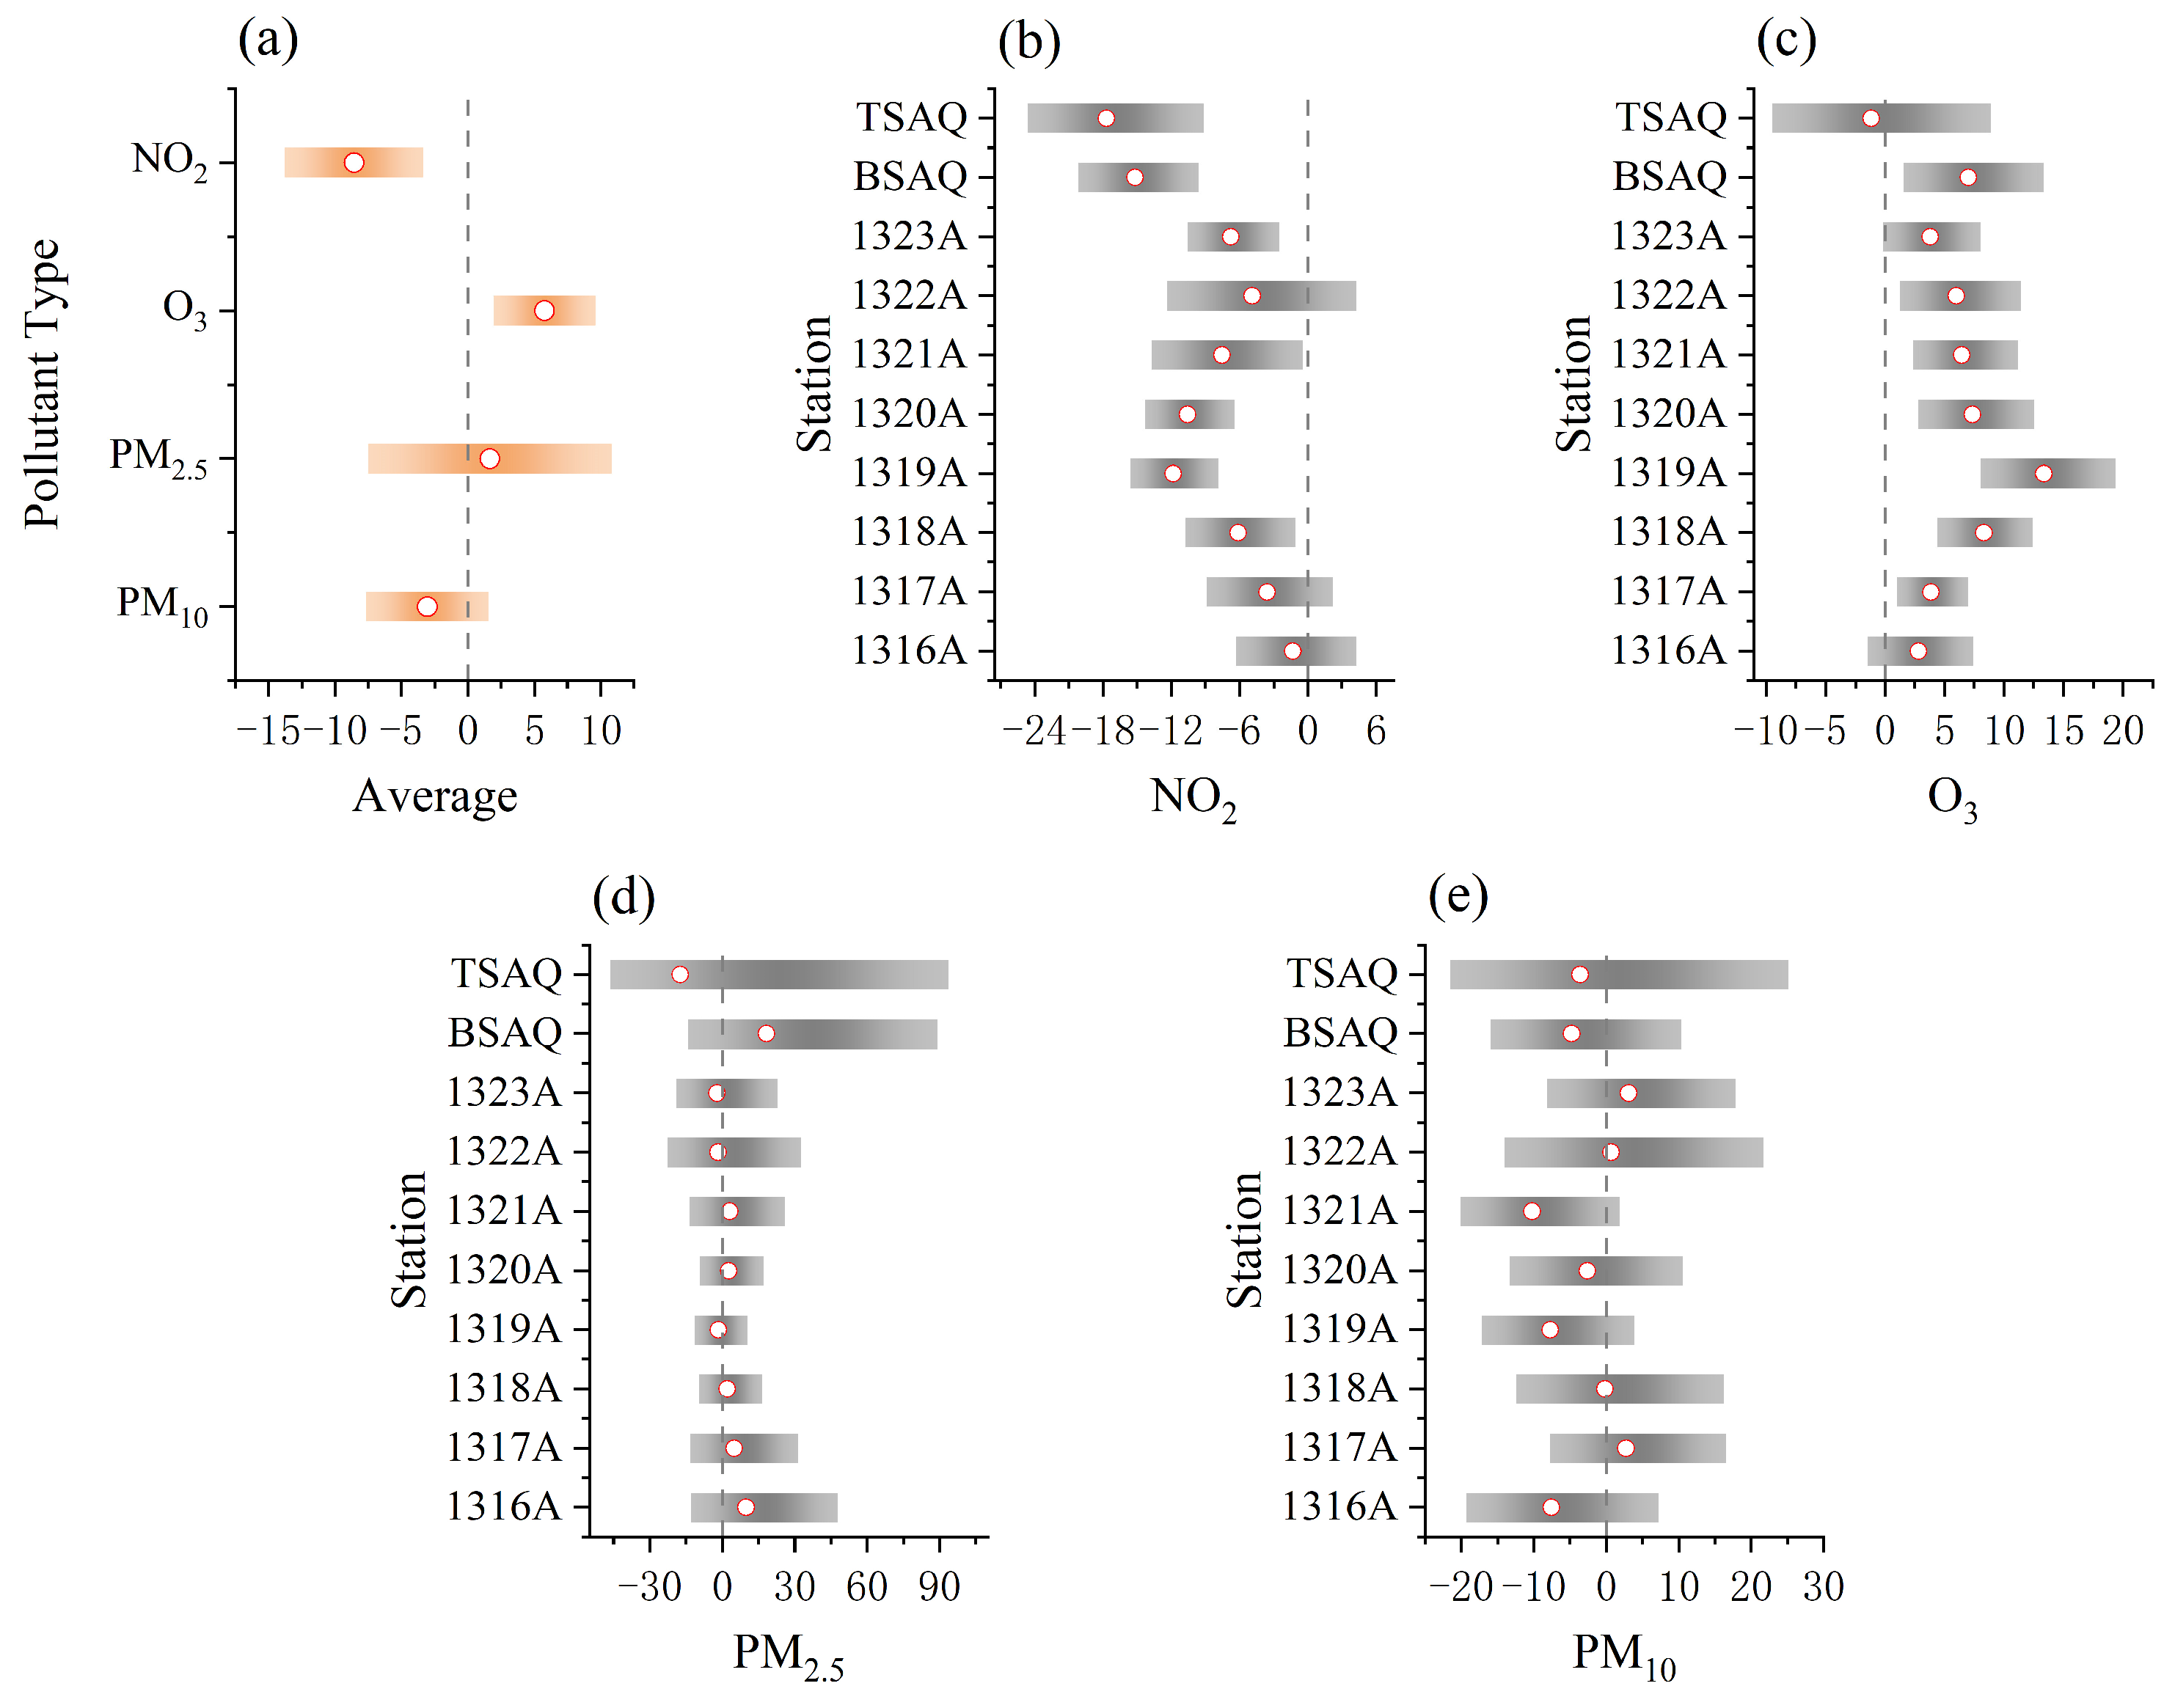
3.2.1. NGM Policy Impact on Pollutants

The NMG policy had the greatest impact on NO2, resulting in an average reduction of 8.6% compared to the BAU scenario. In contrast, O3 concentrations rose by 5.8% from 66.5 to 70.6 μg m−3. The increase is consistent with known chemical reactions that reduce O3, as studies have shown that reducing both particulate matter and NO concentrations can contribute to an increase in O3 concentration [22,60,61]. Furthermore, in the central area of Zhengzhou, O3 formation is in the NOX-saturated regime (VOC-sensitive) [62], thus moderate reductions in NOX can lead to increased O3 levels. However, a significant decrease in NOX levels will shift the mechanism controlled by volatile organic compounds (VOCs) to a mechanism controlled by NOX, thereby effectively reducing O3 levels [63].
Considering particulate matter, PM10 concentrations decreased from 56.0 to 54.3 μg m−3 (3.0%) under the NMG policy. Road dust is the largest contributor to PM10 [64]. The main factors influencing road dust accumulation include both exhaust and non-exhaust from vehicles, dust sources such as soil and construction activities, coal combustion, industrial activities, and secondary particles [64]. Each of these sources contributes differently depending on local environmental conditions and urban planning, thus impacting the quantity and characteristics of road dust.
The NMG policy had little impact on overall PM2.5 levels, with a small observed increase of 1.7% during the NMG period. Residential-related emissions, including those from coal and biomass combustion, accounted for a large share of PM2.5 in Zhengzhou [48,65]. In addition, ammonia (NH3) emissions from urban domestic sewage and agricultural sources also contribute significantly [66,67]. Besides local emissions, regional transport is the second-largest contributor to the increase in PM2.5 levels in Zhengzhou [65,68].

3.2.2. Variations Across Monitoring Stations

The NMG policy’s impact varied significantly across the TSAQ, BSAQ, and other urban air quality monitoring stations (Figure 3 and Figure S10). At the TSAQ, the most pronounced reductions were observed for NO2 and PM2.5, which decreased by 17.7% from 61.5 to 52.3 μg m−3 and by 17.5% from 35.6 to 30.3 μg m−3, respectively. In contrast, reductions in PM10 were more modest at 3.6% from 73.0 to 70.4 μg m−3, indicating that there exist other emission sources. During the policy implementation period, O3 levels at the TSAQ also saw a slight decrease of 1.2% from 58.5 to 57.8 μg m−3. In contrast, at the BSAQ, NO2 and PM10 concentrations were reduced by 15.2% from 23.3 to 20.2 μg m−3 and by 4.8% from 57.6 to 55.0 μg m−3, respectively. O3 and PM2.5 concentrations increased by 7.0% (from 57.0 to 61.3 μg m−3) and 18.1% (from 19.1 to 23.4 μg m−3). The BSAQ is located in an area without nearby industrial activities, with observed NO2 concentrations approximately 18–66 μg m−3 (about 20–40%) lower than those at other stations. Consequently, the percentage reduction in air pollutant concentrations at this station appears more pronounced due to its typically lower baseline levels. The observed increase in PM2.5 at the BSAQ may be partially attributed to the long-range transport of PM2.5 from surrounding areas [48], and it could also be due to the enhanced formation of secondary aerosols offsetting the reduction in primary PM2.5 emissions [69]. The decrease in PM10 during the NMG period may be related to dust control measures at the time. The increase in O3 is attributed to reduced NO titration, as NO levels decreased (Figures S11 and S12) [56,69].
The NMG policy showed positive control effects on NO2 levels across all NAQM stations in Zhengzhou. Although reductions in NO2 concentration at stations 1319A and 1320A were not as pronounced as those at the TSAQ and BSAQ, they still showed clear policy effects (11.7% and 10.6%, respectively). From 8 to 16 September 2019, temporary traffic flow control measures were implemented on Science Avenue (from Changchun Road to the West Third Ring Expressway) near 1319A and Dongfeng South Road (from Jinshui East Road to the Longhai Expressway) near 1320A based on actual traffic conditions [70]. The decrease in NO2 concentrations (3.5 μg m−3 for 1319A and 3.2 μg m−3 for 1320A) indicates the effectiveness of the traffic restriction policy. The station with the least effect, 1316A, is in a predominantly commercial and residential area and near the intersection of the Longhai Expressway and Zijinshan Road, a major traffic artery. While the NMG policy restricted traffic on the second layer of the Longhai viaduct, it did not fully restrict traffic on the first layer, where the monitoring station is positioned. As a result, the reduction in vehicle numbers at this location was likely small. Additionally, emissions from nearby industrial sources, such as fuel combustion, may have further reduced the effectiveness of the policy at this station. As expected, stations with larger reductions in NO2, particularly those not dominated by traffic emissions, saw a bigger increase in O3 levels, especially at station 1319A.
Although the NMG policy showed a positive reduction effect at the TSAQ, its impact on PM2.5 levels at most urban stations and the BSAQ was limited. The authors of [48] reported that the sources of PM2.5 in Zhengzhou were primarily residential-related sectors (residents and agriculture), accounting for 49%, followed by dust (19%), traffic (15%), and industrial emissions (13%). The NMG policy measures did not cover residential emissions. This is consistent with the relatively small contribution of traffic-related emissions to PM2.5 in Zhengzhou. Additionally, the presence of nearby industrial emission sources at the 1316A station may influence the effectiveness of the policy in lowering PM2.5 concentrations at this station. The varied effects of PM10 across those urban air quality stations highlight the complexity of interpreting changes in PM10 levels. Stations 1316A, 1319A, and 1321A showed more prominent effects, which may be related to strengthened dust control measures nearby.
The surrounding environment and conditions of the TSAQ, the BSAQ, and other urban stations play an important role in explaining their variations in the effectiveness of NMG control measures. The policy documents [70,71] indicate that citywide road restrictions were implemented during the NMG, particularly on major thoroughfares. However, the “conditional restrictions” applied to certain roads, where restrictions are enforced based on specific conditions, complicate the quantification of their exact impact. Among all monitoring stations, TSAQ is directly located on roads subject to traffic restrictions, while urban stations 1317A, 1318A, 1319A, 1320A, 1321A, 1322A, and 1323A are situated within the restricted traffic zones. At these locations, NO2 levels exhibited a significant response to policy interventions. However, apart from a noticeable decline in PM2.5 at the TSAQ, reductions in PM2.5 at the other stations remained minimal. This suggests that short-term, localised measures to control PM2.5 have not had a positive impact on the citywide PM2.5 levels.
In summary, the NMG policy had notable success in reducing NO2 levels across Zhengzhou, particularly at traffic (TSAQ) and background (BSAQ) stations. However, its impact on PM2.5 and O3 is more complex. The chemical reactions between NOX and VOCs, for instance, contributed to an increase in O3 concentrations, illustrating the limitations of short-term interventions in addressing air quality issues. While short-term interventions can moderately improve the overall air quality, effective air quality management in Zhengzhou will require a long-term coordinated approach that addresses both local and regional emissions and considers the unique chemistry of each pollutant.

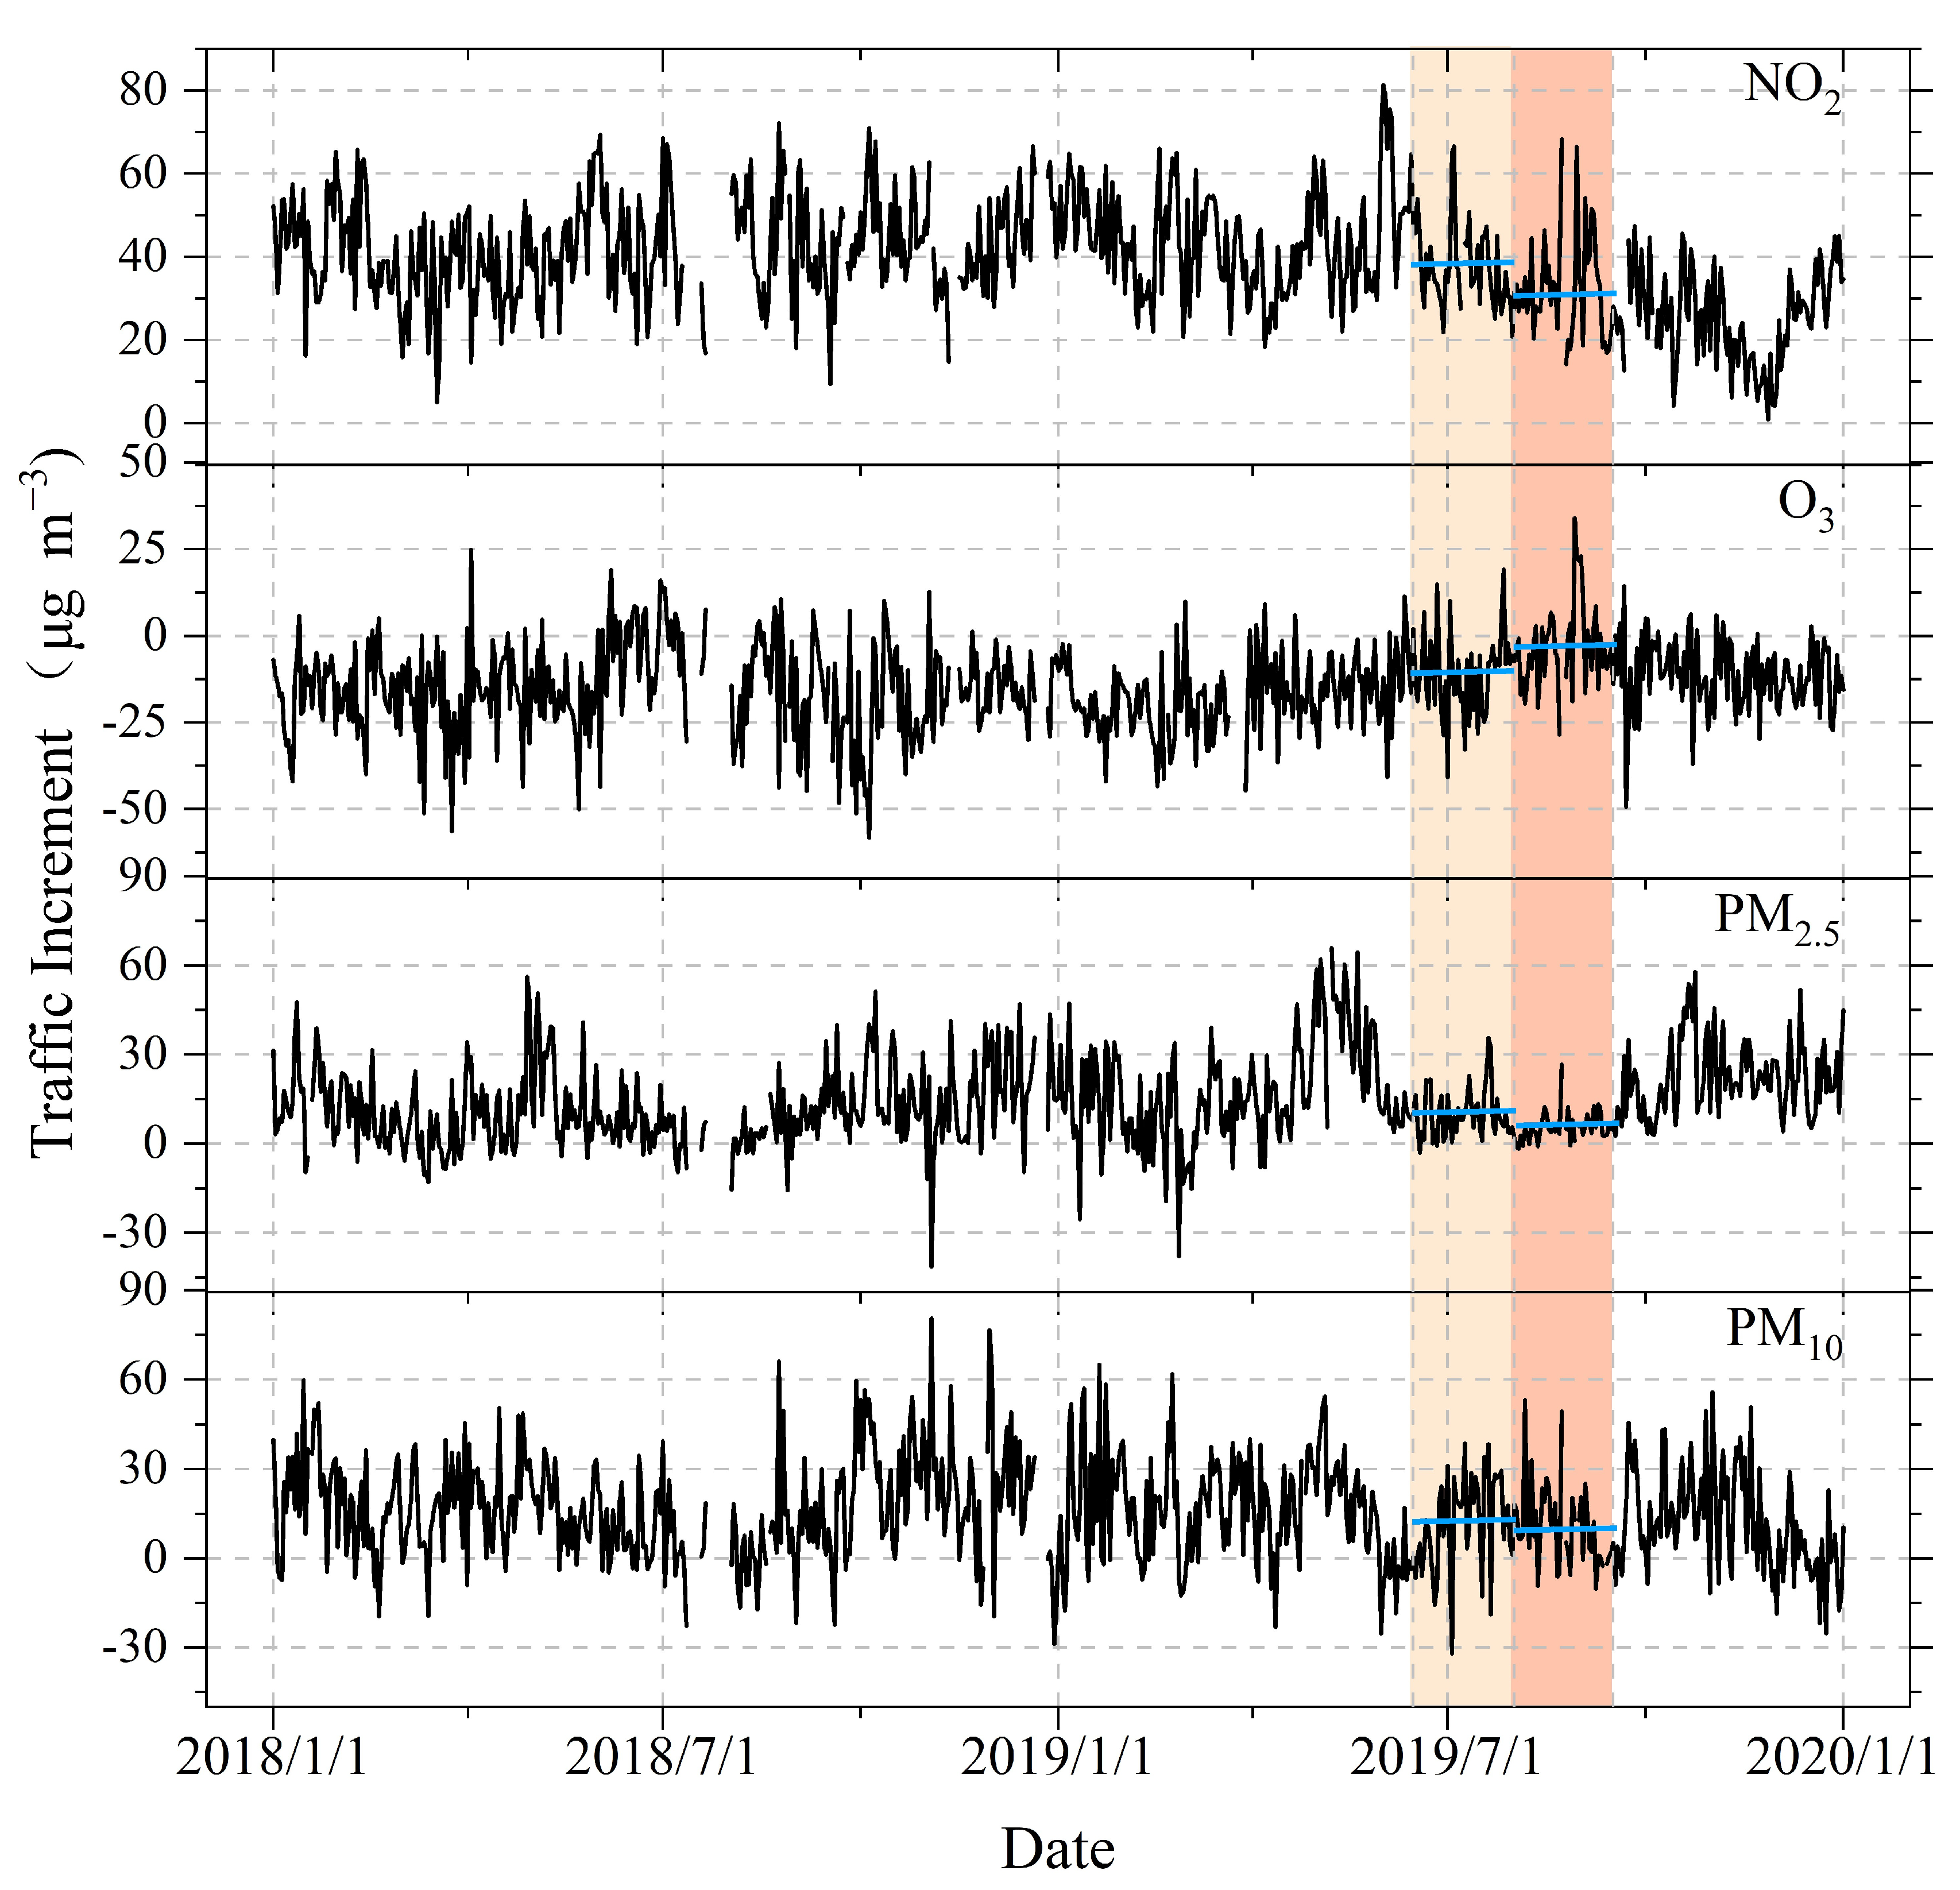
3.3. Traffic-Related Air Pollution and Increment Trends

3.3.1. Annual Trend and Pre-NMG vs. During-NMG Traffic Increment Analysis

Traffic increment, defined as the concentration difference between traffic and background air quality stations, is an important indicator of traffic-related air pollution [27,72,73]. In Zhengzhou, traffic increments of particulate matter were generally (Table 2) higher than in cities such as London, Paris, and Beijing, in contrast with NOX pollution. This can be attributed to variations in vehicle emission standards and fuel types. For instance, European cities introduced stringent Euro 5 (2011) and Euro 6 (2013) standards [27] earlier, whereas Zhengzhou fully implemented equivalent emission standards (China National V) between 2017 and 2018, about two years later than Beijing (i.e., 2016) [74]. This lag may explain the higher PM2.5 traffic increment in Zhengzhou. Additionally, diesel vehicles emit more NOX compared to gasoline-powered vehicles [75,76]. The lower use of diesel vehicles in China (9.1%) [77,78] compared to that in Europe (40%) [79] contributes to lower NOX traffic increments in Zhengzhou and Beijing.
Between 2018 and 2019, Zhengzhou saw a 4.8 μg m−3 (42.1%) increase in the PM2.5 traffic increment (Table 2, Figure 4), driven by a sharp drop in PM2.5 concentrations at the BSAQ. In contrast, traffic increments for NO2, O3, and PM10 decreased by 10–20%, suggesting variability in their sources and environmental influences such as traffic patterns, types of fuel used, and chemical reactions in the atmosphere [43].
Following the implementation of the NMG policy (During-NMG), traffic increments for all air pollutants (i.e., NO2, O3, PM2.5, and PM10) decreased, with PM2.5 and NO2 showing the largest reductions of 5.2 μg m−3 (48.5%) and 7.2 μg m−3 (18.9%), respectively (Table 2 and Figure S13). These results are consistent with significant reductions in NO2 and PM2.5 at the TSAQ, as analysed using ASCM (Figure 3). Additionally, a 16.3% decrease in total traffic volume during the NMG period, following traffic restrictions on major roads near the TSAQ, was observed (Figure S14). As indicated by the traffic increments, the decrease in traffic-related PM2.5 and NO2 concentrations accounted for 73.2% and 56.3%, respectively, of the overall effects of the NMG policy on the TSAQ.

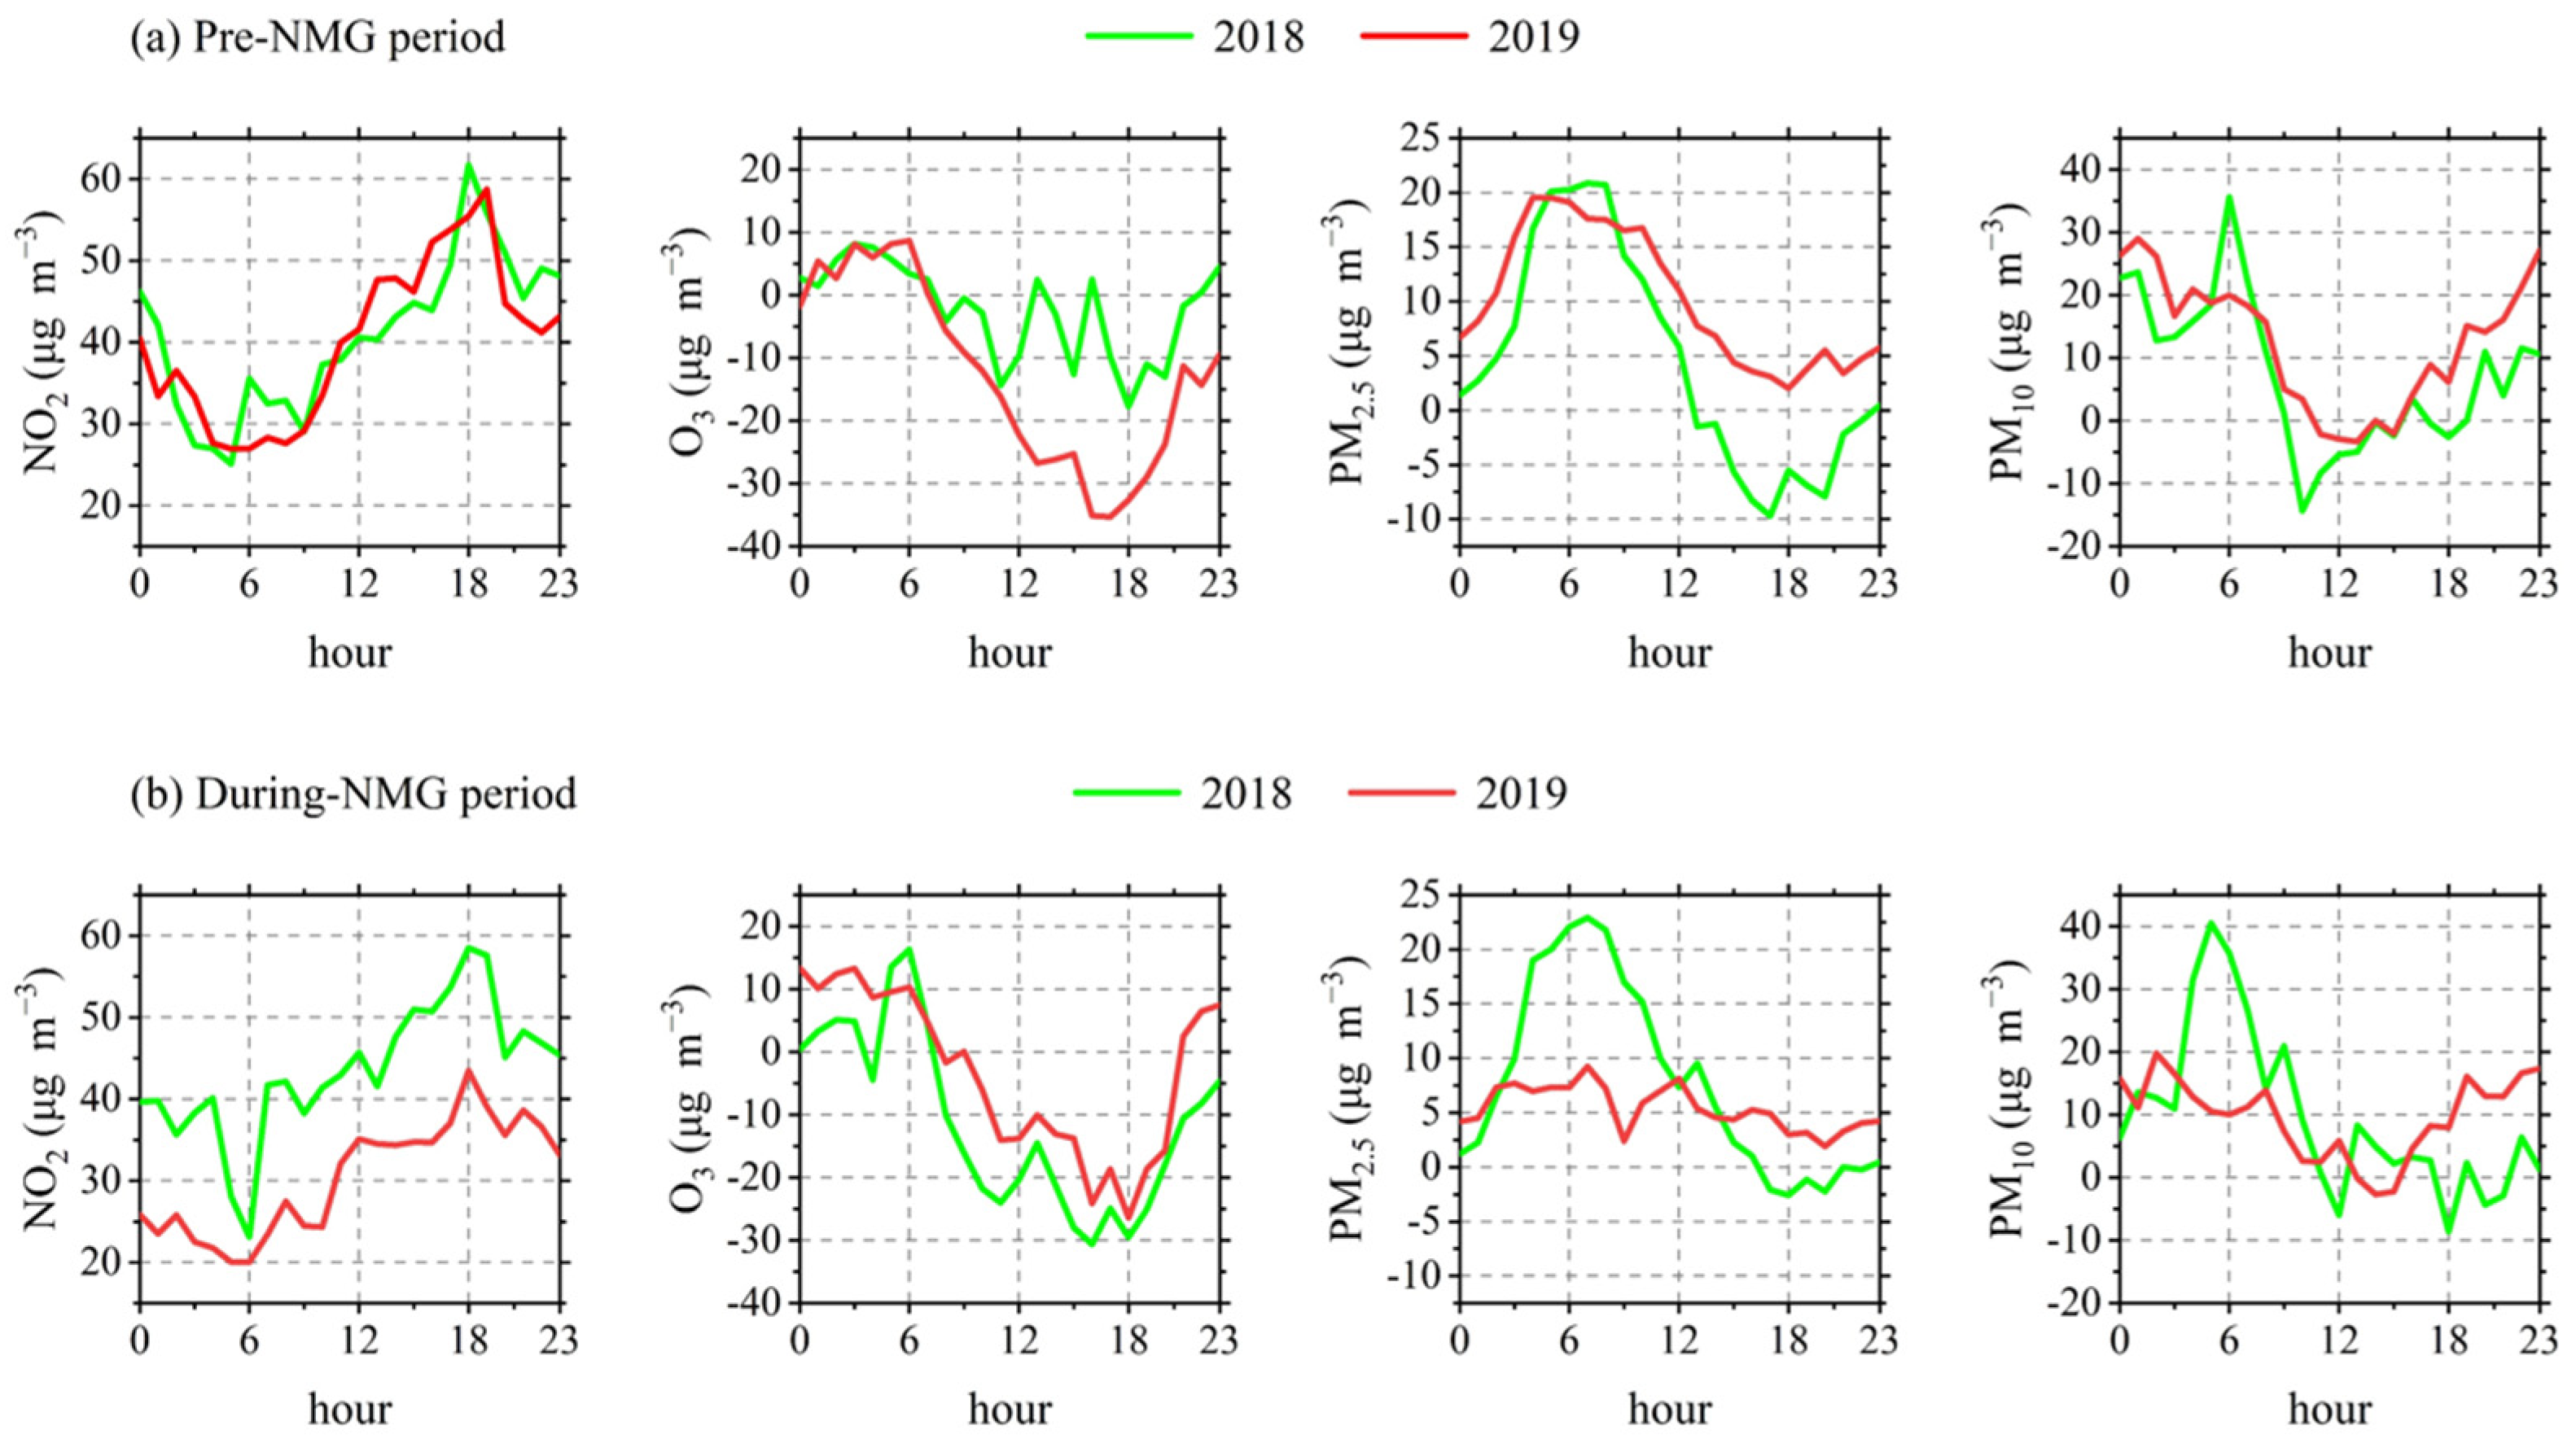
3.3.2. Diurnal Variations in Traffic Increments

Figure 5 presents the diurnal trends of traffic increments for NO2, O3, PM2.5, and PM10 within both the Pre-NMG and During-NMG periods, compared to the same time frame in 2018. In the Pre-NMG period, NO2 traffic increments exhibited a clear diurnal pattern, peaking at around 18:00 during the evening rush hour and reaching their lowest point at around 6:00 in the morning (Figure 5a). This variation is directly tied to traffic flow, which is about half as intense at 6:00 compared to 18:00 (Figure S15). Stronger atmospheric boundary layer convection in the afternoon likely facilitated pollutant dispersion and dilution later in the day [80]. The traffic increment of O3 showed an inverse pattern to NO2, with higher levels at night and early morning (around 23:00 to 6:00) and a decline during the day. This inverse relationship reflects the photolysis-driven dynamics of O3 formation [81], which is not solely dependent on traffic emissions.
During the NMG period in 2019, the NMG policy led to consistently lower NO2 traffic increments throughout the day, with a notable 34.1% reduction in NOX traffic increments compared to the same period in 2018 (Figures S11 and S12). This decline trend is consistent with the 16.1% drop in traffic volume during the NMG (Figure S14). This indicates the effectiveness of traffic restriction measures in reducing vehicular-related emissions. In contrast, the O3 diurnal traffic increment increased during the NMG in 2019 (−11.0 μg m−3) compared to the same period in 2018 (−3.2 μg m−3), mainly due to a 13.7% decrease in O3 concentrations at the BSAQ, while the O3 concentration at the TSAQ only decreased by 2.5%. The formation of O3 in the centre of Zhengzhou city was reported to be a VOC-limited condition, while the suburban areas could be classified as NOX-limited zones [82]. A 19.7% reduction in NOX concentrations at the BSAQ (Figures S11 and S12) likely contributed to the significant decrease in O3 levels in those areas.
The diurnal traffic increments of PM2.5 and PM10 also showed significant changes during the NMG period in 2019. At around 6:00 a.m., PM2.5 and PM10 traffic increments decreased by 66.9% (14.8 μg m−3) and 72.0% (25.7 μg m−3), respectively, with fewer fluctuations observed throughout the day compared to 2018. In addition to traffic restrictions, the observed reductions could also be attributed to the dust control measures implemented during the NMG period [83], such as spray dust suppression and the use of dust-proof cloths at construction sites. However, the diurnal average traffic increment of PM10 remained relatively unchanged (0.4%), while the PM2.5 traffic increment decreased by 30.5% (2.3 μg m−3). This limited reduction in PM10 may be due to a slower decline in the background levels compared to the traffic areas.

4. Conclusions and Implications

In this study, we employed an automated machine learning weather normalisation approach combined with the Augmented Synthetic Control Approach (ASCM) to evaluate the short-term air quality interventions implemented during the 11th National Traditional Games of Ethnic Minorities of China (NMG) in Zhengzhou, China, in September 2019. The results show that while the NMG control measures significantly reduced the concentration of traffic-related pollutants such as NO2, they were less effective in mitigating other pollutants like PM2.5 and O3. The greatest improvements were observed at the TSAQ, where NO2 concentrations dropped by 17.7% from 61.5 to 52.3 μg m−3 and PM2.5 concentrations dropped by 17.5% from 35.6 to 30.3 μg m−3. These results support the effectiveness of traffic control measures, particularly in reducing vehicular emissions. Traffic-related NO2 and PM2.5 accounted for 56.3% and 73.2% of the total reduction, respectively, during the NMG period, indicating that the policy had a substantial localised impact on areas dominated by traffic emissions. However, the effect of the NMG measures across other urban air quality stations showed less pronounced reductions, with only marginal reductions observed in NO2 and PM10. This discrepancy indicates that NMG control measures primarily impacted traffic-related emissions, while emissions from other sectors, such as industrial and residential activities, remained largely unaddressed.
Moreover, despite these short-term reductions, none of the pollutants met World Health Organization (WHO) (Table S1) standards after policy implementation. NO2 levels remained 23.2% above the WHO 24 h guideline of 25 μg m−3, with even the best-performing stations (1317A and 1318A) still exceeding the standard by 0.7% and 3.7%, respectively. O3 concentrations, already 10.8% above the WHO level (60 μg m−3) before the policy, increased further to 17.6%. PM10 reductions varied across different monitoring stations, yet the citywide average remained 20.8% above the WHO 24 h standard of 45 μg m−3. More concerningly, PM2.5 levels remained 55.3% above the WHO 24 h standard of 15 μg m−3 despite the control measures, highlighting the necessity for more aggressive and targeted interventions to lower PM2.5 levels.
The findings of this study emphasise the need for more comprehensive air quality management strategies in Zhengzhou and similar urban environments. A key takeaway is that while traffic control measures are effective in reducing NO2 and PM10 concentrations, they do not adequately address the challenges posed by PM2.5 and O3. Future interventions must therefore prioritise coordinated strategies that simultaneously target NOX and volatile organic compound (VOC) emissions to mitigate the complex, interrelated effects of PM2.5 and O3 pollution. Additionally, by integrating emission inventories with source apportionment, a “pollution source-environmental concentration-control measures” framework could be established in future work, enabling more precise control over pollutant emissions. Ultimately, policies aimed at reducing urban air pollution should not only focus on immediate, short-term gains but also seek to implement sustainable, long-term interventions that address the root causes of pollution across sectors. By targeting both primary emissions and secondary pollutants such as O3, future air quality management efforts can deliver more significant health benefits for vulnerable populations and create healthier urban environments.

Supplementary Materials

The following supporting information can be downloaded at https://www.mdpi.com/article/10.3390/atmos16050557/s1. Text S1: Weather normalization; Text S2: Augmented synthetic control method; Table S1. Air quality guidelines (AQGs) of the World Health Organisation (WHO); Figure S1: The monthly variations of the weather normalised NO2 concentrations in Zhengzhou from 2018 to 2019. The blue boxes represent background station for air quality monitoring (BSAQ), the green boxes represent traffic station for air quality monitoring (TSAQ), and the red boxes represent urban areas (average data from NAQM stations, excluding the BSAQ); all boxes display site-specific median markers; Figure S2: The monthly variations of the weather normalised O3 concentrations in Zhengzhou from 2018 to 2019. The blue boxes represent background station for air quality monitoring (BSAQ), the green boxes represent traffic station for air quality monitoring (TSAQ), and the red boxes represent urban areas (averages data from NAQM stations, excluding the BSAQ); all boxes display site-specific median markers; Figure S3: The monthly variations of the weather normalised PM2.5 concentrations in Zhengzhou from 2018 to 2019. The blue boxes represent background station for air quality monitoring (BSAQ), the green boxes represent traffic station for air quality monitoring (TSAQ), and the red boxes represent urban areas (averages data from NAQM stations, excluding the BSAQ); all boxes display site-specific median markers; Figure S4: The monthly variations of the weather normalised PM10 concentrations in Zhengzhou from 2018 to 2019. The blue boxes represent background station for air quality monitoring (BSAQ), the green boxes represent traffic station for air quality monitoring (TSAQ), and the red boxes represent urban areas (averages data from NAQM stations, excluding the BSAQ); all boxes display site-specific median markers; Figure S5: The seasonal variations of the weather normalised NO2 concentrations in Zhengzhou from 2018 to 2019. The blue boxes represent background station for air quality monitoring (BSAQ), the green boxes represent traffic station for air quality monitoring (TSAQ), and the red boxes represent urban areas (averages data from NAQM stations, excluding the BSAQ); all boxes display site-specific median markers; Figure S6: The seasonal variations of the weather normalised O3 concentrations in Zhengzhou from 2018 to 2019. The blue boxes represent background station for air quality monitoring (BSAQ), the green boxes represent traffic station for air quality monitoring (TSAQ), and the red boxes represent urban areas (averages data from NAQM stations, excluding the BSAQ); all boxes display site-specific median markers; Figure S7: The seasonal variations of the weather normalised PM2.5 concentrations in Zhengzhou from 2018 to 2019. The blue boxes represent background station for air quality monitoring (BSAQ), the green boxes represent traffic station for air quality monitoring (TSAQ), and the red boxes represent urban areas (averages data from NAQM stations, excluding the BSAQ); all boxes display site-specific median markers; Figure S8: The seasonal variations of the weather normalised PM10 concentrations in Zhengzhou from 2018 to 2019. The blue boxes represent background station for air quality monitoring (BSAQ), the green boxes represent traffic station for air quality monitoring (TSAQ), and the red boxes represent urban areas (averages data from NAQM stations, excluding the BSAQ); all boxes display site-specific median markers; Figure S9: The trend of the weather normalised concentrations of NO and NOX at the traffic station for air quality monitoring (TSAQ) and background station for air quality monitoring (BSAQ), along with the traffic increments in Zhengzhou from 2018 to 2019. Two shaded areas represent two periods for comparison of pollutant concentrations: (1) Pre-NMG: from 15 June 2019 to 31 July 2019, (2) During-NMG: from 1 August 2019 to 16 September 2019; Figure S10: The absolute concentration difference (μg m−3) between the observed pollutant concentrations and the business-as-usual (BAU) conditions at the traffic station for air quality monitoring (TSAQ), background station for air quality monitoring (BSAQ), and the other urban stations during the event policy window in Zhengzhou. Negative values indicate the control measures lead to a decrease in pollutant concentrations, resulting in an improvement in air quality; Figure S11: Diurnal trends of criteria pollutants at the traffic station for air quality monitoring (TSAQ) and background station for air quality monitoring (BSAQ) in the During-NMG period; Figure S12: Diurnal trends of criteria pollutants at the traffic station for air quality monitoring (TSAQ) and background station for air quality monitoring (BSAQ) during the corresponding period of During-NMG in 2018 (1 August to 16 September); Figure S13: Diurnal trends of criteria pollutants at the traffic station for air quality monitoring (TSAQ) and background station for air quality monitoring (BSAQ) in the Pre-NMG period; Figure S14: Diurnal trends of criteria pollutants at the traffic station for air quality monitoring (TSAQ) and background station for air quality monitoring (BSAQ) during the corresponding period of Pre-NMG in 2018 (15 June to 31 July); Figure S15: A comparison of NO2, O3, PM2.5, and PM10 traffic increments in Pre-NMG (from 15 June 2019 to 31 July 2019) and During-NMG periods (from 1 August 2019 to 16 September 2019); Figure S16: Comparison of diurnal trends in traffic flow at the traffic station for air quality monitoring (TSAQ): (a) Pre-NMG (15 June to 31 July) and During-NMG (1 August to 16 September) in 2019; (b) Pre-NMG (15 June to 31 July) and During-NMG (1 August to 16 September) in 2018; Figure S17: Comparison of diurnal trends in traffic flow at the traffic station for air quality monitoring (TSAQ): (a) Pre-NMG in 2019 and the same period in 2018 (15 June to 31 July); (b) During-NMG in 2019 and the same period in 2018 (1 August to 16 September).

Author Contributions

J.G.: Formal analysis, visualisation, and writing—original draft. R.X.: Formal analysis, validation, writing—original draft, writing—review and editing, and funding acquisition. B.L.: Methodology and writing—review and editing. M.K.: Investigation and formal analysis. Y.Y.: Data curation and formal analysis. Z.S.: Supervision and writing—review and editing. R.Z.: Data curation and resources. Y.D.: Methodology, software, formal analysis, supervision, and writing—review and editing. All authors have read and agreed to the published version of the manuscript.

Funding

This research was funded by the Natural Science Foundation of Henan, China, grant number 242300421637.

Institutional Review Board Statement

Not applicable.

Informed Consent Statement

Not applicable.

Data Availability Statement

Original air quality monitoring data are openly accessible via the China National Environmental Monitoring Network at https://www.cnemc.cn/ (accessed on 2 February 2025). Meteorological data were obtained from the National Oceanic and Atmospheric Administration (NOAA) using the worldMet R package (publicly accessible through NOAA’s repository). Traffic flow data were collected from local traffic monitoring stations. The raw traffic datasets are available from the corresponding author upon reasonable request.

Conflicts of Interest

The authors declare no competing financial interests.

Abbreviations

The following abbreviations are used in this manuscript:
NMGThe 11th National Traditional Games of Ethnic Minorities of China
ASCMAugmented synthetic control method
NO2Nitrogen dioxide
PM10Coarse particles
PM2.5Fine particles
O3Ozone
NOXNitrogen oxides
VOCsVolatile organic compounds
RFRandom Forests
SCMSynthetic control method
BAUBusiness-as-usual
NAQMNational air quality monitoring
BSAQBackground station for air quality monitoring
TSAQTraffic station for air quality monitoring
GBMGradient boosting machine
RMSERoot mean square error
Pre-NMGThe pre-intervention period from 15 June 2019 to 31 July 2019, prior to the implementation of the NMG policy
During-NMGThe post-intervention period from 1 August 2019 to 16 September 2019, following the introduction of the NMG policy

References

  1. Watanabe, N.; Yan, G.; McLeod, C. The Impact of Sporting Events on Air Pollution: An Empirical Examination of National Football League Games. Sustainability 2023, 15, 5568. [Google Scholar] [CrossRef]
  2. de Prado Bert, P.; Mercader, E.M.H.; Pujol, J.; Sunyer, J.; Mortamais, M. The effects of air pollution on the brain: A review of studies interfacing environmental epidemiology and neuroimaging. Curr. Environ. Health Rep. 2018, 5, 351–364. [Google Scholar] [CrossRef]
  3. Laeremans, M.; Dons, E.; Avila-Palencia, I.; Carrasco-Turigas, G.; Orjuela, J.P.; Anaya, E.; Cole-Hunter, T.; De Nazelle, A.; Nieuwenhuijsen, M.; Standaert, A. Short-term effects of physical activity, air pollution and their interaction on the cardiovascular and respiratory system. Environ. Int. 2018, 117, 82–90. [Google Scholar] [CrossRef]
  4. McCafferty, W.B.; Horvath, S. Air Pollution and Athletic Performance; Thomas Springfield: Springfield, IL, USA, 1981. [Google Scholar]
  5. Reche, C.; Viana, M.; Van Drooge, B.L.; Fernández, F.J.; Escribano, M.; Castaño-Vinyals, G.; Nieuwenhuijsen, M.; Adami, P.E.; Bermon, S. Athletes’ exposure to air pollution during World Athletics Relays: A pilot study. Sci. Total Environ. 2020, 717, 137161. [Google Scholar] [CrossRef]
  6. Cusick, M.; Rowland, S.T.; DeFelice, N. Impact of air pollution on running performance. Sci. Rep. 2023, 13, 1832. [Google Scholar] [CrossRef]
  7. Lee, H.Y.; Kim, H.-J.; Kim, H.J.; Na, G.; Jang, Y.; Kim, S.H.; Kim, N.H.; Kim, H.C.; Park, Y.-J.; Kim, H.C. The impact of ambient air pollution on lung function and respiratory symptoms in elite athletes. Sci. Total Environ. 2023, 855, 158862. [Google Scholar] [CrossRef]
  8. Li, K.; Chen, L.; White, S.J.; Zheng, X.; Lv, B.; Lin, C.; Bao, Z.; Wu, X.; Gao, X.; Ying, F. Chemical characteristics and sources of PM1 during the 2016 summer in Hangzhou. Environ. Pollut. 2018, 232, 42–54. [Google Scholar] [CrossRef]
  9. Sun, Y.; Wang, Z.; Wild, O.; Xu, W.; Chen, C.; Fu, P.; Du, W.; Zhou, L.; Zhang, Q.; Han, T. “APEC Blue”: Secondary aerosol reductions from emission controls in Beijing. Sci. Rep. 2016, 6, 20668. [Google Scholar] [CrossRef]
  10. Huang, X.; Zhang, Y.; Wang, Y.; Ou, Y.; Chen, D.; Pei, C.; Huang, Z.; Zhang, Z.; Liu, T.; Luo, S. Evaluating the effectiveness of multiple emission control measures on reducing volatile organic compounds in ambient air based on observational data: A case study during the 2010 Guangzhou Asian Games. Sci. Total Environ. 2020, 723, 138171. [Google Scholar] [CrossRef]
  11. Liu, H.; Wang, X.; Zhang, J.; He, K.; Wu, Y.; Xu, J. Emission controls and changes in air quality in Guangzhou during the Asian Games. Atmos. Environ. 2013, 76, 81–93. [Google Scholar] [CrossRef]
  12. Li, S.-W.; Li, H.-B.; Luo, J.; Li, H.-M.; Qian, X.; Liu, M.-M.; Bi, J.; Cui, X.-Y.; Ma, L.Q. Influence of pollution control on lead inhalation bioaccessibility in PM2.5: A case study of 2014 Youth Olympic Games in Nanjing. Environ. Int. 2016, 94, 69–75. [Google Scholar] [CrossRef]
  13. Zhang, C.; Zhou, X.; Zhou, B.; Zhao, Z. Impacts of a mega sporting event on local carbon emissions: A case of the 2014 Nanjing Youth Olympics. China Econ. Rev. 2022, 73, 101782. [Google Scholar] [CrossRef]
  14. Mao, Y.; Liu, W.; Hu, T.; Shi, M.; Cheng, C.; Zhan, C.; Zhang, L.; Zhang, J.; Sweetman, A.J.; Jones, K.C. Impact of short-term control measures on air quality: A case study during the 7th Military World Games in central China. Environ. Pollut. 2022, 311, 119998. [Google Scholar] [CrossRef]
  15. Tao, M.; Huang, H.; Chen, N.; Ma, F.; Wang, L.; Chen, L.; Wang, L.; Zhang, L.; Xiang, J.; Kong, H. Contrasting effects of emission control on air pollution in Central China during the 2019 Military World Games based on satellite and ground observations. Atmos. Res. 2021, 259, 105657. [Google Scholar] [CrossRef]
  16. Jiang, Y.; Yu, S.; Chen, X.; Zhang, Y.; Li, M.; Li, Z.; Song, Z.; Li, P.; Zhang, X.; Lichtfouse, E. Large contributions of emission reductions and meteorological conditions to the abatement of PM2.5 in Beijing during the 24th Winter Olympic Games in 2022. J. Environ. Sci. 2024, 136, 172–188. [Google Scholar] [CrossRef]
  17. Wu, Q.; Wu, Z.; Li, S.; Chen, Z. The Impact of the Beijing Winter Olympic Games on Air Quality in the Beijing–Tianjin–Hebei Region: A Quasi-Natural Experiment Study. Sustainability 2023, 15, 11252. [Google Scholar] [CrossRef]
  18. Li, L.; Wu, D.; Chang, X.; Tang, Y.; Hua, Y.; Xu, Q.C.; Deng, S.H.; Wang, S.X.; Hao, J.M. Polar organic aerosol tracers in two areas in Beijing-Tianjin-Hebei region: Concentration comparison before and in the sept. Third Parade and sources. Environ. Pollut. 2021, 270, 116108. [Google Scholar] [CrossRef]
  19. Ren, Y.; Li, H.; Meng, F.; Wang, G.; Zhang, H.; Yang, T.; Li, W.; Ji, Y.; Bi, F.; Wang, X. Impact of emission controls on air quality in Beijing during the 2015 China Victory Day Parade: Implication from organic aerosols. Atmos. Environ. 2019, 198, 207–214. [Google Scholar] [CrossRef]
  20. Yu, S.J.; Su, F.C.; Yin, S.S.; Wang, S.B.; Xu, R.X.; He, B.; Fan, X.G.; Yuan, M.H.; Zhang, R.Q. Characterization of ambient volatile organic compounds, source apportionment, and the ozone-NOx-VOC sensitivities in a heavily polluted megacity of central China: Effect of sporting events and emission reductions. Atmos. Chem. Phys. 2021, 21, 15239–15257. [Google Scholar] [CrossRef]
  21. Mork, D.; Delaney, S.; Dominici, F. Policy-induced air pollution health disparities: Statistical and data science considerations. Science 2024, 385, 391–396. [Google Scholar] [CrossRef]
  22. Su, F.; Xu, Q.; Wang, K.; Yin, S.; Wang, S.; Zhang, R.; Tang, X.; Ying, Q. On the effectiveness of short-term intensive emission controls on ozone and particulate matter in a heavily polluted megacity in central China. Atmos. Environ. 2021, 246, 118111. [Google Scholar] [CrossRef]
  23. Wang, G.; Cheng, S.Y.; Wei, W.; Yang, X.W.; Wang, X.Q.; Jia, J.; Lang, J.L.; Lv, Z. Characteristics and emission-reduction measures evaluation of PM2.5 during the two major events: APEC and Parade. Sci. Total Environ. 2017, 595, 81–92. [Google Scholar] [CrossRef] [PubMed]
  24. Deng, F.Y.; Lv, Z.F.; Qi, L.J.; Wang, X.T.; Shi, M.S.; Liu, H. A big data approach to improving the vehicle emission inventory in China. Nat. Commun. 2020, 11, 2801. [Google Scholar] [CrossRef] [PubMed]
  25. Franco, V.; Kousoulidou, M.; Muntean, M.; Ntziachristos, L.; Hausberger, S.; Dilara, P. Road vehicle emission factors development: A review. Atmos. Environ. 2013, 70, 84–97. [Google Scholar] [CrossRef]
  26. Geng, Y.B.; Wang, Z.T.; Shen, L.; Zhao, J.N. Calculating of CO2 emission factors for Chinese cement production based on inorganic carbon and organic carbon. J. Clean. Prod. 2019, 217, 503–509. [Google Scholar] [CrossRef]
  27. Harrison, R.M.; Van Vu, T.; Jafar, H.; Shi, Z. More mileage in reducing urban air pollution from road traffic. Environ. Int. 2021, 149, 106329. [Google Scholar] [CrossRef]
  28. Li, M.; Liu, H.; Geng, G.N.; Hong, C.P.; Liu, F.; Song, Y.; Tong, D.; Zheng, B.; Cui, H.Y.; Man, H.Y.; et al. Anthropogenic emission inventories in China: A review. Natl. Sci. Rev. 2017, 4, 834–866. [Google Scholar] [CrossRef]
  29. Chen, D.; Liu, Z.; Ban, J.; Zhao, P.; Chen, M. Retrospective analysis of 2015–2017 wintertime PM2.5 in China: Response to emission regulations and the role of meteorology. Atmos. Chem. Phys. 2019, 19, 7409–7427. [Google Scholar] [CrossRef]
  30. Cheng, J.; Su, J.; Cui, T.; Li, X.; Dong, X.; Sun, F.; Yang, Y.; Tong, D.; Zheng, Y.; Li, Y. Dominant role of emission reduction in PM2.5 air quality improvement in Beijing during 2013–2017: A model-based decomposition analysis. Atmos. Chem. Phys. 2019, 19, 6125–6146. [Google Scholar] [CrossRef]
  31. Grange, S.K.; Carslaw, D.C.; Lewis, A.C.; Boleti, E.; Hueglin, C. Random forest meteorological normalisation models for Swiss PM10 trend analysis. Atmos. Chem. Phys. 2018, 18, 6223–6239. [Google Scholar] [CrossRef]
  32. Vu, T.V.; Shi, Z.; Cheng, J.; Zhang, Q.; He, K.; Wang, S.; Harrison, R.M. Assessing the impact of clean air action on air quality trends in Beijing using a machine learning technique. Atmos. Chem. Phys. 2019, 19, 11303–11314. [Google Scholar] [CrossRef]
  33. Abadie, A. Using synthetic controls: Feasibility, data requirements, and methodological aspects. J. Econ. Lit. 2021, 59, 391–425. [Google Scholar] [CrossRef]
  34. Liu, B.; Bryson, J.R.; Sevinc, D.; Cole, M.A.; Elliott, R.J.; Bartington, S.E.; Bloss, W.J.; Shi, Z. Assessing the impacts of Birmingham’s clean air zone on air quality: Estimates from a machine learning and synthetic control approach. Environ. Resour. Econ. 2023, 86, 203–231. [Google Scholar] [CrossRef]
  35. Song, C.; Liu, B.; Cheng, K.; Cole, M.A.; Dai, Q.; Elliott, R.J.; Shi, Z. Attribution of air quality benefits to clean winter heating policies in China: Combining machine learning with causal inference. Environ. Sci. Technol. 2023, 57, 17707–17717. [Google Scholar] [CrossRef]
  36. Hilker, N.; Wang, J.M.; Jeong, C.-H.; Healy, R.M.; Sofowote, U.; Debosz, J.; Su, Y.; Noble, M.; Munoz, A.; Doerksen, G. Traffic-related air pollution near roadways: Discerning local impacts from background. Atmos. Meas. Tech. 2019, 12, 5247–5261. [Google Scholar] [CrossRef]
  37. Pandolfi, M.; Mooibroek, D.; Hopke, P.; van Pinxteren, D.; Querol, X.; Herrmann, H.; Alastuey, A.; Favez, O.; Hüglin, C.; Perdrix, E. Long-range and local air pollution: What can we learn from chemical speciation of particulate matter at paired sites? Atmos. Chem. Phys. 2020, 20, 409–429. [Google Scholar] [CrossRef]
  38. Zhao, S.; Yu, Y.; Yin, D.; He, J.; Liu, N.; Qu, J.; Xiao, J. Annual and diurnal variations of gaseous and particulate pollutants in 31 provincial capital cities based on in situ air quality monitoring data from China National Environmental Monitoring Center. Environ. Int. 2016, 86, 92–106. [Google Scholar] [CrossRef]
  39. Ministry of Environmental Protection of the People’s Republic of China. GB 3095-2012; Ambient Air Quality Standard. China Environmental Science Press: Beijing, China, 2012.
  40. Carslaw, D.C. Davidcarslaw. Available online: http://github.com/davidcarslaw/ (accessed on 1 February 2023).
  41. Dai, Y.; Liu, B.; Tong, C.; Shi, Z. Aqpet—An R package for air quality policy evaluation. Environ. Model. Softw. 2024, 177, 106052. [Google Scholar] [CrossRef]
  42. LeDell, E.; Poirier, S. H2O AutoML: Scalable automatic machine learning. In Proceedings of the 7th ICML Workshop on Automated Machine Learning (AutoML 2020), San Diego, CA, USA, 18 July 2020. [Google Scholar]
  43. Zheng, Z.; Fiore, A.M.; Westervelt, D.M.; Milly, G.P.; Goldsmith, J.; Karambelas, A.; Curci, G.; Randles, C.A.; Paiva, A.R.; Wang, C. Automated machine learning to evaluate the information content of tropospheric trace gas columns for fine particle estimates over India: A modeling testbed. J. Adv. Model. Earth Syst. 2023, 15, e2022MS003099. [Google Scholar] [CrossRef]
  44. Chi, Y.-Y.; Wang, Y.-Y.; Xu, J.-H. Estimating the impact of the license plate quota policy for ICEVs on new energy vehicle adoption by using synthetic control method. Energy Policy 2021, 149, 112022. [Google Scholar] [CrossRef]
  45. Gilchrist, D.; Emery, T.; Garoupa, N.; Spruk, R. Synthetic control method: A tool for comparative case studies in economic history. J. Econ. Surv. 2023, 37, 409–445. [Google Scholar] [CrossRef]
  46. Ben-Michael, E.; Feller, A.; Rothstein, J. The augmented synthetic control method. J. Am. Stat. Assoc. 2021, 116, 1789–1803. [Google Scholar] [CrossRef]
  47. Zhao, C.; Sun, Y.; Zhong, Y.; Xu, S.; Liang, Y.; Liu, S.; He, X.; Zhu, J.; Shibamoto, T.; He, M. Spatio-temporal analysis of urban air pollutants throughout China during 2014–2019. Air Qual. Atmos. Health 2021, 14, 1619–1632. [Google Scholar] [CrossRef] [PubMed]
  48. Du, H.; Li, J.; Wang, Z.; Yang, W.; Chen, X.; Wei, Y. Sources of PM2.5 and its responses to emission reduction strategies in the Central Plains Economic Region in China: Implications for the impacts of COVID-19. Environ. Pollut. 2021, 288, 117783. [Google Scholar] [CrossRef]
  49. Henan Provincial Department of Ecological Environment. Available online: https://sthjt.henan.gov.cn/2018/02-06/1043833.html (accessed on 14 July 2024).
  50. The People’s Government of Henan Province. Available online: https://m.henan.gov.cn/2021/02-04/2091229.html (accessed on 18 November 2024).
  51. Wang, Y.; Duan, X.; Liang, T.; Wang, L.; Wang, L. Analysis of spatio-temporal distribution characteristics and socioeconomic drivers of urban air quality in China. Chemosphere 2022, 291, 132799. [Google Scholar] [CrossRef]
  52. Yin, D.; Zhao, S.; Qu, J. Spatial and seasonal variations of gaseous and particulate matter pollutants in 31 provincial capital cities, China. Air Qual. Atmos. Health 2017, 10, 359–370. [Google Scholar] [CrossRef]
  53. Wang, Y.; Sun, Y.; Zhang, Z.; Cheng, Y. Spatiotemporal variation and source analysis of air pollutants in the Harbin-Changchun (HC) region of China during 2014–2020. Environ. Sci. Ecotechnol. 2021, 8, 100126. [Google Scholar] [CrossRef]
  54. Ma, M.; Yao, G.; Guo, J.; Bai, K. Distinct spatiotemporal variation patterns of surface ozone in China due to diverse influential factors. J. Environ. Manag. 2021, 288, 112368. [Google Scholar] [CrossRef]
  55. Wang, P.; Zhang, R.; Sun, S.; Gao, M.; Zheng, B.; Zhang, D.; Zhang, Y.; Carmichael, G.R.; Zhang, H. Aggravated air pollution and health burden due to traffic congestion in urban China. Atmos. Chem. Phys. 2023, 23, 2983–2996. [Google Scholar] [CrossRef]
  56. Akimoto, H.; Tanimoto, H. Rethinking of the adverse effects of NOx-control on the reduction of methane and tropospheric ozone–Challenges toward a denitrified society. Atmos. Environ. 2022, 277, 119033. [Google Scholar] [CrossRef]
  57. Liu, X.; Jiang, N.; Zhang, R.; Yu, X.; Li, S.; Miao, Q. Composition analysis of PM2.5 at multiple sites in Zhengzhou, China: Implications for characterization and source apportionment at different pollution levels. Environ. Sci. Pollut. Res. 2021, 28, 59329–59344. [Google Scholar] [CrossRef] [PubMed]
  58. Jia, T.; Li, Q.; Shi, W. Estimation and analysis of emissions from on-road vehicles in Mainland China for the period 2011–2015. Atmos. Environ. 2018, 191, 500–512. [Google Scholar] [CrossRef]
  59. Singh, V.; Biswal, A.; Kesarkar, A.P.; Mor, S.; Ravindra, K. High resolution vehicular PM10 emissions over megacity Delhi: Relative contributions of exhaust and non-exhaust sources. Sci. Total Environ. 2020, 699, 134273. [Google Scholar] [CrossRef]
  60. Xu, W.; Liu, X.; Liu, L.; Dore, A.J.; Tang, A.; Lu, L.; Wu, Q.; Zhang, Y.; Hao, T.; Pan, Y. Impact of emission controls on air quality in Beijing during APEC 2014: Implications from water-soluble ions and carbonaceous aerosol in PM2.5 and their precursors. Atmos. Environ. 2019, 210, 241–252. [Google Scholar] [CrossRef]
  61. Zhang, X.; Fung, J.C.; Lau, A.K.; Hossain, M.S.; Louie, P.K.; Huang, W. Air quality and synergistic health effects of ozone and nitrogen oxides in response to China’s integrated air quality control policies during 2015–2019. Chemosphere 2021, 268, 129385. [Google Scholar] [CrossRef] [PubMed]
  62. Zeng, X.; Han, M.; Ren, G.; Liu, G.; Wang, X.; Du, K.; Zhang, X.; Lin, H. A comprehensive investigation on source apportionment and multi-directional regional transport of volatile organic compounds and ozone in urban Zhengzhou. Chemosphere 2023, 334, 139001. [Google Scholar] [CrossRef]
  63. Chu, B.; Ding, Y.; Gao, X.; Li, J.; Zhu, T.; Yu, Y.; He, H. Coordinated control of fine-particle and ozone pollution by the substantial reduction of nitrogen oxides. Engineering 2022, 15, 13–16. [Google Scholar] [CrossRef]
  64. Lin, Z.; Ji, Y.; Lin, Y.; Yang, Y.; Gao, Y.; Wang, M.; Xiao, Y.; Zhao, J.; Feng, Y.; Yang, W. PM10 and PM2.5 chemical source profiles of road dust over China: Composition, spatio-temporal distribution, and source apportionment. Urban Clim. 2023, 51, 101672. [Google Scholar] [CrossRef]
  65. Yang, W.; Li, J.; Wang, Z.; Wang, L.; Dao, X.; Zhu, L.; Pan, X.; Li, Y.; Sun, Y.; Ma, S. Source apportionment of PM2.5 in the most polluted Central Plains Economic Region in China: Implications for joint prevention and control of atmospheric pollution. J. Clean. Prod. 2021, 283, 124557. [Google Scholar] [CrossRef]
  66. Wu, Y.; Gu, B.; Erisman, J.W.; Reis, S.; Fang, Y.; Lu, X.; Zhang, X. PM2.5 pollution is substantially affected by ammonia emissions in China. Environ. Pollut. 2016, 218, 86–94. [Google Scholar] [CrossRef]
  67. Yang, J.; Liu, P.; Song, H.; Miao, C.; Wang, F.; Xing, Y.; Wang, W.; Liu, X.; Zhao, M. Effects of Anthropogenic Emissions from Different Sectors on PM2.5 Concentrations in Chinese Cities. Int. J. Environ. Res. Public Health 2021, 18, 10869. [Google Scholar] [CrossRef] [PubMed]
  68. Wang, Y.; Wang, F.; Min, R.; Song, G.; Song, H.; Zhai, S.; Xia, H.; Zhang, H.; Ru, X. Contribution of local and surrounding anthropogenic emissions to a particulate matter pollution episode in Zhengzhou, Henan, China. Sci. Rep. 2023, 13, 8771. [Google Scholar] [CrossRef] [PubMed]
  69. Shi, Z.; Song, C.; Liu, B.; Lu, G.; Xu, J.; Van Vu, T.; Elliott, R.J.; Li, W.; Bloss, W.J.; Harrison, R.M. Abrupt but smaller than expected changes in surface air quality attributable to COVID-19 lockdowns. Sci. Adv. 2021, 7, eabd6696. [Google Scholar] [CrossRef]
  70. Zhengzhou Municipal People’s Government. Available online: https://public.zhengzhou.gov.cn/02Q/305496.jhtml (accessed on 26 May 2024).
  71. Henan Economic Daily. Available online: https://mbd.baidu.com/newspage/data/landingsuper?rs=2631667997&ruk=70H0PN3umKgmwPe2On7efg&urlext=%7B%22cuid%22%3A%22lOSoi0iJ280m8S8T_u2rag8IvugC8HadluS18_a7S8Kr0qqSB%22%7D&isBdboxFrom=1&pageType=1&sid_for_share=&context=%7B%22nid%22%3A%22news_9406587344368166081%22,%22sourceFrom%22%3A%22search%22%7D (accessed on 26 May 2024).
  72. Ali-Taleshi, M.S.; Bakhtiari, A.R.; Hopke, P.K. Meteorologically normalized spatial and temporal variations investigation using a machine learning-random forest model in criteria pollutants across Tehran, Iran. Urban Clim. 2024, 53, 101790. [Google Scholar] [CrossRef]
  73. Pültz, J.; Banzhaf, S.; Thürkow, M.; Kranenburg, R.; Schaap, M. Source attribution of particulate matter in Berlin. Atmos. Environ. 2023, 292, 119416. [Google Scholar] [CrossRef]
  74. Ministry of Ecology and Environment of the People’s Republic of China. Available online: https://www.mee.gov.cn/gkml/hbb/bgg/201601/t20160118_326596.htm (accessed on 20 July 2024).
  75. Beevers, S.D.; Westmoreland, E.; de Jong, M.C.; Williams, M.L.; Carslaw, D.C. Trends in NOx and NO2 emissions from road traffic in Great Britain. Atmos. Environ. 2012, 54, 107–116. [Google Scholar] [CrossRef]
  76. Huang, Y.; Unger, N.; Harper, K.; Heyes, C. Global climate and human health effects of the gasoline and diesel vehicle fleets. GeoHealth 2020, 4, e2019GH000240. [Google Scholar] [CrossRef]
  77. Ministry of Ecology and Environment of the People’s Republic of China. Available online: https://www.mee.gov.cn/xxgk2018/xxgk/xxgk15/201909/t20190904_732374.html (accessed on 20 July 2024).
  78. Ministry of Ecology and Environment of the People’s Republic of China. Available online: https://www.mee.gov.cn/xxgk2018/xxgk/xxgk15/202008/t20200810_793252.html (accessed on 20 July 2024).
  79. Anenberg, S.; Miller, J.; Henze, D.; Minjares, R. A Global Snapshot of the Air Pollution-Related Health Impacts of Transportation Sector Emissions in 2010 and 2015; International Council on Clean Transportation: Washington, DC, USA, 2019; pp. 1–48. [Google Scholar]
  80. Qu, W.; Wang, J.; Zhang, X.; Wang, Y.; Gao, S.; Zhao, C.; Sun, L.; Zhou, Y.; Wang, W.; Liu, X. Effect of weakened diurnal evolution of atmospheric boundary layer to air pollution over eastern China associated to aerosol, cloud–ABL feedback. Atmos. Environ. 2018, 185, 168–179. [Google Scholar] [CrossRef]
  81. Napi, N.M.; Abdullah, S.; Ahmed, A.; Mansor, A.A.; Ismail, M. Annual and diurnal trend of surface ozone (O3) in industrial area. IOP Conf. Ser. Earth Environ. Sci. 2020, 498, 012062. [Google Scholar]
  82. Su, F.; Xu, Q.; Yin, S.; Wang, K.; Liu, G.; Wang, P.; Kang, M.; Zhang, R.; Ying, Q. Contributions of local emissions and regional background to summertime ozone in central China. J. Environ. Manag. 2023, 338, 117778. [Google Scholar] [CrossRef]
  83. Henan Business Daily. Available online: http://hn.zhonghongwang.com/show-140-9600-1.html (accessed on 31 July 2024).
Figure 1. The geographic location of (a) the cities within the control and treatment groups and (b) the monitoring stations in Zhengzhou, with the lower right corner indicating the location of Zhengzhou’s urban area within Henan Province. Nine national air quality monitoring (NAQM) stations are situated in different districts of Zhengzhou, comprising eight urban stations and one background station 1314A for air quality monitoring (BSAQ). The traffic station for air quality monitoring (TSAQ) is a municipal monitoring station located at the intersection of Longhai Road and Qinling Road.
Atmosphere 16 00557 g001
Figure 2. The trend of daily weather-normalised concentrations of O3, NO2, PM2.5, and PM10 at the traffic station for air quality monitoring (TSAQ), background station for air quality monitoring (BSAQ), and the urban areas (average data from NAQM stations, excluding the BSAQ) during the event policy window in Zhengzhou from 2018 to 2020. The dashed line in the figure represents the air quality standards of the World Health Organization (WHO) (Table S1).
Atmosphere 16 00557 g002
Figure 3. The percentage difference (%) between the observed pollutant concentrations and the business-as-usual (BAU) conditions at the traffic station for air quality monitoring (TSAQ), background station for air quality monitoring (BSAQ), and the other urban stations during the event policy window in Zhengzhou: (a) mean values of monitoring stations; (b) NO2; (c) O3; (d) PM2.5; (e) PM10. Negative values indicate that the control measures lead to a decrease in pollutant concentrations, resulting in an improvement in air quality. The points represent the mean percentage difference during the NMG period, with the bars indicating the upper and lower bounds of the percentage change.
Atmosphere 16 00557 g003
Figure 4. The traffic increments of weather-normalised NO2, O3, PM2.5, and PM10 in Zhengzhou from 2018 to 2019. Two shaded areas represent two periods for comparison of pollutant concentrations: (1) Pre-NMG, from 15 June 2019 to 31 July 2019, and (2) During-NMG, from 1 August 2019 to 16 September 2019. The blue lines represent the mean traffic increments of the two periods, respectively.
Atmosphere 16 00557 g004
Figure 5. A comparison of diurnal trends of NO2, O3, PM2.5 and PM10 traffic increments during (a) the Pre-NMG period in 2019 and the same period in 2018 (15 June to 31 July) and (b) the During-NMG period in 2019 and the same period in 2018 (1 August to 16 September).
Atmosphere 16 00557 g005
Table 1. A summary of the cities within the control group.
Serial NumberCityLongitudeLatitudeGDP
(in Billions of Yuan)
Population (in Ten Thousands)
1Baoding115.538.938811170
2Cangzhou116.838.33588759
3Changchun125.744.07002910
4Dongying118.637.53899220
5Eerduosi110.039.85850222
6Haerbin126.645.95576940
7Heze115.535.24465864
8Jinan117.136.79443883
9Langfang116.739.53526480
10Lanzhou103.936.13487443
11Linyi118.435.146001124
12Nanchang115.928.65596555
13Qiangdao120.436.111,741940
14Suqian118.334.03099493
15Taiyuan112.637.94028443
16Tianjin117.239.114,1041560
17Weifang119.136.75689934
18Xuzhou117.334.27151892
19Yulin109.738.34136370
20Zibo118.136.83642471
Table 2. A summary of the traffic increments (μg m−3) and percentage increase (% Increase) in various cities. The percentage increase is calculated as follows: (traffic increment/background concentration) × 100.
LocationSampling PeriodSampling TypeTraffic Increment% IncreaseReference
Zhengzhou,
China
2019.
6.15–7.31
PM2.510.839.7This study
PM1012.517.4
PM2.5–101.73.9
NO8.6288.6
NO237.9140.8
NOX39.8127.4
2019.
8.1–9.16
PM2.55.721.6
PM109.115.1
PM2.5–103.410.1
NO9.6269.1
NO230.5144.9
NOX38.4149.7
2018–2019PM2.513.427.9
PM1015.615.5
PM2.5–102.24.3
NO25.5598.5
NO239.4114.9
NOX75.1174.0
Tehran,
Iran
2019PM2.51.045.16[72]
PM107.9811.5
CO0.012.31
NO3.2217.1
NO2−1.02−1.21
NOX11.013.4
O3−0.380.62
SO20.458.88
London,
Britain
2016–2018PM2.55.148.6[27]
PM108.148.5
PM2.5–103.048.4
NO254.9170.0
NOX230.3460.6
Paris,
France
2016–2018PM2.54.939.5
PM1015.071.1
PM2.5–1010.1116.1
NO258.6192.1
NOXn.an.a
Berlin,
Germany
2016–2018PM2.51.911.9
PM104.318.6
PM2.5–102.433.8
NO214.053.8
NOX46.6129.8
Beijing,
China
2016–2018PM2.54.87.5
PM107.27.2
PM2.5–102.36.4
NO218.737.9
NOXn.an.a
Hong Kong,
China
2016–2018PM2.54.822.7
PM103.08.8
PM2.5–10−1.8−13.8
NO243.2112.5
NOX127.2219.7
Istanbul,
Turkey
2016–2018PM2.51.88.2
PM1011.232.0
PM2.5–109.471.8
NO238.3116.8
NOXn.an.a
Disclaimer/Publisher’s Note: The statements, opinions and data contained in all publications are solely those of the individual author(s) and contributor(s) and not of MDPI and/or the editor(s). MDPI and/or the editor(s) disclaim responsibility for any injury to people or property resulting from any ideas, methods, instructions or products referred to in the content.

