Abstract
By utilizing daily precipitation data from 400 meteorological stations in the Yellow River Basin (YRB) of China, atmospheric and oceanic reanalysis data, this study investigates the climatological characteristics, leading modes, and relationships with atmospheric circulation and sea surface temperature (SST) of summer extreme precipitation in the YRB from 1981 to 2020 through the extreme precipitation metrics and Empirical Orthogonal Function (EOF) analysis. The results indicate that both the frequency and intensity of extreme precipitation exhibit an eastward and southward increasing pattern in terms of climate state, with regions of higher precipitation showing greater interannual variability. When precipitation in the YRB exhibits a spatially coherent enhancement pattern, high latitudes exhibits an Eurasian teleconnection wave train that facilitates the southward movement of cold air. Concurrently, the northward extension of the Western Pacific subtropical high (WPSH) enhances moisture transport from low latitudes to the YRB, against the backdrop of a transitioning SST pattern from El Niño to La Niña. When precipitation in the YRB shows a “south-increase, north-decrease” dipole pattern, the southward-shifted Ural high and westward-extended WPSH converge cold air and moist in the southern YRB region, with no dominant SST drivers identified.
1. Introduction
With the intensification of global warming, the climate in Yellow River Basin (YRB) of China is undergoing a pronounced transition from dry-cold to warm-humid conditions [1,2,3,4]. Concurrently, meteorological disasters have become more severe, and extreme weather and climate events are occurring with increasing frequency, posing significant challenges to socioeconomic development and public livelihoods [5,6,7,8,9]. Extreme precipitation events have escalated urban drainage loads and flood risks while causing substantial disruptions to critical infrastructure sectors such as transportation and power supply. Consequently, research on the spatiotemporal evolution characteristics of extreme precipitation plays a pivotal role in mitigating flood hazards, safeguarding societal security, enhancing ecological environments, and promoting sustainable water resource utilization [10,11,12,13].
With the onset and northward progression of the summer monsoon, the rainy season in YRB typically commences between late July and early August each year [14,15,16]. During this period, the western Pacific subtropical high (WPSH) reaches its northernmost position annually, coinciding with peak rainfall intensity over YRB. The southwestern or easterly airflow along the western flank of the WPSH continuously transports moisture from low-latitude oceans northward, providing abundant water vapor for precipitation in the region [17,18]. Within this brief window of approximately one month, rainfall in YRB accounts for nearly one-third of the annual total, making this phase the most concentrated period for flood disasters in YRB and a critical timeframe for flood prevention efforts [19,20]. In recent decades, extreme precipitation events in China have exhibited increasing frequency, spatial extent, and duration. Notable examples include the flood disaster in Shandong Province caused by Typhoon Rumbia in 2018 [21]. The July 2021 Henan “7.20” extreme rainstorm causing more than 380 fatalities and US$18 billion in economic damage [22]. The historically unprecedented rainfall brought by Typhoon Doksuri to Beijing-Tianjin-Hebei area in summer 2023 [23]. Furthermore, increasingly complex compound events, such as concurrent heatwaves and extreme rainfall, are emerging under global warming. Extreme precipitation in the YRB is manifesting in progressively intricate patterns [24]. The Assessment Report of the Intergovernmental Panel on Climate Change, projections indicated that extreme precipitation intensity in China may further intensify during the 21st century, while drought conditions are also expected to worsen concurrently [25].
In recent years, extreme weather and climate events in North and Northwest China have shown increasing trends in both frequency and intensity [26,27]. A particularly severe example occurred in late July 2021, when catastrophic flood-inducing rainfall struck central and northern Henan Province, causing significant impacts across the YRB [28]. Situated at the transitional zone between subtropical and temperate monsoon regions, the YRB serves as a climatic boundary between humid and semi-humid areas. It also functions as a strategic pivot connecting eastern and western China and integrating northern and southern regions, playing a critical role in national infrastructure frameworks such as the “West-East Power Transmission, North-South Mutual Supply, and Nationwide Grid Interconnection” [29].
Recently, researches on the extreme precipitation in the YRB remains relatively limited, with sparse investigations into the spatiotemporal distribution mechanisms. To address this gap, this study employs observational and reanalysis datasets to investigate the distribution patterns of historical summer extreme precipitation in the YRB through defining extreme precipitation indices. The research further explores potential relationships with atmospheric circulation and sea surface temperature (SST) anomalies. These findings aim to provide decision-making support for meteorological services in disaster prevention and mitigation, while also establishing a theoretical foundation for enhancing extreme precipitation monitoring and prediction capabilities in the region.
2. Data and Methods
2.1. Data
The ground-based precipitation observational data employed in this study were obtained from the daily precipitation records of 400 meteorological stations within the YRB, compiled and quality-controlled by the National Meteorological Information Center of the China Meteorological Administration. All datasets underwent rigorous quality assurance procedures and extreme value validation. The geographic configuration of the YRB and the spatial distribution of meteorological stations are illustrated in Figure 1.
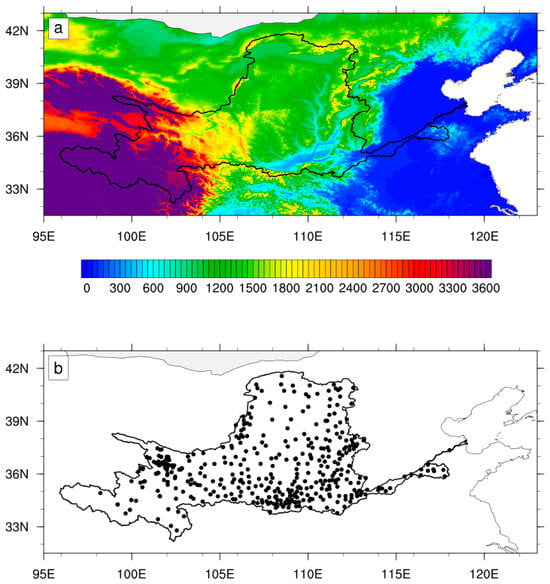
Figure 1.
(a) Topographical features of YRB (shading denotes terrain height derived from the global 30-m resolution Shuttle Radar Topography Mission (SRTM) Digital Elevation Model (DEM) dataset released by the United States Geological Survey (USGS), unit: m) and (b) distribution of the meteorological stations used in this study (black dots).
Monthly atmospheric circulation data were derived from the ERA5 (Fifth Generation of European Centre for Medium-Range Weather Forecasts Reanalysis) global climate reanalysis dataset, featuring a horizontal resolution of 2.5° × 2.5° and 27 vertical layers spanning from 1000 hPa to 100 hPa [30]. Key variables include geopotential height, horizontal wind fields, specific humidity, and surface pressure. Monthly mean SST data were sourced from the HadISST (Hadley Centre Sea Ice and Sea Surface Temperature) reanalysis dataset, developed by the Met Office Hadley Centre for Climate Science and Services, with a horizontal resolution of 1.0° × 1.0° [31]. The study period spans from 1981 to 2020, with summer defined as June–August (JJA) for consistency across analyses.
2.2. Methods
Referring to the definitions of extreme precipitation indices established by the Expert Team on Climate Change Detection and Indices (ETCCDI) [32], and considering regional applicability to the YRB, we defined multiple precipitation indices to comprehensively characterize the spatiotemporal variation characteristics of extreme precipitation in the YRB during the period 1981–2020. The definitions and computational methodologies of these precipitation indices are detailed in Table 1. Additionally, the Empirical Orthogonal Function (EOF) analysis method was employed to the JJA mean anomaly fields of each extreme precipitation index to extract the dominant modes of extreme precipitation in the YRB. The spatial patterns of these modes were determined by regressing the principal component time series onto the extreme precipitation indices. Linear trends were estimated by fitting the slope of variation from summer to the next using the linear least squares method, and all variables were linearly detrended prior to analysis in order to focus on climate variability. The statistical significance of linear regression and correlation analysis was evaluated through the two-tailed Student’s t-test.

Table 1.
Definitions of precipitation index in this study.
3. Climatic Characteristics of Summer Extreme Precipitation in the YRB
Spanning three-step topographic terraces (Figure 1), the YRB features a west-high-east-low elevation gradient and lies within the warm-temperate and subtropical monsoon climate zones. Its summers are characterized by high temperatures and abundant rainfall, driven by the southeasterly monsoon originating from tropical oceans that delivers substantial moisture. Precipitation in the YRB exhibits highly uneven spatial and temporal distribution, with summer rainfall accounting for over half of the annual total. The complex terrain further drives a climatological precipitation gradient decreasing from the southeastern to northwestern regions, accompanied by large interannual variability. Analysis of the threshold distribution of summer extreme precipitation in the basin (Figure 2) reveals a strong linkage between precipitation patterns and topographic features. Extreme precipitation thresholds exhibit smaller magnitudes in the upper mountainous reaches and higher magnitudes in the lower basin regions. For the 90th percentile extreme precipitation threshold, spatial disparities exceed 10 mm/d across the basin. The spatial pattern of the 95th percentile threshold closely resembles that of the 90th percentile, yet basin-wide differences surpass 20 mm/d. These findings demonstrate that, within the YRB, the spatial heterogeneity in precipitation magnitude amplifies with increasing extremity of rainfall events.
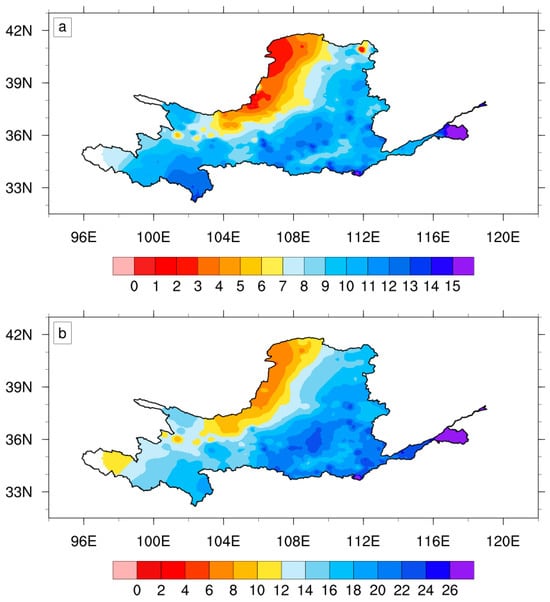
Figure 2.
Spatial distribution of summer extreme precipitation 90% threshold (a) and 95% threshold (b) (unit: mm/d) in YRB from 1981 to 2020.
As revealed by the climatological spatial distribution of summer extreme precipitation indices in the YRB from 1981 to 2020 (Figure 3), all metrics exhibit a northwest-to-southeast increasing gradient, except for total precipitation days. While total precipitation days (Figure 3a) peak in the western mountainous regions, heavy rain days (Figure 3b) and torrential rain days (Figure 3c) are significantly more frequent in the southeastern basin than in the western mountains. This indicates that the western mountainous areas are dominated by frequent light rainfall events, whereas extreme precipitation predominantly occurs in the southeastern regions. Combined with total precipitation amounts (Figure 3d), extreme precipitation accounts for the majority of total rainfall in the southeastern YRB. Both extreme precipitation amounts (Figure 3e) and exceptionally extreme precipitation amounts (Figure 3f) display a spatial hierarchy: highest in the southeast, secondary in the northeastern basin, and lowest in the western mountainous areas. These climatological features of extreme precipitation are intrinsically linked to the basin’s topography.
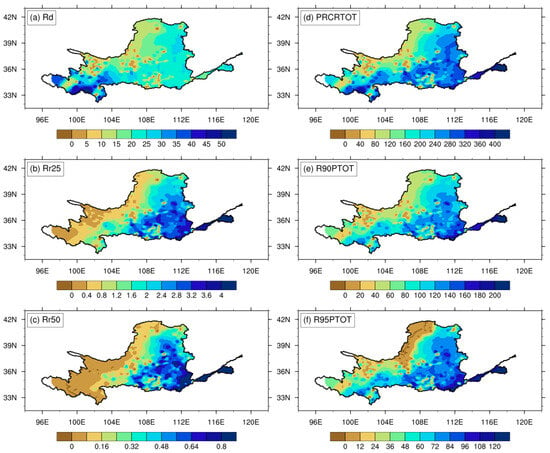
Figure 3.
Climatological mean spatial distribution of summer RD ((a) unit: days), Rr25 ((b) unit: days), Rr50 ((c) unit: days), PRCPTOT ((d) unit: mm), R90PTOT ((e) unit: mm), and R95PTOT ((f) unit: mm) in YRB from 1981 to 2020.
Moisture availability is a critical prerequisite for precipitation. Mechanistically, atmospheric moisture is primarily transported northward from the low-latitude Indian and Pacific Oceans. Climatologically, higher latitudes experience greater moisture depletion during transport, resulting in higher precipitation totals in southern regions compared to northern areas. Furthermore, as atmospheric moisture is predominantly concentrated in the lower and middle troposphere, mountainous regions receive substantially less moisture influx than plains. Consequently, precipitation intensity generated over mountainous terrain remains comparatively weaker.
The spatial distribution of standard deviations for summer extreme precipitation indices in the YRB during 1981–2020 (Figure 4) closely resembles its climatological patterns. Across all indices, the standard deviations generally exhibit a spatial hierarchy: largest in the southeastern regions, intermediate in the northeastern basin, and smallest in the western mountainous areas. This reflects greater interannual variability in the southeastern regions, moderate variability in the northeast, and minimal variability in the western mountains. The high-standard-deviation zones for total precipitation days (Figure 4a) are predominantly located within the third-step topographic terraces, highlighting the significant influence of terrain on precipitation frequency. For heavy rain days (Figure 4b) and torrential rain days (Figure 4c), the regions with the highest standard deviations are concentrated in the southeastern basin. Regarding precipitation amounts, the maximum standard deviations for total precipitation (Figure 4d), extreme precipitation (Figure 4e), and exceptionally extreme precipitation (Figure 4f) are all predominantly observed in the southeastern YRB, collectively indicating pronounced interannual variability in these metrics.
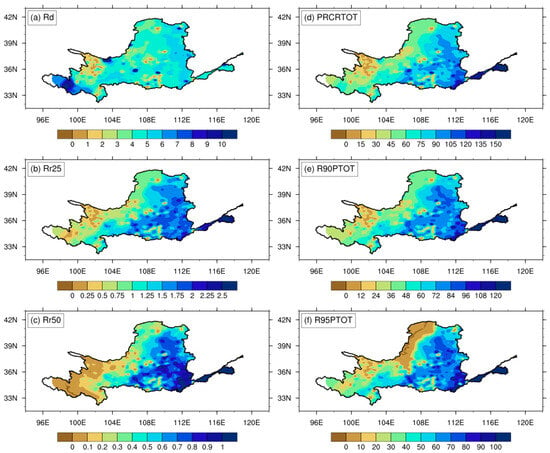
Figure 4.
Standard deviation of summer RD ((a) unit: days), Rr25 ((b) unit: days), Rr50 ((c) unit: days), PRCPTOT ((d) unit: mm), R90PTOT ((e) unit: mm), and R95PTOT ((f) unit: mm) in YRB from 1981 to 2020.
The linear trend distributions of summer extreme precipitation indices in the YRB during 1981–2020 are illustrated in Figure 5. With the exception of total precipitation days, most indices exhibit predominantly increasing trends across the majority of the basin, with similar spatial patterns. Overall, total precipitation days show an increasing trend in the upper reaches of the YRB but a decreasing trend in the lower reaches. All other indices demonstrate increasing trends except in the southern part of the lower basin. On a basin-wide average basis, total precipitation days exhibit a linear decline rate of 0.145 days/decade, while heavy rain days, torrential rain days, total precipitation amount, exceptionally extreme precipitation amount, and precipitation intensity increase at rates of 0.101 days/decade, 0.035 days/decade, 4.142 mm/decade, 5.375 mm/decade, and 3.774 mm/decade, respectively. The results from Figure 4 and Figure 5 collectively indicate that the pronounced interannual variability and intensifying trends of summer extreme precipitation in the YRB lead to significant annual disparities in the spatial distribution of extreme rainfall events. This poses substantial challenges for both the prediction of extreme precipitation and disaster prevention and mitigation efforts in the region. Note that linear trend efficiently quantifies the mean rate of change in extreme precipitation, some non-parametric methods such as the Trend-Free Pre-Whitening Mann-Kendall (TFPW-MK) test may better characterize monotonic trends in autocorrelated climate series [33,34]. It is particularly critical for attributing precipitation changes, which will be the focus of our future work.
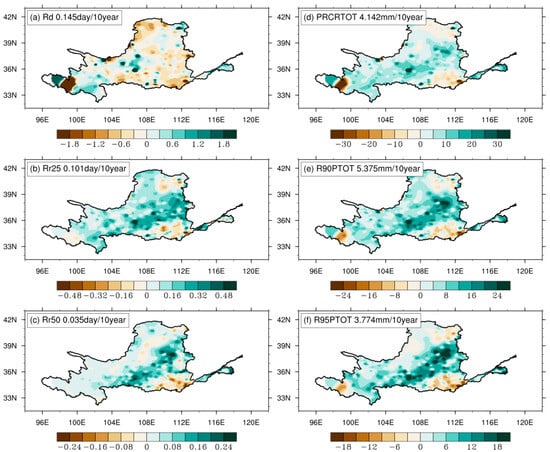
Figure 5.
Linear trend of summer RD ((a) unit: day/10year), Rr25 ((b) unit: day/10year), Rr50 ((c) unit: day/10year), PRCPTOT ((d) unit: mm/day), R90PTOT ((e) unit: mm/day), and R95PTOT ((f) unit: mm/day) in YRB from 1981 to 2020.
4. Leading Modes of Summer Extreme Precipitation in the YRB and Their Relationships with Atmospheric Circulation and SST
To objectively analyze the dominant spatial modes of summer extreme precipitation in the YRB, EOF analysis was applied to the anomaly fields of each extreme precipitation index. The spatial patterns of the first and second modes are presented in Figure 6 and Figure 7, respectively, with their corresponding temporal coefficients shown in Figure 8.
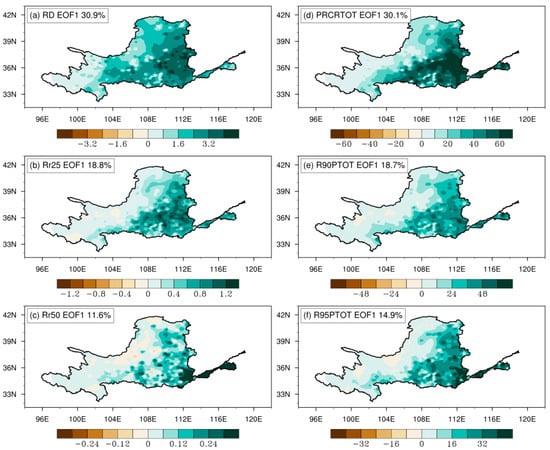
Figure 6.
Spatial pattern of the first EOF (EOF1) mode of summer RD ((a) unit: days), Rr25 ((b) unit: days), Rr50 ((c) unit: days), PRCPTOT ((d) unit: mm), R90PTOT ((e) unit: mm), and R95PTOT ((f) unit: mm) in YRB from 1981 to 2020.
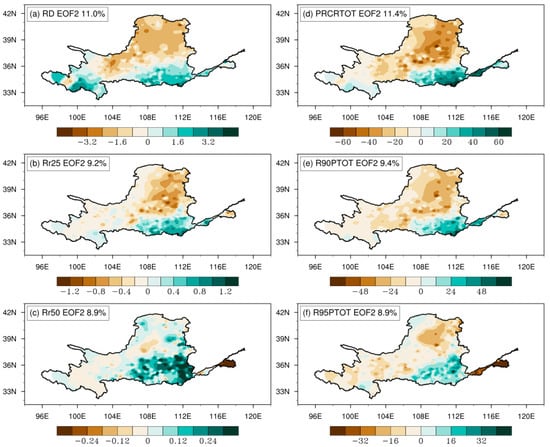
Figure 7.
Same as in Figure 6, but for EOF2 mode.
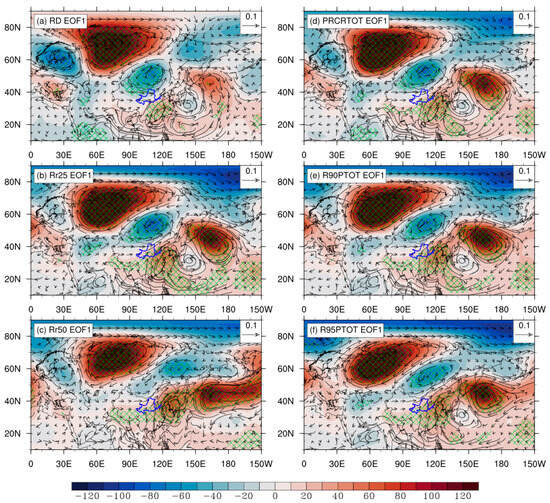
Figure 8.
Regression of summer geopotential height at 500 hPa (H500) anomaly (shading, unit: gpm) and vertically integrated (from surface to 100 hPa) water vapor flux anomaly (vectors, unit: kg/ms) on the time series of the EOF1 mode of summer RD (a), Rr25 (b), Rr50 (c), PRCPTOT (d), R95PTOT (e), and R95PTOT (f) in YRB from 1981 to 2020. Green meshes denote significant H500 anomaly above the 95% confidence level based on the two-tailed Student’s t-test. Blue curve denotes YRB.
The spatial distribution of the first mode reveals a spatially coherent pattern across all indices. During the positive phase of the first mode, metrics including precipitation days, heavy rain days, torrential rain days, total precipitation amount, extreme precipitation amount, and exceptionally extreme precipitation amount exhibit a northwest-to-southeast increasing gradient. Maximum values are observed in the southeastern basin, followed by the northeastern regions, with the lowest magnitudes in the western mountainous areas. Notably, more extreme precipitation indices exhibit smaller variance contributions. Specifically, precipitation days account for the largest variance contribution (30.9%), while torrential rain days contribute the least (11.6%). These results suggest that the stronger the extremeness of precipitation events, the more complex their interannual variability becomes within the basin.
During the positive phase of the second mode, all indices exhibit a dipolar distribution pattern characterized by reduced values in the northern YRB and enhanced values in the southern basin. The extremal centers are located in the mid-basin’s northern sector and the southeastern basin, respectively. Among these indices, total precipitation days and total precipitation amount show the largest variance contributions at 11.0% and 11.4%, respectively. Heavy rain days and extreme precipitation amount contribute 9.2% and 9.4%, while torrential rain days and exceptionally extreme precipitation amount exhibit the smallest variance contributions, both at 8.9%. This further demonstrates that precipitation indices with higher extremeness possess more complex interannual variability characteristics.
To investigate the anomalous drivers of summer extreme precipitation in the YRB, regression analysis was conducted between the temporal coefficients of the dominant modes of extreme precipitation indices and the 500 hPa geopotential height field, as well as the vertically integrated water vapor flux. The results are shown in Figure 8.
Overall, when summer extreme precipitation exhibits a basin-wide increase, the mid-to-high latitudes display a typical Eurasian teleconnection pattern: negative geopotential height anomalies over Northern Europe, positive anomalies over the Ural Mountains, and negative anomalies over eastern Siberia. Under such conditions, the meridional circulation intensifies. Specifically, when the negative geopotential height anomaly center over eastern Siberia extends southwestward to the Hetao region and areas to its south, it facilitates the southward transport of cold air from high latitudes into the YRB. Concurrently, significant positive geopotential height anomalies over subtropical East Asia indicate a westward extension and northward displacement of the subtropical high. This configuration channels abundant moisture into the basin via the southeasterly airflow along the southwestern flank of the subtropical high, providing favorable water vapor conditions for extreme precipitation.
The occurrence of extreme precipitation results from synergistic interactions of multiple factors. For instance, comparative analysis of total precipitation days (Figure 8a), heavy rain days (Figure 8b), and torrential rain days (Figure 8c) reveals that the establishment of the Eurasian teleconnection pattern—marked by active cold air advection from high latitudes—coincides with the northward displacement of the subtropical high. This drives convergence between warm, moist air from low latitudes (southerly flow) and cold air diverted westward from high latitudes (northerly flow), particularly over the lower YRB, thereby enhancing precipitation. Furthermore, a stronger and more northerly displaced subtropical high intensifies southerly warm-moist moisture transport, amplifying extreme precipitation and favoring heavy to torrential rainfall. Similar mechanisms are observed for total precipitation amount (Figure 8d) and extreme precipitation amounts (Figure 8e,f).
When summer extreme precipitation in the YRB exhibits a “north-deficit-south-surplus” dipolar distribution pattern, the corresponding 500 hPa geopotential height field and vertically integrated water vapor flux are illustrated in Figure 9. Compared to Figure 8, the most distinct feature lies in the zonal dipole pattern of geopotential height anomalies over the Ural Mountains and regions to their west. Here, the Ural anticyclonic anomaly shifts southward, with cyclonic anomalies prevailing to its north, resulting in a predominantly zonal circulation regime. The southerly displaced Ural anticyclone forces cold air advection from high latitudes to penetrate further south, favoring enhanced precipitation in the southern YRB.
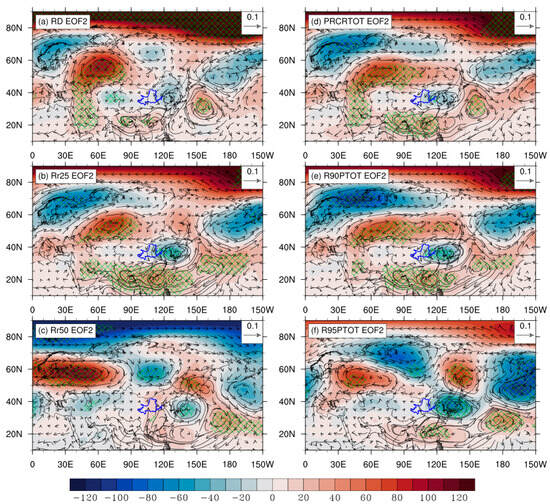
Figure 9.
Same as in Figure 8, but for EOF2 mode.
Over East Asia, an East Asia-Pacific (EAP) teleconnection pattern emerges. The subtropical high exhibits strong zonal orientation, extending westward and remaining anomalously southward, thereby channeling moisture to regions south of the YRB where it converges with cold air from high latitudes. Comparative analysis of total precipitation days (Figure 9a), heavy rain days (Figure 9b), and torrential rain days (Figure 9c) reveals that the southward displacement of the Ural anticyclone reinforces the dipolar precipitation pattern (north-deficit, south-surplus) across the basin. In such scenarios, precipitation intensity depends critically on moisture transport efficiency. When the subtropical high adopts a clustered spatial configuration (Figure 9c), it generates stronger rainfall intensity compared to its zonally elongated structure (Figure 9b).
Further comparison of total precipitation amount (Figure 9d) and extreme precipitation amounts (Figure 9e,f) demonstrates that the EAP teleconnection associated with extreme precipitation is markedly stronger than that linked to total precipitation. This underscores the dominant contribution of warm-moisture transport induced by the subtropical high to precipitation intensity amplification.
SST anomalies are a critical driver of global atmospheric circulation anomalies and play a pivotal role in modulating the East Asian summer monsoon and summer precipitation anomalies across China. Figure 10 illustrates the SST anomaly patterns associated with the EOF1 mode of summer extreme precipitation in the YRB, spanning from the preceding autumn to the concurrent summer.
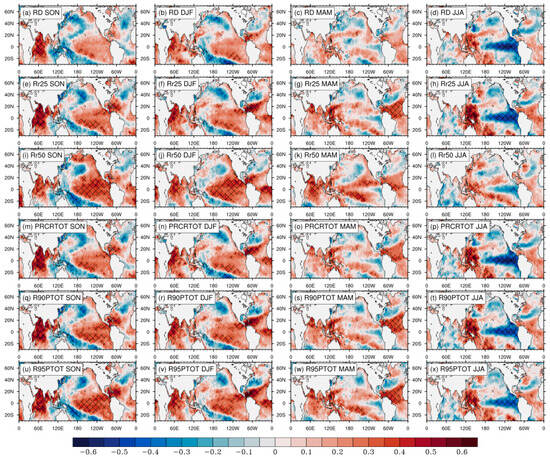
Figure 10.
Correlation patterns between the time series of the EOF1 mode of summer RD (a–d), Rr25 (e–h), Rr50 (i–l), PRCPTOT (m–p), R90PTOT (q–t), and R95PTOT (u–x) in YRB and former autumn (a,e,i,m,q,u), winter (b,f,j,n,r,v), spring (c,g,k,o,s,w) and simultaneous summer (d,h,l,p,t,x) SST anomalies. Black meshes denote significant correlation coefficients above the 95% confidence level based on the two-tailed Student’s t-test.
Precipitation characteristics depicted by both precipitation days and precipitation amount reveal coherent SST anomaly signals. Specifically, the preceding SST anomaly signals linked to total precipitation days and total precipitation amount are relatively weak. However, during the concurrent summer, a significant negative correlation emerges with tropical eastern Pacific SST anomalies, indicative of a La Niña-like SST pattern. As the extremity of precipitation increases, preceding SST signals intensify markedly, particularly during autumn and winter. These signals manifest as a prominent Indian Ocean basin-wide (IOBW) mode and an El Niño-like SST pattern. The SST evolution from the preceding autumn to the concurrent summer exhibits a transition from a decaying El Niño to a developing La Niña.
Figure 11 shows the sea surface temperature (SST) anomalies associated with the second EOF mode of summer extreme precipitation in the YRB. Comparative analysis between extreme precipitation and total precipitation reveals that as extreme precipitation increases, SST signals become more complex, with statistically significant SST signals becoming less distinct. All indices exhibit SST anomaly patterns resembling the Indian Ocean Basin Mode (IOBM), El Niño-Southern Oscillation (ENSO), and North Atlantic SST (NAST), though these patterns remain non-canonical. This may be attributed to the fact that SST-forced circulation anomalies primarily generate large-scale stable circulation patterns, which in turn produce spatially extensive precipitation events, including extreme precipitation. When extreme precipitation in the YRB manifests as a north-deficit-south-surplus dipolar distribution pattern, these mesoscale, localized precipitation anomalies predominantly respond to regional circulation anomalies while exhibiting relatively weaker sensitivity to SST forcing.
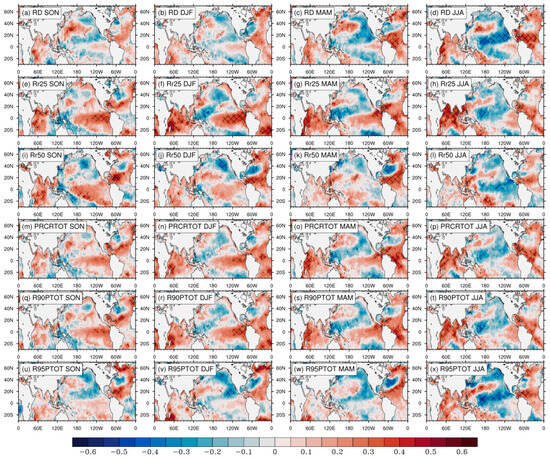
Figure 11.
Same as in Figure 10, but for EOF2 mode.
Figure 12 presents the lead-lag correlations between the EOF temporal coefficients of precipitation indices and the Niño3.4, IOBM, and NAST indices, calculated to clarify the SST anomaly signals associated with the dominant modes of summer extreme precipitation in the YRB. As previously established, the EOF1 modes of all indices predominantly occur during the decaying phase of El Niño and developing phase of La Niña, with significant El Niño signals detectable in preceding autumn-winter seasons, particularly for extreme precipitation. The evolution of IOBM signals parallels that of ENSO, consistent with previous studies [35,36] demonstrating that the IOBM partially functions as a passive atmospheric bridge response driven by ENSO-induced Walker circulation anomalies. However, Atlantic signals exhibit negligible influence on EOF1.
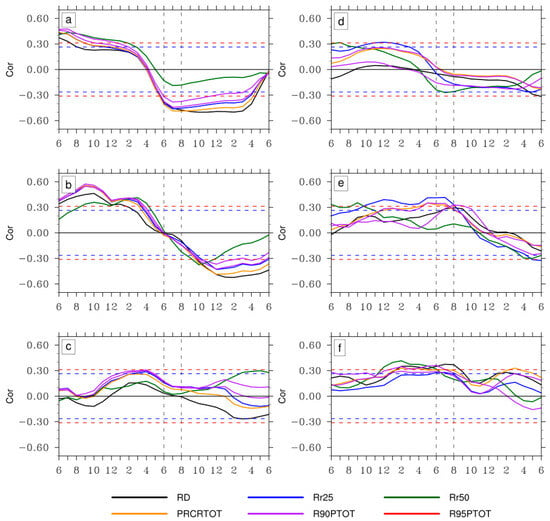
Figure 12.
(a–c) Lead-lag correlation coefficients between the time series of EOF1 mode of summer RD, Rr25, Rr50, PRCPTOT, R90PTOT, and R95PTOT in YRB and monthly Niño3.4 index (a), IOBM index (b), and NAST index (c). (d–f) Same as in (a–c), but for EOF2 mode. The dashed blue (red) line denotes statistical significance at 90% (95%) confidence level based on Student’s t-test.
For EOF2 modes, SST anomaly signals reveal contributions from all three major ocean basins. Summers corresponding to the EOF2 modes of all indices also show characteristics of El Niño decay and La Niña development. Although IOBM signals display analogous evolutionary patterns, they only attain statistical significance for heavy rain days. Notably, NAST signals from the preceding spring through concurrent summer demonstrate substantially greater strength in EOF2 compared to EOF1 modes, with most passing significance tests.
5. Conclusions and Discussion
Utilizing daily precipitation data from 400 meteorological stations in the YRB, ERA5 reanalysis data, and HadISST datasets, this study analyzed the climatic characteristics, dominant modes, and their linkages with atmospheric circulation and SST anomalies of extreme precipitation in the YRB during 1981–2020. Key conclusions are as follows:
- (1)
- All extreme precipitation indices in the YRB exhibit northwest-to-southeast increasing gradients in both climatological patterns and standard deviation distributions of frequency and intensity. The highest extreme precipitation values occur in the southeastern lower basin, followed by the northeastern regions, with the lowest values observed in the western mountainous upper reaches. Precipitation distribution demonstrates an intrinsic linkage with topography—the western mountainous areas are dominated by frequent light precipitation, whereas extreme precipitation events predominantly concentrate in the southeastern lower basin. Trend analysis reveals predominantly increasing trends in summer extreme precipitation across most regions of the YRB.
- (2)
- The first EOF mode of summer extreme precipitation in the YRB exhibits a spatially coherent pattern with a northwest-to-southeast increasing gradient, peaking in the southeastern basin, followed by the northeastern regions, and reaching minimum values in the western mountainous areas. The second EOF mode displays a dipolar distribution characterized by precipitation deficits in the northern basin and surpluses in the southern basin, with extremal centers located in the northern sector of the mid-basin and the southeastern basin, respectively. Notably, precipitation indices with higher extremity demonstrate smaller variance contributions, indicating more complex interannual variability in extreme precipitation indices.
Extreme precipitation in the YRB is the result of synergistic interactions among multiple climatic drivers. During the positive phase of the first EOF mode of summer extreme precipitation, the atmospheric circulation configuration over high latitudes exhibits a prototypical Eurasian teleconnection pattern. Enhanced meridional circulation facilitates the southward intrusion of high-latitude cold air masses, while the northward displacement of the subtropical high promotes robust moisture transport via southeasterly airflow along its southwestern flank, channeling abundant moisture toward the Henan region. This phase coincides with the decaying phase of El Niño and the developing phase of La Niña, though North Atlantic signals remain statistically insignificant. For the positive phase of the second EOF mode, the circulation anomalies feature a southward-shifted Ural blocking high, which steers cold air advection anomalously southward. Concurrently, the westward-extended and southward-displaced subtropical high drives moisture convergence, where warm-moist southerly flows intersect with cold air masses south of the YRB, generating precipitation. During this phase, SST anomalies across the Pacific, Indian, and Atlantic Oceans exhibit complex yet non-canonical patterns, lacking dominant basin-specific signals characteristic of established climate modes. Given that the first two EOF modes explain more than 20–40% of the total variance for most precipitation indices, developing seasonal prediction and early warning systems for extreme precipitation in the YRB based on these EOF patterns represents a potential approach for future flood and disaster prevention in the region.
This study analyzes the climatic characteristics of summer extreme precipitation in the YRB and investigates their dominant modes and relationships with atmospheric circulation and SST. The identified circulation and SST patterns represent a climatic background conducive to extreme precipitation events. Notably, significant SST anomalies are observed in the North Atlantic, Indian Ocean, and tropical Pacific. However, the specific pathways through which SST anomalies in these regions influence extreme precipitation in the YRB [37,38,39,40], as well as the independence and synergistic effects among these oceanic signals [41,42,43], require further investigation. While our results demonstrated statistically significant correlations between tropical SST anomalies and summer extreme precipitation patterns in the YRB, it can hardly infer a direct causal relationship from these associations. The observed linkages likely arise from complex atmospheric teleconnections resulted from ocean forcing. For example, the transition from El Niño decay to La Niña development may modulate the East Asia-Pacific teleconnection pattern, which subsequently influences the position of the WPSH and mid-latitude Rossby wave trains [37,39,44]. Future work employing model experiments is needed to isolate the potential mechanisms of causal pathways to extreme precipitation in this region. Moreover, as extreme precipitation events emerge as mesoscale phenomena under large-scale circulation regimes and are showing complexity (such as concurrent heatwaves and extreme rainfall) under climate change [24], the influence of interactions among different scales on summer extreme precipitation [44,45,46,47], as well as the variation of extreme precipitation during the advancement of global warming [48,49,50,51], will be the focus of further research and discussion.
Author Contributions
Conceptualization, D.Y.; methodology, D.Y. and X.W.; software, X.W.; validation, D.Y. and X.W.; formal analysis, D.Y. and X.W.; data curation, J.W.; writing—original draft preparation, X.W.; writing—review and editing, D.Y. and, J.W.; visualization, X.W., D.Y. and J.W. All authors have read and agreed to the published version of the manuscript.
Funding
This work was supported by the Science and Technology Project of State Grid Henan Electric Power Company (No. 52170223000N).
Institutional Review Board Statement
Not applicable.
Informed Consent Statement
Not applicable.
Data Availability Statement
The ERA5 reanalysis datasets were obtained from the Copernicus Climate Change Service Climate Data Store (https://cds.climate.copernicus.eu/datasets/reanalysis-era5-pressure-levels-monthly-means (accessed on 17 July 2025)) [30]. The HadISSTv1 dataset was obtained from the Met Office Hadley Centre for Climate Science and Services (https://www.metoffice.gov.uk/hadobs/hadisst (accessed on 17 July 2025)) [31].
Conflicts of Interest
Author Degui Yao, Xiaohui Wang and Jinyu Wang were employed by the State Grid Henan Electric Power Company. The remaining authors declare that the research was conducted in the absence of any commercial or financial relationships that could be construed as a potential conflict of interest.
References
- Fu, G.; Chen, S.; Liu, C.; Shepard, D. Hydro-climatic Trends of the Yellow River basin for the last 50 years. Clim. Change 2004, 65, 149–178. [Google Scholar] [CrossRef]
- Meng, F.; Su, F.; Yang, D.; Tong, K.; Hao, Z. Impacts of recent climate change on the hydrology in the source region of the Yellow River basin. J. Hydrol. Reg. Stud. 2016, 6, 66–81. [Google Scholar] [CrossRef]
- Zhu, Y.; Lin, Z.; Wang, J.; Zhao, Y.; He, F. Impacts of climate changes on water resources in Yellow River Basin, China. Procedia Eng. 2016, 154, 687–695. [Google Scholar] [CrossRef]
- Liang, K.; Liu, S.; Bai, P.; Nie, R. The Yellow River basin becomes wetter or drier? The case as indicated by mean precipitation and extremes during 1961–2012. Theor. Appl. Clim. 2015, 119, 701–722. [Google Scholar] [CrossRef]
- Guan, Y.; Zheng, F.; Zhang, P.; Qin, C. Spatial and temporal changes of meteorological disasters in China during 1950–2013. Nat. Hazards 2015, 75, 2607–2623. [Google Scholar] [CrossRef]
- Wu, M.; Chen, Y.; Wang, H.; Sun, G. Characteristics of meteorological disasters and their impacts on the agricultural ecosystems in the northwest of China: A case study in Xinjiang. Geoenviron. Disasters 2015, 2, 3. [Google Scholar] [CrossRef]
- Wang, Y.; Zhang, Q.; Wang, S.-P.; Wang, J.-S.; Yao, Y.-B. Characteristics of agro-meteorological disasters and their risk in Gansu Province against the background of climate change. Nat. Hazards 2017, 89, 899–921. [Google Scholar] [CrossRef]
- Ferreira, S. Extreme weather events and climate change: Economic impacts and adaptation policies. Annu. Rev. Resour. Econ. 2024, 16, 207–231. [Google Scholar] [CrossRef]
- Newman, R.; Noy, I. The global costs of extreme weather that are attributable to climate change. Nat. Commun. 2023, 14, 6103. [Google Scholar] [CrossRef] [PubMed]
- Zuo, Q.; Song, Y.; Wang, H.; Li, J.; Han, C. Spatial variations of extreme precipitation events and attribution analysis in the main water resource area of the Belt and Road Initiative. Theor. Appl. Clim. 2021, 144, 535–554. [Google Scholar] [CrossRef]
- Tabari, H. Extreme value analysis dilemma for climate change impact assessment on global flood and extreme precipitation. J. Hydrol. 2021, 593, 125932. [Google Scholar] [CrossRef]
- Zhou, X.; Bai, Z.; Yang, Y. Linking trends in urban extreme rainfall to urban flooding in China. Int. J. Clim. 2017, 37, 4586–4593. [Google Scholar] [CrossRef]
- Yang, L.; Smith, J.; Niyogi, D. Urban impacts on extreme monsoon rainfall and flooding in complex terrain. Geophys. Res. Lett. 2019, 46, 5918–5927. [Google Scholar] [CrossRef]
- Zhou, X.; Sun, L.; Huang, W.; Cheng, W.; Jia, N. Precipitation in the Yellow River drainage basin and East Asian monsoon strength on a decadal time scale. Quat. Res. 2012, 78, 486–491. [Google Scholar] [CrossRef]
- Xu, J.; Ma, Y. Response of the hydrological regime of the Yellow River to the changing monsoon intensity and human activity. Hydrol. Sci. J. 2009, 54, 90–100. [Google Scholar] [CrossRef]
- Chen, F.; Opała-Owczarek, M.; Owczarek, P.; Chen, Y. Summer monsoon season streamflow variations in the middle Yellow River since 1570 CE inferred from tree rings of Pinus tabulaeformis. Atmosphere 2020, 11, 717. [Google Scholar] [CrossRef]
- Xu, H.; Goldsmith, Y.; Lan, J.; Tan, L.; Wang, X.; Zhou, X.; Cheng, J.; Lang, Y.; Liu, C. Juxtaposition of western Pacific subtropical high on Asian Summer Monsoon shapes subtropical East Asian precipitation. Geophys. Res. Lett. 2020, 47, e2019GL084705. [Google Scholar] [CrossRef]
- Xue, G.; Cai, Y.; Zheng, Y.; Zhang, H.; Han, T.; Huang, S.; Cheng, X.; Ma, L.; Liu, C.; Edwards, R.L.; et al. Western Pacific Subtropical High modulates regional hydroclimate changes on multiple timescales over central China. J. Geophys. Res. Atmos. 2025, 130, e2024JD042735. [Google Scholar] [CrossRef]
- Hu, L.; Zhang, Q.; Wang, G.; Singh, V.P.; Wu, W.; Fan, K.; Shen, Z. Flood disaster risk and socioeconomy in the Yellow River Basin, China. J. Hydrol. Reg. Stud. 2022, 44, 101272. [Google Scholar] [CrossRef]
- Sun, Y.; Zhang, Q.; Singh, V.P. Flooding in the Yellow River Basin, China: Spatiotemporal patterns, drivers and future tendency. J. Hydrol. Reg. Stud. 2024, 52, 101706. [Google Scholar] [CrossRef]
- Zhu, Y.; Qiao, F.; Liu, Y.; Liang, X.-Z.; Liu, Q.; Wang, R.; Zhang, H. The impacts of multi-physics parameterization on forecasting heavy rainfall induced by weak landfalling Typhoon Rumbia (2018). Atmos. Res. 2021, 265, 105883. [Google Scholar] [CrossRef]
- Zhang, Q.; Li, R.; Sun, J.; Lu, F.; Xu, J.; Zhang, F. A Review of Research on the Record-Breaking Precipitation Event in Henan Province, China, July 2021. Adv. Atmos. Sci. 2023, 40, 1485–1500. [Google Scholar] [CrossRef]
- Yan, Z.; Wang, Z.; Peng, M. Impacts of climate trends on the heavy precipitation event associated with Typhoon Doksuri in Northern China. Atmos. Res. 2025, 314, 107816. [Google Scholar] [CrossRef]
- He, K.; Chen, X.; Zhou, J.; Zhao, D.; Yu, X. Compound successive dry-hot and wet extremes in China with global warming and urbanization. J. Hydrol. 2024, 636, 131332. [Google Scholar] [CrossRef]
- IPCC. Climate Change 2021: The Physical Science Basis. Contribution of Working Group I to the Sixth Assessment Report of the Intergovernmental Panel on Climate Change; Masson-Delmotte, V., Zhai, P., Pirani, A., Connors, S.L., Péan, C., Berger, S., Caud, N., Chen, Y., Goldfarb, L., Gomis, M.I., et al., Eds.; Cambridge University Press: Cambridge, UK; New York, NY, USA, 2021. [Google Scholar]
- Chi, H.; Wu, Y.; Zheng, H.; Zhang, B.; Sun, Z.H.; Yan, J.H.; Ren, Y.K.; Guo, L.N. Spatial patterns of climate change and asso-ciated climate hazards in Northwest China. Sci. Rep. 2023, 13, 10418. [Google Scholar] [CrossRef] [PubMed]
- Zhou, X.; Li, Y.; Xiao, C.; Chen, W.; Mei, M.; Wang, G. High-impact Extreme Weather and Climate Events in China: Summer 2024 Overview. Adv. Atmos. Sci. 2025, 42, 1064–1076. [Google Scholar] [CrossRef]
- Yin, L.; Ping, F.; Mao, J.; Jin, S. Analysis on precipitation efficiency of the “21.7” Henan extremely heavy rainfall event. Adv. Atmos. Sci. 2023, 40, 374–392. [Google Scholar] [CrossRef]
- Huang, Y.; Feng, X.; Zhou, C.; Fu, B. Reconciling the strategic goals of irrigated food production, energy production with environmental flows under water transfer project in the Yellow River Basin. J. Hydrol. Reg. Stud. 2025, 60, 102575. [Google Scholar] [CrossRef]
- Hersbach, H.; Bell, B.; Berrisford, P.; Hirahara, S.; Horányi, A.; Muñoz-Sabater, J.; Nicolas, J.; Peubey, C.; Radu, R.; Schepers, D.; et al. The ERA5 global reanalysis. Q. J. R. Meteorol. Soc. 2020, 146, 1999–2049. [Google Scholar] [CrossRef]
- Titchner, H.A.; Rayner, N.A. The Met Office Hadley Centre sea ice and sea surface temperature data set, version 2: 1. Sea ice concentrations. J. Geophys. Res. Atmos. 2014, 119, 2864–2889. [Google Scholar] [CrossRef]
- Kang, K.K.; Lee, D.S.; Hwang, S.W.; Kim, B.S. Analysis of Changes in Extreme Weather Characteristics in Gangwon Region Using Expert Team on Climate Change Detection and Indices (ETCCDI). J. Korean Soc. Water. Res. 2014, 47, 1107–1119. [Google Scholar]
- Chauhan, A.S.; Singh, S.; Maurya, R.K.S.; Danodia, A. Spatio-temporal analysis of rainfall in relation to monsoon teleconnections and agriculture at Regional Scale in Haryana, India. Environ. Sci. Pollut. Res. 2022, 30, 116781–116803. [Google Scholar] [CrossRef] [PubMed]
- Chauhan, A.S.; Singh, S.; Maurya, R.K.S.; Rani, A.; Danodia, A. Spatio-temporal trend analysis and future projections of precipitation at regional scale: A case study of Haryana, India. J. Water Clim. Change 2022, 13, 2143–2170. [Google Scholar] [CrossRef]
- Lau, N.-C.; Nath, M.J. The Role of the “atmospheric bridge” in linking tropical Pacific ENSO events to extratropical SST anomalies. J. Clim. 1996, 9, 2036–2057. [Google Scholar] [CrossRef]
- Klein, S.A.; Soden, B.J.; Lau, N.C. Remote sea surface temperature variations during ENSO: Evidence for a tropical atmospheric bridge. J. Clim. 1999, 12, 917–932. [Google Scholar] [CrossRef]
- Yuan, F.; Yasuda, H.; Berndtsson, R.; Uvo, C.B.; Zhang, L.; Hao, Z.; Wang, X. Regional sea-surface temperatures explain spatial and temporal variation of summer precipitation in the source region of the Yellow River. Hydrol. Sci. J. 2016, 61, 1383–1394. [Google Scholar] [CrossRef]
- Ding, X.; Li, X.; Wang, A.; Guo, X.; Xu, X.; Liu, C.; Qin, X.; Xie, Y.; Wei, Y.; Cui, Z.; et al. Unprecedented phytoplankton blooms in autumn/winter in the southern Bohai Sea (China) due to high Yellow River discharge: Implications of extreme rainfall events. J. Environ. Manag. 2024, 351, 119901. [Google Scholar] [CrossRef] [PubMed]
- Zhang, L.; Sielmann, F.; Fraedrich, K.; Zhu, X.; Zhi, X. Variability of winter extreme precipitation in Southeast China: Contributions of SST anomalies. Clim. Dyn. 2015, 45, 2557–2570. [Google Scholar] [CrossRef]
- Jiang, P.; Yu, Z.; Yuan, F.; Acharya, K. The Multi-scale temporal variability of extreme precipitation in the source region of the Yellow River. Water 2019, 11, 92. [Google Scholar] [CrossRef]
- Zhang, J.; Li, D.; Li, L.; Deng, W. Decadal variability of droughts and floods in the Yellow River basin during the last five centuries and relations with the North Atlantic SST. Int. J. Clim. 2013, 33, 3217–3228. [Google Scholar] [CrossRef]
- Zhu, Z.; Feng, Y.; Jiang, W.; Lu, R.; Yang, Y. The compound impacts of sea surface temperature modes in the Indian and North Atlantic oceans on the extreme precipitation days in the Yangtze River Basin. Clim. Dyn. 2023, 61, 3327–3341. [Google Scholar] [CrossRef]
- Liu, G.; He, S.; Wong, M.L.; Zou, Y.F.; He, H.B.; Chongyi, E.; Chawchai, S.; Zheng, H.B.; Li, X.Z. Tropical Pacific forcing of hydro-climate in the source area of the Yellow River. Geophys. Res. Lett. 2021, 48, e2021GL095876. [Google Scholar] [CrossRef]
- Yu, S.; Shi, X.; Lin, X. Interannual variation of East Asian summer monsoon and its impacts on general circulation and precipitation. J. Geogr. Sci. 2009, 19, 67–80. [Google Scholar] [CrossRef]
- Yin, Y.; Chen, H.; Zhai, P.; Xu, C.; Ma, H. Characteristics of summer extreme precipitation in the Huai River basin and their relationship with East Asia summer monsoon during 1960–2014. Int. J. Clim. 2019, 39, 1555–1570. [Google Scholar] [CrossRef]
- Ding, Y.; Wang, Z.; Sun, Y. Inter–decadal variation of the summer precipitation in East China and its association with de-creasing Asian summer monsoon. Part I: Observed evidences. Int. J. Climatol. 2008, 28, 1139–1161. [Google Scholar] [CrossRef]
- Veiga, S.F.; Yuan, H. The response of the East Asian summer rainfall to more extreme El Niño events in future climate scenarios. Atmos. Res. 2021, 268, 105983. [Google Scholar] [CrossRef]
- Ban, N.; Schmidli, J.; Schär, C. Heavy precipitation in a changing climate: Does short-term summer precipitation increase faster? Geophys. Res. Lett. 2015, 42, 1165–1172. [Google Scholar] [CrossRef]
- Hu, Y.; Deng, Y.; Zhou, Z.; Cui, C.; Dong, X. A statistical and dynamical characterization of large-scale circulation patterns associated with summer extreme precipitation over the middle reaches of Yangtze river. Clim. Dyn. 2019, 52, 6213–6228. [Google Scholar] [CrossRef]
- Zhang, F.; Odins, A.M.; Nielsen-Gammon, J.W. Mesoscale predictability of an extreme warm-season precipitation event. Weather Forecast. 2006, 21, 149–166. [Google Scholar] [CrossRef]
- Bao, J.; Feng, J. Intercomparison of CMIP5 simulations of summer precipitation, evaporation, and water vapor transport over Yellow and Yangtze River basins. Theor. Appl. Clim. 2015, 123, 437–452. [Google Scholar] [CrossRef]
Disclaimer/Publisher’s Note: The statements, opinions and data contained in all publications are solely those of the individual author(s) and contributor(s) and not of MDPI and/or the editor(s). MDPI and/or the editor(s) disclaim responsibility for any injury to people or property resulting from any ideas, methods, instructions or products referred to in the content. |
© 2025 by the authors. Licensee MDPI, Basel, Switzerland. This article is an open access article distributed under the terms and conditions of the Creative Commons Attribution (CC BY) license (https://creativecommons.org/licenses/by/4.0/).