Sensitivity Study of WRF Model at Different Horizontal Resolutions for the Simulation of Low-Level, Mid-Level and High-Level Wind Speeds in Hebei Province

 ,
,
Abstract
1. Introduction
2. Materials and Methods
3. Results
3.1. Simulation Performance of the WRF Model at Three Resolutions for Wind Speeds at Different Heights in Various Stations
3.1.1. Spring
3.1.2. Summer
3.1.3. Autumn
3.1.4. Winter
3.2. Simulation Performance of the WRF Model at Three Resolutions for Wind Speeds at Different Heights in Mountains and Plains
3.2.1. Spring
3.2.2. Summer
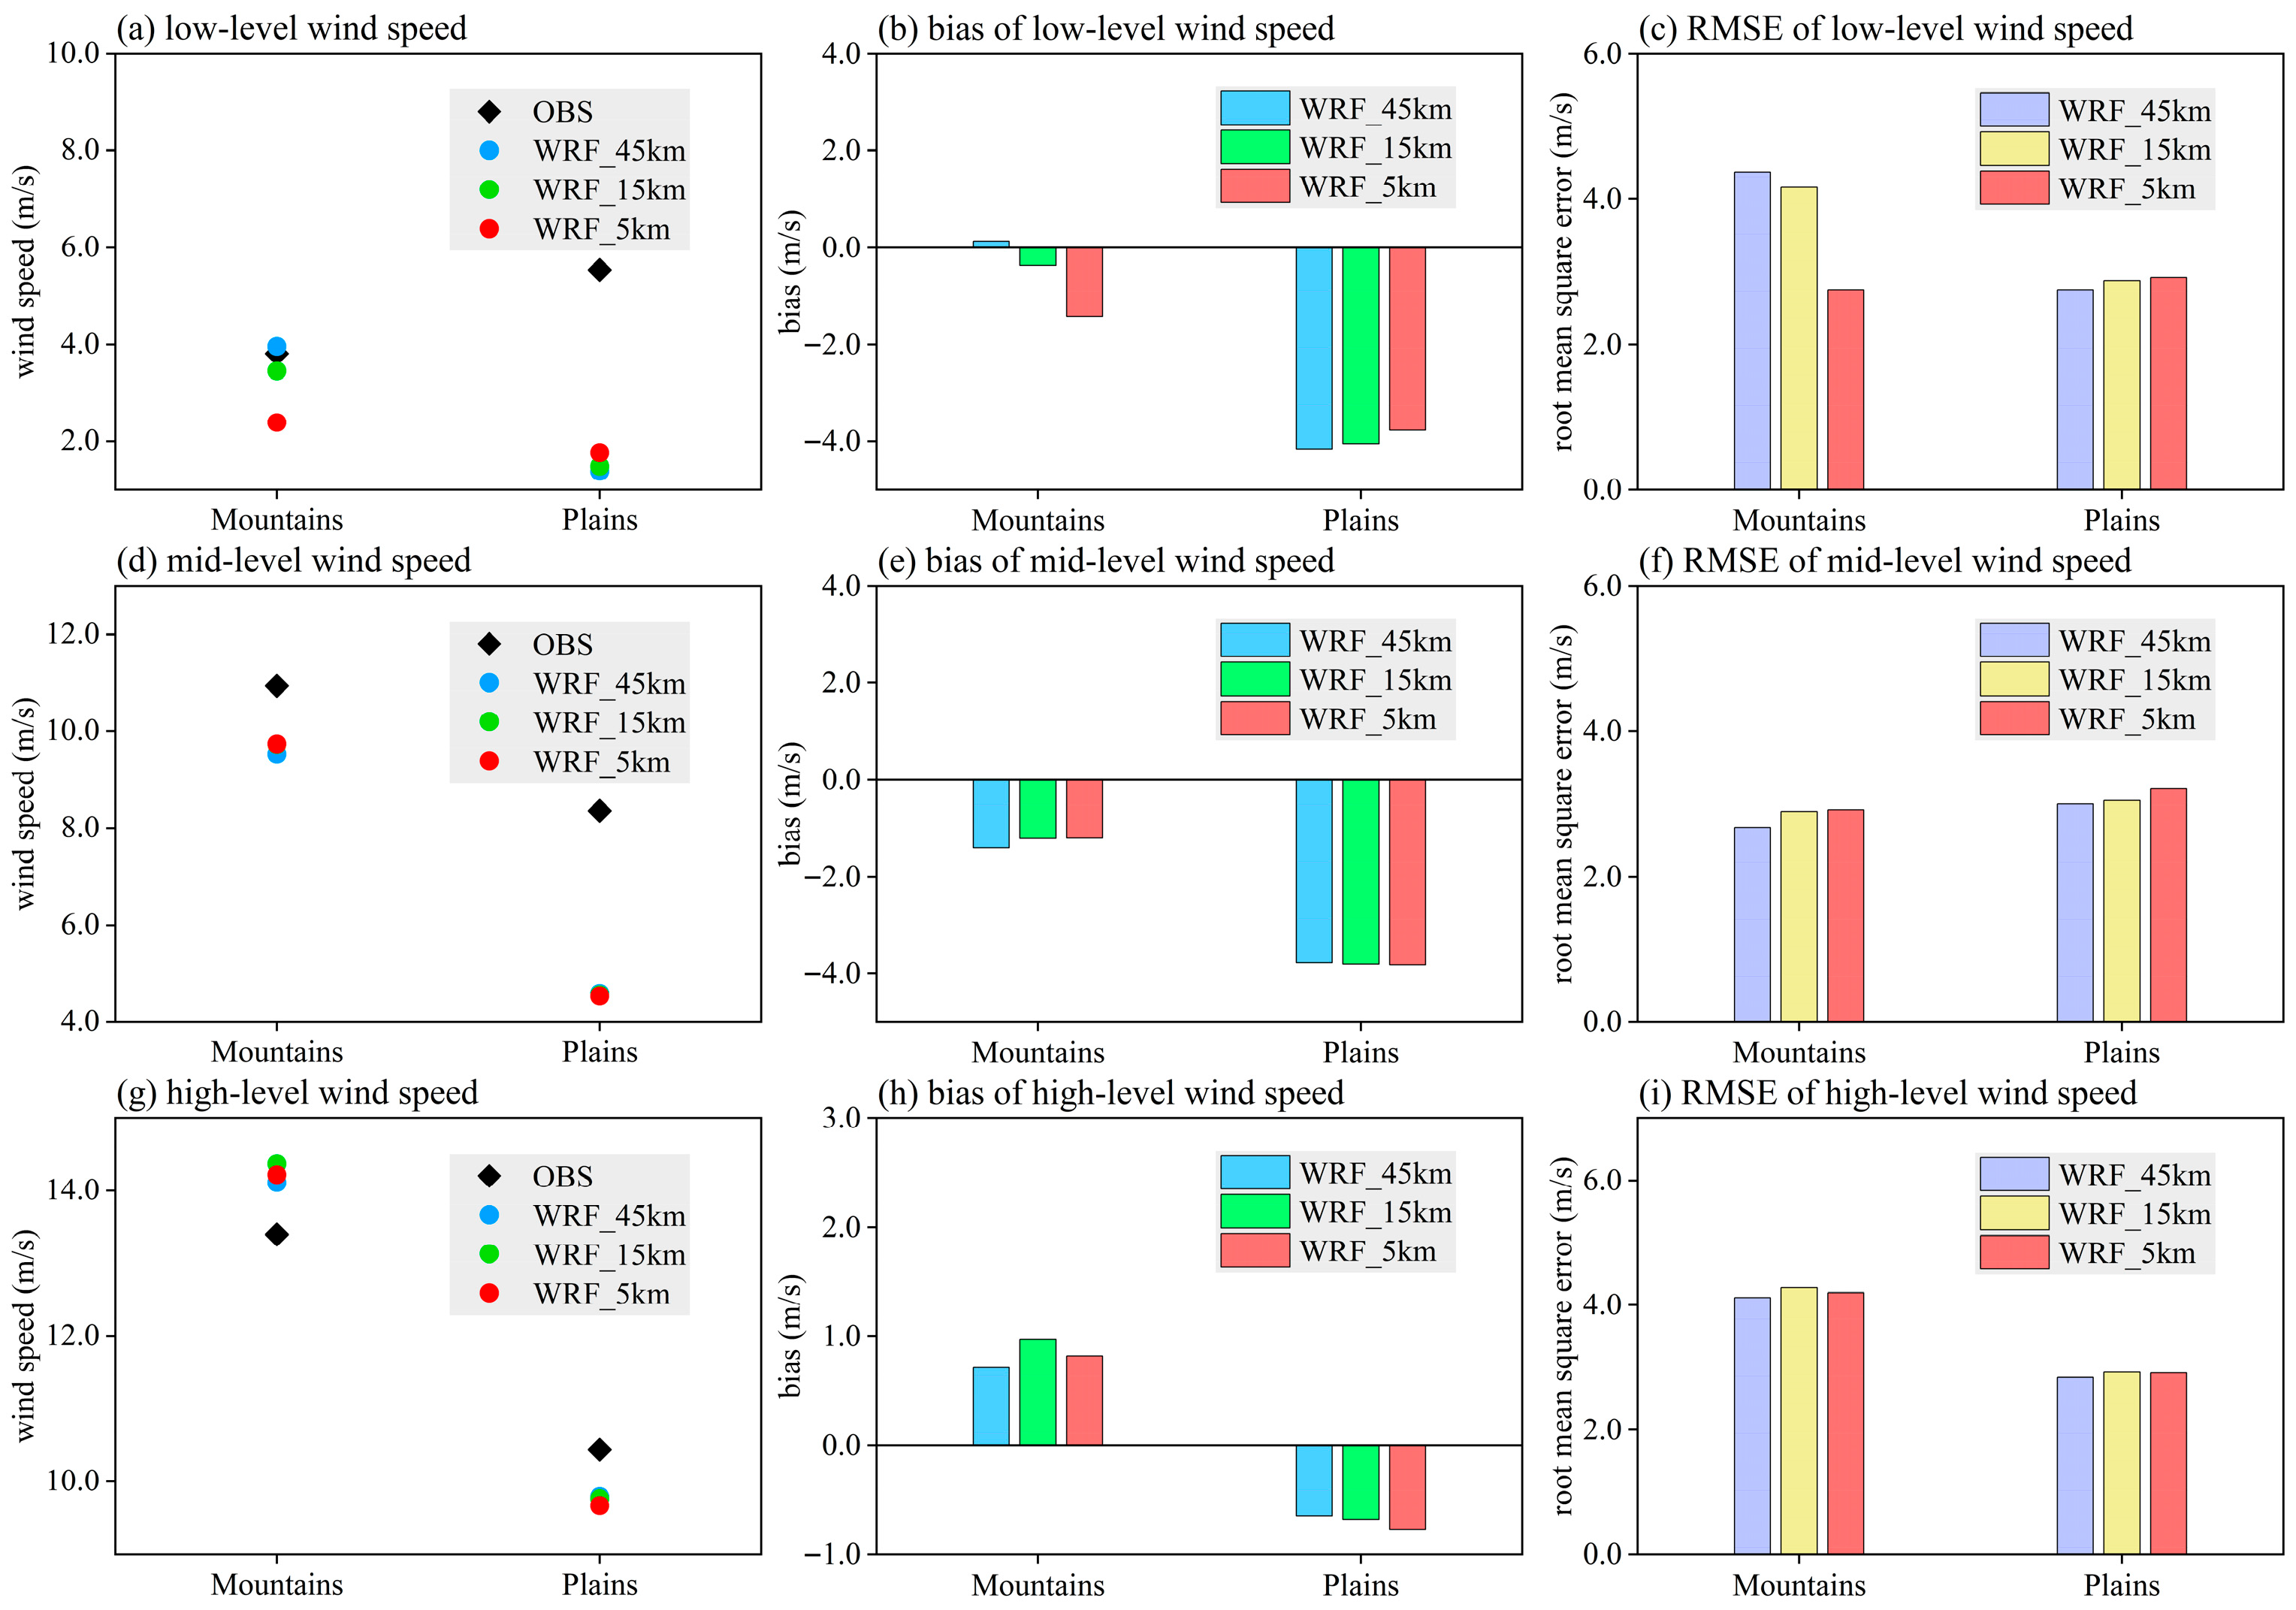
3.2.3. Autumn
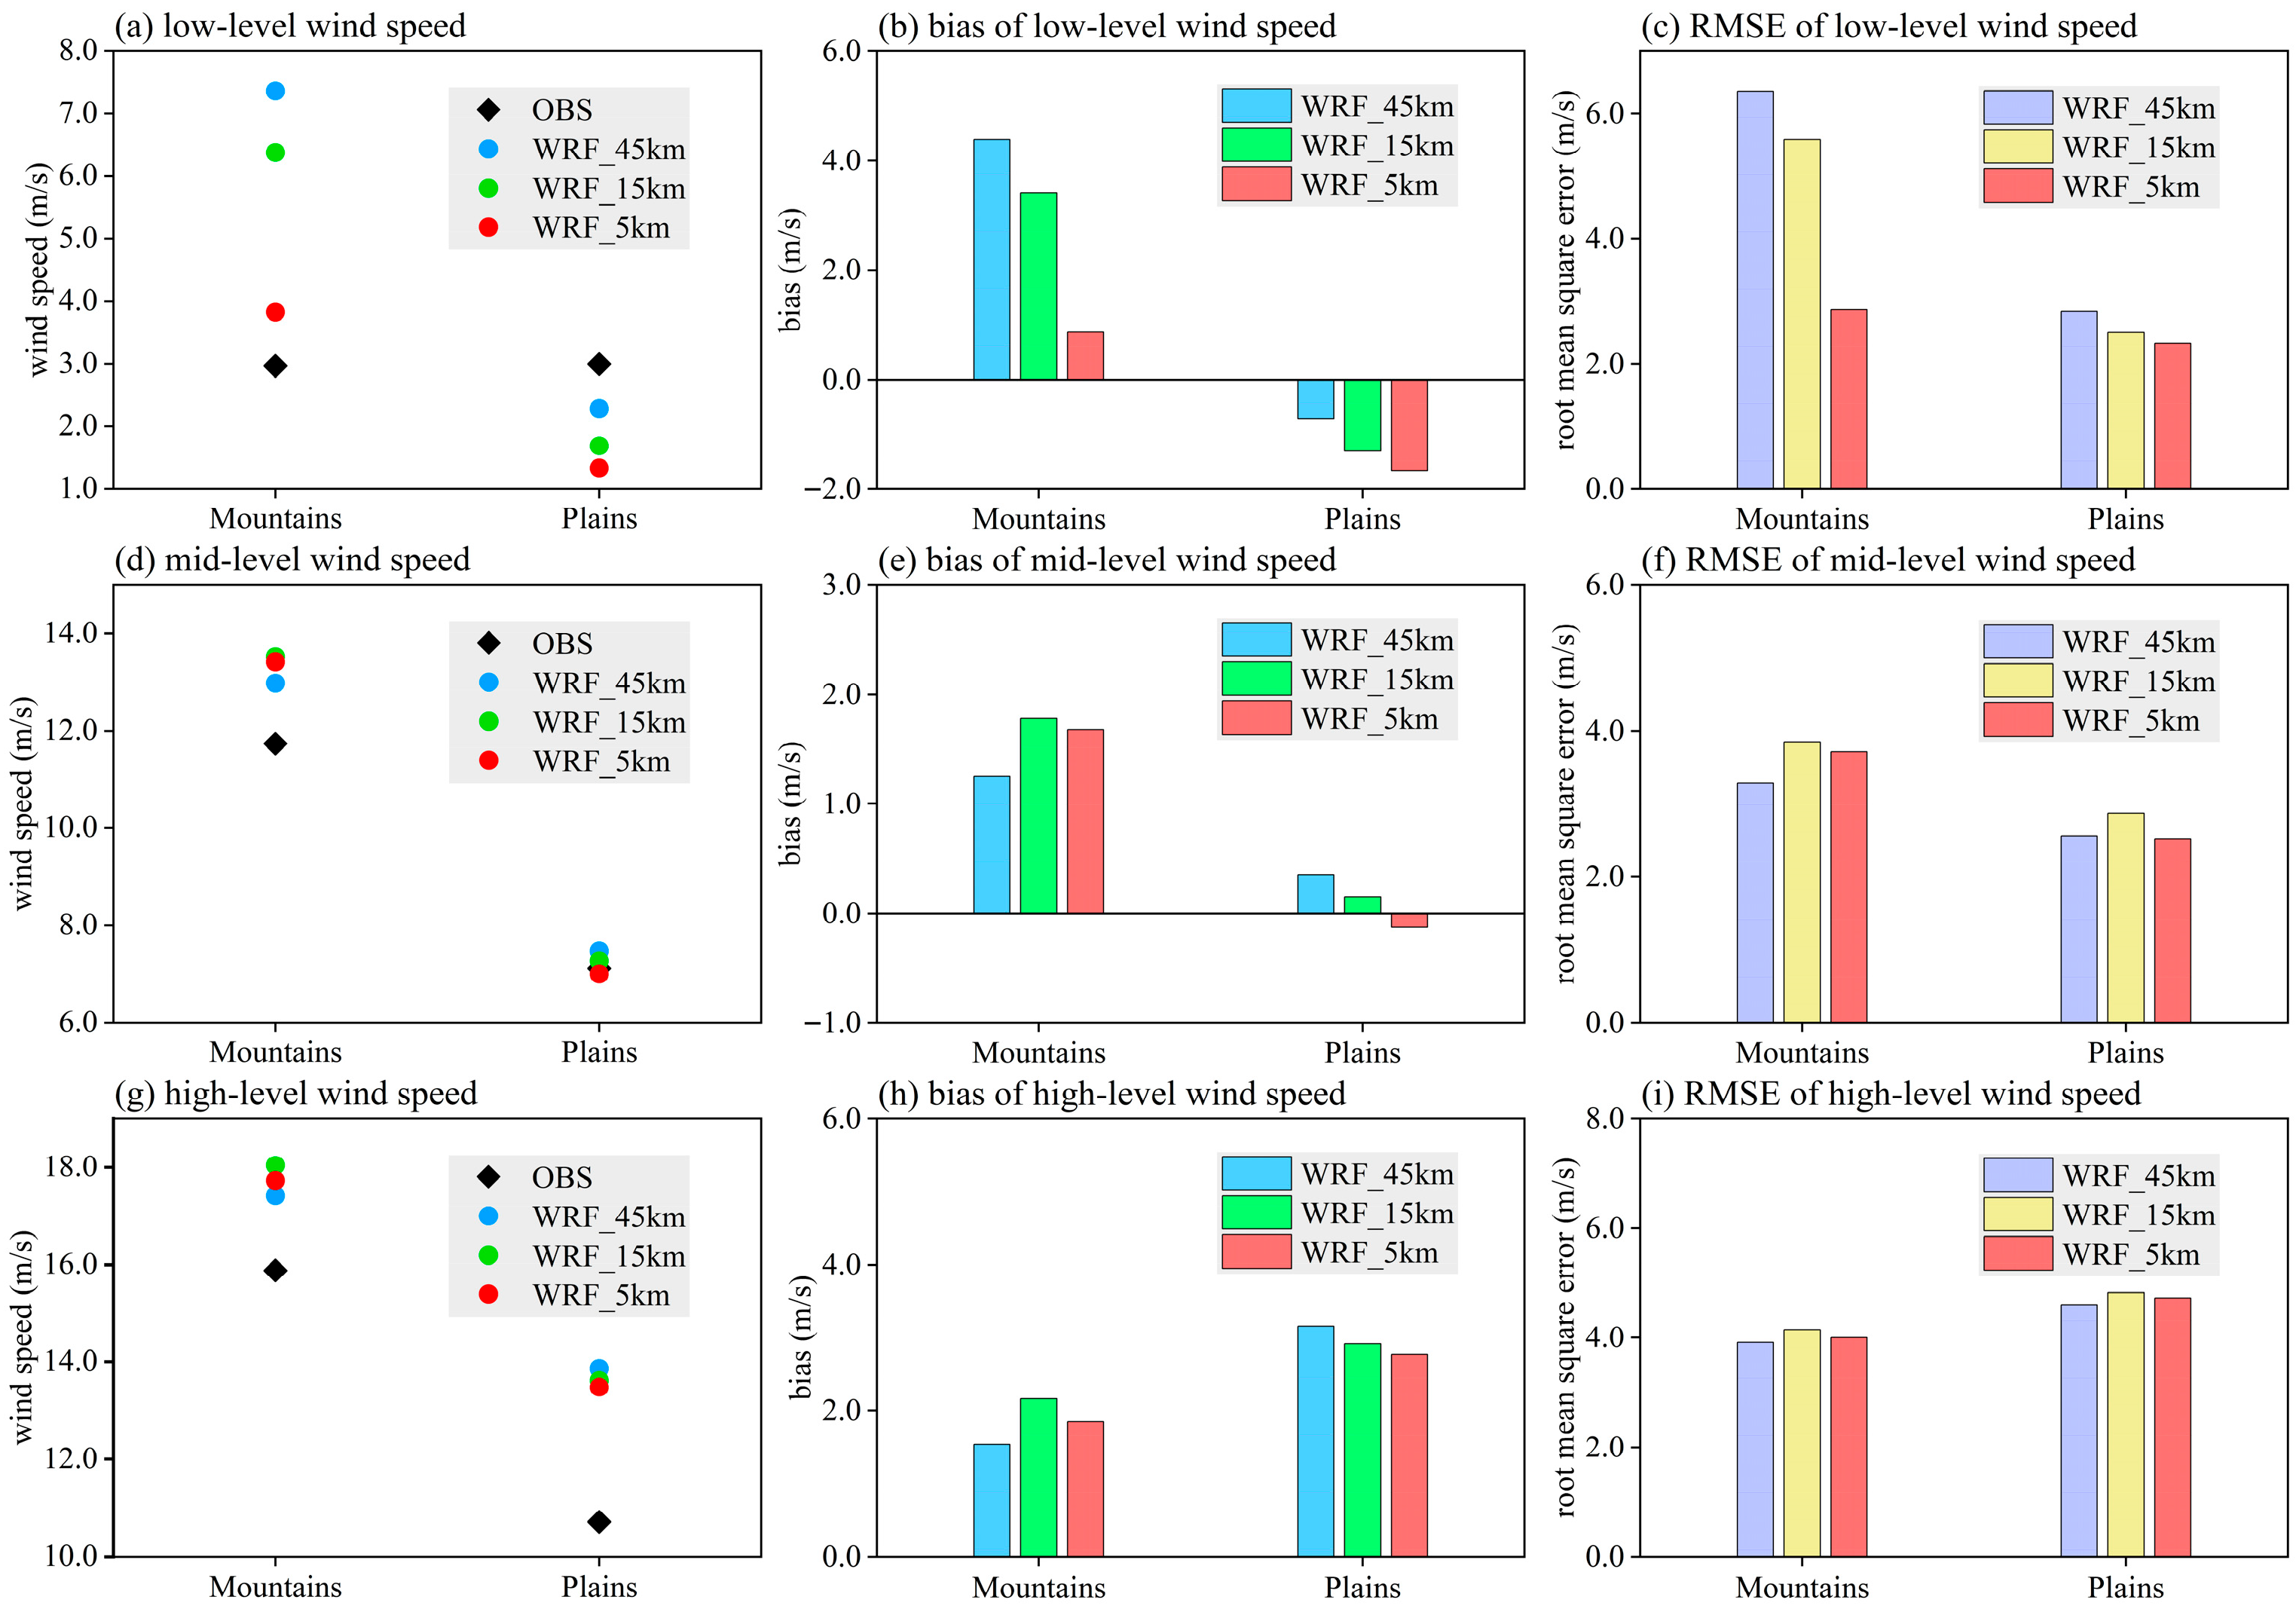
3.2.4. Winter
4. Discussion and Conclusions
Author Contributions
Funding
Institutional Review Board Statement
Informed Consent Statement
Data Availability Statement
Acknowledgments
Conflicts of Interest
References
- Osobajo, O.A.; Otitoju, A.; Otitoju, M.A.; Oke, A. The Impact of Energy Consumption and Economic Growth on Carbon Dioxide Emissions. Sustainability 2020, 12, 7965. [Google Scholar] [CrossRef]
- Balint, T.; Lamperti, F.; Mandel, A.; Napoletano, M.; Roventini, A.; Sapio, A. Complexity and the Economics of Climate Change: A Survey and a Look Forward. Ecol. Econ. 2017, 138, 252–265. [Google Scholar] [CrossRef]
- Yu, E.T. High-resolution seasonal snowfall simulation over Northeast China. Chin. Sci. Bull. 2013, 58, 1412–1419. [Google Scholar] [CrossRef]
- Wang, X.P.; Mauzerall, D.L. Evaluating impacts of air pollution in China on public health: Implications for future air pollution and energy policies. Atmos. Environ. 2006, 40, 1706–1721. [Google Scholar] [CrossRef]
- Cai, W.J.; Li, K.; Liao, H.; Wang, H.J.; Wu, L.X. Weather conditions conducive to Beijing severe haze more frequent under climate change. Nat. Clim. Change 2017, 7, 257–262. [Google Scholar] [CrossRef]
- Khan, K.S.; Tariq, M. Wind resource assessment using SODAR and meteorological mast—A case study of Pakistan. Renew. Sustain. Energy Rev. 2018, 81, 2443–2449. [Google Scholar] [CrossRef]
- Carvalho, D.; Rocha, A.; Gómez-Gesteira, M.; Santos, C.S. WRF wind simulation and wind energy production estimates forced by different reanalyses: Comparison with observed data for Portugal. Appl. Energy 2014, 117, 116–126. [Google Scholar] [CrossRef]
- Zhou, X.; Yang, K.; Beljaars, A.; Li, H.D.; Lin, C.G.; Huang, B.; Wang, Y. Dynamical impact of parameterized turbulent orographic form drag on the simulation of winter precipitation over the western Tibetan Plateau. Clim. Dyn. 2019, 53, 707–720. [Google Scholar] [CrossRef]
- Wang, Q.; Luo, K.; Yuan, R.Y.; Zhang, S.X.; Fan, J.R. Wake and performance interference between adjacent wind farms: Case study of Xinjiang in China by means of mesoscale simulations. Energy 2019, 166, 1168–1180. [Google Scholar] [CrossRef]
- Olsen, B.T.; Hahmann, A.N.; Sempreviva, A.M.; Badger, J.; Jørgensen, H.E. An intercomparison of mesoscale models at simple sites for wind energy applications. Wind Energy Sci. 2017, 2, 211–228. [Google Scholar] [CrossRef]
- Nor, K.M.; Shaaban, M.; Rahman, H.A. Feasibility assessment of wind energy resources in Malaysia based on NWP models. Renew. Energy 2014, 62, 147–154. [Google Scholar] [CrossRef]
- Li, H.D.; Claremar, B.; Wu, L.C.; Hallgren, C.; Körnich, H.; Ivanell, S.; Sahlée, E. A sensitivity study of the WRF model in offshore wind modeling over the Baltic Sea. Geosci. Front. 2021, 12, 101229. [Google Scholar] [CrossRef]
- Kong, X.H.; Wang, A.H.; Bi, X.Q.; Sun, B.Y.; Wei, J.F. The Hourly Precipitation Frequencies in the Tropical-Belt Version of WRF: Sensitivity to Cumulus Parameterization and Radiation Schemes. J. Clim. 2022, 35, 285–304. [Google Scholar] [CrossRef]
- Hernández Galvez, G.; Saldaña Flores, R.; Miranda Miranda, U.; Sarracino Martínez, O.; Castillo Téllez, M.; Almenares López, D.; Gómez, A.K.T. Wind resource assessment and sensitivity analysis of the levelised cost of energy. A case study in Tabasco, Mexico. Renew. Energy Focus 2019, 29, 94–106. [Google Scholar] [CrossRef]
- Giannaros, T.M.; Melas, D.; Ziomas, I. Performance evaluation of the Weather Research and Forecasting (WRF) model for assessing wind resource in Greece. Renew. Energy 2017, 102, 190–198. [Google Scholar] [CrossRef]
- Charabi, Y.; Al Hinai, A.; Al-Yahyai, S.; Al Awadhi, T.; Choudri, B.S. Offshore wind potential and wind atlas over the Oman Maritime Zone. Energy Ecol. Environ. 2019, 4, 1–14. [Google Scholar] [CrossRef]
- Yu, E.; Bai, R.; Chen, X.; Shao, L. Impact of physical parameterizations on wind simulation with WRF V3.9.1.1 under stable conditions at planetary boundary layer gray-zone resolution: A case study over the coastal regions of North China. Geosci. Model Dev. 2022, 15, 8111–8134. [Google Scholar] [CrossRef]
- Yang, B.; Qian, Y.; Berg, L.K.; Ma, P.-L.; Wharton, S.; Bulaevskaya, V.; Yan, H.; Hou, Z.; Shaw, W.J. Sensitivity of Turbine-Height Wind Speeds to Parameters in Planetary Boundary-Layer and Surface-Layer Schemes in the Weather Research and Forecasting Model. Bound.-Lay. Meteorol. 2017, 162, 117–142. [Google Scholar] [CrossRef]
- Taraphdar, S.; Pauluis, O.M.; Xue, L.L.; Liu, C.H.; Rasmussen, R.; Ajayamohan, R.S.; Tessendorf, S.; Jing, X.Q.; Chen, S.S.; Grabowski, W.W. WRF Gray-Zone Simulations of Precipitation Over the Middle-East and the UAE: Impacts of Physical Parameterizations and Resolution. J. Geophys. Res.-Atmos. 2021, 126, e2021JD034648. [Google Scholar] [CrossRef]
- Gholami, S.; Ghader, S.; Khaleghi-Zavareh, H.; Ghafarian, P. Sensitivity of WRF-simulated 10 m wind over the Persian Gulf to different boundary conditions and PBL parameterization schemes. Atmos. Res. 2021, 247, 105147. [Google Scholar] [CrossRef]
- Fernández-González, S.; Martín, M.L.; García-Ortega, E.; Merino, A.; Lorenzana, J.; Sánchez, J.L.; Valero, F.; Rodrigo, J.S. Sensitivity Analysis of the WRF Model: Wind-Resource Assessment for Complex Terrain. J. Appl. Meteorol. Climatol. 2018, 57, 733–753. [Google Scholar] [CrossRef]
- Cheng, W.Y.Y.; Liu, Y.B.; Liu, Y.W.; Zhang, Y.X.; Mahoney, W.R.; Warner, T.T. The impact of model physics on numerical wind forecasts. Renew. Energy 2013, 55, 347–356. [Google Scholar] [CrossRef]
- Solbakken, K.; Birkelund, Y.; Samuelsen, E.M. Evaluation of surface wind using WRF in complex terrain: Atmospheric input data and grid spacing. Environ. Model. Softw. 2021, 145, 105182. [Google Scholar] [CrossRef]
- Yuan, R.Y.; Ji, W.J.; Luo, K.; Wang, J.W.; Zhang, S.X.; Wang, Q.; Fan, J.R.; Ni, M.J.; Cen, K.F. Coupled wind farm parameterization with a mesoscale model for simulations of an onshore wind farm. Appl. Energy 2017, 206, 113–125. [Google Scholar] [CrossRef]
- Marjanovic, N.; Wharton, S.; Chow, F.K. Investigation of model parameters for high-resolution wind energy forecasting: Case studies over simple and complex terrain. J. Wind. Eng. Ind. Aerodyn. 2014, 134, 10–24. [Google Scholar] [CrossRef]
- Li, Y.; Tian, Z.; Chen, X.; Su, X.; Yu, E. Investigation on the Sensitivity of Precipitation Simulation to Model Parameterization and Analysis Nudging over Hebei Province, China. Atmosphere 2024, 15, 512. [Google Scholar] [CrossRef]
- Ma, H.; Ding, Z.; Wang, Z.; Huang, H.; Guo, Z. Numerical simulation of formation of a strong convective rainfall of south central Hebei province. Sci. Meteorol. Sin. 2011, 31, 332–338. [Google Scholar]
- Wang, E.L.; Yu, Q.; Wu, D.R.; Xia, J. Climate, agricultural production and hydrological balance in the North China Plain. Int. J. Climatol. 2008, 28, 1959–1970. [Google Scholar] [CrossRef]
- Jeong, S.J.; Ho, C.H.; Piao, S.L.; Kim, J.; Ciais, P.; Lee, Y.B.; Jhun, J.G.; Park, S.K. Effects of double cropping on summer climate of the North China Plain and neighbouring regions. Nat. Clim. Change 2014, 4, 615–619. [Google Scholar] [CrossRef]
- Zhang, C.; Wang, Y.; Hamilton, K. Improved Representation of Boundary Layer Clouds over the Southeast Pacific in ARW-WRF Using a Modified Tiedtke Cumulus Parameterization Scheme. Mon. Weather Rev. 2011, 139, 3489–3513. [Google Scholar] [CrossRef]
- Tiedtke, M. A Comprehensive Mass Flux Scheme for Cumulus Parameterization in Large-Scale Models. Mon. Weather Rev. 1989, 117, 1779–1800. [Google Scholar] [CrossRef]
- Thompson, G.; Field, P.R.; Rasmussen, R.M.; Hall, W.D. Explicit Forecasts of Winter Precipitation Using an Improved Bulk Microphysics Scheme. Part II: Implementation of a New Snow Parameterization. Mon. Weather Rev. 2008, 136, 5095–5115. [Google Scholar] [CrossRef]
- Iacono, M.J.; Delamere, J.S.; Mlawer, E.J.; Shephard, M.W.; Clough, S.A.; Collins, W.D. Radiative forcing by long-lived greenhouse gases: Calculations with the AER radiative transfer models. J. Geophys. Res.-Atmos. 2008, 113, D13103. [Google Scholar] [CrossRef]
- Mesinger, F. Forecasting Upper Tropospheric Turbulence Within the Framework of the Mellor-Yamada 2.5 Closure; WMO: Geneva, Switzerland, 1993. [Google Scholar]
- Monin, A.S.; Obukhov, A.M. Basic laws of turbulent mixing in the surface layer of the atmosphere. Tr. Akad. Nauk SSSR Geophiz. Inst. 1954, 24, 163–187. [Google Scholar]
- Janjić, Z.I. The Step-Mountain Eta Coordinate Model: Further Developments of the Convection, Viscous Sublayer, and Turbulence Closure Schemes. Mon. Weather Rev. 1994, 122, 927–945. [Google Scholar] [CrossRef]
- Janić, Z.I. Nonsingular Implementation of the Mellor-Yamada Level 2.5 Scheme in the NCEP Meso Model; NCEP Technical Note 437; NOAA: Camp Springs, MD, USA, 2002; 61p. [Google Scholar]
- Soci, C.; Hersbach, H.; Simmons, A.; Poli, P.; Bell, B.; Berrisford, P.; Horányi, A.; Muñoz-Sabater, J.; Nicolas, J.; Radu, R.; et al. The ERA5 global reanalysis from 1940 to 2022. Q. J. R. Meteorol. Soc. 2024, 150, 4014–4048. [Google Scholar] [CrossRef]
- Hersbach, H.; Bell, B.; Berrisford, P.; Hirahara, S.; Horanyi, A.; Munoz-Sabater, J.; Nicolas, J.; Peubey, C.; Radu, R.; Schepers, D.; et al. The ERA5 global reanalysis. Q. J. R. Meteorol. Soc. 2020, 146, 1999–2049. [Google Scholar] [CrossRef]
- Ou, T.; Chen, D.; Chen, X.; Lin, C.; Yang, K.; Lai, H.-W.; Zhang, F. Simulation of summer precipitation diurnal cycles over the Tibetan Plateau at the gray-zone grid spacing for cumulus parameterization. Clim. Dyn. 2020, 54, 3525–3539. [Google Scholar] [CrossRef]
- Ding, Y.H.; Chan, J.C.L. The East Asian summer monsoon: An overview. Meteorol. Atmos. Phys. 2005, 89, 117–142. [Google Scholar] [CrossRef]
- Ding, Y.H. The variability of the Asian summer monsoon. J. Meteorol. Soc. Jpn. 2007, 85B, 21–54. [Google Scholar] [CrossRef]
- Carvalho, D.; Rocha, A.; Gómez-Gesteira, M.; Santos, C. A sensitivity study of the WRF model in wind simulation for an area of high wind energy. Environ. Model. Softw. 2012, 33, 23–34. [Google Scholar] [CrossRef]
- Holtslag, A.A.M.; Svensson, G.; Baas, P.; Basu, S.; Beare, B.; Beljaars, A.C.M.; Bosveld, F.C.; Cuxart, J.; Lindvall, J.; Steeneveld, G.J.; et al. Stable Atmospheric Boundary Layers and Diurnal Cycles: Challenges for Weather and Climate Models. Bull. Am. Meteorol. Soc. 2013, 94, 1691–1706. [Google Scholar] [CrossRef]
- Santos-Alamillos, F.J.; Pozo-Vázquez, D.; Ruiz-Arias, J.A.; Lara-Fanego, V.; Tovar-Pescador, J. Analysis of WRF Model Wind Estimate Sensitivity to Physics Parameterization Choice and Terrain Representation in Andalusia (Southern Spain). J. Appl. Meteorol. Climatol. 2013, 52, 1592–1609. [Google Scholar] [CrossRef]
- Jiménez, P.A.; González-Rouco, J.F.; Montávez, J.P.; García-Bustamante, E.; Navarro, J. Climatology of wind patterns in the northeast of the Iberian Peninsula. Int. J. Climatol. 2009, 29, 501–525. [Google Scholar] [CrossRef]
- Rajeevan, M.; Kesarkar, A.; Thampi, S.B.; Rao, T.N.; Radhakrishna, B.; Rajasekhar, M. Sensitivity of WRF cloud microphysics to simulations of a severe thunderstorm event over Southeast India. Ann. Geophys. 2010, 28, 603–619. [Google Scholar] [CrossRef]
- Pan, L.L.; Liu, Y.B.; Roux, G.; Cheng, W.; Liu, Y.W.; Hu, J.; Jin, S.L.; Feng, S.L.; Du, J.; Peng, L.X. Seasonal variation of the surface wind forecast performance of the high-resolution WRF-RTFDDA system over China. Atmos. Res. 2021, 259, 105673. [Google Scholar] [CrossRef]
- Li, J.N.; Ding, C.H.; Li, F.Z.; Chen, Y.L. Effects of single- and double-moment microphysics schemes on the intensity of super typhoon Sarika(2016). Atmos. Res. 2020, 238, 104894. [Google Scholar] [CrossRef]
- Dzebre, D.E.K.; Adaramola, M.S. A preliminary sensitivity study of Planetary Boundary Layer parameterisation schemes in the weather research and forecasting model to surface winds in coastal Ghana. Renew. Energy 2020, 146, 66–86. [Google Scholar] [CrossRef]
- Carvalho, D.; Rocha, A.; Gómez-Gesteira, M.; Silva Santos, C. Sensitivity of the WRF model wind simulation and wind energy production estimates to planetary boundary layer parameterizations for onshore and offshore areas in the Iberian Peninsula. Appl. Energy 2014, 135, 234–246. [Google Scholar] [CrossRef]
- Carvalho, D.; Rocha, A.; Gómez-Gesteira, M.; Santos, C.S. Offshore wind energy resource simulation forced by different reanalyses: Comparison with observed data in the Iberian Peninsula. Appl. Energy 2014, 134, 57–64. [Google Scholar] [CrossRef]


| WRF Physics | Parameterization Scheme |
|---|---|
| Cumulus scheme | Tiedtke [30,31] |
| Microphysics scheme | Thompson [32] |
| Radiation scheme | RRTMG [33] |
| Planetary boundary layer scheme | Mellor–Yamada–Janjic (MYJ) [34] |
| Surface layer scheme | Eta Similarity [35,36,37] |
| Land surface model scheme | Noah |
| Station | Actual Heights (m) | Model Heights (m) | |||
|---|---|---|---|---|---|
| 45 km | 15 km | 5 km | |||
| Mountains | Zhangbei | 1393.3 | 1333.8 | 1437.3 | 1405.0 |
| Chongli | 1239.8 | 1286.0 | 1544.4 | 1410.0 | |
| Weichang | 894.0 | 1187.4 | 1122.9 | 1024.6 | |
| Fengning | 670.0 | 1049.2 | 908.6 | 779.5 | |
| Plains | Luquan | 103.6 | 260.2 | 158.8 | 124.9 |
| Cheng’an | 59.7 | 73.8 | 56.7 | 58.8 | |
| Lulong | 55.0 | 119.1 | 70.2 | 60.9 | |
| Jizhou | 24.8 | 23.3 | 24.5 | 24.1 | |
| Tangshan | 23.2 | 20.5 | 16.2 | 25.2 | |
| Baoding | 16.8 | 36.7 | 18.8 | 17.9 | |
| Huanghua | 4.5 | 4.5 | 4.4 | 4.0 | |
| Beijing | 31.5 | 83.2 | 33.3 | 35.9 | |
| Xiqing | 3.5 | 5.3 | 5.0 | 3.8 | |
| Station | WRF_45 km | WRF_15 km | WRF_5 km | ||||
|---|---|---|---|---|---|---|---|
| Bias | RMSE | Bias | RMSE | Bias | RMSE | ||
| Mountains | low-level | 0.88 | 4.51 | 0.18 | 4.34 | −0.79 | 3.63 |
| mid-level | −0.57 | 3.09 | −0.64 | 3.32 | −0.84 | 3.13 | |
| high-level | −0.04 | 4.18 | 0.03 | 4.34 | −0.05 | 4.20 | |
| Plains | low-level | −2.81 | 3.26 | −2.67 | 3.33 | −2.42 | 3.32 |
| mid-level | −4.24 | 3.37 | −4.23 | 3.43 | −4.12 | 3.58 | |
| high-level | −0.91 | 2.90 | −0.92 | 2.92 | −1.00 | 2.98 | |
| Station | WRF_45 km | WRF_15 km | WRF_5 km | ||||
|---|---|---|---|---|---|---|---|
| Bias | RMSE | Bias | RMSE | Bias | RMSE | ||
| Mountains | low-level | −2.02 | 2.22 | −2.01 | 2.25 | −2.07 | 1.58 |
| mid-level | −3.85 | 2.68 | −3.69 | 2.68 | −3.49 | 2.68 | |
| high-level | −2.22 | 2.41 | −1.85 | 2.63 | −1.68 | 2.51 | |
| Plains | low-level | −3.62 | 2.49 | −3.19 | 2.68 | −3.07 | 2.71 |
| mid-level | −4.85 | 2.80 | −4.85 | 2.80 | −4.89 | 2.90 | |
| high-level | −4.07 | 2.84 | −3.98 | 2.96 | −3.90 | 2.81 | |
| Station | WRF_45 km | WRF_15 km | WRF_5 km | ||||
|---|---|---|---|---|---|---|---|
| Bias | RMSE | Bias | RMSE | Bias | RMSE | ||
| Mountains | low-level | 0.14 | 4.37 | −0.37 | 4.16 | −1.43 | 2.75 |
| mid-level | −1.41 | 2.68 | −1.21 | 2.90 | −1.20 | 2.92 | |
| high-level | 0.71 | 4.12 | 0.97 | 4.28 | 0.82 | 4.20 | |
| Plains | low-level | −4.16 | 2.75 | −4.05 | 2.88 | −3.77 | 2.92 |
| mid-level | −3.78 | 3.00 | −3.81 | 3.05 | −3.82 | 3.21 | |
| high-level | −0.65 | 2.84 | −0.68 | 2.92 | −0.77 | 2.91 | |
| Station | WRF_45 km | WRF_15 km | WRF_5 km | ||||
|---|---|---|---|---|---|---|---|
| Bias | RMSE | Bias | RMSE | Bias | RMSE | ||
| Mountains | low-level | 4.39 | 6.36 | 3.41 | 5.59 | 0.86 | 2.87 |
| mid-level | 1.25 | 3.29 | 1.78 | 3.85 | 1.68 | 3.71 | |
| high-level | 1.54 | 3.91 | 2.16 | 4.15 | 1.85 | 4.00 | |
| Plains | low-level | −0.72 | 2.84 | −1.31 | 2.50 | −1.67 | 2.32 |
| mid-level | 0.35 | 2.56 | 0.15 | 2.87 | −0.13 | 2.52 | |
| high-level | 3.16 | 4.60 | 2.91 | 4.82 | 2.77 | 4.72 | |
Disclaimer/Publisher’s Note: The statements, opinions and data contained in all publications are solely those of the individual author(s) and contributor(s) and not of MDPI and/or the editor(s). MDPI and/or the editor(s) disclaim responsibility for any injury to people or property resulting from any ideas, methods, instructions or products referred to in the content. |
© 2025 by the authors. Licensee MDPI, Basel, Switzerland. This article is an open access article distributed under the terms and conditions of the Creative Commons Attribution (CC BY) license (https://creativecommons.org/licenses/by/4.0/).
Share and Cite
Zhao, N.; Su, X.; Meng, X.; Yang, Y.; Jiao, Y.; Zhang, Z.; Nie, W. Sensitivity Study of WRF Model at Different Horizontal Resolutions for the Simulation of Low-Level, Mid-Level and High-Level Wind Speeds in Hebei Province. Atmosphere 2025, 16, 891. https://doi.org/10.3390/atmos16070891
Zhao N, Su X, Meng X, Yang Y, Jiao Y, Zhang Z, Nie W. Sensitivity Study of WRF Model at Different Horizontal Resolutions for the Simulation of Low-Level, Mid-Level and High-Level Wind Speeds in Hebei Province. Atmosphere. 2025; 16(7):891. https://doi.org/10.3390/atmos16070891
Chicago/Turabian StyleZhao, Na, Xiashu Su, Xianluo Meng, Yuling Yang, Yayin Jiao, Zhi Zhang, and Wenzhi Nie. 2025. "Sensitivity Study of WRF Model at Different Horizontal Resolutions for the Simulation of Low-Level, Mid-Level and High-Level Wind Speeds in Hebei Province" Atmosphere 16, no. 7: 891. https://doi.org/10.3390/atmos16070891
APA StyleZhao, N., Su, X., Meng, X., Yang, Y., Jiao, Y., Zhang, Z., & Nie, W. (2025). Sensitivity Study of WRF Model at Different Horizontal Resolutions for the Simulation of Low-Level, Mid-Level and High-Level Wind Speeds in Hebei Province. Atmosphere, 16(7), 891. https://doi.org/10.3390/atmos16070891