Article

Stage-Dependent Microphysical Structures of Meiyu Heavy Rainfall in the Yangtze-Huaihe River Valley Revealed by GPM DPR

1
School of Atmospheric Physics, Nanjing University of Information Science and Technology, Nanjing 210044, China
2
Collaborative Innovation Center on Forecast and Evaluation of Meteorological Disasters, Key Laboratory for Aerosol-Cloud-Precipitation of China Meteorological Administration, Nanjing University of Information Science and Technology, Nanjing 210044, China
3
Shanghai Institute of Satellite Engineering, Shanghai 201109, China
*
Author to whom correspondence should be addressed.
Atmosphere 2025, 16(7), 886; https://doi.org/10.3390/atmos16070886
Submission received: 11 June 2025 / Revised: 11 July 2025 / Accepted: 16 July 2025 / Published: 19 July 2025
(This article belongs to the Section Meteorology)

Abstract

This study presents a comprehensive analysis of the microphysical structures of Meiyu heavy rainfall (near-surface rainfall intensity > 8 mm/h) across different life stages in the Yangtze-Huaihe River Valley (YHRV). We classified the heavy rainfall events into three life stages of developing, mature, and dissipating using ERA5 reanalysis and IMERG precipitation estimates, and examined vertical microphysical structures using Dual-frequency Precipitation Radar (DPR) data from the Global Precipitation Measurement (GPM) satellite during the Meiyu period from 2014 to 2023. The results showed that convective heavy rainfall during the mature stage exhibits peak radar reflectivity and surface rainfall rates, with the largest near-surface mass weighted diameter (Dm ≈ 1.8 mm) and the smallest droplet concentration (dBNw ≈ 38). Downdrafts in the dissipating stage preferentially remove large ice particles, whereas sustained moisture influx stabilizes droplet concentrations. Stratiform heavy rainfall, characterized by weak updrafts, displays narrower particle size distributions. During dissipation, particle breakups dominate, reducing Dm while increasing dBNw. The analysis of the relationship between microphysical parameters and rainfall rate revealed that convective heavy rainfall shows synchronized growth of Dm and dBNw during the developing stage, with Dm peaking at about 2.1 mm near 70 mm/h before stabilizing in the mature stage, followed by small-particle dominance in the dissipating stage. In contrast, stratiform rainfall exhibits a “small size, high concentration” regime, where the rainfall rate correlates primarily with increasing dBNw. Additionally, convective heavy rainfall demonstrates about 22% higher precipitation efficiency than stratiform systems, while stratiform rainfall shows a 25% efficiency surge during the dissipation stage compared to other stages.

1. Introduction

The Yangtze-Huaihe River Valley (YHRV) region (24–34° N, 113–122° E), a critical monsoon climate zone in eastern China, is characterized by unique geographical and climatic conditions that render it highly susceptible to heavy precipitation, particularly during the East Asian summer monsoon season. The region is most notably affected by the Meiyu front system, which dominates the summer precipitation patterns from June to July. The Meiyu season, characterized by persistent quasi-stationary fronts and abundant moisture transport from the south, accounts for 30–40% of the annual precipitation in this region and serves as the primary generator of extreme rainfall events [1,2,3].
Formed by the alluvial deposits of the YHRV, the region exhibits a topographically low-lying central area flanked by elevated peripheries, which enhances convective instability and precipitation efficiency during the Meiyu period. As one of China’s most densely populated and economically vital regions, frequent Meiyu-related heavy precipitation events in the YHRV often trigger severe floods, leading to substantial socio-economic losses [4,5,6]. In recent years, observational data have shown a marked increasing trend in both the intensity and duration of Meiyu rainfall [7,8,9], a trend that may further intensify under future climate scenarios due to enhanced moisture availability and more frequent stagnation of monsoon fronts [10]. However, the microphysical processes and life stage evolution characteristics of heavy precipitation in this region remain poorly understood. A systematic investigation of the microphysical structure of heavy precipitation across its life stages and its relationship with rainfall intensity is thus essential for advancing numerical model parameterizations.
The life cycle of a cloud and precipitation system encompasses its complete evolution from formation to dissipation [11,12] and is typically divided into three distinct stages: developing, mature, and dissipating [13,14,15]. Previous studies have employed this framework to analyze the precipitation characteristics. For example, Yokoyama and Takayabu (2008) classified typhoon life cycles based on variations in near-center wind speeds [16], while D’Adderio et al. (2022) utilized GPM data to elucidate the precipitation structure and microphysical mechanisms of Mediterranean Hurricane Ianos across its developmental stages [17]. Similarly, Witte et al. (2014) examined microphysical parameter dynamics in cumulus clouds via large-eddy simulations [12], and Booth et al. (2018) combined IMERG precipitation data with ERA-Interim reanalysis to link extratropical cyclone life stages with precipitation characteristics [13]. Additionally, Sun et al. (2019) analyzed vertical structures of different stages of Meiyu cases using GPM-DPR and Fengyun satellites, revealing phase specific vertical structures that advance understanding of monsoon frontal precipitation [18].
Research has demonstrated that the spatiotemporal evolution of precipitation processes is closely associated with cloud life stages, exhibiting distinct precipitation microphysical structures across different stages [15,16,17,18]. In this study, we systematically investigate the vertical microphysical structure of heavy rainfall in the YHRV region during the Meiyu period throughout its lifecycle using multi-source satellite data from 2014 to 2023. Utilizing Global Precipitation Measurement Dual-Frequency Precipitation Radar (GPM DPR) data, we obtain high-resolution precipitation profiles and accurate drop size distribution (DSD) measurements, with a particular focus on heavy rainfall with a near-surface rainfall rate exceeding 8 mm/h during the Meiyu period (June and July). By combining ERA5 reanalysis data and IMERG precipitation products, we classified heavy rainfall into developing, mature, and dissipating stages to examine the vertical microphysical differences between convective and stratiform heavy rainfall, their relationships with rainfall intensity, and variations in precipitation efficiency across different stages. This methodology could effectively capture the dynamic changes in the vertical microphysical structure during the precipitation system’s evolution, providing valuable insights into precipitation formation mechanisms and key parameters for model optimization.
This study aimed to systematically investigate the vertical microphysical structure and lifecycle evolution of heavy precipitation events in the YHRV during the Meiyu season, leveraging multi-source satellite observations and reanalysis data from 2014 to 2023. By integrating high-resolution GPM DPR precipitation profiles, ERA5 reanalysis, and IMERG products, this research seeks to (1) characterize the distinct microphysical features of convective and stratiform heavy rainfall across developing, mature, and dissipating stages; (2) elucidate the relationship between precipitation intensity and microphysical processes at each lifecycle stage; and (3) quantify variations in precipitation efficiency during system evolution. The findings are expected to advance the understanding of Meiyu heavy rainfall mechanisms and improve the representation of microphysical processes in numerical models.

2. Data and Methods

2.1. Dataset

Due to the non-continuous nature of precipitation observations from GPM DPR, the life stage of heavy rainfall cannot be directly and accurately distinguished using GPM DPR data alone. Therefore, to investigate the vertical microphysical structure characteristics of heavy rainfall at different life stages, it is necessary to incorporate spatiotemporally continuous data to assist in determining the life stages of heavy rainfall. In this study, ERA5 and IMERG data were combined to classify the stages of GPM DPR-observed heavy rainfall.

2.1.1. GPM DPR

The GPM launched in 2014 aims to provide high-precision, high-resolution precipitation observations on a global scale. As the core instrument of the GPM mission, the DPR operates in a dual-frequency collaborative mode, utilizing Ku-band (13.6 GHz) and Ka-band (35.5 GHz). This dual-frequency mechanism not only retrieves the DSD but also significantly improves the accuracy of rainfall rate inversion [19,20,21,22].
The DPR system underwent a major technical upgrade. Before May 2018, the Ka-band Precipitation Radar (KaPR) only matched the central 25 scan pixels of the Ku-band Precipitation Radar (KuPR) [20,21,22,23]. After the May 2018 upgrade, all 49 scan pixels of the KaPR were fully aligned with the KuPR [23,24,25]. This enhancement improved the consistency of the two bands’ scanning ranges to 245 km, significantly expanding dual-frequency retrieval coverage and data reliability. The latest version (V07) of the dataset offers two modes, Full Scan (FS) and High Sensitivity Scan (HS). FS mode covers 49 horizontal scan pixels (5 km resolution) and 176 vertical pixels (125 m interval), simultaneously acquiring Ku- and Ka-band observations [24,25]. The HS mode provides high-sensitivity Ka-band measurements [26]. In our study, we have utilized variables extracted from the FS structure.
This study utilized GPM DPR Level-2A (2ADPR) V07 data to investigate the vertical microphysical structure of heavy rainfall across different stages during summer (June–July) from 2014 to 2023. The analysis focused on FS-based dual-frequency retrieval products, with key variables including attenuation-corrected equivalent radar reflectivity factor (Ze), drop size distribution (DSD), near-surface rainfall rate, freezing level height, liquid water path (LWP), ice water path (IWP), precipitation type, and temperature.

2.1.2. ERA5

ERA5 is the fifth-generation global atmospheric reanalysis dataset developed by the European Centre for Medium-Range Weather Forecasts (ECMWF) and represents a benchmark achievement in the current development of international reanalysis technology [27,28]. As the successor to ERA-Interim, ERA5 has achieved significant improvements in spatiotemporal resolution, data quality, and coverage. Its horizontal resolution reaches 0.25° × 0.25°, with an hourly temporal resolution. The dataset employs an advanced four-dimensional variational assimilation system (4D-Var), which deeply integrates multi-source observation data (including satellite remote sensing, ground observations, radiosonde data, etc.) with numerical models through efficient optimization algorithms, constructing a continuous, consistent, and high-quality three-dimensional reconstruction of atmospheric states from 1979 to the present [28].
This study utilized ERA5 sea-level pressure data from summer (June to July) during 2014–2023 in the YHRV region. By analyzing pressure changes during heavy precipitation events and the hour before and after, we aimed to determine the life stages of Meiyu heavy rainfall.

2.1.3. IMERG

IMERG data is a multi-satellite precipitation retrieval algorithm developed by the GPM team, designed to provide unified precipitation estimates [29,30,31,32,33]. This product integrates multi-source satellite observations (including the GPM core satellite, polar-orbiting satellites, and geostationary satellites), ground-based precipitation measurements, and numerical model outputs to generate precipitation fields with a spatial coverage from 60° S to 60° N, a spatial resolution of 0.1° × 0.1°, and a temporal resolution of half an hour. IMERG offers three product types: near-real-time (Early), delayed (Late), and post-processed (Final). IMERG Final Precipitation Data is the most accurate among the three IMERG products, as it incorporates ground-based rain gauge observations from the Global Precipitation Climatology Centre for bias correction. This calibration significantly enhances the reliability of the precipitation estimates compared to the near-real-time versions (Early and Late), which rely solely on satellite data [34,35,36].
This study utilized the latest Version 07B Final IMERG data from June to July between 2014 and 2023. After determining the life stages of Meiyu heavy precipitation in the YHRV region based on ERA5 pressure data analysis of pressure changes, this study further assisted in identifying the life stages by analyzing IMERG rainfall changes during the observed heavy rainfall events (as measured by DPR) and the half-hour periods before and after.

2.2. Selection of Heavy Rainfall Profiles

This study selected data from the GPM DPR data in the YHRV (27–34° N, 113–122° E, the black boxed area in Figure 1) with a surface rainfall rate exceeding 8 mm/h during June to July from 2014 to 2023 as heavy rainfall. The observational data from GPM DPR have been systematically validated using various ground-based measurement techniques, including rain gauges, ground-based radars, and disdrometers [37,38,39,40,41,42]. Kou et al. (2023) conducted a study comparing the liquid microphysical profiles and precipitation rate data from GPM DPR with those from ground-based dual-polarization radars [23]. The results showed good consistency between the two in terms of spatial distribution and intensity. Research by Gao et al. (2021) demonstrated that in the YHRV region, the discrepancy between DPR precipitation estimates and rain gauge data is typically less than 5%, confirming the high accuracy of DPR in precipitation monitoring over this area [43]. These validation results indicate that GPM DPR exhibits high precision and reliability in precipitation observation.
Based on the DPR precipitation classification algorithm, we extracted all convective and stratiform heavy rainfall-related profile data from the Meiyu period between 2014 and 2023, while removing isolated samples and precipitation profiles classified as “other” types. By screening precipitation profiles with near-surface rain rates exceeding 8 mm/h and their corresponding microphysical profiles, a total of 26,045 GPM DPR heavy rainfall profile datasets were ultimately obtained.

2.3. Identifying the Stages of Heavy Rainfall Events

The life stage of heavy rainfall is closely related to gradient in atmospheric pressure, as the evolution of the pressure field directly reflects the dynamic processes of the precipitation system [44,45]. During the developing stage of heavy rainfall, pressure gradually decreases, indicating enhanced upward motion and the initiation and intensification of precipitation. In the mature stage, pressure reaches its lowest value and remains at a low level. During the dissipation stage, pressure begins to rise, upward motion weakens, and precipitation intensity diminishes accordingly. Therefore, pressure variations serve as a key indicator for identifying the life stages of heavy rainfall [46,47,48,49]. The study by Bengtsson et al. (2006) also emphasizes that the gradient is a critical metric for determining the development stages of precipitation systems, with specific thresholds varying depending on the study region and data type [50].
In this study, we identified the life stages of heavy rainfall by analyzing pressure changes over the preceding and following one-hour periods, a method conceptually similar to that used in previous studies [46,47,48,49]. Specifically, in the developing stage, the pressure shows a continuous decline, where ΔP1 ≤ −1.5 hPa and ΔP2 ≤ −1.5 hPa; ΔP1 represents the difference between the pressure at the DPR data timestamp and that of the preceding hour, while ΔP2 denotes the difference between the subsequent hour’s pressure and the DPR timestamp pressure. This stage corresponds to the process of strengthening upward motion. During the mature stage, the pressure remains low and stable, where |ΔP1| < 3 hPa, |ΔP2| < 3 hPa, and ΔP1 and ΔP2 have opposite signs. This stage reflects the period of peak heavy precipitation activity. The dissipating stage is the stage of atmospheric pressure recovery, where ΔP1 ≥ 1.5 hPa and ΔP2 ≥ 1.5 hPa. This stage represents the declining process of heavy rainfall [51,52].
Due to the differences in spatiotemporal resolution between GPM DPR and ERA5 reanalysis data, it is necessary to match the two datasets during the identification of life stages. To ensure data consistency, this study interpolated the ERA5 pressure data onto the DPR pixels using the nearest neighbor matching method, thereby achieving spatial alignment between the two datasets. Since the focus of this research is on the microphysical structural characteristics of heavy rainfall, this data-matching approach maximizes the retention of high-resolution precipitation information from DPR observations while incorporating the pressure field data from ERA5.
To reduce uncertainty arising from mismatches between pressure and precipitation scales, we incorporated IMERG precipitation trends before and after the DPR profile to further constrain and validate the classification. After preliminarily identifying the life stage of heavy rainfall based on pressure variations, we further analyzed the half-hourly rainfall changes before and after the precipitation event using IMERG data to refine the determination of its life states. Specifically, for samples classified into the developing stages based on ERA5 pressure data, the IMERG rainfall rate must exhibit a progressively increasing trend in the half-hour before, during, and after the DPR measured precipitation events. During the mature stage, the IMERG rainfall rate must peak in the half-hour window when DPR detects the rainfall. In the dissipating stage, the rainfall rate should show a gradually decreasing trend over the corresponding time intervals. This study focused on characterizing the local precipitation life stage at the location of DPR observation since the localized identification of life stages based on pressure tendency combined with precipitation rate evolution remains a practical and effective approach.
The proportions of convective and stratiform precipitation for Meiyu heavy rainfall in the YHRV region at different stages are shown in Table 1. The statistical results revealed that during the developing stage of Meiyu heavy rainfall in this region, the proportion of convective precipitation is lower than that of stratiform precipitation, which is closely related to differences in the triggering mechanisms of the two precipitation types. Stratiform heavy rainfall primarily relies on large-scale upward motion and requires relatively low atmospheric instability energy for formation, allowing it to organize more rapidly during the developing stage. In contrast, convective heavy rainfall depends on sufficient accumulation of instability energy and localized triggering mechanisms, making its development conditions more stringent. For both convective and stratiform heavy rainfall, the average surface rainfall intensity peaks during the mature stage, reaching 26.30 mm/h and 16.28 mm/h, respectively. This indicates that the microphysical structure during the mature stage is most conducive to heavy rainfall formation. The lower proportion of stratiform precipitation during the dissipating stage is attributed to the fact that a considerable portion of stratiform systems weakens into non-heavy rainfall due to diminished upward motion and evaporation of hydrometeors. Consequently, the average near-surface rainfall rate for stratiform heavy rainfall during the dissipating stage is the lowest, at only 15.55 mm/h.
The occurrence of heavy rainfall in the YHRV region during Meiyu exhibits distinct temporal distribution characteristics (Figure 2). For convective heavy rainfall, its initiation occurs relatively infrequently between 20:00 and 03:00. The developing stage is primarily concentrated from 03:00 to 08:00 and 12:00 to 17:00, while the mature stage mainly occurs between 14:00 and 18:00. The dissipating stage predominantly takes place from 13:00 to 19:00. In contrast, the stratiform heavy rainfall shows a more continuous temporal occurrence. Its developing stage is mainly concentrated between 04:00 and 20:00, the mature stage peaks from 15:00 to 23:00, and the dissipating stage frequently occurs from 05:00 to 11:00 and 18:00 to 22:00. The proportion of convection, average rainfall rate, and occurrence time during different stages of Meiyu heavy rainfall in the YHRV region reveal the macroscopic characteristics of heavy rainfall at various stages.

3. Results

3.1. Vertical Structures of Radar Reflectivity Factor

Figure 3 presents the contoured frequency by altitude of the Ku-band equivalent radar reflectivity factor (Ze) during different stages (developing, mature, and dissipating). The results revealed that convective heavy rainfall consistently exhibits stronger radar echo intensity and greater vertical development height than stratiform heavy rainfall across all stages.
For convective heavy rainfall (Figure 3a–c), distinct stage-dependent characteristics are evident. During the developing stage, echo tops remain relatively low (<11 km), reflecting the initial growth phase of the convection. The mature stage shows peak intensity with echo tops reaching 12–15 km, indicating vigorous convective activity with strong updrafts throughout the troposphere. In the dissipating stage, both radar reflectivity factors (decreasing by about 3 dB) and echo top height decline, signaling convective weakening.
Stratiform heavy rainfall (Figure 3d–f) displays markedly different features, most notably a pronounced bright band near the 0 °C level (~5 km altitude), particularly during mature and dissipating stages. The bright band’s evolution suggests initial atmospheric instability during the developing stage that stabilizes in subsequent stages. This vertical structure contrasts sharply with convective precipitation, with stratiform precipitation showing lower echo tops (<10 km) and reduced vertical gradients, indicative of weaker, more homogeneous updrafts.

3.2. DSD Parameters Analysis

3.2.1. Vertical Structures of DSD Parameters

The drop size distribution (DSD) serves as a fundamental microphysical characteristic of rainfall, playing a critical role in characterizing both the vertical structure of precipitation and its microphysical variations. The DSD in GPM DPR is primarily characterized by two key parameters: the mass-weighted mean diameter (Dm, in mm) and the normalized intercept parameter (dBNw). Here, dBNw represents the logarithmic transformation (dBNw = 10log10(Nw)) of the particle number concentration. To illustrate the vertical microphysical structure of Meiyu heavy rainfall in the YHRV region during different stages, Figure 4 presents the vertical structures of the average values of Dm and dBNw for total, convective, and stratiform heavy rainfall. For total heavy rainfall, the Dm is largest during the mature stage, reaching approximately 1.7 mm near the surface, while the dBNw is smallest, only 39 near the surface. In contrast, the Dm is the smallest in the dissipating stage, less than 1.6 mm near the surface, and dBNw is the largest, about 42 near the surface. This differs significantly from the result observed for all rainfall, where the mature stage exhibits the largest dBNw [14]. Since all rainfall includes a substantial proportion of light rain events, where stratiform precipitation dominates, the rainfall intensity during both the developing and dissipating stages remains relatively low. Under these conditions, the particle number concentration is less affected by collision–coalescence processes and is more prone to collision–breakup, resulting in a comparatively higher dBNw in the mature stage.
For convective heavy rainfall, its microphysical parameters exhibit complex vertical structural features. The mature stage shows the largest Dm, with a near-surface average value reaching 1.9 mm, which is closely related to the particle coalescence driven by strong updrafts. During the dissipating stage, the Dm below the freezing level is similar to that in the developing stage. However, above the freezing level, the Dm in the developing stage is significantly smaller than that in the dissipating stage (Figure 4b). This phenomenon is caused by the combined effects of microphysical processes and dynamic conditions in convective heavy rainfall. In the developing stage, intense updrafts rapidly lift a large number of supercooled droplets above the freezing level, causing them to freeze quickly and generate numerous small ice crystals or graupel particles. However, due to the excessively strong updrafts, these particles are swiftly transported away from the growth region, reducing their residence time in the supercooled water zone. This limits the time available for riming and collision–coalescence, resulting in insufficient particle growth and a smaller Dm (only about 1.2 mm). However, during the dissipating stage, updrafts weaken or shift into downdrafts, prolonging the residence time of particles above the freezing level. This suggests that a longer duration may facilitate particle growth processes, resulting in larger Dm values. Notably, the dBNw in convective heavy rainfall shows less variation across different stages (Figure 4e). This relative stability could be related to the dynamic balance between particle generation and growth processes within convective systems.
The vertical microphysical structures of stratiform heavy rainfall exhibit typical features of stratiform precipitation. During the mature stage, the average Dm reaches its maximum (about 1.58 mm near the surface) while the average dBNw is minimal (about 40 near the surface). Conversely, the dissipating stage shows the smallest average Dm (about 1.4 mm near the surface) and the largest dBNw (about 43 near the surface). This evolution is closely related to the microphysical processes in a stratiform precipitation system. During the developing stage, water vapor continuously condenses on condensation nuclei, allowing small droplets to grow gradually, whereas at the mature stage, raindrop collision–coalescence processes maximize particle Dm while minimizing number concentration. In the dissipating stage, large raindrops break up under airflow effects, increasing small particle counts and resulting in decreased Dm but enhanced dBNw. Compared with convective heavy rainfall, stratiform heavy rainfall demonstrates more pronounced stage-dependent variations in both Dm and dBNw. This contrast highlights fundamental differences in microphysical processes between different precipitation types.
Figure 4a–c reveal that the differences in the Dm of heavy rainfall across different stages primarily originate above the freezing level. To better elucidate the microphysical structure of heavy rainfall above the freezing level, Figure 5 presents the two-dimensional probability density distributions of Dm and dBNw in this region. The dBNw values are predominantly concentrated within the 25–45 (Figure 5d–f), while the Dm values are distributed between 0.5–2 mm (Figure 5a–c). Notably, for convective heavy rainfall during the developing stage (Figure 5a), the peak of Dm distribution falls within 0.7–1.2 mm, indicating a predominance of small-to-medium sized particles during this stage. The dBNw is mainly concentrated between 31–42, indicating that the concentration of particles in the upper layer of the initial convective cell is relatively high, and the upward airflow begins to strengthen, accelerating the condensation of water vapor, but has not yet fully triggered collision and growth.
During the mature stage of convective heavy rainfall (Figure 5b), the Dm distribution shows a significant rightward shift, with the primary peak expanding to 1.5–1.8 mm, indicating an increased proportion of large-sized particles. Simultaneously, the dBNw distribution extends toward lower values, concentrating between 28–34. This demonstrates that strong updrafts prolong particle residence time, effectively promoting droplet coalescence and ice-phase particle growth, thereby increasing Dm. In the dissipating stage of convective heavy rainfall (Figure 5c), the peak of Dm retreats to 1.2–1.6 mm. Notably, from the developing to mature stage, convective heavy rainfall exhibits about a 50% increase in Dm and a 3–5 decrease in dBNw.
The microphysical parameters of stratiform heavy rainfall exhibit distinct evolutionary characteristics across different stages. During the developing stage (Figure 5d), the peak of Dm distribution is within 0.7–1.1 mm, and the dBNw is mainly between 27–41. The particle size distribution of stratiform rainfall is more concentrated than that of convective rainfall. These features indicate that weak updrafts result in cloud droplet growth primarily through slow condensation processes, leading to particle size distribution narrowing. At the mature stage (Figure 5e), the Dm distribution expands to 0.9–1.2 mm, and the dBNw reaches its overall minimum value. This suggests that while ice-phase particle coalescence contributes to precipitation, the weak updrafts significantly constrain coalescence efficiency. During the dissipating stage (Figure 5f), the distribution of Dm significantly shifted to the left, with the main peak returning to 0.8–1.0 mm. The dBNw distribution was mainly concentrated at 33–40, and the proportion of high concentration areas increased. The Dm of stratiform heavy rainfall only increases by about 30% during the mature stage, and the declining rate of microphysical parameters during the dissipating stage is faster than that of convective rainfall.

3.2.2. Vertical Microphysical Variations

As shown in Figure 4, the vertical structure of Dm exhibits two distinct inflection points, dividing the profile into three characteristic altitudes: 8 km, 5 km, and 2 km. Based on this phenomenon, we analyzed variations in Dm at different altitudes for heavy rainfall across their stages, with a particular focus on Dm variation as precipitation particles traverse these key heights (8 km, 5 km, and 2 km). The analysis starts at 0.5 km above these heights (8.5 km, 5.5 km, and 2.5 km respectively) and ends at 0.5 km below (7.5 km, 4.5 km, and 1.5 km respectively). The horizontal axis represents the Dm value at the starting height, and the vertical axis represents the difference of the Dm between the ending height and the starting height (ΔDm). These distributions quantitatively reveal the magnitude of vertical Dm changes as hydrometeors descend through different altitudes.
Figure 6 and Figure 7 present the two-dimensional contoured frequency of ΔDm versus Dm for convective and stratiform heavy rainfall at 8 km, 5 km, and 2 km altitudes during different stages. The results reveal significant altitude-dependent characteristics in Dm variations for both precipitation types. At 8 km, Dm shows relatively small overall increases, indicating limited particle growth in upper ice-phase regions. Meanwhile at 5 km, Dm increases rapidly, suggesting substantial particle growth as larger ice-phase hydrometeors undergo further enlargement in the melting layer. At 2 km, the proportions of Dm increases and decreases are roughly balanced, reflecting competing microphysical processes (e.g., coalescence vs. breakup) in lower altitudes. Notably, Dm variations at the same altitude differ across stages, highlighting distinct microphysical processes occurring at identical heights for different precipitation types.
For convective heavy rainfall, the Dm during the developing stage mainly shows an increasing trend when the precipitation particles drop to the 8 km height, with a growth rate of less than 0.2 mm in most cases (Figure 6a). Meanwhile, the growth is mainly concentrated in smaller precipitation particles (Dm < 1.2 mm). This suggests that condensation growth represents the dominant microphysical process during this stage. The preferential growth of smaller particles at 8 km during the developing stage creates favorable conditions for subsequent heavy rainfall intensification. However, during the mature stage of convective rainfall, the Dm growth rate is the highest when the precipitation particles drop to 8 km, and the Dm growth rate in the dissipation stage is slightly smaller than that in the mature stage (Figure 6d,g).
When hydrometeors pass through the 5 km altitude, the Dm varies significantly, with most particles experiencing rapid growth. This phenomenon results from the rapid phase transition of precipitation particles from mixed ice-water states to liquid droplets, accompanied by intense breakup effects, condensation growth, and collision–coalescence processes. A positive correlation exists between ΔDm and terminal Dm values, and larger particles demonstrate enhanced coalescence efficiency at 5 km. This indicates bigger hydrometeors preferentially merge into even larger raindrops. During the developing and dissipating stages, the distribution of particle growth is more concentrated than that in the mature stage. This difference may be related to coexisting updrafts and downdrafts during the mature stage.
When precipitation particles descend to the 2 km altitude, the proportion of Dm increases and decreases become relatively balanced, with the increasing fraction being slightly greater than the decreasing fraction. At this altitude, the precipitation particles exist in the liquid phase, and the dominant physical processes include coalescence, breakup, and evaporation.
For stratiform heavy rainfall, the Dm primarily exhibits an increasing trend when hydrometeors descend to the 8 km altitude, although with growth rates generally below 0.15 mm in most cases. Notably, this growth process is accompanied by significant particle breakup phenomena, indicating that environmental conditions at this altitude impose distinct limitations on the condensational growth of precipitation particles, thereby restricting the magnitude of particle growth. In different stages of stratiform heavy rainfall, the Dm growth rate is highest at an altitude of 8 km during the developing stage (Figure 7a), which may be related to stronger updrafts and a more abundant water vapor supply during the developing stage.
When precipitation particles pass through the 5 km altitude, the change in Dm is the most significant, and ΔDm is consistently positive. During the developing stage, particle growth distribution is more concentrated than that in the mature stage, which may be related to differences in dynamic conditions between different stages. In the mature stage, ΔDm is concentrated between 0.2–0.5 mm, and this relatively dispersed distribution characteristic may be associated with the more complex vertical airflow structure during this stage.
When precipitation particles descend to an altitude of 2 km, the proportions of Dm increase and decrease in stratiform heavy rainfall are roughly equal. At this altitude, the precipitation particles have completely transitioned into the liquid phase, and their evolution is primarily governed by three microphysical processes of collision–coalescence, breakup effect, and evaporation. The relative dominance of these three microphysical processes determines why the proportions of Dm increase and decrease remain nearly balanced at this altitude.

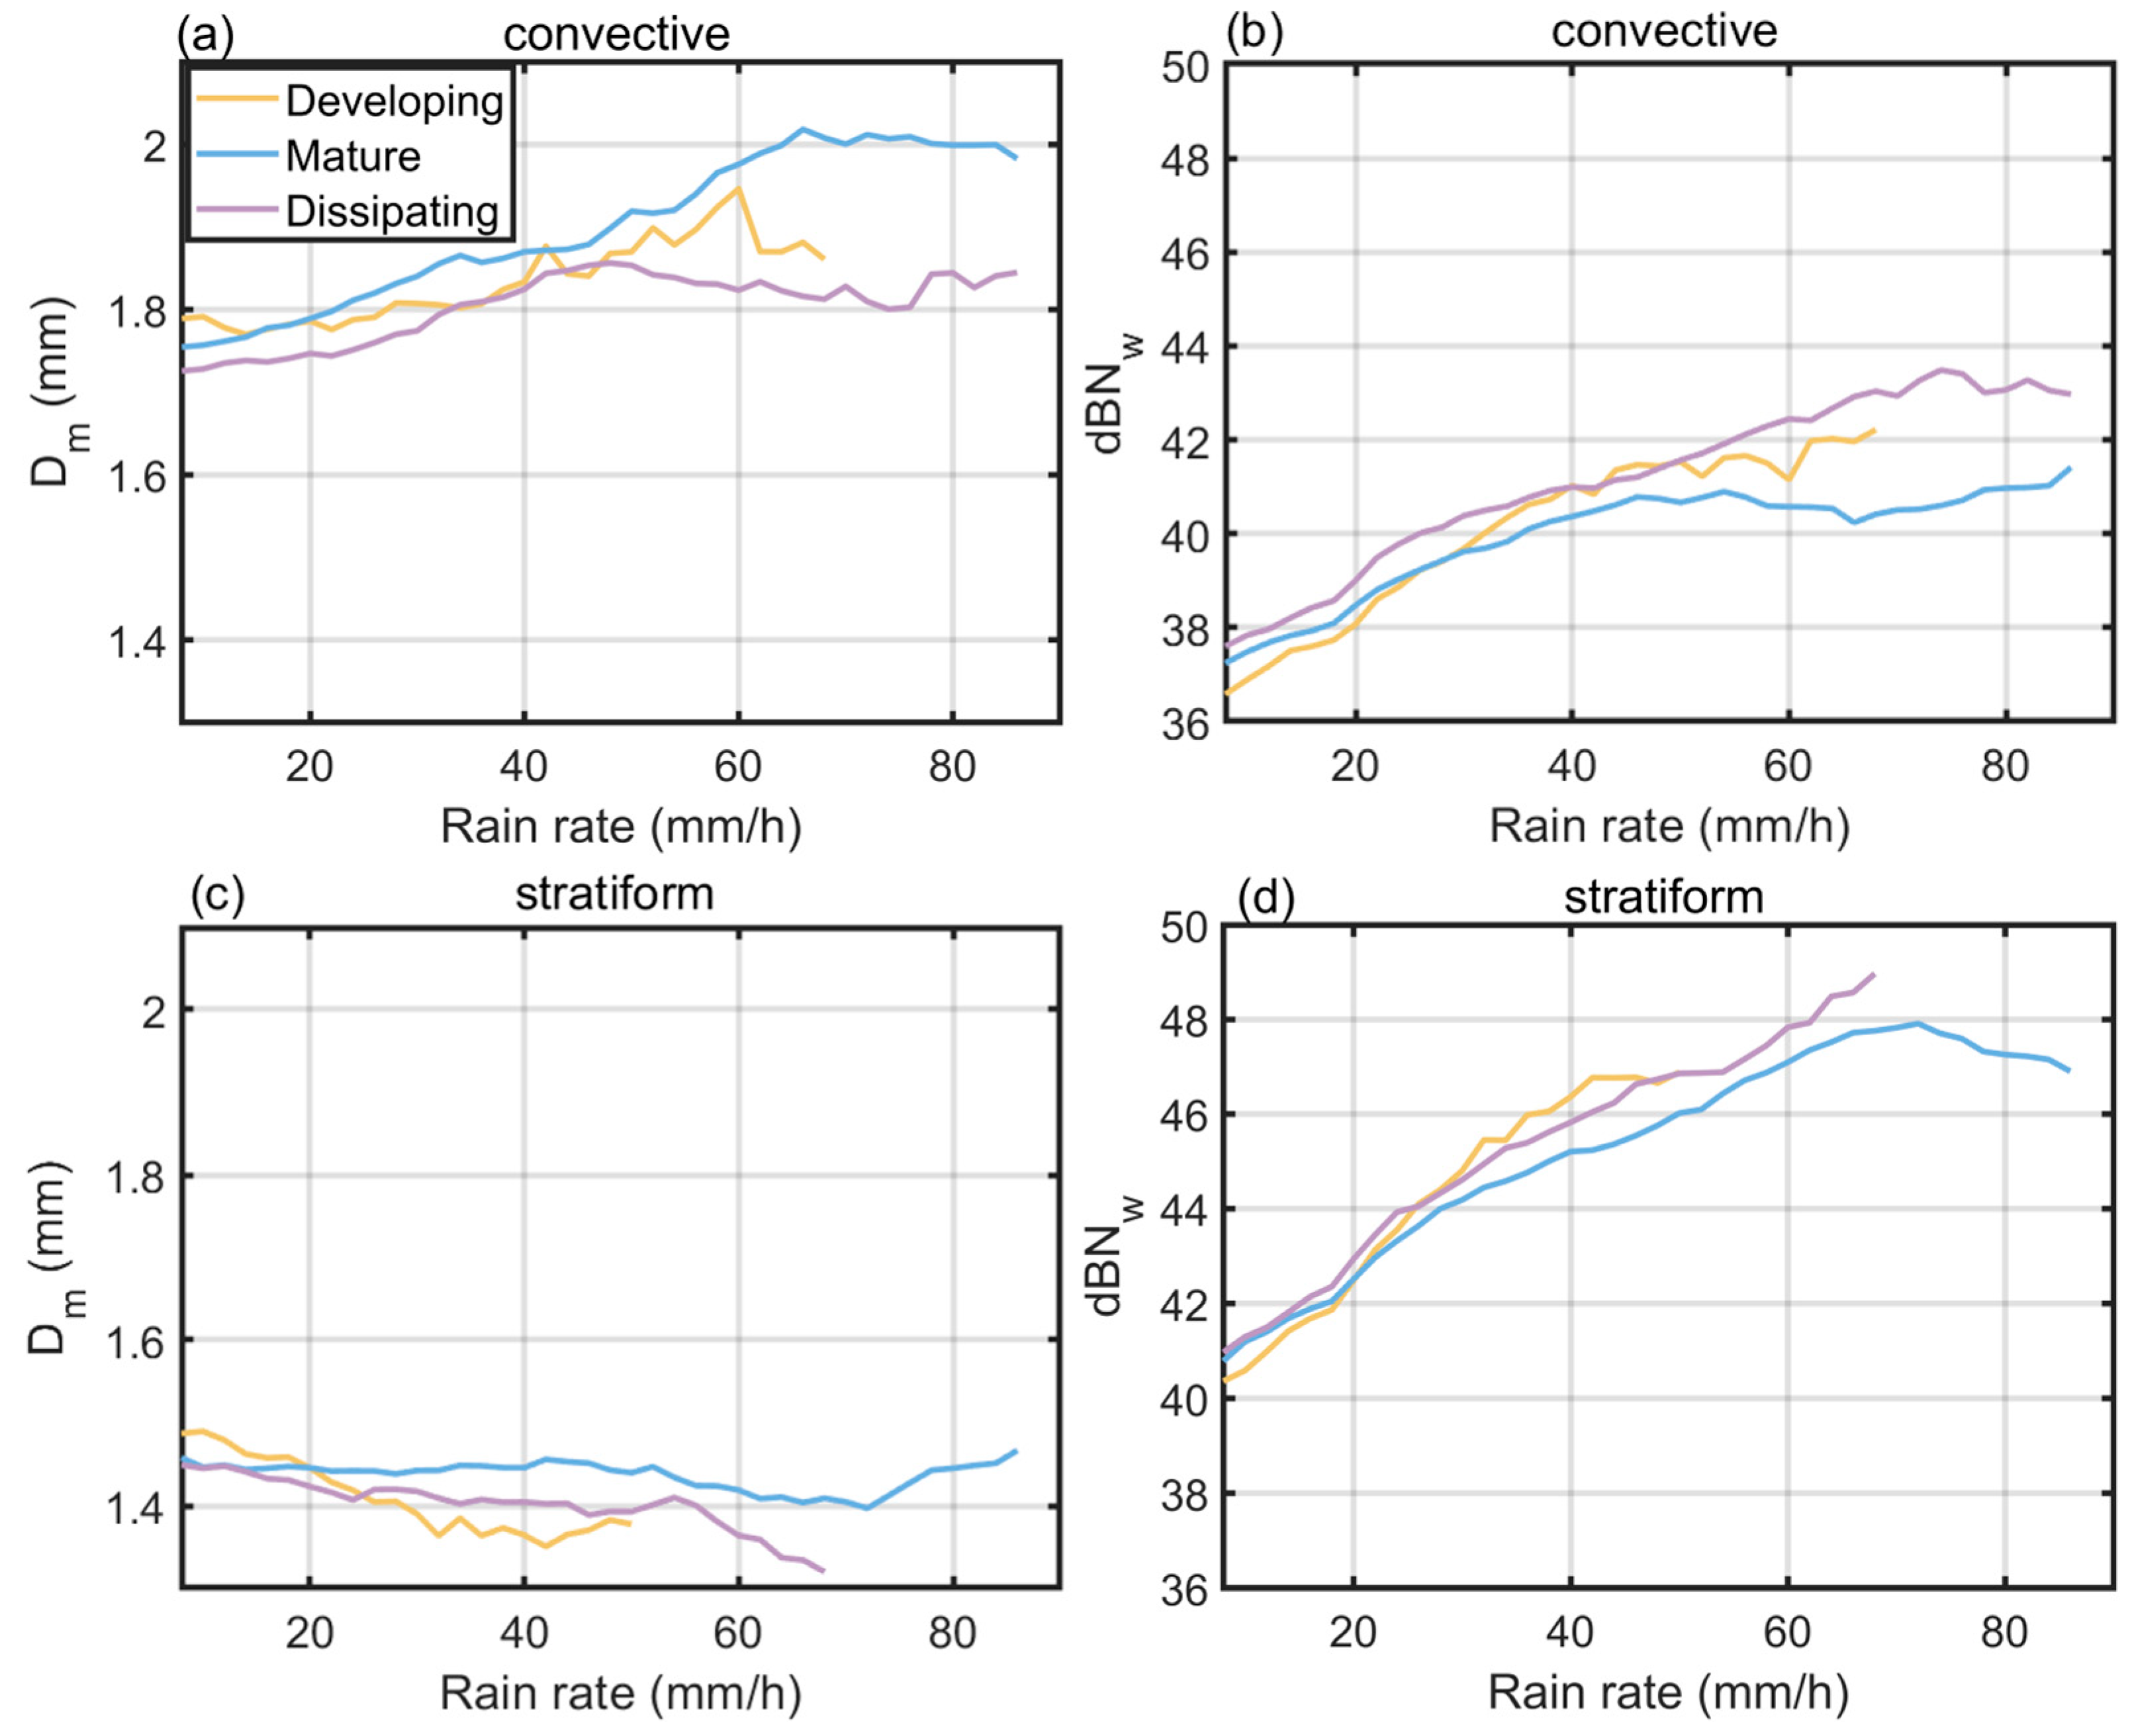
3.2.3. The Relationship Between Near-Surface Microphysics and Rainfall Rate

This section focuses on analyzing the relationship between Dm, dBNw, and the near-surface rainfall rate. Through comparative analysis of the microphysical parameter response characteristics between convective and stratiform heavy rainfall, we revealed differences in the dominant mechanisms governing rainfall intensity evolution for different precipitation types.
Figure 8 illustrates the relationship between Dm, dBNw, and rainfall intensity for convective and stratiform heavy rainfall at different stages. The results demonstrate that microphysical parameters in convective heavy rainfall exhibit significant dynamic responses throughout their life stages. During the developing stage, both Dm and dBNw increase synchronously with rainfall intensity, with Dm rising from 1.75 mm to 1.9 mm, while dBNw increases from 37 to 42. This indicates that robust updrafts during this stage not only facilitate particle collision–coalescence growth but also allow the particle number concentration to rapidly increase with rainfall intensity. In the mature stage, Dm peaks at 2.1 mm when rainfall intensity reaches 70 mm/h, then stabilizes despite further intensity increases, which may be due to particle breakup effects induced by strong updrafts. Meanwhile, dBNw stabilizes at 40 once the rainfall intensity exceeds 50 mm/h, suggesting saturation of the particle number concentration. The dissipating stage exhibits distinct microphysical characteristics. When rainfall intensity exceeds 50 mm/h, Dm decreases from 1.8 mm, while dBNw continues to rise to 42. This indicates that the maintenance of heavy rainfall during this stage relies more on the number of small particles. In the dissipating stage, the decrease in Dm may be due to the weakening of updrafts.
In contrast to convective heavy rainfall, stratiform heavy rainfall exhibits distinct near-surface microphysical characteristics. Compared to convective heavy rainfall, the near-surface mean Dm is consistently 0.3–0.5 mm lower as rainfall intensity increases, while dBNw is 3–5 units higher, with a ~20% greater growth rate. This discrepancy arises due to weaker convection in stratiform precipitation, which reduces particle collision–coalescence opportunities, resulting in smaller Dm but higher number concentrations. This “small size, high concentration” characteristic is closely linked to the stable layered structure of stratiform systems and small-scale turbulent mixing mechanism. Notably, the intensification of stratiform rainfall primarily relies on a significant increase in dBNw, while Dm fluctuates within a narrow range (±0.1 mm), confirming a number concentration-dominated enhancement mechanism. During the developing and dissipating stages, Dm shows a slight decreasing trend with increasing rainfall intensity, likely due to enhanced particle breakup effects. In the mature stage, Dm remains stable at 1.45 mm, indicating that rainfall intensification is mainly driven by continuous growth in particle number concentration.
The findings of this section elucidated the microphysical characteristics associated with the intensification of Meiyu heavy rainfall in the YHRV region across different stages. The results demonstrated distinct microphysical pathways: convective systems enhance rainfall through synergistic Dm growth and dBNw increases during both developing and mature stages, whereas stratiform systems predominantly depend on number concentration modulation, especially during developing and dissipating stages. These stage-dependent microphysical signatures provide crucial observational constraints for refining microphysical parameterization schemes in numerical prediction models.

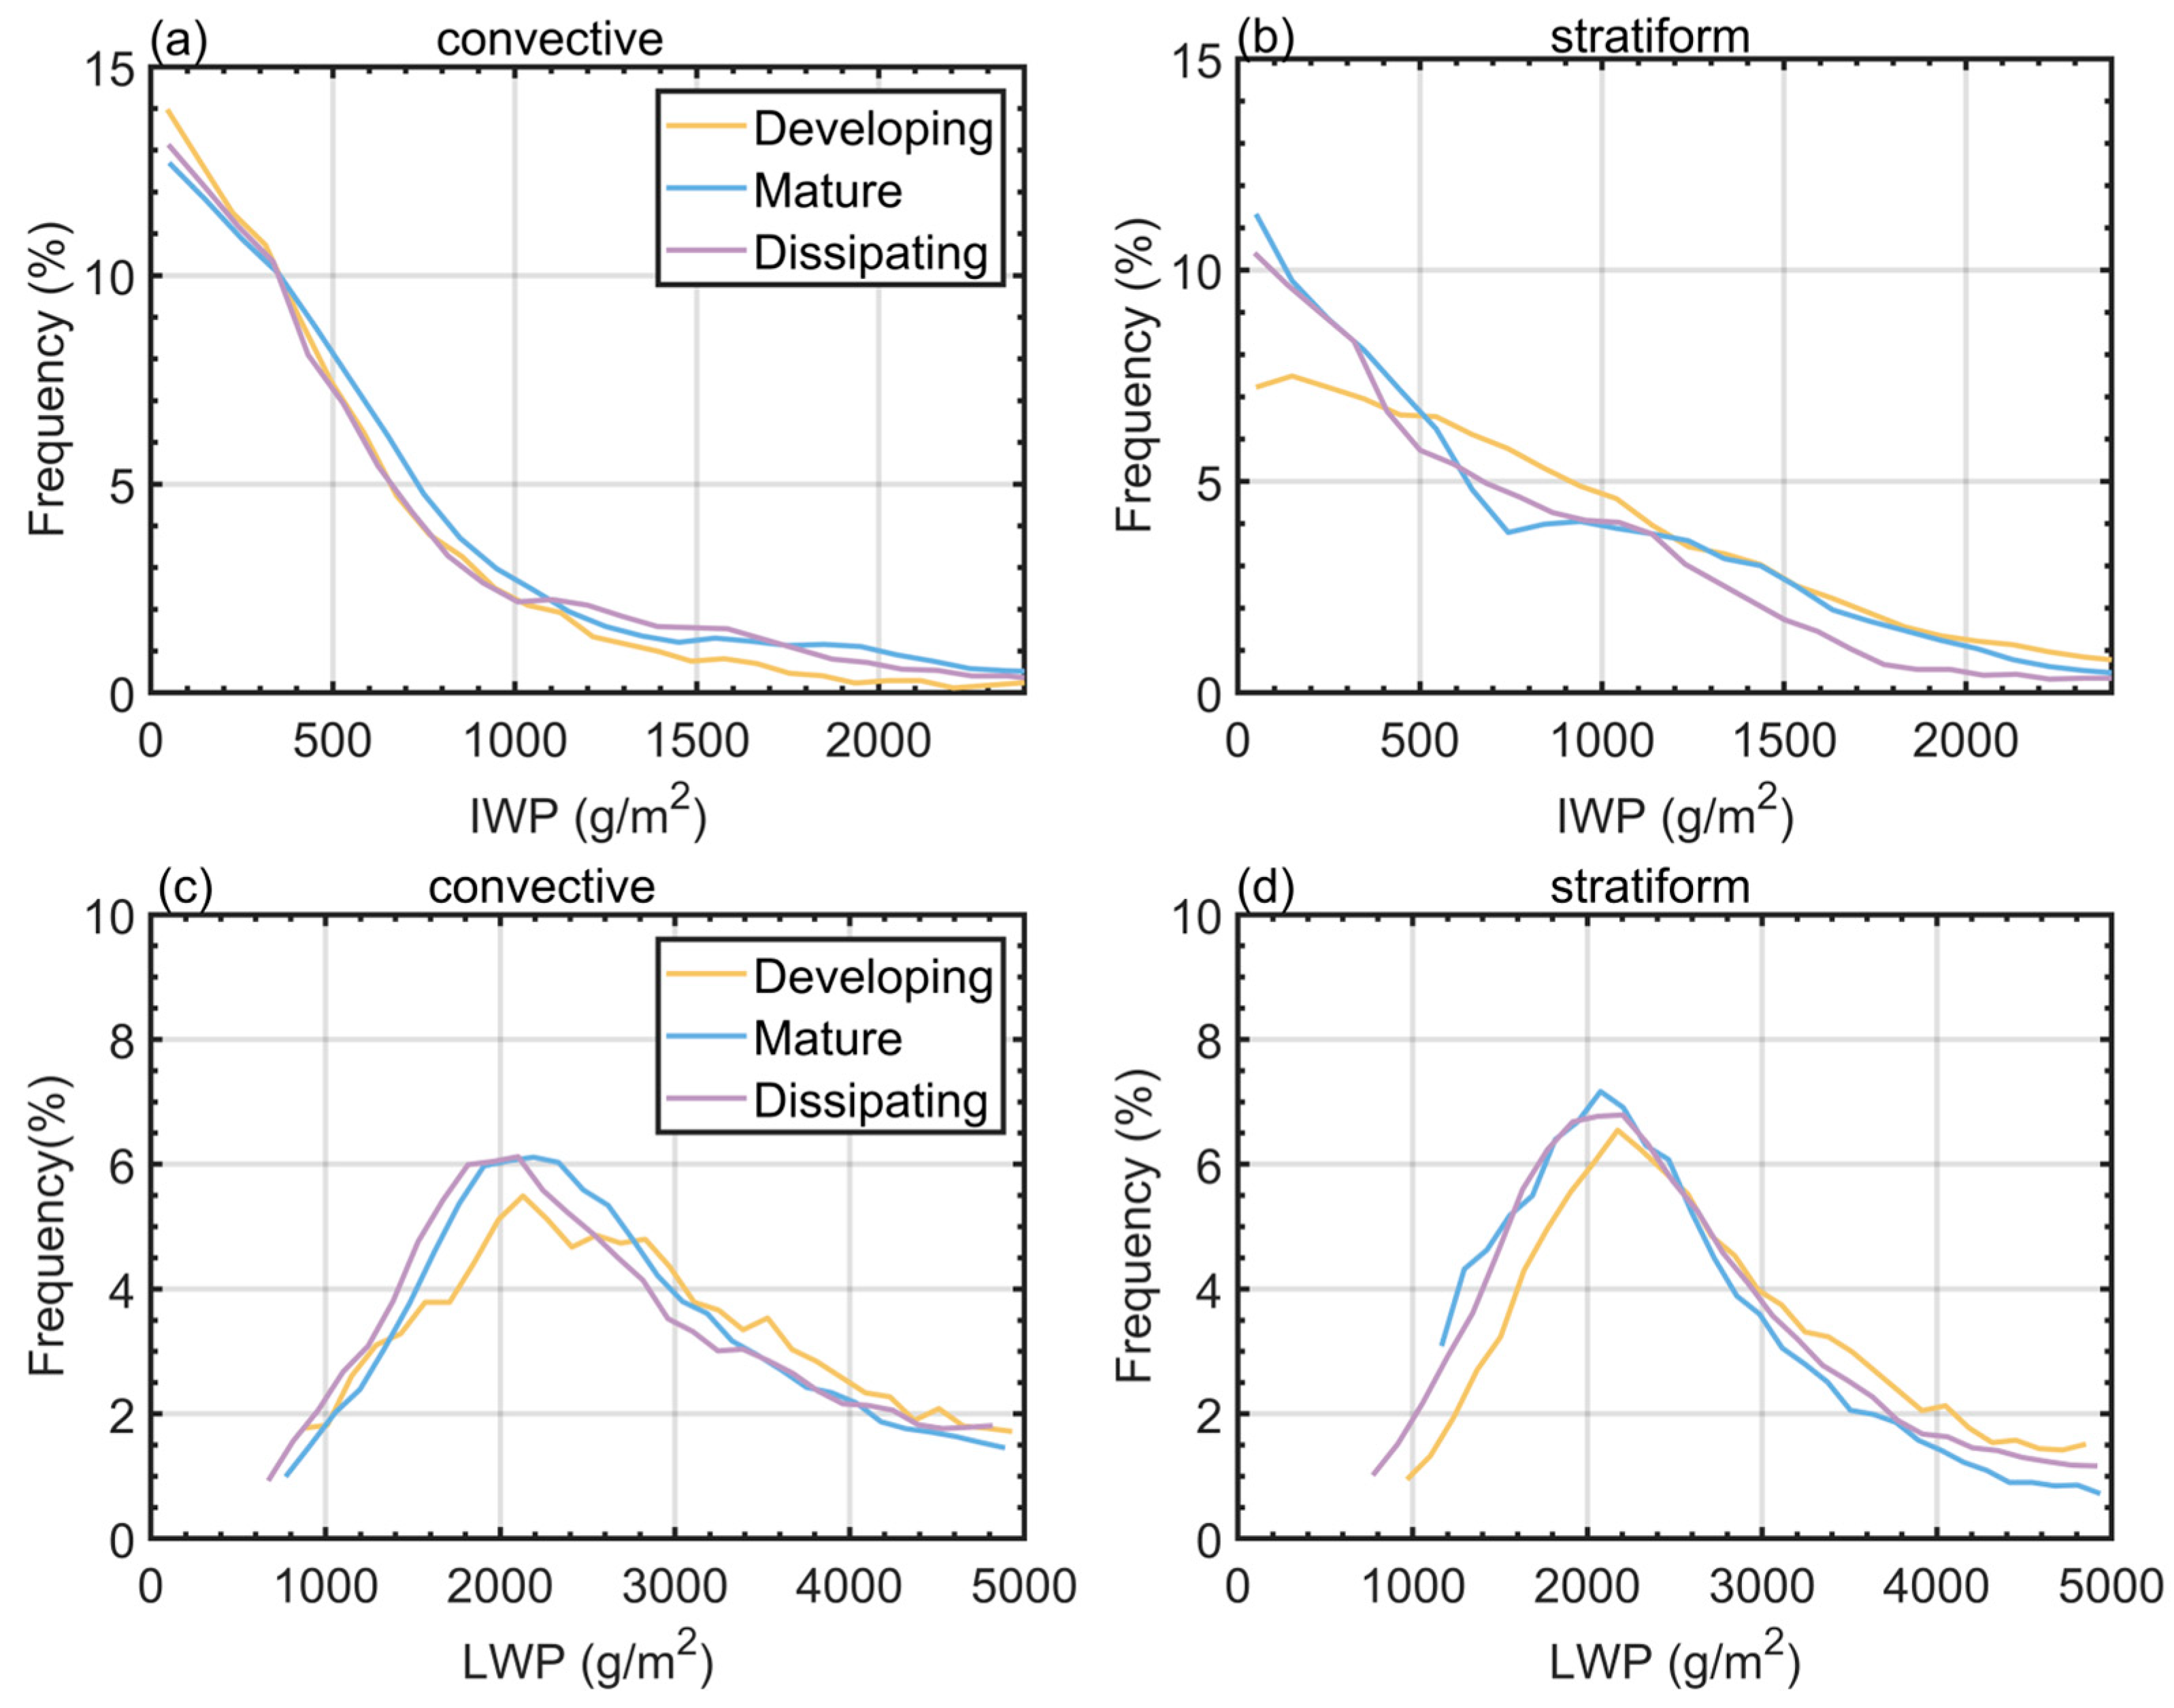
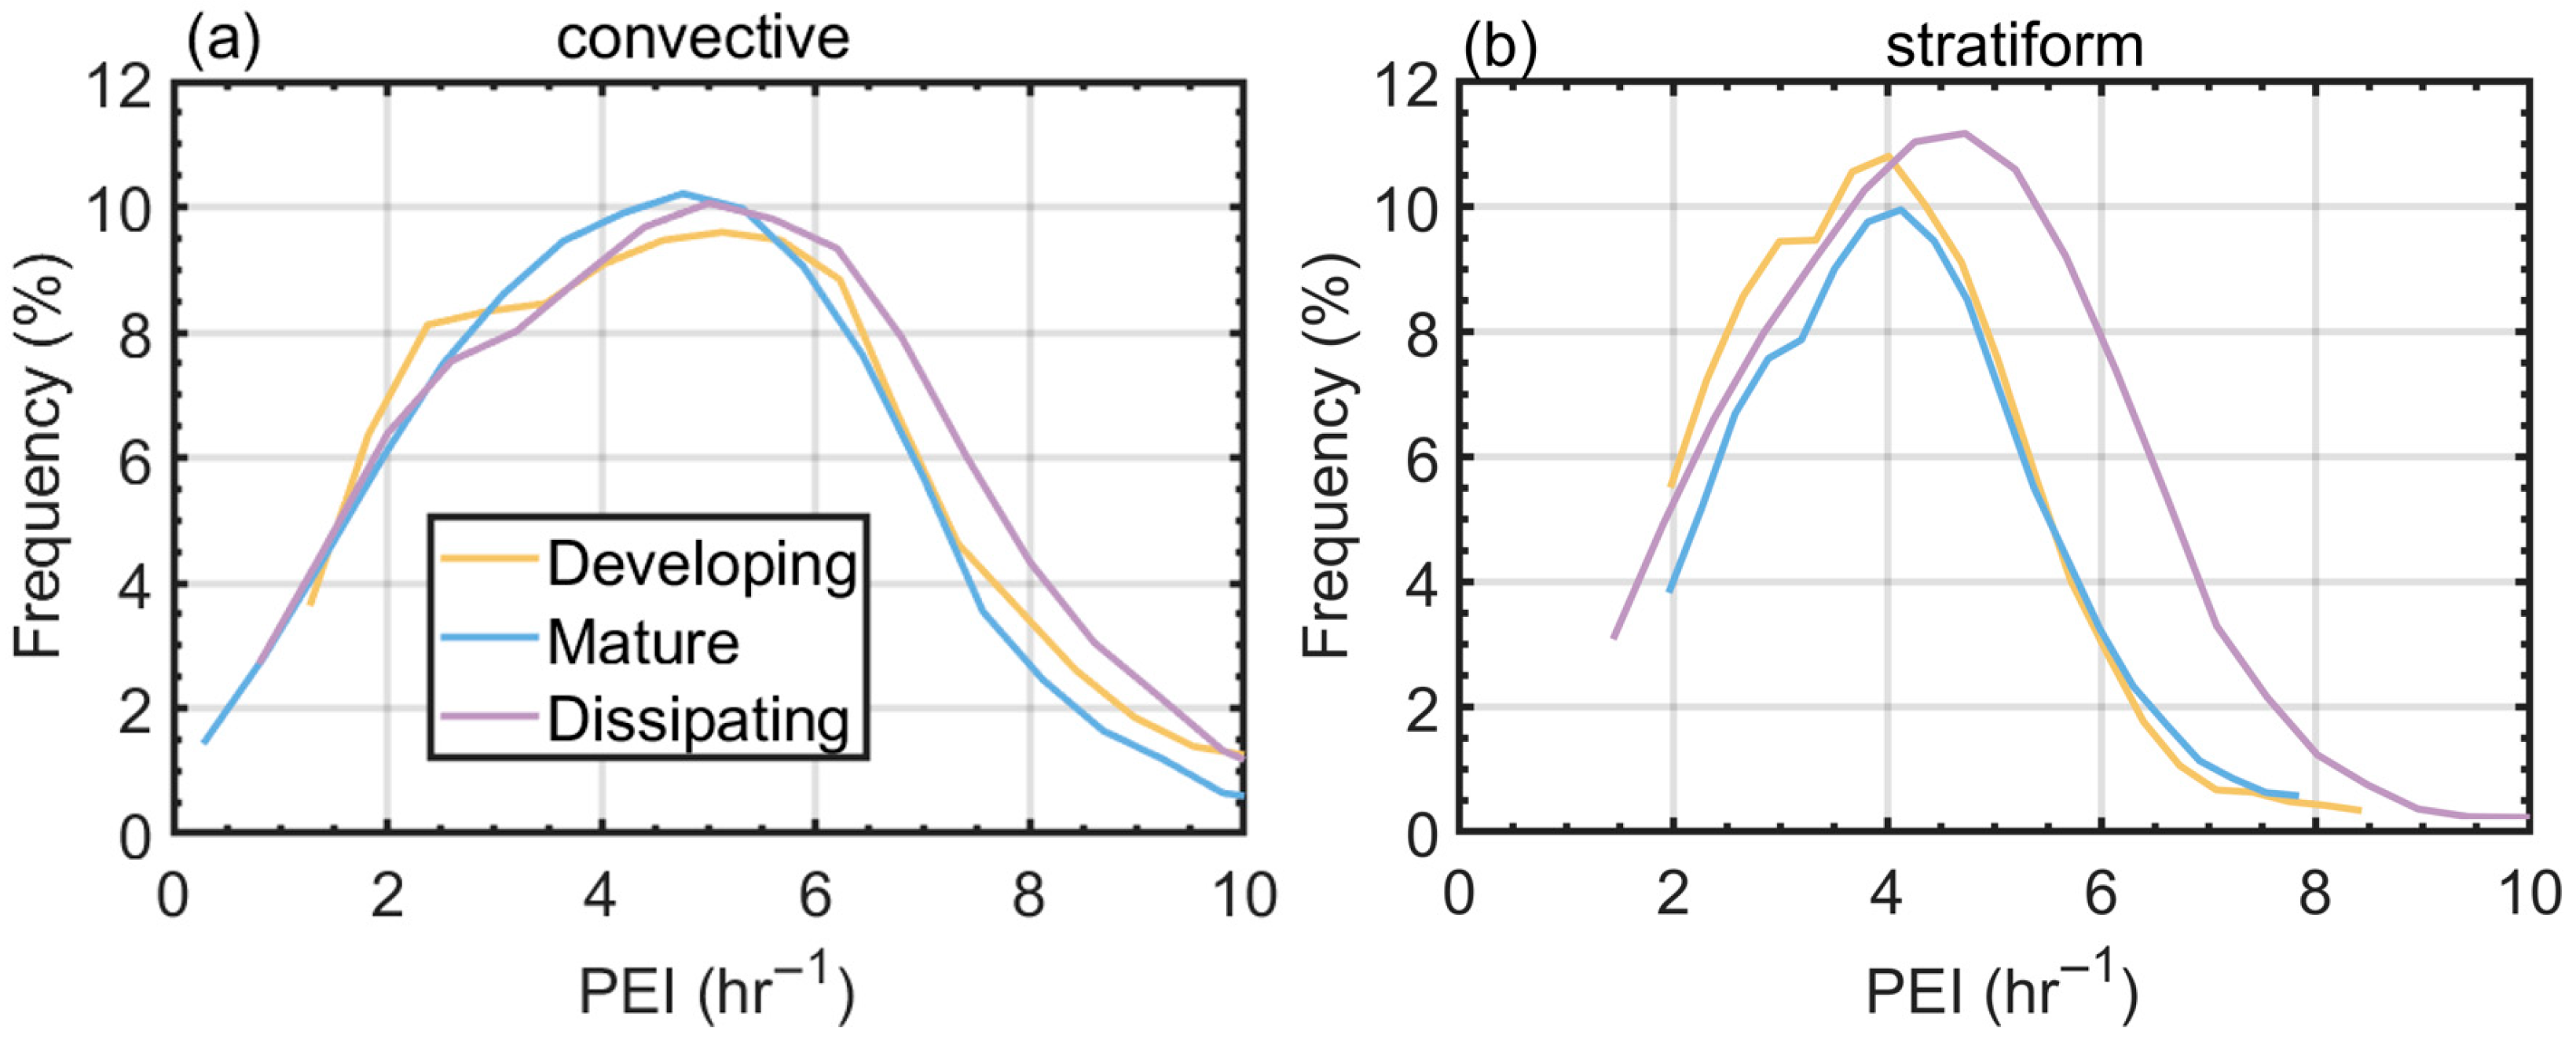
3.3. Comparative Analysis of Precipitation Efficiency

The Precipitation Efficiency Index (PEI) is usually used to evaluate how efficiently precipitation systems produce precipitation. In this study, PEI is defined as the ratio of the surface rainfall rate to the total vertically integrated ice and liquid water content [53,54]:
PEI = RR IWP + LWP
where RR is the near-surface rainfall rate, IWP represents the ice water path, and LWP represents the liquid water path. It should be noted that the definition of PEI in this study differs from the precipitation efficiency used in previous research that is defined as the ratio of rainfall to precipitable water [55,56]. Nevertheless, the PEI employed here also qualitatively reflects the contribution of column-integrated water to rainfall rate.
To quantify the differences in IWP and LWP of convective and stratiform heavy rainfall across different stages, Figure 9 presents their probability distributions. The IWP of stratiform heavy rainfall is significantly larger than that of convective heavy rainfall, indicating that Meiyu heavy rainfall in the YHRV region generated by stratiform precipitation clouds requires higher IWP than convective precipitation. During the dissipating stage of stratiform heavy rainfall, the IWP is notably smaller than during the developing and mature stages. Meanwhile, the proportion of LWP exceeding 2600 g/m2 in the developing stage is higher than in the mature and dissipating stages (Figure 9d). For stratiform heavy rainfall, the proportion of IWP exceeding 1400 g/m2 during the dissipation stage is lower than during the developing and mature stages (Figure 9d). This suggests that during the dissipating stage, downdrafts induce the melting of ice-phase particles, leading to a rapid decrease in IWP. The proportion of IWP above 1400 g/m2 during the dissipating stage of stratiform rainfall is smaller than during the developing and maturity stages (Figure 9d), indicating that downdrafts induce the melting of ice-phase particles at the dissipating stage, leading to a rapid decline in IWP.
The convective heavy rainfall exhibits distinct characteristics (Figure 9a,c). The distribution curves of IWP show similar features across all stages, while the LWP peaks at 2000 g/m2. During the developing stage, the proportion of IWP exceeding 1000 g/m2 is lower than during the dissipating and mature stages. Conversely, the proportion of LWP exceeding 2800 g/m2 is higher than in the dissipating and mature stages. This indicates that during the developing stage, updrafts promote rapid vapor condensation, leading to a swift increase in LWP, while ice particles in heavy rainfall remain underdeveloped, resulting in relatively lower IWP.
Figure 10 shows the distribution of PEI for convective and stratiform heavy rainfall at different stages. It should be noted that due to the lack of observational data on particle vertical fall velocity, the PEI in this study has a dimension of h−1. The results demonstrate that the PEI of Meiyu convective heavy rainfall in the YHRV region is generally higher than that of stratiform heavy rainfall. This is attributed to the strong updrafts in convective clouds, which prolong the cloud droplet coalescence growth time and facilitate the formation of large precipitation particles. While the PEI of convective heavy rainfall shows minor variations across different stages, the mature stage exhibits slightly higher PEI values due to larger Dm and greater raindrop fall velocities compared to the developing and dissipation stages. In contrast, stratiform heavy rainfall displays distinctly different evolutionary characteristics. Its PEI during the dissipating stage is significantly higher (by approximately 25%) than during the developing and mature stages. This enhancement may be associated with factors such as weakened updrafts during the dissipating stage, which promote rapid conversion of supercooled water droplets through condensation-coalescence processes, along with shortened particles fall paths within the precipitation cloud system.

4. Discussion

This study systematically analyzed the stage-dependent evolution of microphysical characteristics of Meiyu heavy rainfall over the YHRV region. Our findings revealed distinct microphysical signatures and controls between convective and stratiform precipitation across developing, mature, and dissipating stages.
In the YHRV region, stratiform precipitation dominates (>50%) during the developing stage of Meiyu heavy rainfall, while convective precipitation becomes dominant (>55%) during the mature and dissipating stages. Both convective and stratiform precipitation exhibit peak values in average surface rainfall rate and radar reflectivity during the mature stage, accompanied by the maximization of Dm and minimization of dBNw. This indicates that the microphysical structure during the mature stage optimally facilitates heavy rainfall formation, in agreement with Ai et al. (2016) [57].
The vertical microphysical structure exhibits pronounced stage dependence. In convective precipitation, strong updrafts during development limit particle growth, while mature stage conditions maximize particle size through coalescence and ice processes. The subsequent settling of large particles in the dissipating stage maintains number concentration stability. Stratiform precipitation shows clearer stage transitions: condensation dominates development, coalescence drives the mature stage, and breakup effects cause significant DSD narrowing during dissipation. This contrast underscores fundamentally different microphysical evolution pathways.
Analysis of the relationship between microphysical parameters and rainfall intensity revealed that convective heavy rainfall shows synchronous growth of Dm and dBNw during the developing stage. In the mature stage, Dm peaks at 2.1 mm when the rainfall rate reaches 70 mm/h, while dBNw stabilizes around 40 at 50 mm/h. During the dissipating stage, heavy rainfall (>50 mm/h) exhibits an inverse trend, with Dm decreasing (to 1.6 mm) while dBNw continues to increase (to 43). Stratiform heavy rainfall, however, shows greater sensitivity of dBNw to rainfall intensity (20% higher growth rate compared to convective rainfall), while Dm remains relatively stable (±0.1 mm variation), confirming that the number concentration is the primary controlling factor for stratiform heavy rainfall intensity, particularly during its developing and dissipating stages.
The significantly higher PEI of convective rainfall (~22% higher than stratiform) is attributed to enhanced cloud droplet coalescence within sustained strong updrafts. The observed ~25% increase in stratiform PEI during the dissipating stage, compared to development and maturity, likely results from rapid supercooled droplet conversion and shortened particle fall paths due to weakened updrafts. These PEI differences highlight the role of dynamic forces in modulating microphysical efficiency. In this study, we adopted PEI = RR/[LWP + IWP] due to inherent limitations in GPM DPR’s observational capabilities. Although GPM DPR reliably retrieves the LWP, IWP, and surface rainfall rate, accurately resolving hydrometeor fall velocities and evaporation losses at regional scales remains technically challenging with current remote sensing technology. While maintaining consistency with existing GPM DPR PEI research paradigms [53,54], this simplified scheme delivers a verifiable benchmark for systematic inter-stage comparisons.
This study systematically elucidated the stage evolution of microphysical structures in convective and stratiform heavy rainfall over the YHRV region, advanced the understanding of the relationship between rainfall intensity and microphysical parameters across different stages, and quantified the precipitation efficiency during these stages. These findings have significant scientific implications for understanding the evolution of Meiyu heavy rainfall in the YHRV region, while also aiding in refining the microphysical parameterization for nowcasting. However, the direct applicability of these findings to other climatic regimes requires careful consideration due to the region’s unique monsoonal environment, characterized by persistent frontal dynamics with strong moisture convergence and shallower convection depths compared to tropical systems. These results are particularly relevant for East Asian monsoon regions with comparable synoptic conditions and for heavy rainfall forecasting in similar mid-latitude frontal systems. Future validation studies across different climate zones are recommended to establish the broader generalizability of these stage-dependent frameworks.

5. Conclusions

This study elucidated the stage-dependent evolution of microphysical structures during Meiyu heavy rainfall events in the YHRV region, yielding several key findings:
Regarding precipitation type dominance, stratiform precipitation predominates (>50%) during the developing stage of Meiyu heavy rainfall, while convective precipitation becomes dominant (>55%) in both the mature and dissipating stages. Both precipitation types exhibit peak values in average surface rainfall rate, radar reflectivity, and Dm; during the mature stage, indicating this phase possesses the most favorable microphysical structure for heavy rainfall formation.
The vertical microphysical structure shows distinct stage-dependent characteristics. In convective precipitation, development-stage updrafts inhibit particle growth, whereas mature-stage conditions optimize particle size via coalescence and ice processes. During dissipation, large particle settling preserves the concentration stability. Stratiform precipitation exhibits more defined stage transitions: development is dominated by condensation, maturation by coalescence, and dissipation by breakup-induced DSD narrowing.
Analysis of rainfall intensity controls reveals stage-dependent relationships between microphysical parameters and precipitation rates that differ by precipitation type. For convective rainfall, synchronous growth of Dm and dBNw occurs during development. The mature stage shows Dm peaking at ~70 mm/h (2.1 mm) while dBNw stabilizes earlier (~50 mm/h at ~40). During dissipation, heavy rainfall (>50 mm/h) exhibits an inverse trend with decreasing Dm (to 1.6 mm) and increasing dBNw (to 43). Stratiform rainfall demonstrates greater sensitivity of dBNw to rainfall intensity compared to convective rainfall, while Dm remains remarkably stable (±0.1 mm variation), confirming that dBNw serves as the primary control on stratiform rainfall intensity, particularly during the development and dissipation stages.
Notable differences emerge in precipitation efficiency. Convective rainfall shows significantly higher PEI values (averaging ~22% greater than stratiform), attributable to prolonged droplet coalescence in strong updrafts. Stratiform rainfall exhibits a ~25% PEI increase during dissipation compared to earlier stages.
These findings significantly advance our understanding of microphysical evolution during Meiyu heavy rainfall. The established stage-dependent relationships between rainfall intensity and microphysical parameters provide crucial insights for refining microphysical parameterizations in numerical models, particularly for nowcasting applications in the YHRV region. Future research should incorporate ground-based dual-polarization radar observations to investigate regulatory mechanisms of ice-phase precipitation particles below the melting layer, while validation studies across different climate regimes would help in assessing the broader applicability of these stage-dependent frameworks.

Author Contributions

Conceptualization, P.H. and L.K.; methodology, Z.H., L.K. and P.H.; software, H.G. and Z.H.; validation, P.H. and L.K.; formal analysis, L.K. and P.H.; investigation, P.H.; resources, Z.H.; data curation, L.K. and Z.H.; writing—original draft preparation, P.H. and Z.H.; writing—review and editing, L.K.; visualization, L.K.; supervision, L.K.; project administration, H.G., Y.X. and L.Z.; funding acquisition, H.G., Y.X. and L.Z. All authors have read and agreed to the published version of the manuscript.

Funding

This study was funded by the National Key Research and Development Program of China (2021YFC2802502), the Meteorological Joint Funds of the National Natural Science Foundation of China (U2342222), the National Natural Science Foundation of China (42475146), the Shanghai Aerospace Science and Technology Innovation Fund (SAST2023-047), and the NUIST Students’ Platform for Innovation and Entrepreneurship Training Program (202410300048Z).

Institutional Review Board Statement

Not applicable.

Informed Consent Statement

Not applicable.

Data Availability Statement

GPM DPR and IMERG data were downloaded from NASA PPS at https://storm.pps.eosdis.nasa.gov/storm/ (accessed on 28 April 2025). ERA5 data were downloaded from https://cds.climate.copernicus.eu/cdsapp#!/dataset/reanalysis-era5-single-levels (accessed on 25 April 2025).

Acknowledgments

We acknowledge the data providers of the National Centers for Environmental Prediction Final Operational Model Global Tropospheric Analyses. We would like to thank the scientists and those who contributed to the GPM mission.

Conflicts of Interest

The authors declare no conflicts of interest.

References

  1. Wang, J.; Liu, Y.; Ding, Y.; Wu, Z. Towards influence of Arabian Sea SST anomalies on the withdrawal date of Meiyu over the Yangtze-Huaihe River basin. Atmos. Res. 2020, 249, 105340. [Google Scholar] [CrossRef]
  2. Pan, X.; Li, T.; Sun, Y.; Zhu, Z. Cause of extreme heavy and persistent rainfall over Yangtze River in summer 2020. Adv. Atmos. Sci. 2021, 38, 1994–2009. [Google Scholar] [CrossRef]
  3. Naud, C.M.; Martin, J.E.; Ghosh, P.; Elsaesser, G.S.; Booth, J.F.; Posselt, D.J. Lifecycle-type matters for extratropical cyclone precipitation production. Geophys. Res. Lett. 2025, 52, e2025GL115153. [Google Scholar] [CrossRef]
  4. Wang, J.; He, H.J.; Liu, X.F.; Wu, B.G. Interannual variability of the Meiyu onset over Yangtze-Huaihe River Valley and analyses of its previous strong influence signal. Chin. Sci. Bull. 2008, 54, 687–695. [Google Scholar] [CrossRef]
  5. Chen, Y.L.; Zhang, A.Q.; Zhang, Y.H.; Cui, C.G.; Wan, R.; Wang, B.; Fu, Y.F. A heavy precipitation event in the Yangtze River basin led by an eastward moving Tibetan plateau cloud system in the summer of 2016. J. Geophys. Res. Atmos. 2020, 125, e2020JD032429. [Google Scholar] [CrossRef]
  6. Bai, M.X.; Zheng, J.Y.; Zhang, L. Potential causes of megapluvials in the Yangtze–Huaihe River valley over the last millennium. Glob. Planet. Change 2023, 231, 104292. [Google Scholar] [CrossRef]
  7. Cui, Y.; Jiang, Z.H.; Chen, W.L.; Zhang, R.Y. Projections of the 21st century Changjiang-Huaihe River Basin extreme precipitation events. Adv. Clim. Change Res. 2012, 3, 76–83. [Google Scholar] [CrossRef]
  8. Zhou, B.T.; Xu, Y.; Wu, J.; Dong, S.Y.; Shi, Y. Changes in temperature and precipitation extreme indices over China: Analysis of a high-resolution grid dataset. Int. J. Climatol. 2015, 36, 1051–1066. [Google Scholar] [CrossRef]
  9. Li, L.; Zhai, P.M.; Chen, Y.; Ni, Y.Q. Low-frequency oscillations of the East Asia–Pacific teleconnection pattern and their impacts on persistent heavy precipitation in the Yangtze–Huai River valley. J. Meteorol. Res. 2016, 30, 459–471. [Google Scholar] [CrossRef]
  10. Wu, X.J.; Wang, L.C.; Niu, Z.G.; Jiang, W.X.; Cao, Q. More extreme precipitation over the Yangtze River Basin, China: Insights from historical and projected perspectives. Atmos. Res. 2023, 292, 106883. [Google Scholar] [CrossRef]
  11. Moseley, C.; Berg, P.; Haerter, J.O. Probing the precipitation life cycle by iterative rain cell tracking. J. Geophys. Res. Atmos. 2013, 118, 13361–13370. [Google Scholar] [CrossRef]
  12. Witte, M.K.; Chuang, P.Y.; Feingold, G. On clocks and clouds. Atmos. Chem. Phys. 2014, 14, 6729–6738. [Google Scholar] [CrossRef]
  13. Booth, J.F.; Naud, C.M.; Jeyaratnam, J. Extratropical cyclone precipitation life cycles: A satellite-based analysis. Geophys. Res. Lett. 2018, 45, 8647–8654. [Google Scholar] [CrossRef]
  14. Zhang, A.Q.; Fu, Y.F. Life cycle effects on the vertical structure of precipitation in East China measured by Himawari-8 and GPM DPR. Mon. Weather Rev. 2018, 146, 2183–2199. [Google Scholar] [CrossRef]
  15. Zhang, A.Q.; Chen, C.; Chen, Y.L.; Li, W.B.; Chen, S.M.; Fu, Y.F. Resilient dataset of rain clusters with life cycle evolution during April to June 2016–2020 over eastern Asia based on observations from the GPM DPR and Himawari-8 AHI. Earth Syst. Sci. Data 2022, 14, 1433–1445. [Google Scholar] [CrossRef]
  16. Yokoyama, C.; Takayabu, Y.N. A statistical study on rain characteristics of tropical cyclones using TRMM satellite data. Mon. Weather Rev. 2008, 136, 3848–3862. [Google Scholar] [CrossRef]
  17. D’Adderio, L.P.; Vulpiani, G.; Porcù, F.; Tokay, A.; Meneghini, R. Comparison of GPM core observatory and Ground-Based radar retrieval of Mass-Weighted mean raindrop diameter at midlatitude. J. Hydrometeorol. 2018, 19, 1583–1598. [Google Scholar] [CrossRef]
  18. Sun, Y.T.; Dong, X.Q.; Cui, W.J.; Zhou, Z.M.; Fu, Z.K.; Zhou, L.L.; Deng, Y.; Cui, C.G. Vertical structures of typical Meiyu precipitation events retrieved from GPM-DPR. J. Geophys. Res. Atmos. 2019, 125, e2019JD031466. [Google Scholar] [CrossRef]
  19. Meneghini, R.; Liao, L.; Iguchi, T. A generalized Dual-Frequency Ratio (DFR) approach for rain retrievals. J. Atmos. Ocean. Technol. 2022, 39, 1309–1329. [Google Scholar] [CrossRef]
  20. Hou, A.Y.; Kakar, R.K.; Neeck, S.; Azarbarzin, A.A.; Kummerow, C.D.; Kojima, M.; Oki, R.; Nakamura, K.; Iguchi, T. The global precipitation measurement mission. Bull. Am. Meteorol. Soc. 2013, 95, 701–722. [Google Scholar] [CrossRef]
  21. Skofronick-Jackson, G.; Petersen, W.A.; Berg, W.; Kidd, C.; Stocker, E.F.; Kirschbaum, D.B.; Kakar, R.; Braun, S.A.; Huffman, G.J.; Iguchi, T.; et al. The Global Precipitation Measurement (GPM) mission for science and society. Bull. Am. Meteorol. Soc. 2016, 98, 1679–1695. [Google Scholar] [CrossRef] [PubMed]
  22. Masaki, T.; Iguchi, T.; Kanemaru, K.; Furukawa, K.; Yoshida, N.F.; Kubota, T. Calibration of the Dual-Frequency Precipitation radar onboard the Global Precipitation Measurement core observatory. IEEE Trans. Geosci. Remote Sens. 2020, 60, 5100116. [Google Scholar] [CrossRef]
  23. Kou, L.L.; Mao, Y.; Wang, Z.X.; Chen, A.J.; Chu, Z.G. Comparisons of three-dimensional reflectivity and precipitation rate from GPM dual-frequency precipitation radar and ground dual-polarization radar. Atmos. Res. 2022, 282, 106521. [Google Scholar] [CrossRef]
  24. Iguchi, T.; Seto, S.; Meneghini, R.; Yoshida, N.; Awaka, J.; Le, M.; Chandrasekar, V.; Brodzik, S.; Kubota, T. GPM/DPR Level-2 Algorithm Theoretical Basis Document; NASA Goddard Space Flight Center: Greenbelt, MD, USA, 2021. Available online: https://arthurhou.pps.eosdis.nasa.gov/Documents/ATBD_DPR_V07A.pdf (accessed on 15 July 2025).
  25. Hu, P.; Kou, L.L.; Wang, W.J.; Gao, H.Y.; Xie, Y.Q.; Zhang, L.G. Vertical microphysical structures of summer heavy rainfall in the Yangtze-Huaihe River Valley from GPM DPR data. Atmos. Res. 2024, 315, 107833. [Google Scholar] [CrossRef]
  26. Rivero-Ordaz, L.; Merino, A.; Navarro, A.; Tapiador, F.J.; Sánchez, J.L.; García-Ortega, E. Detection and characterization of hailstorms over France using DPR data onboard the GPM core observatory. Atmos. Res. 2024, 302, 107308. [Google Scholar] [CrossRef]
  27. Hersbach, H.; Bell, B.; Berrisford, P.; Nicolas, J.L.; Peubey, C.; Radu, R.; Schepers, D.; Simmons, A.; Soci, C.; Abdalla, S.; et al. The ERA5 global reanalysis. Q. J. R. Meteorol. Soc. 2020, 146, 1999–2049. [Google Scholar] [CrossRef]
  28. Lavers, D.A.; Simmons, A.; Vamborg, F.; Rodwell, M.J. An evaluation of ERA5 precipitation for climate monitoring. Q. J. R. Meteorol. Soc. 2022, 148, 3152–3165. [Google Scholar] [CrossRef]
  29. Tan, J.; Huffman, G.J.; Bolvin, D.T.; Nelkin, E.J. Diurnal cycle of IMERG V06 precipitation. Geophys. Res. Lett. 2019, 46, 13584–13592. [Google Scholar] [CrossRef]
  30. Wang, J.; Wolff, D.B.; Tan, J.; Marks, D.A.; Pippitt, J.L.; Huffman, G.J. Validation of IMERG oceanic precipitation over Kwajalein. Remote Sens. 2022, 14, 3753. [Google Scholar] [CrossRef]
  31. Zhu, S.Y.; Li, Z.; Chen, M.Y.; Wen, Y.X.; Gao, S.; Zhang, J.Q.; Wang, J.; Nan, Y.; Ferraro, S.C.; Tsoodle, T.E.; et al. How has the latest IMERG V07 improved the precipitation estimates and hydrologic utility over CONUS against IMERG V06? J. Hydrol. 2024, 654, 132257. [Google Scholar] [CrossRef]
  32. Yang, S.; Surratt, M.; Whitcomb, T.R.; Camacho, C. Evaluation of IMERG and GSMAP for tropical Cyclone applications. Geophys. Res. Lett. 2024, 51, e2023g1106414. [Google Scholar] [CrossRef]
  33. Pradhan, R.K.; Markonis, Y.; Godoy, V.; Rodrigo, M.; Anahi, V.-P.; Andreadis, K.M.; Nikolopoulos, E.I.; Papalexiou, S.M. Review of GPM IMERG performance: A global perspective. Remote Sens. Environ. 2021, 268, 112754. [Google Scholar] [CrossRef]
  34. Gaona, M.F.R.; Villarini, G.; Zhang, W.; Vecchi, G.A. The added value of IMERG in characterizing rainfall in tropical cyclones. Atmos. Res. 2018, 209, 95–102. [Google Scholar] [CrossRef]
  35. Huang, W.R.; Chang, Y.H.; Liu, P.Y. Assessment of IMERG precipitation over Taiwan at multiple timescales. Atmos. Res. 2018, 214, 239–249. [Google Scholar] [CrossRef]
  36. Maghsood, F.F.; Hashemi, H.; Hosseini, S.H.; Berndtsson, R. Ground Validation of GPM IMERG precipitation products over Iran. Remote Sens. 2019, 12, 48. [Google Scholar] [CrossRef]
  37. Wu, Z.H.; Zhang, Y.; Zhang, L.F.; Hao, X.L.; Lei, H.C.; Zheng, H.P. Validation of GPM precipitation products by comparison with ground-based parsivel disdrometers over Jianghuai region. Water 2019, 11, 1260. [Google Scholar] [CrossRef]
  38. Gatlin, P.N.; Petersen, W.A.; Pippitt, J.L.; Berendes, T.A.; Wolff, D.B.; Tokay, A. The GPM validation network and evaluation of satellite-based retrievals of the rain drop size distribution. Atmosphere 2020, 11, 1010. [Google Scholar] [CrossRef]
  39. Seto, S.; Iguchi, T.; Meneghini, R.; Awaka, J.; Kubota, T.; Masaki, T.; Takahashi, N. The precipitation rate retrieval algorithms for the GPM Dual-frequency Precipitation Radar. J. Meteorol. Soc. Jpn. Ser. II 2020, 99, 205–237. [Google Scholar] [CrossRef]
  40. Seela, B.K.; Janapati, J.; Lin, P.L.; Lan, C.H.; Huang, M.Q. Evaluation of GPM DPR rain parameters with north Taiwan disdrometers. J. Hydrometeorol. 2023, 25, 47–64. [Google Scholar] [CrossRef]
  41. Pabla, C.S.; Wolff, D.B.; Marks, D.A.; Wingo, S.M.; Pippitt, J.L. GPM ground validation at NASA Wallops precipitation research facility. J. Atmos. Ocean. Technol. 2022, 39, 1199–1215. [Google Scholar] [CrossRef]
  42. Gao, J.; Tang, G.Q.; Hong, Y. Similarities and improvements of GPM Dual-Frequency Precipitation Radar (DPR) upon TRMM Precipitation Radar (PR) in global precipitation rate estimation, type classification and vertical profiling. Remote Sens. 2017, 9, 1142. [Google Scholar] [CrossRef]
  43. Gao, Y.; Wu, T.W.; Wang, J.; Tang, S.H. Evaluation of GPM Dual-Frequency Precipitation Radar (DPR) rainfall products using the rain gauge network over China. J. Hydrometeorol. 2020, 22, 547–559. [Google Scholar] [CrossRef]
  44. McErlich, C.; McDonald, A.; Renwick, J.; Schuddeboom, A. An assessment of Extra-Tropical Cyclone precipitation extremes over the Southern Hemisphere using ERA5. Geophys. Res. Lett. 2023, 50, e2023GL104130. [Google Scholar] [CrossRef]
  45. Booth, J.F.; Naud, C.M.; Willison, J. Evaluation of extratropical cyclone precipitation in the North Atlantic Basin: An analysis of ERA-Interim, WRF, and two CMIP5 models. J. Clim. 2017, 31, 2345–2360. [Google Scholar] [CrossRef] [PubMed]
  46. Crawford, A.D.; Alley, K.E.; Cooke, A.M.; Serreze, M.C. Synoptic climatology of Rain-on-Snow events in Alaska. Mon. Weather Rev. 2019, 148, 1275–1295. [Google Scholar] [CrossRef]
  47. Crawford, A.D.; Serreze, M.C. Projected changes in the Arctic Frontal Zone and summer Arctic Cyclone activity in the CESM large ensemble. J. Clim. 2017, 30, 9847–9869. [Google Scholar] [CrossRef]
  48. Hell, M.C.; Gille, S.T.; Cornuelle, B.D.; Miller, A.J.; Bromirski, P.D.; Crawford, A.D. Estimating Southern Ocean storm positions with seismic observations. J. Geophys. Res. Ocean. 2020, 125, e2019JG015898. [Google Scholar] [CrossRef]
  49. Koyama, T.; Stroeve, J.; Cassano, J.; Crawford, A. Sea ice loss and Aarctic cyclone activity from 1979 to 2014. J. Clim. 2017, 30, 4735–4754. [Google Scholar] [CrossRef]
  50. Bengtsson, L.; Hodges, K.I.; Roeckner, E. Storm tracks and climate change. J. Clim. 2006, 19, 3518–3543. [Google Scholar] [CrossRef]
  51. Bengtsson, L.; Hodges, K.I.; Keenlyside, N. Will Extratropical Storms Intensify in a Warmer Climate? J. Clim. 2009, 22, 2276–2301. [Google Scholar] [CrossRef]
  52. Jensen, M.P.; Petersen, W.A.; Bansemer, A.; Bharadwaj, N.; Carey, L.D.; Cecil, D.J.; Collis, S.M.; Del Genio, A.D.; Dolan, B.; Gerlach, J.; et al. The Midlatitude Continental Convective Clouds Experiment (MC3E). Bull. Am. Meteorol. Soc. 2015, 97, 1667–1686. [Google Scholar] [CrossRef] [PubMed]
  53. Huang, H.; Chen, F.J. Precipitation microphysics of tropical cyclones over the Western North Pacific Based on GPM DPR observations: A preliminary analysis. J. Geophys. Res. Atmos. 2019, 124, 3124–3142. [Google Scholar] [CrossRef]
  54. Hu, X.; Ai, W.H.; Qiao, J.Q.; Hu, S.S.; Han, D.; Yan, W. Microphysics of summer precipitation over Yangtze-Huai River Valley region in China revealed by GPM DPR observation. Earth Space Sci. 2021, 9, e2021ea002021. [Google Scholar] [CrossRef]
  55. Sui, C.-H.; Li, X.; Yang, M.-J. On the definition of precipitation efficiency. J. Atmos. Sci. 2007, 64, 4506–4513. [Google Scholar] [CrossRef]
  56. Wang, M.J.; Zhao, K.; Xue, M.; Zhang, G.F.; Liu, S.; Wen, L.; Chen, G. Precipitation microphysics characteristics of a Typhoon Matmo rainband after landfall over eastern China based on polarimetric radar observations. J. Geophys. Res. Atmos. 2016, 121, 12415–12433. [Google Scholar] [CrossRef]
  57. Ai, Y.; Li, W.; Meng, Z.; Li, J. Life Cycle Characteristics of MCSs in Middle East China Tracked by Geostationary Satellite and Precipitation Estimates. Mon. Weather Rev. 2016, 144, 2517–2530. [Google Scholar] [CrossRef]
Figure 1. Display of the study area and its surrounding terrain. The black box area is the study area (27−34° N, 113−122° E).
Atmosphere 16 00886 g001
Figure 2. The time distribution of heavy rainfall in the YHRV region during the developing, mature, and dissipating stages for convective (a) and stratiform (b) precipitation. The time is Beijing Time (BJT).
Atmosphere 16 00886 g002
Figure 3. Normalized frequency contoured plots using an altitude diagram showing the frequency distribution of the equivalent radar reflectivity factor for convective heavy rainfall during its developing (a), mature (b), and dissipating (c) stages, and stratiform heavy rainfall during its developing (d), mature (e), and dissipating (f) stages. The solid line represents the average, and the dashed lines represent the 10th and 90th percentiles.
Atmosphere 16 00886 g003
Figure 4. The average Dm values of total heavy rainfall (a), convective heavy rainfall (b), and stratiform heavy rainfall (c) vary with height; the average dBNw values of total heavy rainfall (d), convective heavy rainfall (e), and stratiform heavy rainfall (f) vary with height. The yellow lines represent the developing stage of heavy rainfall, the blue lines represent the mature stage, and the purple lines represent the dissipating stage.
Atmosphere 16 00886 g004
Figure 5. Two-dimensional probability density distributions of Dm versus dBNw above the freezing level for: (ac) convective heavy rainfall and (df) stratiform heavy rainfall during their (a,d) developing, (b,e) mature, and (c,f) dissipating stages.
Atmosphere 16 00886 g005
Figure 6. The two-dimensional contoured frequency of ΔDm versus Dm for convective heavy rainfall during different stages at altitudes of 8 km (a,d,g), 5 km (b,e,h), and 2 km (c,f,i). The dashed line represents the boundary between the increase and decrease of Dm. The first row represents the developing stage, the second row represents the mature stage, and the third row represents the dissipating stage.
Atmosphere 16 00886 g006
Figure 7. The two-dimensional contoured frequency of ΔDm versus Dm for stratiform heavy rainfall during different stages at altitudes of 8 km (a,d,g), 5 km (b,e,h), and 2 km (c,f,i). The dashed line represents the boundary between the increase and decrease of Dm. The first row represents the developing stage, the second row represents the mature stage, and the third row represents the dissipating stage.
Atmosphere 16 00886 g007
Figure 8. The relationship between near-surface microphysics and rainfall at different stages. (a) The relationship between near-surface average Dm and rainfall rate for convective heavy rainfall, (b) the relationship between near-surface average dBNw and rainfall rate for stratiform heavy rainfall, (c) the relationship between near-surface average Dm and rainfall rate for convective heavy rainfall, (d) the relationship between near-surface average dBNw and rainfall rate for stratiform heavy rainfall.
Atmosphere 16 00886 g008
Figure 9. (a) Distribution of IWP for convective heavy rainfall across different stages. (b) Distribution of IWP for stratiform heavy rainfall across different stages, (c) distribution of LWP for convective heavy rainfall across different stages, (d) distribution of LWP for stratiform heavy rainfall across different stages.
Atmosphere 16 00886 g009
Figure 10. (a) Distribution of PEI for convective heavy rainfall at different stages, (b) distribution of PEI for stratiform heavy rainfall at different stages.
Atmosphere 16 00886 g010
Table 1. Statistics on the occurrence of convective and stratiform precipitation, and the average surface rainfall rate during different stages of Meiyu heavy rainfall in the YHRV region.
DevelopingMatureDissipating
Convective precipitation occurrence (%)42.255.456.0
Average surface rainfall rate of convective (mm/h)25.6626.3025.81
Stratiform precipitation occurrence (%)57.844.644.0
Average surface rainfall rate of stratiform (mm/h)16.1516.2815.55
Disclaimer/Publisher’s Note: The statements, opinions and data contained in all publications are solely those of the individual author(s) and contributor(s) and not of MDPI and/or the editor(s). MDPI and/or the editor(s) disclaim responsibility for any injury to people or property resulting from any ideas, methods, instructions or products referred to in the content.

