3.1. Typhoon Marie (06 W)
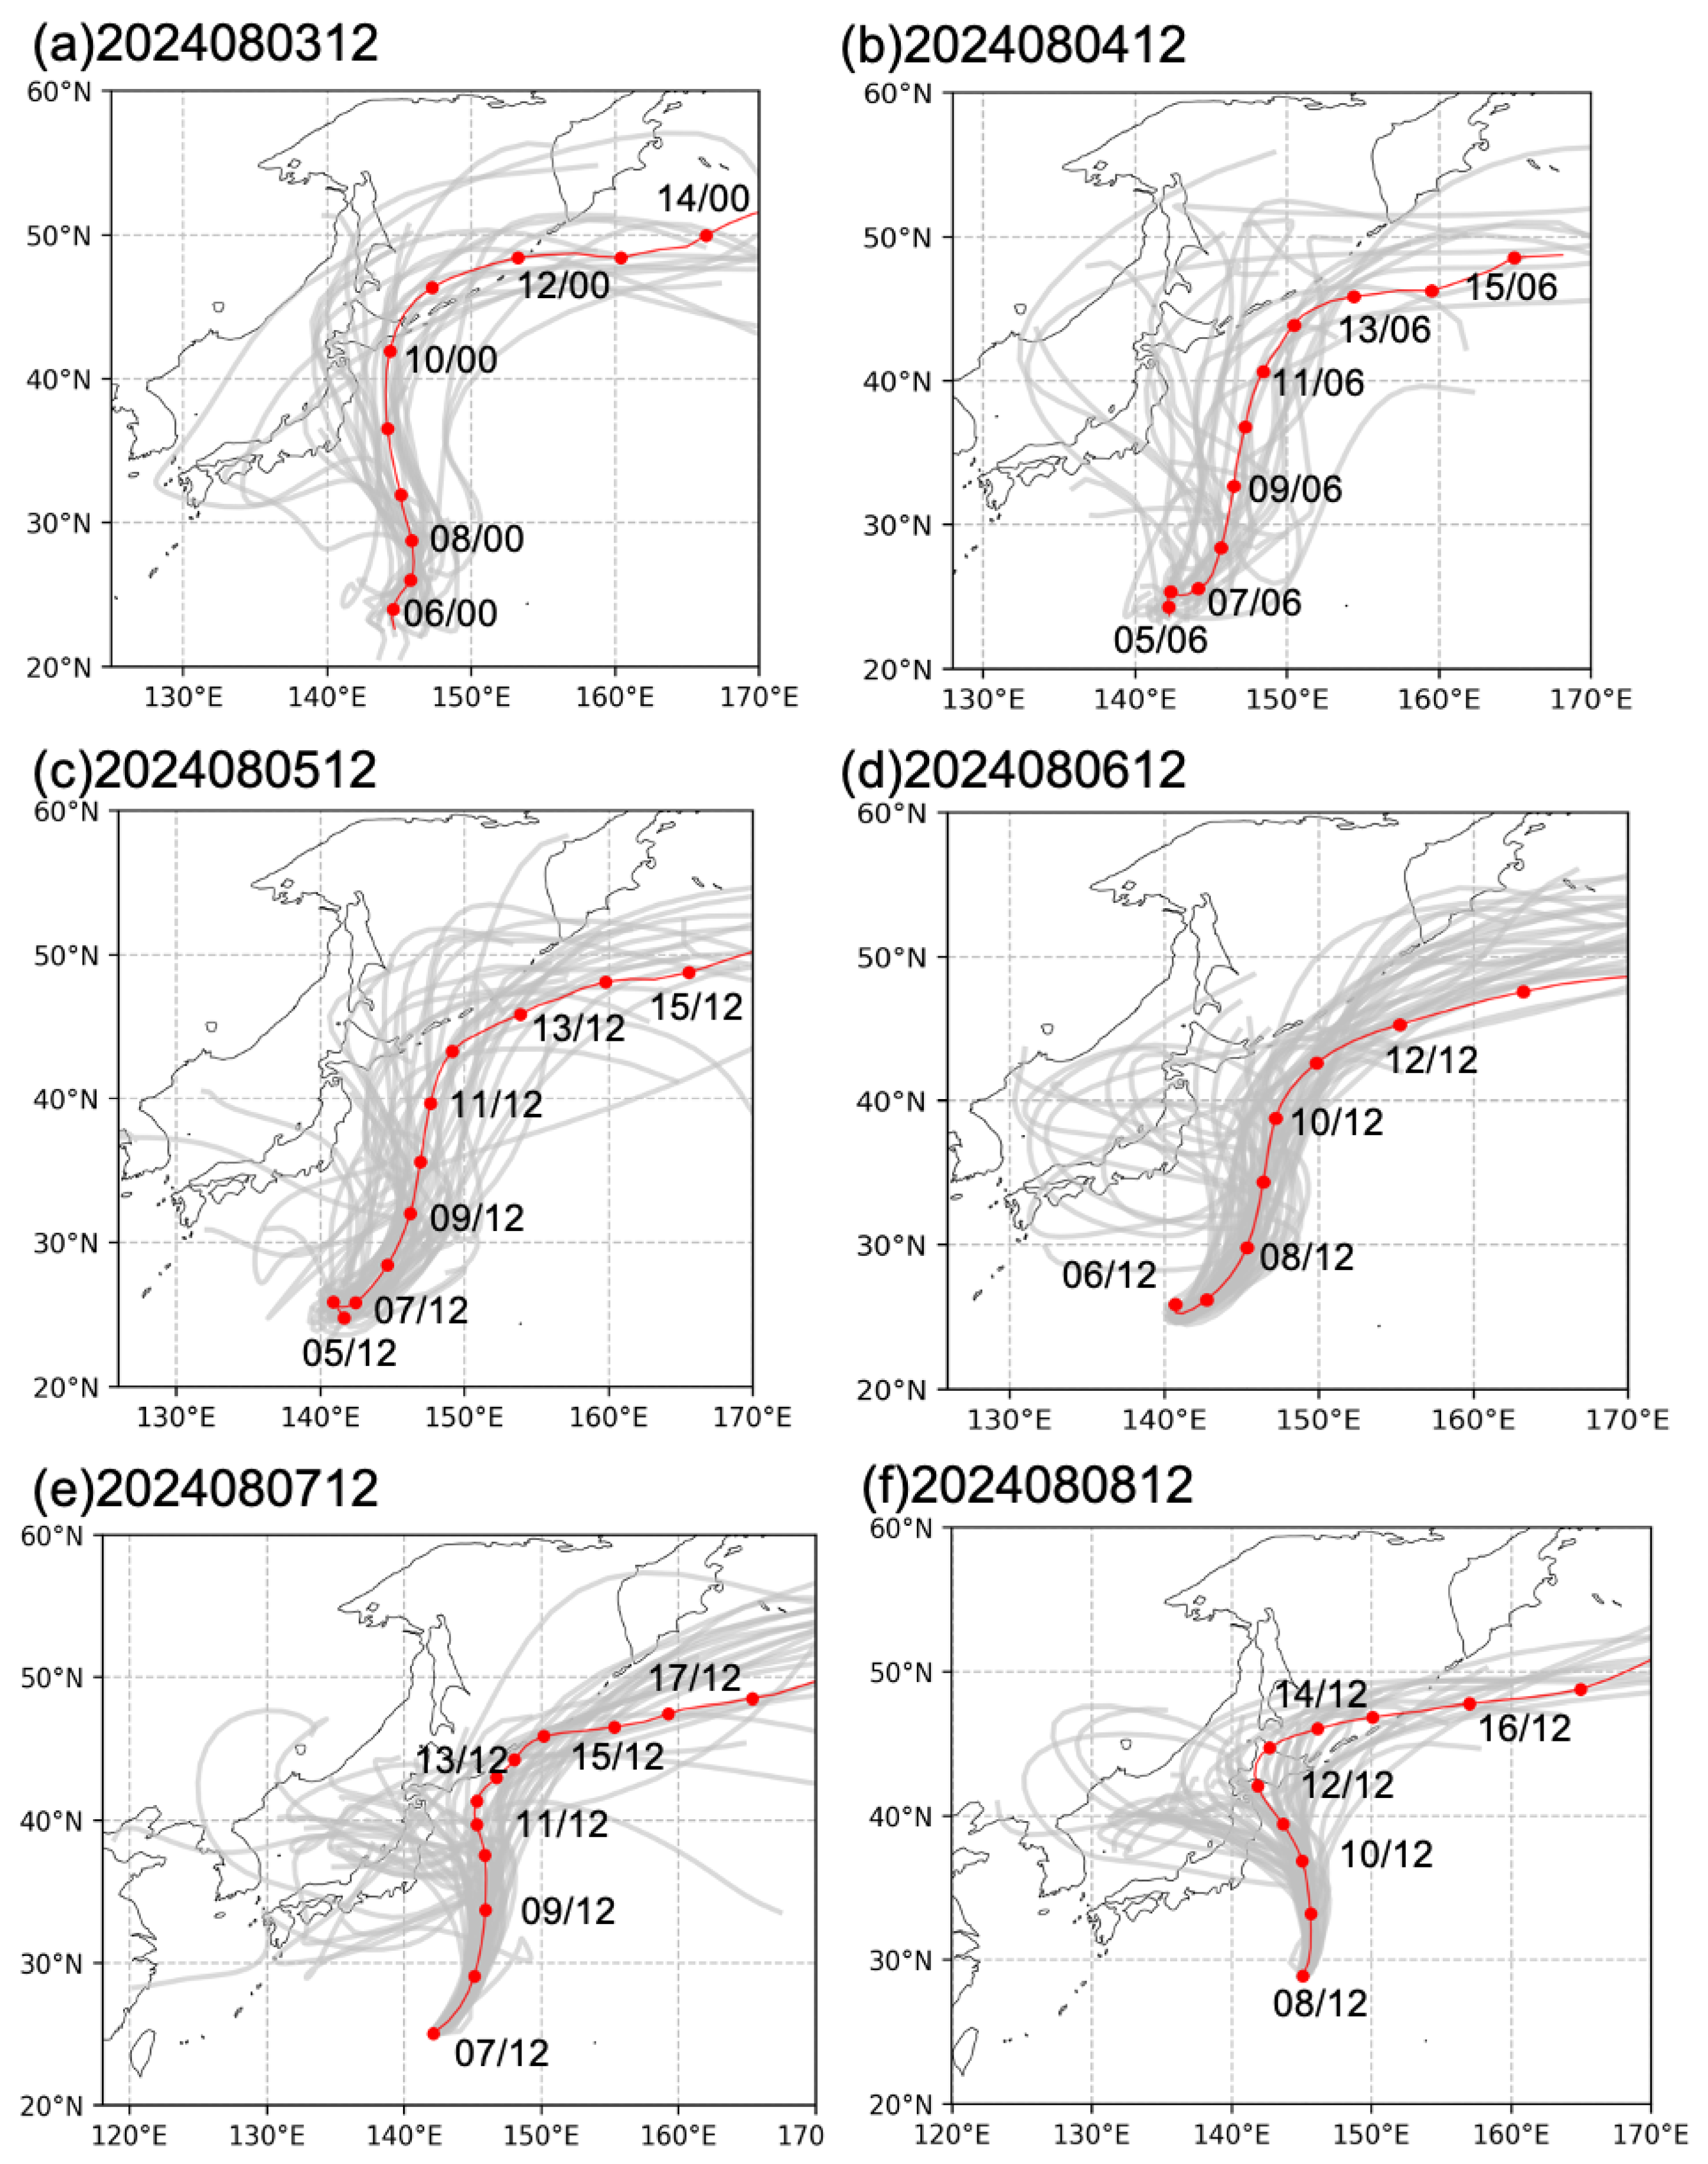
According to the JTWC WBT, TD Marie (06 W) did not start until 00:00 UTC on 7 August near 25.0° N, 141.0° E. In pursuit of our first objective to provide earlier guidance, the 12:00 UTC 3 August ECEPS WMVM forecast predicted that pre-Marie would start at 00:00 UTC on 6 August (Day 2.5) near 24° N, 144° E (
Figure 3a). While the latitudinal spread at 00:00 UTC on 7 August in that ECEPS track forecast included 25° N, the WMVM track was displaced about four degrees to the east of the future Marie 00:00 UTC 7 August position. Nevertheless, the JTWC might have wanted to monitor the disturbance because this WMVM track forecast passed near northern Japan around 00:00 UTC on 10 August (Day 6.5). Even without an initial position adjustment by four degrees to the west, northern Japan was within the ECEPS track forecast spread (
Figure 3a). Furthermore, the future Marie then recurved sharply to the east and might have persisted until at least 00:00 UTC on 14 August (Day 10.5), which is consistent with our second objective to provide extended track forecast guidance.
The 12:00 UTC 4 August ECEPS forecast in
Figure 3b had pre-Marie starting at 06:00 UTC on 5 August (Day 0.75) near 24° N, 142° E. The WMVM-predicted 00:00 UTC 7 August position was near the 25° N starting latitude according to the JTWC WBT. However, the WMVM-predicted 00:00 UTC 7 August longitude was around 144° E, which is too far to the east. The large longitudinal spread in the initial positions in this ECEPS forecast led to such a large WMVM track forecast spread that the forecaster would have little confidence in the forecast, but as suggested above, the forecaster was to continue to monitor the pre-Marie disturbance. The 12:00 UTC 5 August ECEPS forecast (
Figure 3c) had pre-Marie starting at that time (Day 0) at almost the exact position (25° N, 141° E) where the JTWC would later have the WBT of Marie start at 00:00 UTC on 7 August. Because pre-Marie was predicted to be quasi-stationary for that 36 h period, the Day 1.5 forecast position was only two degrees longitude to the east of the verifying position. The early track forecast spread was smaller than in
Figure 3b until a track bifurcation was predicted at around 12:00 UTC on 9 August. Note that the western bifurcation track cluster correctly predicted Marie’s challenging turn toward northern Japan in
Figure 1. However, the ECEPS WMVM track forecast continued to the north beyond 35° N and predicted an early and erroneous recurvature instead of a decay over the northern Japan Sea.
The initial position and the 12:00 UTC 8 August forecast position in the 12:00 UTC 6 August ECEPS forecast (
Figure 3d) were quite accurate. Instead of a track forecast bifurcation with the western track cluster passing over northern Japan as in
Figure 3c, this forecast had about 10 ensemble member tracks spinning off to the west to pass over Japan. Such an unusual track spread would be very challenging to interpret by the forecaster. Similarly, the 12:00 UTC 7 August ECEPS track forecast spread (
Figure 3e) would be challenging to interpret. However, there were more ensemble member tracks that spun off to pass over central to northern Japan. It was not until 12:00 UTC on 8 August (36 h after the first detection of Marie in the JTWC WBT) that a well-defined track forecast bifurcation had the western track cluster passing over northern Japan and decaying over the Japan Sea (
Figure 3f). While the ECEPS WMVM track forecast did pass near northern Japan, it then incorrectly favored the eastern track cluster and sharply recurved to the east.
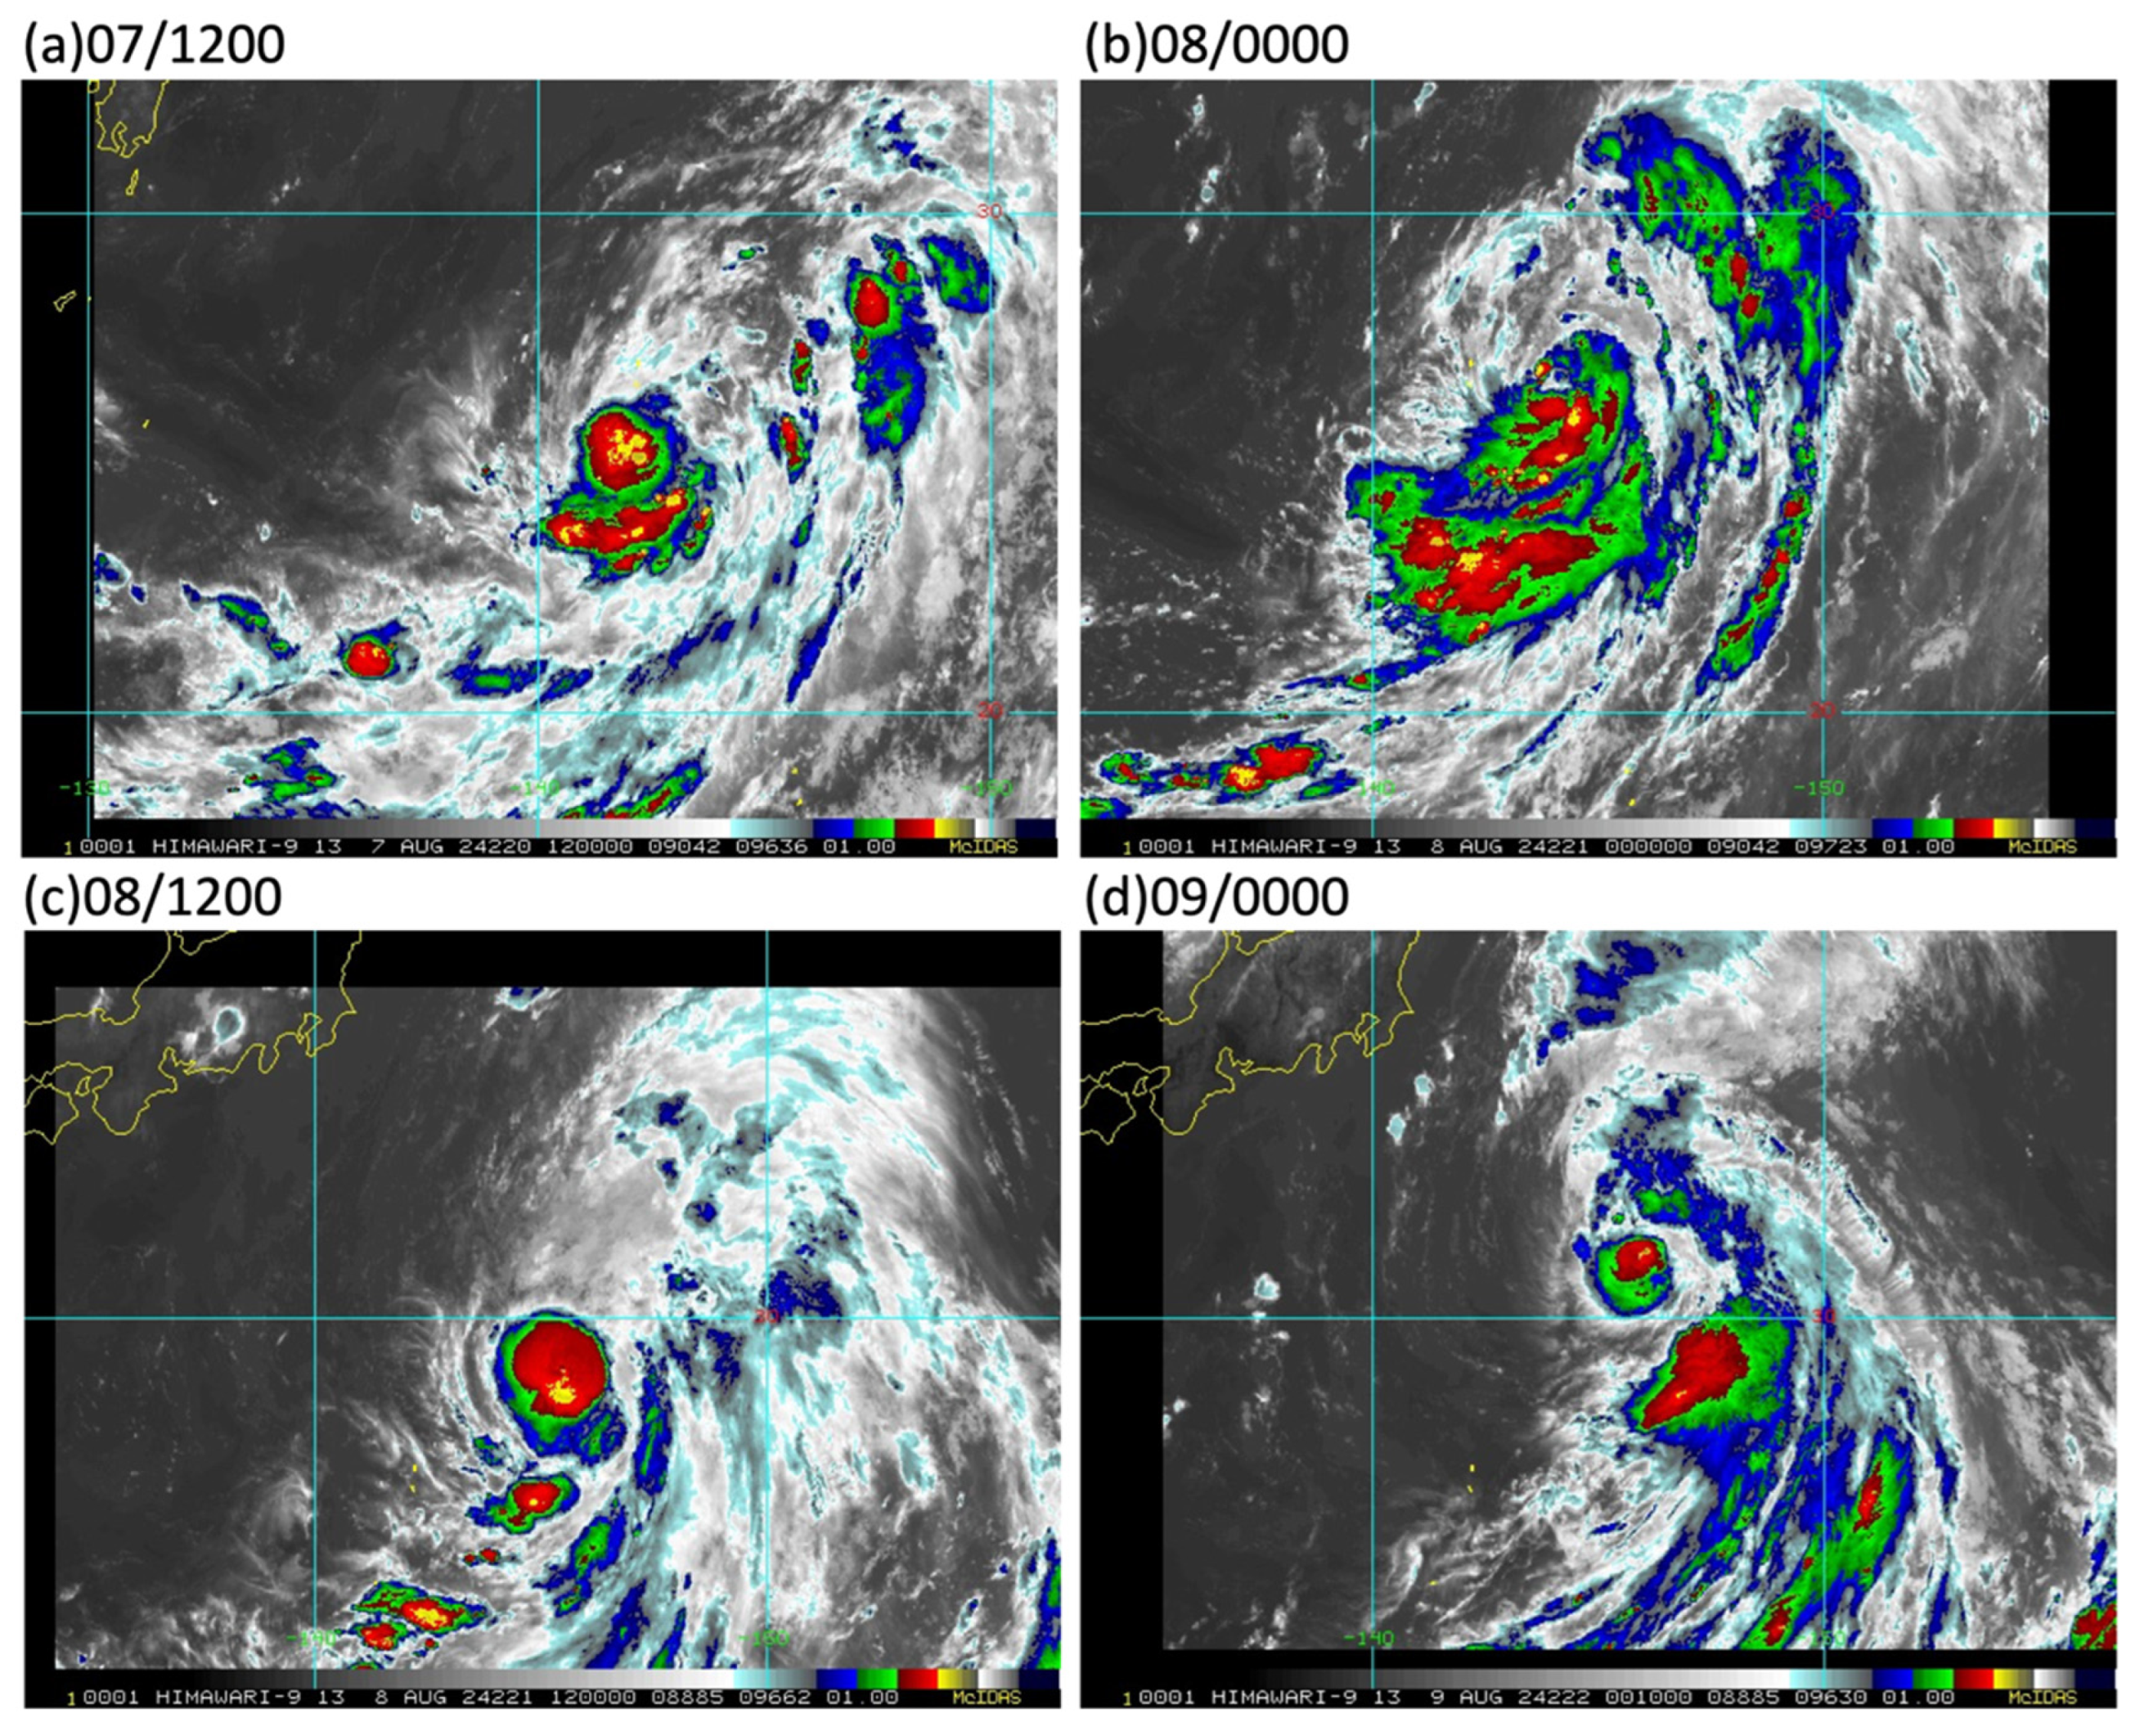
To further examine Marie’s (06 W) intensity forecast challenge, a sequence of 12-hourly Himawari-9 infrared images are presented in
Figure 4. At 12:00 UTC on 7 August (
Figure 4a), when the unadjusted JTWC WBT intensity digitized to the nearest 5 kt was 30 kt (
Table 2, bottom values within brackets) and the adjusted WBT intensity was 35 kt (
Table 2, top value), an outer rainband to the south appeared to be wrapping around the central deep convection region. At 00:00 UTC on 8 August (
Figure 4b), the central deep convection translated to the east–northeast and weakened, and the southern rainband intensified and expanded to the south. Just 12 h later (
Figure 4c), the central deep convection reorganized; according to the JTWC WBT, the center was near 28.8° N, 145.4° E, and a rapid intensification of 20 kt in 12 h occurred. Following the CIMSS ADT + AIDT adjustment, Marie’s intensification was from 41 kt to 54 kt, which was the peak intensity at 12:00 UTC on 8 August (
Table 2, top row). At 00:00 UTC on 9 August (
Figure 4d), Marie became a small isolated vortex near 30.8° N, 145.9° E with an intensity of 65 kt, according to the JTWC WBT. Given the ECEPS and most of the other JTWC intensity forecasts’ agreement with the adjusted WBT intensities in
Table 2, we conclude the ADT + AIDT intensity of 52 kt was the more accurate validation intensity. Therefore, we conclude that the JTWC intensity forecasts from 00:00 UTC and 12:00 UTC on 8 August in
Table 2 were overpredictions.
Although there was some uncertainty in the adjusted WBT intensities used for the validation of the ECEPS and the JTWC intensity forecasts in
Table 2, we conclude that Marie likely was not a typhoon. All of the ECEPS intensity forecasts and the first five JTWC forecasts in
Table 2 appear to be quite accurate relative to these adjusted WBT intensities. The intensity forecast challenge for Marie was that it was not as intense as climatologically expected for a TC in August with Marie’s track in
Figure 3a. The explanation offered here is that Marie’s formation, track, and intensification were all negatively impacted by an unfavorable external environment north of 20° N, which needs to be further studied to improve TC warnings in the western North Pacific.
3.2. Typhoon Ampil (08 W)
According to the JTWC WBT, TD Ampil (08 W) started only five days after Marie (06 W) (
Table 1) and only about five degrees longitude to the west (
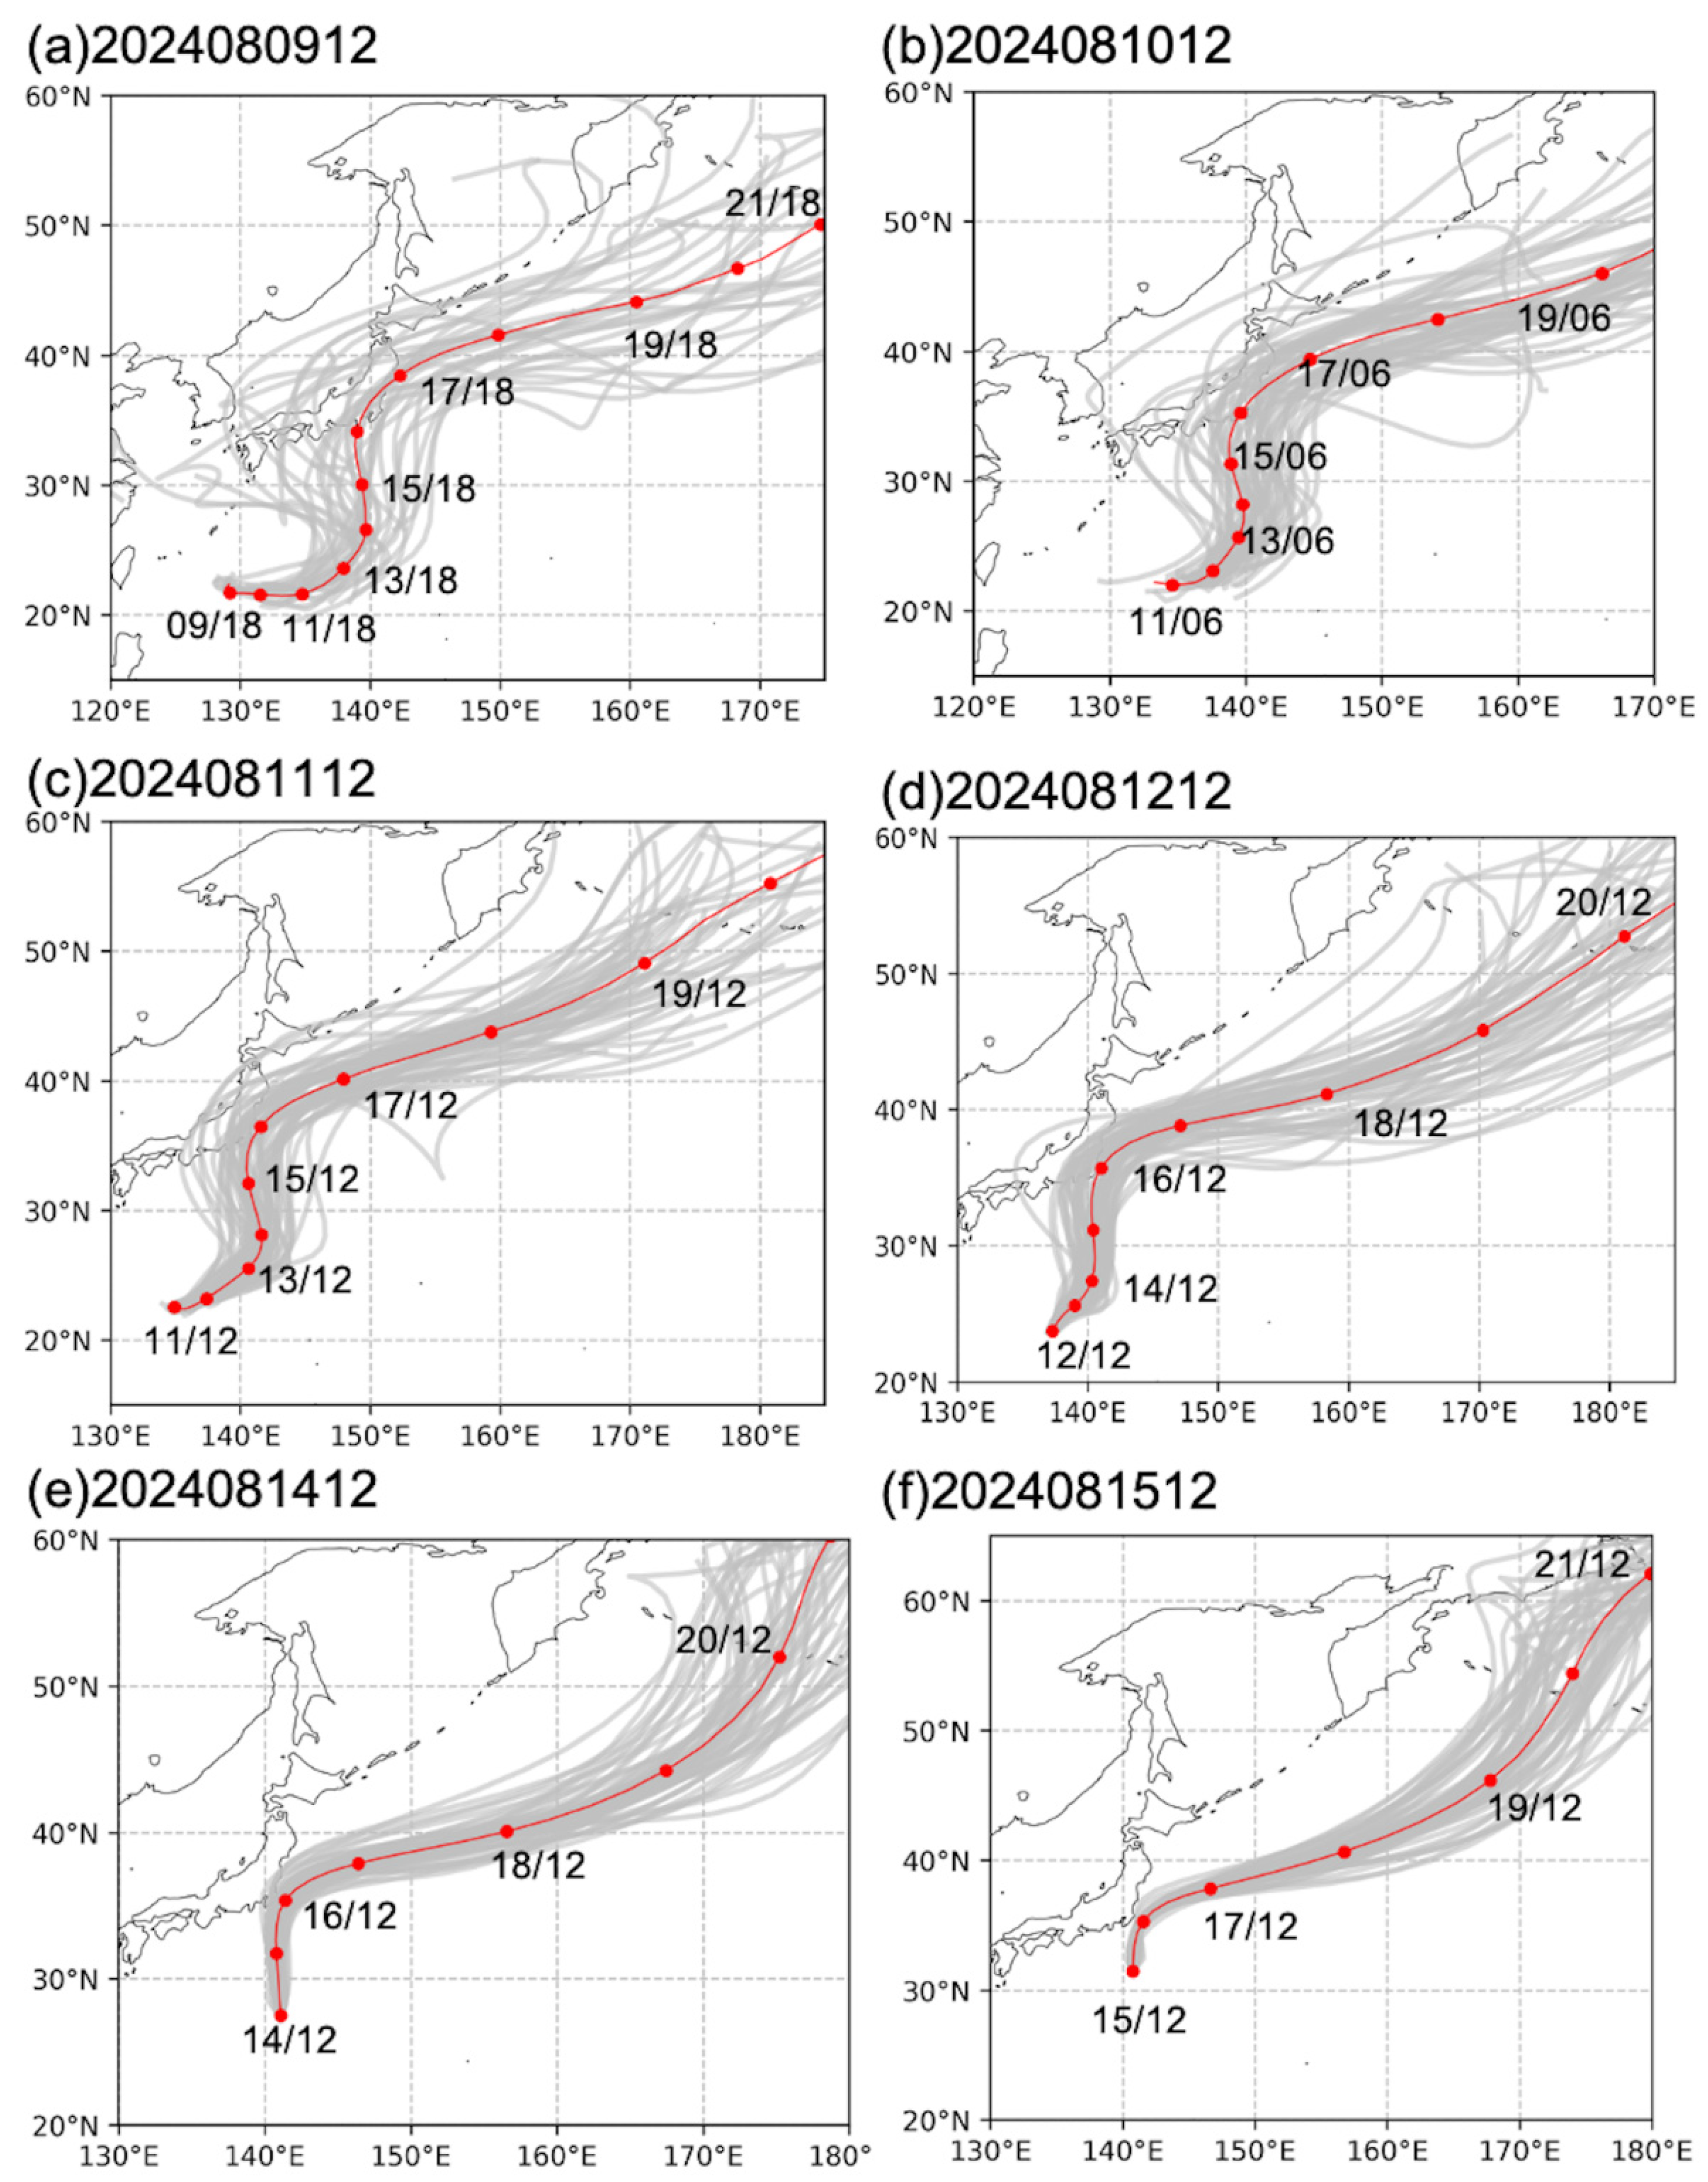
Figure 1). The track forecasting challenges were that Ampil first moved to the northeast to pass near where Marie had started, but then at 140° E sharply turned poleward to around 35° N, where it turned to the east–northeast. The JTWC WBT did not have Ampil start until 12:00 UTC on 12 August near 23.6° N, 136.7° E. Our early guidance objective was achieved, as the pre-Ampil disturbance had been detected in the 12:00 UTC 9 August ECEPS forecast as starting near 22° N, 129° E (
Figure 5a). The ECEPS forecast position at 12:00 UTC on 12 August was near 22° N, 135° E, which is to the southwest of the JTWC WBT starting position. Nevertheless, the ECEPS Ampil WMVM track forecast turned poleward along 140° E, and then around 35° N turned to the east–northeast just as with Ampil’s track in
Figure 1. There was a large track forecast spread after the turn poleward around 18:00 UTC on 13 August (Day 4.0) and again after the turn to the east–northeast around 1800 UTC on 17 August (Day 8.0). This ECEPS forecast, therefore, provided excellent earlier and later guidance than the five-day JTWC forecasts that began at 12:00 UTC on 12 August. To demonstrate that the 12:00 UTC 9 August ECEPS WMVM track forecast was not just one lucky forecast, the next five ECEPS track forecasts are also provided in
Figure 5. In the 12:00 UTC 10 August forecast (
Figure 5b), Ampil was predicted to start at 06:00 UTC on 11 August and be near 23.1° N, 137.5° E at 12:00 UTC on 12 August when the first JTWC WBT position was near 23.6° N, 136.7° E. Similarly, the poleward path along 140° E to 35° N and the turn to the east–northeast were accurately predicted. Note also that the ECEPS forecast spread was markedly reduced to the point that the forecaster could be more confident that Ampil would pass just offshore of mainland Japan. Similar comments apply to the 12:00 UTC 11 August ECEPS WMVM track forecast in
Figure 5c, which is 24 h prior to the start of Ampil (08 W) in the JTWC WBT. One negative feature was that the track forecast spread was increased, and now mainland Japan was within that track spread.
While the 12:00 UTC 12 August ECEPS track forecast spread in
Figure 5d was smaller, the 12:00 UTC 16 August WMVM position was still offshore of mainland Japan, so the forecaster could be confident in alerting the community as to the likely wind impacts. Note that the ECEPS predicted large translation speeds, which would be a favorable aspect of those likely wind impacts, since the strongest winds would be offshore. Unfortunately, the 12:00 UTC 13 August ECEPS forecast was not available. However, the early track forecast spread in the 12:00 UTC 14 August forecast (
Figure 5e) had been incredibly small until Ampil was predicted to pass very near mainland Japan and then turn to the east–northeast as the ECEPS had been predicting since 12:00 UTC on 9 August (
Figure 5a). Finally, the 12:00 UTC 15 August ECEPS forecast (
Figure 5f) completed this sequence of highly consistent predictions that Ampil would pass just offshore of mainland Japan with almost near-zero track forecast spread.
According to the JTWC WBT, Ampil had quickly reached an intensity of 40 kt by 00:00 UTC on 13 August and slowly intensified to a TY at 12:00 UTC on 14 August near 27.6° N, 141.1° E. Intensification continued steadily to a peak intensity of 105 kt at 12:00 UTC on 16 August just offshore of mainland Japan near 30.0° N, 142.0° E. As for Jebi’s case in
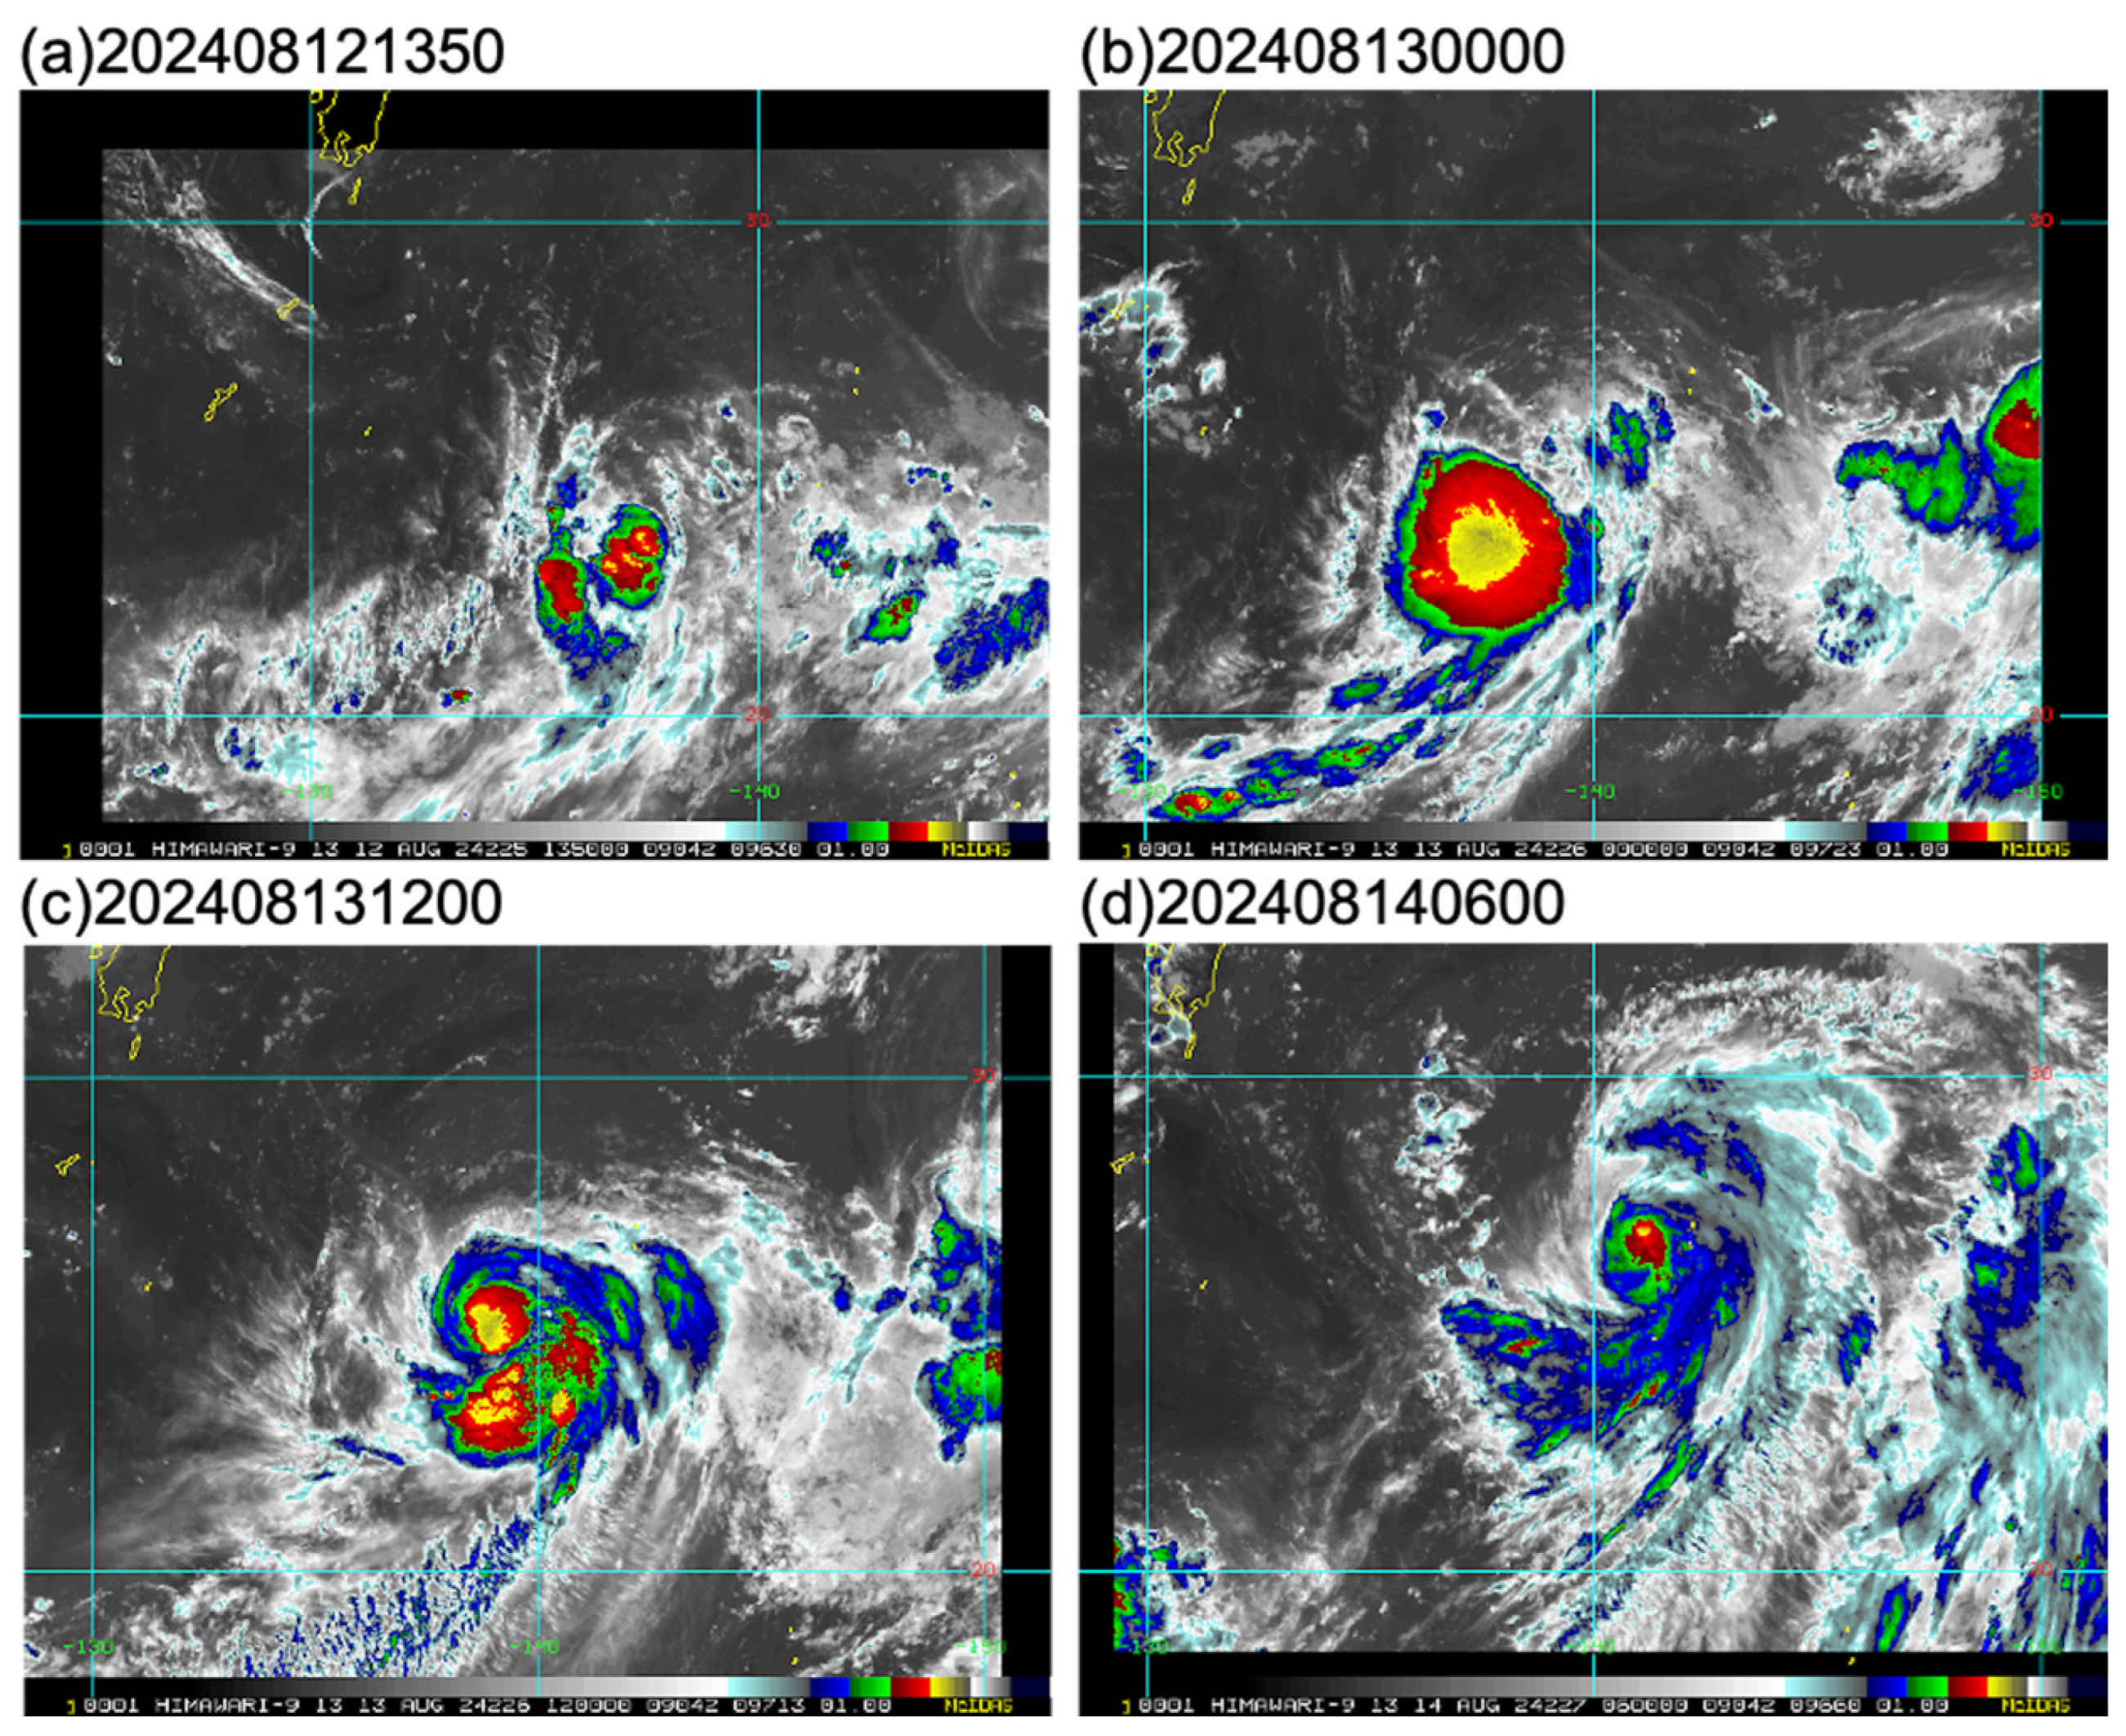
Section 2, Ampil was another case in which the CIMSS SATCON intensity summary provided by Chris Velden had a markedly different intensification according to the ADT + AIDT based on the Himawari-9 infrared satellite. Because of the importance of specifying the timing of 60 kt initial intensity at the beginning of the extreme RI, we examined the Himawari-9 infrared imagery in
Figure 6 during the slow intensification period according to the adjusted WBT in
Table 3 (top row, in brackets). The infrared imagery in
Figure 6a is at the unusual time of 13:50 UTC on 12 August, as that was the first high-density Himawari-9 imagery focused on Ampil. Note that the CIMSS ADT + AIDT intensity at 12:00 UTC on 12 August was 28 kt (
Table 3) and the first two ECEPS forecasts from 00:00 UTC and 12:00 UTC on 11 August (Rows 1 and 2 in
Table 3) predicted Ampil’s intensity would be 27 kt and 24 kt, respectively, at 12:00 UTC on 12 August.
The adjusted WBT intensities to agree with the CIMSS ADT + AIDT intensities for Ampil’s case are given in brackets in the top row in
Table 3. Rather than a quick intensification to 40 kt, the adjusted WBT increased slowly from 20 kt at 00:00 UTC on 12 August to only 34 kt at 00:00 UTC on 13 August. Ampil then intensified slowly from 46 kt at 12:00 UTC on 13 August to 60 kt at 00:00 UTC on 15 August. Thus, the real intensity forecast challenge for Ampil was the extreme rapid intensification (RI) of 43 kt in 24 h from 60 kt to a peak intensity of 103 kt at 00:00 UCT 16 on August (
Table 3). By contrast, the unadjusted JTWC WBT had already increased to 60 kt at 00:00 UTC on 14 August (one row up from the bottom row in
Table 3).
Just 10 h and 10 min later, at 00:00 UTC on 13 August (
Figure 6b), an outflow burst dome developed over Ampil that was near 24.5° N, 138.2° E, according to the JTWC WBT. The ADT + AIDT-adjusted WBT intensity at 00:00 UTC on 13 August was decreasing and only 34 kt (
Table 3, top row). At 12:00 UTC on 13 August (
Figure 6c), the deep convection pattern was highly asymmetric. The JTWC WBT had Ampil’s center at 25.5° N, 138.9° E with a non-adjusted intensity of 55 kt. The deep convection associated with that Ampil center was smaller than the deep convection associated with an outer rainband to the south. Furthermore, there was another weaker, deep-convection region associated with another outer rainband in the southeast quadrant. According to the CIMSS ADT + AIDT, Ampil’s intensity only increased to 46 kt rather than the 55 kt in the non-adjusted WBT intensity. It is noteworthy that the 00:00 UTC 11 August ECEPS forecast that accurately predicted the 12:00 UTC 12 August intensity was 44 kt at 12:00 UTC on 13 August, which also agreed well with the 46 kt estimate from the ADT + AIDT (
Table 3, top row, brackets).
Finally, the 06:00 UTC 14 August infrared imagery (
Figure 6d) had a small isolated vortex near 26.9° N, 140.7° E, according to the JTWC WBT. However, this infrared image was more consistent with the 51 kt adjusted WBT intensity in
Table 3 than with the non-adjusted WBT intensity of 60 kt that was used as the initial intensity for the 00:00 UTC 14 August JTWC forecast (
Table 3, second row from bottom). Thus, we assert that the adjusted WBT intensities agreeing with the CIMSS ADT + AIDT intensities based on this Himawari-9 imagery indicated an unfavorable environment in which Ampil was translating until the extreme RI began at 00:00 UTC on 15 August. This slow Ampil intensification followed by RI over the Kuroshio ocean current was similar to the TY Bebinca (14 W) intensification described in Section 3.3 in Part I [
1].
As described above, the 00:00 UTC 11 August ECEPS forecast predicted well the slow intensification period of Ampil. The key was to adjust the initial T + 12 h intensity to be the adjusted WBT intensity at that time. However, that forecast did not predict the RI of 43 kt in 24 h during 15 August (
Table 3, top row, brackets), which was not unexpected. However, a steady intensification from 67 kt to 85 kt was predicted by that 00:00 UTC 11 August ECEPS forecast. The same conclusion applies to all of the other ECEPS forecasts in
Table 3 for Ampil. In particular, the slow intensification period was well-predicted in every forecast, and more rapid intensification was predicted during the last day, but not RI. Thus, these ECEPS forecasts accomplished both our first objective of earlier forecasts than the JTWC five-day forecasts starting as a tropical depression (e.g., 12:00 UTC 12 August) or a tropical storm (e.g., 00:00 UTC 13 August). While we do not describe the up-to-14-day ECEPS forecasts after the peak intensity had occurred, our second objective of providing longer forecasts than the JTWC was achieved in this study of TY Ampil (08 W).
The first JTWC intensity forecast was from 12:00 UTC on 12 August (
Table 3). Perhaps because the intensity forecasts are digitized to the nearest five knots, the intensification rate is typically 10 kt per 12 h until typhoon intensity is reached or exceeded. Because Ampil had a slow intensification period, the JTWC forecasts tended to overpredict the intensity. Especially when the JTWC forecast started from a higher intensity than the adjusted WBT intensity, the forecast peak intensity at 00:00 UTC on 16 August was more accurate than the ECEPS forecasts, even though the JTWC also did not predict the extreme RI event on 15 August. It would be helpful to the JTWC forecaster to know what other JTWC guidance products could correctly predict the slow intensification period over the unfavorable external environment north of 20° N. Of course, those forecasts would not be accurate if they did not start from the CIMSS ADT + AIDT adjusted initial intensities.
3.3. Typhoon Shanshan (11 W)
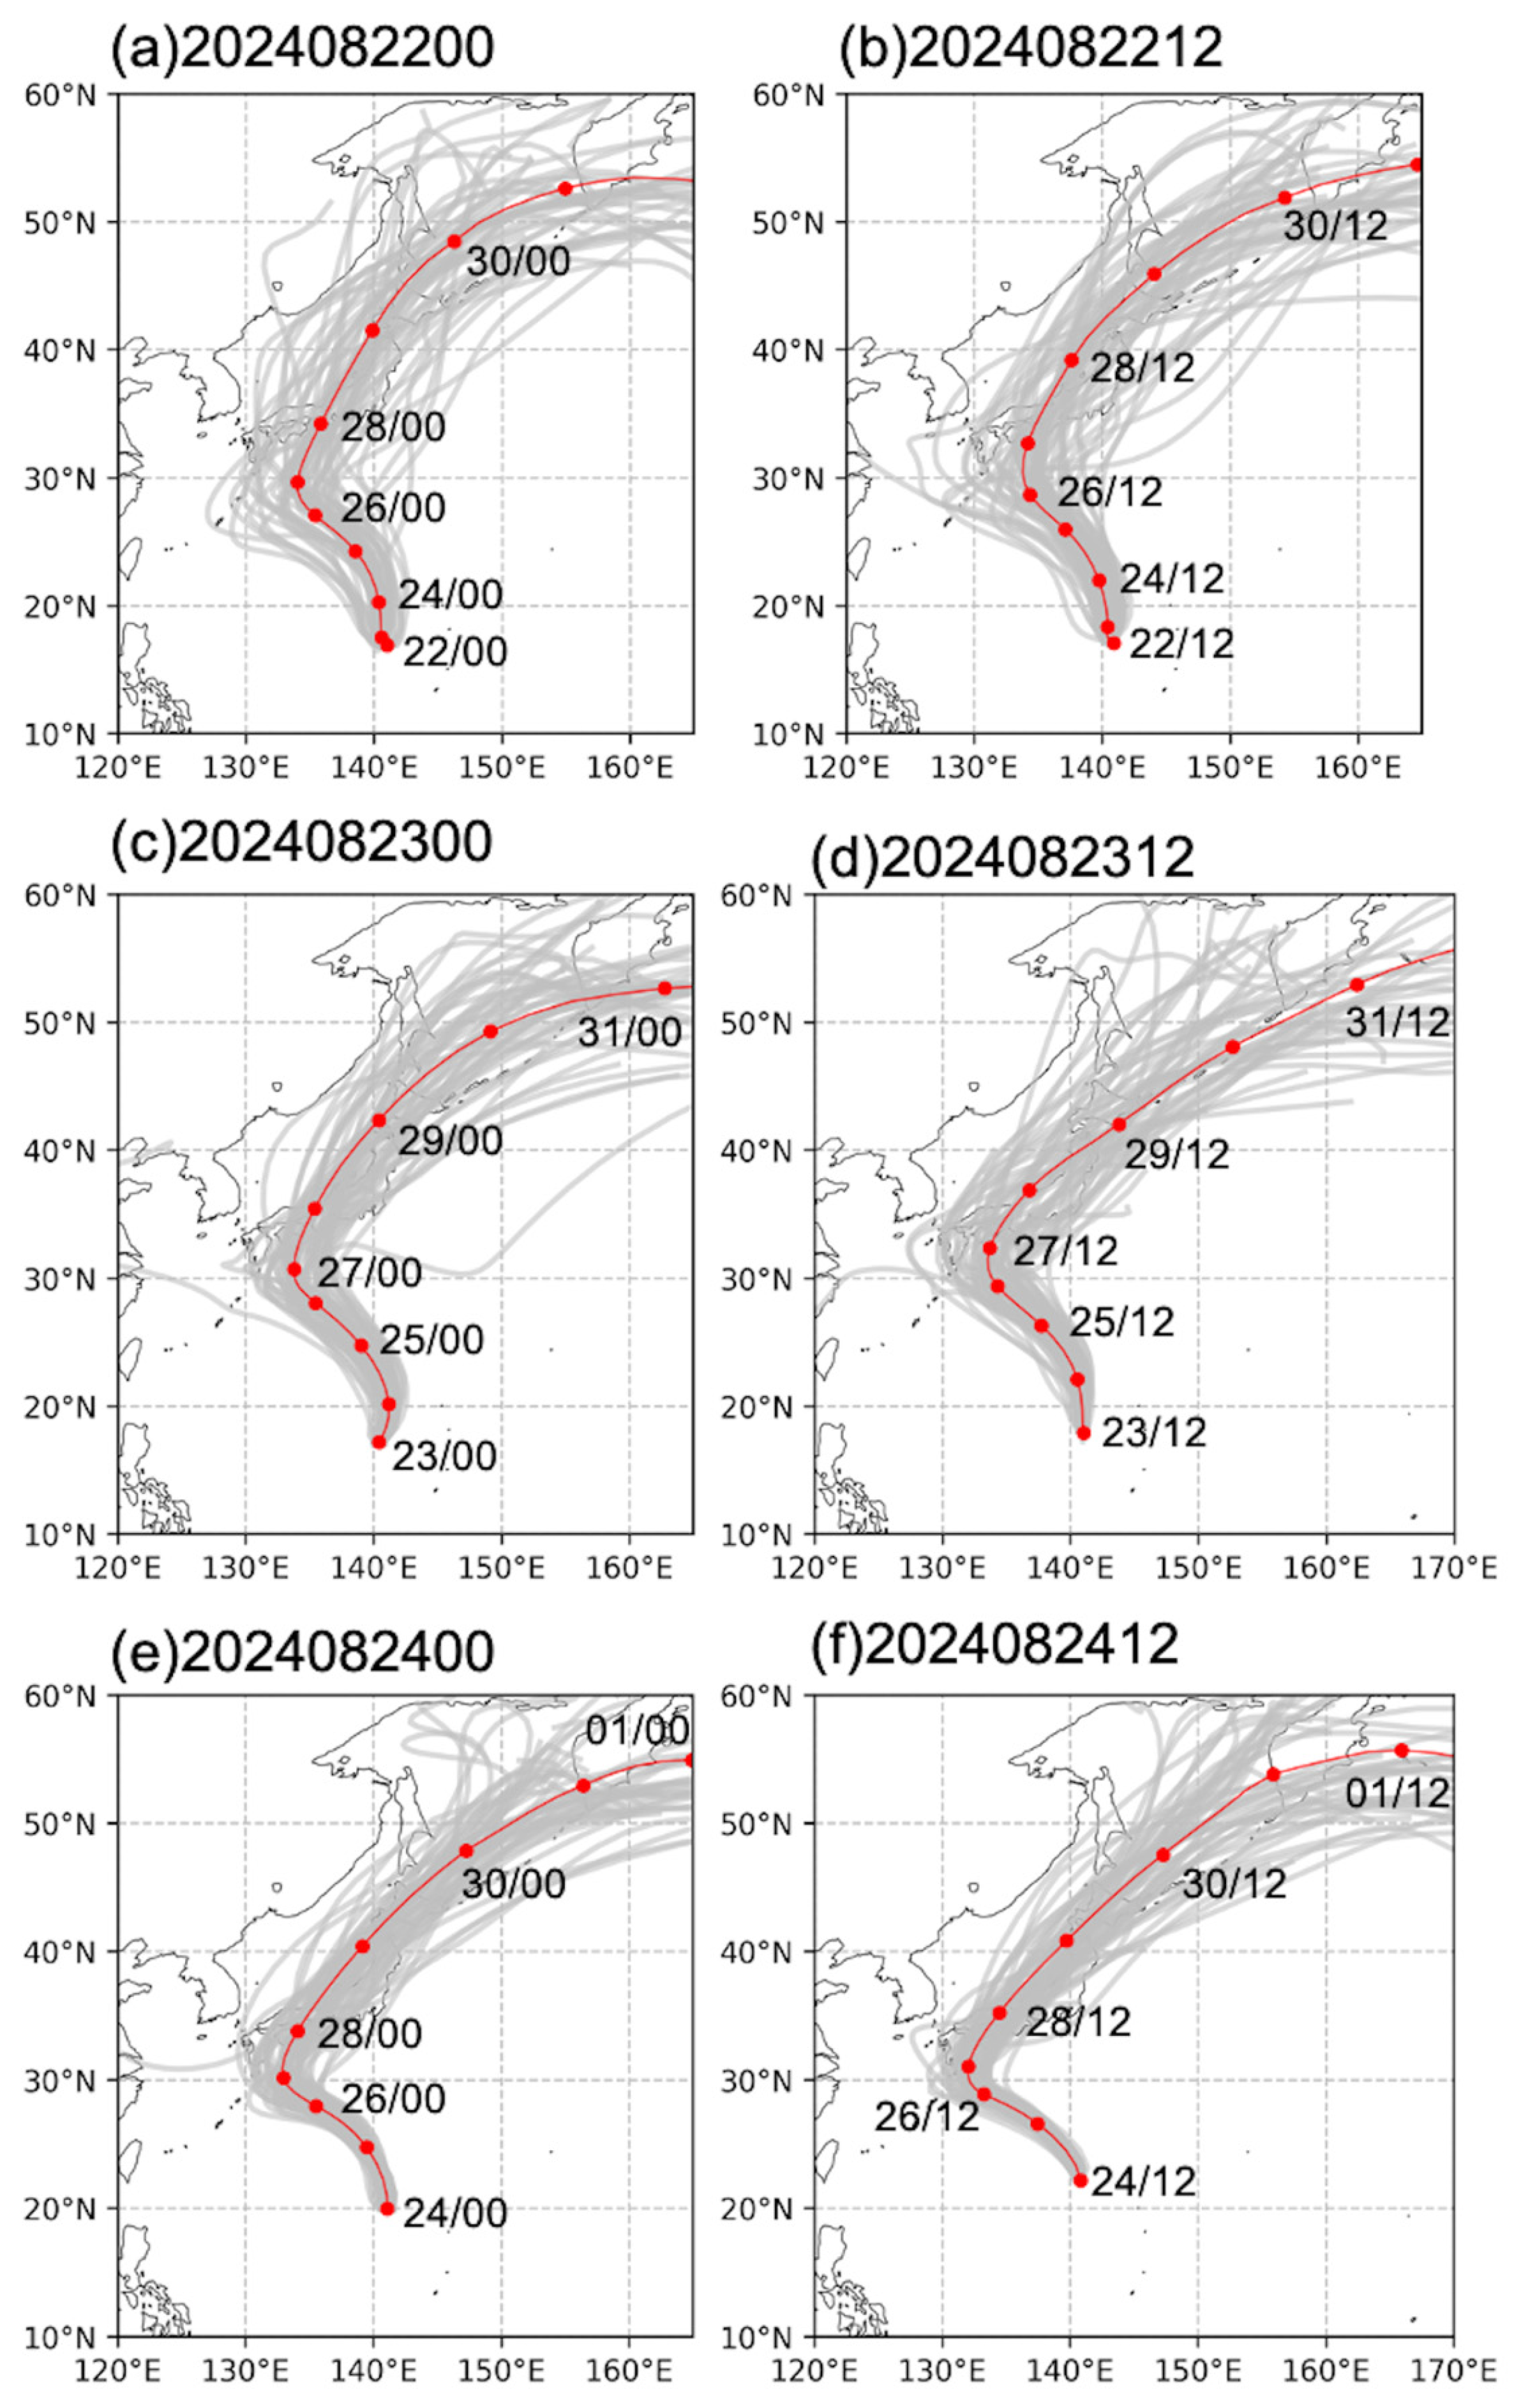
A sequence of six ECEPS track forecasts of Shanshan (11 W) is given in
Figure 7, starting with the 00:00 UTC 22 August forecast when Shanshan had already become a TS (
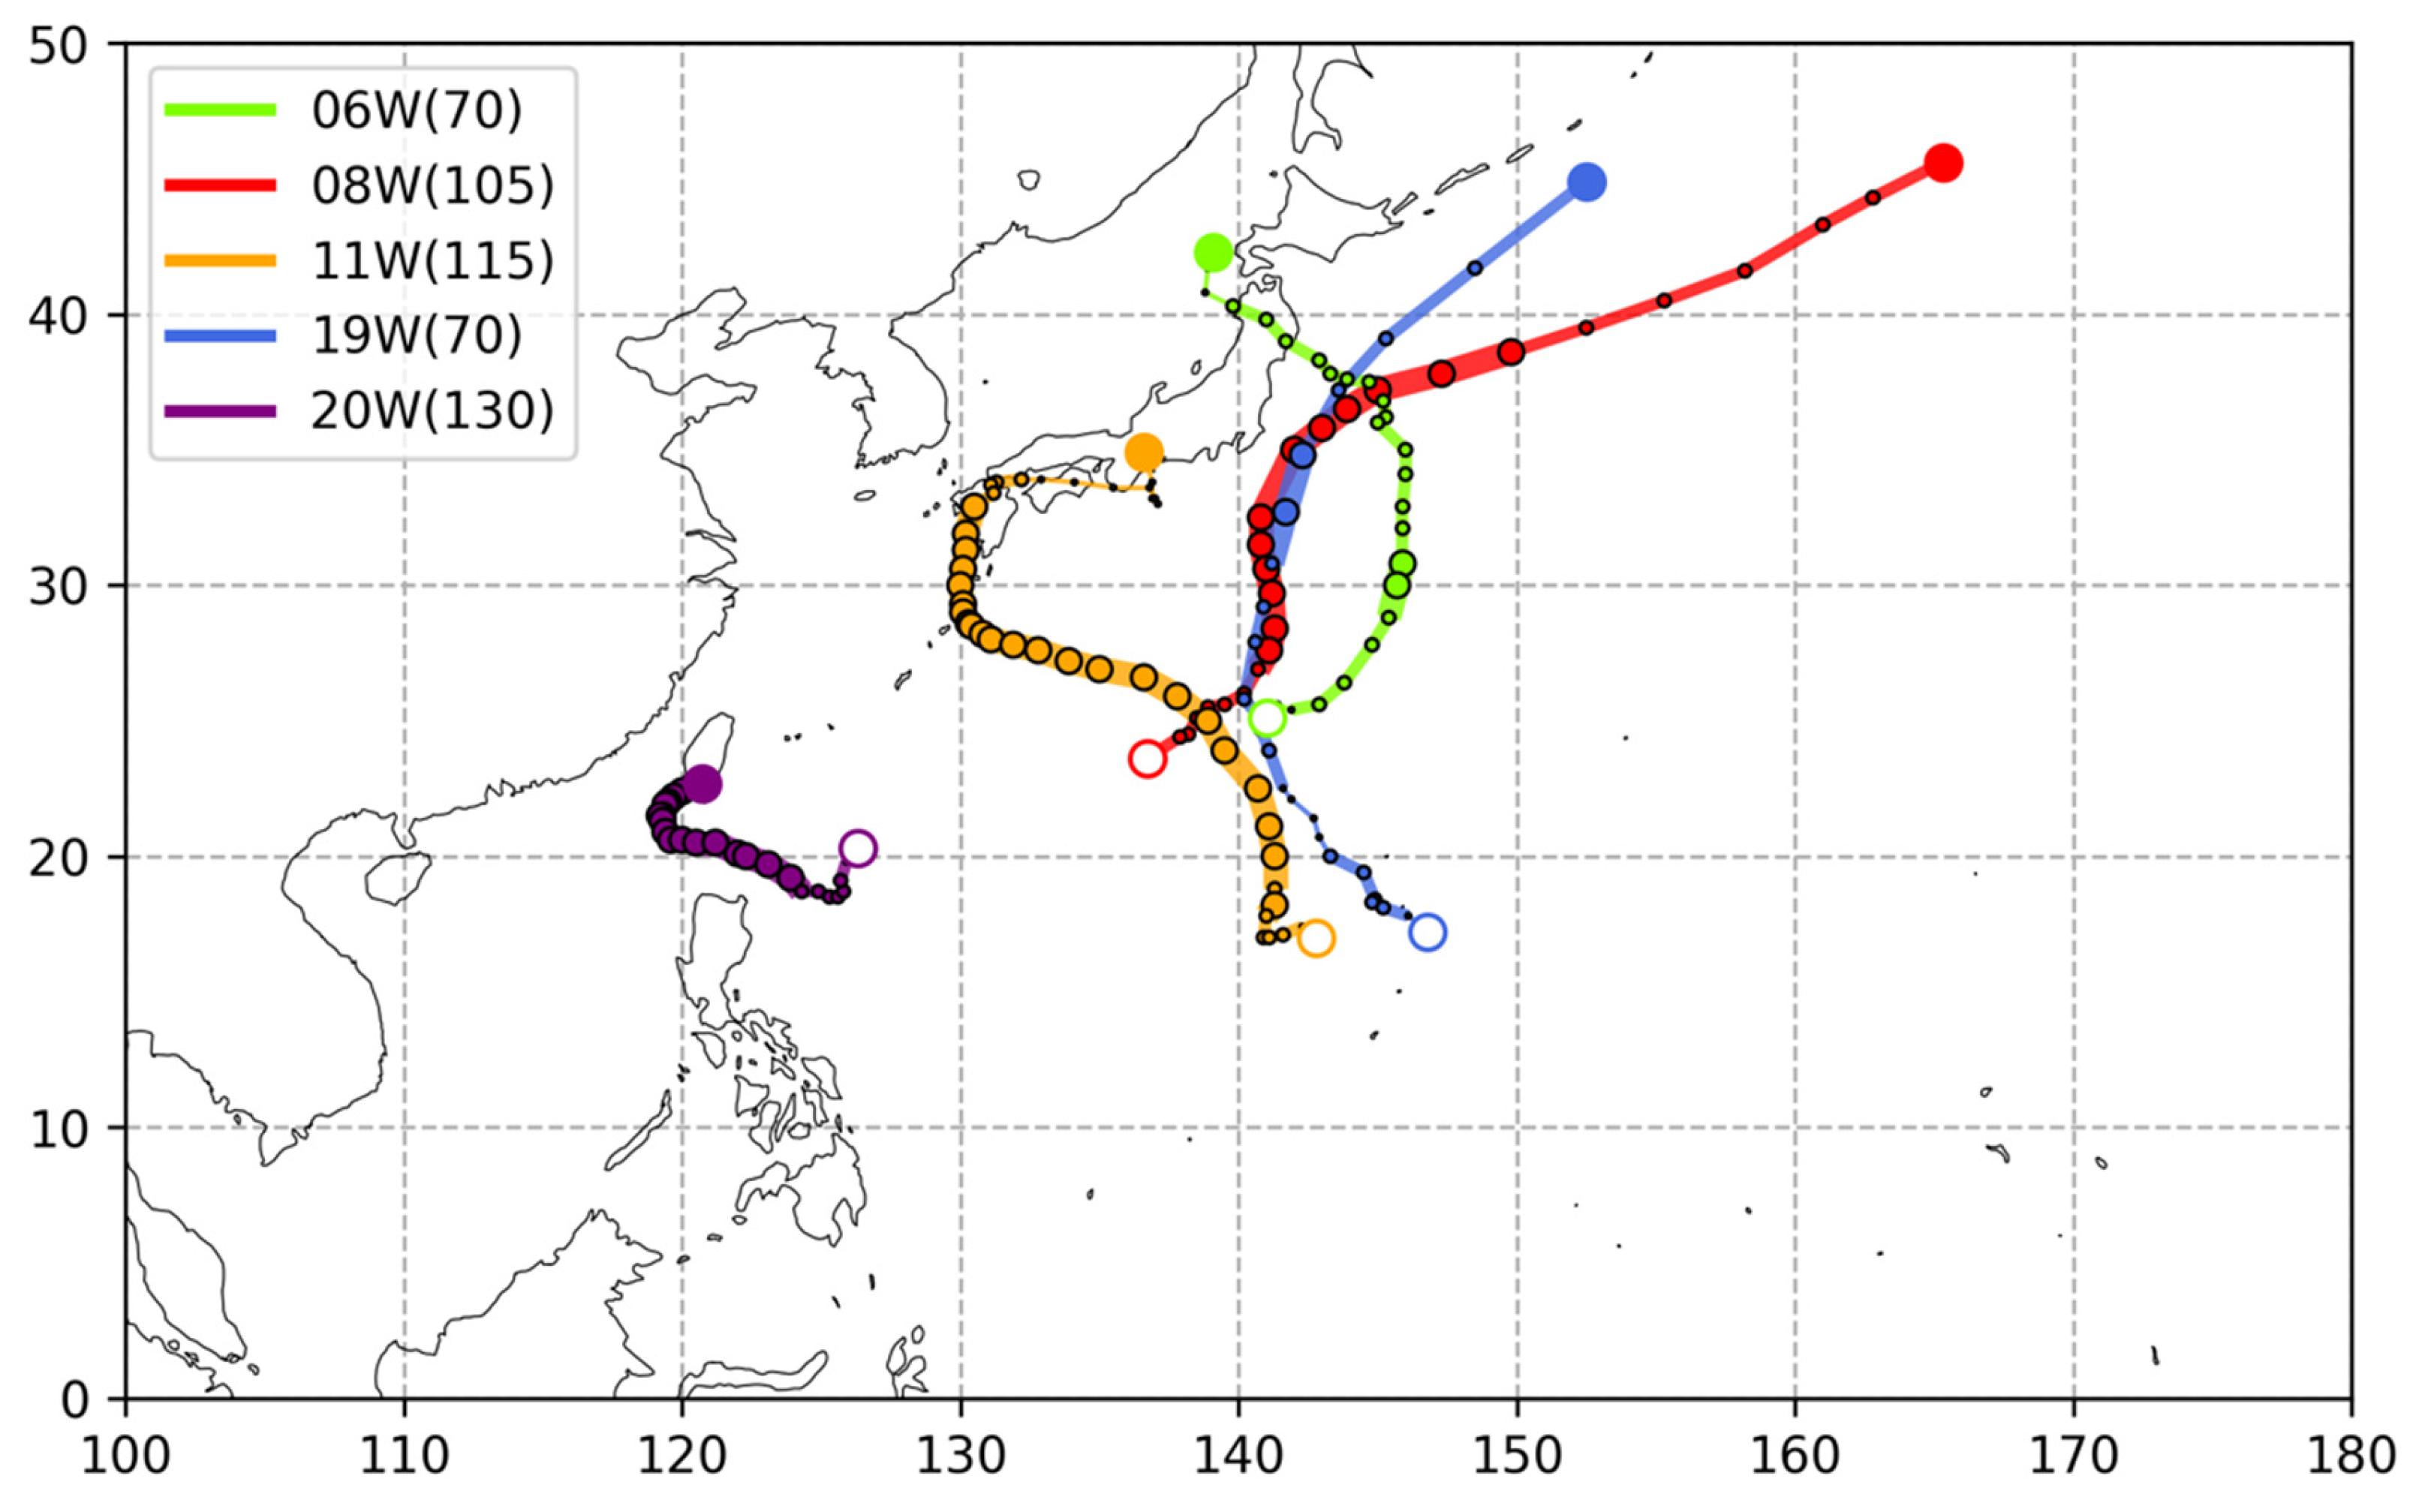
Table 1). As shown in
Figure 1, Shanshan was quasi-stationary near 17° N, 142° E before drifting to the west and then turning to the north to cross 20° N into an unfavorable external environment. As also shown with the large orange circles in
Figure 1, Shanshan had already intensified to a TY at 12:00 UTC on 23 August (
Table 1) before turning to the north. The hypothesis was that the intensity would decrease as Shanshan moved poleward across 20° N, so the timing and longitude of crossing 20° N were important variables that needed to be accurately forecast. Another important track variable for Shanshan in
Figure 1 was the timing and position of the recurvature, which is when landfall over the southern Japan islands occurred and was likely to be the peak intensity.
The 00:00 UTC 22 August ECEPS WMVM forecast (
Figure 7a, red dots) was successful in predicting the quasi-stationary period in the first 24 h, and the timing of Shanshan crossing 20° N was clearly at 00:00 UTC on 24 August. The track forecast spread increased north of 20° N, and there was then a track bifurcation. While ca. 10 ensemble member tracks in the bifurcation western track cluster were predicting an early landfall on the southern Japan islands, the large majority of ensemble member tracks were predicting a recurvature near 30° N, 134° E, which led to a landfall on the southern tip of mainland Japan around 00:00 UTC on 28 August.
Table 4 has a validation of the starting positions, the ECEPS forecasts of the timing and longitude of Shanshan crossing 20° N, and the recurvature timing and position. The starting position of Shanshan in the 00:00 UTC 22 August forecast (
Table 4, row 2) was near 16° N, 141.0° E versus the observed position of 17.1° N, 141.6° E (row 1). The ECEPS forecast of Shanshan crossing 20° N was 00:00 UTC on 24 August (Day 2.0) near 140.4° E, indicating perfect timing and reasonable accuracy in longitude given the track forecast spread at that time (
Figure 7a). The ECEPS forecast of Shanshan’s recurvature at 29.7° N was only 0.3 degrees to the south, but it was one day early (00:00 UTC on 27 August), and, more importantly, 4 degrees to the east. That is, Shanshan did not recurve until 130° E and made landfall on the southern Japan islands (
Figure 1). However, the 00:00 UTC 22 August ECEPS forecast had the recurvature at 00:00 UTC on 27 August (Day 5.0) instead of Day 6.0 and farther to the east, so the landfall was predicted on the southern mainland of Japan.
The 12:00 UTC 22 August WMVM track forecast (
Figure 7b) was also very successful in predicting the quasi-stationary period in the first 24 h, and the timing of Shanshan crossing 20° N at 00:00 UTC 24 August was also accurate (
Table 4, row 2). The early track forecast spread improved over the previous 12 h, but there were still ca. 10 ensemble member tracks that split off toward the west that then made landfall in the southern Japan islands (
Figure 7b). The disappointing feature of this 12:00 UTC 22 August forecast was that the predicted recurvature was, again, 24 h early and 3.0 degrees longitude to the east of the observed position (
Table 4, row 2 of the forecast). In the 00:00 UTC 23 August forecast (
Figure 7c), Shanshan was just beginning to move poleward, and the track forecast spread had been smaller until 00:00 UTC on 27 August (Day 4). The timing and the longitude of Shanshan crossing 20° N are perfectly predicted (
Table 4, row 3), but the predicted recurvature longitude was, again, 3.8 degrees too far to the east.
In the 12:00 UTC 23 August forecast (
Figure 7d), Shanshan’s starting position was at 17.9° N (
Table 4, column 2), and the predicted 00:00 UTC 24 August timing of the crossing of 20° N at a longitude of 141.0° E was very accurate (
Table 4, column 3). The early track forecast spread was small, but the track cluster to the west of the WMVM track (
Figure 7d, red dots) included at least 10 ensemble member tracks that made landfall over the southern Japan islands. However, the WMVM recurvature prediction of 30.7° N, 133.6° E at 00:00 UTC on 27 August continued to be a day early and more than three degrees too far east (
Table 4, column 4). Even with the 00:00 UTC 24 August forecast (
Figure 7e) having a starting position over the correct 20° N crossing position and the early track forecast spread being remarkably small, the predicted recurvature was still a day early and three degrees too far east (
Table 4, column 4). In the 12:00 UTC 24 August forecast (
Figure 7f), Shanshan had already moved poleward 2.2 degrees into the unfavorable environment. The ECEPS-predicted recurvature was only 12 h early, but the longitude error was still 2 degrees to the east (
Table 4, column 4). It was not until the 00:00 UTC 26 August ECEPS forecast (not shown), when Shanshan’s starting position was far to the north at 27.2° N, 133.8° E, that the recurvature timing (Day 2.0) and longitude of 129.9° E were correctly predicted.
In summary, Shanshan was quasi-stationary near 17° N, 142° E on 22–23 August when Shanshan became a typhoon at 12:00 UTC on 2 August according to the JTWC WBT. When TY Shanshan began to move poleward, the ECEPS track forecasts were accurate in predicting when and where Shanshan would cross 20° N into the unfavorable environment, and even two days later during that crossing some physical processes not resolved in the ECEPS caused the recurvature timing and longitude to be early by 24 h and 3–4 degrees to the east. It was easy to explain the early recurvature when Shanshan was predicted to move more poleward (rather than northwestward) and thus get to 30° N more quickly. The track forecast challenge is to understand why Shanshan was not predicted to turn more westward while translating poleward through the unfavorable external environment.
According to the JTWC WBT, the intensification of Shanshan took place in three stages. First, a steady 36 h intensification to a TY at 12:00 UTC on 23 August (
Table 1). Second, a 36 h period of constant 65 kt intensity. Third, a slow intensification over two and a half days to a peak intensity of 115 kt at 18:00 UTC on 27 August. By contrast, the CIMSS ADT + AIDT intensities used to define the adjusted WBT intensities for Shanshan in
Table 5 (top row, brackets) had a four-stage intensification. Stage 1 intensification was almost the same as in the JTWC WBT, but it was only to 61 kt at 00:00 UTC on 23 August. As indicated in
Section 1.2, the first intensity forecast challenge was Stage 2, during which Shanshan decayed to 52 kt at 00:00 UTC on 24 August and did not re-intensify to 61 kt until 00:00 UTC on 25 August. It is noteworthy that during almost all of this Stage 2 decay and recovery, the unadjusted JTWC WBT intensity was constant at 65 kt. Thus, the JTWC intensity overestimate was as large as 13 kt at 00:00 UTC on 24 August. Here, we define Stage 3 as a small intensification–decay event in which Shanshan intensified from 61 kt to 71 kt at 12:00 UTC on 25 August, but then decayed to 68 kt at 00:00 UTC on 26 August, when the unadjusted WBT was 80 kt. This was an important time because it was when our-defined Stage 4 intensification began, and the intensity rapidly increased from 79 kt at 12:00 UTC on 26 August to 104 kt at 00:00 UTC on 27 August (
Table 5, top row, brackets). As indicated in the ECEPS track forecasts in
Figure 7, this was when Shanshan was passing over the Kuroshio ocean current.
Before utilizing these adjusted WBT intensities based on the CIMSS ADT + AIDT intensities for validation of the ECEPS and the JTWC intensity forecasts, we reviewed the Himawari-9 infrared satellite imagery in
Figure 8. While the first high-density infrared imagery focused on the pre-Shanshan disturbance was at 13:40 UTC on 21 August, the focus here was when TY Shanshan had turned poleward and was crossing 20° N. Unfortunately, there were gaps in coverage from 11:10 UTC to 15:40 UTC on 23 August, so the 12:00 UTC imagery could not be displayed, and thus the 11:10 UTC image is provided in
Figure 8a. The JTWC WBT had Shanshan near 18.2° N, 141.3° E. Although the remnants of the eye were present in the low-level clouds, there was no deep convection around the eye. There was a broad outer band coming from 20° N that had some deep convection, but that deep convection was far from the center. An equatorial rainband with deep convection to the south extended around the eastern side of the center, which contributed to the highly asymmetric outer convection around Shanshan’s center as it approached 20° N. While the JTWC WBT continued the intensity as 65 kt, the CIMSS ADT + AIDT-based adjusted WBT intensity was not higher than 60 kt. One caveat to this statement is that the 12:00 UTC 23 August estimate was within that gap period from 11:10 UTC to 15:40 UTC. One possible explanation for that gap may be that the ADT + AIDT algorithm was not capable of providing an estimate based on
Figure 8a.
At 00:00 UTC on 24 August (
Figure 8b), the elliptical outflow burst dome was over the center, which the JTWC WBT had at 20.0° N, 141.3° E. The equatorial rainband wrapped around the eastern side, but it terminated well to the northeast of the center. Note that the environmental airstream on the western side wrapped around the south of the elliptical outflow burst dome, and the outflow was likely rapidly subsiding in that environment. Given the oblong shape of the outflow burst dome with a strong outflow to the south, one might infer that the upper-level warm core was also highly asymmetric and may not have been centered over the central deep convection. While the JTWC WBT continued the intensity at 65 kt, the ADT + AIDT intensity was 52 kt at 00:00 UTC on 24 August. Just as in
Figure 8a, one might question whether the ADT + AIDT algorithm can reliably estimate the vortex intensity for such an oblong outflow burst dome.
The elliptical outflow burst dome pattern then expanded (especially to the northwest) and translated to the north by 12:00 UTC on 24 August (
Figure 8c). There was no longer a connection with the equatorial rainband to the south that had already terminated just north of 20° N. The JTWC WBT had Shanshan’s center near 22.5° N, 140.7° E, which was in the southern lobe of the elliptical outflow dome. The edges of the outflow dome on the western and southern sides were very narrow, which again was indicative of a rapid subsidence of the outflow. We suspected the warm core aloft was not likely to be over Shanshan’s center. Therefore, one may question the ADT + AIDT intensity increase to 56 kt at 12:00 UTC 24 August, which is important as that is a key feature defining the recovery in intensification Stage 2. Certainly, the continued JTWC intensity of 65 kt was unlikely.
By 00:00 UTC 25 August (
Figure 8d), Shanshan had become an isolated elliptical vortex with the major axis oriented southeast to northwest. This isolated vortex structure was similar to the TY Bebinca vortex in Part I [
1] (
Figure 8c) as it propagated northwestward through the unfavorable external environment. Note that the edges of the outflow dome on the southwest side continued to be very narrow and indicated rapid subsidence of that outflow. A new feature was a broad outflow that was flowing toward the northwest but then curved anticyclonically. Such a broad poleward outflow was a favorable condition for intensification, and Stage 3 began with an intensity increase from 61 kt at 00:00 UTC on 25 August to 71 kt at 12:00 UTC on 29 August (
Table 5, top row, brackets). It is noteworthy that the JTWC WBT intensities also increased by 10 kt in 12 h from 65 kt to 75 kt at 00:00 UTC on 25 August. It is also important that the track direction changed from northwestward at 00:00 UTC on 25 August to west–northwest at 12:00 UTC.
According to the ADT + AIDT, the second part of Stage 3 was a short 12 h decay from 71 kt to 68 kt at 00:00 UTC on 26 August. This decay was consistent with an almost complete disconnection of a broad poleward outflow in
Figure 8d to a narrower poleward outflow well in advance of Shanshan’s center in
Figure 8e. A dynamic restructuring of Shanshan’s vortex and the outflow were evident at 00:00 UTC on 26 August in
Figure 8f. The vortex center was near 27.2° N, 133.9° E, according to the JTWC WBT. Almost no deep convection was present near that center position, which appeared to be defined by the mid-level convection. Based on this satellite imagery at 00:00 UTC on 26 August, it seems questionable that the intensity was 80 kt as per the JTWC WBT. Unfortunately, there were, again, gaps in the ADT + AIDT intensity estimates. While the interpolated value was 68 kt, one may question whether these gaps indicated that the ADT + AIDT algorithm was not calibrated to obtain a solution when the central convection was not well-defined, as in
Figure 8f.
What is evident in
Figure 8f is that outflow channels both to the north and to the south were becoming organized, which was favorable for intensification [
21]. Furthermore, Shanshan was approaching the Kuroshio ocean current to the east of the southern Japan islands, which are shown in yellow in the upper-left section of
Figure 8f. As indicated in
Table 5, the Stage 4 adjusted WBT based on the ADT + AIDT started with an 11 kt intensification from 00:00 UTC on 26 August to 12:00 UTC on 26 August, and then rapidly intensified by 25 kt in 12 h to 104 kt. By contrast, the unadjusted WBT was a steady non-rapid intensification from 80 kt at 00:00 UTC on 26 August to 105 kt at 00:00 UTC on 27 August. We conclude from
Figure 8 that the adjusted WBT four-stage intensification should be utilized in the validation of the ECEPS and the JTWC forecasts, as in
Table 5. However, there are questions as to whether the ADT + AIDT intensity estimates were too high, especially at 11:10 UTC on 23 August (
Figure 8a) and at 00:00 UTC on 26 August (
Figure 8f).
A summary of the validations of the ECEPS and the JTWC intensity forecasts during Stages 2–4 of the intensification of Shanshan is provided in
Table 6. The Stage 1 intensification as a small vortex that was quasi-stationary near 17° N, 141° E is not shown as the early ECEPS forecasts and the JTWC forecasts were reasonably similar to the adjusted WBT intensities in
Table 5.
Stage 2 was a decay from 61 kt at 00:00 UTC on 23 August to 52 kt at 00:00 UTC on 24 August and then a slow recovery to 61 kt at 00:00 UTC on 25 August (
Table 5, top row, brackets). First, note that the first three JTWC forecasts of Stage 2 in
Table 6, Column 1, brackets, missed the decay, as the forecasts were for a steady intensification of 15 kt. The 00:00 UTC 24 August JTWC forecast also missed the decay but had the intensity constant at 65 kt for the last 36 h of Stage 2 and thus incidentally validated well with the verifying intensity of 61 kt. The 00:00 UTC 22 August ECEPS forecast (
Table 6, first row) was characterized as a previous decay, but that decay had already occurred at least 24 h earlier, as the initial intensity was 46 kt (
Table 5, row 1). However, an early recovery to 60 kt occurred in the first 12 h, and the predicted intensity at 00:00 UTC on 25 August was only 5 kt too high.
For the 12:00 UTC 22 August ECEPS forecast (
Table 6, row 2), again, the decay had previously occurred, and the recovery was early—namely, at the initial time. The subsequent forecast intensities were, then, too high, and the verifying intensity of 72 kt at 00:00 UTC on 25 August was 11 kt too high. Similar comments as to the previous decay, very early recovery, and too high intermediate intensities apply to the 00:00 UTC 23 August ECEPS forecast (
Table 6, row 3). Finally, the 12:00 UTC 23 August ECEPS forecast (
Table 6, row 4) had the best prediction of the Stage 2 decay and recovery, but this was expected as the intensity initialization was perfect, and it was only a 36 h forecast to the verifying time of 00:00 UTC on 25 August. While there were overpredictions of the intensities during the recovery period, the ECEPS forecasts of Shanshan (11 W) Stage 2 were more accurate than the JTWC forecasts.
Stage 3 of Shanshan was an intensification after 00:00 UTC on 25 August to 71 kt at 12:00 UTC that was interrupted by a short decay to 65 kt at 00:00 UTC on 26 August, which led to the delayed start of a RI in the following 24 h. The common characteristic of the first four ECEPS forecasts from 00:00 UTC on 22 August to 12:00 UTC on 23 August is that a good prediction was made of a decay, but the timing was 12–24 h early (
Table 6, Rows 1–4). The next ECEPS forecast from 00:00 UTC on 24 August, which started from the conditions in
Figure 8b, was challenged to predict a 12 h intensification from the conditions in
Figure 8d to the conditions in
Figure 8e, and then predict a 12 h decay to the conditions in
Figure 8f. However, the validation for the 00:00 UTC 24 August forecast was that the intensity was essentially constant rather than an intensification and decay (
Table 6, Column 2, Row 5). Note that the ECMWF did not utilize a bogus vortex to initialize the control for the ECEPS at 00:00 UTC on 24 August. Rather, those initial conditions primarily came from the previous six-hour deterministic forecasts and may even have been influenced by the previous 12 h deterministic forecast from 12:00 UTC on 23 August, which started from the weak conditions in
Figure 8a. Using the same reasoning, the next ECEPS forecast from 12:00 UTC on 24 August, which was initialized from the conditions in
Figure 8c, could have a validation of good decay and good recovery (
Table 6, Row 6). However, the 00:00 UTC 25 August ECEPS forecast (
Table 6, Row 7) had no decay and only a 15 kt increase in 24 h. As in Stage 2, the JTWC forecasts of Stage 3 had no decay or constant intensity with intensification (even one RI) over the 24 h period, and thus were less accurate than the ECEPS forecasts of Stage 3 of Shanshan.
Only the first two ECEPS forecasts from 00:00 UTC on 22 August and 12:00 UTC on 22 August were able to predict Stage 4 RI, and that was from 12:00 UTC 26 August to 00:00 UTC on 27 August (
Table 6, Rows 1 and 2). As shown in
Figure 7a,b, Shanshan was predicted to be over the Kuroshio ocean current at 00:00 UTC on 27 August. For the remaining ECEPS forecasts from 00:00 UTC on 23 August through 00:00 UTC on 25 August (
Table 6, Rows 3–7), only ~15 kt intensity increases were predicted over the 24 h period of Stage 4. Our tentative explanation is that a majority of the 51 ensemble member tracks were still over the northern unfavorable external environment (note the large track spread in
Figure 7c–f). Only the JTWC forecast from 00:00 UTC on 25 August (
Table 6, Row 6) was able to predict Stage 4 RI, although the 12:00 UTC 22 August JTWC forecast came close with a 25 kt increase over the 24 h period. The remaining JTWC forecasts had only 10–20 kt intensity increases during this 24 h period of Stage 4 of Shanshan. In addition to the challenge of the ECEPS to predict any RI, the challenge of very accurate track forecasts in the Kuroshio ocean current region, along with possible land effects, made this Shanshan case very difficult to predict.
In summary, the ECEPS predicted well the track of Shanshan crossing this southern boundary of an unfavorable external environment (
Figure 7 and
Table 4). The ECEPS intensity forecasts were compared with the CIMSS ADT + AIDT intensities provided by Chris Velden. The ADT + AIDT documented two important decay periods when the JTWC WBT intensities were either constant in time or steadily intensifying rather than rapidly intensifying. Analysis of the Himawari-9 infrared imagery (
Figure 8) during these two decay periods, when the deep convection patterns were so disrupted, brought into question whether even the ADT + AIDT intensities were too high. Furthermore, the ADT + AIDT technique may need to be recalibrated to accurately estimate the intensities associated with the oblong outflow dome signatures in
Figure 8b–e. Given these possible ambiguities, the ECEPS intensity forecasts of Shanshan were definitely more accurate than the JTWC intensity forecasts overall and especially during the decay and recovery stages. Since the CONW intensity technique [
5], which is a primary intensity guidance product for the JTWC intensity forecasts, contains both regional and global numerical models as well as statistical–dynamical techniques, it would be helpful to the JTWC forecasters to know which category of guidance products would lead to better forecasts of TCs developing and intensifying near and north of 20° N.
3.4. Typhoon Jebi (19 W)
The discussion in
Section 1.2 of forecasting challenges for TY Jebi (19 W) was primarily focused on the intensity analyses and forecasts, both before and after Jebi crossed 20° N into the unfavorable external environment (
Figure 1, blue line). First, why did Jebi not intensify to more than 40 kt while south of 20° N as Typhoon Shanshan (
Figure 1, 11 W, orange line) did in late August (
Section 3.3)? According to the JTWC WBT, Jebi decayed to 30 kt while crossing 20° N and was still only 35 kt at 00:00 UTC on 30 September when Jebi was near 25° N. The other intensity challenge for Jebi was that a rapid intensification occurred from 45 kt at 12:00 UTC on 30 September to a peak intensity of 70 kt at 00:00 UTC on 1 October, according to the JTWC WBT. Just as in the other three cases described above in
Section 3.1,
Section 3.2 and
Section 3.3, the JTWC WBT intensities for Jebi were adjusted to agree with the CIMSS ADT + AIDT intensities provided by Chris Velden. A detailed description of this adjustment procedure using Jebi’s case as the example is given in
Appendix A. Except for that 70 kt initial intensity at 00:00 UTC on 1 October in Row 1 of
Table A1, the ADT + AIDT intensities digitized at 1 kt increments are within ± 5 kt of the JTWC WBT intensities. Thus, both approaches indicate that the intensities of Jebi translating poleward through the unfavorable external environment are smaller than would be expected for a late September storm with Jebi’s track in
Figure 1.
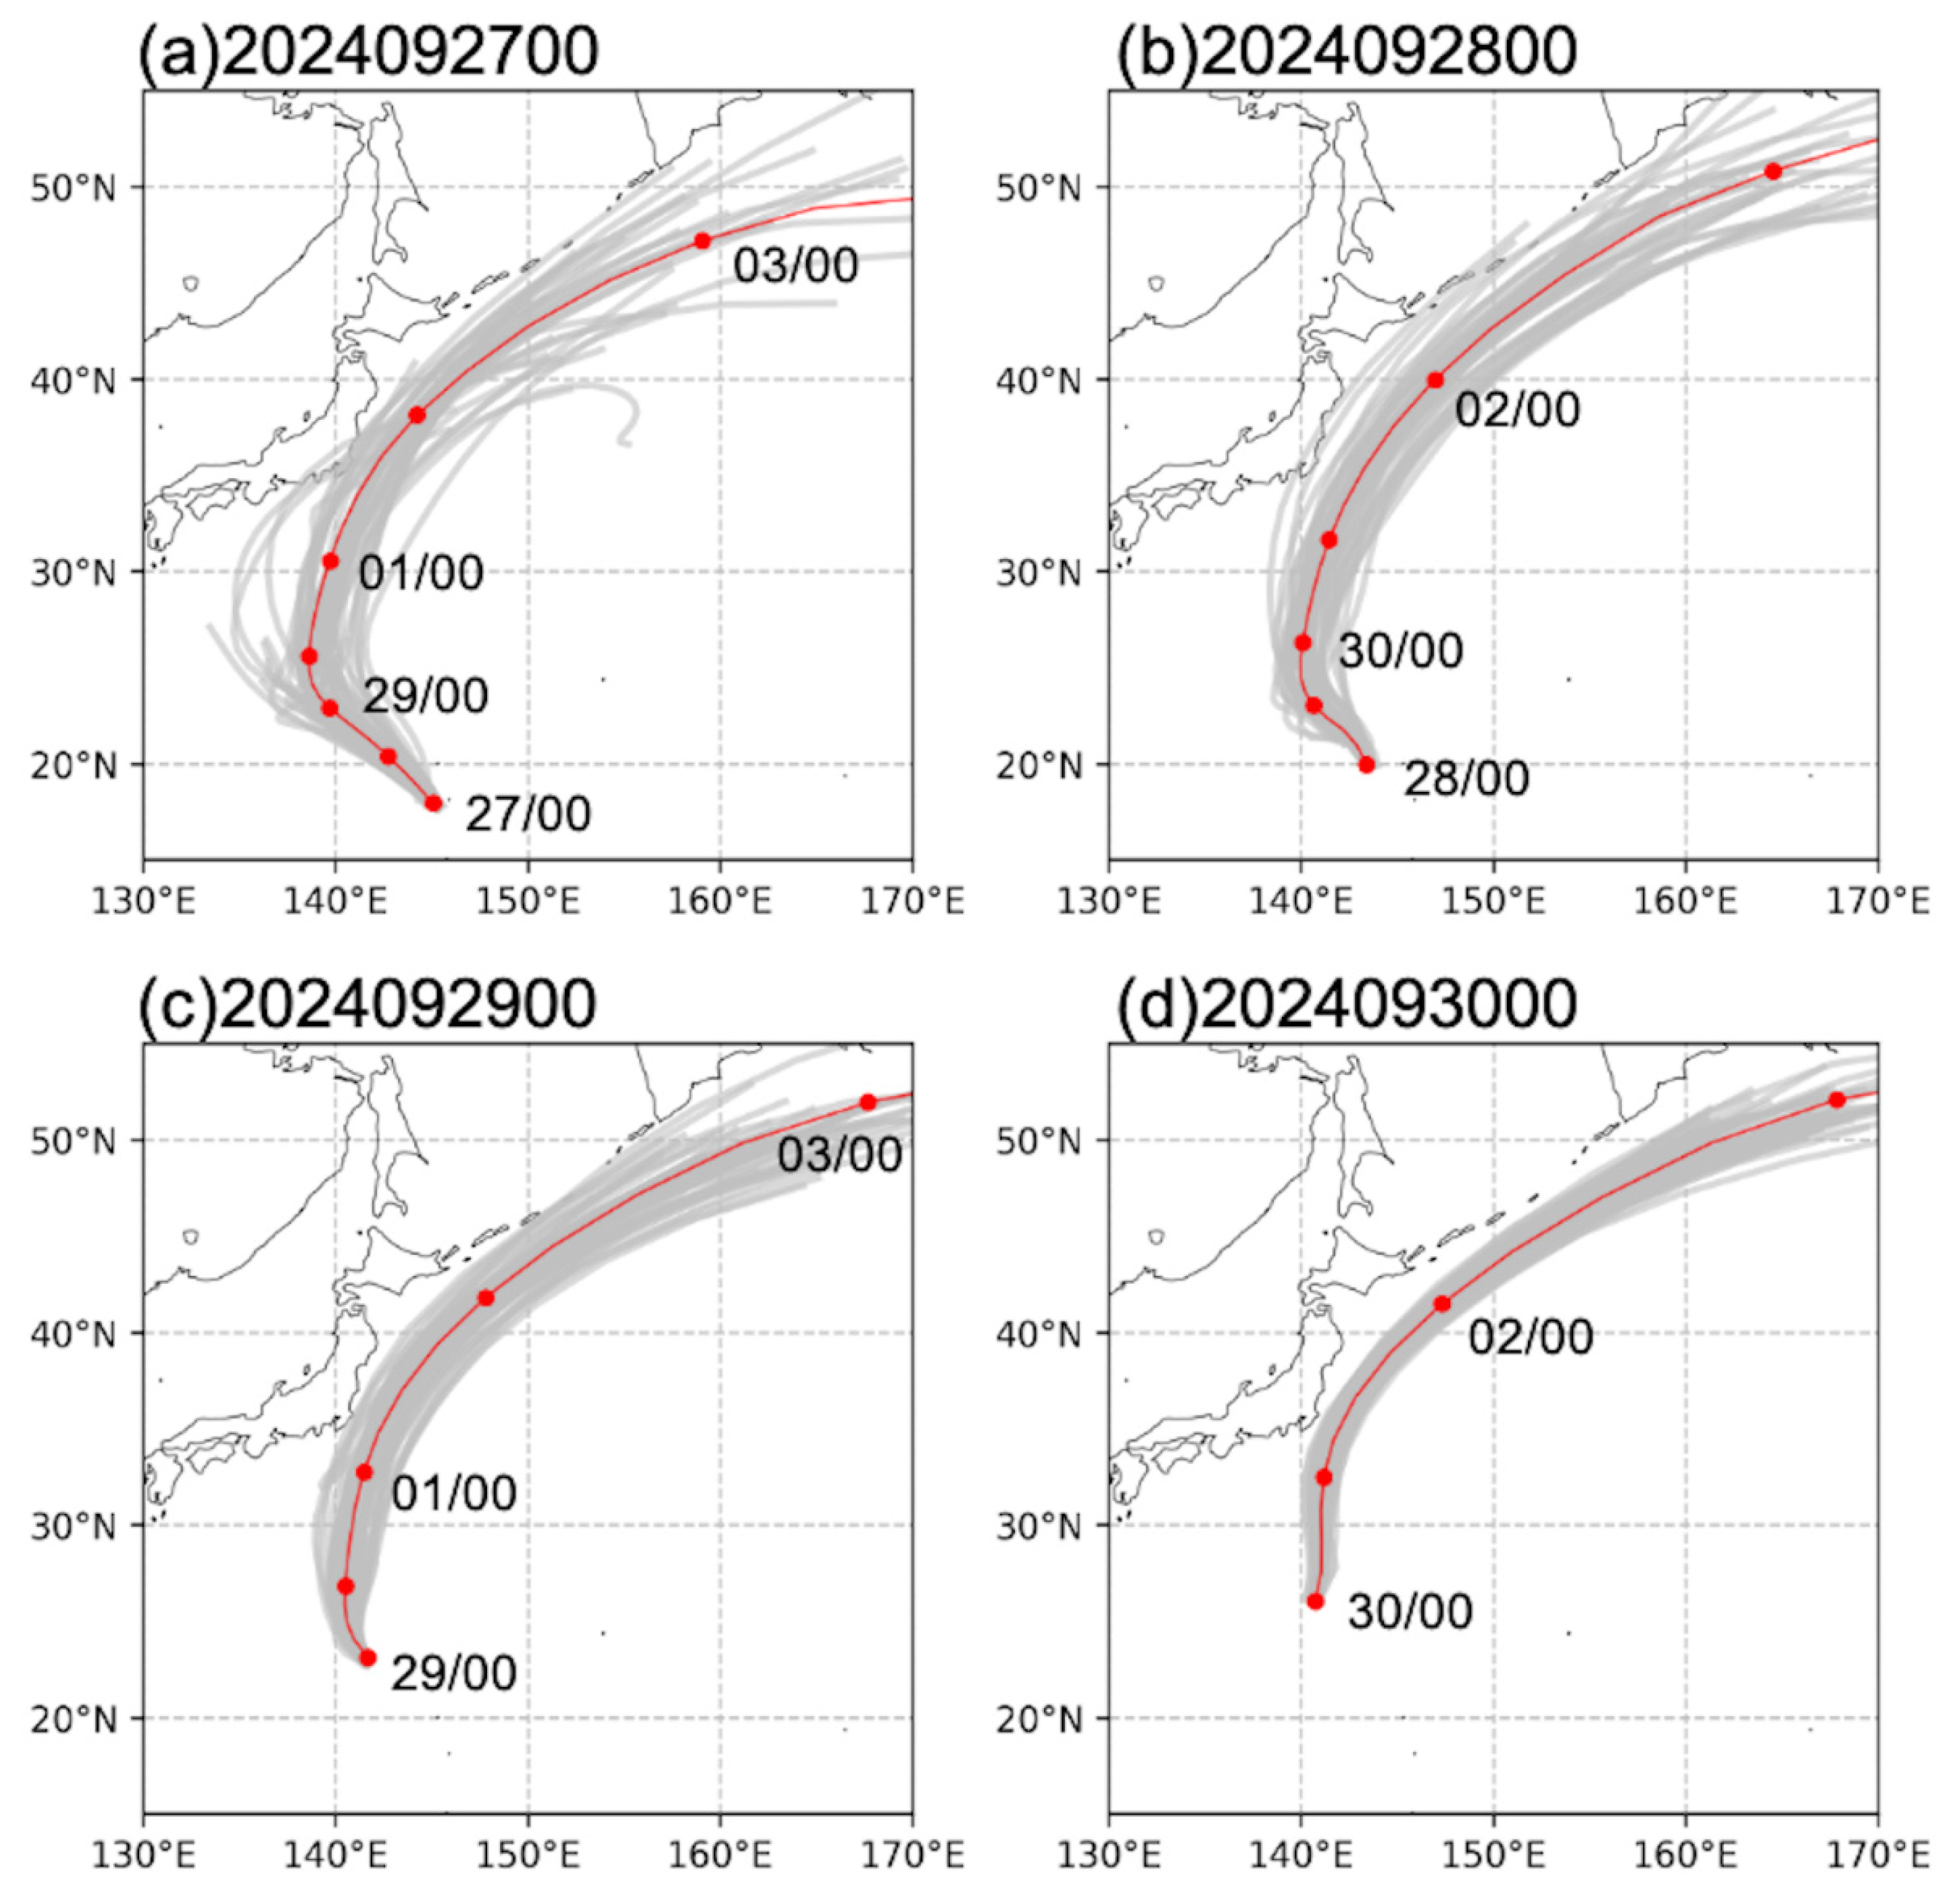
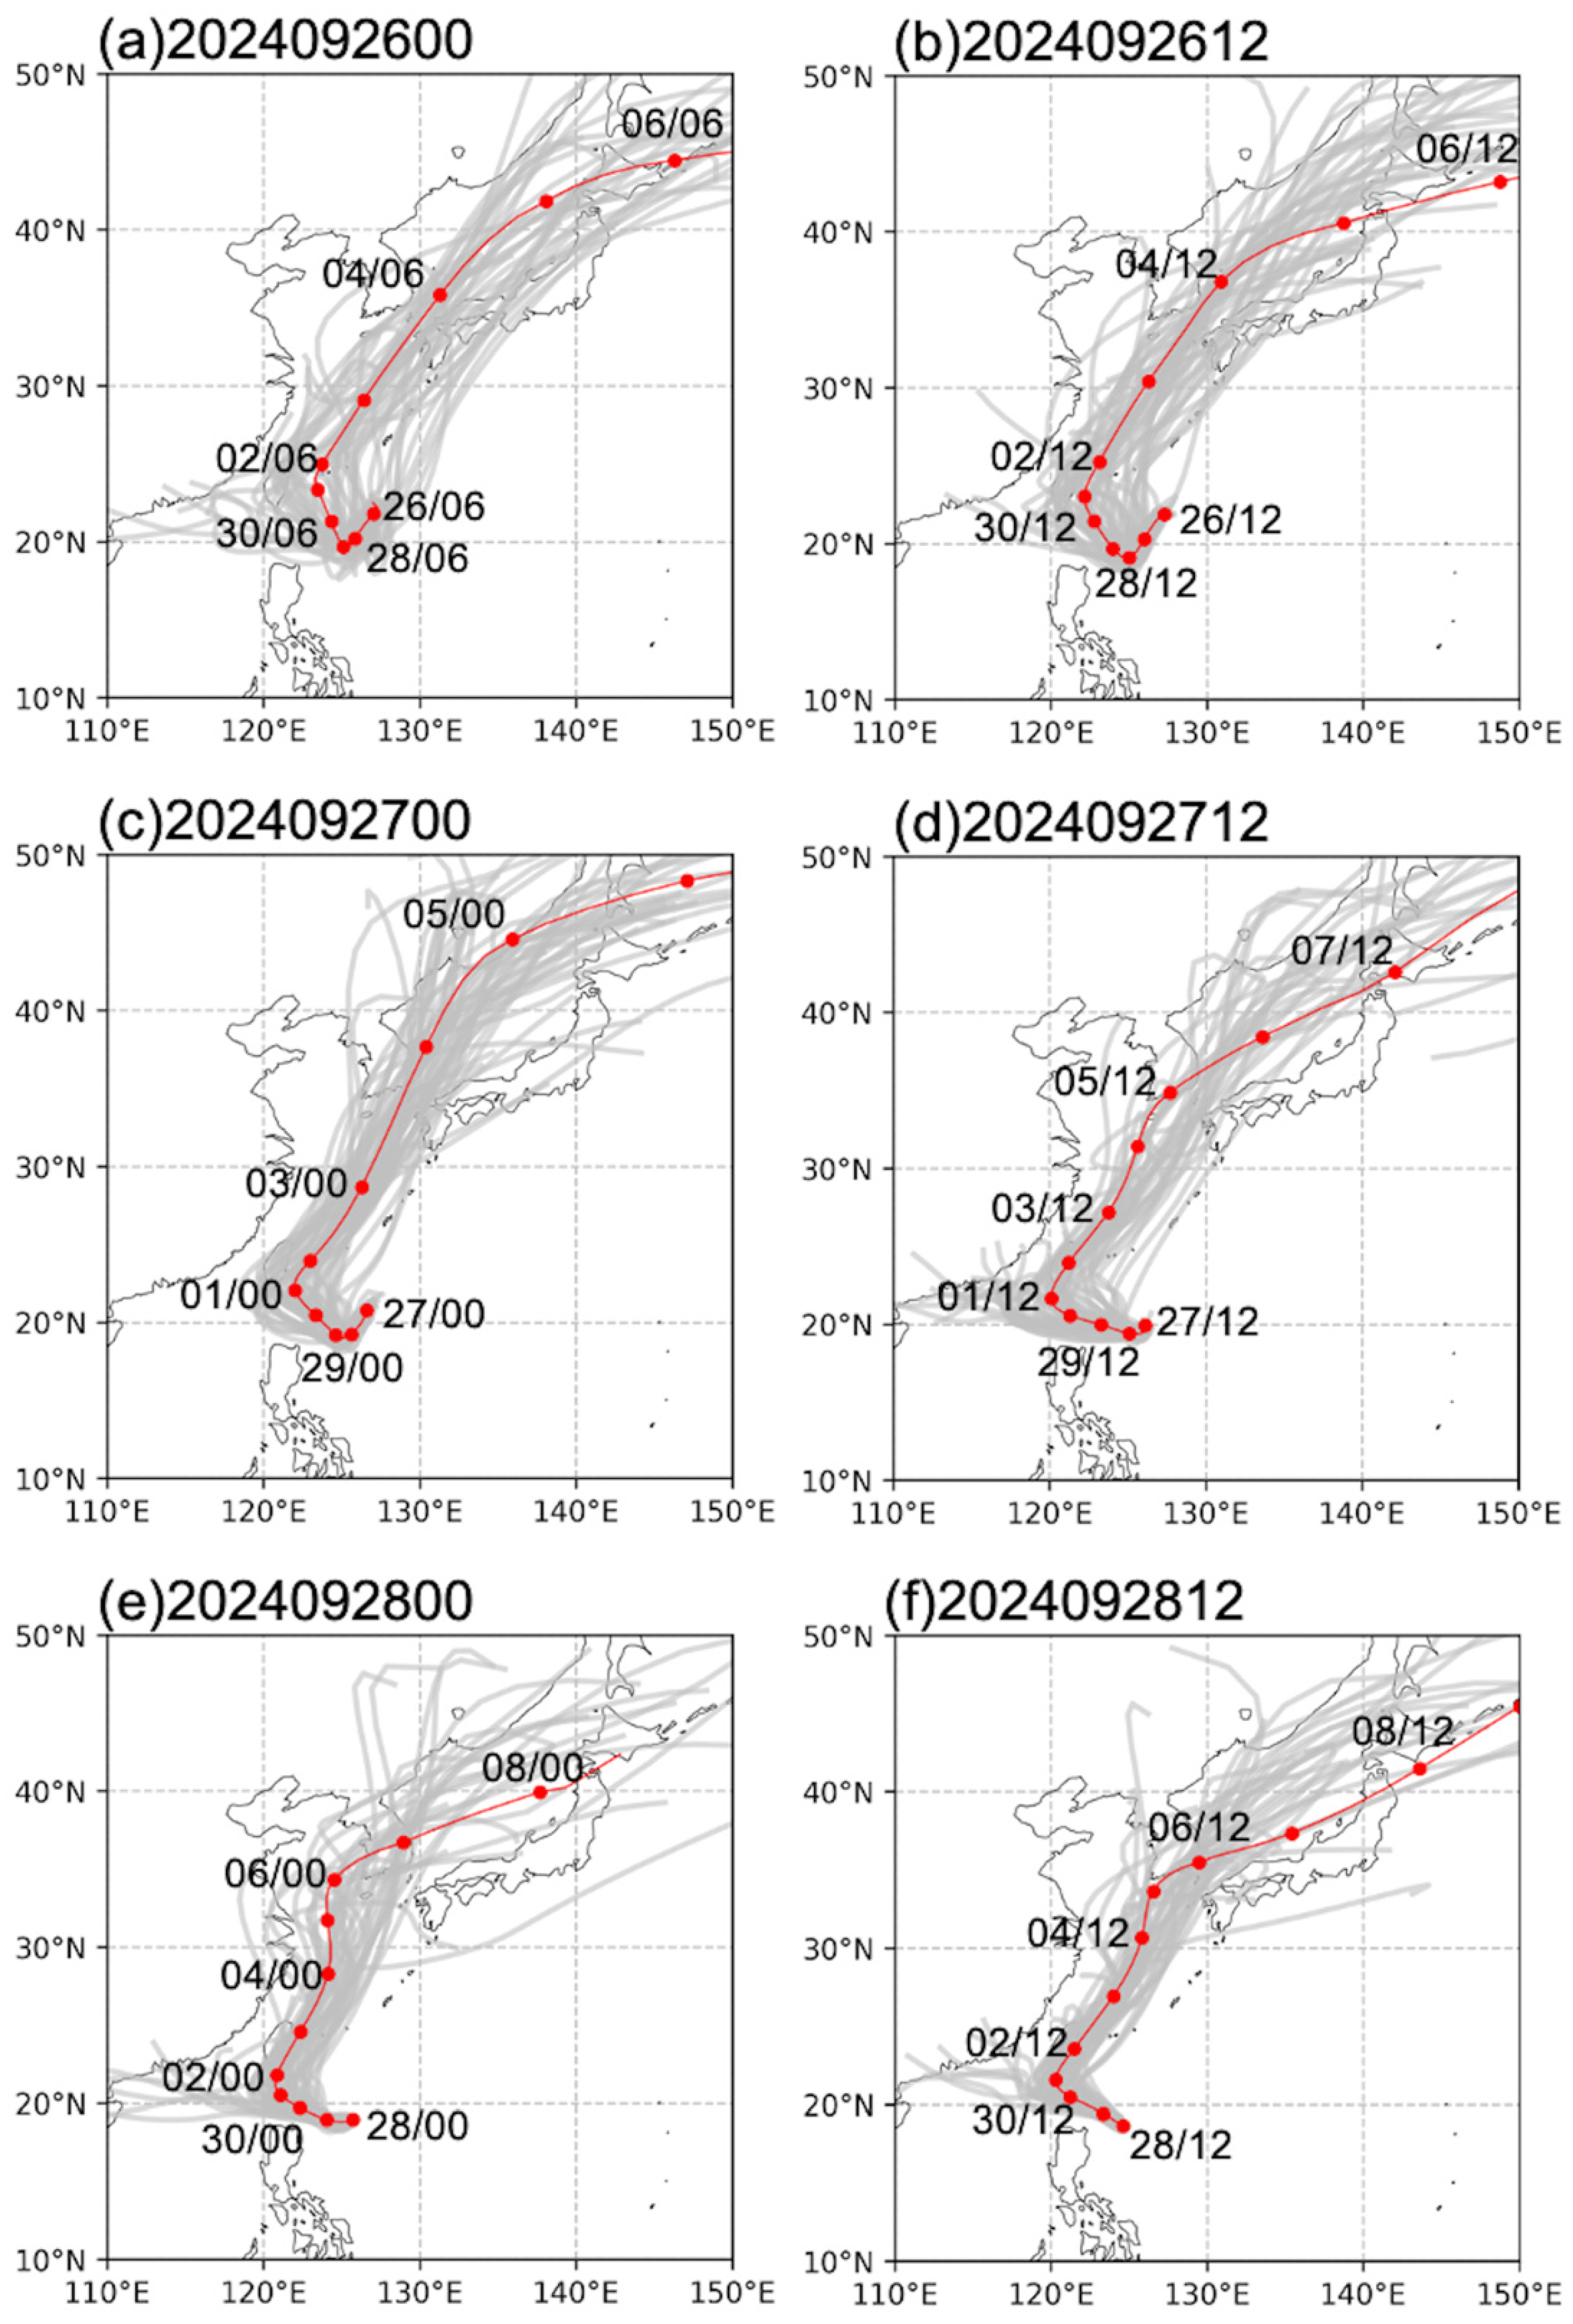
The capability of the ECEPS to predict Jebi’s track is illustrated in
Figure 9. As indicated in
Figure 1, Jebi was slowly drifting westward near 18° N, 145° E early in its lifecycle, and then turned more poleward to cross 20° N near 143° E at 00:00 UTC on 28 September. In the 00:00 UTC 27 September ECEPS track forecast in
Figure 9a, the 00:00 UTC 28 September position was 20.4° N, 142.7° E, with a relatively small track forecast spread. Another noteworthy feature in
Figure 9a was that a number of the ensemble member track forecasts on the west side of the WMVM track (red dots at 24 h intervals) terminated around 00:00 UTC on 30 September, so there were then seven fewer ensemble member tracks. That time was also the predicted recurvature time, and the translation speed then increased so that Jebi was predicted to be translating at 19.4 kt at 12:00 UTC on 1 October as Jebi passed just to the east of central mainland Japan.
The 00:00 UTC 28 September ECEPS track forecast in
Figure 9b started at 19.9° N, 143.4° E, but there were only 41 ensemble member tracks instead of the maximum 51 ensemble members in
Figure 9a. The predicted recurvature time was 12:00 UTC on 29 September near 24.4° N, 140° E, and the predicted translation speed was 21.5 kt at 12:00 UTC on 1 October when Jebi’s track forecast was closest to the coast of mainland Japan. In the 00:00 UTC 29 September ECEPS track forecast (
Figure 9c), the track forecast spread was small, and the westernmost ensemble member track just brushed by the Japan mainland coast. The predicted recurvature time was 12 h later, at 00:00 UTC on 30 September, and was farther north at 26.8° N, 140.5° E. It is noteworthy that the predicted translation speed while passing close to mainland Japan was 21 kt. Thus, the vortex wind structure was predicted to be highly asymmetric, with the maximum (minimum) winds offshore (onshore). Note also that the ECEPS track forecast spread (
Figure 9d) was very small. While the predicted recurvature time was the initial time of 00:00 UTC on 30 September, Jebi was first predicted to move poleward during the first 24 h, but then veer to the northeast and avoid landfall. Thus, all four of the ECEPS track forecasts in
Figure 9 were consistent in predicting the poleward path of Jebi to pass just east of central mainland Japan at 12:00 UTC ± 6 h on 1 October.
As described above, and explained in
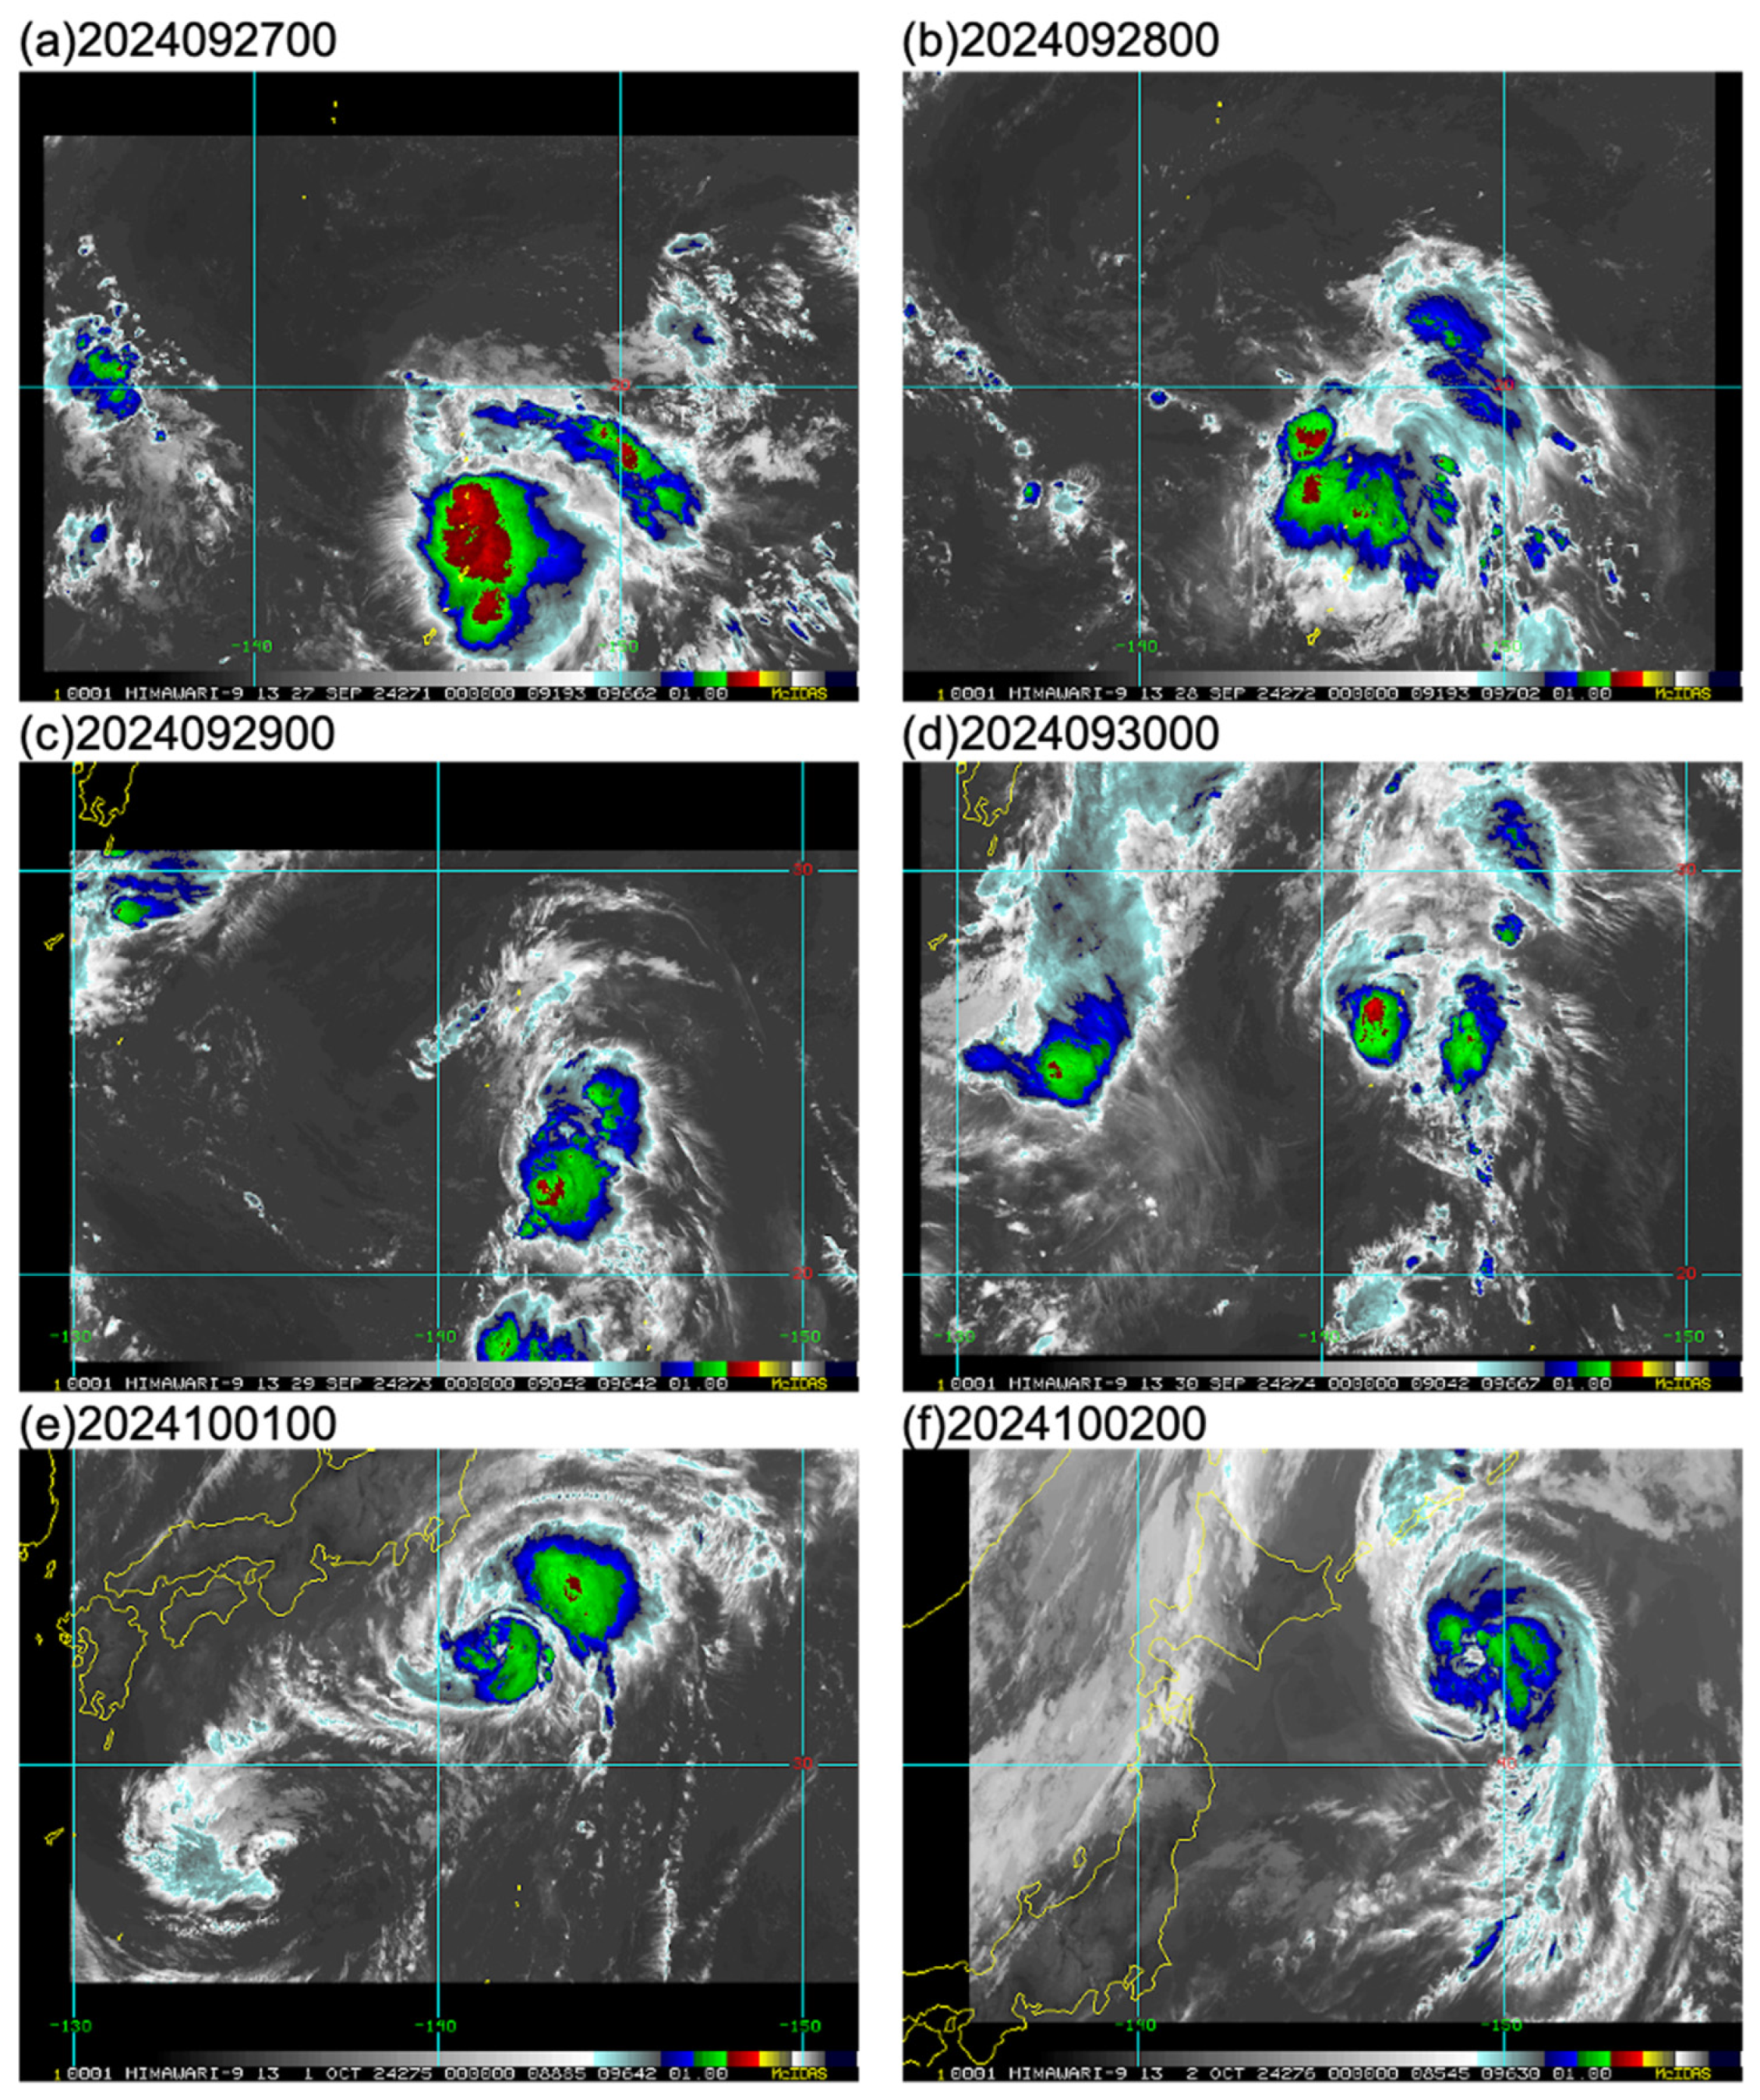
Appendix A, there was some disagreement in Jebi’s initial intensities between the JTWC WBT and the CIMSS ADT + AIDT, especially when Jebi was moving poleward across 20° N and at the time of peak intensity. Thus, we first reviewed the Himawari-9 infrared satellite imagery in
Figure 10. According to the JTWC WBT, Jebi was at 18.8° N, 145.2° E at 00:00 UTC on 27 September (
Figure 10a), and the intensity was 35 kt. The key features included the oblong deep convection pattern with near-radial outflow beyond the western edge of that deep convection, which indicated rapid subsidence and warming. By contrast, the deep convection on the eastern side was spread over a wide area. Note also the outer rainband to the northeast that only wrapped around the center to the north, which in past cases indicated the circulation would begin to have a larger poleward translation.
At 00:00 UTC on 28 September (
Figure 10b), the JTWC WBT had Jebi’s center at 20.0° N, 143.3° E with an intensity of 35 kt. However, there was no clear relationship between the deep convection and that center position. Most of the deep convection was in a broad region well to the south and disorganized, and there was no well-defined outflow toward the west, as in
Figure 10a. The rainband to the northeast expanded and extended poleward across 20° N. By 00:00 on 29 September (
Figure 10c), the JTWC WBT had Jebi’s center at 22.5° N, 141.6° E, with an intensity of 30 kt. The only deep convection signature was somewhat farther to the east and did not wrap around the center. The outer rainband expanded and made the overall convection have an oblong shape oriented almost south-to-north.
At 00:00 UTC on 30 September (
Figure 10d), Jebi had a small, well-defined deep convection region, but it appeared to be somewhat to the east of the JTWC WBT center at 25.8° N, 140.2° E. Although the overall convection pattern had an oblong shape, the secondary deep convection was far to the east–southeast of the primary deep convection associated with Jebi’s center. There was also a deep convection region far to the north–northeast of Jebi’s center. Thus, the combination of Jebi and these other two deep convection regions represents a large change in the external environment pattern compared to
Figure 10c. Recall from the discussion of
Figure 9d at this same time that Jebi began to translate very rapidly poleward. In the 00:00 UTC 29 September ECEPS forecast (see the track forecast in
Figure 9c), Jebi was predicted to be losing its warm core at 00:00 UTC on 30 September, and the warm core magnitude was predicted to be near zero 12 h later.
The satellite image at 00:00 UTC on 1 October (
Figure 10e) was when there was a disagreement as to Jebi’s intensity, with the JTWC WBT intensity of 70 kt versus the CIMSS ADT + AIDT intensity of 58 kt (
Table A1, Rows 1–2, respectively). Note in
Figure 10e that Jebi was just off the east coast of mainland Japan, and the inflow bands appeared to originate near the Kuroshio ocean current. Assuming the 00:00 UTC 29 September ECEPS forecast was correct in that Jebi would be losing its warm core at 00:00 UTC on 30 September (
Figure 10d), it was reasonable that the enthalpy input from the Kuroshio region would re-intensify Jebi. The question was whether it would reach 70 kt or 58 kt. Note that Jebi’s eye was large, and there was no deep convection in the eye region, which are factors more consistent with 58 kt. As indicated in
Section 1.2, the RSMC Tokyo did not label Jebi as a typhoon, and Jebi was well within Japan’s radar coverage.
A complicating feature in
Figure 10e is the large rainband far to the northeast of Jebi with deep convection near 36° N, 144° E. We interpreted that rainband to be an extratropical cyclone warm sector-type ascent region passing over the Kuroshio ocean current. As Jebi’s remnants translated rapidly to 41.7° N, 148.5° E by 00:00 UTC on 2 October (
Figure 10f), that large rainband in
Figure 10e was no longer present. While the JTWC WBT intensity at that time was 60 kt, the eye was large and ragged, and there was no deep convection around the eye. Note that the CIMSS ADT + AIDT had Jebi’s remnants at 61 kt at 00:00 UTC on 2 October, but the question was whether that technique had been trained on the extratropical transition of cold-core systems.
The ECEPS intensity forecast from 00:00 UTC on 27 September along the track forecast in
Figure 9a is compared in
Table A1 with the JTWC intensity forecast from 12:00 UTC on 27 September because the ECEPS forecasts did not arrive at the JTWC until about 10 h after the synoptic times 00:00 UTC and 12:00 UTC. The major point in
Table A1 is that the JTWC forecast was for typhoon-force winds from 00:00 UTC on 30 September to 00:00 UTC on 1 October. By contrast, the 00:00 UTC 27 September ECEPS forecast was within 5 kt of the ADT + AIDT intensities until 00:00 UTC on 30 September. However, the ECEPS then predicted extratropical transition with the weighted mean V
max near 35 kt.
That comparison of the 00:00 UTC 27 September ECEPS intensity forecast for Jebi with the 12:00 UTC 27 September ECEPS intensity forecast is also in the first row of
Table 7. Note that the ECEPS forecast intensities from the time when Jebi was predicted to begin to have negative warm core magnitudes were then derived from the weighted-mean V
max, and then highlighted in blue in
Table 7. In that 12:00 UTC 27 September ECEPS forecast, the predicted ECEPS intensities from 12:00 UTC on 30 September onward were almost all in blue as the extratropical transition had started. However, this was when the adjusted WBT intensities based on the CIMSS ADT + AIDT intensities were beginning to intensify, so, again, the question was whether that technique had been trained on the extratropical transition of cold-core systems such as Jebi in
Figure 10e,f? The ECEPS intensity forecasts in
Table 7 from 12:00 UTC on 27 September onward had the extratropical transition beginning at 12:00 UTC on 30 September, with the exceptions of the 12:00 UTC 28 September and 00:00 UTC 29 September forecasts that predicted extratropical transition would already begin at 00:00 UTC 30 September.
The validation of the JTWC intensity forecasts relative to the adjusted WBT intensities was striking. Note that the JTWC was generally predicting a steady increase in intensity right from the initial intensity, while the adjusted WBT was almost a constant 35 kt from 00:00 UTC on 27 September to 00:00 UTC on 30 September. Thus, Jebi’s peak intensities in most of the JTWC forecasts were 70 kt, with the exceptions being the 00:00 UTC and 12:00 UTC 29 September forecasts, with a peak intensity of 60 kt. Consequently, the JTWC forecasts of Jebi’s peak intensity were generally double the peak intensities in the ECEPS forecasts that predicted an extratropical transition after 00:00 UTC on 30 September.
In summary, the ECEPS provided early, accurate track forecasts of Jebi’s (19 W) threat to mainland Japan. As in the previous three storms, the CIMSS ADT + AIDT intensities were utilized for initialization and validation of the ECEPS intensity forecasts. Those ADT + AIDT intensities documented that Jebi’s intensities, while crossing into and passing through the unfavorable external environment, were only around 35 kt. While the ECEPS correctly predicted such unusually small intensities, the JTWC forecast steady intensification during that period. The disagreement between the ECEPS intensity forecasts and the ADT + AIDT intensities was when the ECEPS was predicting extratropical transition with Vmax ~35 kt and the ADT + AIDT technique (and the JTWC) was interpreting Jebi’s remnants as a tropical cyclone.
3.5. Super Typhoon Krathon (20 W)
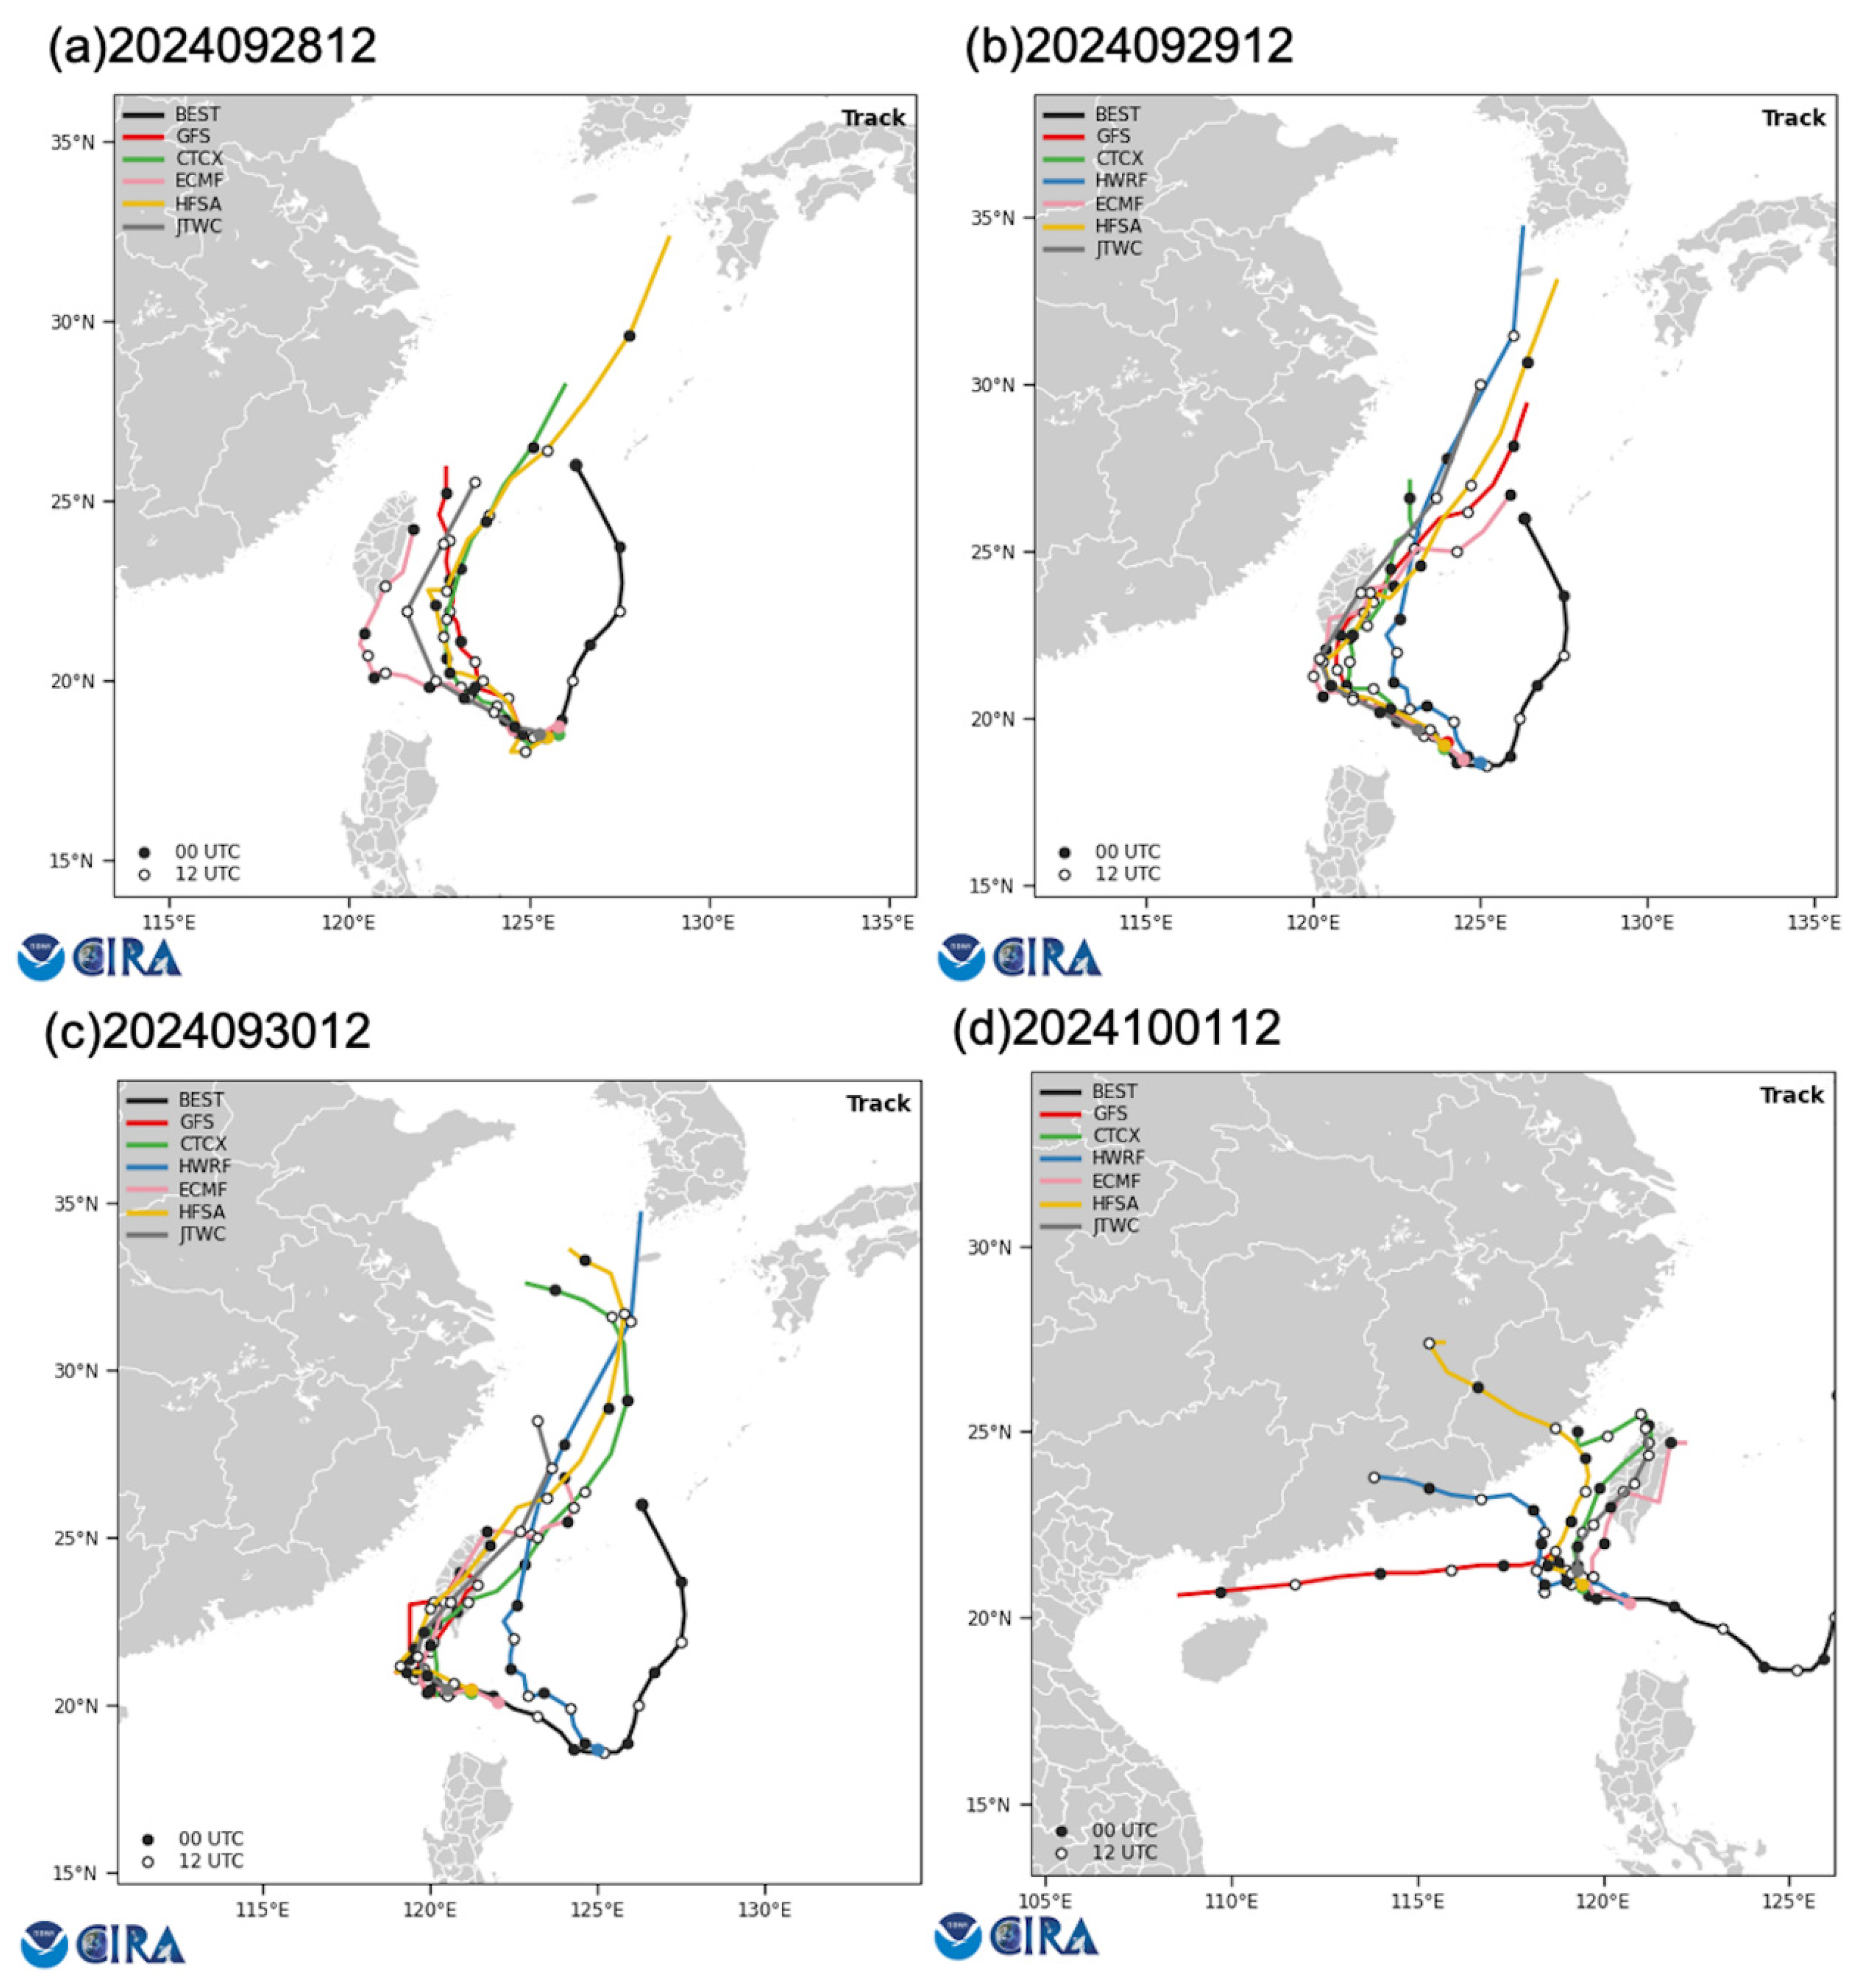
A summary of track forecasts of Krathon (20 W) from various sources is presented in
Figure 2 to illustrate the challenge of predicting an unusual track and associated intensification. With our guiding principle that the intensity changes beyond 72 h are primarily dependent on the track forecast, the scatter among the track forecasts in
Figure 2 can be expected to lead to quite different intensities. As indicated in the discussion of
Figure 2, the ECMWF deterministic model track forecasts were the most accurate in predicting the location and timing of the sharp turn from a westward movement to a poleward track threatening Taiwan. If the ECEPS control track forecast is accurate, the ensemble member track forecasts will also be accurate, and consequently, the ECEPS intensity forecasts should be accurate.
The sequence of ECEPS track forecasts for Krathon is provided in
Figure 11. At 00:00 UTC on 26 September (
Figure 11a), the pre-Krathon disturbance was at 22.5° N, 127.0° E and was still moving southward. While Krathon was predicted to cross 20° N at 06:00 UTC on 28 September near 125.7° E, the JTWC WBT had the crossing at 06:00 UTC on 27 September near 126.3° E, with an intensity of 25 kt. As indicated in
Figure 11a, the southernmost position was predicted to be just south of 20° N at 19.6° N, 125.3° E. By contrast, the JTWC WBT had Krathon near 18.5° N, 125.6° E at 06:00 UTC on 28 September, with an intensity of 35 kt. It was from that time that Krathon rapidly intensified by 80 kt in just 42 h, and the peak intensity of 130 kt was achieved at 18:00 UTC on 30 September when Krathon drifted north to near 20.6° N. That was also the time when Krathon turned to move poleward along 119.3° E (
Figure 1, purple line). In the 00:00 UTC 26 September forecast (
Figure 11a), the westernmost predicted position was near 23.1° N, 123.4° E, which is well to the east of Taiwan. However, the ECEPS track forecast spread was so large that there would be low confidence in that Day 5.0 position.
The 12:00 UTC 26 September ECEPS track forecast (
Figure 11b) was similar to the 00:00 UTC 26 September forecast, with a southward crossing of 20° N at around 12:00 UTC on 27 September and the southernmost predicted position at 12:00 UTC on 28 September near 19.1° N, 125.0° E. Krathon was then predicted to move northwestward to 23.0° N, 122.2° E at 12:00 UTC on 1 October before turning poleward well to the east of Taiwan. Again, the ECEPS track forecast spread was so large that there would be low confidence. The track forecast spread was significantly reduced during the early stage of the 00:00 UTC 27 September ECEPS forecast (
Figure 11c). Krathon was predicted to be quasi-stationary near 19.0° N, 125.1° E at 12:00 UTC on 28 September before turning to a more northwestward track near 22.1° N, 122.0° E at 00:00 UTC on 1 October. As indicated in
Figure 11c, there was a large east–west track spread of the predicted poleward turn at that time.
It was not until the 12:00 UTC 27 September ECEPS forecast (
Figure 11d) that the critical westward path along 20° N and, just as important, the turn northward along 120° E were correctly predicted. Note that ca. 10 of the ensemble member tracks continued westward beyond 120° E. For the first time, the ECEPS WMVM track forecast was toward the western side of the Central Mountain Range of Taiwan. However, the 00:00 UTC 28 September forecast reverted to Krathon not propagating as far westward along 20° N, even though ca. 10% of the ensemble member track forecasts did continue to the west of 120° E. Thus, the turn poleward was predicted too soon, and Krathon was predicted to pass just east of Taiwan and have a long life moving poleward over warm water (
Figure 11e).
The 12:00 UTC 28 September ECEPS forecast (
Figure 11f) was an improvement as the turn poleward was at 00:00 UTC on 1 October near 21.6° N, 120.3° E. Similar to the ECEPS control track forecast in
Figure 2a (pink line), Krathon was predicted to make landfall on the southern tip of Taiwan and pass along the east coast of Taiwan instead of along the west coast as observed. This was an important track forecast challenge due to the economic impacts of Krathon moving up the west coast of Taiwan, as in
Figure 1, being enormous compared to Krathon moving up the east coast. Recall that the other real-time model track forecasts from 12:00 UTC on 28 September in
Figure 2a were not as accurate. Furthermore, Krathon dissipated over the Central Mountain Range rather than having a long poleward path to threaten Korea on 6 October (Day 8).
As in
Section 3.3 and
Section 3.4, we next reviewed the Himawari-9 infrared imagery (
Figure 12) to examine the deep convection evolution around the pre-Krathon center as it crossed 20° N out of the unfavorable external environment predicted by the ECEPS forecasts in
Figure 11a–c. At 18:00 UTC on 27 September (
Figure 12a), the pre-Krathon circulation propagated southward down the north–south-oriented cloud band region that extends up to the top of the image. According to the JTWC WBT, Krathon’s center was near 19.1° N, 125.7° E. Note that there was only a small region of deep convection near the center, and it appeared to be tilted to the west. Another small deep-convection region was to the south of the center. However, the major outflow dome was between the center and Luzon Island (yellow line,
Figure 12a). The origin of that deep convection was in association with an outer rainband crossing 20° N to the west of the center. As that outflow spread to the west and to the south, the overall deep convection pattern in
Figure 12a is highly asymmetric with respect to the center. The JTWC WBT intensity and the CIMSS ADT + AIDT intensity at 00:00 UTC on 28 September (
Table 8, top row, brackets) were essentially the same at 35 kt and 36 kt, respectively.
The JTWC WBT at 06:00 UTC on 28 September had Krathon’s center at its southernmost position of 18.5° N, 125.6° E, but there was not an open eye and only a narrow rainband of deep convection in the western semicircle (
Figure 12b). The major outflow dome in
Figure 12a extended so far south that the overall deep connecting pattern was almost circular, with no apparent connection with the unfavorable environment to the north of 20° N. Given that this deep convection pattern was not centered on Krathon’s center, the JTWC kept the intensity at 35 kt. Although Krathon remained quasi-stationary near 18.5° N, 125.3° E for the next 12 h, the deep convection pattern in
Figure 12c with a major band to the north between the center and 20° N was an indication that northward motion would be starting. There was also an outer rainband farther to the south, so that the overall deep convection pattern was oblong, with a north–south orientation. Again, it is important that the JTWC intensity estimate at 18:00 UTC on 28 September was 50 kt, while the CIMSS ADT + AIDT intensity estimate was only 2 kt slower. Thus, there is an indication of the unfavorable environment leading to systematically lower ADT + AIDT intensities (
Table 8, top row, brackets).
By 06:00 UTC on 29 September (
Figure 12d), the deep convection pattern was more resembling of a TC with an outflow dome to the northeast of Krathon’s center that was near 19.2° N, 123.9° E, according to the JTWC WBT. The spiral rainband to the south and east tended to decay north of 20° N, and only wrapped around to the north of the center. The spiral rainband to the west started near 20° N and only extended southwest of the center. The 12 h period from 18:00 UTC on 28 September to 06:00 UTC on 29 September was one of the few times the CIMSS ADT + AIDT had a larger intensification (from 51 kt to 90 kt) than the JTWC intensification (50 kt to 80 kt). However, with the CIMSS technique, Krathon only increased by 5 kt to 95 kt during the next 6 h, while with the JTWC, it increased by 15 kt to also be at 95 kt.
The 18:00 UTC 29 September satellite image (
Figure 12e) is indicative of an intense TC, although the eye of Krathon was irregular and not small. The CIMSS ADT + AIDT had the intensity at 110 kt and indicated rapid intensification by 15 kt in the next 6 h. By contrast, the JTWC only indicated Krathon’s intensification from 105 kt at 18:00 UTC on 29 September to 115 kt at 00:00 UTC on 30 September. The noteworthy change in the deep convection pattern in
Figure 12e is the outer band to the northeast of the center, indicating a turn to move more poleward rather than continuing westward along 20° N. Finally, the 06:00 UTC 30 September Himawari-9 satellite image indicated a possible eyewall replacement cycle (ERC) with a large eye and deep-convection rainbands at a larger radius than in
Figure 12c. The ADT + AIDT technique indicated a decay of 5 kt at 06:00 UTC on 30 September from the peak value of 125 kt, and a decay of 13 kt by 12:00 UTC on 30 September. By contrast, the JTWC WBT did not indicate the peak value of 125 kt followed by an ERC decay. Rather, the JTWC WBT had a continuous intensification from 115 kt at 00:00 UTC on 30 September to a second peak value of 130 kt at 18:00 UTC on 30 September.
Although the overall intensification trend of Krathon reflected in the JTWC WBT was similar to the ADT + AIDT intensification, the adjusted WBT values derived from the ADT + AIDT were utilized for the initialization and validation of the ECEPS intensity forecasts (
Table 8, top row, brackets). The first ECEPS forecast of pre-Krathon (20 W) from 00:00 UTC on 26 September (
Table 8, row 1) was selected to demonstrate the availability of early guidance even when the JTWC formation alert had an intensity of only 15 kt and a CIMSS SATCON file had not been established. This forecast was of considerable interest because the ECEPS-predicted five-day intensity was 113 kt. Indeed, the ECEPS forecast was for an early intensification from 30 kt at 00:00 UTC on 27 September to 64 kt at 12:00 UTC on 28 September, which was an intermediate time between the satellite images in
Figure 12a,b. This ECEPS overintensification by ~15 kt relative to the adjusted WBT intensity persisted until 00:00 UTC on 29 September, which was when Krathon underwent an extreme RI from 56 kt to 125 kt in 24 h (
Table 8, top row, brackets). Even though the ECEPS did at least predict an intensification from 74 kt to 100 kt during those 24 h, it also did not predict the subsequent ERC, as in
Figure 12f. No JTWC intensity forecast was available for comparison with this 00:00 UTC 26 September ECEPS forecast, or for the next forecast (
Table 8, Rows 1 and 2).
The 12:00 UTC 26 September ECEPS intensity forecast was a large improvement (
Table 8, Row 2). The predicted intensities were generally within 5 kt of the adjusted WBT intensities until the extreme RI event began at 00:00 UTC on 29 September. That is, the ECEPS severely underpredicted the RI event, and also missed the subsequent ERC event. The same comments apply to the 00:00 UTC 27 September ECEPS forecast (
Table 8, Row 3). That is, the predicted intensities prior to the extreme RI event were reasonably accurate, but that extreme RI event was very underpredicted, and the ERC was missed. Furthermore, the same comments apply to the 12:00 UTC 27 September JTWC intensity forecast.
In the remainder of the ECEPS intensity forecasts from 12:00 UTC on 27 September (
Table 8, Row 4) through 12:00 UTC on 28 September (
Table 8, Row 6), the pre-extreme RI event intensities were relatively accurate, but the time intervals to the beginning of that RI event were getting shorter and shorter. Nevertheless, these later ECEPS forecasts greatly underpredicted the extreme RI event and failed to predict the ERC intensity decay and recovery. The JTWC forecasts were slightly better, in part because the initial intensities were higher than the adjusted WBT intensities (
Table 8, top row).
These ECEPS intensity forecasts were dependent on the track forecasts, as in
Figure 11. One reason the ECEPS intensity forecasts were too small during the extreme RI event was that the ECEPS tended to turn to the northwest too soon versus continuing farther west along 20° N and then turning north into the unfavorable external environment (
Figure 11a–c,f). Another possibility that should have been examined with Doppler radars from southern Taiwan and/or northern Luzon was the accuracy of the CIMSS ADT + AIDT intensities utilized for initialization and validation in
Table 8 (top row). Preliminary examination of the six infrared images between
Figure 12e and 12:00 UTC on 1 October indicated the conditions in the unfavorable environment may require a recalibration of the ADT + AIDT technique.


