Article

Atmospheric Concentration of Particulate Air Pollutants in the Context of Projected Future Emissions from Motor Vehicles

1
Faculty of Mechanical Engineering and Aeronautics, Rzeszow University of Technology, 35-959 Rzeszow, Poland
2
Faculty of Civil and Environmental Engineering and Architecture, Rzeszow University of Technology, 35-959 Rzeszow, Poland
*
Author to whom correspondence should be addressed.
Atmosphere 2025, 16(7), 878; https://doi.org/10.3390/atmos16070878
Submission received: 30 April 2025 / Revised: 4 July 2025 / Accepted: 15 July 2025 / Published: 17 July 2025
(This article belongs to the Section Air Quality)

Abstract

Ambient PM concentrations are influenced by various emission sources and weather conditions such as temperature, wind speed, and direction. Measurements using optical sensors cannot directly link pollution levels to specific sources. Data from roadside monitoring often show that a significant portion of PM originates from non-traffic sources. Therefore, vehicle-related PM emissions are typically estimated using simulation models based on average emission factors. This study uses the COPERT (Computer Programme to Calculate Emissions from Road Transport) model to estimate emissions from road vehicles under current conditions and future scenarios. These include the introduction of Euro 7 standards and a shift from internal combustion engine (ICE) vehicles to battery electric vehicles (BEVs). The analysis considers exhaust and non-exhaust emissions, as well as indirect emissions from electricity generation for BEV charging. The conducted study showed, among other findings, that replacing internal combustion engine vehicles with electric ones could reduce PM2.5 emissions by approximately 6% (2% when including indirect emissions from electricity generation) and PM10 emissions by about 10% (5% with indirect emissions), compared to the Euro 7 scenario.

1. Introduction

Road transport is considered a significant source of harmful substances emitted into the atmosphere [1,2]. Numerous toxic compounds generated by motor vehicles are well known and can be categorized into two main groups:
  • Compounds emitted due to incomplete and inefficient combustion of fuels in internal combustion engines [3,4];
  • Substances generated through the mechanical wear of vehicle components, released in the form of various particulate matter (solid-phase particles) [5,6].
Research conducted by scientists worldwide on engine exhaust emissions has enabled highly precise identification of toxic compounds in exhaust gases and the influence of various factors on their formation [7,8,9,10,11]. However, the generation of toxic substances resulting from the abrasion of brake pads, brake discs, clutch plates, tires, and road surfaces is a relatively new and considerably more complex source to quantify. These abrasion products, present as particulate matter that also contains toxic compounds, enter the atmosphere in large quantities, and persist in the air as suspended particles [12].
Some of these particulates settle near roads or on vertical surfaces such as walls, from where they can be resuspended by wind and reintroduced into the atmosphere. Once airborne again, they can easily penetrate living organisms, posing a serious threat to human health. Dust particles with adsorbed toxic substances—such as those presented in [13,14]—primarily affect the upper respiratory tract and are linked to the following:
  • Coughing, shortness of breath, throat inflammation, and exacerbation of allergic symptoms such as hay fever, conjunctivitis, eczema, or asthma [15];
  • Gastric cancer [16];
  • Respiratory and cardiovascular diseases, particularly cancers of the larynx and lungs, pneumonia, myocardial infarction, strokes, hypertension, and atherosclerosis [17,18].
It is also important to note that road vehicles are not the only sources of particulate matter. A substantial amount of PM is also emitted from natural sources (e.g., volcanic activity, plant dust), as well as from power plants, residential heating systems, and construction activities. As a result, determining the exact origin and source of particulate emissions remains very difficult [19].
Air pollution measurements enable the assessment of air quality based on the concentration of measured gaseous and particulate pollutants. These measurements are conducted within the scope of pollutant atmospheric concentration, which is proportional to the total emissions from all sources, taking into account meteorological and topographical conditions that affect the dispersion and transmission of pollutants in the atmosphere. Consequently, measurements of particulate matter concentrations and particle numbers do not allow for the precise determination of emissions from individual sources. This also applies to emissions from road vehicles [20,21,22].
To estimate pollutant emissions from vehicles, measurements are conducted at monitoring stations located near roadways. However, the results recorded at these stations also include pollutants originating from other emission sources. This issue is particularly evident in Poland, as well as in other countries and regions where significant differences in particulate matter atmospheric concentration are observed between the heating and non-heating seasons [23,24,25,26]. This indicates a substantial influence from heating sources used in residential buildings, which is further linked to the quality of fuels being used [27].
The low correlation between the atmospheric concentration of PM2.5 and PM10 particulate matter and traffic volume, as well as emissions from road transport, is confirmed by the emission shares presented in report [28], which account for the major sources of particulate pollution. The graph shown in Figure 1 indicates that the contribution of PM10 emissions from road transport accounts for approximately 7% of total emissions to the atmosphere, while for PM2.5, this figure is around 5%. It is also evident that the primary source of particulate emissions is the use of boilers for heating residential buildings. In 2024, emissions from domestic and municipal sources accounted for approximately 74% of PM10 emissions and 89% of PM2.5 emissions. This also applies to Benzo(a)pyrene (B(a)P), whose emissions are almost exclusively associated with this domestic and municipal source (approximately 99%). Car engines exhaust emissions are primarily associated with the release of nitrogen oxides (NOx), which accounted for approximately 39% of total emissions in 2024.
It is therefore evident that, despite the implementation of sustainable transport solutions in Rzeszow [29,30], air quality—particularly during the heating season—remains unsatisfactory. A similar situation is observed in other cities across Poland, as demonstrated in previous studies [31,32,33].
A significant contribution of particulate matter emissions in the atmospheric air from vehicles can be observed in relation to emissions in engine exhaust gases through tests on engine dynamometers or chassis dynamometers, as well as in enclosed spaces such as parking lots [34,35,36] or tunnels [37,38,39]. During particulate matter concentration measurements in laboratories, non-exhaust emissions are also taken into account [40]. These emissions are associated with the wear of tires, brakes, and road surfaces.
In order to reduce emissions from the road transport sector in urban areas, Low Emission Zones (LEZs) are being introduced. These zones restrict access for vehicles with internal combustion engines—particularly older models with lower Euro emission standards. Furthermore, beginning in 2035, the European Union plans to phase out internal combustion engines in new passenger cars and light commercial vehicles, replacing them with electric drivetrains [41].
In recent years, increasing attention has been paid not only to the health and environmental impacts of particulate matter (PM) emissions from road transport but also to the development and refinement of methods for estimating and forecasting such emissions. Since direct measurement of the contribution of road transport to ambient PM concentrations is limited by the influence of multiple emission sources and meteorological variability, modelling approaches have become essential tools in this area.
Among the most widely used models is COPERT (Computer Programme to Calculate Emissions from Road Transport), developed by the European Environment Agency, which estimates pollutant emissions based on fleet composition, vehicle types, fuel consumption, and standardized emission factors. Other models, such as the U.S. EPA’s MOVES (Motor Vehicle Emission Simulator), or bottom-up inventory approaches, also allow for detailed scenario analysis, considering changes in vehicle technologies, driving patterns, and regulatory interventions. A detailed review of models used to estimate non-exhaust particulate emissions is provided in [5].
The primary objective of this article is to conduct a comparative assessment of particulate matter emissions from vehicles operating in the Rzeszow metropolitan area under three research scenarios:
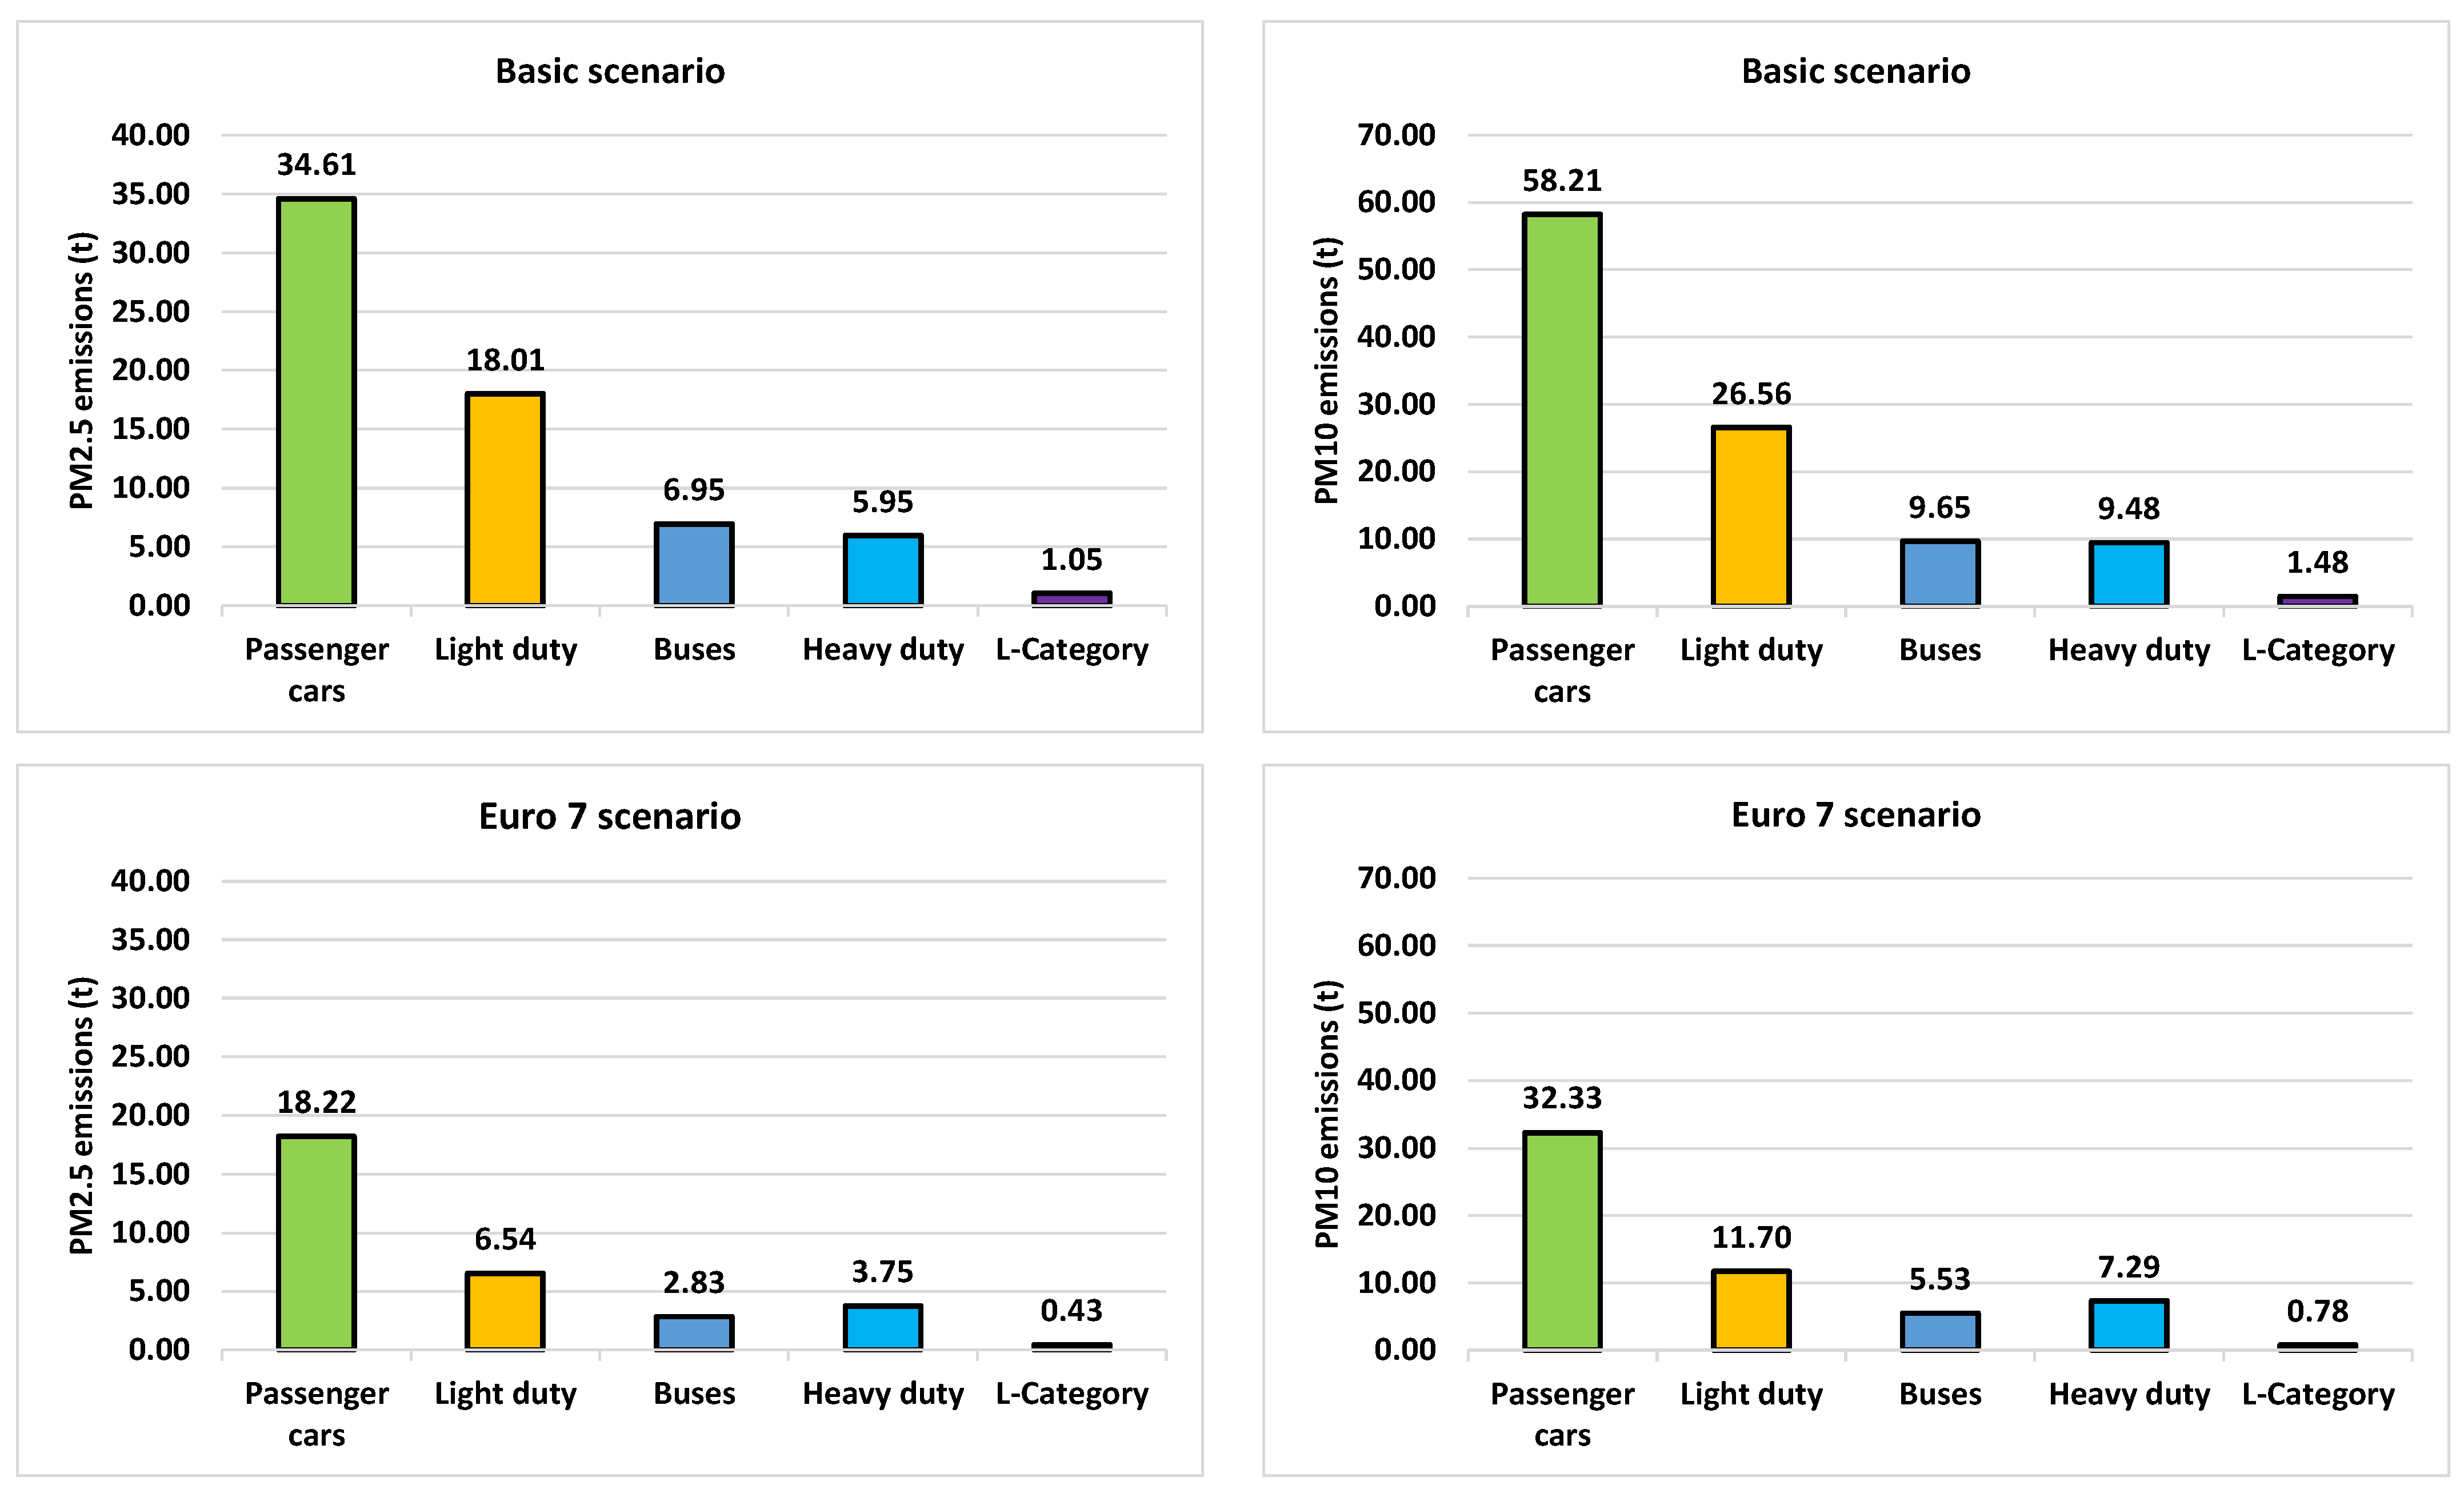
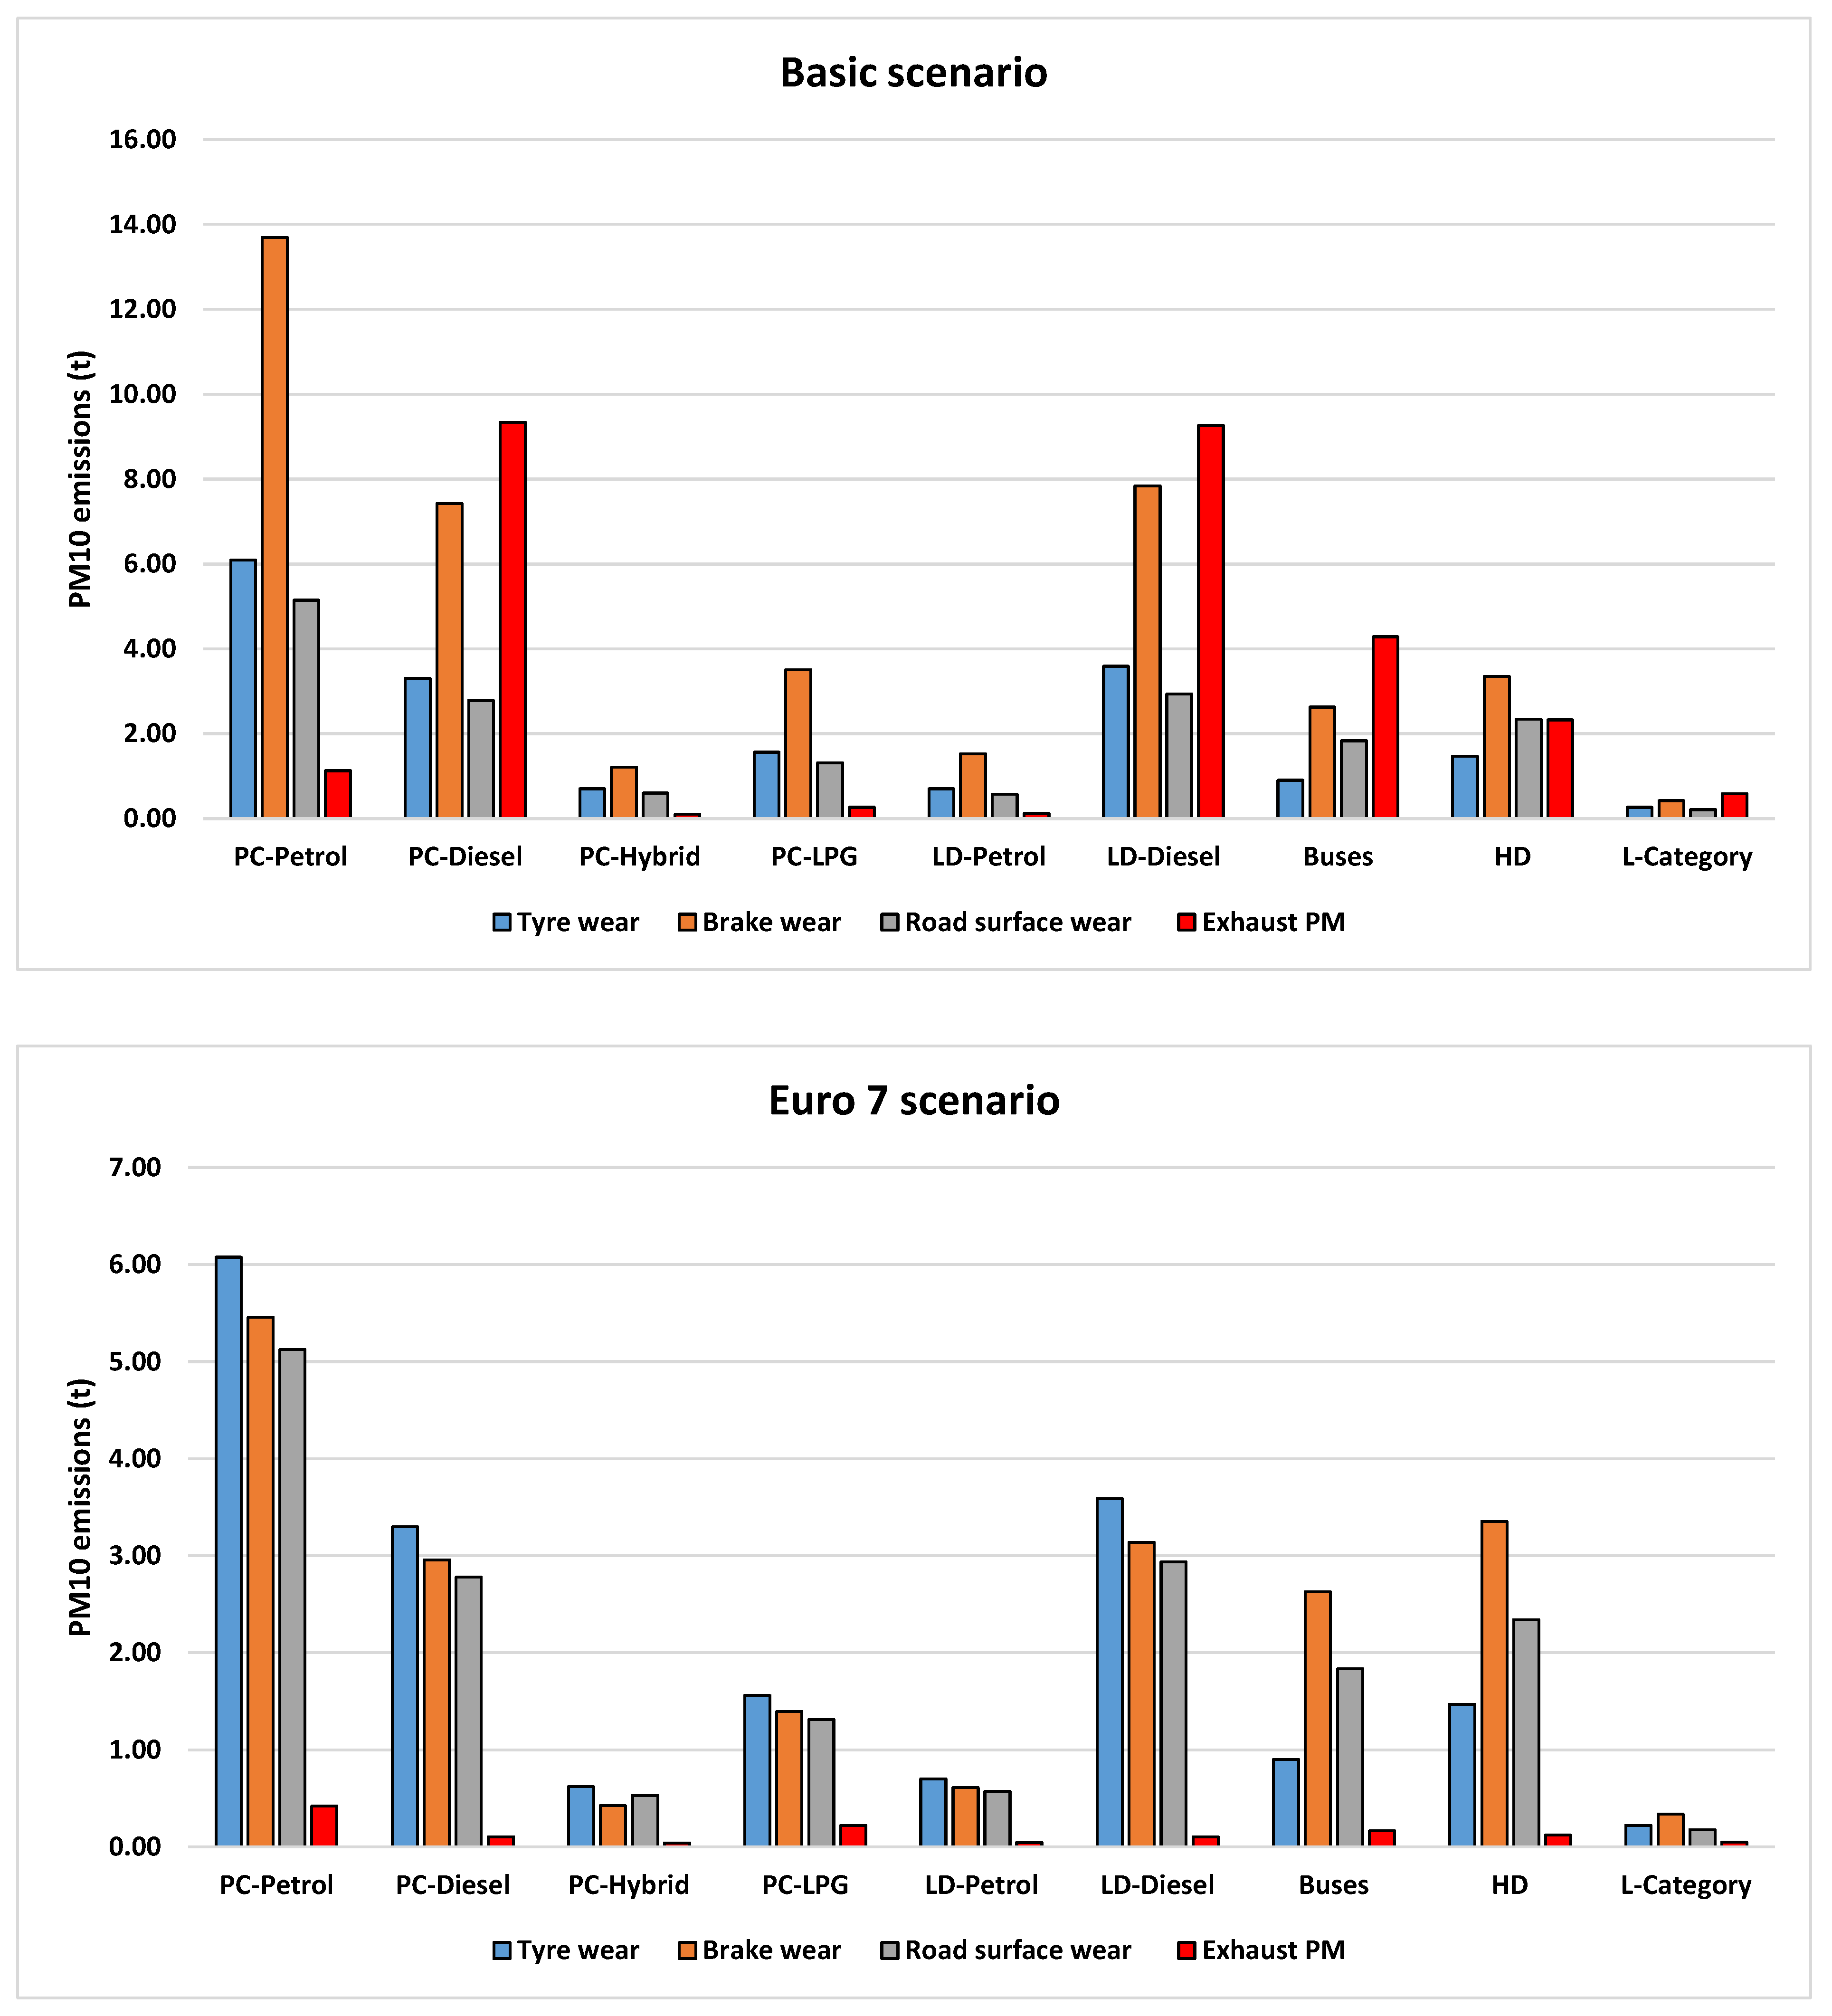
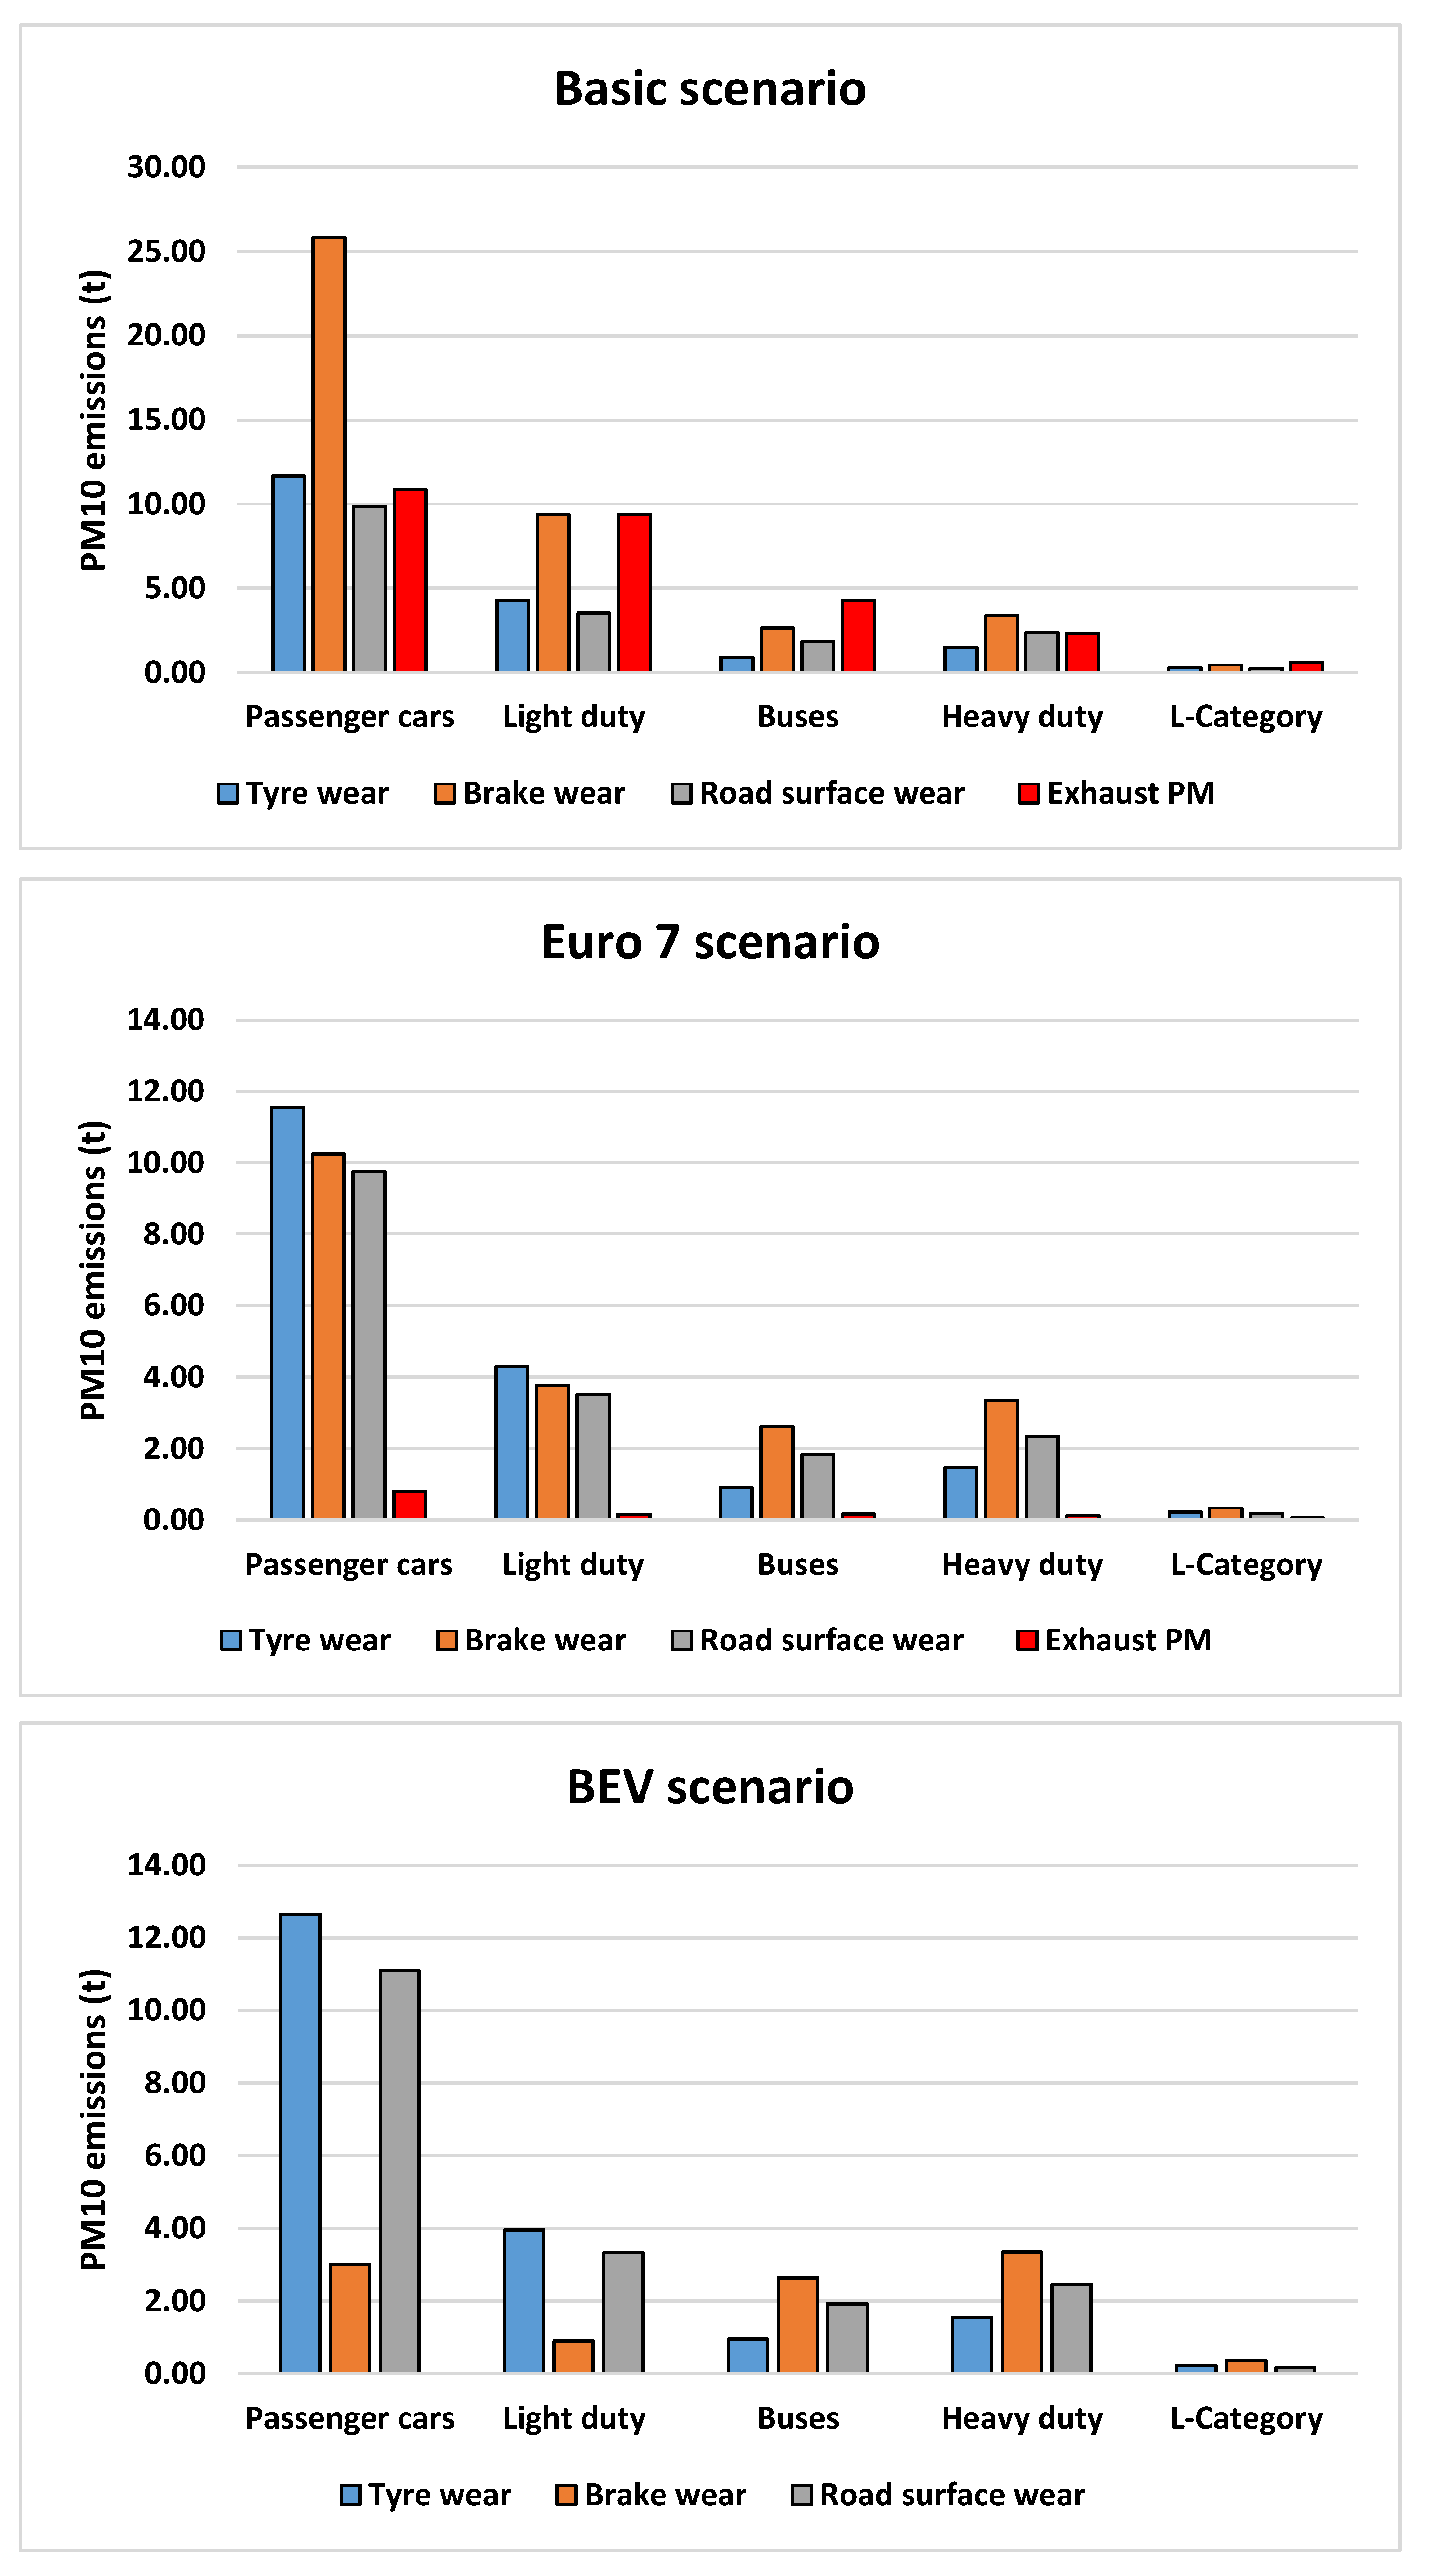
  • Basic Scenario—representing the current vehicle fleet composition;
  • Euro 7 Scenario—assuming the same number of vehicles as in the Basic scenario, but all vehicles meet Euro 7 standards, and buses and trucks meet Euro VII standards;
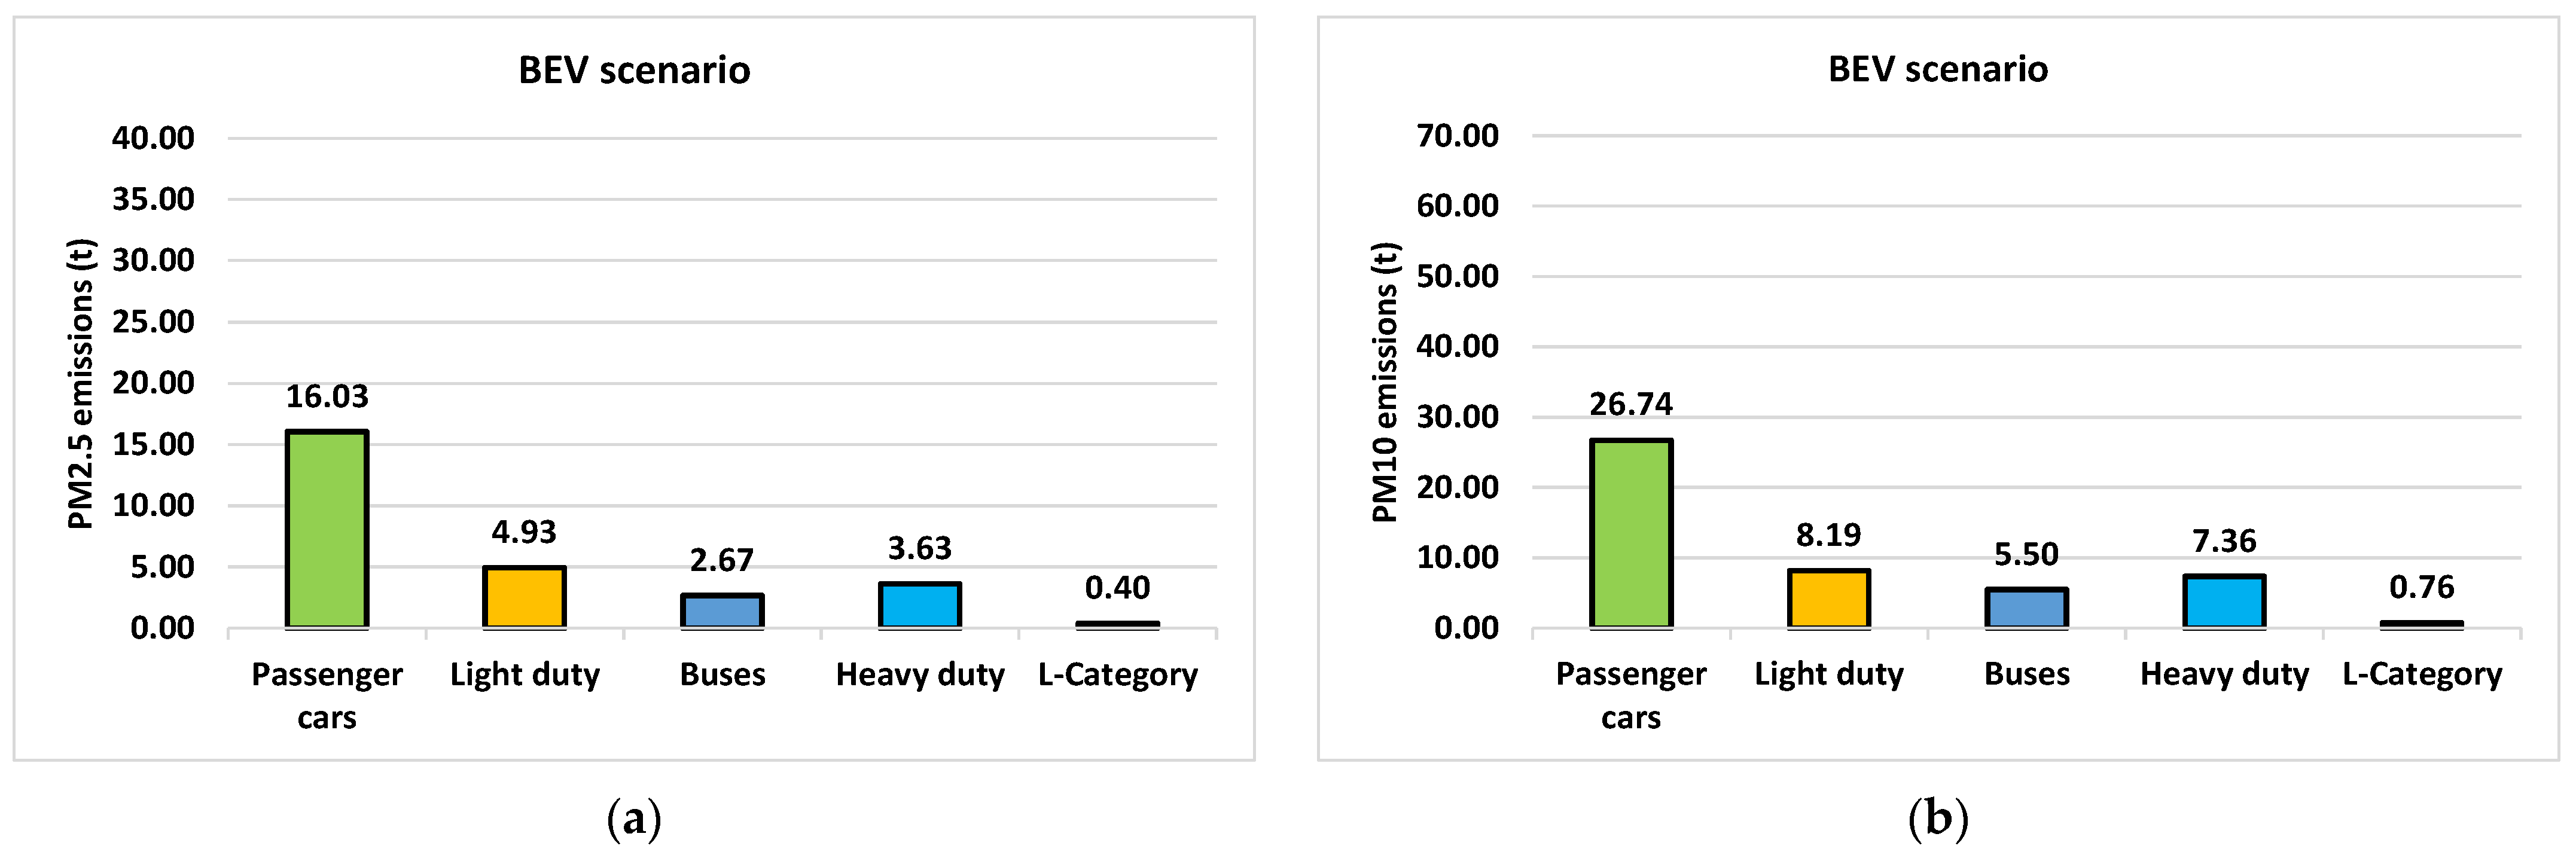
  • BEV Scenario—assuming that all vehicles are battery electric vehicles (BEVs).
The novelty of the present study lies in its integrated and comparative assessment of particulate matter emissions—both exhaust and non-exhaust—under three distinct scenarios for the vehicle fleet in the Rzeszow metropolitan area: the current baseline, full compliance with Euro 7/VII standards, and a complete transition to battery electric vehicles (BEVs). While numerous studies have addressed exhaust emissions from internal combustion engines, the quantification and inclusion of non-exhaust emissions (e.g., tire, brake, and road surface wear) remain relatively underexplored, especially in regional-scale emission inventories. Our study goes beyond conventional analyses by also incorporating indirect emissions associated with electricity generation for BEV charging, which are often neglected in urban transport assessments. By applying the COPERT 5.8 model—the latest version with significant updates including Euro 7 vehicles—we provide a timely and practical evaluation of emission reduction potential in light of the EU’s planned 2035 ban on new internal combustion engine vehicles. This makes our work particularly relevant for policymakers and urban planners seeking to design evidence-based strategies for cleaner urban air in the context of energy transition and climate goals.

2. Materials and Methods

The calculation of particulate matter emissions was conducted based on the vehicle type and age structure of motor vehicles registered in the Rzeszow district, according to 2023 data provided by the Central Statistical Office of Poland (GUS) [42]. Figure 2 presents the age distribution of vehicles included in the analysis. The dominant category consisted of vehicles aged 16–20 years, which predominantly fall under the Euro 4 emission standard (30,269 vehicles).
Considering the total number of vehicles in each emission class, the largest group comprised vehicles aged 1–9 years, compliant with the Euro 6 standard (59,157 vehicles). The number of vehicles aged 10–15 years, falling under the Euro 5 class, amounted to 35,062. Additionally, there were 16,590 vehicles in the Euro 3 class, 5514 in the Euro 2 class, and 19,359 in the Euro 1 class.
The analysis also accounted for engine propulsion types and fuels used, including petrol, diesel, LPG, and CNG. Figure 3 shows the percentage share of passenger cars, light-duty vehicles (LDVs), and buses, classified by fuel type. Among passenger cars, petrol-fueled vehicles constituted the largest share (approximately 52.7%). Diesel-fueled vehicles accounted for around 28.6%, while LPG-fueled vehicles made up approximately 13.5%.
In the light-duty vehicle category, diesel vehicles had the largest share (approximately 77.8%), followed by petrol vehicles (around 11.6%) and LPG vehicles (approximately 4.8%). Similarly, in the bus category, the majority (about 70.9%) were powered by diesel fuel, while the remaining buses primarily operated on compressed natural gas (CNG) or were electrically powered. Heavy-duty vehicles (HDVs) were exclusively powered by diesel, while mopeds and motorcycles were powered by petrol.
The calculations were performed using the COPERT v. 5.8 software (EMISIA SA, Thessaloniki, Greece). For the calculations of PM emissions from non-exhaust systems, the Tier 2 EMEP/EEA methodology [43] was adopted.
According to this methodology, the estimated emission from tire and brake wear is expressed by Equation (1), while the emission related to road surface wear is expressed by Equation (2) [43]:
T E S = j N j · M j · E F i , s , j
T E R = j N j · M j · E F i , R , j
where
TES is the total emissions resulting from tire and brake wear (g);
TER is the total emissions resulting from road surface wear (g);
Nj is the number of vehicles in category j within the defined spatial boundary;
J is the index relates to the vehicle category;
Mj is the mileage (km) driven by each vehicle in category j during the defined time period;
EFi,s,j is the mass emission factor for particle classes i (PM10 and PM2.5), source of PM s (tire (T), or brake (B) wear) for vehicles in category j (g/km);
EFi,R,j is the mass emission factor for road surface wear for particle classes i, for vehicles in category j (g/km).
The emission factor values are expressed by the following formulas [43]:
E F i , s , j = E F T S P , s , j · f s , i · S s ( V )
E F i , R , j = E F T S P , R , j · f R , i
where
EFTSP,s,j is the Total Solid Particles (TSPs) mass emission factor for vehicles in category j (g/km);
s is the index refers to the source of PM, i.e., tire (T) or brake (B) wear;
fs,i is the mass fraction of TSP that can be attributed to particle size class i;
EFTSP,R,j is the TSP mass emission factor for road surface wear, for vehicles in category j (g/km);
fR,i is the mass fraction of road surface wear attributed to particle size class i;
Ss(V) is the correction factor for a mean vehicle travelling speed V.
The values of the emission factors EFTSP,T,j, EFTSP,B,j, and EFTSP,R,j were adopted based on reference [43]. Correction factors for tire (ST(V)) and brake (SB(V)) wear for a mean vehicle travelling speed are expressed by formula [43]:
S T V = 1.39           for     V < 40   km / h 0.00974 · V + 1.78           for     40   km / h V 90   km / h 0.902           for     V > 90   km / h
S B V = 1.67           for     V < 40   km / h 0.0270 · V + 2.75           for     40   km / h V 95   km / h 0.185           for     V > 95   km / h
Size distribution of tire fT,i, brake fB,i, and road surface wear particles fR,i are represented in Table 1.
For heavy-duty vehicles and buses, the emission factor for tire wear EFTSP,T,HDV and for brake wear EFTSP,B,HDV are represented by the equations [43]:
E F T S P , T , H D V = N a x l e 2 · L C F T · E F T S P , T , P C
E F T S P , B , H D V = 1.956 · L C F B · E F T S P , B , P C
where
EFTSP,T,HDV is the TSP emission factor (g/km) for tire wear from heavy-duty vehicles;
EFTSP,B,HDV is the TSP emission factor (g/km) for brake wear from heavy-duty vehicles;
Naxle is the number of truck axles;
LCFT is a load correction factor for tire wear;
LCFB is a load correction factor for brake wear;
EFTSP,T,PC is the TSP emission factor for tire wear from passenger cars—ICE;
EFTSP,B,PC is the TSP emission factor for brake wear from passenger cars—ICE.
Load correction factor for tire wear and brake wear, are expressed by the equations [43]:
L C F T = 1.41 + 1.38 · L F
L C F B = 1 + 0.79 · L F
where
LF is the load factor, ranging from 0 for an empty truck to 1 for a fully laden one.
The PM emission in exhaust gases was calculated using the methodology represented in the work [44].
The emission factor values for individual vehicle categories, adopted for the calculation of PM2.5 and PM10 emitted in exhaust gases, are included in [45] and implemented in the COPERT 5.8.1 software, which was used for the calculations.
The calculations were carried out based on the following assumptions:
  • Average driving speed V = 27 km/h (this represents the average speed value determined using the OBD system in a vehicle operated within the analyzed area of Rzeszow County over a one-year period);
  • Average load of a truck/bus 50%;
  • Average annual mileage of a passenger car 10,000 km;
  • Average annual mileage of a truck 20,000 km;
  • Average annual mileage of a bus 60,000 km;
  • Average annual mileage of a motorcycle/moped 5000 km.
The vehicle classification was based on statistical data. It was assumed that, within each passenger car category, the number of vehicles using specific fuel types (petrol, LPG, diesel, hybrid) was assigned according to the percentage shares observed across the entire vehicle fleet. A similar approach was applied to light-duty vehicles. As for buses, the numbers for each category and fuel type (diesel fuel, CNG, hybrid, electric) were determined based on data provided by the Municipal Transport Company in Rzeszow.
To ensure the reproducibility of our results, a detailed quantitative breakdown of the analyzed vehicles is included in the Supplementary Materials as Table S1. For the Euro 7 and BEV scenarios, the analysis was conducted using the total numbers of vehicles for each type and category, assumed, respectively, to comply with Euro 7 standards or be battery electric vehicles.
For the calculations of PM emissions from tire wear, brake systems, and road surface wear, the emission factors (EFi,T,j, EFi,B,j, EFi,R,j) included in Tables S2–S4 (found in the Supplementary Materials), were adopted. These emission factor values (EF2.5,T,j, EF2.5,B,j, EF2.5,R,j, EF10,T,j, EF10,B,j, EF10,R,j), which account for speed correction factors as well as the number of axles and load for heavy-duty vehicles, were used in the emission calculations in accordance with Equations (1) and (2). For heavy duty vehicles with electric drive, the emission factor values for tires and brakes were assumed to be 5% higher. This is due to their higher weight compared to vehicles with internal combustion engines [46].

3. Results and Discussion

The calculation results present annual vehicular dust emissions in Rzeszow County, based on the assumptions detailed in Section 2. The outcomes refer to three distinct research scenarios. In the first scenario, emissions from vehicles were calculated for the baseline scenario. This scenario considers the existing number of vehicles, categorized by emission classes and types of propulsion. In the second scenario, named Euro 7, calculations were carried out under the assumption that vehicles meet the Euro 7 emission standards (for light vehicles) and EURO VII standards (for heavy vehicles). In this scenario, it was assumed that emissions from all motorcycles and scooters correspond to the values defined by the Euro 5 standards. The third scenario, BEV scenario, presents the results of emission calculations assuming that all vehicles are equipped with battery electric drive systems. In this case, no exhaust emissions occur, and the emissions are solely related to tire wear, brake wear, and road surface wear. Additionally, for scenario 3, the indirect emissions associated with the production of electricity [47] needed to charge the BEV batteries were also calculated.
Figure 4 shows the results of the PM2.5 and PM10 dust emission calculations for the analyzed research scenarios.
Figure 4a presents the results of the PM2.5 emissions calculations for the analyzed research scenarios. Similarly to PM10 emissions, the highest PM2.5 emissions were observed for the Basic scenario, where emissions from passenger cars amounted to approximately 34.6 tons, and from LDVs to approximately 18 tons. For the Euro 7 scenario, PM2.5 emissions from passenger cars were about 18.2 tons, while for light-duty vehicles, it was around 6.5 tons. In the BEV scenario, PM2.5 emissions from passenger cars decreased to approximately 16 tons and to about 4.9 tons for LDVs.
The highest PM10 emission (Figure 4b) occurs in the Basic scenario, where the emission from passenger cars amounts to approximately 58.2 tons, while for light-duty vehicles (LDVs) it is about 25.86 tons. In the Euro 7 scenario, the PM10 emission from passenger cars was about 32.3 tons, while for LDVs it was around 11.7 tons. Replacing the internal combustion engine with an electric drive reduces PM10 emissions to approximately 26.7 tons for passenger cars and around 8.2 tons for LDVs.
Figure 5 shows the percentage shares of PM2.5 and PM10 dust emissions for the Basic and Euro 7 scenarios. It is evident that, for PM10 dust for Basic scenario (Figure 5a), non-engine emissions are higher than exhaust emissions for all types of analyzed vehicles. The highest share of PM10 emissions in the exhaust is observed for buses (approximately 44% of total PM10 emissions), while the lowest is for heavy-duty vehicles (about 24% of total PM10 emissions). Regarding PM2.5 emissions, except for passenger cars and heavy-duty vehicles, higher emissions occurred in the engine exhaust. The highest share was found for buses, where PM2.5 emissions in the exhaust accounted for about 68% of total PM2.5 emissions.
For the Euro 7 scenario (Figure 5b), improvements in internal combustion engine technology in these vehicles result in a significant reduction in PM10 and PM2.5 exhaust emissions. The highest exhaust emissions were observed for L-category vehicles (approximately 6% for PM10 and approximately 11% for PM2.5), which is due to the emission factor assumed for these vehicles according to the Euro 5 standard.
Figure 6 presents a comparison of PM10 dust emissions from different types of vehicles for the Basic and Euro 7 scenarios. In the Basic scenario, emissions related to brake wear dominate, particularly for passenger cars with gasoline-powered engines. For vehicles equipped with diesel engines, the highest emissions in this scenario are associated with exhaust gases. In the Euro 7 scenario, the main source of PM10 emissions for passenger cars and LDVs was tires. For buses, trucks, and L-category vehicles, emissions from brake wear were dominant. Figure 7 illustrates the comparative results of PM10 dust emissions for the analyzed scenarios and individual vehicle categories. As seen in Figure 6, the introduction of Euro 7 standards will lead to a significant reduction in engine exhaust PM emissions. However, non-engine emissions remain. In the case of BEVs (battery electric vehicles), further reduction in brake wear dust emissions is possible due to regenerative braking.
Figure 8 presents the comparative results of PM2.5 dust emissions for the analyzed scenarios and individual vehicle categories. It is evident that, for the Basic scenario, the biggest issue related to the emission of these dust particles for all vehicle categories is exhaust gases. Similarly to PM10, the introduction of Euro 7 standards will lead to a significant reduction in PM2.5 emissions from engine exhaust gases. For the BEV scenario, the greatest reduction in PM2.5 emissions would be possible, although the differences between the Euro 7 and BEV variants are not large.
In the case of the third scenario, which assumes replacing the internal combustion engine with an electric drive, it is also important to consider the indirect emissions related to the generation of electricity, with an average level of 0.014 kg/MWh [47]. Assuming the energy indicators defined for Poland for the year 2023, the additional particulate emissions related to electricity generation amounted to 3 tons of PM2.5 and 4.2 tons of PM10. Figure 9 shows the total emissions of PM2.5 and PM10 for all variants. For variant 3 (BEV scenario), the indirect emissions related to electricity generation were also included. The total PM2.5 emission for the Basic scenario was approximately 66.6 tons, while the PM10 emission was approximately 105.4 tons. For the Euro 7 scenario, the PM2.5 emission was approximately 31.8 tons. In the case of PM10, the emission for the Euro 7 scenario was approximately 57.6 tons. The lowest PM2.5 and PM10 emissions were achieved for the BEV variant. In this case, the PM2.5 emission was approximately 28 tons (approximately 30.8 tons when considering the indirect emissions related to electricity generation), while for PM10, the emission was approximately 48.2 tons (52.5 tons when including the indirect emissions).
The emission differences presented in Figure 10 indicate that by replacing vehicles with those meeting the Euro 7 (EURO VII) standards, the mass of emitted PM2.5 particles could be reduced by approximately 52%, while the mass of PM10 particles could be reduced by around 45%. For the scenario assuming the replacement of the entire vehicle fleet with electric vehicles, a reduction of approximately 58% in the mass of emitted PM2.5 particles and around 56% in the mass of emitted PM10 particles would be achievable. These values are based on the assumption that the electricity used to power the vehicles would come exclusively from renewable and zero-emission sources. However, if indirect emissions from electricity generation in Poland (using the 2023 emission factor) are considered, the reduction in the mass of emitted PM2.5 particles would be around 53%, while PM10 particles would decrease by about 50%.
The analyses show that the difference between emissions from vehicles meeting the Euro 7 emission standard and those powered by BEVs is approximately 6% for PM2.5 particles and about 10% for PM10 particles.
In this study, the COPERT model was used to estimate road transport emissions based on average emission factors assigned to specific vehicle categories and technologies. While this approach is widely applied in emission assessments, it is important to emphasize that actual road usage patterns may significantly differ from the assumptions made in the model. Traffic volume, fleet composition, driving behavior, and road conditions can all substantially influence real-world emission levels.
Therefore, the estimated pollutant emissions expressed in tons may not fully reflect actual emissions for a given location or time period. Acknowledging this dependency is crucial for appropriately interpreting the results, particularly in the context of their application to environmental policy development and emission reduction strategies. Future analyses could benefit from integrating empirical data on local traffic activity to improve the accuracy of emission estimates and their relevance for decision-makers.
Nevertheless, the assumptions adopted in the study were sufficient to carry out a comparative assessment of vehicle pollutant emissions under identical conditions across the examined research scenarios. Given that particulate atmospheric concentration in Poland are not significantly related to vehicle emissions, to improve air quality, especially during the heating season, it is necessary to reduce emissions from municipal and residential sources, including heating systems in homes. According to the analysis of heat sources in Poland, based on data from the [48], the largest share consists of solid fuel boilers with an emission standard below class 3 (about 50.8%), while desired class 5 boilers and so-called Ecodesign class boilers account for about 17% and 2%, respectively. It is well established that, during the winter season, emissions of particulate matter and gaseous pollutants also originate from individual residential heating systems. According to [49], the average annual PM10 emissions from a single solid-fuel boiler in a detached house range from approximately 17.5 kg/year for biomass boilers to around 20.5 kg/year for coal-fired boilers, depending on the type of fuel used.

4. Conclusions

Based on the conducted calculations and assumed conditions, the following can be stated:
  • The replacement of vehicles with low-emission ones (Euro 7) may contribute to a reduction in PM2.5 dust emissions by about 52% in the Rzeszow district, and PM10 dust emissions by about 55%.
  • Replacing internal combustion engine vehicles with BEV (battery electric vehicle) electric vehicles could reduce PM2.5 dust emissions by about 58% and PM10 dust emissions by about 54% in the analyzed district.
  • Considering the additional indirect emissions associated with electricity production, the reduction in PM2.5 dust emissions for the BEV scenario would be approximately 54%, and PM10 dust emissions would be about 50%.
  • Replacing internal combustion engine vehicles with electric vehicles is associated with a significant reduction in emissions of gaseous pollutants (NOx, CO, CO2, THC, etc.). However, eliminating internal combustion engine vehicles will not significantly reduce particulate pollution levels. When comparing emissions for the Euro 7 and BEV scenarios, replacing internal combustion engine vehicles with electric ones could reduce PM2.5 dust emissions by about 6% (around 2% considering indirect emissions from electricity production for battery charging), and PM10 dust emissions by about 10% (around 5% considering indirect emissions).
Future research should take a more holistic approach to assessing air pollution by incorporating additional factors beyond road transport. This includes analyzing emission reductions resulting from the replacement of heat sources and the thermal modernization of buildings under the Polish government’s “Clean Air” program [50]. A key research priority is the more precise quantification of non-exhaust particulate emissions, particularly those generated by brake, tire, and road surface wear [46,51] under real-world driving conditions—an issue already partially addressed in the Euro 7 standard. There is also a need to develop more advanced models that reflect the variability of emissions based on vehicle load, traffic intensity, and environmental conditions. Additionally, future studies should consider the regional variability of indirect emissions from electricity generation for electric vehicles, accounting for differences in local energy mixes. Incorporating seasonal dynamics, especially the significant impact of residential heating in winter, will further enhance the understanding of urban air quality.
The results presented in this article may be useful, for example, to decision-makers, urban planners, environmental protection organizations, and institutions involved in transport infrastructure planning.

Supplementary Materials

The following supporting information can be downloaded at https://www.mdpi.com/article/10.3390/atmos16070878/s1. Table S1. Adopted vehicle classification for analysis in the Basic scenario; Table S2. PM2.5 and PM10 emission factors for road vehicle tire wear, road vehicle brake wear, and road surface wear for Basic scenario; Table S3. PM2.5 and PM10 emission factors for road vehicle tire wear, road vehicle brake wear, and road surface wear for Euro 7 scenario; Table S4. PM2.5 and PM10 emission factors for road vehicle tire wear, road vehicle brake wear, and road surface wear for BEV scenario.

Author Contributions

Conceptualization, A.J. and K.B.; Data curation, A.J.; Formal analysis, A.J.; Investigation, A.J., H.K., K.B. and B.B.; Methodology, A.J.; Resources, A.J., H.K., K.B. and B.B.; Software, A.J. and K.B.; Supervision, A.J. and H.K.; Validation, A.J., H.K., K.B. and B.B.; Visualization, A.J. and K.B.; Writing—original draft, A.J., H.K., K.B. and B.B.; Writing—review and editing, A.J., H.K., K.B. and B.B. All authors have read and agreed to the published version of the manuscript.

Funding

This research received no external funding.

Institutional Review Board Statement

Not applicable.

Informed Consent Statement

Not applicable.

Data Availability Statement

Data are contained within the article.

Acknowledgments

The author wishes to acknowledge the Polish Ministry of Science and Higher Education and Rzeszow University of Technology for supporting this research.

Conflicts of Interest

The authors declare no conflicts of interest.

References

  1. Targa, J.; Colina, M.; Banyuls, L.; González Ortiz, A.; Soares, J. Status Report of Air Quality in Europe for Year 2024, Using Validated and Up-to-Date Data (ETC-HE Report 2025/1); European Topic Centre on Human Health and the Environment: Truro, UK, 2024. [Google Scholar] [CrossRef]
  2. Ortega, J.L.M.; Akkermans, S.; Lopez, P.; Chornet, J.; Petrides, Y.R.; Vella, A.; Dauwe, T.; Ebrahimi, B.; Bouman, E.; Moran, D.D. ETC CM Report 2024/03. European Topic Centre on Climate Change Mitigation. 2024. Available online: https://www.eionet.europa.eu/etcs/etc-cm/products/etc-cm-report-2024-03/%40%40download/file/ETC%2520Report%25202024-03%2520(1).pdf (accessed on 29 April 2025).
  3. Jamrozik, A.; Tutak, W.; Gruca, M.; Pyrc, M. Performance, emission and combustion characteristics of CI dual fuel engine powered by diesel/ethanol and diesel/gasoline fuels. J. Mech. Sci. Technol. 2018, 32, 2947–2957. [Google Scholar] [CrossRef]
  4. Jaworski, A.; Kuszewski, H.; Balawender, K.; Woś, P.; Lew, K.; Jaremcio, M. Assessment of CH4 Emissions in a Compressed Natural Gas-Adapted Engine in the Context of Changes in the Equivalence Ratio. Energies 2024, 17, 2095. [Google Scholar] [CrossRef]
  5. Giechaskiel, B.; Grigoratos, T.; Mathissen, M.; Quik, J.; Tromp, P.; Gustafsson, M.; Franco, V.; Dilara, P. Contribution of Road Vehicle Tyre Wear to Microplastics and Ambient Air Pollution. Sustainability 2024, 16, 522. [Google Scholar] [CrossRef]
  6. Laskowski, P.P.; Zimakowska-Laskowska, M. The problem of emission of total particulate matter and heavy metals from tribological systems in vehicles. Combust. Engines 2024, 198, 13–19. [Google Scholar] [CrossRef]
  7. Grigoratos, T.; Fontaras, G.; Giechaskiel, B.; Zacharof, N. Real world emissions performance of heavy-duty Euro VI diesel vehicles. Atmospheric Environ. 2019, 201, 348–359. [Google Scholar] [CrossRef]
  8. Pielecha, J.; Merkisz, J.; Markowski, J.; Jasiński, R.; Filipowicz, M.; Dudek, M.; Olkuski, T.; Styszko, K. Analysis of Passenger Car Emission Factors in RDE Tests. In Proceedings of the E3S Web of Conferences, Poznan, Poland, 17–19 May 2016; Volume 10, p. 00073. [Google Scholar] [CrossRef]
  9. Ziółkowski, A.; Fuć, P.; Lijewski, P.; Jagielski, A.; Bednarek, M.; Kusiak, W. Analysis of Exhaust Emissions from Heavy-Duty Vehicles on Different Applications. Energies 2022, 15, 7886. [Google Scholar] [CrossRef]
  10. Lijewski, P.; Merkisz, J.; Fuć, P.; Ziółkowski, A.; Rymaniak, L.; Kusiak, W. Fuel consumption and exhaust emissions in the process of mechanized timber extraction and transport. Eur. J. For. Res. 2017, 136, 153–160. [Google Scholar] [CrossRef]
  11. Gis, W.; Gis, M.; Pielecha, J.; Skobiej, K. Alternative Exhaust Emission Factors from Vehicles in on-Road Driving Tests. Energies 2021, 14, 3487. [Google Scholar] [CrossRef]
  12. Mattonai, M.; Nacci, T.; Modugno, F. Analytical strategies for the quali-quantitation of tire and road wear particles. A critical review. Trends Anal. Chem. 2022, 154, 116650. [Google Scholar] [CrossRef]
  13. Beji, A.; Deboudt, K.; Muresan, B.; Khardi, S.; Flament, P.; Fourmentin, M.; Lumiere, L. Physical and chemical characteristics of particles emitted by a passenger vehicle at the tire-road contact. Chemosphere 2023, 340, 139874. [Google Scholar] [CrossRef]
  14. Koupal, J.; Denbleyker, A.; Kishan, S.; Vedula, R.; Agudelo, C. Brake Wear Particulate Matter Emissions Modelling; Eastern Research Group, Inc.: Concord, MA, USA; LINK Engineering Company: Plymouth, MI, USA, 2021; p. CA21-3232. Available online: https://rosap.ntl.bts.gov/view/dot/60273 (accessed on 24 May 2024).
  15. Seihei, N.; Farhadi, M.; Takdastan, A.; Asban, P.; Kiani, F.; Mohammadi, M.J. Short-term and long-term effects of exposure to PM10. Clin. Epidemiology Glob. Heal. 2024, 27, 101611. [Google Scholar] [CrossRef]
  16. Sjödahl, K.; Jansson, C.; Bergdahl, I.A.; Adami, J.; Boffetta, P.; Lagergren, J. Airborne exposures and risk of gastric cancer: A prospective cohort study. Int. J. Cancer 2007, 120, 2013–2018. [Google Scholar] [CrossRef] [PubMed]
  17. Sangkham, S.; Phairuang, W.; Sherchan, S.P.; Pansakun, N.; Munkong, N.; Sarndhong, K.; Islam, A.; Sakunkoo, P. An update on adverse health effects from exposure to PM2.5. Environ. Adv. 2024, 18, 100603. [Google Scholar] [CrossRef]
  18. Krzeszowiak, J.; Pawlas, K. Particulate matter (PM2,5 and PM10), properties and epidemiological significance for respiratory and cardiovascular diseases. A review of the literature on the effects of short- and long-term exposure. Med. Sr. Environ. Med. 2018, 21, 7–13. Available online: https://www.environmed.pl/pdf-112798-42572?filename=Particulate%20matter%20_PM2_5.pdf (accessed on 29 April 2025).
  19. Particulate matter from natural sources and related reporting under the EU Air Quality Directive in 2008 and 2009. In EEA Technical Report No 10/2012; Publications Office of the European Union: Luxembourg, 2012. [CrossRef]
  20. Fuć, P.; Lijewski, P.; Kurczewski, P.; Ziołkowski, A.; Dobrzyński, M. The analysis of fuel consumption and exhaust emissions from forklifts fueled by diesel fuel and liquefied petroleum gas (LPG) obtained under real driving conditions. In Proceedings of the International Mechanical Engineering Congress & Exposition IMECE 2017, Tampa, FL, USA, 3–9 November 2017. [Google Scholar]
  21. Rymaniak, Ł.; Ziolkowski, A.; Gallas, D. Particle number and particulate mass emissions of heavy duty vehicles in real operating conditions. In Proceedings of the MATEC Web of Conferences, Sibiu, Romania, 7–9 June 2017; Volume 118, p. 00025. [Google Scholar]
  22. Reizer, M.; Juda-Rezler, K. Explaining the high PM10 concentrations observed in Polish urban areas. Air Qual. Atmosphere Health 2015, 9, 517–531. [Google Scholar] [CrossRef] [PubMed] [PubMed Central]
  23. Jandacka, D.; Durcanska, D.; Nicolanska, M.; Holubcik, M. Impact of Seasonal Heating on PM10 and PM2.5 Concentrations in Sučany, Slovakia: A Temporal and Spatial Analysis. Fire 2024, 7, 150. [Google Scholar] [CrossRef]
  24. Li, H.; You, S.; Zhang, H.; Zheng, W.; Zou, L. Analysis of the impacts of heating emissions on the environment and human health in North China. J. Clean. Prod. 2019, 207, 728–742. [Google Scholar] [CrossRef]
  25. Hasan, F.B.; Midyurova, B.N.; Mihalev, T.M. Temperature Effect on Particulate Matter Concentrations PM 10 during the heating season in Burgas. IOP Conf. Ser. Mater. Sci. Eng. 2021, 1031, 012002. [Google Scholar] [CrossRef]
  26. Maranzano, P. Air Quality in Lombardy, Italy: An Overview of the Environmental Monitoring System of ARPA Lombardia. Earth 2022, 3, 17–203. [Google Scholar] [CrossRef]
  27. Yun, X.; Shen, G.; Shen, H.; Meng, W.; Chen, Y.; Xu, H.; Ren, Y.; Zhong, Q.; Du, W.; Ma, J.; et al. Residential solid fuel emissions contribute significantly to air pollution and associated health impacts in China. Sci. Adv. 2020, 6, eaba7621. [Google Scholar] [CrossRef]
  28. Michalak, B.; Bieniek, J.; Kopeć, R. Annual assessment of air quality in Podkarpackie Province. In Provincial Report for the Year 2024; General Inspectorate for Environmental Protection: Rzeszow, Poland, 2025. Available online: https://powietrze.gios.gov.pl/pjp/documents/download/118502 (accessed on 29 April 2025).
  29. Jaworski, A.; Mateichyk, V.; Kuszewski, H.; Mądziel, M.; Woś, P.; Babiarz, B.; Śmieszek, M.; Porada, S. Towards Cleaner Cities: An Analysis of the Impact of Bus Fleet Decomposition on PM and NOX Emissions Reduction in Sustainable Public Transport. Energies 2023, 16, 6956. [Google Scholar] [CrossRef]
  30. Jaworski, A.; Mądziel, M.; Kuszewski, H. Sustainable Public Transport Strategies—Decomposition of the Bus Fleet and Its Influence on the Decrease in Greenhouse Gas Emissions. Energies 2022, 15, 2238. [Google Scholar] [CrossRef]
  31. Nahorski, Z.; Holnicki, P.; Kałuszko, A. Towards Air Quality Protection in an Urban Area—Case Study. Atmosphere 2024, 15, 1106. [Google Scholar] [CrossRef]
  32. Nidzgorska-Lencewicz, J.; Czarnecka, M. Thermal Inversion and Particulate Matter Concentration in Wrocław in Winter Season. Atmosphere 2020, 11, 1351. [Google Scholar] [CrossRef]
  33. Zgłobicki, W.; Baran-Zgłobicka, B. Air pollution in major Polish cities in the period 2005–2021: Intensity, effects and attempts to reduce it. Environ. Res. 2023, 240, 117497. [Google Scholar] [CrossRef]
  34. Chae, E.; Choi, S.-S. Concentrations of particulate matter (PM2.5) and contributions of tire wear particle to PM2.5 in an indoor parking garage: Comparison with the outside and the differences according to the sampling sites. Heliyon 2023, 10, e23513, ISSN 2405-8440. [Google Scholar] [CrossRef]
  35. Rahimi, N.R.; Fouladi-Fard, R.; Ghalhari, M.R.; Mojarrad, H.; Yari, A.; Farajollahi, M.M.; Hamta, A.; Fiore, M. The links between microclimatic and particulate matter concentration in a multi-storey car parking: A case study iran. J. Environ. Health Sci. Eng. 2022, 20, 775–783. [Google Scholar] [CrossRef] [PubMed] [PubMed Central]
  36. Vuković, G.; Urošević, M.A.; Razumenić, I.; Kuzmanoski, M.; Pergal, M.; Škrivanj, S.; Popović, A. Air quality in urban parking garages (PM10, major and trace elements, PAHs): Instrumental measurements vs. active moss biomonitoring. Atmos. Environ. 2014, 85, 31–40, ISSN 1352-2310. [Google Scholar] [CrossRef]
  37. Marinello, S.; Lolli, F.; Gamberini, R. Roadway tunnels: A critical review of air pollutant concentrations and vehicular emissions. Transp. Res. Part D Transp. Environ. 2020, 86, 102478, ISSN 1361-9209. [Google Scholar] [CrossRef]
  38. Jiang, N.; Lv, Z.; Zhang, R.; Zhu, R.; Qu, G. Characteristics, source analysis, and health risk of PM2.5 in the urban tunnel environment associated with E10 petrol usage. Environ. Sci. Pollut. Res. 2024, 31, 30454–30466. [Google Scholar] [CrossRef]
  39. Jandacka, D.; Durcanska, D.; Cibula, R. Concentration and inorganic elemental analysis of particulate matter in a road tunnel environment (Žilina, Slovakia): Contribution of non-exhaust sources. Front. Environ. Sci. 2022, 10, 952577. [Google Scholar] [CrossRef]
  40. Jaworski, A.; Balawender, K.; Kuszewski, H.; Jaremcio, M. The Assessment of PM2.5 and PM10 Immission in Atmospheric Air in a Climate Chamber during Tests of an Electric Car on a Chassis Dynamometer. Atmosphere 2024, 15, 270. [Google Scholar] [CrossRef]
  41. Dornoff, J.; Mock, P.; Baldino, C.; Bieker, G.; Díaz, S.; Miller, J.; Sen, A.; Tietge, U.; Wappelhorst, S. Fit for 55: A Review and Evaluation of the European Commission Proposal for Amending the CO2 Targets for New Cars and Vans. International Council on Clean Transportation. 2021. Available online: https://theicct.org/wp-content/uploads/2021/12/fit-for-55-review-eu-sept21.pdf (accessed on 2 April 2025).
  42. Statistics Poland. Available online: https://bdl.stat.gov.pl/bdl/metadane/cechy/1733 (accessed on 2 April 2025).
  43. Ntziachristos, L.; Boulter, P. Road transport: Automobile tyre and brake wear. Road transport: Automobile road abrasion. In EMEP/EEA Air Pollutant Inventory Guidebook 2023—Update 2024; European Environment Agency: Copenhagen, Denmark, 2024. [Google Scholar]
  44. Ntziachristos, L.; Samaras, Z. EMEP/EEA air pollutant emission inventory guidebook 2023—Update 2024. In Passenger Cars, Light Commercial Trucks, Heavy-Duty Vehicles Including Buses and Motorcycles; European Environment Agency: Copenhagen, Denmark, 2024; Available online: https://copert.emisia.com/wp-content/uploads/2024/07/1.A.3.b.i-iv-Road-transport-2024.pdf (accessed on 2 April 2025).
  45. Appendix 4 to Chapter ‘1.A.3.b.i-iv Road Transport’, of the EMEP/EEA Air Pollutant Emission Inventory Guidebook v 2024; European Environment Agency: Copenhagen, Denmark, 2024.
  46. Giechaskiel, B.; Grigoratos, T.; Dilara, P.; Franco, V. Environmental and Health Benefits of Reducing Tyre Wear Emissions in Preparation for the New Euro 7 Standard. Sustainability 2024, 16, 10919. [Google Scholar] [CrossRef]
  47. National Centre for Emissions Balancing and Management. Emission Factors for Electricity for the Year 2023 Published in December 2024. Available online: https://www.kobize.pl/uploads/materialy/materialy_do_pobrania/wskazniki_emisyjnosci/Wska%C5%BAniki_emisyjno%C5%9Bci_dla_energii_elektrycznej_grudzie%C5%84_2024.pdf (accessed on 4 April 2025).
  48. Sources of Heat and Fuel Combustion in Poland. Available online: https://www.gunb.gov.pl/aktualnosc/ceeb-baza-informacji-o-zrodlach-ciepla-i-spalania-paliw-w-polsce (accessed on 10 April 2025).
  49. Hałacz, J.; Skotnicka-Siepsiak, A.; Neugebauer, M. Assessment of Reducing Pollutant Emissions in Selected Heating and Ventilation Systems in Single-Family Houses. Energies 2020, 13, 1224. [Google Scholar] [CrossRef]
  50. Babiarz, B.; Krawczyk, D.A.; Siuta-Olcha, A.; Manuel, C.D.; Jaworski, A.; Barnat, E.; Cholewa, T.; Sadowska, B.; Bocian, M.; Gnieciak, M.; et al. Energy Efficiency in Buildings: Toward Climate Neutrality. Energies 2024, 17, 4680. [Google Scholar] [CrossRef]
  51. Stępień, A. Vehicle related non exhaust particle emissions—Euro 7 requirements. Combust. Engines 2024, 199, 15–29. [Google Scholar] [CrossRef]
Figure 1. Emission shares of air pollutants in the air in the year 2024 for the Podkarpackie Voivodeship area [28].
Atmosphere 16 00878 g001
Figure 2. Age structure of vehicles in the Rzeszow district [43].
Atmosphere 16 00878 g002
Figure 3. Percentage share of passenger cars, light-duty vehicles, and buses by type of propulsion (fuel type) [43].
Atmosphere 16 00878 g003
Figure 4. PM2.5 (a) and PM10 (b) mass emissions, expressed in tons, for the analyzed scenarios.
Atmosphere 16 00878 g004aAtmosphere 16 00878 g004b
Figure 5. Share of PM2.5 and PM10 emissions for the Basic scenario (a) and Euro 7 scenario (b), including both exhaust and non-exhaust emissions.
Atmosphere 16 00878 g005
Figure 6. PM10 emissions, expressed in tons, for the Basic scenario and Euro 7 scenario, considering the sources of emissions.
Atmosphere 16 00878 g006
Figure 7. PM10 emissions, expressed in tons, considering the sources of emissions for the analyzed scenarios.
Atmosphere 16 00878 g007
Figure 8. PM2.5 emissions, expressed in tons, for the Basic scenario, considering the sources of emissions for the analyzed scenarios.
Atmosphere 16 00878 g008
Figure 9. Comparison of the total PM2.5 and PM10 emissions, expressed in tons, for the analyzed scenarios (* includes indirect emissions from electricity generation for battery charging).
Atmosphere 16 00878 g009
Figure 10. Relative PM2.5 and PM10 emissions for the analyzed scenarios (* includes indirect emissions from electricity generation for battery charging).
Atmosphere 16 00878 g010
Table 1. Size distribution of tire, brake, and road surface wear particles [43].
Particle Size Class (i)Mass Fraction (fT,i) of TSPMass Fraction (fB,i) of TSPMass Fraction (fR,i) of TSP
PM2.50.4200.3900.27
PM100.6000.9800.50
Disclaimer/Publisher’s Note: The statements, opinions and data contained in all publications are solely those of the individual author(s) and contributor(s) and not of MDPI and/or the editor(s). MDPI and/or the editor(s) disclaim responsibility for any injury to people or property resulting from any ideas, methods, instructions or products referred to in the content.

