Article

Gas–Particle Partitioning and Temporal Dynamics of Pesticides in Urban Atmosphere Adjacent to Agriculture

1
Institute of Chemistry and Processes for Energy, Environment and Health ICPEES, UMR 7515 Group of Physical Chemistry of the Atmosphere, University of Strasbourg, 25 Rue Becquerel, CEDEX 3, 67087 Strasbourg, France
2
ANSES, Nancy Laboratory for Hydrology, Water Chemistry Department, 40 Rue Lionnois, 54000 Nancy, France
3
Ubon Ratchathani University, 85 Sathonlamak Rd, Mueang Si Khai, Warin Chamrap District, Ubon Ratchathani 34190, Thailand
4
UFR Sciences Fondamentales et Appliquées, University of Lorraine, Rue du General Deslestraint, 57070 Metz, France
*
Author to whom correspondence should be addressed.
Atmosphere 2025, 16(7), 873; https://doi.org/10.3390/atmos16070873
Submission received: 25 May 2025 / Revised: 9 July 2025 / Accepted: 14 July 2025 / Published: 17 July 2025
(This article belongs to the Section Air Quality)

Abstract

Air pollution caused by pesticide residues is an emerging concern in urban environments influenced by nearby agricultural activities. In this study, weekly air samples were collected between May 2018 and March 2020 in Strasbourg, France, to quantify 104 pesticides in both gas and particle phases using GC-MS/MS and LC-MS/MS. Herbicides and fungicides were the most frequently detected classes, appearing in 98% of both phases followed by insecticides. Key compounds such as metalaxyl-M, diphenylamine, and bifenthrin were present in over 90% of samples. Concentrations ranged from 2.5 to 63 ng m−3 weekly, with cumulative annual loads exceeding 1200 ng m−3. Gas–particle partitioning revealed that highly volatile compounds like azinphos-ethyl favored the gas phase, while less volatile ones like bifenthrin and tebuconazole partitioned >95% into particles. A third-degree polynomial regression (R2 of 0.74) revealed a nonlinear relationship between Kₚ and particle-phase concentrations, highlighting a threshold above Kₚ of 0.025 beyond which compounds accumulate disproportionately in the particulate phase. Seasonal variability showed that 36% of the annual pesticide load occurred in autumn, with total airborne levels peaking near 400 ng m−3, while the lowest load occurred during summer. Principal component analysis identified rainfall and total suspended particles as major drivers of pesticide phase distribution. The inhalation health risk assessed yielded hazard index values < 1 × 10⁻⁷ for all population groups, suggesting negligible non-cancer risk. This study highlights the prevalence, seasonal dynamics, and partition behavior of airborne pesticides in urban air and underscores the need for regulatory attention to this overlooked exposure route.

1. Introduction

Pesticides are extensively used in agriculture and public health, yet a large fraction of applied chemicals does not stay on target. It is estimated that only about 1% of pesticides reach the intended pest or crop, while the remaining 99% are released into non-target compartments of the environment [1]. A significant portion of this loss occurs via spray drift during application and volatilization after application, which can collectively account for substantial pesticide emissions to the atmosphere. For instance, spray drift can carry away 2–25% of the applied pesticide (over distances from a few meters up to hundreds of kilometers), and post-application volatilization can evaporate as much as 80–90% of applied amounts within days [2]. The persistent airborne pesticide emissions lead to contamination of the atmosphere and can be transported regionally and even globally. Studies have consistently detected pesticide residues in air, rain, and even fog and snow across various regions, indicating that nearly every investigated pesticide can be found in the atmosphere at least part of the year. Some persistent or semi-volatile pesticides have been observed far from their use areas—for example, compounds like lindane (γ-HCH) and hexachlorobenzene have been detected in remote wildlife, evidencing long-range transport (LRT) [1]. Likewise, modern pesticides such as chlorothalonil, chlorpyrifos, and others have been identified in Arctic air and precipitation, underscoring the ability of current-use pesticides to undergo long-distance drift and deposition. These findings prompted increasing scientific and regulatory concern about pesticide air pollution since the mid-20th century. Indeed, the issue of pesticides in air has periodically raised regulatory attention, especially in Europe. Landmark actions such as the Stockholm Convention on Persistent Organic Pollutants (1996) specifically targeted pesticides prone to LRT, and regulatory frameworks now recognize air as an environmental compartment to be considered in pesticide risk assessment [3]. However, clear guidelines and routine monitoring requirements for pesticides in ambient air remain limited.
Airborne pesticides exist in the atmosphere in two principal forms: as gas-phase vapor and associated with airborne particulate matter. Many pesticides are semi-volatile organic compounds (SVOCs) and can partition between gas and particle phases depending on their physicochemical properties and ambient conditions [4,5]. Generally, pesticides with higher vapor pressures and lower octanol-air partition coefficients tend to remain in the gas phase, whereas less volatile, more lipophilic compounds preferentially sorb to dust or aerosol particles. This gas/particle partitioning is dynamic and influenced by temperature, humidity, and particle concentrations in the air. Gas-phase pesticides can travel longer distances and penetrate indoors more readily, while particle-bound pesticides can contribute to localized deposition and human exposure via inhalable dust. Measuring both phases is therefore essential for understanding transport pathways and exposure risks.
Monitoring pesticides in the atmosphere is important not only near sources but also in populated areas. Urban environments represent a potential receptor of agricultural pesticide drift as well as urban pesticide uses (e.g., vector control, parks and garden treatments) [2]. Urban residents might be chronically exposed to low levels of pesticides by inhalation, yet this exposure route has been less studied than dietary or occupational routes. Acute and chronic exposure to airborne pesticides is a public health concern—inhalation of certain organophosphates, organochlorines, and other pesticides has been linked to respiratory, neurological, and endocrine-disrupting effects in humans [6,7,8,9], and airborne pesticide drift can also impact ecosystems by harming non-target species such as pollinators, birds, and aquatic life [10,11,12]. Most pesticide air monitoring efforts to date have focused on agricultural regions or specific incidents, and there is a knowledge gap regarding the baseline levels and behavior of pesticide mixtures in city air. Recent studies in Europe have begun to document pesticide occurrence even in urban atmospheres, showing seasonal patterns and urban-to-rural concentration gradients [13]. Still, data from diverse urban settings are scarce. There is a need to scientifically contextualize how pesticides disperse into cities, partition between gas and particles in urban air, and vary with seasonal use and meteorological conditions.
In this study, we address these gaps by monitoring a broad spectrum of pesticides in the air of an urban area over multiple seasons. By simultaneously sampling the gas phase and particle phase, we aim to characterize the transport of pesticides via both routes and how environmental factors modulate their concentrations. This dual-phase, multi-residue approach allows us to identify which compounds are present in urban air, their phase distribution, seasonal behavior, and any correlations with meteorological parameters.

2. Materials and Methods

2.1. Reagents and Chemicals

High-performance liquid chromatography (HPLC) grade solvents including acetonitrile (ACN), ethyl acetate (EtAc), nitric acid, ethanol (EtOH), n-hexane, methylene chloride (DCM), and toluene were sourced from VWR (Rosny-sous-Bois, France). Solid-phase microextraction (SPME) fiber coated with 100 µm polydimethylsiloxane (PDMS), along with N-tert-butyldimethylsilyl-N-methyltrifluoroacetamide (MtBSTFA), were obtained from Sigma-Aldrich (St. Quentin Fallavier, France). Ultrapure water was produced using an Elga purification system (VEOLIA, Antony, France). CHROMABOND® Hydrophilic Lipophilic Balance (HLB) solid-phase extraction (SPE) cartridges were purchased from Macherey-Nägel (Hoerth, France). NMC@SiC were purchased from Tisch Environmental, Hamilton, OH, USA. Pesticide mixture at a concentration of 10 mg L−1 in ACN were obtained from Cluzeau Info Labo (St. Foy la Grande, France). A working standard solution at 10 mg L−1 was prepared in ACN and stored at −18 °C. Internal standards (IS) at 10 mg L−1 in ACN, were supplied by Sigma-Aldrich (St. Quentin Fallavier, France).

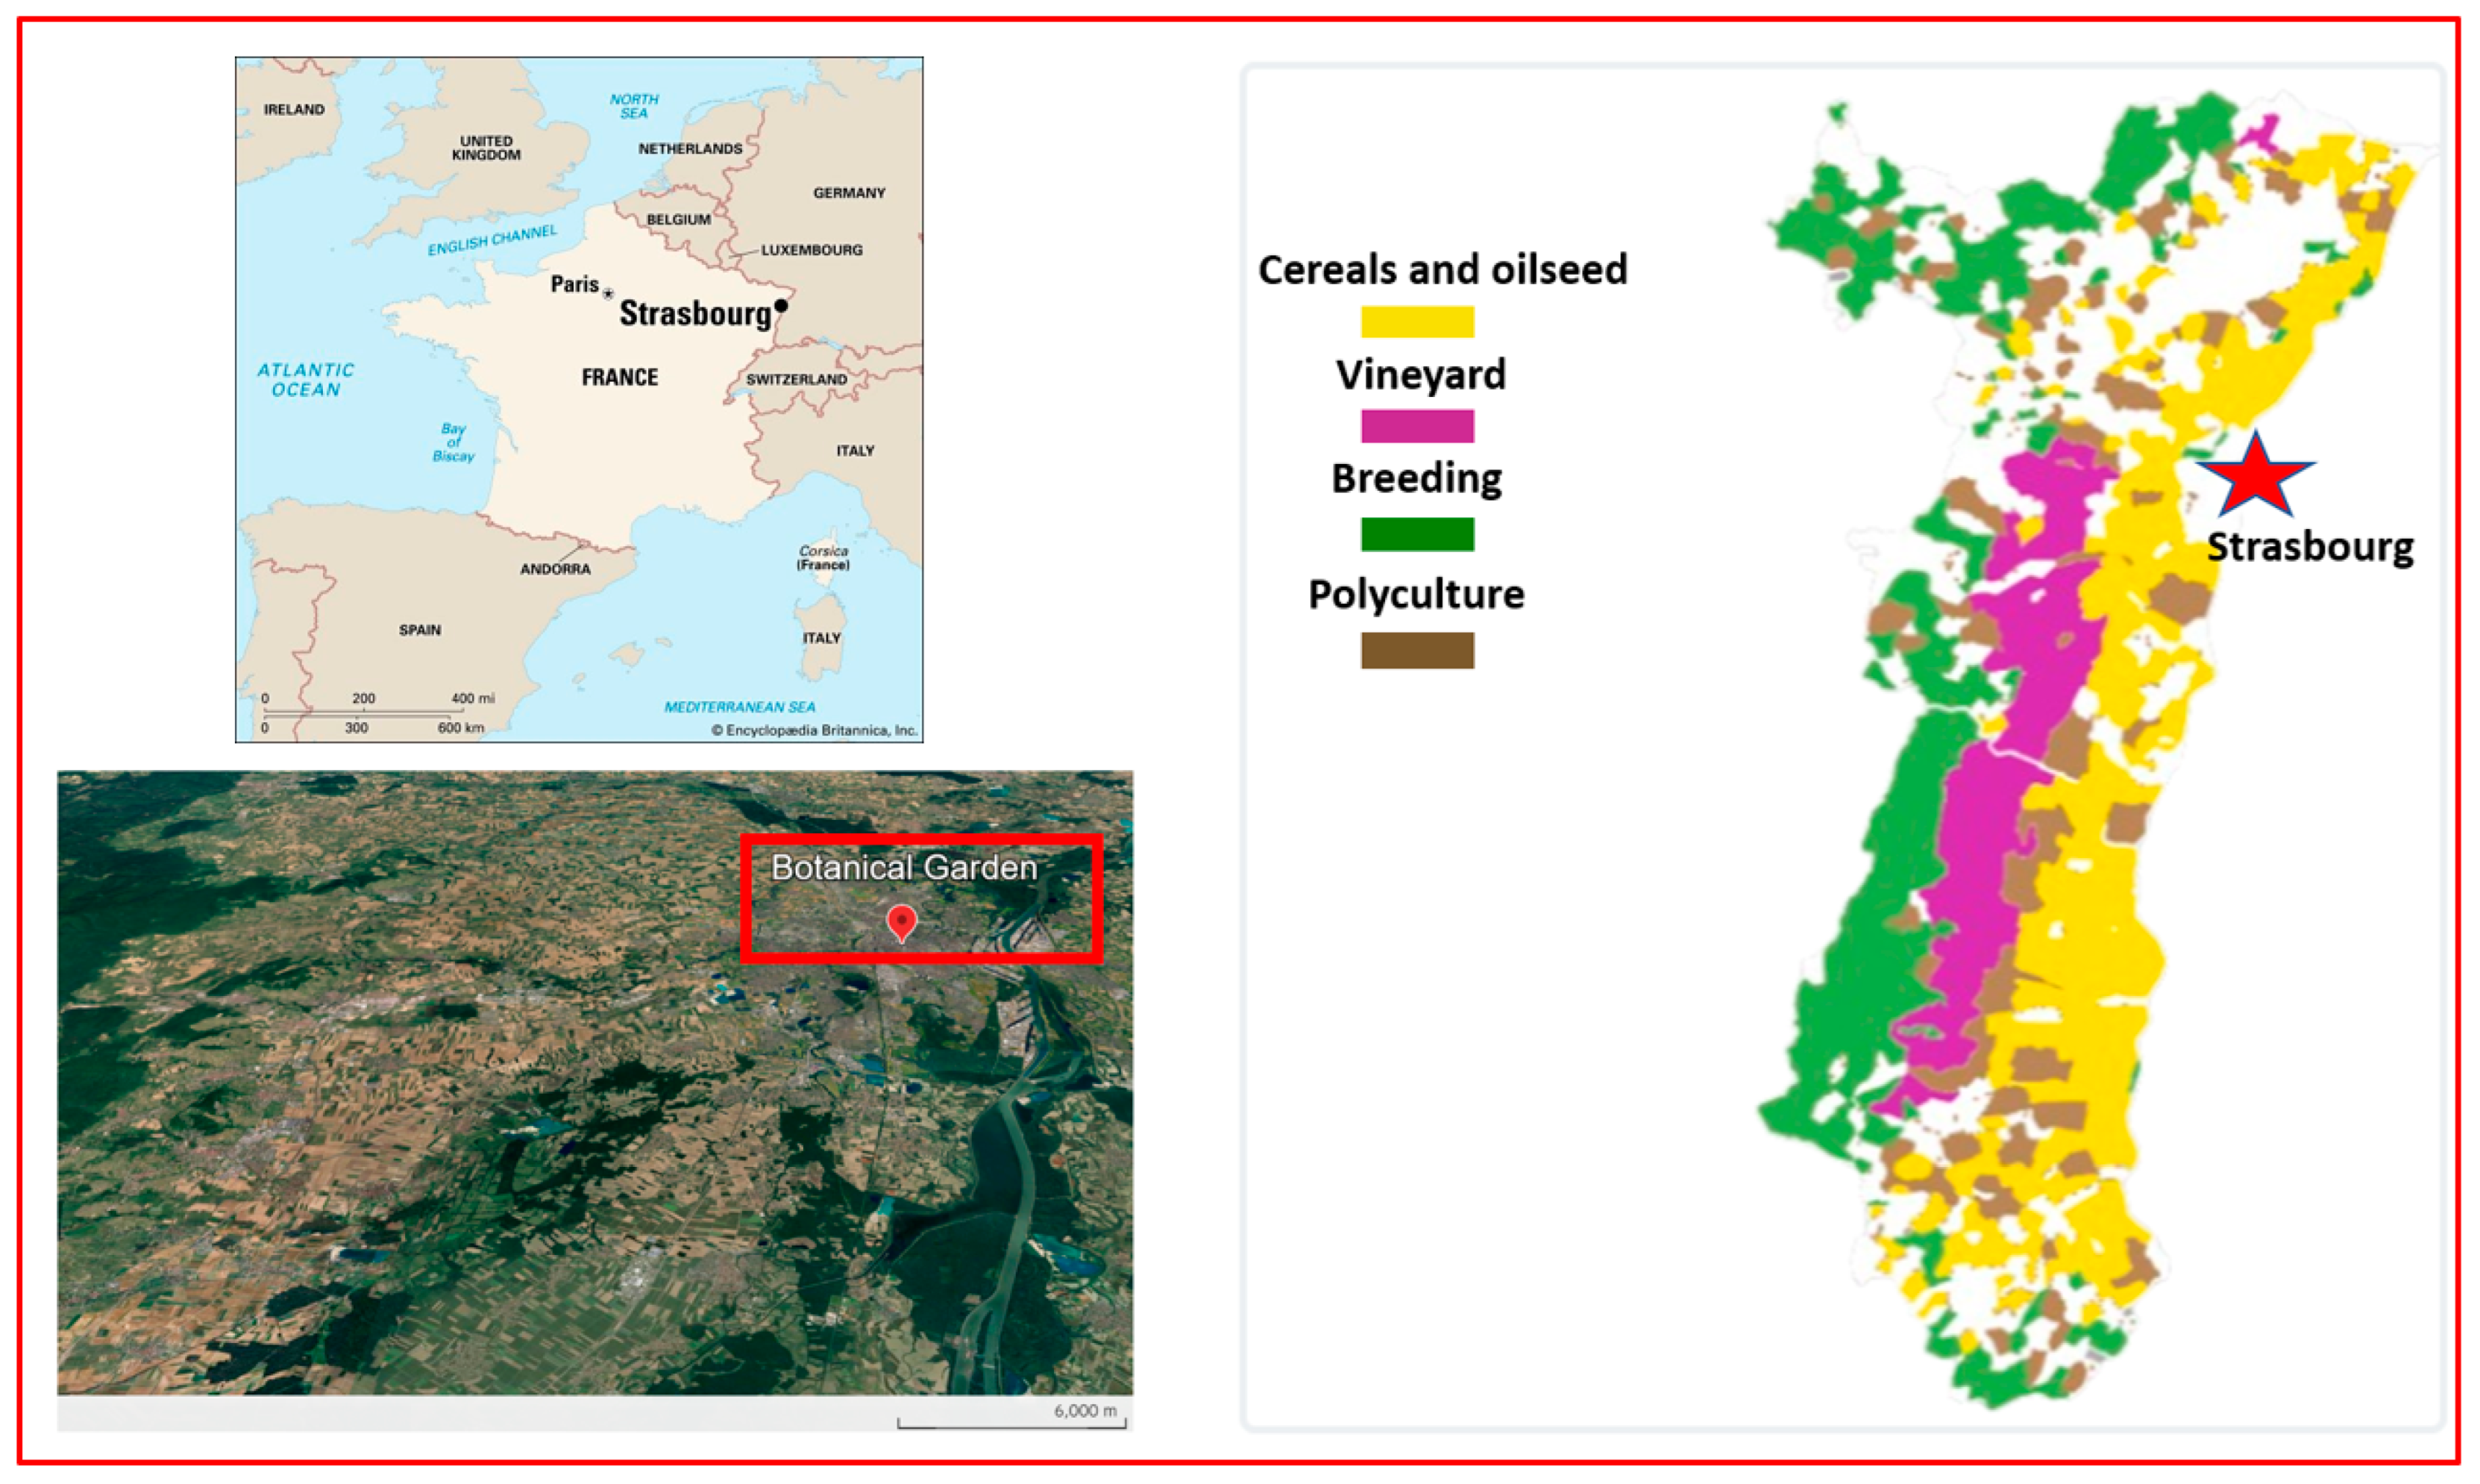
2.2. Sampling Procedure

Air samples were simultaneously collected using a low-volume sampler (2.3 m3 h−1, Sven Leckel, Berlin, Germany) fitted with a PM10 inlet and a 47 mm glass fiber filter (Whatman™, Sigma-Aldrich, St. Quentin Fallavier, France), and a silicon carbide foam coated with a thin layer of nitrogen-doped carbon (NMC@SiC) shielded from direct sunlight and rainfall using a protective housing made of polyvinyl chloride (PVC). The sampling took place in Strasbourg—a major city in northeastern France’s Alsace region from 13 June 2018 to 3 March 2020 on a weekly basis (7 days) to avoid overloading the sorbent. Strasbourg features a mix of urban infrastructure, including shops, restaurants, and residential zones. Samples were collected from the rooftop of the University’s Botanic Institute (48.58.40° N, 7.76.63° E), located approximately 3 km from major roads and industrial zones, 11 km from the regional airport, and 3.5 km from nearby farmland. This site is considered representative of a typical urban background environment (see Figure 1). However, due to logistical and maintenance constraints, sampling could not be carried out every week. The longest interruptions occurred between 17 July and 4 September 2018; 11 December 2018 and 19 February 2019; and 23 July and 27 August 2019.
Before sampling, both filters and foams were cleaned by Accelerated Solvent Extraction (Dionex® ASE 300, Sunnyvale, CA, USA) with a 50:50 (v/v) mix of n-hexane and DCM, followed by ACN. The ASE was conducted at 1500 psi for 45 min using three static cycles at 150 °C for 15 min each. Prior to cleaning, the NMC@SiC were cut into cylinders (5 cm in length, 2.8 cm in diameter) to fit the 34 mL cell used in the study. After cleaning, the sampling media were dried under a fume hood, individually wrapped in aluminum foil and stored at 50 °C until deployment. After collection, the NMC@SiC sorbents and filters were promptly wrapped in aluminum foil at the sampling site and transported to the ICPEES laboratory in insulated bags containing ice packs and then stored at −18 °C to prevent potential losses until further analysis. The average estimated air volume sampled is about 386 m3 week−1. The meteorological parameters (temperature and relative humidity) were taken from the nearest Météo-France meteorological station (Entzheim Airport, ~11 km southwest of the sampling site).

2.3. Samples Extraction and Analysis

Pesticide analysis was carried out using a previously developed analytical method. Briefly, both filters and NMC@SiC foams underwent two rounds of extraction using ASE with ACN at 1500 psi for 10 min at 150 °C. Post-extraction, MtBSTFA was added to the 80 mL ASE extract to derivatize certain polar compounds by heating the mixture at 80 °C for 1 h. Following derivatization, the extracts were diluted to a total volume of 1000 mL using distilled water acidified with nitric acid (pH 3) and then purified using CHROMABOND® HLB SPE cartridges on a DIONEX® AutoTrace 280 system, as described by Levy et al. (2020) [15]. The SPE process involved conditioning the cartridges with 5 mL each of ethanol and water before loading the diluted extracts (1000 mL) at a flow rate of 5 mL min−1. After loading, the cartridges were dried with a nitrogen stream for 30 min. Analytes were then sequentially eluted using 2 mL of each solvent—DCM, EtAc, and ACN—at the same flow rate. The collected eluates were carefully concentrated under a fume hood to near dryness and then reconstituted in 1 mL of ACN. A 100 µL aliquot of this solution was transferred into a vial for LC-MS/MS analysis, to which 10 µL of a 10 mg L−1 IS mixture was added. The remaining 900 µL was divided into four 225 µL portions. One of these portions was further diluted to 20 mL with acidified, salted distilled water (pH 3, 1.5% NaCl). The dilution to 20 mL was required to ensure optimal conditions for the solid phase microextraction (SPME) preconcentration step. In total, 10 µL of a 10 mg L−1 IS mixture was then added for GC-MS/MS analysis (see Table 1).

2.4. Quality Assurance/Quality Control (QA/QC)

Internal standard control solutions and stock solutions were injected at both the start and end of each analytical sequence to ensure proper instrument performance.
Two types of blank samples were prepared: the first involved pre-cleaned samplers that were extracted and analyzed in the lab, while the second consisted of a field blank—pre-cleaned samplers that were exposed to field conditions for the same duration as the actual samples before being extracted and analyzed. They underwent the same extraction and analysis steps as the real air samples. None of the targeted compounds were quantified (all values were below the quantification limits) in either type of blank, confirming the effectiveness of the cleaning and storage protocols employed.
The analytical parameters including detection and quantification limits, recovery, and variabilities along with the fragmentation parameters (collision energy, quantification and confirmation ions) are fully shown in the Supplementary Materials (Tables S1 and S2, respectively).
Additionally, it is important to emphasize that certain periods (mentioned above) were affected by sampling interruptions due to equipment maintenance or operational constraints. Such interruptions may have limited the temporal resolution during key transitional seasons, possibly affecting trend interpretation and contributing to observed variability. All affected intervals have been clearly documented, and results were interpreted with these limitations in mind.

2.5. Gas/Particle Partitioning

The gas-particle distribution coefficient Kp (m3 µg−1) for pesticides was determined using the equation proposed by Yamasaki et al. (1982) [16].
Kp = Cp/(Cg × TSP)
In this formula, TSP represents the total suspended particulate matter concentration (µg m−3), while Cp and Cg correspond to the concentrations of the compound in the particulate and gas phases, respectively. TSP data were sourced from the Atmospheric Pollution Survey network (“Atmo Grand-Est”).

2.6. Inhalation Health Risk to Populations from Atmospheric Pesticides

The evaluation of pesticide health risks is assessed through the exposure dose in relation to a suitable health standard [17], based on the United States Environmental Protection Agency (USEPA) exposure assessment tool to calculate the average daily dose via inhalation (ADD) (Equation (2)).
A D D = C a i r R b b w 10 9 ,
where ADD is the average daily dose via inhalation (mg kg−1 d−1), Rb is the breathing rate (m3 d−1), and bw is the body weight (kg) for infants (Rb = 5.4, bw = 9.2), children (Rb = 12, bw = 31.8), and adults (Rb = 16, bw = 80) were employed based on the exposure factors handbook (EFH) [18]. The conversion factor “109” is applied to convert pg m−3 to mg m−3.
The threshold of daily exposure dose was determined based on the Acceptable Daily Intake (ADI) values derived from toxicological assessments. To assess health risks, the Hazard Quotient (HQ) was calculated for individual pesticides (Equation (3)), while the overall risk from combined exposure was evaluated using the Hazard Index (HI) (Equation (4)).
H Q = A D D A D I
H I = H Q
Here, HQ represents the ratio of the exposure dose to the acceptable daily intake (ADI), while the HI is the sum of HQs of all the detected pesticides within a specified sampling period. If the HQ or HI exceeds the toxicological threshold of “1”, then it indicates an unacceptable health risk from inhalation exposure to individual pesticides or total pesticides, respectively. Recommended ADI values for the target pesticides can be found in the Pesticides Properties Database (PPDB) [19].

3. Results and Discussions

3.1. Pesticide Detected in Air Samples

Over the weekly monitoring period, 104 pesticide active ingredients were tracked in weekly air samples, separated into gas-phase and particle-phase fractions, and class (fungicides, herbicides, and insecticides). The detection frequency (DF) varied widely among compounds. Figure 2 shows pesticides detected with more than 40% in air samples, by class and phase. Many pesticides were regularly present in both phases (whose vapor pressure varies between 10−5 and 10−2 Pa), underscoring their semi-volatile nature and ubiquitous occurrence in the atmosphere [20]. However, certain substances showed a marked preference for either the gas phase or the particle phase, likely reflecting differences in their volatility, chemical properties, and usage patterns. It was also clear that herbicides dominate the high DF group, followed by fungicides and insecticides. Overall, 42 herbicides, 36 fungicides, 24 insecticides, and 2 acaricides were detected in our field study. In addition, the data revealed that pesticides are routinely detected in ambient air, often in both vapor and particulate forms, highlighting significant potential for atmospheric transport from nearby agricultural fields to urban land topography [21]. For instance, Khoury et al. (2024) demonstrated in a previous study that the main direction of pesticide transport is from the southwest, supporting the likelihood that pesticides originating primarily from Geispolsheim (a rural/suburban site located southwest of sampling site) and Erstein (a rural site located to the south) were transported toward Strasbourg [21].

3.1.1. Detection Frequency by Pesticide Class

To examine broad trends, we grouped the compounds by pesticide family (herbicides, fungicides, insecticides, and acaricides) and calculated the average DF for each class in each phase. Herbicides (42 compounds) and insecticides (24 compounds) showed fairly similar behavior. Out of the weekly samples collected, pesticides were nearly ubiquitous in both gas and particle phases. Herbicides and fungicides each showed a DF of ~98% in gas-phase samples and ~98% in particle-phase samples. Insecticides were detected almost as frequently (in 96% of gas samples and 98% of particle samples), while acaricides were somewhat less common, appearing in ~86% of gas samples and ~73% of particle samples. Notably, at least one herbicide or fungicide was found in virtually every sample, underscoring their widespread use and persistence. Acaricides, though used less extensively, were still detected in the majority of samples. These high DF aligned well with findings from other regions. For example, a comprehensive German survey detected glyphosate in 100% of air samples and reported that over half of samples contained multiple herbicides (e.g., pendimethalin, terbuthylazine) and fungicides (e.g., chlorothalonil, tebuconazole) [22]. Similarly, an Austrian study observed five herbicides in 100% of samples and several fungicides and an insecticide in >90% of samples [23]. China’s atmospheric surveys also reported extremely high DF (≥87%) for prevalent pesticides such as atrazine, carbendazim, and chlorpyrifos [24]. These comparisons indicate that the near-ubiquitous presence of herbicides and fungicides in our study is not unusual and reflects a global pattern of intensive pesticide usage in the environment. In summary, herbicides and fungicides were the most consistently detected pesticide classes in both phases, followed closely by insecticides. This observation is consistent with their lower usage volume relative to other pesticide classes. The pervasive detection of multiple pesticide classes in ambient air highlights the atmosphere as an important transport medium for diverse agrochemicals, as reported in Europe and elsewhere [22,23].

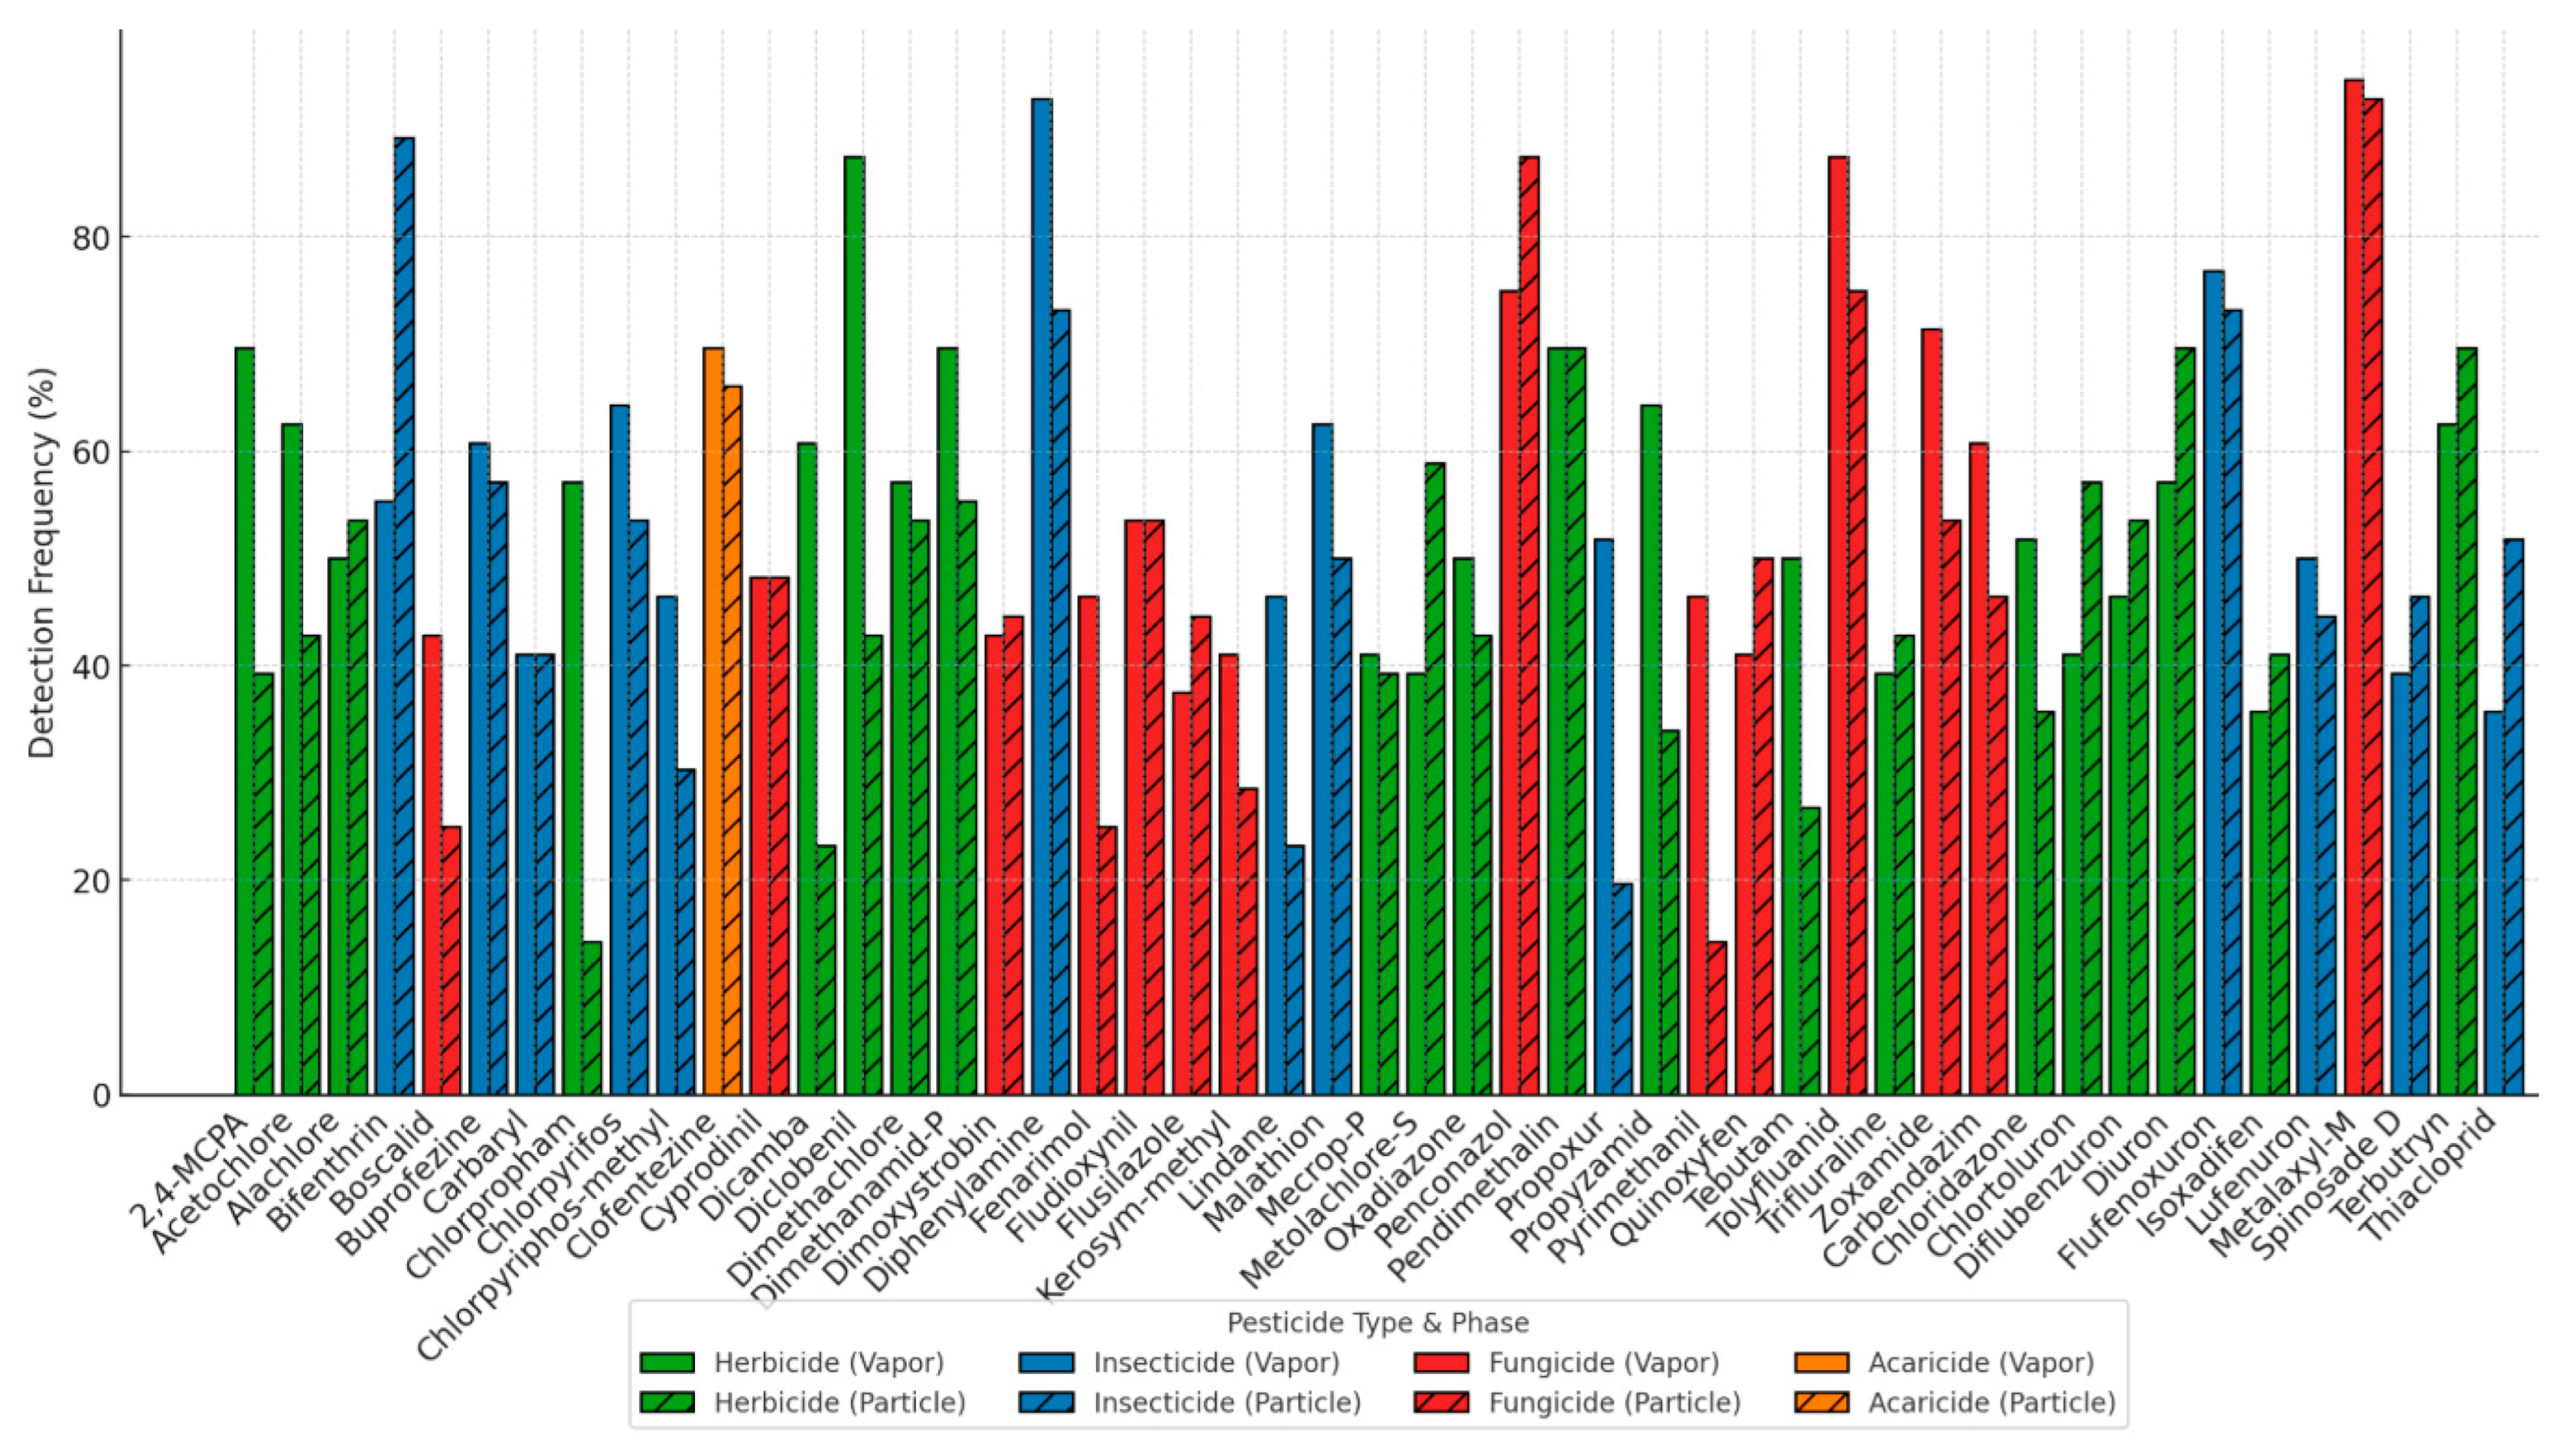
3.1.2. Most Detected in Gas Phase

The gas-phase samples were dominated by a few pesticides that occurred in nearly every sample. The five most frequently detected compounds in the gas phase were diphenylamine, metalaxyl-M, tolyfluanid, diclobenil, and clofentezine, with DF, respectively, of 96%, 95%, 88%, 86%, and 80%. Diphenylamine (an antioxidant/insecticide) was detected in 96% of gas samples—the highest among all compounds—indicating a nearly continuous presence in the air. The systemic fungicide metalaxyl-M (mefenoxam) was a close second at 95%. Two fungicides, tolyfluanid and diclobenil (the latter also used as an herbicide), were each present in roughly 85–88% of gas samples. The acaricide clofentezine, used against mite pests, was detected in ~80% of gas samples. These top-five gas-phase compounds span multiple pesticide classes suggesting varied sources and uses. Their remarkably high DF indicates regular or widespread application in the region throughout the sampling period. For instance, diphenylamine is used post-harvest (e.g., on stored fruit) and may be continually emitted, while metalaxyl-M and tolyfluanid are heavily used fungicides in crop protection (e.g., for downy mildew), leading to their constant presence in air. Diclobenil is a herbicide often used in non-crop areas, and clofentezine is an acaricide applied in orchards—their frequent detection points to regular use in local agricultural practice near the urban site.

3.1.3. Most Detected in Particle Phase

The particle-phase samples showed a slightly different ranking of dominant compounds, although there was some overlap with the gas phase. The five most frequently detected pesticides in the particulate phase were metalaxyl-M, bifenthrin, penconazole, diphenylamine, and tolyfluanid. Metalaxyl-M exhibited the highest particle-phase DF (about 93% of samples), indicating its strong presence in both phases. The pyrethroid insecticide bifenthrin was detected in 89% of particle samples—notably higher than its gas-phase occurrence (54%), reflecting bifenthrin’s low volatility and tendency to bind to aerosols. The triazole fungicide penconazole was found in 88% of particle samples (versus ~73% in gas), also consistent with its semi-volatile, particle-affinitive nature. Diphenylamine appeared in 84% of particle samples (slightly lower than in gas), and tolyfluanid in 75% of particle samples. Thus, metalaxyl-M and diphenylamine were ubiquitous in both phases, whereas bifenthrin and penconazole showed a marked preference for the particulate phase. The prevalence of bifenthrin in particles is expected, as pyrethroid insecticides are known to sorb strongly to airborne particulate matter due to their low vapor pressures [24]. Penconazole’s high particle occurrence aligns with its use pattern (e.g., vineyard sprays that can adhere to dust) and its physicochemical profile favoring partition to the condensed phase. Tolylfluanid, while frequently in gas, was somewhat less so in particles, perhaps due to degradation or fewer particle nucleation opportunities after application.
The dominance of bifenthrin and penconazole in the particulate phase underscores the role of compound volatility in determining phase distribution. In general, pesticides with lower vapor pressures (such as pyrethroids and many organochlorines) are found preferentially on aerosols [25]. Our findings agree with this: bifenthrin (a pyrethroid) was far more frequent in particles than in gas, and other relatively involatile fungicides (penconazole, tolylfluanid) were among the top particle-bound compounds. In other studies, highly hydrophobic pesticides like permethrin and chlorpyrifos have also been shown to partition substantially to atmospheric particulate matter [23]. The consistent presence of metalaxyl-M in both phases suggests intermediate volatility; it can exist in vapor form but also readily adsorb onto particulates, which is characteristic of many polar fungicides. Diphenylamine’s strong showing in both phases could be due to continuous emissions and moderate volatility, allowing some to remain in vapor and some to adsorb to fine particulates present in enclosed storage or ambient air.

3.1.4. Gas–Particle Partitioning

To further analyze gas–particle partitioning of pesticides, we calculated the partition coefficient (Kp) for targeted pesticides. Most compounds were detectable in both phases at least occasionally as shown above, but the balance between gas and particle varied from compound to another (see Figure S1). Generally, more volatile pesticides tended to remain in the gaseous phase, whereas less volatile or highly lipophilic pesticides preferentially associated with airborne particles [26]. In our study, the average Kp values for the studied pesticides were on the order of 10−3 to 10−2 which are comparable to literature reports [6]. Overall, a large fraction of the measured pesticides displayed a dominant presence in the gas phase, a trend typically associated with relatively high vapor pressures and low sorptive affinity for particulate matter. For instance, azinphos-ethyl, an organophosphate insecticide, exhibited a strong gas-phase signature, with concentrations reaching 1.97 ng m−3 in the vapor phase compared to just 0.21 ng m−3 in the particle phase. This behavior is consistent with its low molecular weight and high volatility, which favors atmospheric transport in gaseous form. Conversely, pesticides like indoxacarb and bromoxynil octanoate showed a greater affinity for the particle phase, with particle-phase concentrations of 2.08 ng m−3 and 1.05 ng m−3, respectively—substantially higher than their gas-phase counterparts. Their log Kp values of −1.47 and −1.61 place them in the range typically associated with SVOCs that preferentially adsorb to aerosol surfaces, especially in cooler or more particle-rich conditions. The observed distribution likely reflects both their intrinsic low volatility and the availability of fine urban aerosols (e.g., soot, organic matter, or mineral dust) onto which these compounds can sorb during atmospheric transport from surrounding agricultural areas. Cypermethrine, flumioxazin, tebuconazole, and isoxaflutole were partitioned at 100% in the particulate phase. One possible explanation is that during pesticide application, the aerosol was captured directly on the filter, preventing the compound from diffusing into the sorbent materials. Another possibility can be related to their volatility which limits their atmospheric transport into the urban sampling site. Compounds with intermediate partitioning, such as aclonifen and 2,4-MCPA, exhibited roughly balanced concentrations in both phases, indicative of dynamic equilibrium between gas-phase volatilization and particulate sorption. These compounds are characterized by log Kp values around −1.8, and their distribution is likely sensitive to seasonal variations and environmental factors. A third-degree polynomial regression was applied to assess the relationship between compound-specific partitioning behavior (log Kₚ) and their observed particle-phase concentrations. The resulting fitted cubic model (R2 of 0.75) captures a nonlinear trend, suggesting that particle-phase concentrations remain relatively stable at low log Kₚ values, followed by a sharp increase at higher log Kₚ values (beyond 0.025) (see Figure 3). This rise indicates that substances with greater affinity for the particle phase (higher log Kₚ) tend to accumulate disproportionately in that phase, especially beyond the observed threshold log Kₚ. Such behavior may reflect enhanced sorption to particles due to lower volatility or stronger particle interactions under ambient conditions.

3.1.5. Influence of Environmental Factors

Principal Component Analysis (PCA) was applied to evaluate the combined influence of meteorological variables—temperature, rainfall, and TSP—on total pesticide concentrations in both phases. The first two principal components (PC) accounted for approximately 58% of the total variance (PC1 = 33.2%, PC2 = 25.1%). PC1 described a strong contrast between rainfall (positively loaded) and TSP and particle-phase pesticide concentrations (negatively loaded) (see Table 2). This indicates that weeks with high rainfall have low TSP and low particulate pesticide, while dry weeks have high dust (TSP) and high particle-phase pesticide. In our study, periods with elevated TSP levels tended to show increased particle-phase pesticide burdens, supporting the idea that abundant aerosol surfaces enhance pesticide partitioning to particles. In fact, the particle-phase pesticide vector is almost colinear with TSP (small angle between them) and nearly opposite to rainfall (large angle ~180°), signifying a strong positive correlation between particulate pesticide and particulate matter and a strong negative correlation with rainfall. These patterns are consistent with the well-known washout effect of rain (wet scavenging) on airborne particles and associated pesticide loads. Conversely, PC2 was characterized by an inverse relationship between temperature and gas-phase pesticide concentrations, indicating higher gas-phase levels under cooler conditions, likely reflecting seasonal application patterns rather than volatilization-driven behavior. This contrasts with the classical expectation that warmer air enhances pesticide volatilization, but it suggests that in our site the timing or season of pesticide application may dominate over temperature alone. Notably, the gas-phase pesticide vector is nearly orthogonal to the TSP and rainfall vectors. This suggests that gas-phase pesticide levels are largely independent of particulate levels and rain. They are governed by distinct environmental drivers, possibly linked to source strength and atmospheric degradation processes, especially in urban environments where pesticide use is indirect and transport-driven.

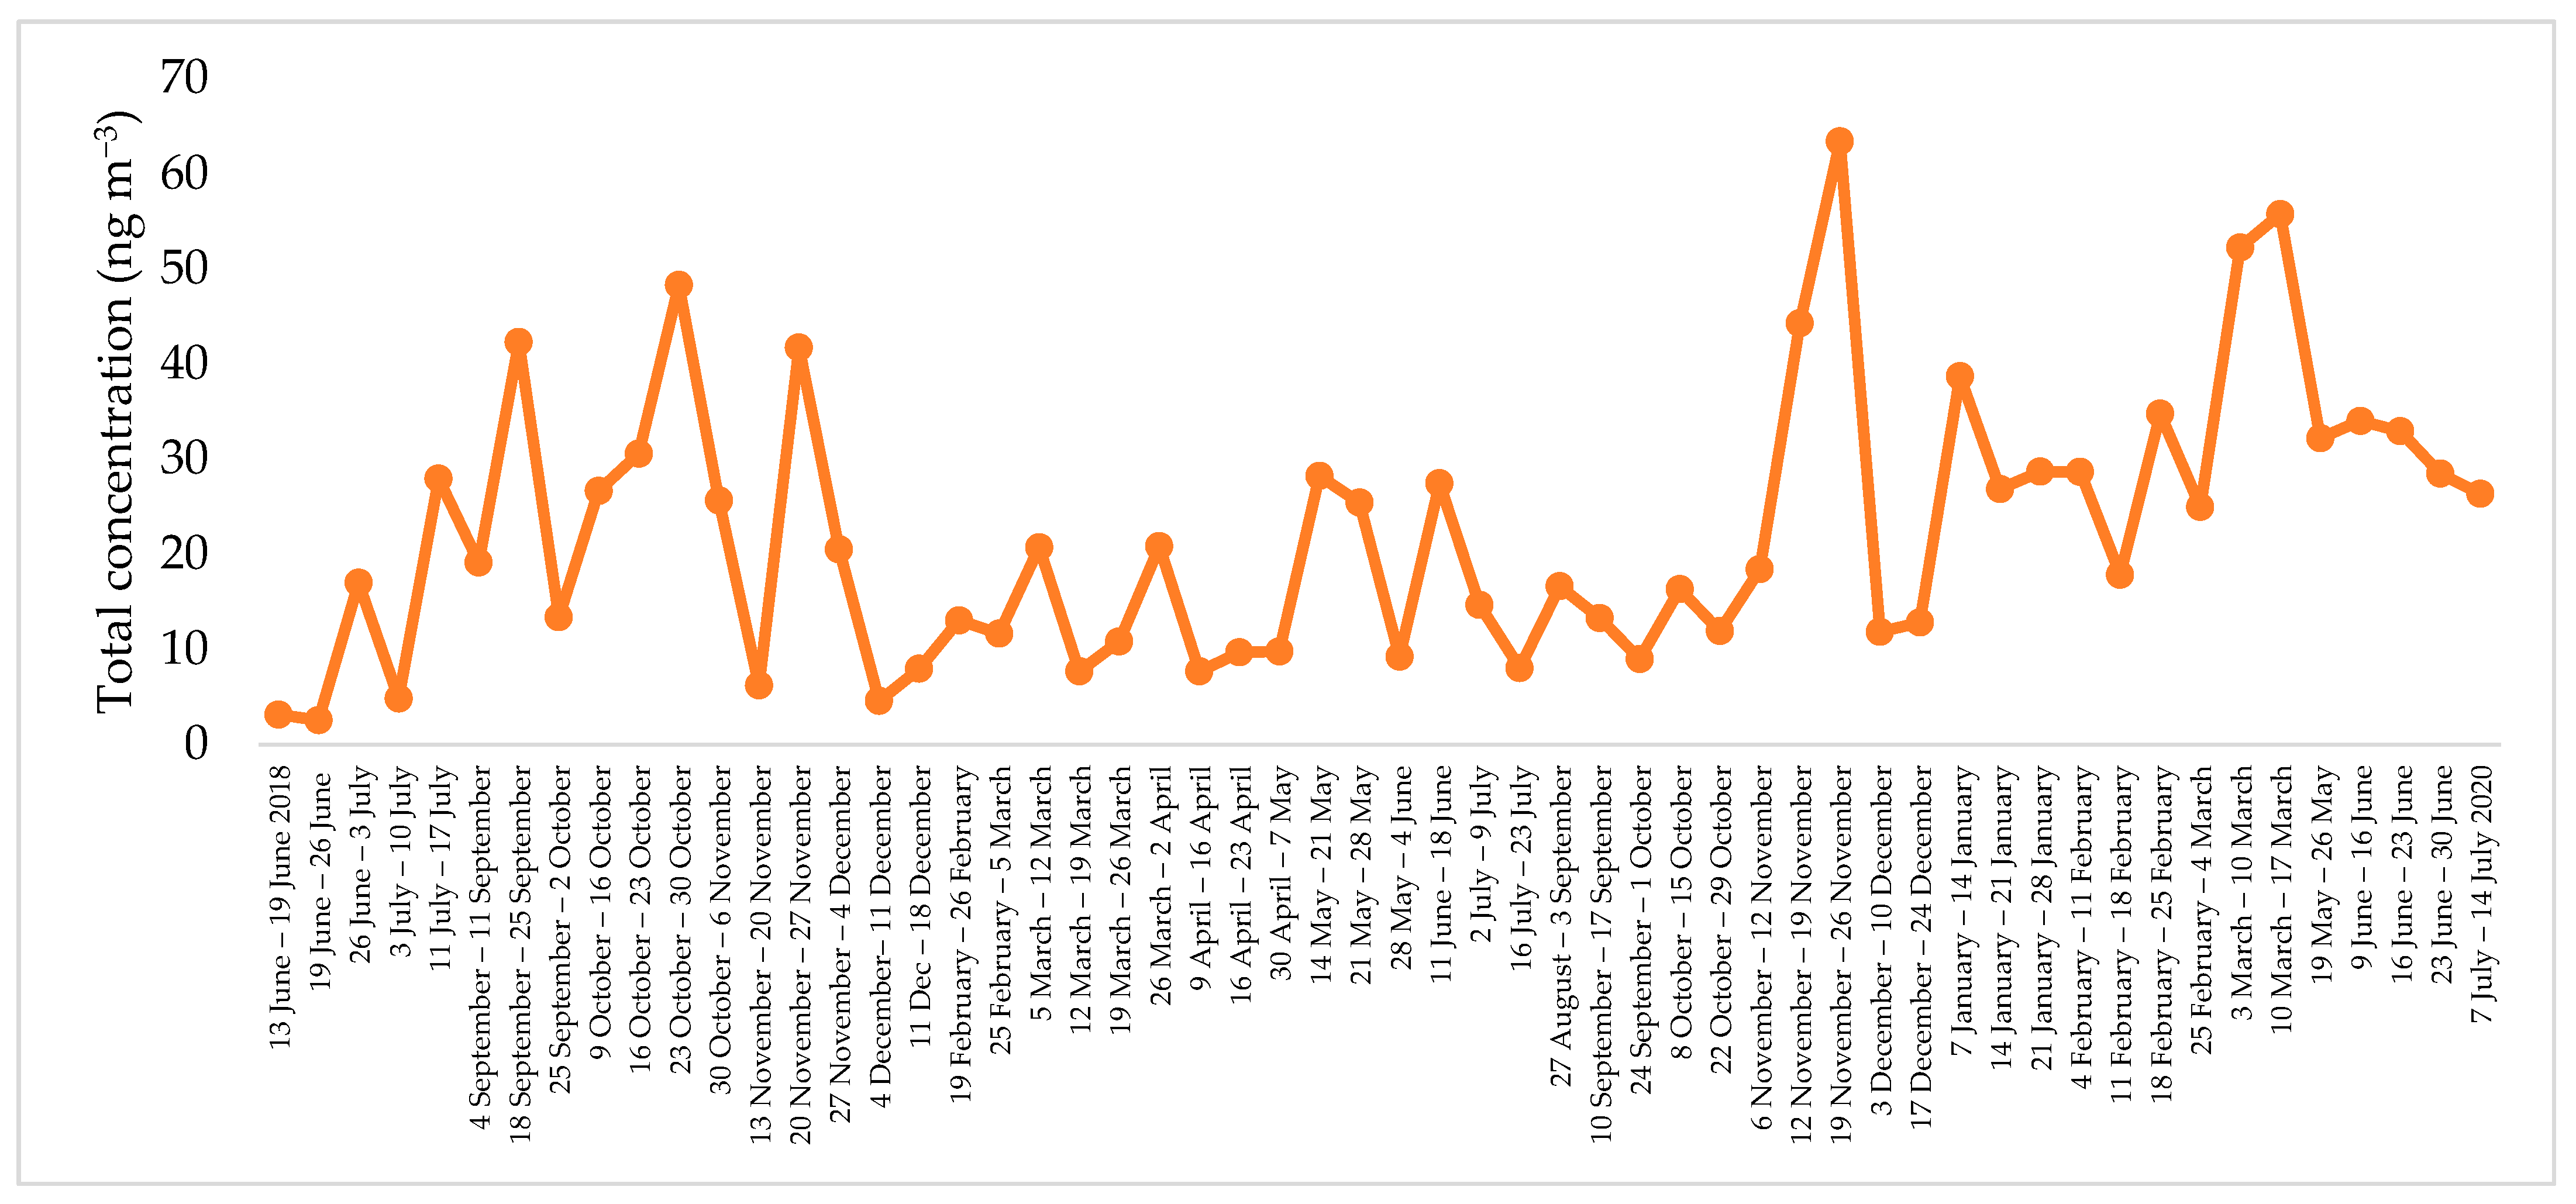
3.2. Total Pesticide Load and Major Contributors

The total pesticide burden in the sampled air (gas + particle phases) was substantial, with an average total concentration of ~22.3 ng m−3 when summing all substances. This total pesticide concentration varied by an order of magnitude over the study period, from a minimum of ~2.5 ng m−3 in a summer sample to a maximum of ~63 ng m−3 in a late-autumn sample. For context, these levels are of the same order reported in other agricultural regions; for example, total current-use pesticide concentrations in rural air have been measured in the tens of ng m−3 in parts of North America [27]. Notably, our single highest sample (63 ng m−3) occurred during November, suggesting that heavy post-harvest pesticide applications or meteorological conditions (like low mixing heights) led to an accumulation of residues in that period.
Although dozens of compounds were detected, a relatively small subset accounted for the majority of the total pesticide mass in air. The top contributors were the fungicide pyrimethanil and the carbamate insecticide propoxur, which each contributed roughly 5.5–6.5% of the total measured pesticide mass. Pyrimethanil (a botryticide used on fruits and grapes) had the single highest total mass contribution (~6.0%), reflecting a combination of relatively high concentrations in certain samples and frequent usage. Propoxur (a broad-spectrum insecticide) was a close second at ~5.8% of total mass. The systemic fungicide metalaxyl-M and the carbamate insecticide carbaryl each contributed ~5.5% as well. These four compounds alone thus accounted for about 23% of the total pesticide load. Other notable contributors included the mite growth regulator clofentezine (~3.6%), the organophosphate malathion (~3.5%), and the pyrethroid bifenthrin (~2.7%). Herbicides were somewhat less dominant on a mass basis; for instance, 2,4-MCPA (a phenoxy herbicide) contributed ~2.6% of total mass. The remaining dozens of compounds individually contributed less than 2% each but together comprised about 70% of the total mass. This long tail of minor contributions underscores the complex mixture of pesticides present at lower concentrations.
It is interesting to note that fungicides and insecticides dominated the mass contributions, whereas herbicides—despite their highest DF—were less prominent by mass. This can be partly explained by usage patterns and physicochemical properties. Many herbicides detected (e.g., triazines, chloroacetanilides) were present at lower concentrations (often sub- ng m−3) compared to some insecticides and fungicides that had episodic spikes. Pyrimethanil’s top ranking is likely due to a few high-concentration episodes in late season (indeed, pyrimethanil peaked to ~4 ng m−3 in some autumn samples). Propoxur and carbaryl, both fast-acting insecticides, were consistently found at moderate levels year-round, summing to a large total. In contrast, widely used herbicides like pendimethalin and prosulfocarb were not among the top contributors in our study, possibly because they were not applied as heavily in this region or season (or were absent from our analyte list). By comparison, a Europe-wide study found herbicides (prosulfocarb, pendimethalin, etc.) to contribute strongly to air pesticide loads, with prosulfocarb showing the highest mean air concentration among pesticides in that study [23]. Our results suggest that in the local context, late-season fungicide treatments and certain insecticide uses (including indoor/domestic use, given propoxur’s profile) were the predominant sources of pesticide residues in air.
In absolute terms, the total pesticide concentrations we observed (tens of ng m−3) indicate a non-trivial inhalation exposure potential for nearby populations and ecosystems. These levels are on par with or exceed those reported in some other agricultural regions. For instance, Foreman et al. (2000) measured up to 62 ng m−3 of methyl parathion in the Mississippi Delta region during peak spraying periods [27]. Our maximum for any single insecticide (carbaryl) was ~3 ng m−3, but the aggregate of all insecticides at that time was substantially higher. This underlines that while no single compound dominated overwhelmingly, the cocktail of many pesticides results in a significant cumulative presence. From an air quality perspective, the total pesticide burden in our samples increased sharply during certain weeks (especially in autumn), implying that application timing and atmospheric conditions can lead to short-term concentration surges. Such surges have also been observed in California’s Central Valley, where total measured pesticides in air spiked after pesticide application events [23]. The implication is that “total pesticide” metrics, as well as identifying key contributors, are important for evaluating overall pesticide pressure on the environment and potential human exposure.

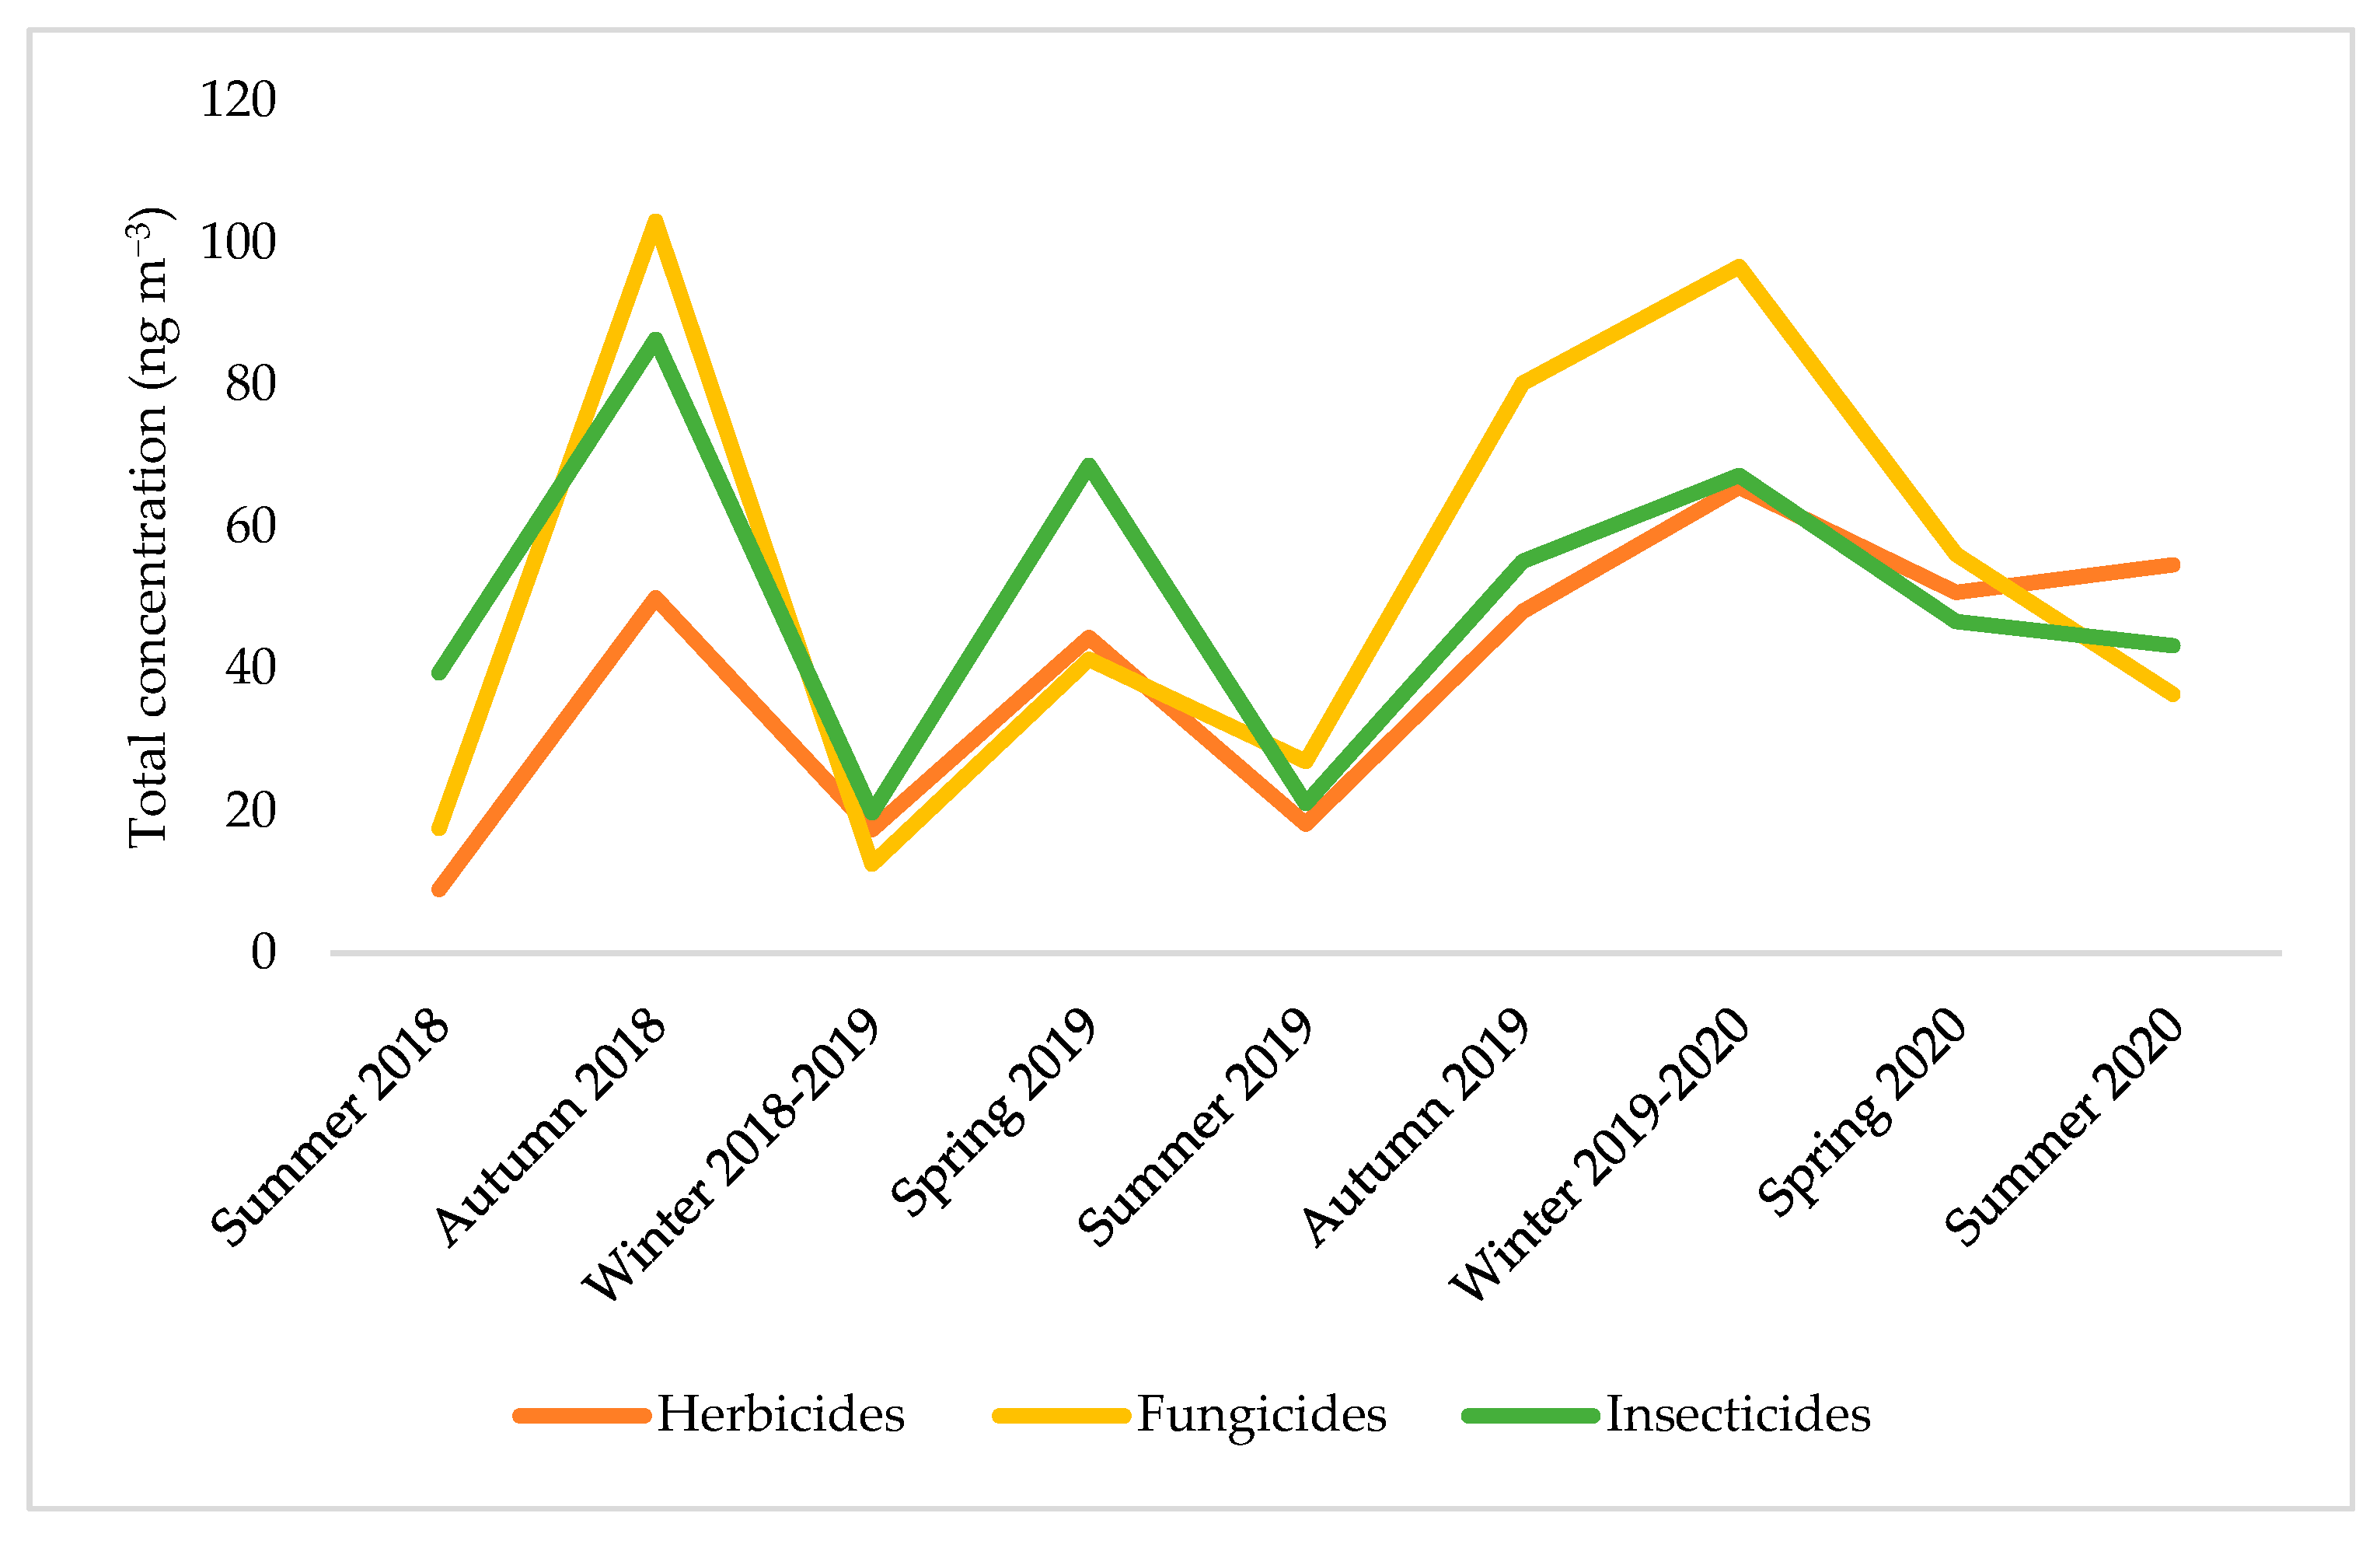
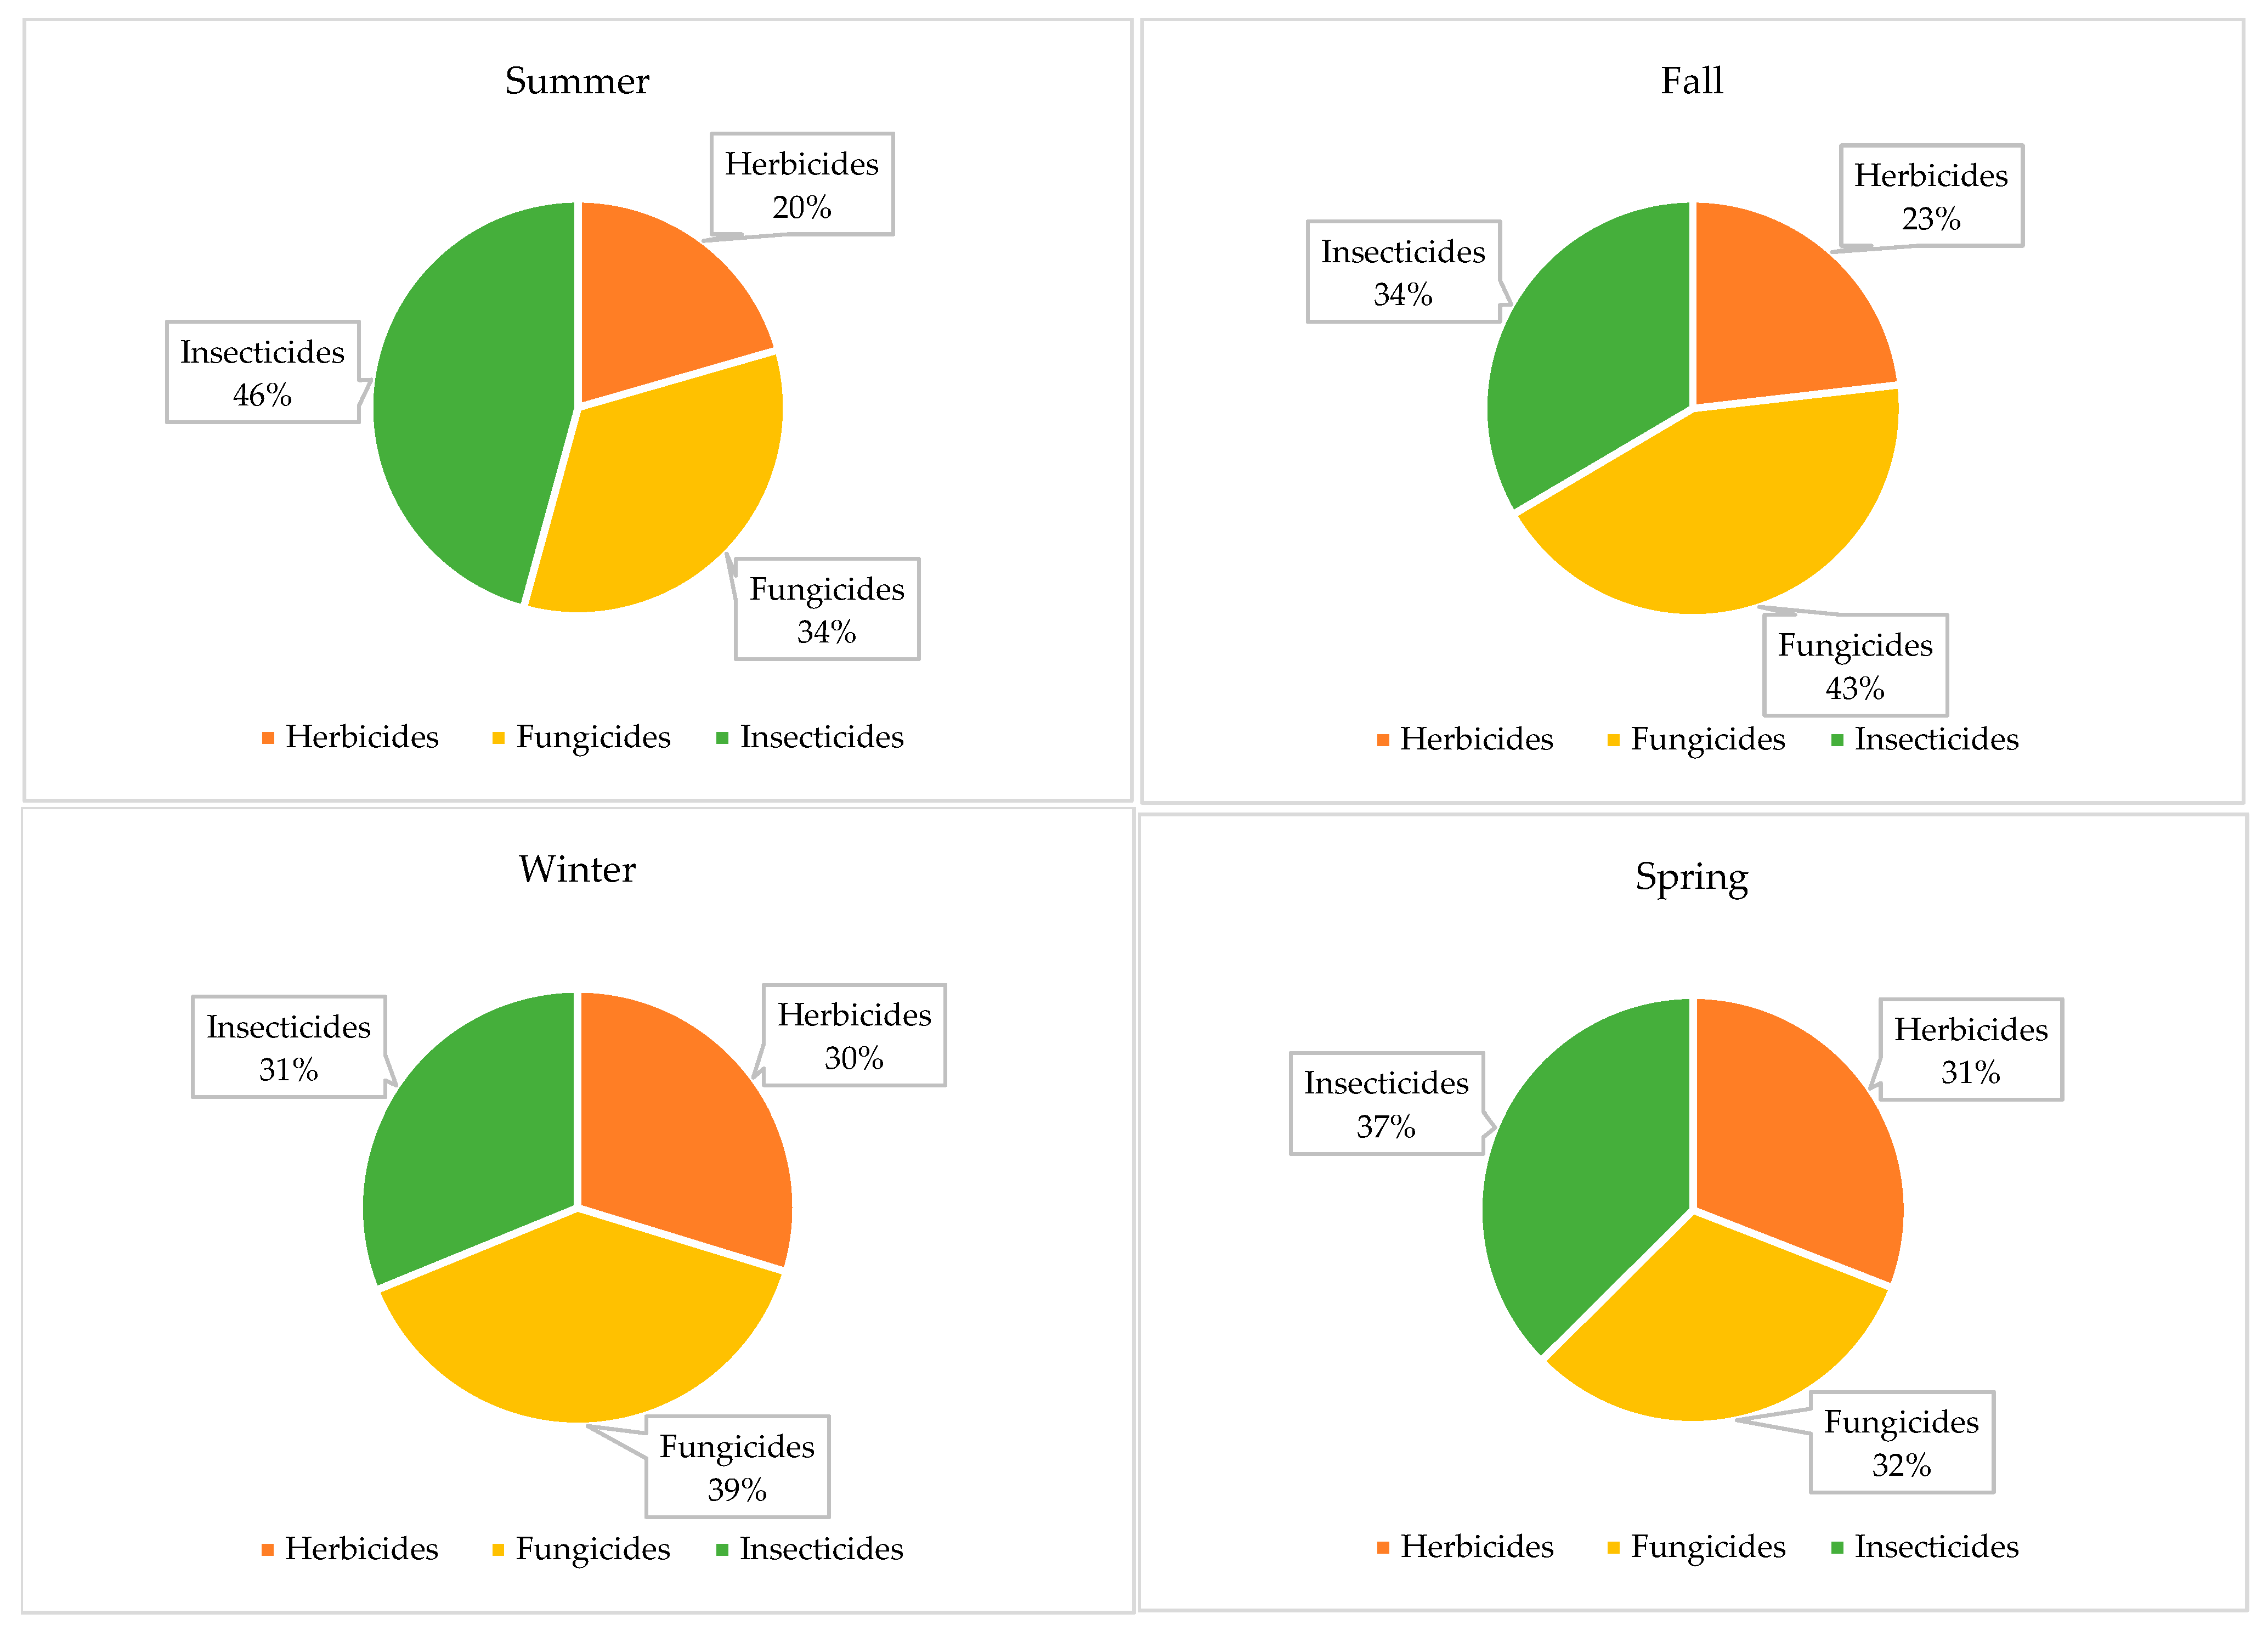
3.3. Seasonal Variability of Pesticide Concentrations

Pesticide concentrations in air, illustrated in Figure 4, showed a marked seasonal variability over the course of the year. Total concentrations (gas + particle) were not evenly distributed through the seasons but, instead, peaked during specific periods linked to agricultural activity. In fact, the autumn months (September–November) had by far the highest combined pesticide levels. We found that about 36% of the entire year’s pesticide load occurred in autumn alone—the largest share of any season. In contrast, summer (June–August) had the lowest pesticide burden (only ~20% of the annual total). Spring (March–May) and winter (December–February) were intermediate, each accounting for roughly 21–23% of the yearly total.
Figure 5 summarizes the seasonal trend of total airborne pesticides concentration by class. Across classes, summer total concentrations were universally low (all classes in the 9–55 ng m−3 range). In contrast, autumn (especially Autumn 2018) brought the highest readings (fungicides ~103 ng m−3, insecticides ~86 ng m−3, herbicides ~50 ng m−3). Winter 2019–20 also saw a broad spike (herbicides 65 ng m−3, fungicides 97 ng m−3, insecticides 67 ng m−3), implying an unusual event or cumulative buildup. The lower concentration recorded in winter 2018–2019 than those observed in winter 2019–2020 was mainly influenced by sampling interruptions (see Section 2.4). Spring values were generally high (herbicides 44–50 ng m−3; fungicides ~41–56 ng m−3; insecticides 46–68 ng m−3). In absolute terms, the summed concentration over all compounds in autumn was ~400 ng m−3 (gas + particle), nearly double the summer total (~200 ng m−3), while spring (~290 ng m−3) and winter (~263 ng m−3) were closer to each other. This indicates that there was a pronounced rise in ambient pesticide levels as the growing season progressed into late summer and fall, followed by a decline to lower levels in the winter off-season. Such seasonal trends are illustrated by the week-by-week concentration data. The autumn peak likely corresponds to late-season pesticide applications (for example, fungicide treatments near harvest time, or insecticides for end-of-season pest outbreaks), as well as possible re-volatilization and transport of residues from nearby agricultural fields from soil and plants after the summer’s cumulative usage. It is worth noting that this specific seasonal profile may reflect local agricultural practices—in many temperate regions one often expects the highest air concentrations during spring and summer when pesticides are actively used [28]. In our dataset, however, autumn emerged as the peak season, implying that significant pesticide releases were still occurring late in the growing season (possibly due to crops like orchards or vineyards receiving heavy fungicide sprays in the fall, or post-harvest field treatments). The lowest atmospheric pesticide levels were reported during summers. This pattern is likely influenced by several interrelated atmospheric factors. In urban settings (like Strasbourg site), where direct pesticide application is minimal, measured concentrations primarily reflect atmospheric transport from surrounding agricultural areas. During summer, higher temperatures increase vertical atmospheric mixing and boundary layer height, promoting dilution of airborne pesticides and reducing their accumulation near the surface. Additionally, strong solar radiation and elevated levels of oxidants (e.g., ozone, hydroxyl radicals) enhance photochemical degradation, shortening the atmospheric lifetime of semi-volatile pesticides. Moreover, wind speed is minimal during summer, which limits the dispersion of pesticide in the air and therefore prevents their short- and long-range transport from nearby fields [29]. Taken together, these factors explain the observed decline in total atmospheric pesticide concentrations during summer in the urban environment, despite continued agricultural activity in nearby fields.
Figure 6 shows the seasonal distribution of total airborne pesticides concentration by class. In summer, insecticides dominate, accounting for ~45% of the total—roughly twice the herbicide share (~21%). Fungicides make up the remaining ~33%. Warm temperatures and high insect activity in summer typically drive up insecticide applications. In autumn, fungicides become the largest share (~43%), followed by insecticides (~34%) and herbicides (~23%). Cooler and wetter fall conditions often promote fungal diseases on crops, so growers apply more fungicides before crop dormancy. For example, farmers commonly spray winter wheat with fungicide in the fall to protect it from expected cool, wet weather. This practice explains why fungicides dominate the fall composition. In contrast, herbicide use remains relatively low after the growing season. The winter pie is more balanced: fungicides are still slightly highest (~39%), but insecticides (~31%) and herbicides (~30%) are nearly equal. Overall, pesticide use is lower in winter since most crops are dormant. Because no class is overwhelmingly needed during winter, all three classes share the burden more evenly. This flat profile is consistent with lower “intensive use” periods in winter. In spring, insecticides rise again to ~37% of the total, with fungicides (~32%) and herbicides (~31%) almost tied. Spring planting invigorates both weed and insect pressures, leading to robust use of all classes. In summary, insecticides dominate summer and spring, whereas fungicides dominate fall (and still lead in winter). Herbicides have the smallest share of all seasons among the three classes with more important fractions during winter and spring. These shifts are consistent with agronomic needs and environmental conditions—warmer, wetter seasons favor insects or fungi, respectively—and match broader observations of seasonal pesticide use.

3.4. Comparison with Global Studies

In the Strasbourg urban air study, pesticides were nearly always present and often at higher levels than those seen in other cities. The total concentration of all measured pesticides in Strasbourg averaged on the order of tens of ng m−3 (mean of roughly 10–20 ng m−3), with weekly peaks exceeding 50 ng m−3 during spray seasons. By comparison, other European urban sites often report lower totals (for instance, one Spanish city study found individual pesticide averages of only 7–141 pg m−3 [30]. DFs in Strasbourg were extremely high—essentially, pesticides were detected in almost every weekly sample, similarly to European surveys that find pesticides in >90% of air samples [26]. Concentrations in Strasbourg showed strong seasonal variability, peaking in spring-summer during local agricultural application and dropping in winter. This pattern of higher summer levels is consistent with other regions: for example, legacy organochlorines in Beijing’s air also rose in summer (except for ultra-volatile HCB) [31], and European and North American studies likewise observe summer spikes linked to pesticide use and volatilization.
Dominant compounds and classes in Strasbourg reflected its surrounding agriculture. The most frequently detected and highest-concentration analytes were primarily fungicides and herbicides used on nearby crops. For instance, fungicides such as penconazole, tebuconazole, and trifloxystrobin were found in 100% of spring samples in one Strasbourg campaign (with individual levels up to ~19 ng m−3) [26]. Herbicides (e.g., pendimethalin, diflufenican) and certain insecticides (like chlorpyrifos-methyl) were also prevalent [20]. This mirrors other European findings: in rural France and Spain, fungicides (e.g., folpet, boscalid) and herbicides (terbuthylazine, 2,4-D) are often top contributors to air contamination [20]. In U.S. urban/peri-urban monitoring, a slightly different profile emerges—herbicides and fumigants tend to dominate. For example, California’s network found pesticides in ~80% of weekly samples in farm-adjacent towns, with a total of 19 compounds detected; the most common included the herbicide pendimethalin and the soil fumigant 1,3-dichloropropene (telone) [32]. Insecticides used in vector control or home gardening are occasionally detected in U.S. cities, but at generally lower levels than agricultural chemicals. Meanwhile, Chinese urban air studies reveal contamination by a broad mix of current-use pesticides, though usually at lower concentrations. Dozens of modern pesticides have been observed in megacities like Shanghai, with some compounds (e.g., diphenylamine, a fungicide additive) present in 100% of samples [33]. The most abundant pollutants in Chinese city air often include herbicides and fungicides (e.g., organo-amine herbicides, triazole fungicides like tebuconazole) alongside lingering OCPs from past use. One study noted that fungicides (tebuconazole, myclobutanil) and even a legacy insecticide (DDT’s metabolite) plus industrial HCB dominated the urban pesticide profile in coastal East China [34].
In summary, Strasbourg’s pesticide levels are at the higher end of the urban spectrum but, overall, similar patterns are seen globally. Urban air invariably contains multiple pesticides at ng m−3 levels, with nearly ubiquitous detection and clear seasonal peaks linked to spraying cycles. The specific chemicals vary with regional usage—e.g., Strasbourg (and much of Europe) is skewed toward fungicides and crop herbicides [21], U.S. city-edge air features more herbicides and fumigants [35], and Chinese cities show a mix of newer fungicides/herbicides with some persistent old pesticides [33]—yet all these studies highlight the common finding that city-center atmospheres are routinely contaminated by pesticides throughout the year.

4. Health Risk Exposure

Using the seasonal mean concentrations, we computed ADD (mg/kg-day) and HQ. All ADD values were extremely low (on the order of 10−9 to 10−7 mg/kg-day). Consequently, all HQ values were orders of magnitude below 1 for every compound and group. For example, even the highest ADDs (for infants) divided by ADIs yielded HQ typically 10−4–10−7. Seasonal HQs were aggregated to give a HI for each group. Infants had the highest HI, followed by children and adults, reflecting smaller body weight. However, all HI values were well below 1 (our largest HI ~3 × 10⁻⁷ in autumn for infants), indicating negligible non-cancer risk under EPA guidance (HI << 1). HQ or HI < 1 implies exposure is below levels of concern. Our results are consistent with other studies: for example, a Mediterranean survey in Spain found all inhalation HQ < 1 for adults, children, and infants [36], and similarly, a Chinese rural greenhouse study reported HQ < 1 (worst-case ~0.70 for one pesticide) [37]. In each case, children/infants show higher values due to lower body weight, but none exceeded safe thresholds. Thus, our findings of HQ/HI << 1 across all seasons agree with published assessments (Europe, USA, China) showing low airborne pesticide risk under ambient conditions [36,37]. The EPA-method ADD and HQ analysis demonstrates that inhalation exposures to the measured pesticides are extremely low. Even the sum of all pesticide HQs (HI) remains orders of magnitude under 1 for infants, children, and adults. This suggests negligible acute or chronic health risk. In summary, based on current ambient concentrations and ADIs, the inhalation risk is minimal.

5. Conclusions

This study provides a comprehensive assessment of atmospheric pesticide residues in an urban background influenced by agriculture by simultaneously examining gas-phase and particle-phase concentrations. Out of 104 monitored pesticides, herbicides and fungicides showed the highest detection frequencies (98%), with concentrations ranging from 2.5 to 63 ng m−3. The study found that a diverse array of current-use pesticides routinely contaminates urban air, reflecting both regional agricultural usage through wind transport and possibly local urban pesticide applications. The majority of pesticides (>60%) favored the gas phase, yet particle-bound pesticides were significant during dry and particulate-rich periods. Gas–particle partitioning was compound-dependent, with log Kp values ranging from −1.47 to −2.20, confirming the semi-volatile nature of most analytes. A cubic regression model (R2 of 0.74) showed a nonlinear association between Kₚ and particle-phase concentrations, with a marked increase in accumulation observed for compounds exceeding a Kₚ value of approximately 0.025. Seasonally, autumn accounted for 36% of the annual airborne pesticide burden, compared to only 20% in summer, due to both late-season agricultural applications and atmospheric conditions limiting dispersion. Principal component analysis confirmed that total suspended particles (TSP) concentrations and rainfall were the primary environmental factors modulating pesticide distribution between phases. Rainfall was associated with reduced airborne concentrations, likely through washout and deposition, while elevated TSP levels favored the sorption of semi-volatile pesticides onto particles. Despite the widespread detection, health risk assessments indicated extremely low inhalation exposure (HQ and HI << 1) for infants, children, and adults. This suggests that current atmospheric levels, while omnipresent, are not likely to pose immediate health risks. Nonetheless, the persistent presence of pesticide mixtures year-round warrants ongoing surveillance. Based on observed peaks in atmospheric concentrations during late spring and summer, we recommend targeted restrictions or enhanced mitigation measures during these periods. Our results also demonstrated elevated pesticide concentrations at an urban background site adjacent to agricultural areas, indicating that current buffer zones may be insufficient. We suggest revisiting minimum setback distances, especially in densely populated or sensitive urban environments. Finally, the detection of several gas-phase dominant pesticides across all seasons highlights the need for specific attention to their monitoring and regulation, due to their potential for long-range atmospheric transport and infiltration into indoor environments.

Supplementary Materials

The following supporting information can be downloaded at https://www.mdpi.com/article/10.3390/atmos16070873/s1. Table S1: Validation parameters for the targeted pesticides. Table S2: Fragmentation parameters for the analyzed pesticides. Figure S1: Mean gas and particle distribution (%) of quantified pesticide at the urban site Strasbourg.

Author Contributions

Conceptualization, D.K., S.C., O.D., and M.M.; methodology and experimentation, S.C.; validation, S.C.; data curation and interpretation, D.K.; writing—original draft preparation, D.K.; writing—review and editing, D.K., S.C., O.D., and M.M.; supervision, O.D. and M.M.; project administration, M.M. All authors have read and agreed to the published version of the manuscript.

Funding

This research received no external funding.

Institutional Review Board Statement

Not applicable.

Informed Consent Statement

Not applicable.

Data Availability Statement

The data in this study are available upon request from the first author.

Conflicts of Interest

The authors declare no conflicts of interest.

References

  1. Boonupara, T.; Udomkun, P.; Khan, E.; Kajitvichyanukul, P. Airborne pesticides from agricultural practices: A critical review of pathways, influencing factors, and human health implications. Toxics 2023, 11, 858. [Google Scholar] [CrossRef] [PubMed]
  2. Aktar, M.W.; Sengupta, D.; Chowdhury, A. Impact of pesticides use in agriculture: Their benefits and hazards. Interdiscip. Toxicol. 2009, 2, 1. [Google Scholar] [CrossRef] [PubMed]
  3. Lallas, P.L. The Stockholm Convention on persistent organic pollutants. Am. J. Int. Law 2001, 95, 692–708. [Google Scholar] [CrossRef]
  4. Udomkun, P.; Boonupara, T.; Sumitsawan, S.; Khan, E.; Pongpichan, S. and Kajitvichyanukul, P. Airborne pesticides—Deep diving into sampling and analysis. Toxics 2023, 11, 883. [Google Scholar] [CrossRef] [PubMed]
  5. Degrendele, C.; Okonski, K.; Melymuk, L.; Landlová, L.; Kukučka, P.; Audy, O.; Kohoutek, J.; Čupr, P.; Klánová, J. Pesticides in the atmosphere: A comparison of gas-particle partitioning and particle size distribution of legacy and current-use pesticides. Atmos. Chem. Phys. 2016, 16, 1531–1544. [Google Scholar] [CrossRef]
  6. Kamel, F. Paths from pesticides to Parkinson’s. Science 2013, 341, 722–723. [Google Scholar] [CrossRef] [PubMed]
  7. Mascarelli, A. Growing up with pesticides. Science 2013, 341, 740–741. [Google Scholar] [CrossRef] [PubMed]
  8. Parrón, T.; Requena, M.; Hernández, A.F.; Alarcón, R. Environmental exposure to pesticides and cancer risk in multiple human organ systems. Toxicol. Lett. 2014, 230, 157–165. [Google Scholar] [CrossRef] [PubMed]
  9. Yan, D.; Zhang, Y.; Liu, L.; Yan, H. Pesticide exposure and risk of Alzheimer’s disease: A systematic review and meta-analysis. Sci. Rep. 2016, 6, 32222. [Google Scholar] [CrossRef] [PubMed]
  10. DiBartolomeis, M.; Kegley, S.; Mineau, P.; Radford, R.; Klein, K. An assessment of acute insecticide toxicity loading (AITL) of chemical pesticides used on agricultural land in the United States. PLoS ONE 2019, 14, e0220029. [Google Scholar] [CrossRef] [PubMed]
  11. Goulson, D.; Thompson, J.; Croombs, A. Rapid rise in toxic load for bees revealed by analysis of pesticide use in Great Britain. PeerJ 2018, 6, e5255. [Google Scholar] [CrossRef] [PubMed]
  12. Kudsk, P.; Jørgensen, L.N.; Ørum, J.E. Pesticide load—A new Danish pesticide risk indicator with multiple applications. Land Use Policy 2018, 70, 384–393. [Google Scholar] [CrossRef]
  13. Degrendele, C.; Kanduč, T.; Kocman, D.; Lammel, G.; Cambelová, A.; Dos Santos, S.G.; Horvat, M.; Kukučka, P.; Šmejkalová, A.H.; Mikeš, O.; et al. NPAHs and OPAHs in the atmosphere of two central European cities: Seasonality, urban-to-background gradients, cancer risks and gas-to-particle partitioning. Sci. Total Environ. 2021, 793, 148528. [Google Scholar] [CrossRef] [PubMed]
  14. Fance3. Nombre D’exploitations, Surface, Types de Cultures: Les Chiffres Clés de L’agriculture en Alsace. 2019. Available online: https://france3-regions.francetvinfo.fr/grand-est/nombre-exploitations-surface-types-cultures-chiffres-cles-agriculture-alsace-1733597.html (accessed on 8 October 2019).
  15. Levy, M.; Al-Alam, J.; Delhomme, O.; Millet, M. An integrated extraction method coupling pressurized solvent extraction, solid phase extraction and solid-phase micro extraction for the quantification of selected organic pollutants in air by gas and liquid chromatography coupled to tandem mass spectrometry. Microchem. J. 2020, 157, 104889. [Google Scholar] [CrossRef]
  16. Yamasaki, H.; Kuwata, K.; Miyamoto, H. Effects of ambient temperature on aspects of airborne polycyclic aromatic hydrocarbons. Environ. Sci. Technol. 1982, 16, 189–194. [Google Scholar] [CrossRef]
  17. Murphy, R.R.; Haith, D.A. Inhalation health risk to golfers from turfgrass pesticides at three northeastern US sites. Environ. Sci. Technol. 2007, 41, 1038–1043. [Google Scholar] [CrossRef] [PubMed]
  18. U.S. EPA. Exposure Factors Handbook 2011 Edition (Final Report); U.S. Environmental Protection Agency: Washington, DC, USA, 2011; EPA/600/R-09/052F.
  19. PPDB. Pesticide Properties DataBase. 2023. Available online: https://sitem.herts.ac.uk/aeru/ppdb/ (accessed on 13 July 2025).
  20. FOCUS. Pesticides in Air: Considerations for Exposure Assessment; European Commission: Brussels, Belgium, 2008; p. 327, Report of the FOCUS Working Group on Pesticides in Air, EC Document Reference SANCO/10553/2006 Rev 2 June 2008.
  21. Khoury, D.; Jabali, Y.; Delhomme, O.; Millet, M. Pesticide occurrence and distribution in fogwater collected at four sites at Strasbourg metropolitan between 2015 and 2021. Environ. Pollut. 2024, 359, 124564. [Google Scholar] [CrossRef] [PubMed]
  22. Kruse-Plaß, M.; Hofmann, F.; Wosniok, W.; Schlechtriemen, U.; Kohlschütter, N. Pesticides and pesticide-related products in ambient air in Germany. Environ. Sci. Eur. 2021, 33, 144. [Google Scholar] [CrossRef]
  23. Zaller, J.G.; Kruse-Plaß, M.; Schlechtriemen, U.; Gruber, E.; Peer, M.; Nadeem, I.; Formayer, H.; Hutter, H.P.; Landler, L. Pesticides in ambient air, influenced by surrounding land use and weather, pose a potential threat to biodiversity and humans. Sci. Total Environ. 2022, 838, 156012. [Google Scholar] [CrossRef] [PubMed]
  24. Zhao, M.; Wu, J.; Figueiredo, D.M.; Zhang, Y.; Zou, Z.; Cao, Y.; Li, J.; Chen, X.; Shi, S.; Wei, Z.; et al. Spatial-temporal distribution and potential risk of pesticides in ambient air in the North China Plain. Environ. Int. 2023, 182, 108342. [Google Scholar] [CrossRef] [PubMed]
  25. Zhan, L.; Cheng, H.; Zhong, G.; Sun, Y.; Jiang, H.; Zhao, S.; Zhang, G.; Wang, Z. Occurrence of atmospheric current-use and historic-use pesticides at a CAWNET background site in central China. Sci. Total Environ. 2021, 775, 145802. [Google Scholar] [CrossRef]
  26. Schummer, C.; Mothiron, E.; Appenzeller, B.M.; Rizet, A.L.; Wennig, R.; Millet, M. Temporal variations of concentrations of currently used pesticides in the atmosphere of Strasbourg, France. Environ. Pollut. 2010, 158, 576–584. [Google Scholar] [CrossRef] [PubMed]
  27. Foreman, W.T.; Majewski, M.S.; Goolsby, D.A.; Wiebe, F.W.; Coupe, R.H. Pesticides in the atmosphere of the Mississippi River Valley, part II—Air. Sci. Total Environ. 2000, 248, 213–226. [Google Scholar] [CrossRef] [PubMed]
  28. Habran, S.; Giusti, A.; Galloy, A.; Gérard, G.; Delvaux, A.; Pigeon, O.; Remy, S. Spatial and temporal variations of currently used pesticides (CUPs) concentrations in ambient air in Wallonia, Belgium. Chemosphere 2024, 351, 141241. [Google Scholar] [CrossRef] [PubMed]
  29. Van Dijk, H.F.G.; Van Pul, W.A.J.; De Voogt, P. Fate of Pesticides in the Atmosphere; Kluwer Academic Publishers: Dordrecht, The Netherlands, 1999; ISBN 0-7923-59941-1. [Google Scholar]
  30. Coscollà, C.; Hart, E.; Pastor, A.; Yusà, V. LC-MS characterization of contemporary pesticides in PM10 of Valencia Region, Spain. Atmos. Environ. 2013, 77, 394–403. [Google Scholar] [CrossRef]
  31. Zhang, L.; Huang, Y.; Dong, L.; Shi, S.; Zhou, L.; Zhang, T.; Mi, F.; Zeng, L.; Shao, D. Levels, seasonal patterns, and potential sources of organochlorine pesticides in the urban atmosphere of Beijing, China. Arch. Environ. Contam. Toxicol. 2011, 61, 159–165. [Google Scholar] [CrossRef] [PubMed]
  32. The New Lede. Pesticides found in 80% of Air Samples from California Farm Communities. 2024. Available online: https://www.thenewlede.org/2024/10/pesticides-found-in-80-of-air-samples-from-california-farm-communities/ (accessed on 1 October 2024).
  33. Ni, J.; Cai, M.; Lin, Y.; Li, T.; Ma, J. Occurrence, seasonal variations, and spatial distributions of current-use organoamine pesticides in the atmosphere of Shanghai, China. Atmos. Pollut. Res. 2024, 15, 102187. [Google Scholar] [CrossRef]
  34. Zhang, X.; Zhang, X.; Zhang, Z.F.; Yang, P.F.; Li, Y.F.; Cai, M.; Kallenborn, R. Pesticides in the atmosphere and seawater in a transect study from the Western Pacific to the Southern Ocean: The importance of continental discharges and air-seawater exchange. Water Res. 2022, 217, 118439. [Google Scholar] [CrossRef] [PubMed]
  35. Atmo Grand Est. Évaluation des Pesticides en Grand Est—Rapport Final 2021; ATMO Grand Est: Schiltigheim, France, 2021. [Google Scholar]
  36. Lopez, A.; Yusà, V.; Munoz, A.; Vera, T.; Borras, E.; Ródenas, M.; Coscolla, C. Risk assessment of airborne pesticides in a Mediterranean region of Spain. Sci. Total Environ. 2017, 574, 724–734. [Google Scholar] [CrossRef] [PubMed]
  37. Hu, Y.; Wu, S.; Lyu, W.; Ning, J.; She, D. Risk assessment of human exposure to airborne pesticides in rural greenhouses. Sci. Rep. 2023, 13, 5138. [Google Scholar] [CrossRef] [PubMed]
Figure 1. Location of the urban sampling site and surrounding agricultural areas with dominant crop types [14].
Atmosphere 16 00873 g001
Figure 2. Most detected pesticide (DF > 40%), by class and phase in the analyzed air samples.
Atmosphere 16 00873 g002
Figure 3. Relationship between Kp and particle-phase concentration.
Atmosphere 16 00873 g003
Figure 4. Weekly total pesticide concentrations (gas + particle phases) measured over the two-year sampling. Each point represents the sum of all pesticides in a given weekly sample.
Atmosphere 16 00873 g004
Figure 5. Seasonal total concentration levels by pesticide class between summer 2018 and summer 2020.
Atmosphere 16 00873 g005
Figure 6. Seasonal distribution of total airborne pesticides concentration by class.
Atmosphere 16 00873 g006
Table 1. Key parameters for GC-MS/MS and LC-MS/MS used for the analysis of the targeted pesticides.
ParameterGC-MS/MS
(Semi-Volatile Pesticides)
LC-MS/MS
(Non-Volatile Pesticides)
InstrumentThermo Scientific Trace Ultra/ITQ 700 + QQQ MS/MSThermo Scientific Surveyor + TSQ Quantum Access Max QQQ MS/MS
Pre-concentrationSPME (Polyacrylate fiber (85 µm) at 60 °C for 40 min). Direct Injection
ModeMRM (Multiple Reaction Monitoring)
ColumnOptima XLB (30 m L × 0.25 mm i.d × 0.25 µm film)Nucleodur C18 Pyramid (150 mm L × 3 mm i.d × 3 µm particle diameter)
Column TemperatureOven: Programmed Thermostated at 25 °C
Injection ModeSplitless at 250 °C for 15 min
Transfer Line Temperature300 °C300 °C
Ion Source Temp210 °C30 °C
Carrier Gas/Flow RateHelium at 1 mL min−1ACN (B)/Water (A)+ 0.1% formic acid at 0.3 mL min−1
Ionization ModeElectron Impact (EI)Positive Electrospray Ionization (ESI+)
Oven Temperature Program50 °C (3 min) → 160 °C @ 36.6 °C min−1 → 300 °C @ 5.8 °C min−1 (10 min hold)30(B):70(A) (5 min) → 50(B):50(A) (6 min) → 80(B):20(A) (7 min) → 95(B):5(A) (10 min) → 30(B):70(A) (8 min)
Table 2. Correlation of environmental variables with PC: significance of meteorological drivers on pesticide phase distribution. Significant correlations are show in bold.
VariablePCCorrelation (r)p-ValueSignificance
TemperaturePC10.1900.22113Not significant
TemperaturePC2−0.804<0.00001Highly significant
RainfallPC10.819<0.00001Highly significant
RainfallPC20.2700.07989Marginal
TSPPC1−0.820<0.00001Highly significant
TSPPC2−0.1770.25658Not significant
Particle-phase PC1−0.5580.01842Significant
Particle-phase PC2−0.1200.44530Not significant
Gas-phase PC1−0.3600.01783Significant
Gas-phase PC20.711<0.00001Highly significant
Disclaimer/Publisher’s Note: The statements, opinions and data contained in all publications are solely those of the individual author(s) and contributor(s) and not of MDPI and/or the editor(s). MDPI and/or the editor(s) disclaim responsibility for any injury to people or property resulting from any ideas, methods, instructions or products referred to in the content.

