Article

Characteristics and Sources of VOCs During a Period of High Ozone Levels in Kunming, China

1
Zhejiang Provincial Top Discipline of Biological Engineering (Level A), College of Biological and Environmental Sciences, Zhejiang Wanli University, Ningbo 315100, China
2
Air Pollution Prevention and Control Research Center, Kunming Research Academy of Eco-Environmental Sciences, Kunming 650032, China
3
Center for Excellence in Regional Atmospheric Environment, Fujian Key Laboratory of Atmospheric Ozone Pollution Prevention, Key Laboratory of Urban Environment and Health, Institute of Urban Environment, Chinese Academy of Sciences, Xiamen 361021, China
4
Zhejiang Key Laboratory of Pollution Control for Port-Petrochemical Industry, Ningbo Key Laboratory of Urban Environmental Pollution and Control, CAS Haixi Industrial Technology Innovation Center in Beilun, Ningbo 315830, China
5
College of Resources and Environment, Fujian Agriculture and Forestry University, Fuzhou 350002, China
6
Yunnan Guoke Environmental Protection Co., Ltd., Kunming 650206, China
*
Authors to whom correspondence should be addressed.
These authors contributed equally to this work.
Atmosphere 2025, 16(7), 874; https://doi.org/10.3390/atmos16070874
Submission received: 28 May 2025 / Revised: 12 July 2025 / Accepted: 15 July 2025 / Published: 17 July 2025
(This article belongs to the Section Air Quality)

Abstract

The increasing levels of ozone pollution have become a significant environmental issue in urban areas worldwide. Previous studies have confirmed that the urban ozone pollution in China is mainly controlled by volatile organic compounds (VOCs) rather than nitrogen oxides. Therefore, a study on the emission characteristics and source analysis of VOCs is important for controlling urban ozone pollution. In this study, hourly concentrations of 57 VOC species in four groups were obtained in April 2022, a period of high ozone pollution in Kunming, China. The ozone formation potential analysis showed that the accumulated reactive VOCs significantly contributed to the subsequent ozone formation, particularly aromatics (44.16%) and alkanes (32.46%). In addition, the ozone production rate in Kunming is mainly controlled by VOCs based on the results of the empirical kinetic modeling approach (KNOx/KVOCs = 0.25). The hybrid single-particle Lagrangian integrated trajectory model and polar coordinate diagram showed high VOC and ozone concentrations from the southwest outside the province (50.28%) and the south in local areas (12.78%). Six factors were obtained from the positive matrix factorization model: vehicle exhaust (31.80%), liquefied petroleum gas usage (24.16%), the petrochemical industry (17.81%), fuel evaporation (11.79%), coal burning (7.47%), and solvent usage (6.97%). These findings underscore that reducing anthropogenic VOC emissions and strengthening controls on the related sources could provide a scientifically robust strategy for mitigating ozone pollution in Kunming.
Keywords:
VOCs; Ozone; OFP; EKMA; PMF

1. Introduction

The increasing levels of ozone (O3) pollution have become a significant environmental issue in urban areas worldwide, posing threats to human health and the ecosystem [1,2]. Ozone, a secondary pollutant, is formed in the atmosphere through complex photochemical reactions involving nitrogen oxides (NOx) and volatile organic compounds (VOCs) in the presence of sunlight [3]. While NOx emissions have been regulated and controlled, VOCs remain a significant concern due to their diverse sources and potential to contribute to ozone formation [4,5]. VOCs are not only important precursors of ozone, PM2.5, and secondary organic aerosol (SOA), but also are harmful to human bodies, causing toxic effects, carcinogenicity, teratogenicity, and mutagenicity [6,7]. Due to the significant differences in VOC sources among countries and regions, their contribution characteristics to the local ozone formation potential (OFP) are worth studying. According to previous reports, alkenes such as ethylene and propylene [8,9,10], 1.3-butadiene, and isoprene [11]; alkanes such as ethane and propane [10]; aromatics such as toluene [8]; and oxygenated VOCs (OVOCs) such as acetaldehyde [11,12] and butanal [13] are the main contributors to the local OFP. Furthermore, VOCs exhibit significant regional variations in concentration levels and source compositions across different countries and regions worldwide, which are closely associated with local energy consumption structures, dominant industrial types, ecological background conditions, and patterns of human production and daily activities. For instance, alkanes were the dominant contributors to total VOCs (TVOCs) [14], with their sources strongly linked to natural gas combustion processes in Vancouver, Canada [15]. At the Port of Dunkirk in France, the observational results showed that alkanes accounted for 34.2% of TVOCs, primarily consisting of C2–C5 alkanes such as ethane, propane, and butane [16]. These emissions were mainly derived from natural gas usage and gasoline evaporation processes, reflecting the significant impact of transportation activities and energy consumption behaviors in port areas on VOC compositions [17]. In cities in South Asia, such as Delhi, India, alkenes accounted for 39% of TVOCs, with ethylene as the primary component [18]. This feature was confirmed to be directly related to the widespread biomass combustion practices among residents [19]. In cities with high forest coverage, such as Chiang Mai in Thailand, with an 80% forest coverage rate, TVOCs mainly originate from biogenic emissions by plants and vehicle exhaust, reflecting the synergistic effects of natural sources and anthropogenic sources [20,21].
In China, rapid urbanization and industrialization increased VOC emissions, which have become one of the major atmospheric pollutants in urban areas [22,23,24]. Meanwhile, ozone pollution occurs more frequently and has become the second most important urban air pollutant after PM2.5 [4]. Therefore, to better understand the driving factors behind elevated ozone levels in the region, it is essential to understand the characteristics and sources of VOCs during periods of high ozone levels. According to the “Ambient Air Quality Standards (GB 3095-2012 [25])” issued by the Ministry of Ecology and Environment of China (https://www.mee.gov.cn/), the hourly average concentration limit of ozone is 160 µg/m3 and 200 µg/m3, and the daily maximum 8-hour average concentration limit is 100 µg/m3 and 160 µg/m3 (298.15 K and 1013.25 hPa) for Class I and Class II, respectively. The regions of Class I include nature reserves, scenic spots, and other areas that require special protection. The regions of Class II include residential areas, mixed commercial, transportation and residential areas, cultural areas, industrial areas, and rural areas. Regrettably, VOCs have not yet been included in the daily ambient air quality standards in China.
In recent years, Kunming, the capital city of Yunnan Province in China, has experienced elevated ozone levels during specific periods, particularly in springtime. The offline sampling in six different functional areas of Kunming was conducted over one week in April 2021. The results showed that Kunming’s ambient atmospheric VOCs mainly originate from anthropogenic source emissions [26]. However, the relevant research is limited. To further identify and quantify the types and sources of VOCs that are prevalent during the high ozone episodes in Kunming, this study utilized hourly online data with high temporal resolution for analysis. Through a concentrated field campaign and an advanced analytical technique, a broad range of VOCs was sampled and analyzed to gain insights into their sources and impacts. The hybrid single-particle Lagrangian integrated trajectory (HYSPLIT) model and polar coordinate diagram were used to analyze the transport and dispersion of VOCs. Additionally, the OFP was evaluated through the methods of the maximum increment reactivity (MIR). Special attention was given to the identification of key VOC species with significant contributions to ozone formation. The empirical kinetic modeling approach (EKMA) was used to study the sensitivity to ozone precursors. Finally, major sources and their contributions were calculated using the positive matrix factorization (PMF) model. The results of this study not only shed light on the VOC–ozone relationship but also provide scientific data for air quality management in Kunming.

2. Materials and Methods

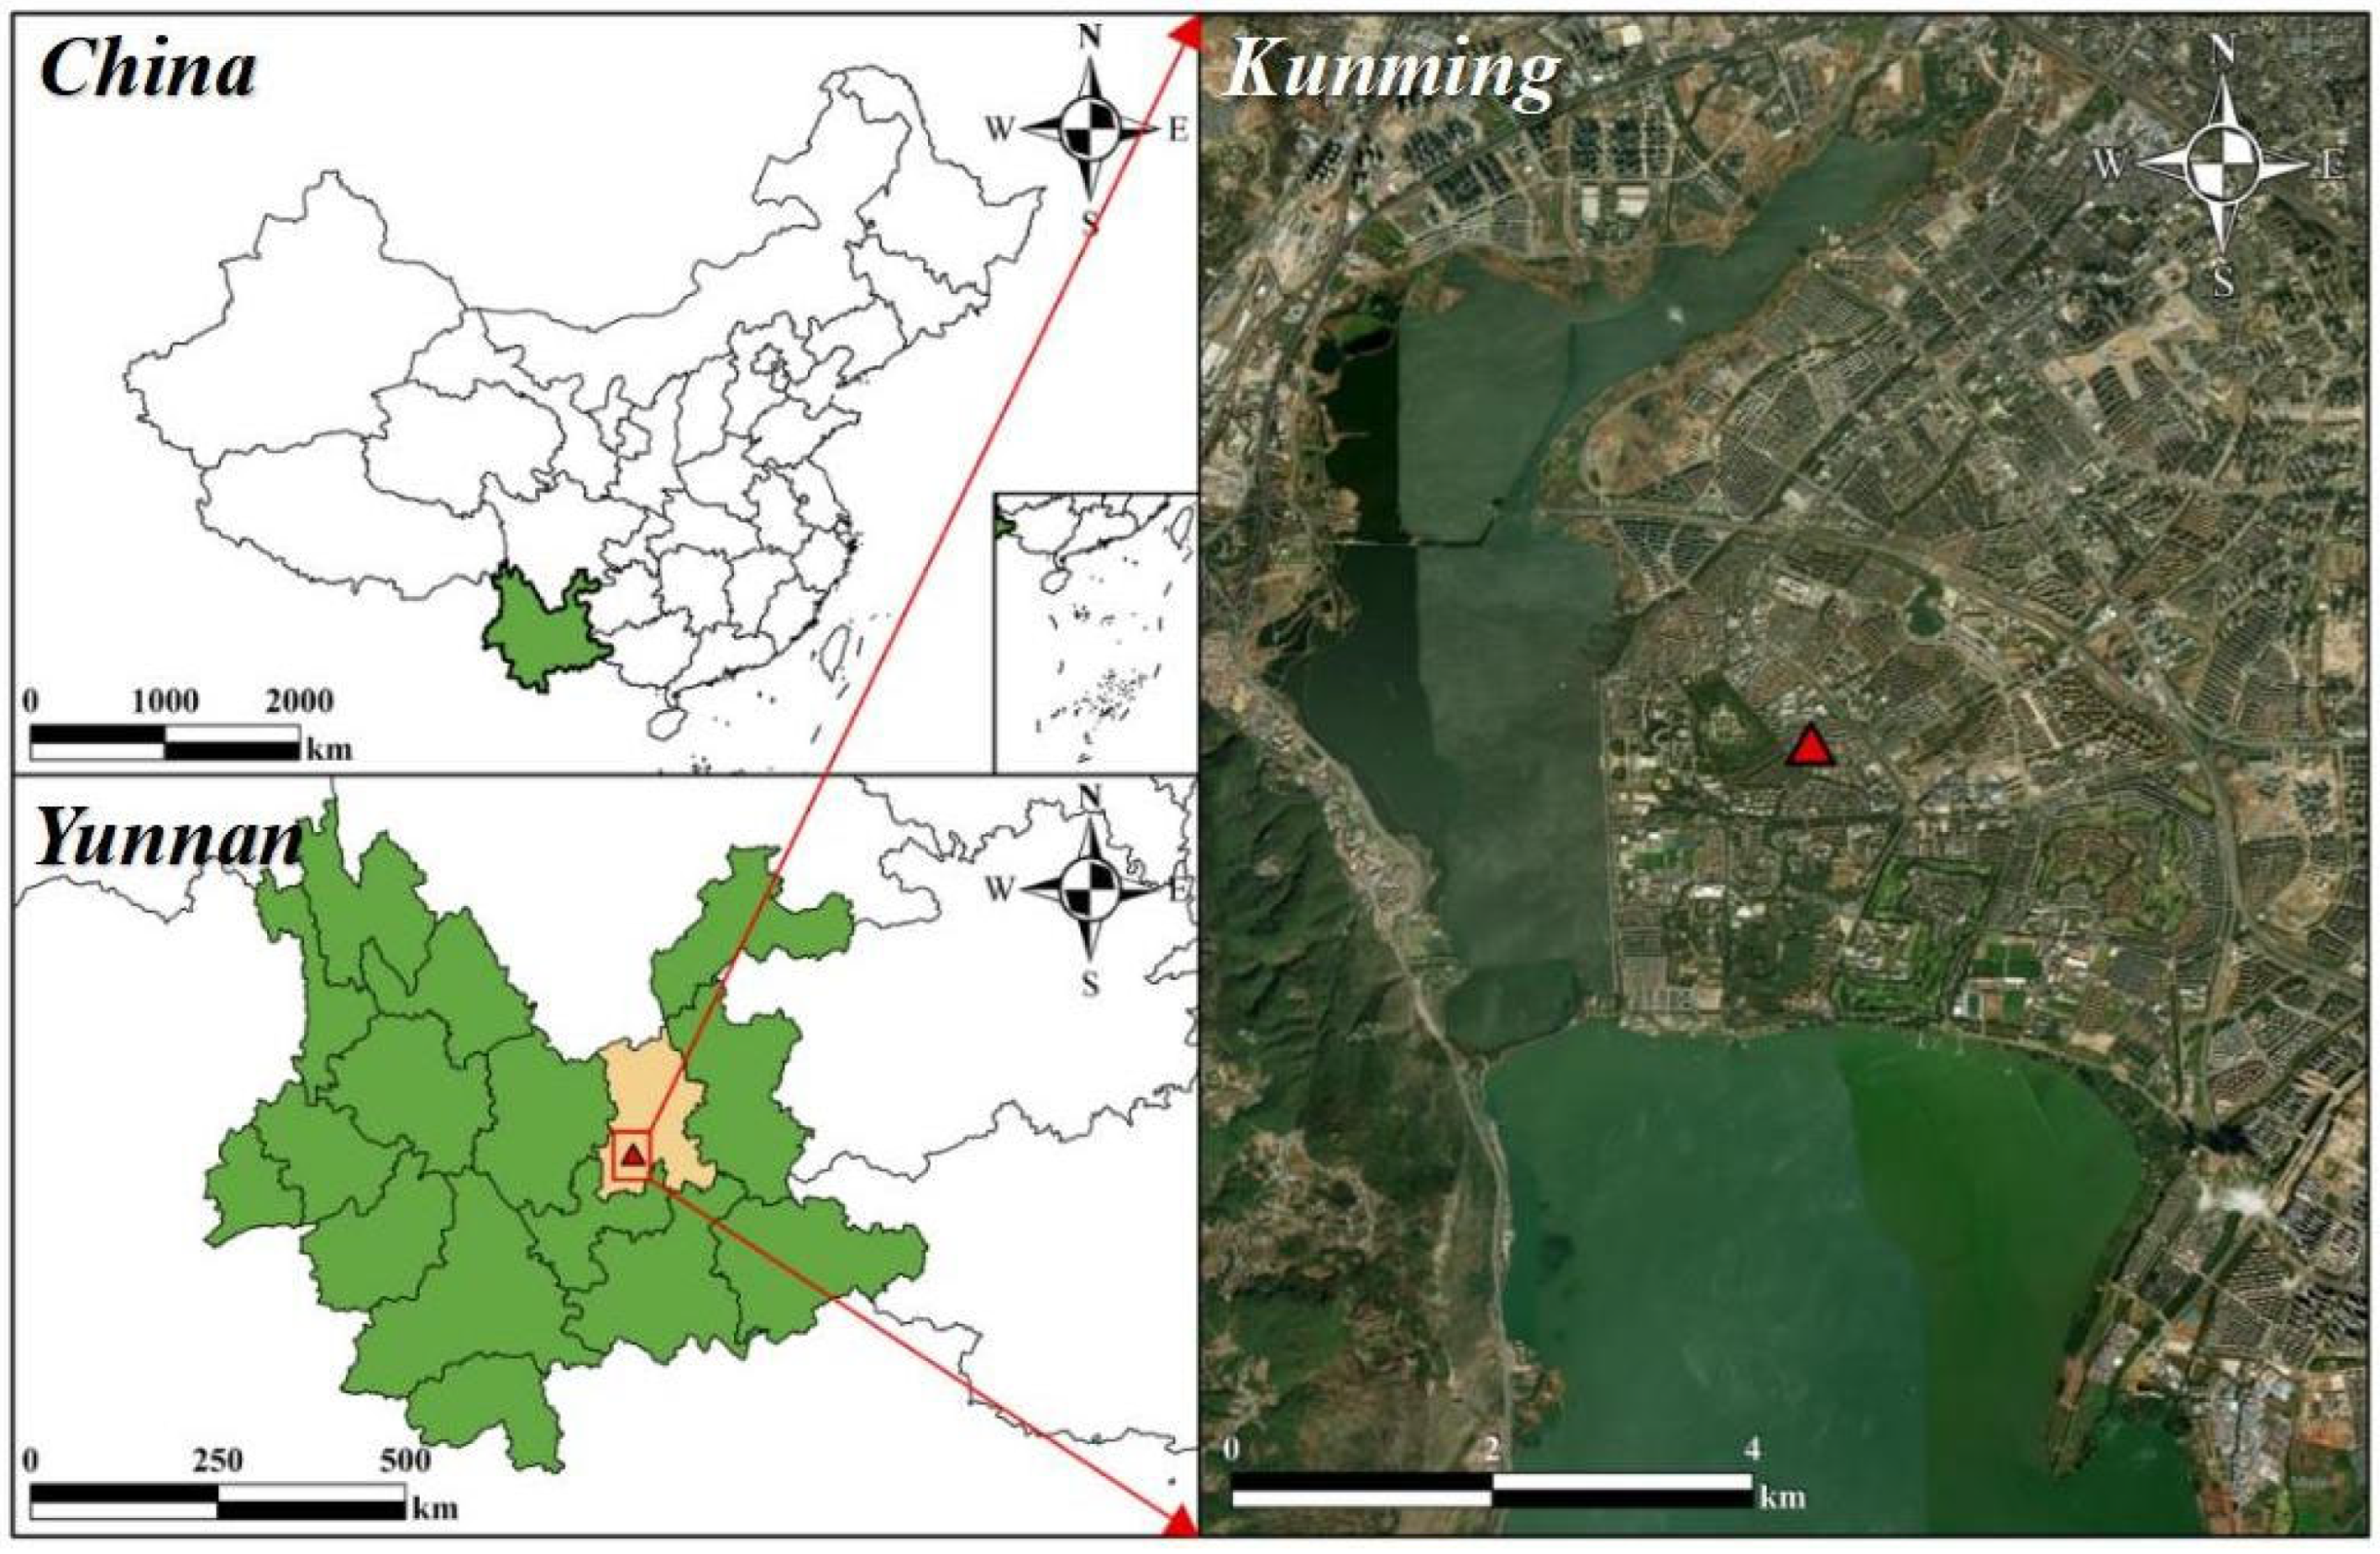
2.1. Study Site and Data Collection

The field study was carried out in Kunming City, Yunnan Province, China (102°66′89″ E, 24°98′76″ N). The sampling site is located in the southwest of the city, about 1.3 km from Dianchi Lake. It is surrounded by residential areas and hotels, and there is a main road to the northeast. Kunming, the capital of Yunnan Province, is located in the southwest of China. By the end of 2024, its permanent resident population was 8.687 million. Although Kunming is located at a subtropical north latitude, it is called the “Spring City” for its mild and pleasant climate during the four seasons, with an annual mean temperature of 15 °C. It has large daily ambient temperature differences (4–20 °C) and high ultraviolet intensity. Due to the influence of the warm and humid air clusters in the southwest of the Indian Ocean, the prevailing wind is from the southwest both in spring and summer in Kunming. The Air Quality Index (AQI) of Kunming is always ranked among the top ten best cities in China.
A Thermo Fisher 5900-C (Thermo Fisher Scientific, Waltham, MA, USA) was deployed on the roof of a building (10 m) about 1.3 km from Dianchi Lake (Figure 1). It adopts gas chromatography with flame ionization detection (GC-FID) technology to conduct continuous qualitative and quantitative analysis of the target components in the ambient air for 24 h over 7 days, and the analysis and detection limit can reach the ppt level. The hourly VOC concentrations of 57 species (Table S1) according to the Photochemical Assessment Monitoring Station (PAMS) were obtained from 1 to 30 April 2022 [27,28,29,30]. In addition, meteorological parameters, including wind speed (WS), wind direction (WD), temperature (T), relative humidity (RH), total solar radiation (TSR), and boundary layer height (BLH), as well as the concentrations of NOx and O3, were concurrently monitored to facilitate the characterization of ambient VOC pollution.

2.2. OFP Analysis

The OFP was used to characterize the potential of each VOC component to generate ozone [31,32]. OFP was calculated by multiplying the atmospheric concentration of each VOC by its maximum incremental reactivity (MIR):
O F P i = V O C i × M I R i
where OFPi represents the ozone formation contribution of compound i, mg/m3; VOCi represents the observed concentration of compound i, mg/m3; MIRi represents the maximum ozone concentration that can be generated by increasing the concentration of VOC compound i per unit [33]. The MIR values are shown in Table S2.

2.3. EKMA Model

The EKMA is the model used to establish the relationship among O3, VOCs, and NOx. The EKMA curve is an isogram plotted based on the ozone generation concentration or generation rate corresponding to different initial concentration backgrounds. It can visually reflect the nonlinear relationship between the ozone generation concentration and the reduction of NOx and VOC emissions from its precursors, thereby qualitatively studying the sensitivity of ozone generation [34,35,36].

2.4. HYSPLIT Model

The HYSPLIT model is widely used for analyzing the transport and dispersion of VOCs and is mainly affected by the terrain height, ambient temperature, rainfall, mixed layer depth, and relative humidity [37,38,39]. In this study, the model was used to compute 24 h backward air mass trajectories at an initial height of 500 m above sea level at the study location.

2.5. PMF Model

The PMF model (version 5.0) was used to identify VOC sources from 1-h-averaged concentrations of 57 VOC species in April 2022. The main equation of PMF is as follows:
X i j = k = 1 p g i k × f k j + e i j
where Xij represents the concentration of component j in sample i, gik represents the contribution of k source to sample i, fkj represents the content of component j in emission source k, eij represents the residuals, and p represents the number of pollution sources.
The PMF separates VOC sources by using the covariance of constituent variables. Since atmospheric dilution can induce the covariance, the ventilation coefficient (VC) is used to quantify the dilution by multiplying the boundary layer height (BLH) and the wind speed (WS). The influence of local dispersion on the observed VOC concentrations is then reduced by normalizing the data to the average VC during the whole study period to produce dispersion-normalized VOC concentrations, as calculated below [40]:
V C t = B L H t × u t
C V C , i j = X i j × V C t V C m
where BLHt is the boundary layer height for period t, ut is the mean wind speed for period t, VCt is the ventilation coefficient for period t, VCm is the mean VC over the whole sampling period, and CVC,ij is the corresponding dispersion normalized VOC concentrations for period t.

3. Results and Discussion

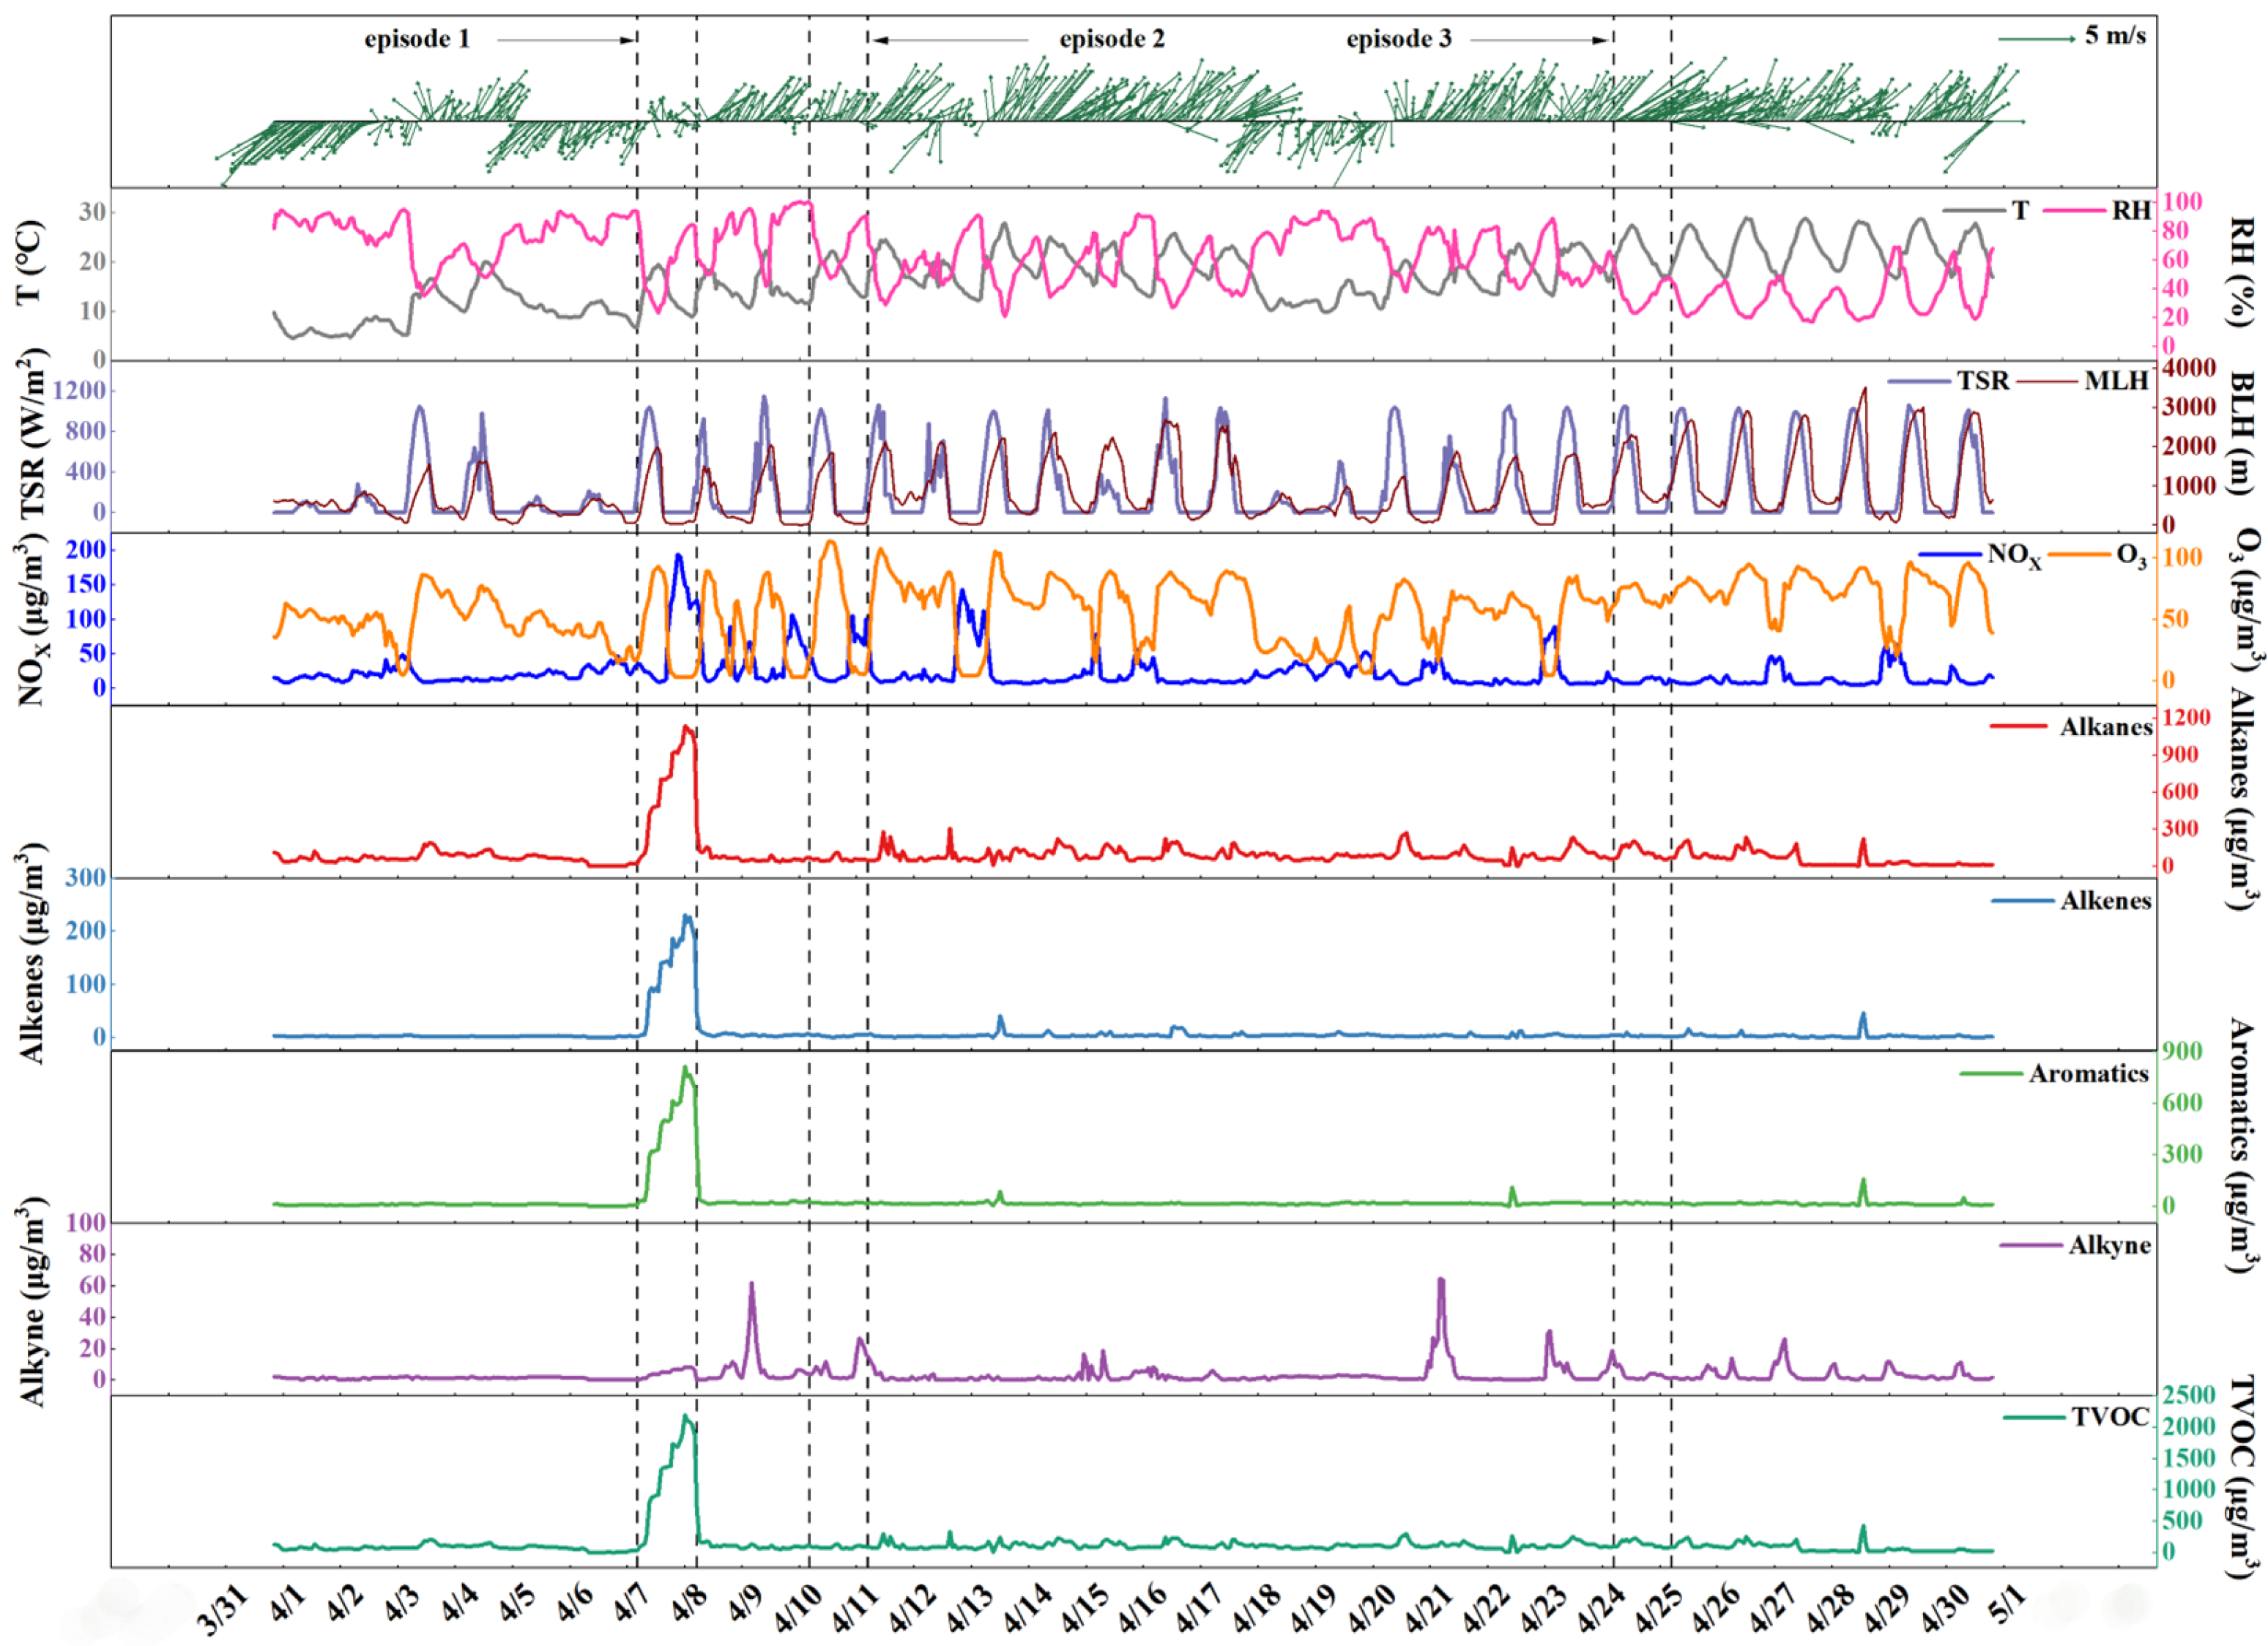
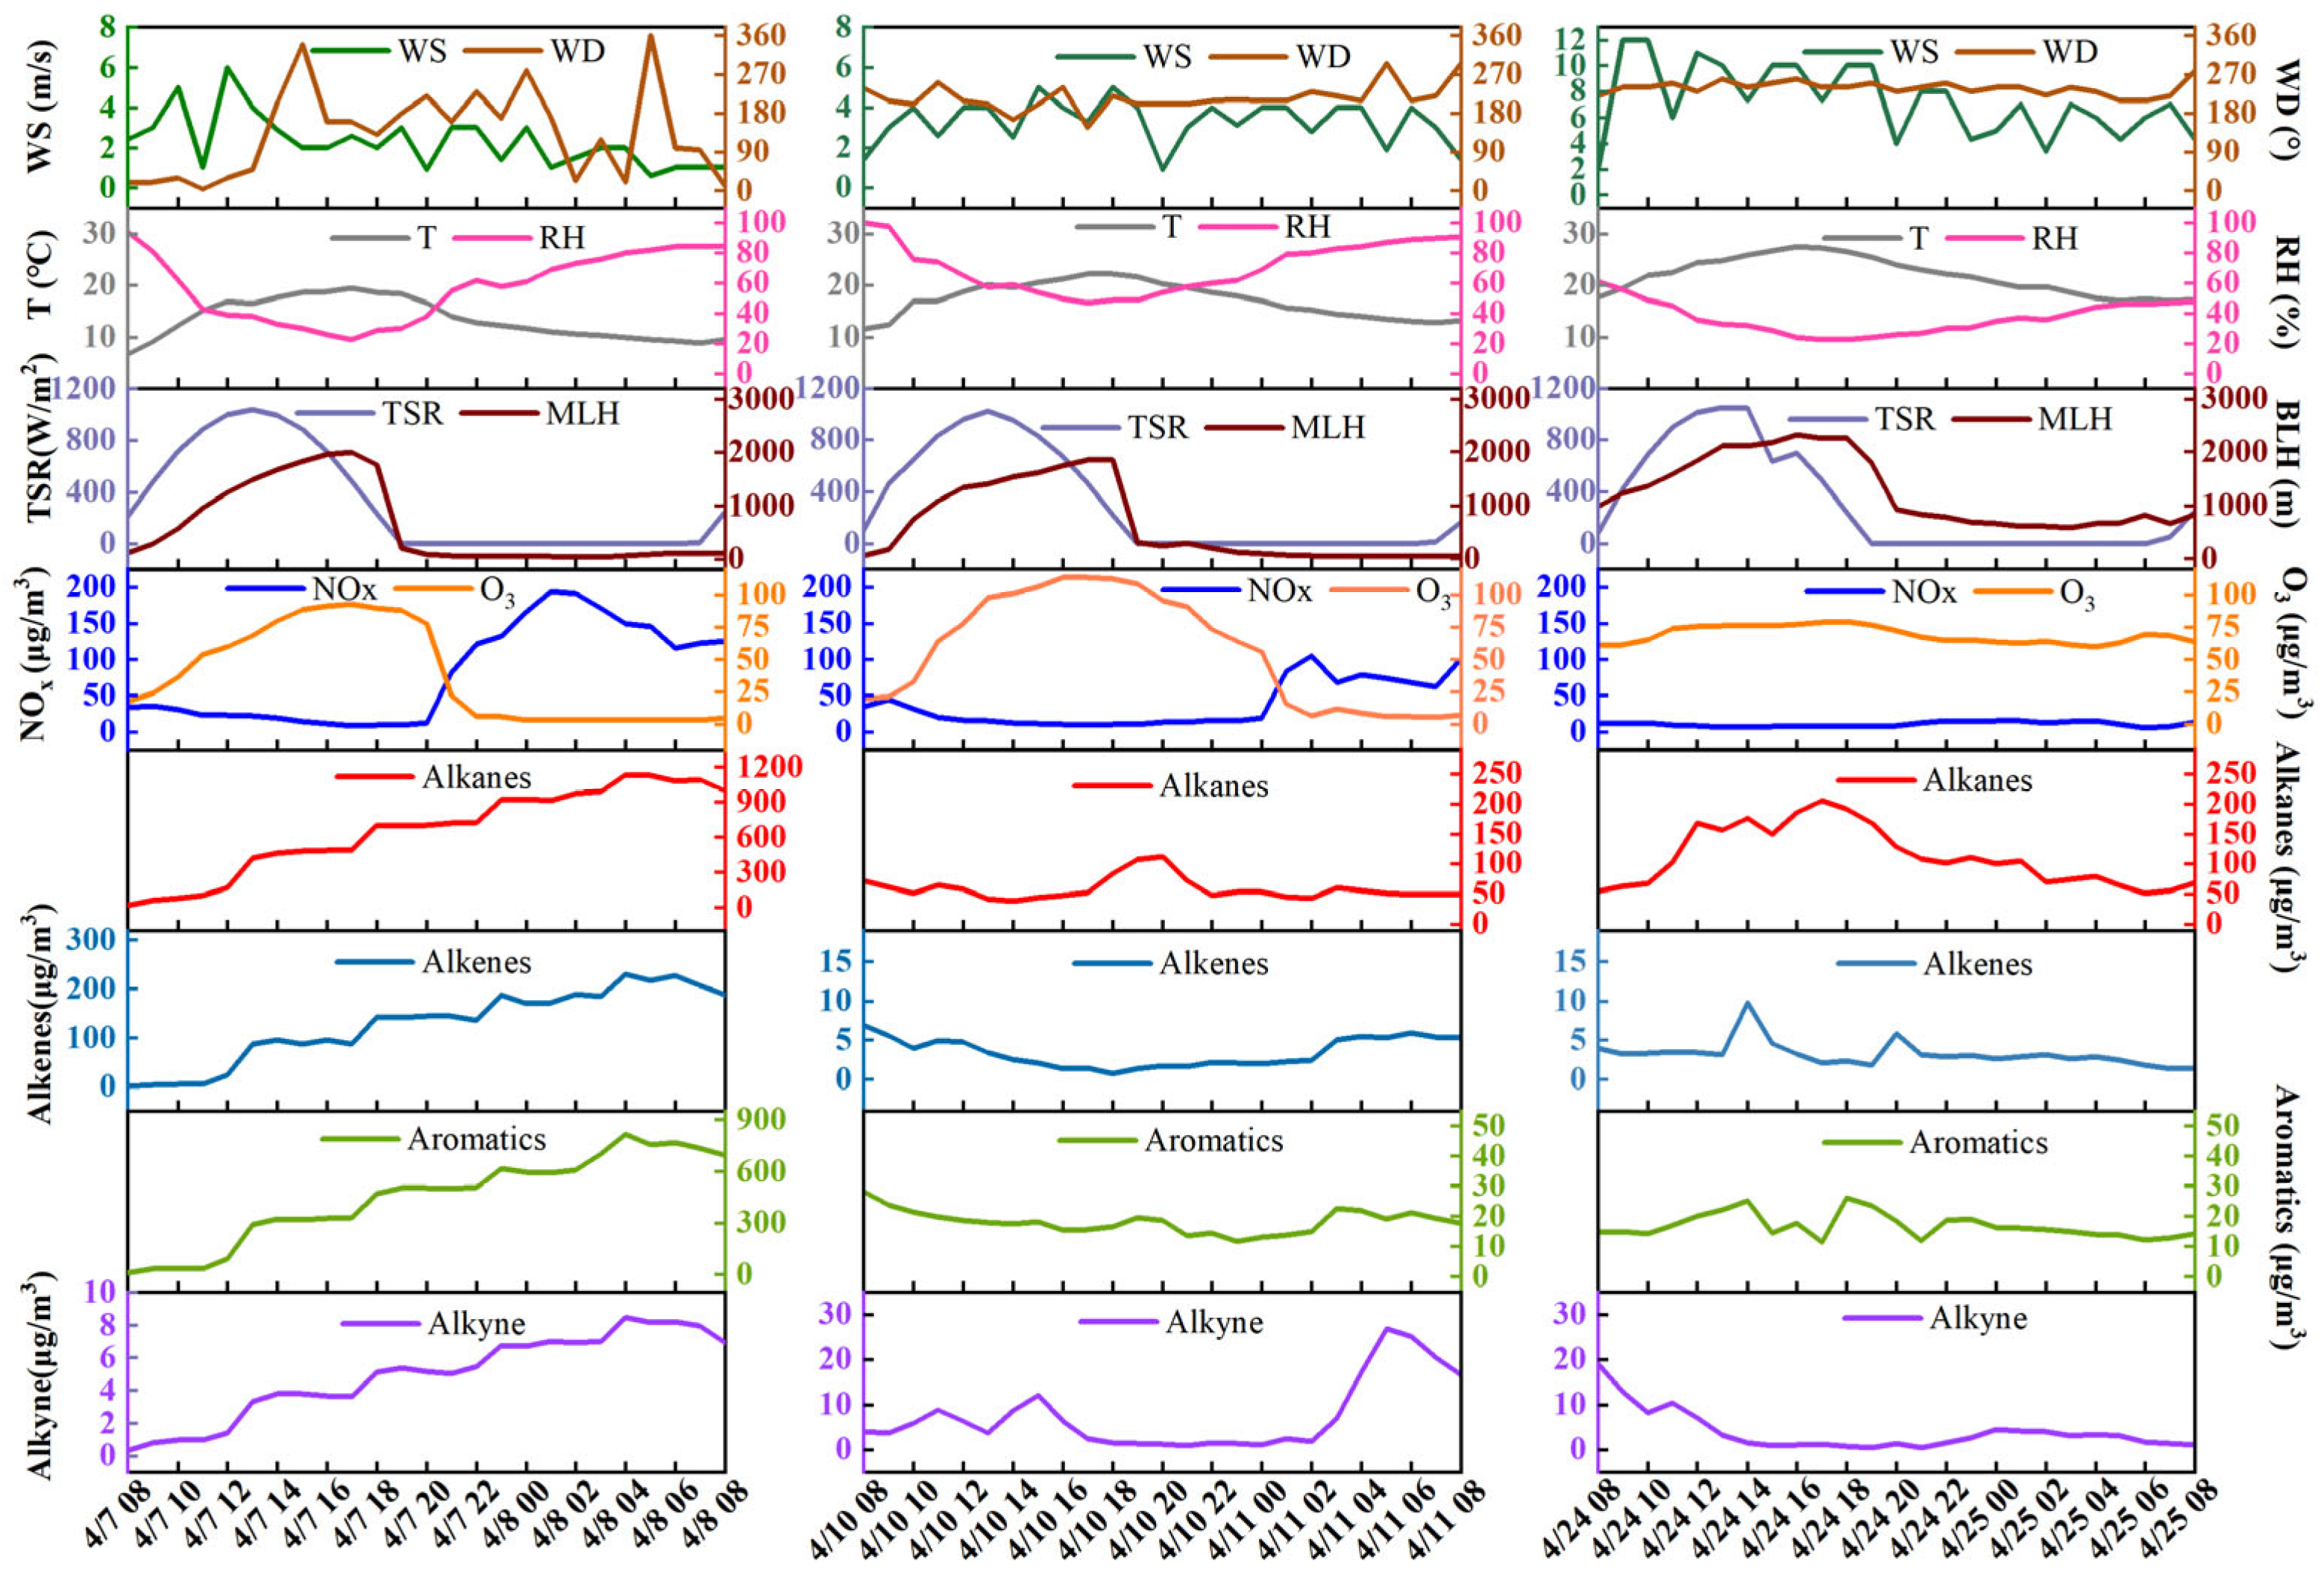
3.1. Hourly Variations of VOCs and Meteorological Parameters

In this study, hourly concentrations of 57 VOC species of PAMS were obtained in April 2022 (n = 40,320). The hourly concentrations of total VOCs were 0–2193.52 µg/m3 (avg = 137.25 µg/m3), which could be divided into four groups of alkanes (70.38%), aromatics (21.60%), alkenes (5.65%), and alkyne (2.37%), with average concentrations of 96.60 µg/m3, 29.64 µg/m3, 7.75 µg/m3, and 3.25 µg/m3, respectively. The main components of alkanes were isobutane (27.06%) and isopentane (22.35%), and the proportions of the remaining 27 alkanes were all less than 10%. The proportions of the 16 aromatic compounds were relatively even, among which the proportion of m/p-xylene (10.95%) was the highest. Alkenes were mainly composed of ethylene (23.82%), isoprene (16.61%), and 1-hexene (16.31%). Acetylene was the only compound of alkynes in this study, because there was only acetylene among the alkynes in PAMS. As shown in Figure 2, the same surge in VOC concentrations of alkanes, aromatics, and alkenes was observed from 7 to 8 April. The concentrations of alkanes, alkenes, and aromatics had several small fluctuations, but there were no obvious variations during most of the observation period. On the other hand, the alkyne had its two maximums both at 8 a.m. on 9 April (62.28 µg/m3) and 21 April (65.06 µg/m3), respectively. During the whole month, the alkyne concentrations always increased between 4 and 5 a.m. and reached peaks at 7–8 a.m., then gradually decreased until night, particularly on 9 and 21 April. During this period, the wind direction was mainly concentrated in the southwest with a low wind speed, lower than 4 m/s. As acetylene is an important industrial gas, it is likely that there were regular emissions from industrial sources in the southwest direction of the sampling site. Therefore, the issue of acetylene emissions in the early morning requires high attention, and further investigation into its emission sources is needed. According to the Pearson correlation matrix results listed in Table S3, alkanes, aromatics, alkenes, and alkyne had a negative correlation with ozone (p < 0.05) and a positive correlation with NOx (p < 0.01). The ozone concentrations had strong positive correlations with temperature (r = 0.707) and BLH (r = 0.687), and strong negative correlations with NOx (r = −0.737) and relative humidity (r = −0.799), respectively, which were more obvious in three episodes.
After careful comparison and observation of air pollutants and meteorological parameters during the 30 days, we selected three representative diel variations to discuss the characteristics and correlation of ozone and its precursors. (1) The first significant episode was from 8 a.m. on 7 April to 8 a.m. on 8 April, shown in Figure 3. The alkanes (1096.46 µg/m3), aromatics (768.66 µg/m3), and alkenes (227.53 µg/m3) reached their peaks at 6–7 a.m., respectively. Then, all the VOC concentrations declined sharply to general levels in 4 h. The NOx concentration increased from 8 p.m. on 7 April to 1 a.m. on 8 April (194.43 µg/m3), and then gradually decreased until 2 p.m. (10.44 µg/m3). On the contrary, the ozone concentrations exhibited an opposite trend. They increased from 8 a.m. to 5 p.m. (93.12 µg/m3) and then decreased until 8 a.m. the next day, which had a strong positive correlation with temperature, BLH, and TSR (p < 0.01). It is apparent that both TVOC (avg = 1859.42 µg/m3) and NOx (avg = 150.90 µg/m3) concentrations remained at high levels, while the ozone concentration was at its lower values (avg = 3.73 µg/m3) during the 9-hour period from 10 p.m. on 7 April to 7 a.m. on 8 April. The high concentrations of VOC and NOx both occurred at night, resulting in low ozone concentrations with the lack of solar radiation. VOCs emitted at night and in the early morning, when photochemical reactions were not active, might lead to the accumulation of anthropogenic VOCs near the surface. As the sun rises and photochemical reaction resumes, the high level of VOCs in the morning will form HO2 and peroxide radicals, which increase the ozone concentration in the afternoon [8,41]. (2) The second episode was from 8 a.m. on 10 April to 8 a.m. on 11 April. Over the 24 h period, the hourly curve of ozone concentration exhibited a normal distribution parabola with a steep slope and presented a feature of rapid rise and fall. This is a typical diurnal trend of predominantly locally generated ozone concentrations [42]. The peak value appeared at 4–5 p.m. (3 h after the maximum of TSR), and the valley value appeared at 2 a.m. the next day. In the process of local ozone generation and dissipation, there are generally no secondary peaks, rebound peaks, or night peaks [2,43,44]. Therefore, the sliding mean concentrations of the maximum 8 h do not easily exceed the standard due to the limited peak area. However, in the case of poor diffusion conditions like low wind speeds and air pressure, the locally generated ozone concentrations will have consecutive flat-head peaks, such as the period from 8 p.m. on 11 April to 7 a.m. on 12 April, leading to the relatively high ozone levels. (3) There were consecutive high values of ozone concentrations from 23 to 27 April. Here we chose the 24 h period from 8 a.m. on 24 April to 8 a.m. on 25 April. Compared with the characteristics of the second episode, it had a slower peak rate and wider peaks during the day, and higher valley values at night. Although the solar radiation intensity was zero from 9 p.m. to 6 a.m., there was no significant decline in ozone concentrations. Meanwhile, the ozone concentrations had a positive correlation with wind speed (p < 0.05). The wind speed was consistently at a high level, even during the 10-hour valley period (avg = 5.90 m/s). These results indicate that the ozone concentrations were dominated by the external transport in this episode.

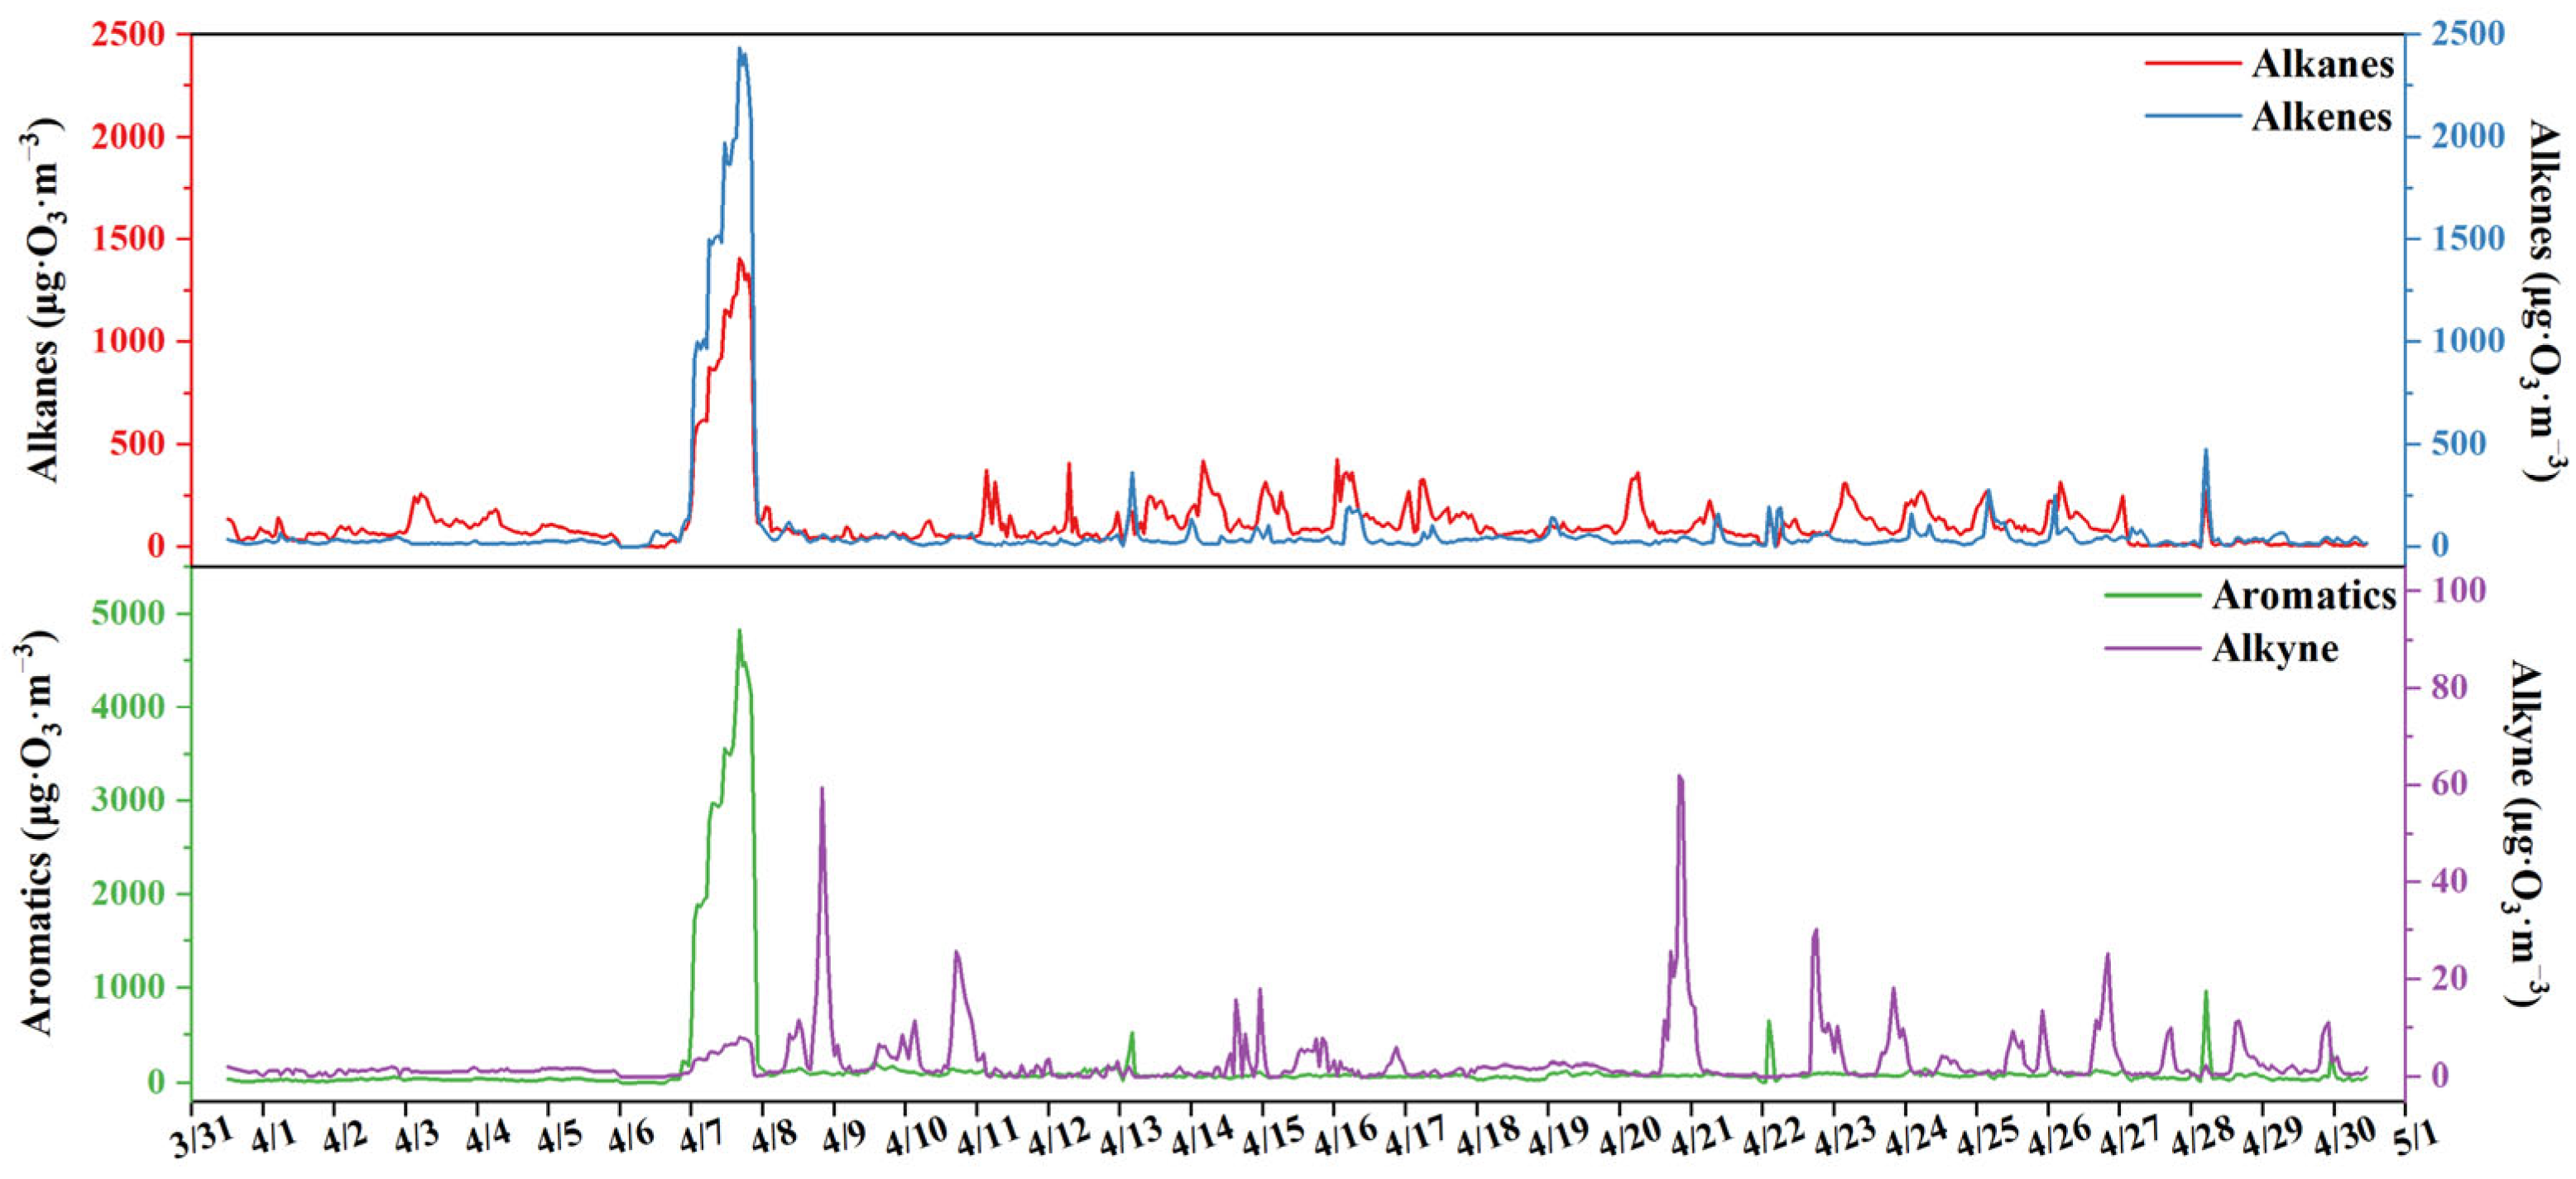
3.2. Ozone Formation Potential of VOCs

Based on the OFP analysis, aromatics, alkanes, and alkenes all significantly contributed to local ozone formation, accounting for 44.16%, 32.46%, and 22.56% of the total OFP, respectively. Among all 57 VOCs, isobutane, isopentane, and m/p-xylene were the three compounds with the highest contributions to OFP. Although their MIR values were lower than alkenes, most compounds of aromatics and alkanes have high concentrations, resulting in higher OFP contributions. Meanwhile, lower concentrations of alkenes like cis-2-butene, propylene, and isoprene limited their contributions to OFP. During the first pollution episode (7 April to 8 April), the OFP values began to increase markedly starting at 4 a.m. on 7 April, shown in Figure 4. The peak OFP values were observed at 4 a.m. on 8 April for alkanes (1407.95 µg/m3), alkenes (2436.51 µg/m3), aromatics (4837.63 µg/m3), and alkynes (8.08 µg/m3), followed by a sharp decline over the next 6 h. It showed that the accumulated reactive VOCs significantly contributed to the subsequent ozone formation. This occurred under favorable meteorological conditions, including strong solar radiation and elevated boundary layer height [5,45]. The results indicate that controlling aromatics and alkanes with high OFP could be an effective approach to reduce ozone levels during pollution episodes.

3.3. Ozone Sensitivity Analysis

The EKMA curve method is based on the chemical reaction mechanism of VOC–NOx–O3 in air quality simulation, and considers the effects of temperature, humidity, boundary layer conditions, and pollutant deposition to study the sensitivity to ozone precursors [46,47]. With different concentrations of VOC and NOx mixtures as the initial conditions, the maximum hourly concentration of ozone was simulated, and a series of isoconcentration curves for ozone generation were drawn, as shown in Figure 5. The line connecting the turning points of ozone concentration or generation rate in the EKMA curve is called the ridge line, which splits the plot into two parts, namely VOC limited area (upper) and NOx limited area (lower). The area close to the ridge line for ozone generation is the co-control area. In Figure 5, the KNOx/KVOCs is 0.25 (blue point), which indicates that Kunming is located in a VOC-limited area. Hence, ozone formation is more sensitive to changes in VOCs. Therefore, the ozone production rate in Kunming is mainly controlled by VOCs. This result is consistent with previous reports that VOC-limited regimes are concentrated in developed cities in China [4,35]. This result further demonstrates that rising ozone levels in urban areas stem from the Clean Air Action Plan’s focus on reducing NOx emissions while lacking sufficient VOC mitigation measures. Hence, reducing the emission of VOCs is crucial for controlling the local ozone pollution in Kunming.

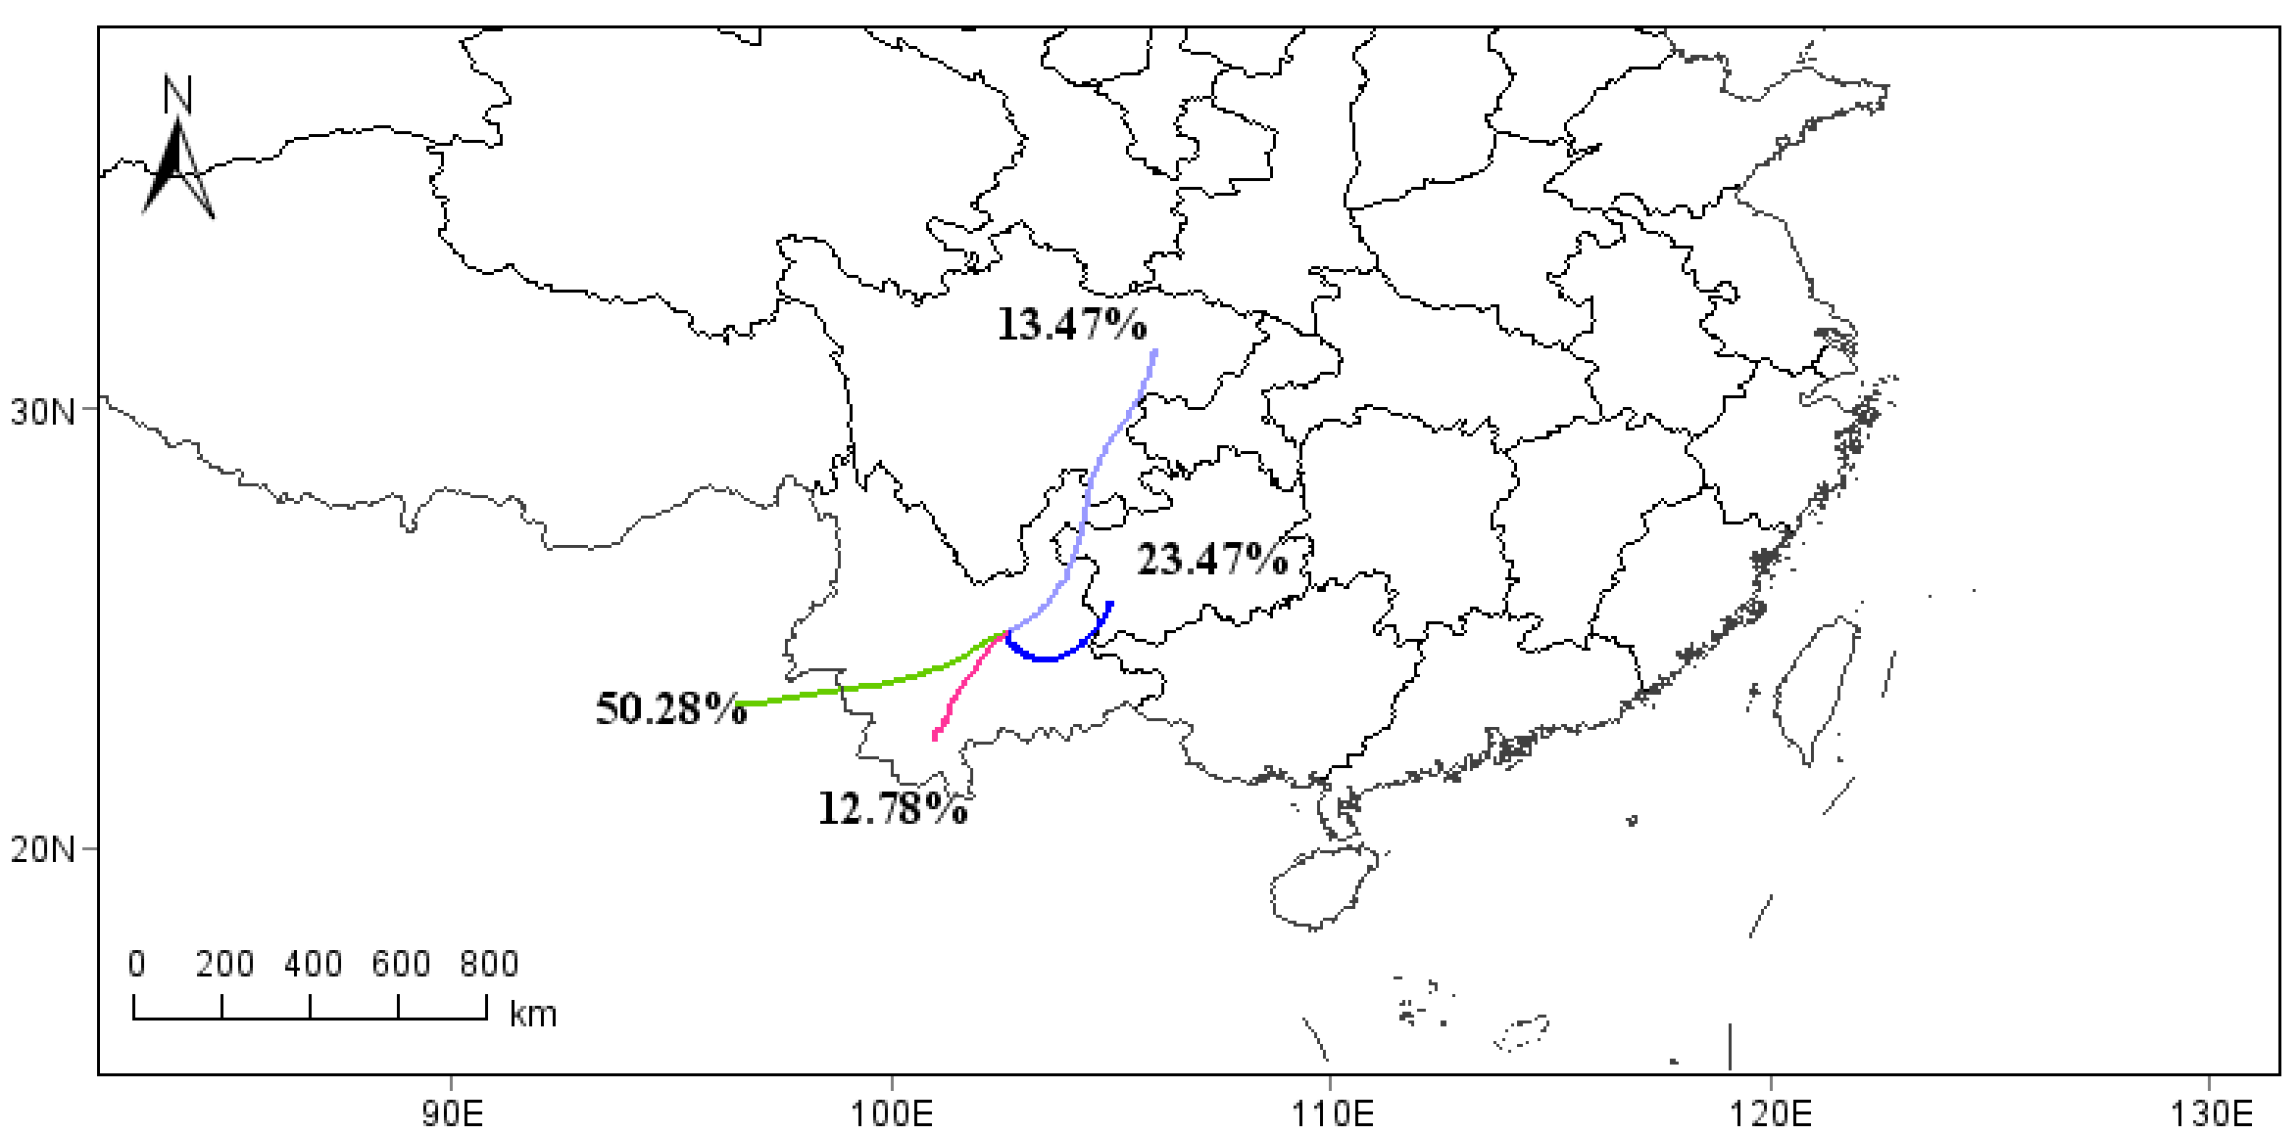
3.4. HYSPLIT Analysis

To evaluate the sources of VOCs at the sampling site, this study utilized the HYSPLIT model to analyze the backward trajectories of local air masses over 30 days in April 2022. Figure 6 shows the 24 h backward clustered trajectories of air masses at an altitude of 500 m: 50.28% of the air masses were transported westward over long distances outside the province; 12.78% of the air masses moved from the southwest within the local province, while 13.47% of the air masses were from just the opposite direction in Sichuan province in a long pathway; 23.47% of the air masses were transported from the border of Guizhou province over a short distance. In April, the subtropical high pressure was consistently between 15° N and 20° N. Under the influence of this atmospheric circulation pattern, Kunming was controlled by the southwest airflow at the edge of the subtropical high, with stable and strong southwest winds prevailing locally. This wind field characteristic allowed air masses from the Indian Ocean and the Indochina Peninsula to drive straight in along the southwest path, explaining why the vast majority of air masses originated from outside the country in the southwest direction. In general, long-distance transmissions of air masses had a greater impact on the sampling site, being particularly strong in the west outside the country. The local impacts were mainly concentrated in the southwest direction.
The polar coordinate wind rose diagram, drawn by combining wind speed, wind direction, and pollutant concentrations, is shown in Figure 7. The highest concentrations of TVOCs in April were observed in the low-wind-speed area in the south, indicating the local pollution source emissions. There were also high concentrations of TVOCs from the long-distance transmission of high wind speed in the southwest direction, with a very wide range. The concentrations of TVOCs transmitted over medium and long distances from the northeast were generally much lower. Meanwhile, the characteristics of ozone were highly similar to those of TVOCs. High NOx concentrations were mainly in the local areas.

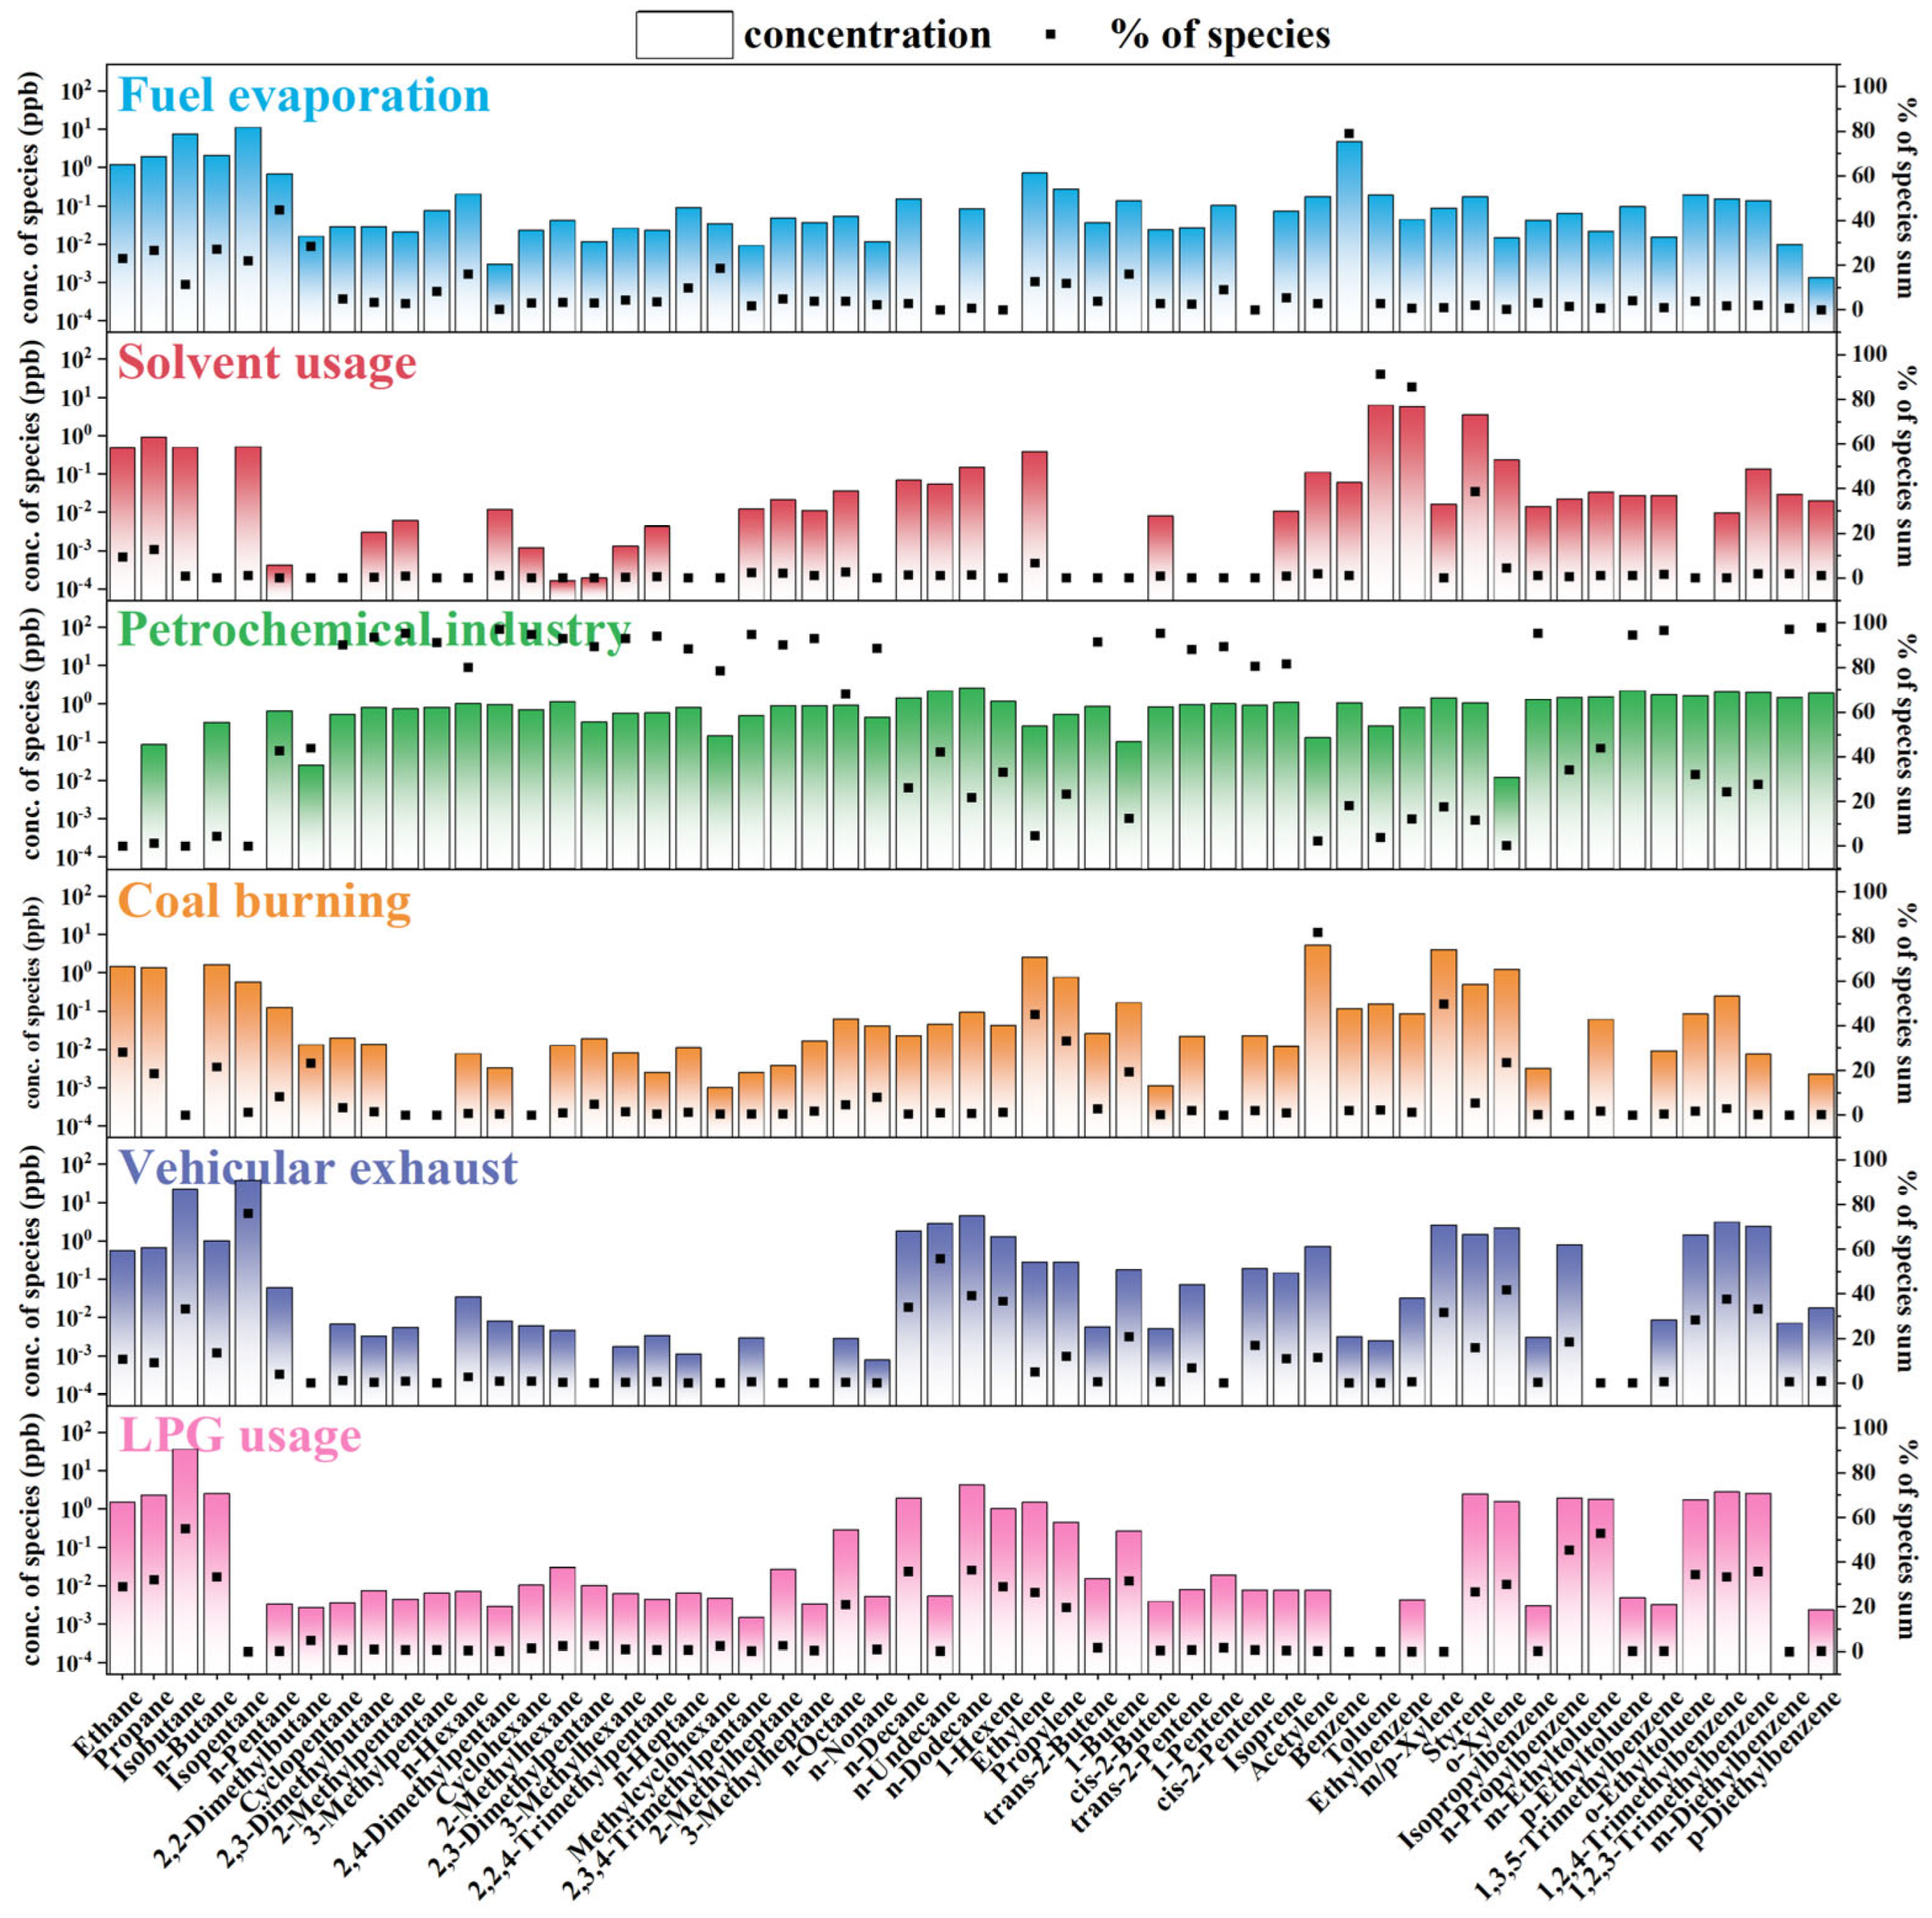
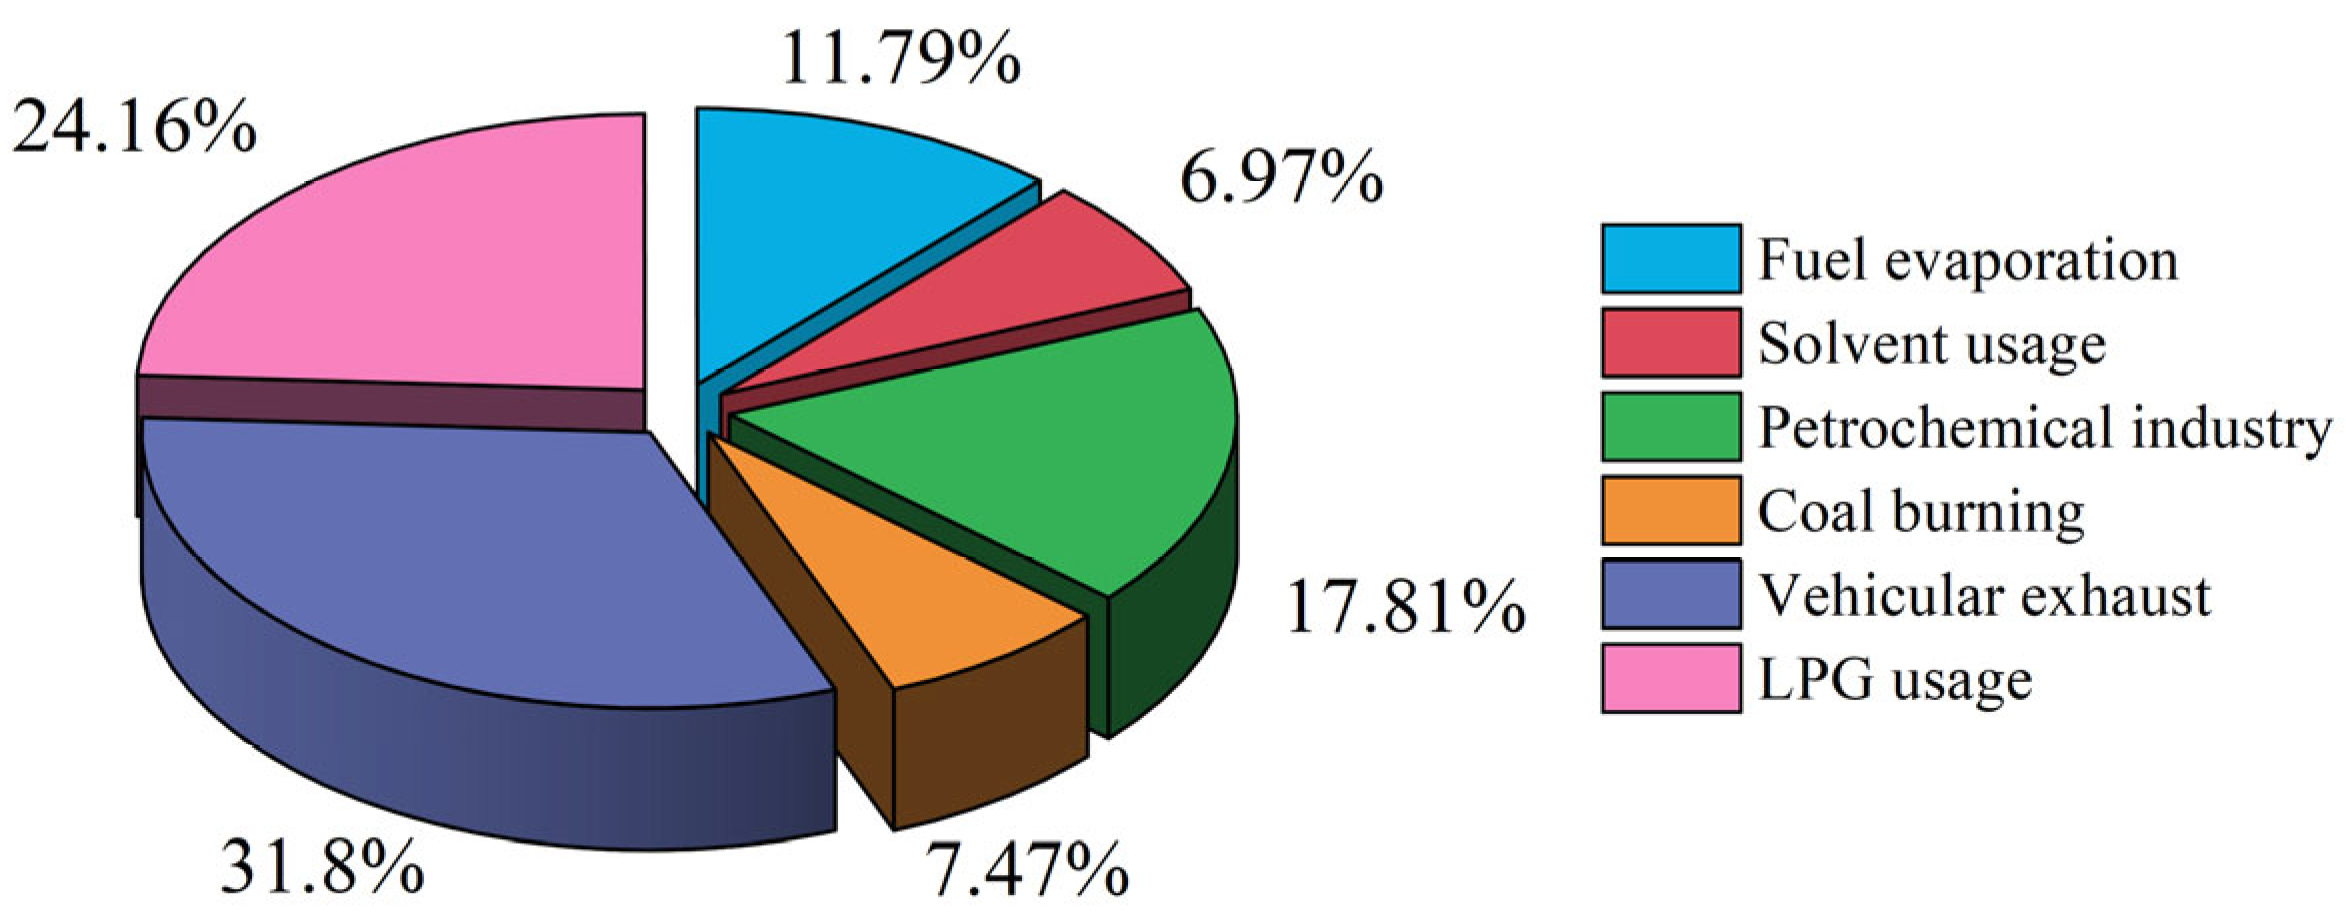
3.5. VOC Source Apportionment

This study utilized the VOC monitoring data (n = 57) from Kunming in April 2022 as the input for the PMF model. Based on the interpretability of the factors in the model output results (Table S4), we ultimately selected six factors. Figure 8 shows the source profiles of six factors of the ambient VOCs resolved by the PMF model.
In Factor 1, C2–C5 alkanes such as ethane, propane, n-butane, isopentane, n-pentane, and benzene made significant contributions. Isopentane and benzene are widely recognized as typical indicators of gasoline emissions [35,48,49]. The major compounds in this factor contained carbon atoms <10, which is consistent with the emission characteristics of motor vehicles, particularly gasoline-powered vehicles during operation [50]. Additionally, alkenes like ethylene and 1-butene were also present. Alkenes such as ethylene in gasoline vehicle exhaust are typical products of the combustion process. However, the benzene to toluene ratio (B/T) of Factor 1 is 24.65, which does not match the relevant ratio from roadside sampling in China within the range of 0.14–1.92 [51]. Based on the pollutant composition and indicators, Factor 1 was identified as originating from fuel evaporation, which contributed 11.79% to the total VOC sources.
Factor 2 was dominated by aromatics such as toluene, ethylbenzene, m/p-xylene, and styrene. Toluene (91.10%) and ethylbenzene (85.44%) made particularly high contributions. The chemical profile of this factor corresponded to solvent usage processes, which are commonly found in emissions from the volatilization of organic solvents in paint, coatings, and printing [52,53]. Solvent usage accounted for 6.97% of the total VOC sources.
Factor 3 was dominated by C6–C7 alkanes such as n-hexane, cyclohexane, and n-heptane; alkenes exemplified by cis-2-butene (95.28%); and alkylbenzenes including p-diethylbenzene (97.73%) and 1,3,5-trimethylbenzene (96.48%). The C6–C7 alkanes are primarily associated with diesel production and usage, while lighter alkanes (C4–C5) and alkenes originate from gasoline refining processes [50]. Based on its chemical composition and emission profile, Factor 3 was identified as being related to petrochemical industry emissions. This source contributed 17.81% of the total VOC sources.
Factor 4 was characterized by unsaturated hydrocarbons such as acetylene (81.70%), ethylene (45.05%), and propylene (33.12%). The low levels of isopentane and benzene indicate that this source is not vehicular exhaust but rather a stationary combustion source. Previous studies found that acetylene and ethylene are typical emissions from coal combustion [35,36,50,53]. Therefore, Factor 4 was identified as coal burning, contributing 7.47% of the total VOC sources.
Factor 5 exhibited high concentrations of isobutane (33.22%) and isopentane (75.81%), indicating a strong association with gasoline [52]. Factor 5 is relatively similar in composition to Factor 1, while its B/T ratio is 0.75, which is close to that from roadside sampling. Combined with the pollutant composition and tracers, Factor 5 can be identified as vehicular emissions. Vehicle exhaust contributed 31.8% to the total VOC sources.
Factor 6 showed high levels of isobutane (54.66%) and n-butane (33.37%), as well as certain alkenes (e.g., ethylene and propylene) and aromatics (e.g., 1,2,4-trimethylbenzene and 1,2,3-trimethylbenzene). Isobutane and n-butane are major components of liquefied petroleum gas (LPG) [35,54]. Although the chemical composition of Factor 6 was similar to that of Factor 1, the former showed a higher concentration of aromatics, which are among the main components of fuel evaporation. The proportion of canned liquefied petroleum gas used in daily life by residents is 10.23% in urban areas and 6.11% in rural areas, only slightly less than electricity and pipeline natural gas in Kunming. Thus, Factor 6 was identified as LPG usage, contributing 24.16% to the total VOC sources.
To further investigate the contribution levels of different sources to air pollution in the Kunming area, we calculated the VOC proportions by the six identified factors. As shown in Figure 9, vehicular exhaust was the dominant source of VOCs during the sampling period, contributing 31.80%, followed by LPG usage (24.16%), petrochemical industry (17.81%), fuel evaporation (11.79%), coal burning (7.47%), and solvent usage (6.97%).

4. Conclusions

This study characterized VOC sources and their mechanistic links to ozone formation during peak ozone episodes in Kunming using online monitoring of atmospheric VOCs. A total of 57 VOCs were observed, categorized into four groups: alkanes (70.38%), aromatics (21.60%), alkenes (5.65%), and alkyne (2.37%). Isobutane, m/p-xylene, ethylene, and acetylene were the dominant species in their respective groups. Diurnal variations in VOCs and ozone revealed that nighttime and early-morning VOC emissions could lead to the accumulation of anthropogenic VOCs near the surface, contributing to higher ozone concentrations in the afternoon. Notably, acetylene emissions in the early morning require urgent attention, and further investigation into their sources is warranted. The EKMA results indicated that ozone formation in the study region was VOC-limited, suggesting that stringent VOC controls would be effective in reducing ozone levels. OFP analysis further confirmed that aromatics, alkanes, and alkenes were the primary contributors to ozone production. Isobutane, isopentane, and m/p-xylene ranked as the top three compounds in OFP contribution due to their high concentrations. The HYSPLIT model identified southwestern Kunming as the major source region for ambient VOCs. The PMF model resolved six VOC sources: vehicle exhaust, solvent usage, petrochemical industry, coal burning, fuel evaporation, and LPG usage. Vehicle exhaust was the dominant source of VOCs, contributing 31.80%, which was greatly influenced by the sampling location. These findings underscore that reducing anthropogenic VOC emissions and strengthening source controls could offer a scientifically robust strategy for mitigating ozone pollution in Kunming. Additionally, we recommend establishing a long-term VOC monitoring network in high-ozone areas and urging the government to promptly implement ambient air quality standards for VOCs to enhance regulatory oversight.

Supplementary Materials

The following supporting information can be downloaded at: https://www.mdpi.com/article/10.3390/atmos16070874/s1, Table S1: The 57 VOCs of the Photochemical Assessment Monitoring Station (PAMS); Table S2: The MIR values of VOCs in this study; Table S3: Pearson correlation matrix results between gaseous pollutants and meteorological parameters in 30 days (n = 8640) and three episodes (n = 288), respectively; Table S4: The output results of VOC concentrations by the PMF model.

Author Contributions

Conceptualization, Y.C. and C.H. (Cenyan Huang); software, Y.L. and L.T.; investigation, data curation, Y.C. and C.L.; resources, funding acquisition, C.H. (Cenyan Huang); methodology, writing—original draft preparation, C.H. (Chuantao Huang), Y.L., and Y.X.; writing—review and editing, C.H. (Cenyan Huang) and H.X. All authors have read and agreed to the published version of the manuscript.

Funding

This research was funded by the Open Project of Zhejiang Provincial Top Discipline of Biological Engineering (Level A), Zhejiang Wanli University (No. ZS2023005); the National Natural Science Foundation of China (No. 41905115); Zhejiang Natural Science Foundation (ZCLMS25B0702); and Ningbo Natural Science Foundation (No. 2023J059, No. 2023J303).

Institutional Review Board Statement

Not applicable.

Informed Consent Statement

Not applicable.

Data Availability Statement

The original contributions presented in this study are included in the article and the Supplementary Materials. Further inquiries can be directed to the corresponding authors.

Acknowledgments

We would like to thank the editor and reviewers for their advice on this work.

Conflicts of Interest

Author Chunli Liu was employed by the company Yunnan Guoke Environmental Protection Co., Ltd. The remaining authors declare that the research was conducted in the absence of any commercial or financial relationships that could be construed as a potential conflict of interest.

References

  1. Cui, M.; An, X.; Xing, L.; Li, G.; Tang, G.; He, J.; Long, X.; Zhao, S. Simulated Sensitivity of Ozone Generation to Precursors in Beijing during a High O3 Episode. Adv. Atmos. Sci. 2021, 38, 1223–1237. [Google Scholar] [CrossRef]
  2. Sellami, F.; Azri, C. Surface O3 temporal variation, photolysis and accumulation in urban Tunis (North Africa) during January to December, 2016: Influence of meteorology and chemical precursors. Air Qual. Atmos. Health 2023, 16, 2401–2420. [Google Scholar] [CrossRef]
  3. Tong, L.; Xiao, H.; Yi, H.; Liu, Y.; Zheng, J.; Huang, C.; He, M. Spatial Regionalization on Surface Ozone in the Yangtze River Delta of China. Asia-Pac. J. Atmos. Sci. 2021, 58, 207–218. [Google Scholar] [CrossRef]
  4. Ren, J.; Guo, F.; Xie, S. Diagnosing ozone–NOx–VOC sensitivity and revealing causes of ozone increases in China based on 2013–2021 satellite retrievals. Atmos. Chem. Phys. 2022, 22, 15035–15047. [Google Scholar] [CrossRef]
  5. Wang, R.; Duan, W.; Cheng, S.; Wang, X. Nonlinear and lagged effects of VOCs on SOA and O3 and multi-model validated control strategy for VOC sources. Sci. Total Environ. 2023, 887, 164113. [Google Scholar] [CrossRef]
  6. Huang, C.; Shan, W.; Xiao, H. Recent Advances in Passive Air Sampling of Volatile Organic Compounds. Aerosol Air Qual. Res. 2018, 18, 602–622. [Google Scholar] [CrossRef]
  7. Huang, C.; Tong, L.; Dai, X.; Xiao, H. Evaluation and Application of a Passive Air Sampler for Atmospheric Volatile Organic Compounds. Aerosol Air Qual. Res. 2018, 18, 3047–3055. [Google Scholar] [CrossRef]
  8. Ring, A.M.; Dickerson, R.R.; Sebol, A.E.; Ren, X.; Benish, S.E.; Salawitch, R.J.; Galasyn, A.; Miller, P.J.; Canty, T.P. Anthropogenic VOCs in the Long Island Sound, NY Airshed and their role in ozone production. Atmos. Environ. 2023, 296, 119583. [Google Scholar] [CrossRef]
  9. Sadeghi, B.; Pouyaei, A.; Choi, Y.; Rappenglueck, B. Influence of seasonal variability on source characteristics of VOCs at Houston industrial area. Atmos. Environ. 2022, 277, 119077. [Google Scholar] [CrossRef]
  10. Holland, R.; Khan, A.H.; Derwent, R.G.; Lynch, J.; Ahmed, F.; Grace, S.; Bacak, A.; Shallcross, D.E. Gas-phase kinetics, POCPs, and an investigation of the contributions of VOCs to urban ozone production in the UK. Int. J. Chem. Kinet. 2023, 55, 350–364. [Google Scholar] [CrossRef]
  11. Berezina, E.; Moiseenko, K.; Skorokhod, A.; Pankratova, N.V.; Belikov, I.; Belousov, V.; Elansky, N.F. Impact of VOCs and NOx on Ozone Formation in Moscow. Atmosphere 2020, 11, 1262. [Google Scholar] [CrossRef]
  12. Alvim, D.S.; Gatti, L.V.; Corrêa, S.M.; Chiquetto, J.B.; Santos, G.M.; de Souza Rossatti, C.; Pretto, A.; Rozante, J.R.; Figueroa, S.N.; Pendharkar, J.; et al. Determining VOCs Reactivity for Ozone Forming Potential in the Megacity of São Paulo. Aerosol Air Qual. Res. 2018, 18, 2460–2474. [Google Scholar] [CrossRef]
  13. Notario, A.; Bravo, I.; Adame, J.A.; Díaz-de-Mera, Y.; Aranda, A.; Rodríguez, A.; Rodríguez, D. Variability of oxidants (OX=O3+NO2), and preliminary study on ambient levels of ultrafine particles and VOCs, in an important ecological area in Spain. Atmos. Res. 2013, 128, 35–45. [Google Scholar] [CrossRef]
  14. Xiong, Y.; Bari, M.A.; Xing, Z.; Du, K. Ambient volatile organic compounds (VOCs) in two coastal cities in western Canada: Spatiotemporal variation, source apportionment, and health risk assessment. Sci. Total Environ. 2020, 706, 135970. [Google Scholar] [CrossRef] [PubMed]
  15. Bari, M.A.; Kindzierski, W.B. Ambient volatile organic compounds (VOCs) in Calgary, Alberta: Sources and screening health risk assessment. Sci. Total Environ. 2018, 631–632, 627–640. [Google Scholar] [CrossRef]
  16. Farhat, M.; Afif, C.; Zhang, S.; Dusanter, S.; Delbarre, H.; Riffault, V.; Sauvage, S.; Borbon, A. Investigating the industrial origin of terpenoids in a coastal city in northern France: A source apportionment combining anthropogenic, biogenic, and oxygenated VOC. Sci. Total Environ. 2024, 928, 172098. [Google Scholar] [CrossRef]
  17. Brown, S.G.; Frankel, A.; Hafner, H.R. Source apportionment of VOCs in the Los Angeles area using positive matrix factorization. Atmos. Environ. 2007, 41, 227–237. [Google Scholar] [CrossRef]
  18. Mandal, T.K.; Yadav, P.; Kumar, M.; Lal, S.; Soni, K.; Yadav, L.; Saharan, U.S.; Sharma, S.K. Characteristics of volatile organic compounds (VOCs) at an urban site of Delhi, India: Diurnal and seasonal variation, sources apportionment. Urban Clim. 2023, 49, 101545. [Google Scholar] [CrossRef]
  19. Liu, T.; Marlier, M.E.; DeFries, R.S.; Westervelt, D.M.; Xia, K.R.; Fiore, A.M.; Mickley, L.J.; Cusworth, D.H.; Milly, G. Seasonal impact of regional outdoor biomass burning on air pollution in three Indian cities: Delhi, Bengaluru, and Pune. Atmos. Environ. 2018, 172, 83–92. [Google Scholar] [CrossRef]
  20. Prapatigul, P.; Sreshthaputra, S. Causes and solution of forest and agricultural burning in Northern, Thailand. Int. J. Agric. Technol. 2022, 18, 1715–1726. [Google Scholar]
  21. Tala, W.; Janta, R.; Kraisitnitikul, P.; Chantara, S. Patterns and impact of volatile organic compounds on ozone and secondary organic aerosol formation: Implications for air pollution in Upper Southeast Asia. J. Hazard. Mater. Adv. 2025, 18, 100762. [Google Scholar] [CrossRef]
  22. Chen, Y.; Ling, Y.; Liu, F.; Tong, L.; Yang, M.; Shi, Y.; Xue, Y.; Ye, H.; Xu, Y.; Huang, C.; et al. Characteristics and Source Apportionment of Volatile Organic Compounds in a Coastal Industrial Area: A Case Study in the Yangtze River Delta of China. Bull. Environ. Contam. Toxicol. 2024, 113, 1–8. [Google Scholar] [CrossRef]
  23. Huang, C.; Shi, Y.; Yang, M.; Tong, L.; Dai, X.; Liu, F.; Huang, C.; Zheng, J.; Li, J.; Xiao, H. Spatiotemporal distribution, source apportionment and health risk assessment of atmospheric volatile organic compounds using passive air samplers in a typical coastal area, China. J. Clean. Prod. 2023, 423, 138741. [Google Scholar] [CrossRef]
  24. Liu, F.; Tong, L.; Luo, Q.; Ling, Y.; Gu, H.; Lv, Y.; Shi, A.; Liu, H.; Xiao, H.; Huang, C. Emission Characteristics and Health Risk Assessment of Volatile Organic Compounds in Key Industries: A Case Study in the Central Plains of China. Atmosphere 2025, 16, 74. [Google Scholar] [CrossRef]
  25. GB 3095-2012; Ambient Air Quality Standards. Ministry of Environmental Protection of the People’s Republic of China; General Administration of Quality Supervision, Inspection and Quarantine of the People’s Republic of China: Beijing, China, 2012.
  26. Xie, S.; Gong, Y.; Chen, Y.; Li, K.; Liu, J. Characterization and Source Analysis of Pollution Caused by Atmospheric Volatile Organic Compounds in the Spring, Kunming, China. Atmosphere 2023, 14, 1767. [Google Scholar] [CrossRef]
  27. Barbieri, M.V.; Peris, A.; Postigo, C.; Moya-Garces, A.; Monllor-Alcaraz, L.S.; Rambla-Alegre, M.; Eljarrat, E.; Lopez de Alda, M. Evaluation of the occurrence and fate of pesticides in a typical Mediterranean delta ecosystem (Ebro River Delta) and risk assessment for aquatic organisms. Environ. Pollut. 2021, 274, 115813. [Google Scholar] [CrossRef]
  28. Eun, D.-M.; Han, Y.-S.; Nam, I.; Chang, Y.; Lee, S.; Park, J.-H.; Gong, S.Y.; Youn, J.-S. Ambient volatile organic compounds in the Seoul metropolitan area of South Korea: Chemical reactivity, risks and source apportionment. Environ. Res. 2024, 251, 118749. [Google Scholar] [CrossRef]
  29. Kong, L.; Zhou, L.; Chen, D.; Luo, L.; Xiao, K.; Chen, Y.; Liu, H.; Tan, Q.; Yang, F. Atmospheric oxidation capacity and secondary pollutant formation potentials based on photochemical loss of VOCs in a megacity of the Sichuan Basin, China. Sci. Total Environ. 2023, 901, 166259. [Google Scholar] [CrossRef]
  30. Lee, J.; Lee, M.; Chang, L.; Shin, S.-A.; Kim, K.; Choi, Y.; Lim, H.; Choi, S.-D.; Lee, G. Assessment of VOCs emission inventory in Seoul through spatiotemporal observations using passive and online PAMS measurements. Atmos. Environ. 2024, 338, 120857. [Google Scholar] [CrossRef]
  31. Zhang, Y.; Li, C.; Yan, Q.; Han, S.; Zhao, Q.; Yang, L.; Liu, Y.; Zhang, R. Typical industrial sector-based volatile organic compounds source profiles and ozone formation potentials in Zhengzhou, China. Atmos. Pollut. Res. 2020, 11, 841–850. [Google Scholar] [CrossRef]
  32. Guan, Y.; Liu, X.; Zheng, Z.; Dai, Y.; Du, G.; Han, J.; Hou, L.; Duan, E. Summer O3 pollution cycle characteristics and VOCs sources in a central city of Beijing-Tianjin-Hebei area, China. Environ. Pollut. 2023, 323, 121293. [Google Scholar] [CrossRef]
  33. Carter, W.P.L. Development of an Improved Chemical Speciation Database for Processing Emissions of Volatile Organic Compounds for Air Quality Models. 2023. Available online: https://intra.engr.ucr.edu/~carter/emitdb/ (accessed on 9 March 2023).
  34. Shiu, C.-J.; Liu, S.C.; Chang, C.-C.; Chen, J.-P.; Chou, C.C.K.; Lin, C.-Y.; Young, C.-Y. Photochemical production of ozone and control strategy for Southern Taiwan. Atmos. Environ. 2007, 41, 9324–9340. [Google Scholar] [CrossRef]
  35. Hui, L.; Liu, X.; Tan, Q.; Feng, M.; An, J.; Qu, Y.; Zhang, Y.; Jiang, M. Characteristics, source apportionment and contribution of VOCs to ozone formation in Wuhan, Central China. Atmos. Environ. 2018, 192, 55–71. [Google Scholar] [CrossRef]
  36. Qu, H.; Wang, Y.; Zhang, R.; Li, J. Extending Ozone-Precursor Relationships in China From Peak Concentration to Peak Time. J. Geophys. Res. Atmos. 2020, 125, e2020JD033670. [Google Scholar] [CrossRef]
  37. Han, X.; Lang, Y.; Wang, T.; Liu, C.Q.; Li, F.; Wang, F.; Guo, Q.; Li, S.; Liu, M.; Wang, Y.; et al. Temporal and spatial variations in stable isotopic compositions of precipitation during the typhoon Lekima (2019), China. Sci. Total Environ. 2021, 762, 143143. [Google Scholar] [CrossRef]
  38. Zong, Z.; Tian, C.; Li, J.; Syed, J.H.; Zhang, W.; Fang, Y.; Jiang, Y.; Nasir, J.; Mansha, M.; Rizvi, S.H.H.; et al. Isotopic Interpretation of Particulate Nitrate in the Metropolitan City of Karachi, Pakistan: Insight into the Oceanic Contribution to NO(x). Environ. Sci. Technol. 2020, 54, 7787–7797. [Google Scholar] [CrossRef]
  39. Shi, Y.; Hu, Y.; Jin, Z.; Li, J.; Zhang, J.; Li, F. Nitrate sources and its formation in precipitation during typhoons (In-fa and Chanthu) in multiple cities, East China. Sci. Total Environ. 2022, 838, 155949. [Google Scholar] [CrossRef]
  40. Dai, Q.; Liu, B.; Bi, X.; Wu, J.; Liang, D.; Zhang, Y.; Feng, Y.; Hopke, P.K. Dispersion Normalized PMF Provides Insights into the Significant Changes in Source Contributions to PM(2.5) after the COVID-19 Outbreak. Environ. Sci. Technol. 2020, 54, 9917–9927. [Google Scholar] [CrossRef]
  41. Warneke, C.; de Gouw, J.A.; Goldan, P.D.; Kuster, W.C.; Williams, E.J.; Lerner, B.M.; Jakoubek, R.; Brown, S.S.; Stark, H.; Aldener, M.; et al. Comparison of daytime and nighttime oxidation of biogenic and anthropogenic VOCs along the New England coast in summer during New England Air Quality Study 2002. J. Geophys. Res. Atmos. 2004, 109, D10309. [Google Scholar] [CrossRef]
  42. Tan, Z.; Lu, K.; Jiang, M.; Su, R.; Dong, H.; Zeng, L.; Xie, S.; Tan, Q.; Zhang, Y. Exploring ozone pollution in Chengdu, southwestern China: A case study from radical chemistry to O3-VOC-NOx sensitivity. Sci. Total Environ. 2018, 636, 775–786. [Google Scholar] [CrossRef]
  43. Lyu, X.P.; Chen, N.; Guo, H.; Zhang, W.H.; Wang, N.; Wang, Y.; Liu, M. Ambient volatile organic compounds and their effect on ozone production in Wuhan, central China. Sci. Total Environ. 2016, 541, 200–209. [Google Scholar] [CrossRef] [PubMed]
  44. Lyu, X.; Guo, H.; Zou, Q.; Li, K.; Xiong, E.; Zhou, B.; Guo, P.; Jiang, F.; Tian, X. Evidence for Reducing Volatile Organic Compounds to Improve Air Quality from Concurrent Observations and In Situ Simulations at 10 Stations in Eastern China. Environ. Sci. Technol. 2022, 56, 15356–15364. [Google Scholar] [CrossRef] [PubMed]
  45. Liu, Y.; Qiu, P.; Li, C.; Li, X.; Ma, W.; Yin, S.; Yu, Q.; Li, J.; Liu, X. Evolution and variations of atmospheric VOCs and O3 photochemistry during a summer O3 event in a county-level city, Southern China. Atmos. Environ. 2022, 272, 118942. [Google Scholar] [CrossRef]
  46. Milford, J.B.; Russell, A.G.; McRae, G.J. A new approach to photochemical pollution control: Implications of spatial patterns in pollutant responses to reductions in nitrogen oxides and reactive organic gas emissions. Environ. Sci. Technol. 1989, 23, 1290–1301. [Google Scholar] [CrossRef]
  47. Liu, C.; Zhang, L.; Wen, Y.; Shi, K. Sensitivity analysis of O3 formation to its precursors-Multifractal approach. Atmos. Environ. 2021, 251, 118275. [Google Scholar] [CrossRef]
  48. Liao, D.; Wang, L.; Wang, Y.; Lin, C.; Chen, J.; Huang, H.; Zhuang, Z.; Choi, S.-D.; Hong, Y. Health risks and environmental influence of volatile organic compounds (VOCs) in a residential area near an industrial park in Southeast China. Atmos. Pollut. Res. 2024, 15, 101966. [Google Scholar] [CrossRef]
  49. Huang, H.; Yang, C.; Wang, Z.; Lian, S.; Li, X.; Liu, Y.; Cheng, H. The chemical characteristics and sources of formaldehyde on O3 and non-O3 polluted days in Wuhan, central China. Atmos. Environ. 2024, 338, 120809. [Google Scholar] [CrossRef]
  50. Liu, Y.; Shao, M.; Fu, L.; Lu, S.; Zeng, L.; Tang, D. Source profiles of volatile organic compounds (VOCs) measured in China: Part I. Atmos. Environ. 2008, 42, 6247–6260. [Google Scholar] [CrossRef]
  51. Ma, Z.; Liu, C.; Zhang, C.; Liu, P.; Ye, C.; Xue, C.; Zhao, D.; Sun, J.; Du, Y.; Chai, F.; et al. The levels, sources and reactivity of volatile organic compounds in a typical urban area of Northeast China. J. Environ. Sci. 2019, 79, 121–134. [Google Scholar] [CrossRef]
  52. Xu, Z.; Zou, Q.; Jin, L.; Shen, Y.; Shen, J.; Xu, B.; Qu, F.; Zhang, F.; Xu, J.; Pei, X.; et al. Characteristics and sources of ambient Volatile Organic Compounds (VOCs) at a regional background site, YRD region, China: Significant influence of solvent evaporation during hot months. Sci. Total Environ. 2023, 857, 159674. [Google Scholar] [CrossRef]
  53. Huang, A.; Yin, S.; Yuan, M.; Xu, Y.; Yu, S.; Zhang, D.; Lu, X.; Zhang, R. Characteristics, source analysis and chemical reactivity of ambient VOCs in a heavily polluted city of central China. Atmos. Pollut. Res. 2022, 13, 101390. [Google Scholar] [CrossRef]
  54. Zhou, J.; Gao, M.; Xu, H.; Cai, R.; Feng, R.; He, K.; Sun, J.; Ho, S.S.H.; Shen, Z. Volatile organic compounds in typical coal chemical industrial park in China and their environmental and health impacts. Atmos. Environ. 2024, 338, 120825. [Google Scholar] [CrossRef]
Figure 1. The sampling site in this study in Kunming, China.
Atmosphere 16 00874 g001
Figure 2. The hourly concentrations of air pollutants and meteorological parameters at the sampling site in April 2022 in Kunming (The three episodes were marked in the figure by dashed lines).
Atmosphere 16 00874 g002
Figure 3. The three episodes of high ozone levels in April 2022 in Kunming.
Atmosphere 16 00874 g003
Figure 4. OFP of four categories of VOCs in April 2022 in Kunming.
Atmosphere 16 00874 g004
Figure 5. Isopleth diagram of ozone production rate for averaged conditions in this study.
Atmosphere 16 00874 g005
Figure 6. The 24 h clusters of air mass backward trajectories in this study.
Atmosphere 16 00874 g006
Figure 7. The polar coordinate wind rose diagram in this study.
Atmosphere 16 00874 g007
Figure 8. Source profiles of the six factors of VOCs in this study.
Atmosphere 16 00874 g008
Figure 9. The proportion of six sources based on the PMF model result.
Atmosphere 16 00874 g009
Disclaimer/Publisher’s Note: The statements, opinions and data contained in all publications are solely those of the individual author(s) and contributor(s) and not of MDPI and/or the editor(s). MDPI and/or the editor(s) disclaim responsibility for any injury to people or property resulting from any ideas, methods, instructions or products referred to in the content.

