Article

An Evaluation of a Novel Air Pollution Abatement System for Ammonia Emissions Reduction in a UK Livestock Building

1
Department of Mechanical Materials and Manufacturing Engineering, University of Nottingham, Nottingham NG7 2RD, UK
2
Iscleanair Global Solutions-IGS Ltd., 32 Greenacres Hendon Lane, Finchley, London N3 3SF, UK
*
Author to whom correspondence should be addressed.
Atmosphere 2025, 16(7), 869; https://doi.org/10.3390/atmos16070869 (registering DOI)
Submission received: 4 June 2025 / Revised: 7 July 2025 / Accepted: 12 July 2025 / Published: 17 July 2025
(This article belongs to the Special Issue Impacts of Anthropogenic Emissions on Air Quality)

Abstract

Agriculture and animal feeding operations are responsible for 87% of ammonia emissions in the UK. Controlling NH3 concentrations below 20 ppm is crucial to preserve workers’ and livestock’s well-being. Therefore, ammonia control systems are required for maintaining adequate air quality in livestock facilities. This study assessed the ammonia reduction efficiency of a novel air pollution abatement (APA) system used in a pig farm building. The monitoring duration was 11 weeks. The results were compared with the baseline from a previous pig cycle during the same time of year in 2023. A ventilation-controlled room was monitored during a two-phase campaign, and the actual ammonia concentrations were measured at different locations within the site and at the inlet/outlet of the APA system. A 98% ammonia reduction was achieved at the APA outlet through NH3 absorption in tap water. Ion chromatography analyses of farm water samples revealed NH3 concentrations of up to 530 ppm within 83 days of APA operation. Further scanning electron microscopy and energy-dispersive X-ray inspections revealed the presence of salts and organic/inorganic matter in the solid residues. This research can contribute to meeting current ammonia regulations (NECRs), also by reusing the process water as a potential nitrogen fertiliser in agriculture.

1. Introduction

Agriculture is a major source of ammonia (NH3) emissions to the atmosphere, contributing to over 81% of global NH3 emissions [1]. In 2022, agriculture accounted for ~227 kt of NH3 emissions, corresponding to 87% of the UK total, with the vast majority coming from fertilisers and animal waste [2]. Pig production accounts for 15% of all livestock-related NH3 emissions worldwide and 25% in Europe [3]. The 2018 estimate of the total costs from both the health and biodiversity impacts of ammonia in the UK ranged between GBP 2000/t and GBP 56,000/t, with an average value of GBP 2500/t [4]. Solutions to reduce NH3 emissions from livestock buildings are required to achieve national and international targets and lower their harmful effects. Indeed, ammonia contents in the air greater than 10–20 ppm may result in respiratory diseases and health issues in farm workers and livestock [5]. The ammonia limit recommended at European and UK levels is 35 ppm over 15 min and a maximum exposure of 25 ppm over 8 h [6]. However, in livestock facilities, ammonia concentrations frequently exceed this threshold [7,8]. Moreover, once deposited on the land, ammonia contributes to the acidification and eutrophication of natural ecosystems and to the loss of terrestrial biodiversity [9].
Ammonia is also a precursor of particulate matter (PM) formation [10], contributing to 50% of PM2.5 in Europe [5], which has raised further concerns about its impact on humans [11] and the environment [12]. Thus, given the increase in pig production expected in the next decades [13], this paper aimed to explore whether further measures can be adopted to comply with the threshold limits.
The UK has international obligations to meet targets for limiting ammonia emissions to protect human health and the environment under the revised Convention on Long Range Transboundary Air Pollution’s amended Gothenburg Protocol (CLRTAP). Also, the National Emission Ceilings Regulations (https://www.legislation.gov.uk/uksi/2018/129/contents, accessed on 11 July 2025) require the UK to reduce ammonia emissions by 16% compared with the 2005 baseline by 2030. The government has implemented regulations and initiatives aimed at reducing ammonia emissions from agriculture, including practice guidelines and economic incentives of GBP 3 million to support farmers [14]. Measures for ammonia reductions in livestock facilities typically include slurry pit design [3], feed/manure management [15], and exhaust air treatment [16]. The wet scrubber is the most popular air treatment technique used for pig farms in Northern Europe [17]. In this method, polluted air from animal housing is forced into contact with the liquid phase (either water or an acid medium), resulting in a highly efficient mass transfer process (>90%) [17]. Moore et al. [18] investigated the impact of different acid media and air flow rates on the performance of an air scrubber used in a livestock facility. They found that the NH3 removal efficiencies ranged from 55% to 90%, with the efficiency decreasing at higher ventilation rates. Similarly, Conti et al. observed a 70% reduction in ammonia emissions when using a citric acid wet scrubber on a pig farm [19].
Besides NH3, it is well documented that particulate matter can also be removed by air scrubber systems. PM is, indeed, one of the most abundant pollutants emitted by pig farms [20]. PM typically consists of nanometric carbon particles combined to generate microscopic formations. Particulate matter from animal farms has been widely investigated by scanning electron microscopy (SEM) analysis. Shen et al. [21] employed SEM to analyse the physicochemical properties of particulate matter in swine confinement barns. They observed irregularly shaped particles of a few microns in size. Cambra-Lopez [22] compared images of PM from different sources, observing branched formations from 2.1 μm to 18.1 μm in diameter. Energy-dispersive X-ray spectroscopy (EDX) has been used to investigate the chemical composition of PM particles. Marcato [23] observed the presence of crystalline material embedded in PM formations. According to Shen [21], this originates from feed and dust. Previous studies in the literature showed average PM removal efficiencies by air scrubbers ranging from 60% to 90% [24,25].
However, despite the beneficial effects in mitigating emissions, the market penetration of current scrubber technologies is limited by the substantial operational costs and sustainability [18]. Current NH3 abatement technologies rely on a two-stage or three-stage air-cleaning system, which further increases the costs of investment due to technological complexity. In a two-stage system, a wet acid scrubber is usually combined with a bio-scrubber, while in a three-stage system, the first stage, consisting of a water scrubber, is usually combined with the second stage (a wet acid scrubber), followed by a biofilter (the third stage). Such solutions may not be generally applicable due to the high implementation cost, or are applicable only to existing plants with a centralised ventilation system [15]. Thus, to achieve the National Emissions Ceilings Regulations target [26], effective, scalable solutions that concurrently reduce agricultural pollutants must be developed.
Meanwhile, the link between ammonia emissions—secondary particulate formation—human health, and related costs is significant at a societal level. The cost associated with the impact of NH3 emissions on human health was estimated at USD 55–114 billion in the European Union in 2018 [27]. Giannadaki et al. [28] estimated that a 50% reduction in agricultural emissions could prevent 200,000 deaths per year. They found that a large-scale reduction in NH3 emissions could lower premature mortality by 18%, with an annual economic benefit of USD 89 billion. Similarly, Giannakis et al. [29] reported an economic benefit of EUR 3.42 billion associated with the reduction in ammonia emissions in the UK.
Thus, while current pollutant abatement technologies involve design complexity and significant investments, the cost associated with ammonia emissions is still too high at a societal level. Furthermore, while ammonia emission factors have been widely utilised to establish the overall emissions of an animal farm, recent findings have raised concerns regarding the accuracy of such approaches [30,31]. Previous studies have revealed that emission factors’ estimates may significantly vary by up to 60% [31], while differences of up to one order of magnitude have been reported between winter and summer experimental campaigns [30]. These inconsistencies underscore the limitations of using only average ammonia emission factors. A more comprehensive set of data on ammonia emitted from livestock facilities is, thus, required to provide a more realistic representation of ammonia emissions and their impact on the environment.
This study aimed to evaluate the environmental performance of a UK farm, with particular attention paid to the effectiveness of a novel air pollution abatement (APA) system as a mitigation solution to reduce NH3 emissions. For this purpose, a farm involved in the production of pigs was evaluated, considering two scenarios: with and without the adoption of the APA system. The novelty of this study lies in the assessment of the impact related to the implementation of an air treatment solution in a real farm scenario using scrubber technology, which only employs tap water without the addition of acidification additives. The ammonia emissions data collected over the entire production cycle were critically compared with a statistical approach. Moreover, this case study aimed to identify the potential benefit of using the APA system on a larger scale and any potential margins for improvement on the reuse of water coming from livestock housing as fertiliser.

2. Materials and Methods

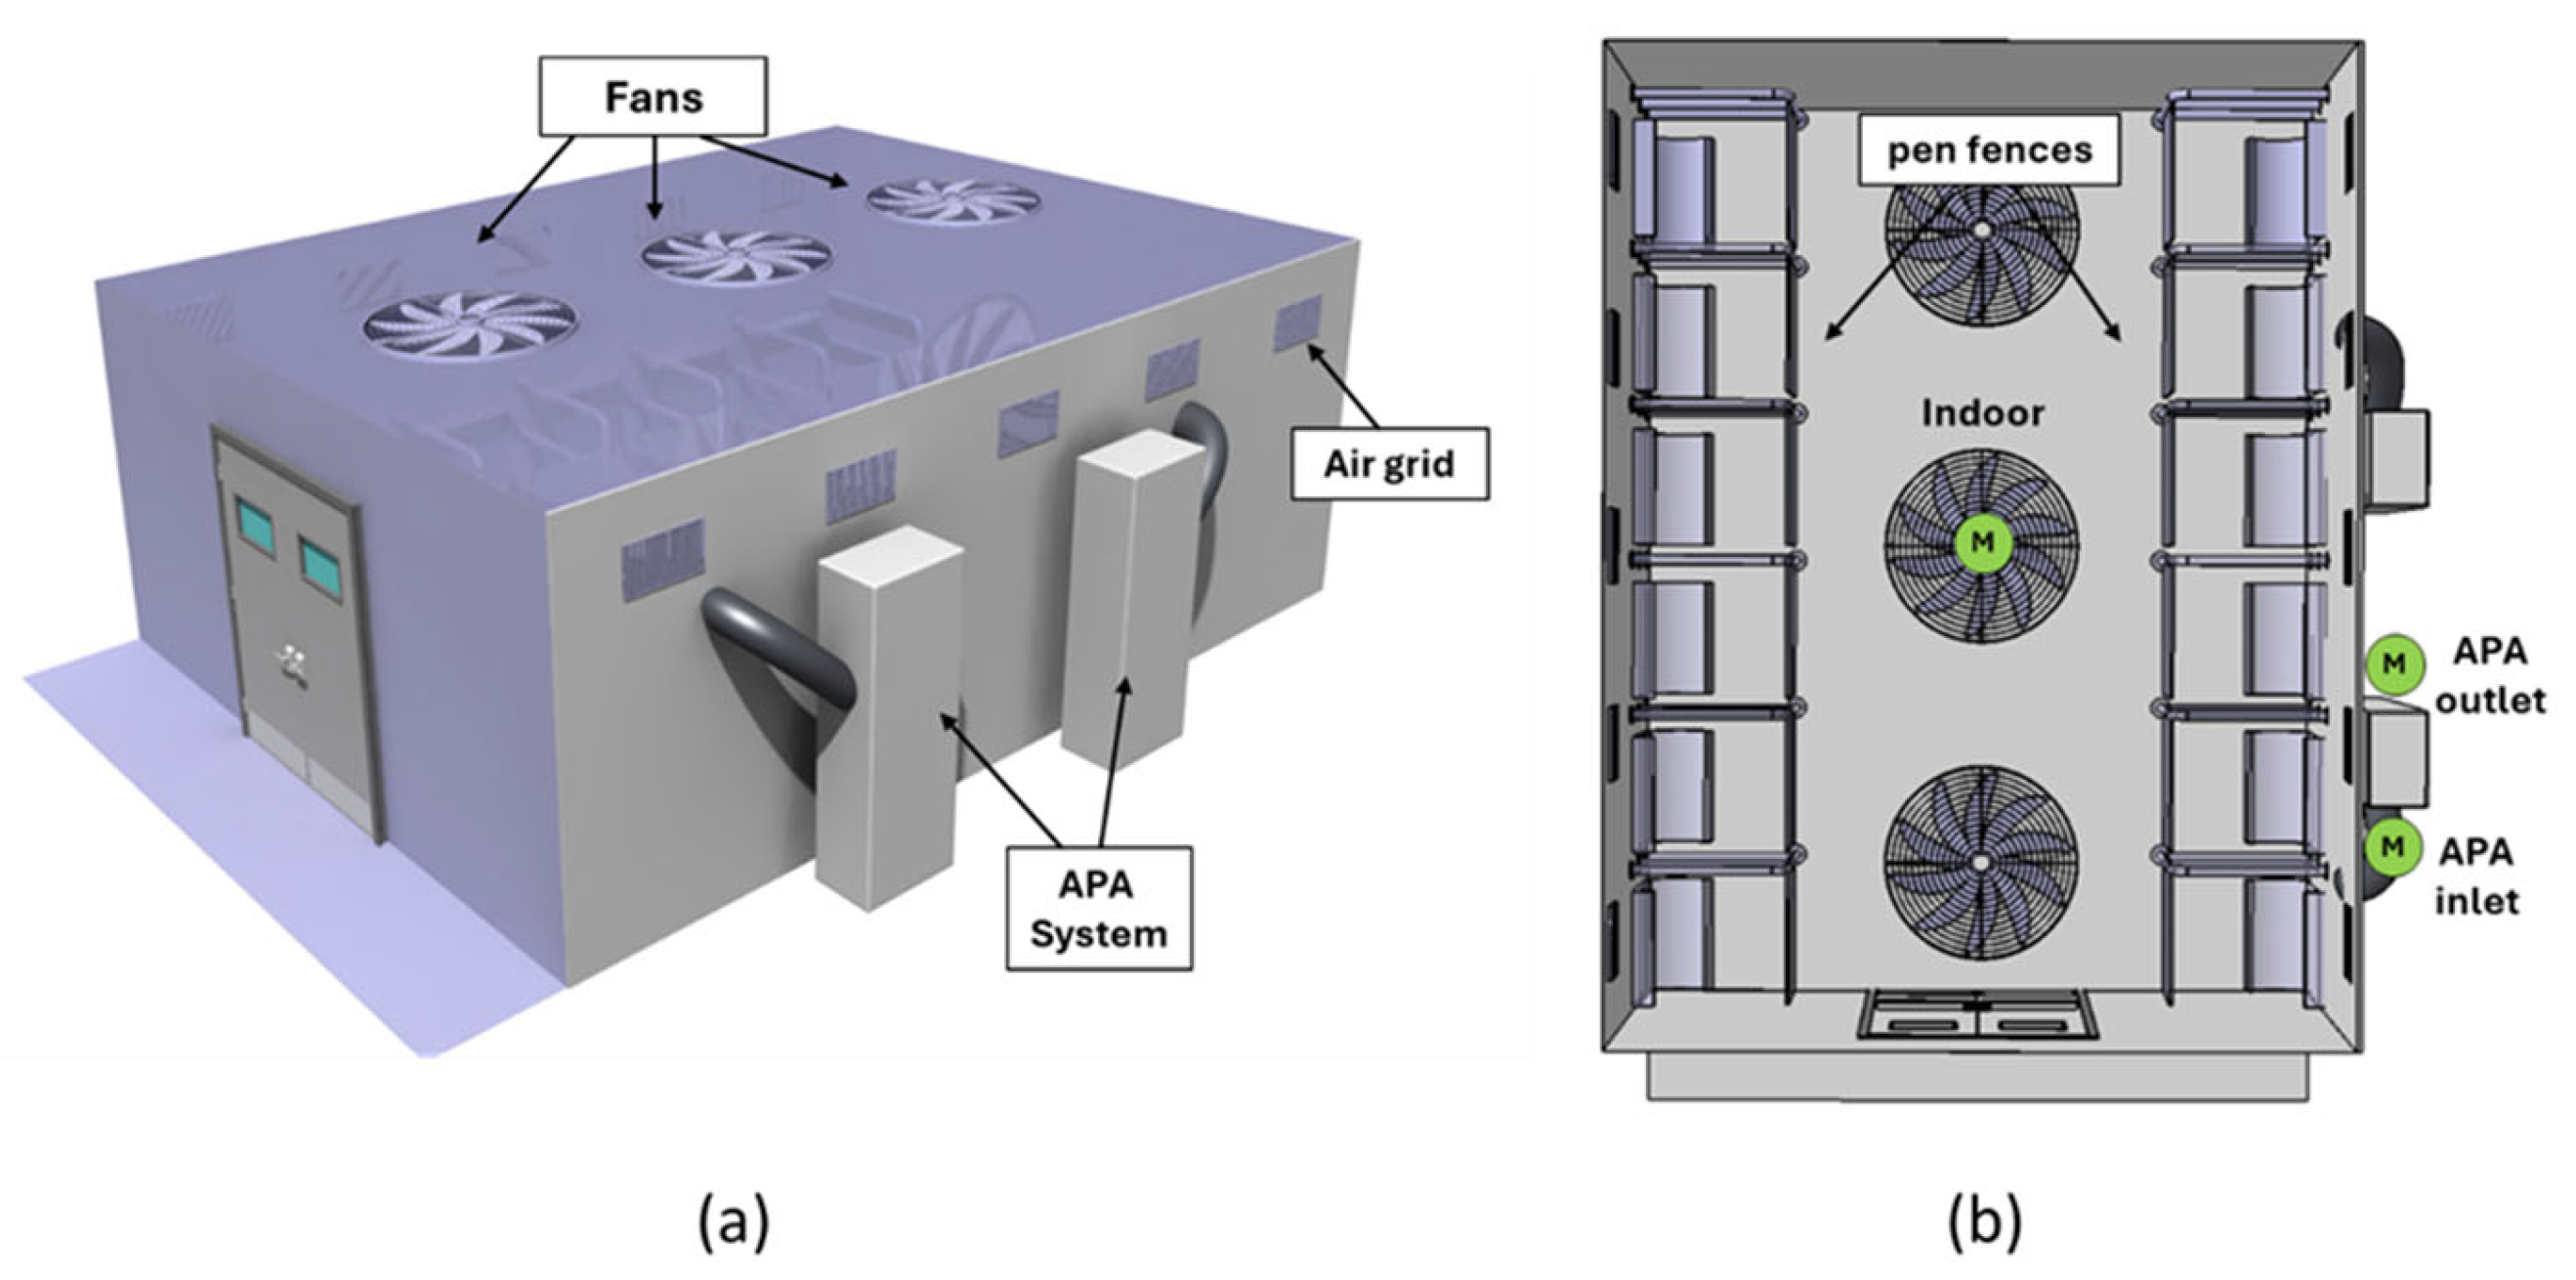
2.1. Livestock Building
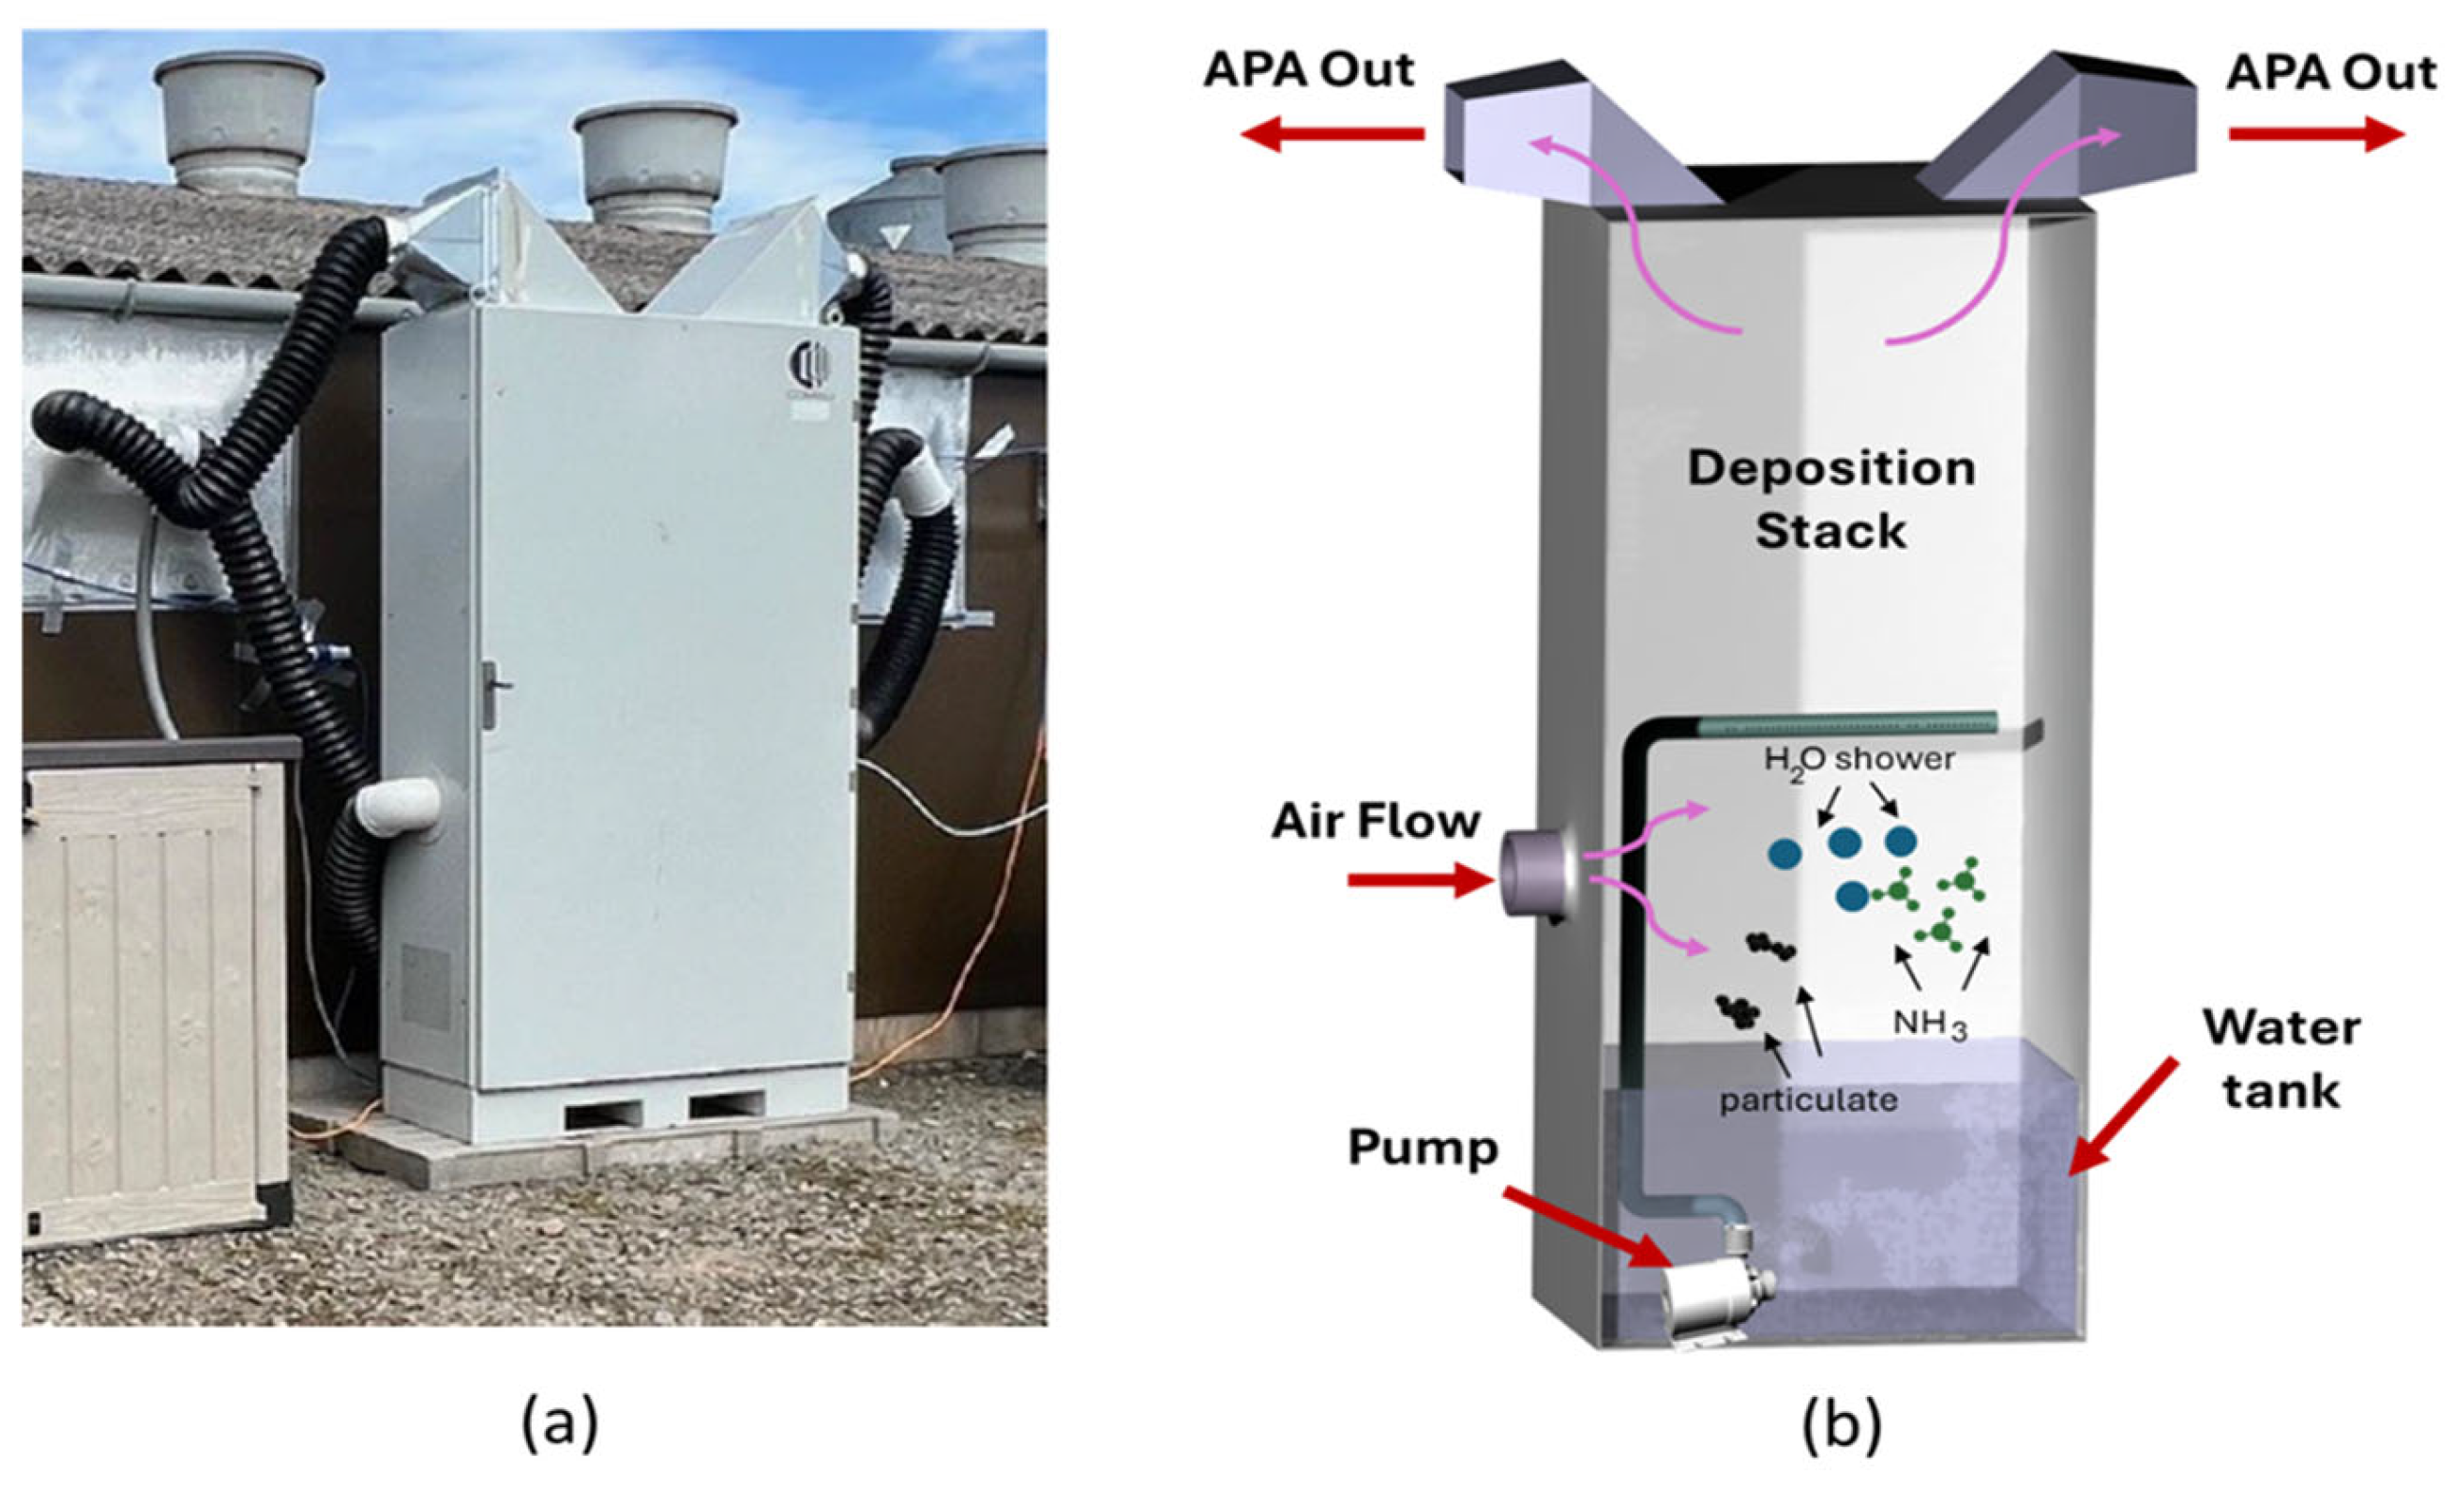
The testing site was part of a larger UK farm, and the finisher pig unit contained between 320 and 340 pigs for 11 weeks, growing from 30 kg to typically 110 kg, before they left the site. All the pens in the room received the same feed source from ABN (UK supplier); D08WP was fed for initial five days, thenmixed with D11GP at 42 kg/LW for three days. Then, pigs were fed D11GP only diet until they weighed 70 kg/LW. This was mixed with D13GP for three days, and then, given D13GP only until they left.
The farm consisted of two rows of six pig units each, separated by a single corridor, following a typical corridor–pig room configuration (Figure 1). The facility had a floor area of 20 m × 12.5 m and an average height of 2.4 m. The finisher room was fully slatted, with a slurry pit with a depth of 1.1 m. The dimensions of the slats were 2000 mm in length, 500 mm in width, and 100 mm in depth, with a drainage gap of 18 mm between the slats.
The room was equipped with three fans located on the ceiling. The fans could be adjusted for operation and control. The room temperature was set at 20 ± 1.0 °C and periodically monitored by the operator. The relative humidity was maintained between 60 and 80%. Ventilation levels were progressively increased from 6.5 m3/h/pig in the initial week to 9.0 m3/h/pig by week 6, and from week 7 until the conclusion of the cycle, coinciding with the APA ON versus APA OFF trial in 2024, were consistently maintained at 15.0 m3/h/pig. Furthermore, the two datasets studied had identical ventilation rates, hence not affecting NH3 concentrations. When the fans were operating, fresh air came through the grid openings located along the two 20 m long walls.
The ammonia indoor concentrations were measured during a two-phase campaign, positioning the inlet of the analyser 30 cm below the ventilation fan to be representative of both the indoor concentration and the emissions generated by the finisher unit and released into the atmosphere. The first phase (baseline) ran between the last week of August and the first week of November 2023, covering a period of over 10 weeks, and was used as baseline data in this work. Week 9 (2023 trial) included the activation of an air pollution abatement (APA) unit, connected to the finisher pig unit via external grids. In the next phase, two APA units were continuously running during the 2024 trial. Data for the 2024 trial campaign were gathered from the beginning of July to the third week of September. Within the entire cycle, weeks 7–8 were selected for a more in-depth assessment of the APA technology performances by comparison with data from week 9 (2024), when the APA system was turned off. The APA outlet values were utilised as the outdoor ammonia concentrations in both the 2023 and 2024 trials. The outdoor average temperatures were comparable among the two experimental campaigns, equal to 16 ± 2.0 °C and 14 ± 2.0 °C for the 2024 and 2023 trials, respectively [32]. The outdoor average temperatures between the two experimental campaigns fell within the respective ranges of variation, indicating that the temperature conditions were statistically similar across the trials.
In contrast with current wet scrubbers’ technologies, APA only relies on water management and electrical energy consumption. The system allows for continuous running for months without the need for water changes. The water tank was filled with 140 L of tap water before starting each experimental campaign. Despite current wastewater handling procedures providing disposal, discharged water can be used as fertiliser with a good agronomic performance [33]. Furthermore, depending on the energy source (grid or renewable), the anticipated costs for energy consumption range from GBP 0.08 to GBP 3 per kg of NH3, which makes it an attractive solution for reducing ammonia emissions in animal facilities.
Previous research has shown that ammonia emission abatement depends on the pH, relative humidity, temperature conditions, and ventilation rate of the incoming air [34]. In the present investigation, the water in the tank was kept at ambient temperature (20 °C), while the pH gradually increased, reaching an alkaline value of 7.5 by the end of the experiment.

2.2. APA System

Figure 2 shows the APA system used in this investigation. The air, taken from the pig unit using two inlets, was treated by the APA systems and then brought back into the same pig unit, creating a continuous purification cycle but without interfering with the existing ventilation systems. The treated air at the APA outlet was then brought back indoors, and the indoor air was then released into the atmosphere through the independent finisher unit ventilation fans. In the APA unit, water was circulated through a nebuliser, which turned the water into a fine mist. In the meantime, the indoor air was drawn into the APA inlet by suction through the system’s fans. Using a patented multilayer mechanical system, solid particulates and ammonia particles present in the treated indoor air were then absorbed and captured due to mechanical collision with the water droplets. The resultant ammonia-enriched process water was then collected onto a deposition stack and, subsequently, flowed back to the water tank by gravity (Figure 2a). The ammonia removal efficiency of the system was calculated using Equation (1):
E f f i c i e n c y   % = C N H 3 , i n C N H 3 , o u t C N H 3 , i n × 100  
where C N H 3 , i n and C N H 3 , o u t are the ammonia concentrations at the inlet and outlet of the APA unit, respectively.

2.3. Measurement Setup

Three Gasmet DX 4030 analysers (Gasmet Technologies Oy, Vantaa, Finland) were employed for measuring ammonia concentrations. The measuring unit utilised the Fourier-transform infrared (FTIR) spectroscopy method of detection, with a precision of 10 ppb. A comprehensive calibration of each analyser against nitrogen in a controlled gas environment was conducted to further minimise measurement errors during testing. Each sample location recorded a total of 12 measurements each hour. Continuous monitoring of ammonia was performed daily for both experimental campaigns. While in the 2023 experimental campaign (phase 1), the ammonia content was only measured inside the livestock facility, in the 2024 campaign (phase 2), two additional gas analysers were employed for a more comprehensive assessment of the ammonia concentration of the farm and the performance of the APA technology. Therefore, in 2024, we relied on three sampling locations: one near the central ventilation fan (indoor), in the same position used during the baseline campaign; one connected to the APA inlet; and one connected to the APA outlet. These were connected to each of the analysers situated outside the finishing pig unit. The sampling height was 2.4 m for indoor measurements and 2 m for APA inlet and outlet measuring locations. Over the years, the literature has demonstrated the consistent use of Gasmet DX4030 or FTIR spectroscopy in livestock monitoring [35,36,37]. To ensure the accuracy of the ammonia readings, the systems were calibrated with known nitrogen concentrations in a calibration gas cylinder before each campaign. Regular calibrations were also carried out during the experiments. The repeatability of the ammonia emission measurements was tested by duplicate sampling and analysis under the same environmental and operating conditions. The consistency was evaluated using statistical parameters such as the standard deviation and coefficient of variation. Variations of up to 1.8% were observed between successive measurements, indicating reliable measurement performance.

2.4. Ammonia Emission Rates

The average ventilation rate was used to estimate the ammonia emission factor of the building using the balance method suggested by the International Commission of Agricultural Engineering [38]. The ammonia emission rates for APA ON and APA OFF testing conditions were derived using the following equation [30]:
E F = V × N H 3 , i n N H 3 , o u t n
where EF is the emission factor in g/h pig−1; V is the ventilation rate, expressed in m 3 /h; n is the number of pigs (330) on the farm; and N H 3 , i n and N H 3 , o u t   are the ammonia concentrations indoors and at the APA exit, respectively, in mg/m3.

2.5. Ion Chromatography

A ThermoFisher ICS 5000 system (Thermo Fisher Scientific, Loughborough, UK) was used for this work. The samples were collected in plastic boxes and stored at room temperature prior to analysis. The samples were diluted in a known volume of deionised water having a resistivity of 18.2 MΩ·cm. An aliquot of each sample was then taken and analysed by ion chromatography for anions and cations. The results were compared with quality control standard samples to obtain accurate measurements. The concentration of NH4+ was recorded, and the results were converted to ammonia (NH3) by applying a correction factor based on the molecular weight difference between NH4+ and NH3. The estimated uncertainty of the analysis was within ±10% of the nominal value.

2.6. SEM-EDX Analysis

The sample preparation procedure is schematically illustrated in Figure 3. Four water samples of 100 mL in volume were drained from the tank of the APA system at different time intervals and inspected via SEM analysis. The elemental composition was determined by EDX spectroscopy. The samples were collected in high-density polyethylene (HDPE) bottles and continuously stored in the refrigerator prior to analysis. Silicon wafers were used as a substrate for sample deposition. The surface of the Si wafer was first ultrasonicated in isopropyl alcohol (IPA) for 3 min to remove any contamination from the surface. Further cleaning was then promoted by subjecting the wafer to O/Ar plasma for 5 min. The sample tubes were shaken to mix the suspended particles, and 5 μL of the suspension was pipetted onto the wafer and dried under ambient conditions overnight. A schematic illustration of the sample preparation procedure and analysis is reported in Figure 3. A FEI Quanta 650 SEM xT microscope control 6.2.1 (Oregon, USA) in low vacuum mode with water at 60 Pa, based in the Nanoscale and Microscale Research Centre (nmRC) at the University of Nottingham, was used to perform the imaging. An incident electron beam voltage of up to 15 kV was used with various magnifications. EDX analysis was performed using an Oxford Instruments AZtec system (version is 6.0) with an X-MaxN detector (Abingdon, UK) mapping with a process time of 3, a width of 256 pixels, a dwell time of 10 μs, and 100 frames. The same elements were selected for all samples in the EDX map, regardless of detection.

2.7. Statistical Analysis

Statistical analysis was performed using the Minitab software, 17.2.1. The data collected from each sensor location point were analysed using descriptive statistics and expressed with means ± standard deviations. The NH3 concentration differences between monitoring locations were evaluated using nonparametric Mann–Whitney tests. This test was chosen because it allowed us to assess the differences between the two datasets without the need for a specific distribution assumption [39]. The statistical analysis tests include two-tailed tests. Values were considered significant at p < 0.05.

3. Results

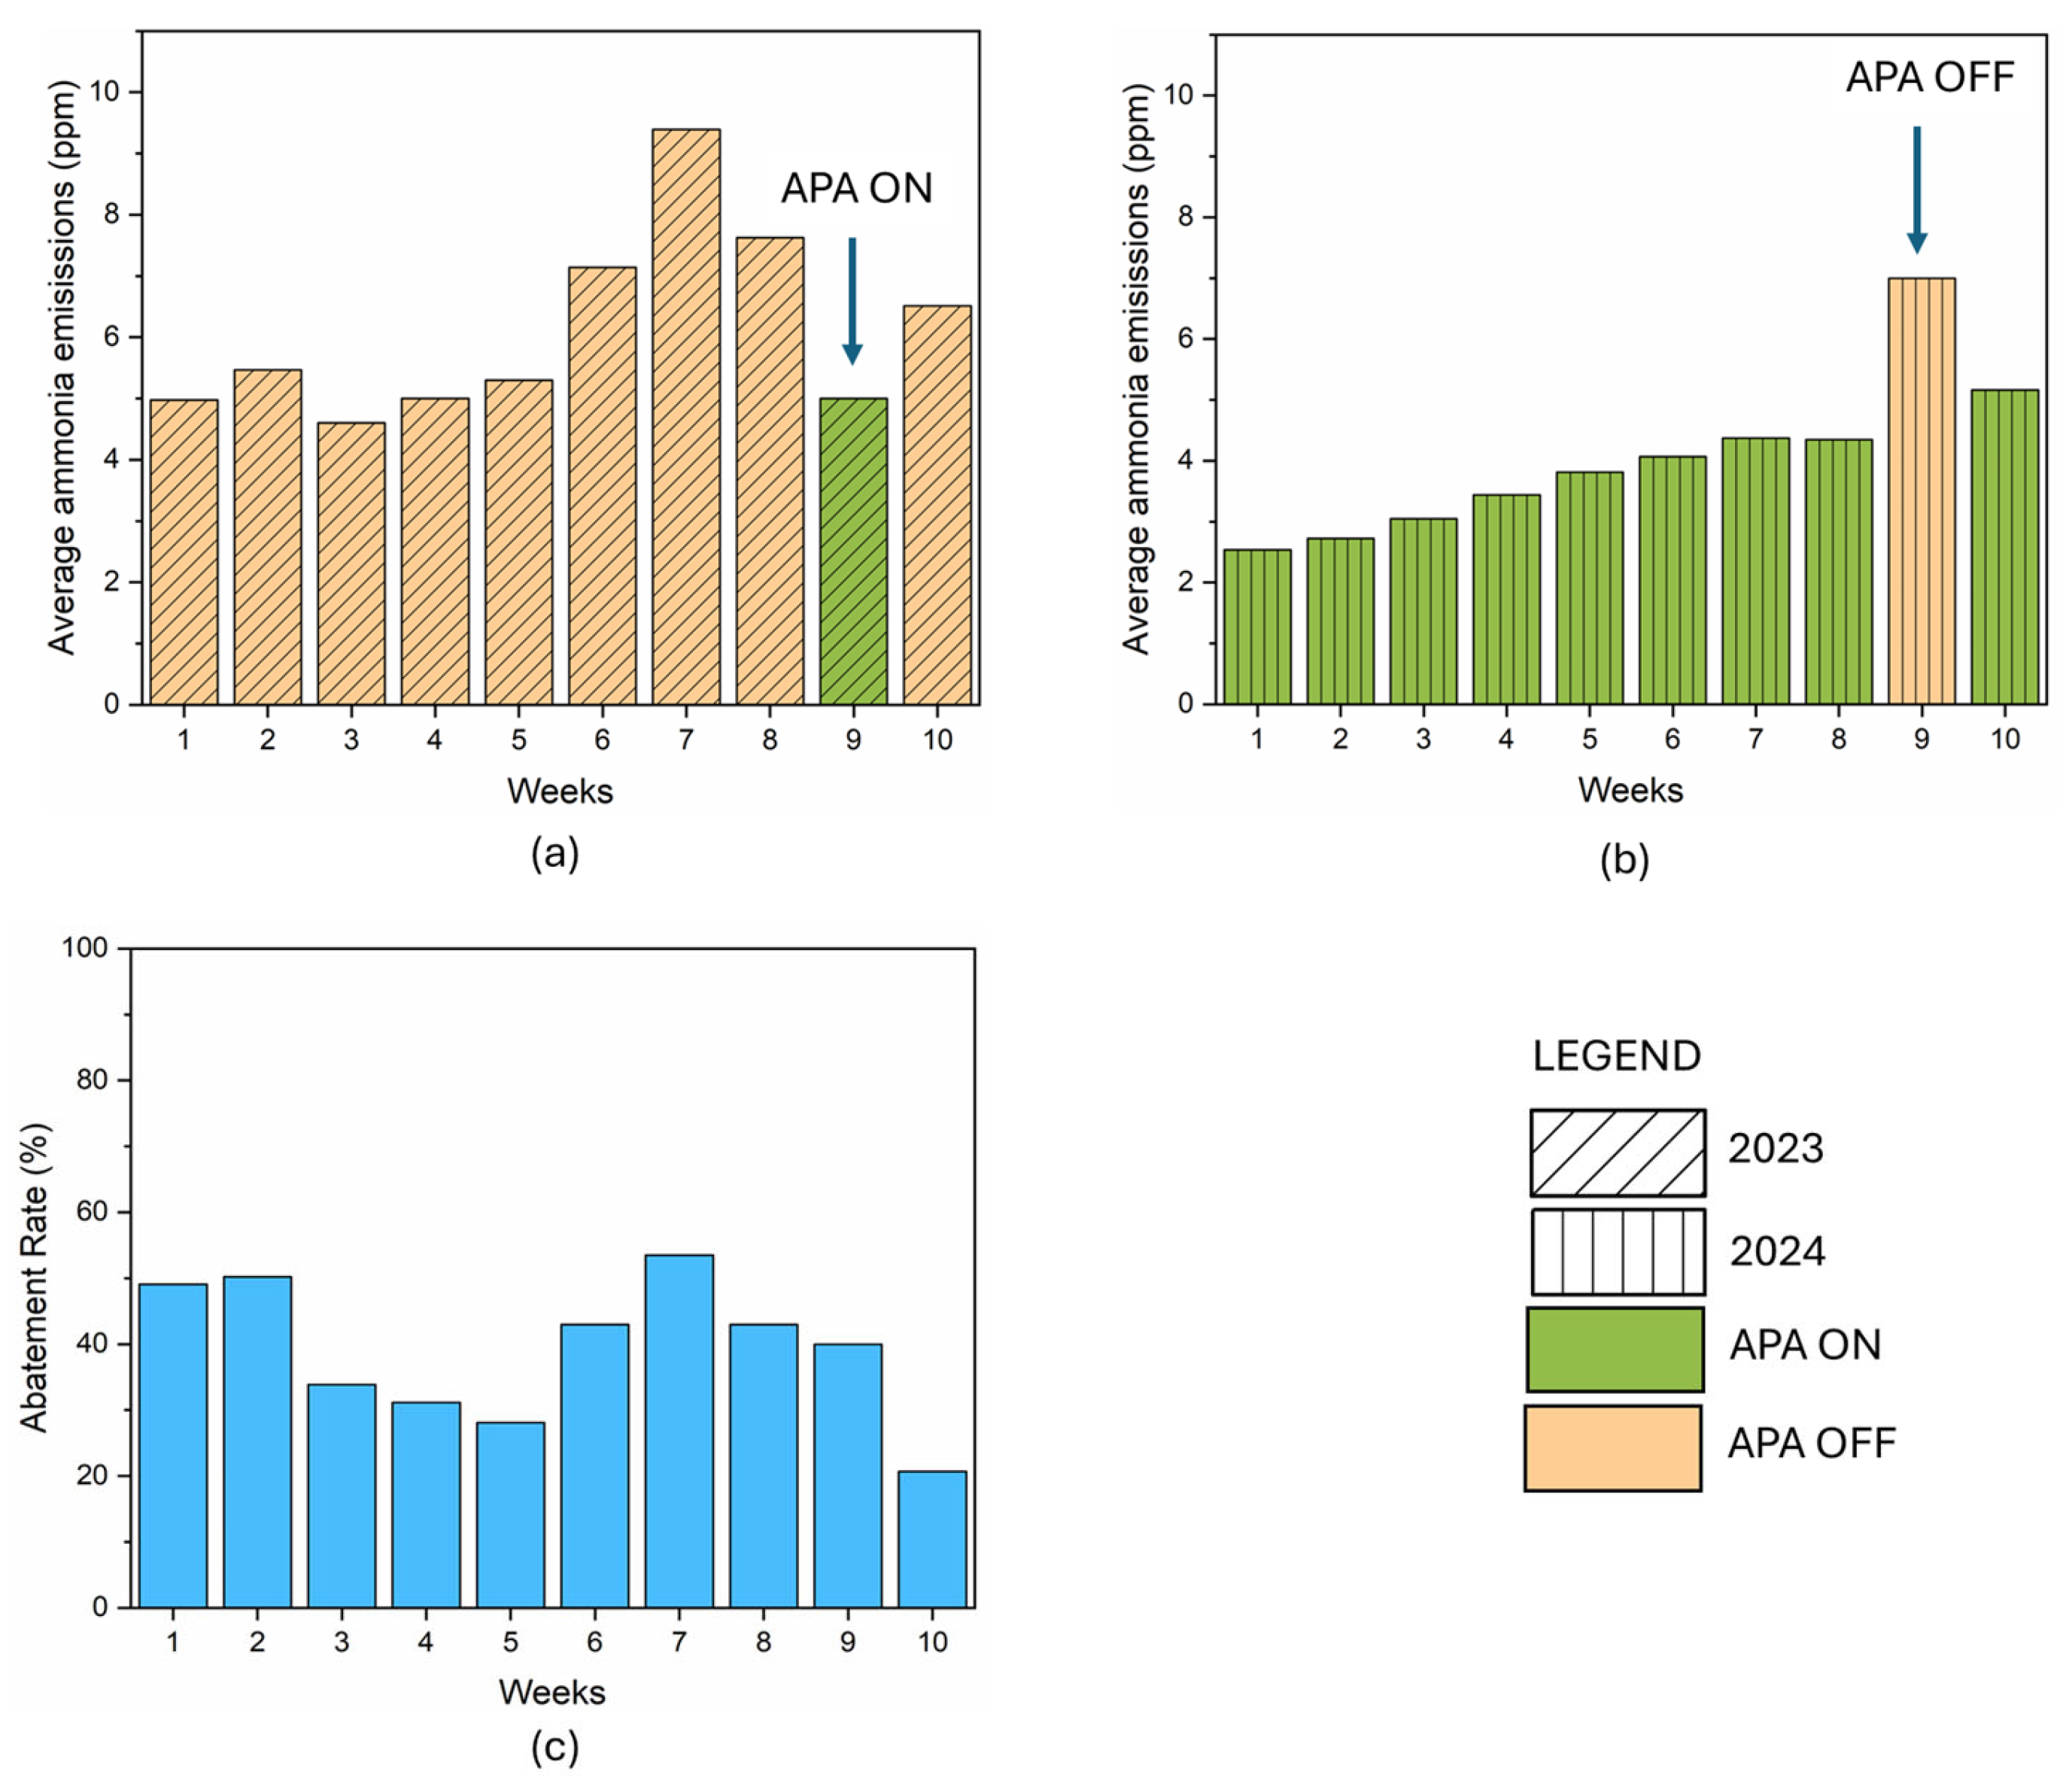
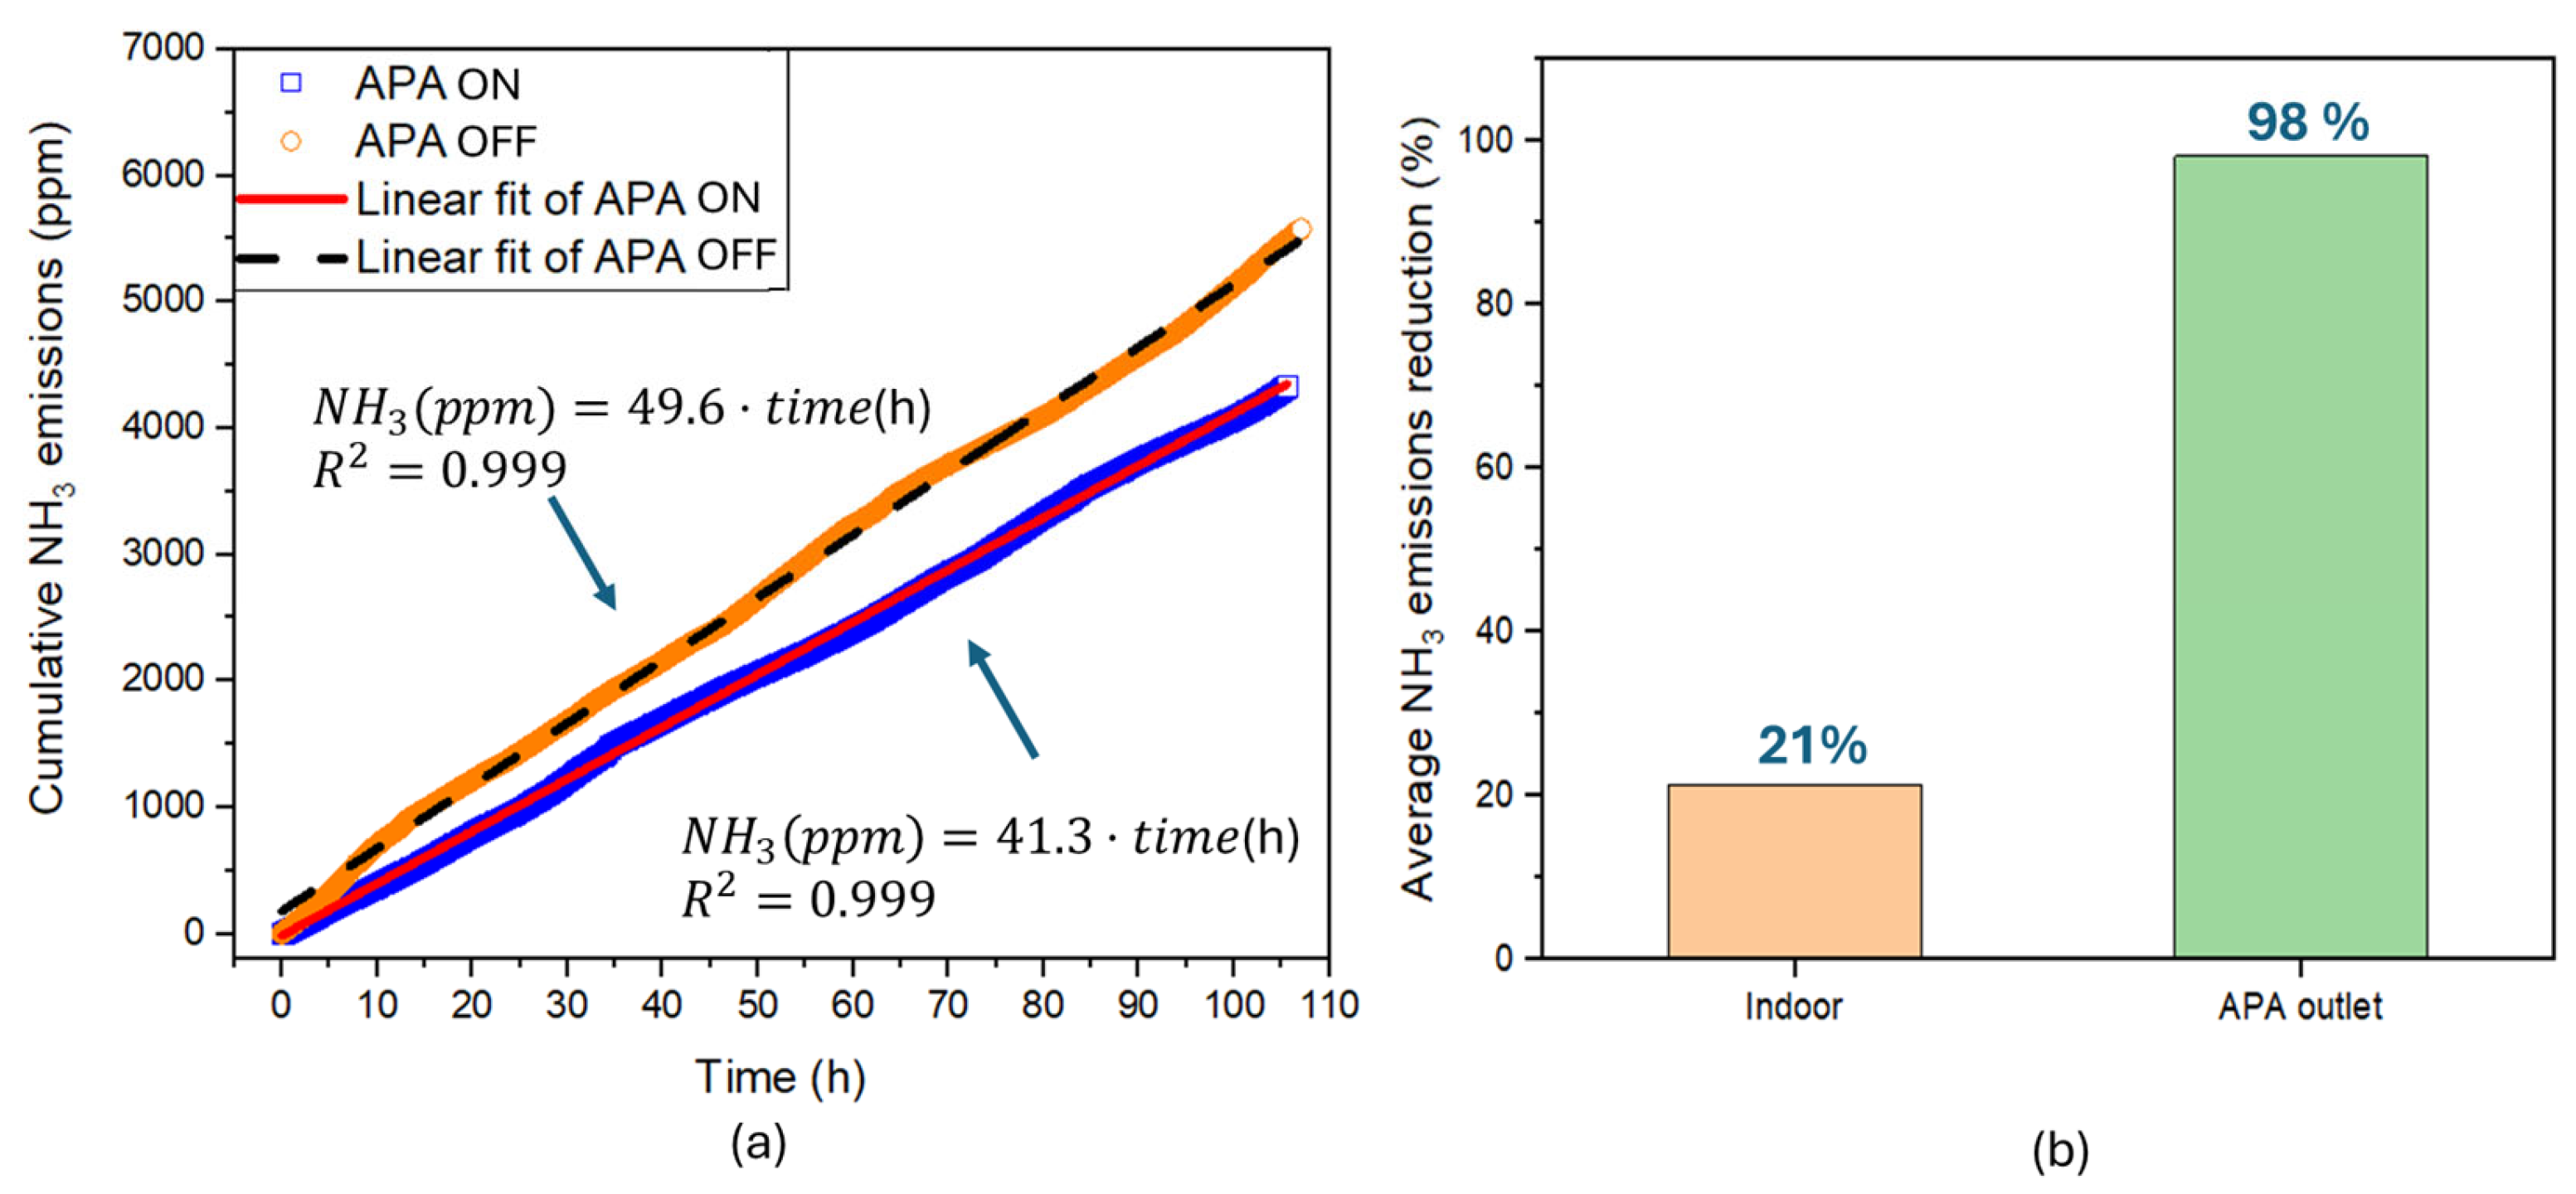
3.1. Average Ammonia Emissions

Figure 4a shows the weekly indoor ammonia concentrations registered during the baseline period in 2023 compared with the 2024 trial when APA was in operation (Figure 4b). The baseline concentrations in 2023 resulted in ten continuous weeks, from the last week of August until the first week of November 2023. Over the first five weeks, the trend in NH3 emissions remained stable at an average concentration of 5 ppm. However, average weekly concentrations of 7 ppm and 9 ppm were observed in weeks six and seven, respectively. An average ammonia concentration of 7 ppm was recorded in the following weeks as the pigs grew and became significantly larger, except for week 9, when the APA system was initially tested for one week. Since the start of the phase 1 campaign, NH3 had increased by up to 89% due to the growing animals. When looking at phase 2, the 2024 experimental campaign when APA was in operation, and comparing it with the baseline from the 2023 campaign, a significant reduction in ammonia content was observed. The only exception occurred in week 9, when the APA system was switched off during the 2024 trial. The average abatement rates when APA was in operation are reported in Figure 4c. The ammonia abatement rate varied from 21% in week 10 to 54% in week 7, with an average abatement rate of 40% across the experimental campaign. Weeks 7 and 8 of the cycle were chosen for a more in-depth evaluation of the APA technology performances in comparison with week 9 (APA OFF), and the hourly variations in ammonia concentrations are shown in Figure 5, Figure 6, Figure 7 and Figure 8.

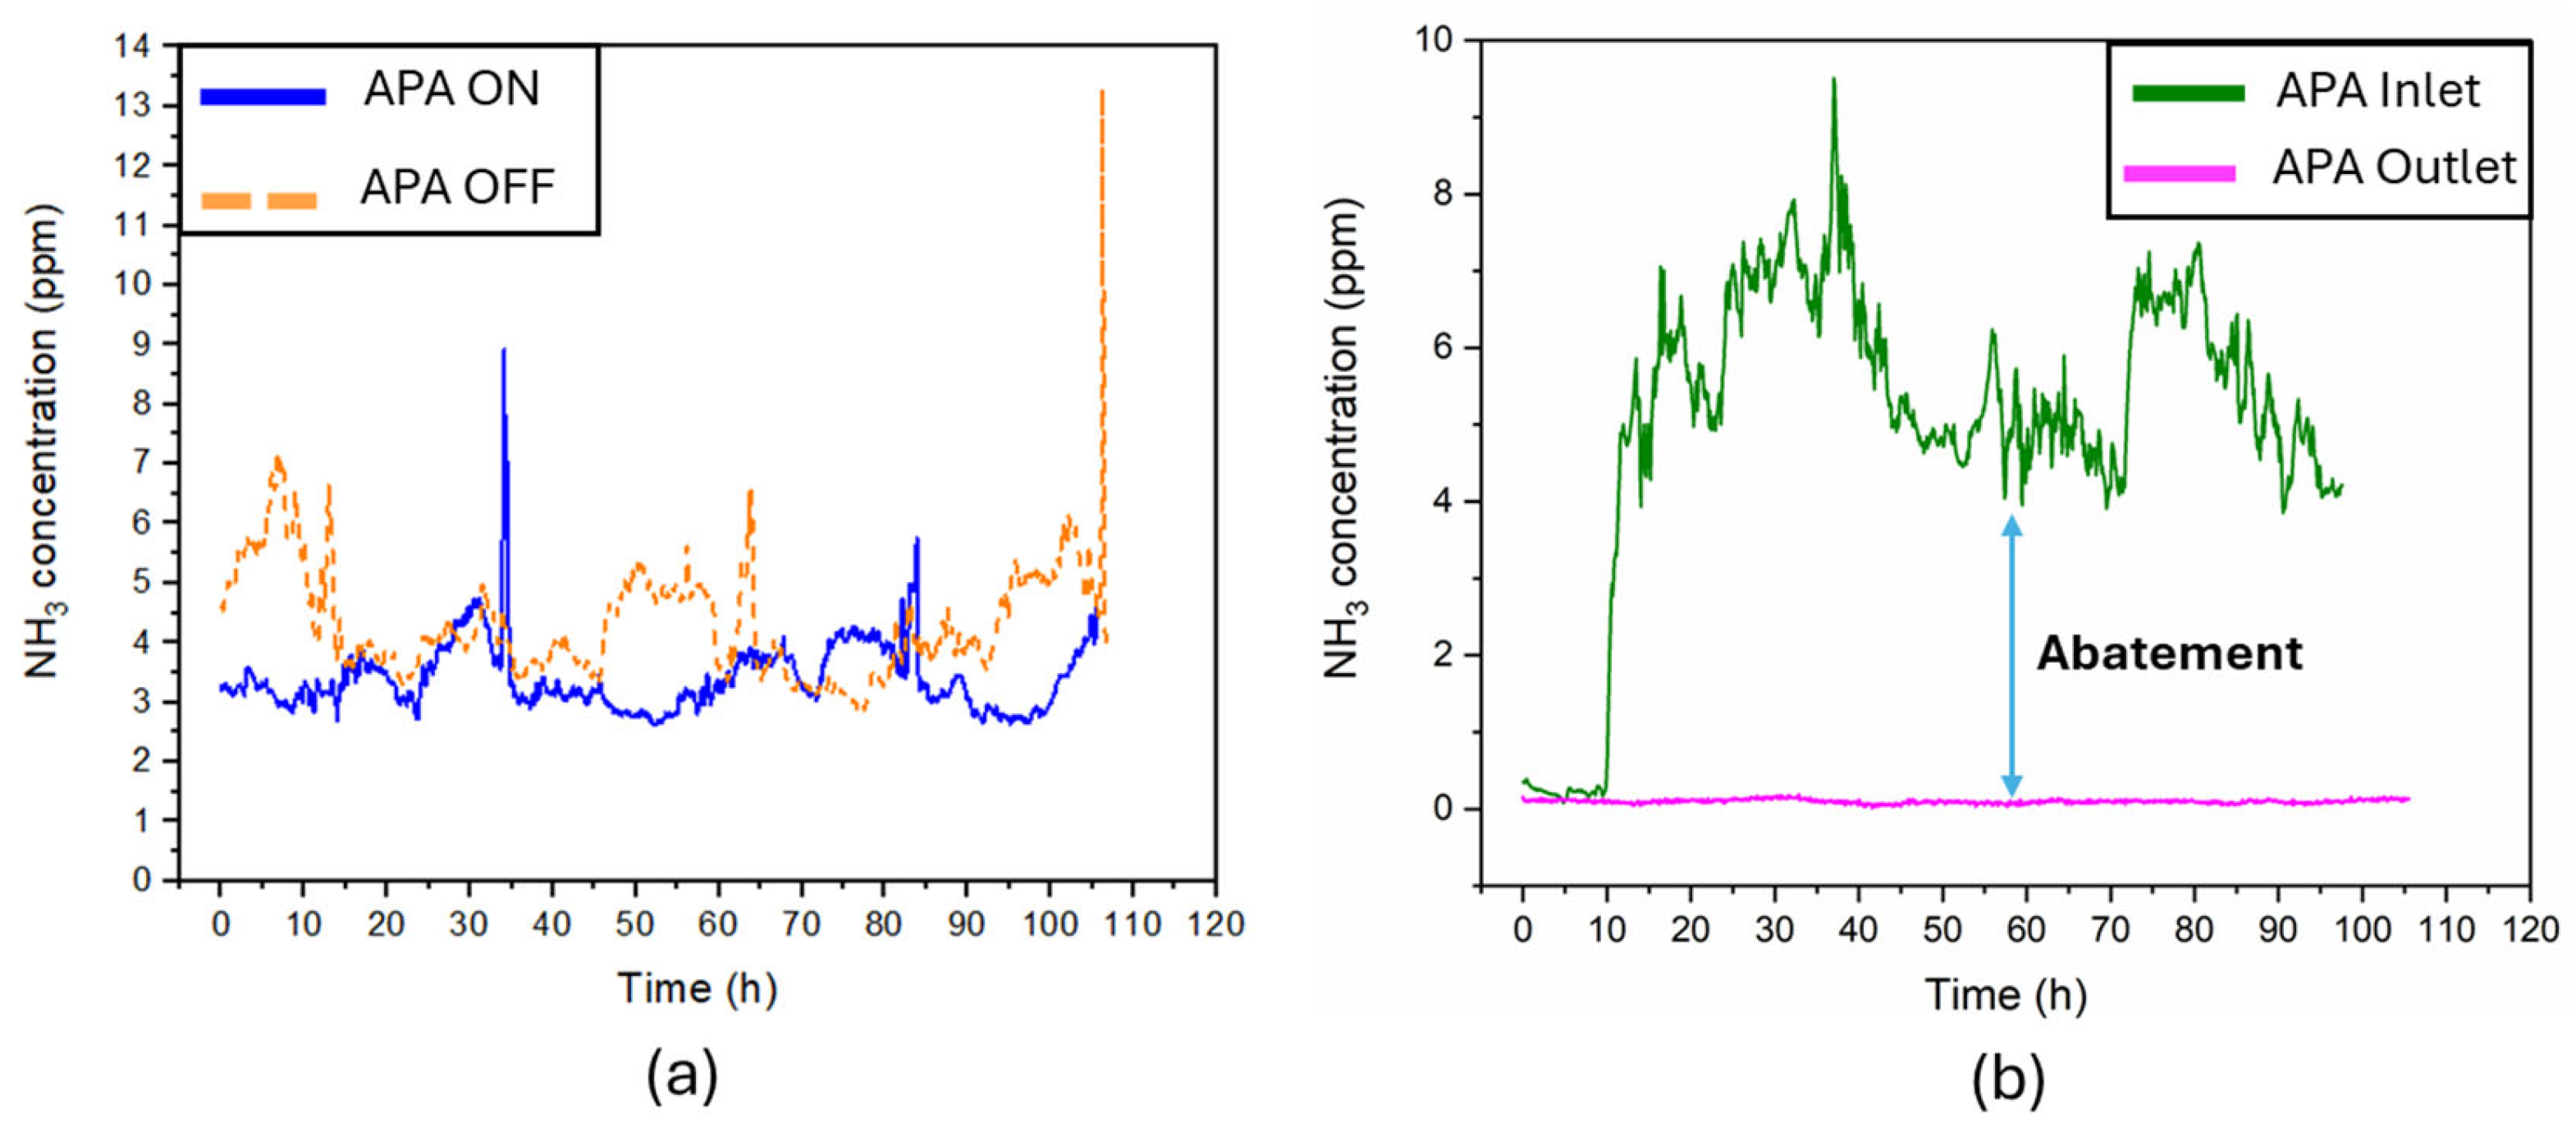
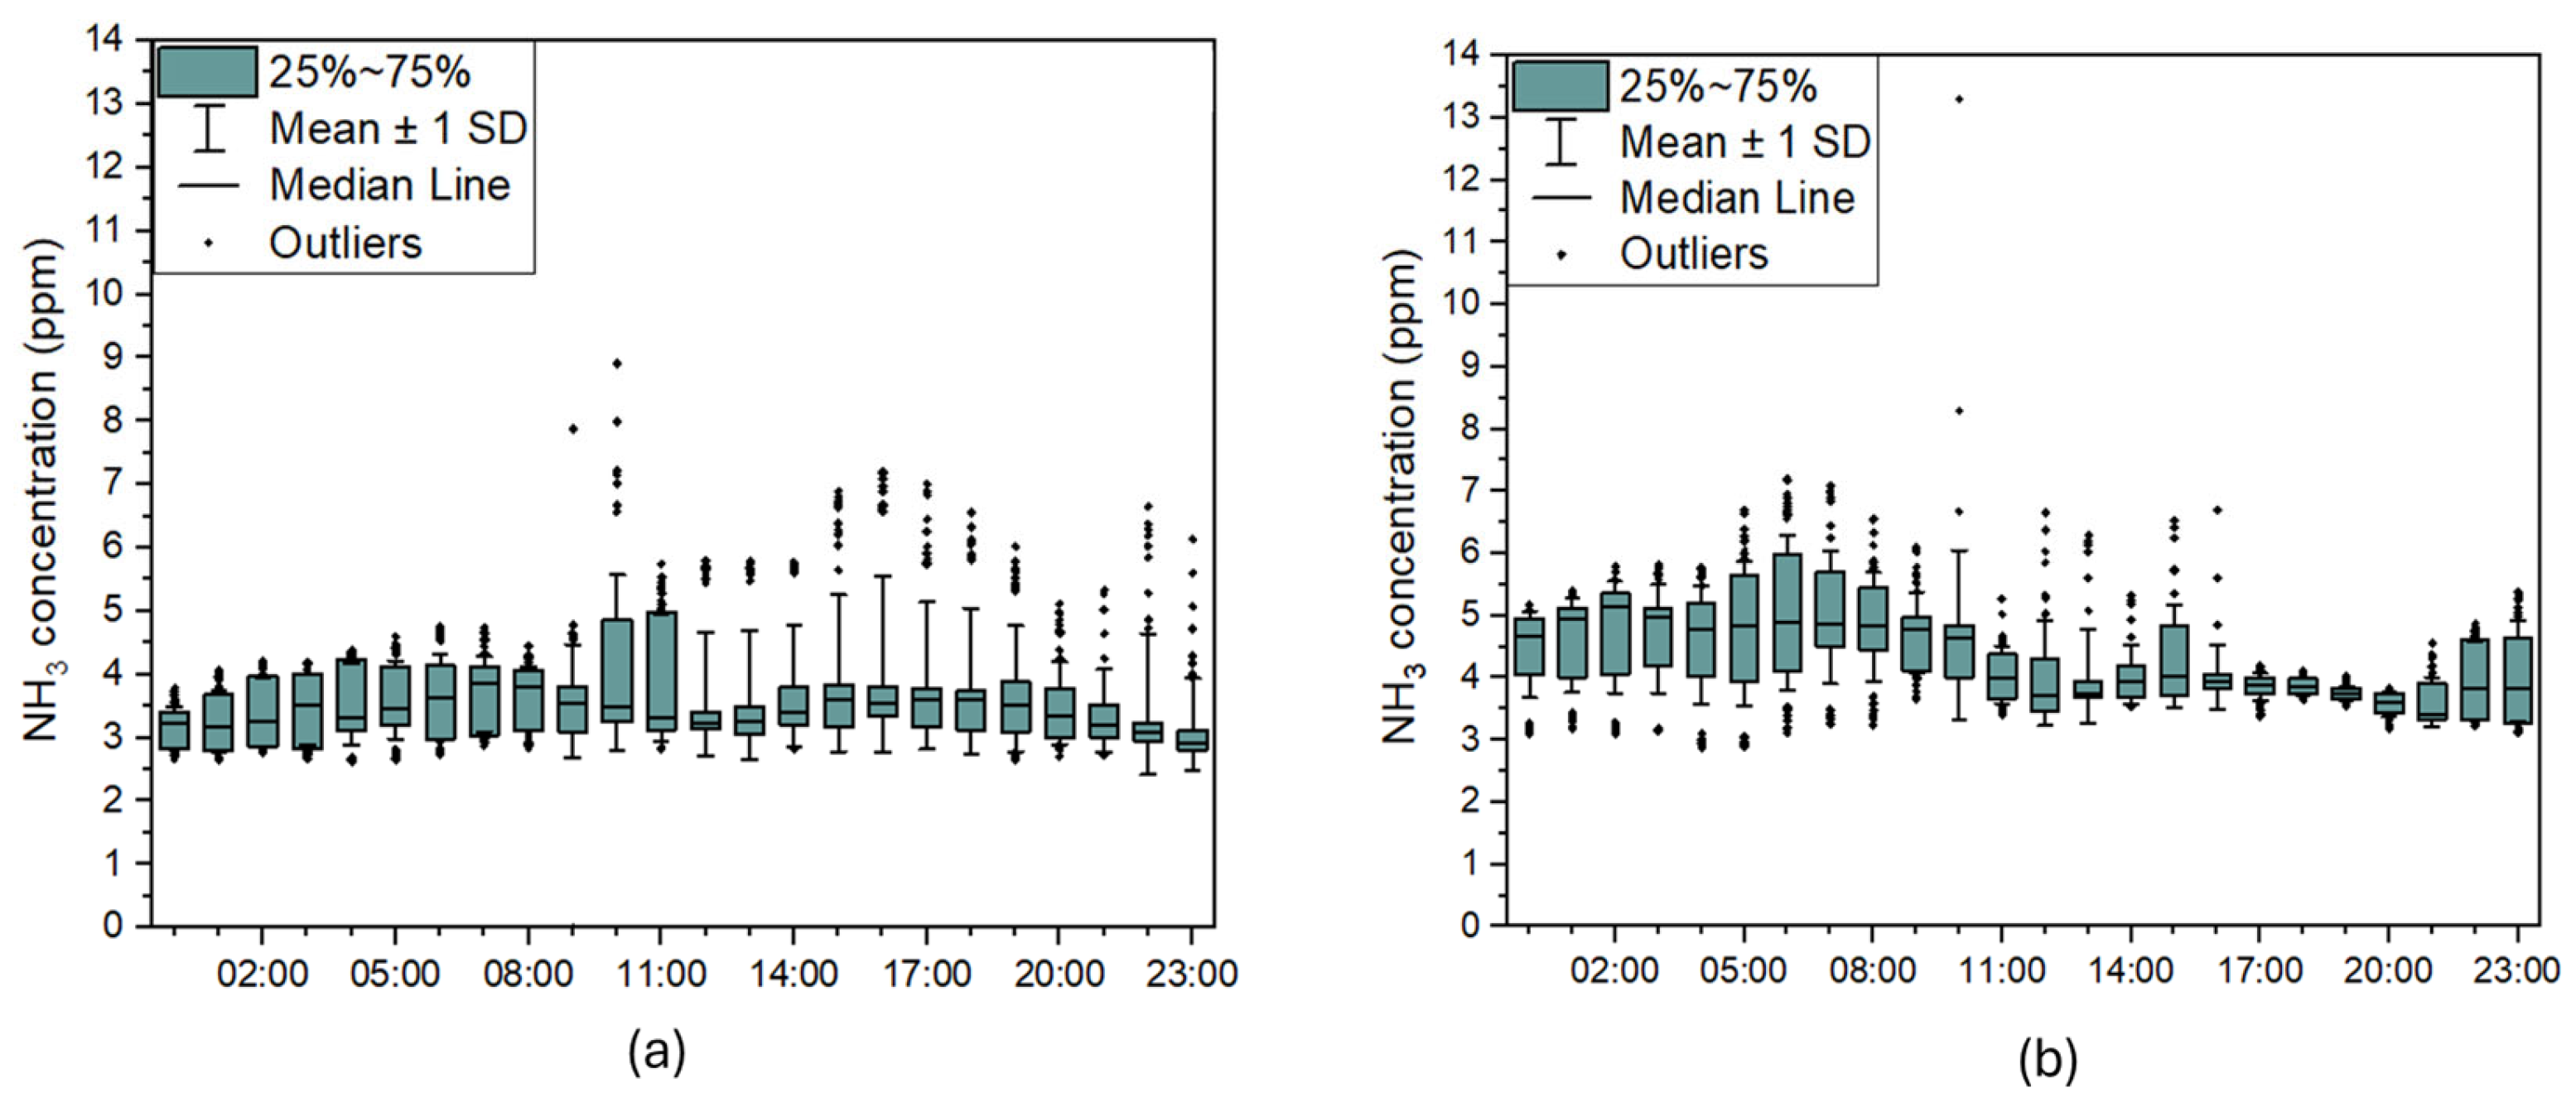
3.2. Hourly Ammonia Concentrations

During the period between weeks 7 and 8, chosen for a more in-depth analysis, the ammonia concentrations measured indoors, at the inlet, and at the outlet of the APA system are shown in Figure 5. Significant fluctuations could be observed in the ammonia concentrations over time, with consistent oscillation patterns indoors and at the APA inlet measuring locations. Substantial variations could be observed in the indoor ammonia emissions between the APA ON and APA OFF scenarios, averaging at 3.40 ± 0.59 ppm and 4.32 ± 0.39 ppm, respectively. Accordingly, average ammonia concentrations of 5.65 ± 1.03 ppm were recorded at the APA’s inlet monitoring point. The ammonia concentrations at the different monitoring locations are outlined in Table 1. Switching on the APA system resulted in a statistically significant decrease in the ammonia concentration indoors (Mann–Whitney: p < 0.05). Cumulative ammonia concentrations for the APA ON/OFF scenarios are illustrated in Figure 6 along with their associated linear regression model.
The measured NH3 emissions were in good agreement with the analytical counterparts for both situations (R-squared: 0.999). Nevertheless, the impact of the APA usage during the sub-set measurement period of the 2024 trial (weeks 7–8 APA ON and week 9 APA OFF) led to a 17% reduction in the ammonia emission rate over the short time considered, demonstrating, once again, the beneficial effect of the device in reducing the overall ammonia emissions from the site. A total 98% reduction could be achieved at the APA intake when the device was in use on the farm, which translated to a 21% decrease indoors (Equation (1)). Figure 7a,b show the hourly fluctuations in ammonia concentrations indoors for the APA ON and OFF scenarios, respectively. Substantial oscillations in indoor ammonia concentrations could be detected in both cases, with fluctuation patterns consistent with the sinusoidal variation expected in animal activity [40]. At around 10:00 a.m., an individual peak could be observed in both instances (see Figure 7). This was presumably a result of the site’s regular manure removal. The ammonia content then drastically decreased to 4 ppm/h during the day. In both situations, the ammonia content fluctuated minimally overnight. This pattern is in line with previous research reported in the literature [41].

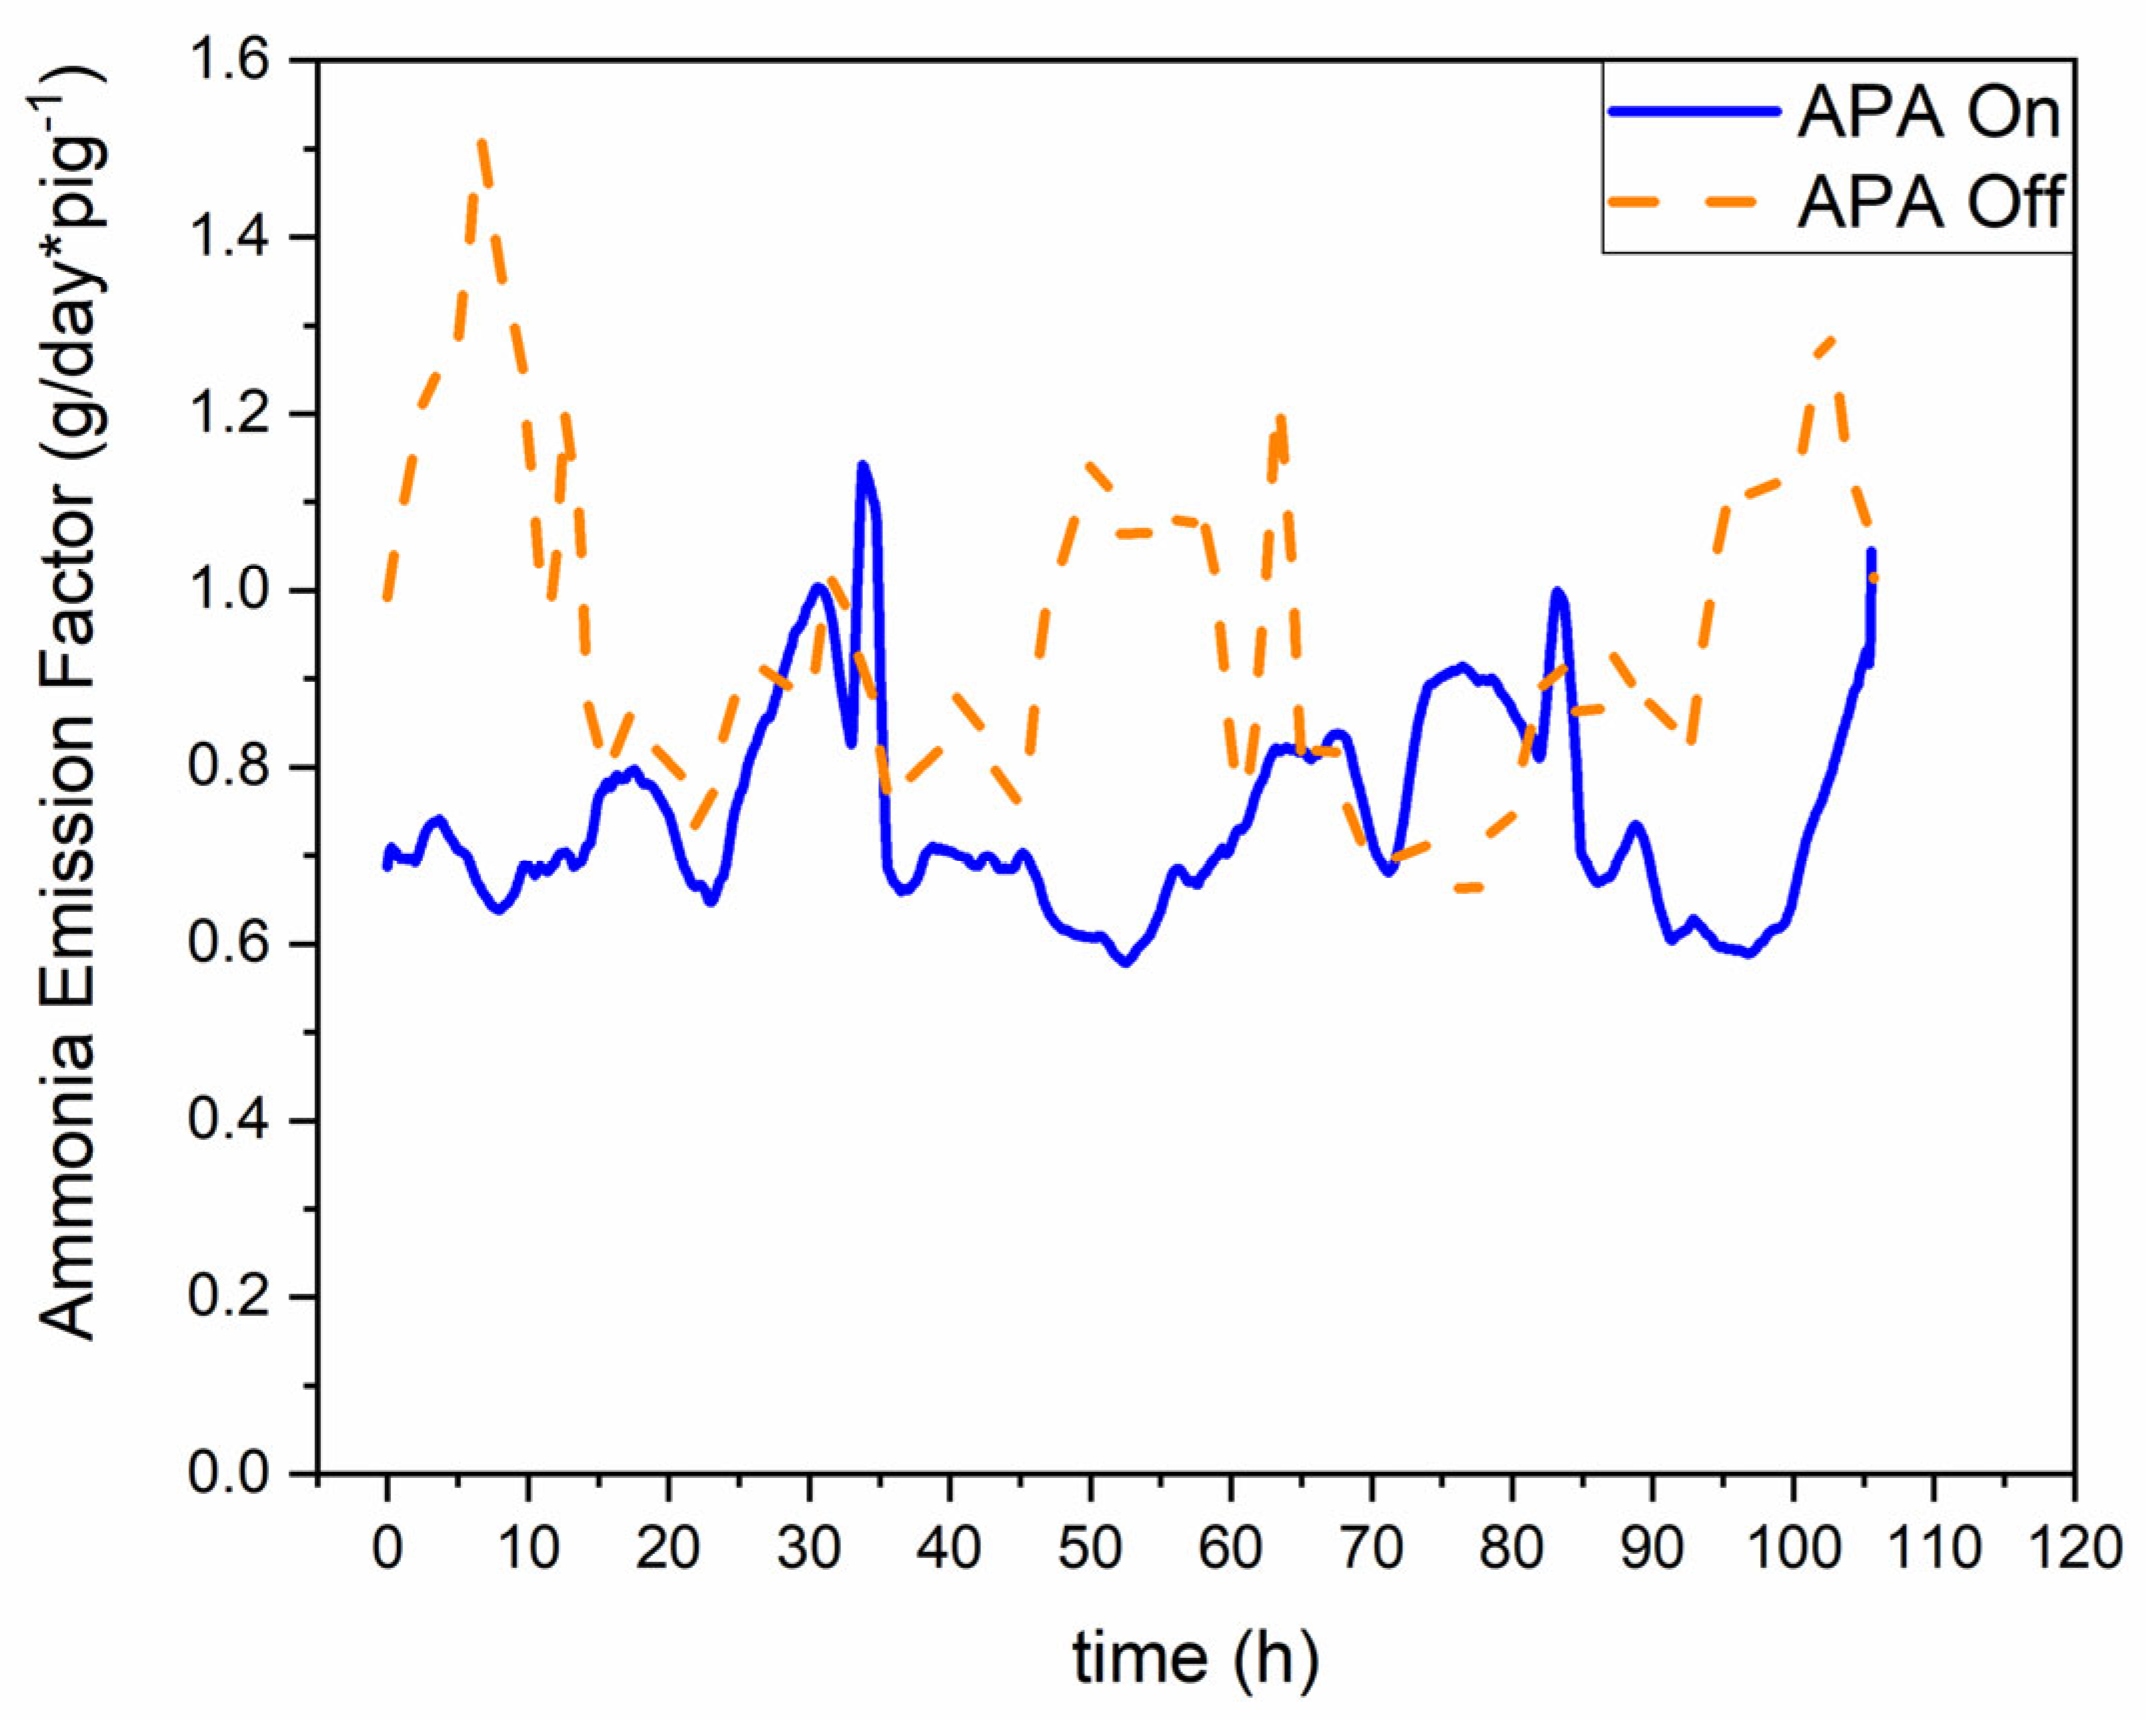
3.3. Ammonia Emission Factors

Equation (2) was used to estimate the average ammonia emission factors, which are shown in Figure 8 for the APA ON and OFF scenarios. The average ventilation rate was kept constant at 8.8 m3/h pig−1 for both experimental campaigns. Pronounced oscillations could be observed in both APA ON/OFF scenarios. These were consistent with the ammonia emissions pattern within the farm site. Since the same airflow rate was adopted for the two cases, the difference could be explained by the reduction in ammonia emissions when the APA system was in operation. The average ammonia emission factors were 0.743 ± 0.13 g/day pig−1 and 0.95 ± 0.19 g/day pig−1 for APA ON and APA OFF, showing, again, during the short period within the 2024 experimental campaign, a 21% reduction in ammonia emissions from the pig unit in the facility when the APA system was in operation (Figure 6) and supporting the wider findings of an overall abatement rate of 40% across the full experimental campaign (Figure 4).

3.4. Water Sample Analysis

Surface examinations were first carried out on a virgin Si wafer to assess the background noise in the SEM-EDX inspection of the water samples. The results of this analysis are illustrated in Figure 9. The wafer surface appeared largely empty, with only a few detected particles of approximately 20 μm in size. EDX revealed that they mainly consisted of carbon and oxygen, likely due to contamination from the air or the SEM vacuum system. Figure 10 shows the typical particles found in the water samples. Many particles had a regular shape, with a size ranging from 5 to 10 μm (Figure 10a,b). The regular shape suggests crystallisation, which may be related to salts or other solids. Particles fused together to form irregular-shaped aggregate structures of up to a few hundred micrometres in size were also observed (Figure 10c). A few of these particles were amorphous (Figure 10d) and underwent some degree of decomposition under the electron beam (Figure 10e). Long-term exposure to the electron beam at standard imaging energies often resulted in decomposition, suggesting the presence of volatile compounds in the material.
EDX examinations revealed that the particles were mainly composed of sodium (Na), chlorine (Cl), and calcium (Ca), with traces of other elements consistent with the use of salt or fertilisers during farm operations [42]. Oxygen (O), sulphur (S), and magnesium (Mg) mainly composed the tails of the branched particles (Figure 10d). Soot-like aggregates with smaller sub-units of 20 nm in diameter typically included carbon (C) and oxygen in their structure (Figure 11c). These elements could be derived from organic contamination or dissolved carbonates [23].
Table 2 presents the ammonia concentration measured by ion chromatography in the water samples throughout three months of APA installation in the livestock building in 2024.
The ammonia content was 0.39 ppm at the start of testing and increased to 530 ppm after 83 days. Gaseous ammonia was, therefore, successfully captured in the liquid medium, leading to a substantial emission reduction in the air.

4. Discussion

The aim of this case study was to investigate the effect of a novel air pollution abatement system, filterless and making use of simple tap water, on the ammonia concentration with regard to its practical use in a pig house. FTIR sensors were installed on site by an independent party, and ammonia concentrations were continuously measured in three different locations: indoors, at the APA inlet, and at the APA outlet. Daily variations in ammonia concentrations were observed in both the pig facility and the APA system.
This can be linked to farm operations, ventilation systems, and different animal activity overnight. According to De Sousa et al. [43], diurnal variation of up to 56% in NH3 emissions can, indeed, be explained by animal activity. The highest average ammonia concentration was measured at the APA inlet location point. Lower amounts (about 21% less) were detected indoors near the independent pig unit ventilation fan. This is not surprising given that the airflow rate was efficiently diluted and transported ammonia emissions to the outdoor air, resulting in a reduced ammonia concentration in comparison with the APA inlet. Statistically significant variations in ammonia concentrations were also found when APA units were in use, suggesting that they were beneficial for the ammonia emissions and lowered the total concentrations by up to 98%.
The NH3 removal efficiency reported in the present work study is consistent with that reported in previous studies. While acid scrubbers and slurry acidification systems have been reported to achieve a removal efficiency of up to 99% [17], water scrubbers are often associated with lower efficiencies [34]. However, the former technique is usually associated with stricter safety controls, effluent management, and a greater cost of investment. Based on available public information, the initial investment cost for acid scrubbers ranges from GBP 65,000 to GBP 400,000, and up to GBP 5k per year in running costs [44,45]. The APA system is between 5 and 10 times less expensive than acid scrubbers and slurry acidification systems, whilst delivering similar levels (98%) of removal of NH3 from the environment. Indeed, according to [4], the costs of air-scrubbing techniques range between GBP 1 and GBP 18/kg of NH3 (depending on the animal), while APA costs are estimated to range between GBP 0.15 and 3.1/kg of NH3. However, since APA acts on multiple pollutants in animal housing, the actual cost per single pollutant removed is much less.
Moreover, the cost of acid versus water, based on existing public information, has been quantified as EUR 530 per 1000 m3/h treated [46], against the few pence of the water used in the APA system. Even comparing personnel costs, estimated at EUR 5000/year for the acid scrubber [46], the APA system does not require frequent maintenance, and only in the case of manual water refill, just a few hours per month, equivalent to up to EUR 500/year. Thus, overall, the use of an acid scrubber has a cost due to the acid and related labour, which can be up to seven times higher than the electric power costs. The electricity used by APA per 1000 m3/h treated can be similar or up to 75% lower than that consumed by acid scrubbers.
Additionally, similar to the current water scrubber technology, the wastewater may be valorised by agronomically exploiting its nutrients [17].
At 20 °C, NH3 can dissolve up to 421 g in 1 litre of water [47]. Given the water volumes required for the APA operation (140 L) and current ammonia flow rates (6000 ppm after 88 h of testing), the system will take 369 days before it needs a water change.
The average ventilation rates used in the present study were consistent with those reported in the literature. Feng et al. [30] reported average ventilation rates of 73,799 m3/h and 1646 m3/h for the summer and winter periods, respectively. Similar fluctuations and orders of magnitude were also outlined by Xu [41]. For the APA ON and APA OFF cases, the estimated ammonia emission rates were 0.743 g/day pig−1 and 0.95 g/day pig−1, respectively. Feng found ammonia emission rates between 0.104 g/day pig−1 and 0.322 g/day pig−1 [30]. The ammonia emission rates reported in the present study are in line with the previous studies and within the range of those from the UK guideline [48]. These emission factors were the result of farm procedures, ventilation, feeding strategies, and waste management. The total emission rates were further reduced, up to 40%, when APA was in operation.
Given the current rates of ammonia emissions from livestock housing in the UK (59.5 kt in 2022) [2], considering a 40% average abatement rate and scaling the impact at UK wide scale, it would result in an up to 23.8 kt reduction in NH3 emissions per year, equivalent to 10.5% of the 2022 national estimated NH3 emissions in the UK. Guthrie et al. [4] proposed a conservative estimate of the damage costs caused by ammonia emissions for both the health and biodiversity effects at GBP 2500/t (2018 prices). Monetising the impacts of 23.8 kt of NH3 avoided emissions, this would correspond to a conservative estimate of economic benefit at MGBP 59.5/year (2018 prices) equal to 77.36 M/year in 2025. This figure could potentially go up between 6 and 22 times, considering the impact cost values according to Brink et al. [49] and Holland et al. [50], respectively.
The high ammonia levels in process water samples detected by ion chromatography further support the observed reduction in NH3 emissions when APA was in operation. The gaseous NH3 dissolved in the liquid phase leads to an effective capture of ammonia from the air. The process water containing ammonia can be used as a fertiliser with good agronomic performance [33]. The synthesis of prevalent fertiliser compounds, such as ammonium nitrate and calcium ammonium nitrate, can be achieved by binding captured NH3 to nitrate solutions, reducing the fertiliser costs for farmers [51].
SEM/EDX analysis was conducted to qualitatively examine the morphology and chemical composition of solid contaminants in the process water. These particles were either captured by the APA technology, already in the water, or a result of other chemical reactions. Investigations revealed regular-shaped particles under SEM. The source of these, according to EDX spectroscopy, was likely due to the natural mineral content in the water and to the animal diet [42]. Other particles exhibited a soot-like appearance. Their aggregates were formed of smaller sub-units of 20 nm in size. Entirely amorphous particles were also observed in the samples, with some showing some degree of decomposition under the electron beam. Previous studies [23,42] have also observed crystalline particles and soot-like formations in samples drained from water and animal manure. Zarebska et al. [42] reported undegraded organic matter and multivalent ions in pig slurry. Similarly, inorganic ion concentrations and particulate matter (PM) have also been reported in swine manure [23].
The present study showed that APA technology can also contribute to containing PM pollution of agricultural origin. Both the environment and human health are negatively impacted by PM [52,53]. Smaller nanoparticle sizes, for example, increase the risk of various harmful health effects, including the ability to penetrate the blood–brain barrier [53] and reach the respiratory system [52]. Furthermore, particulate matter, along with carbon dioxide and methane emissions, is considered the most important contributor to global warming and climate change [54]. As a result, APA technology is promising in environmental terms and could play an important role in the near future for PM control from the agricultural sector.

5. Conclusions

In this work, continuous monitoring of ammonia concentrations was carried out in a ventilated pig house during the summer and autumn seasons. The aim was to assess the effect of a novel air pollution abatement system on the ammonia emissions of a livestock farm. The main conclusions can be summarised as follows:
-
Longer-term assessment during continuous operation of the APA system over a 10-week period in 2024 revealed 40% less ammonia emitted into the atmosphere than during the 2023 baseline, with results also validated during the 2024 trial when temporarily switching off the APA system.
-
The APA system, with its simple structure, provides, therefore, an effective technology for high-efficiency ammonia elimination, reducing the overall emissions from the livestock facility. Application on a national scale may lead to an up to 23.8 kt reduction in ammonia emissions from agriculture in the UK, assisting in compliance with air quality regulations and policies. This would result in a conservative economic benefit of GBP 59.5 MGBP/year (2018 prices) corresponding to ~77.36 M/year in 2025.
-
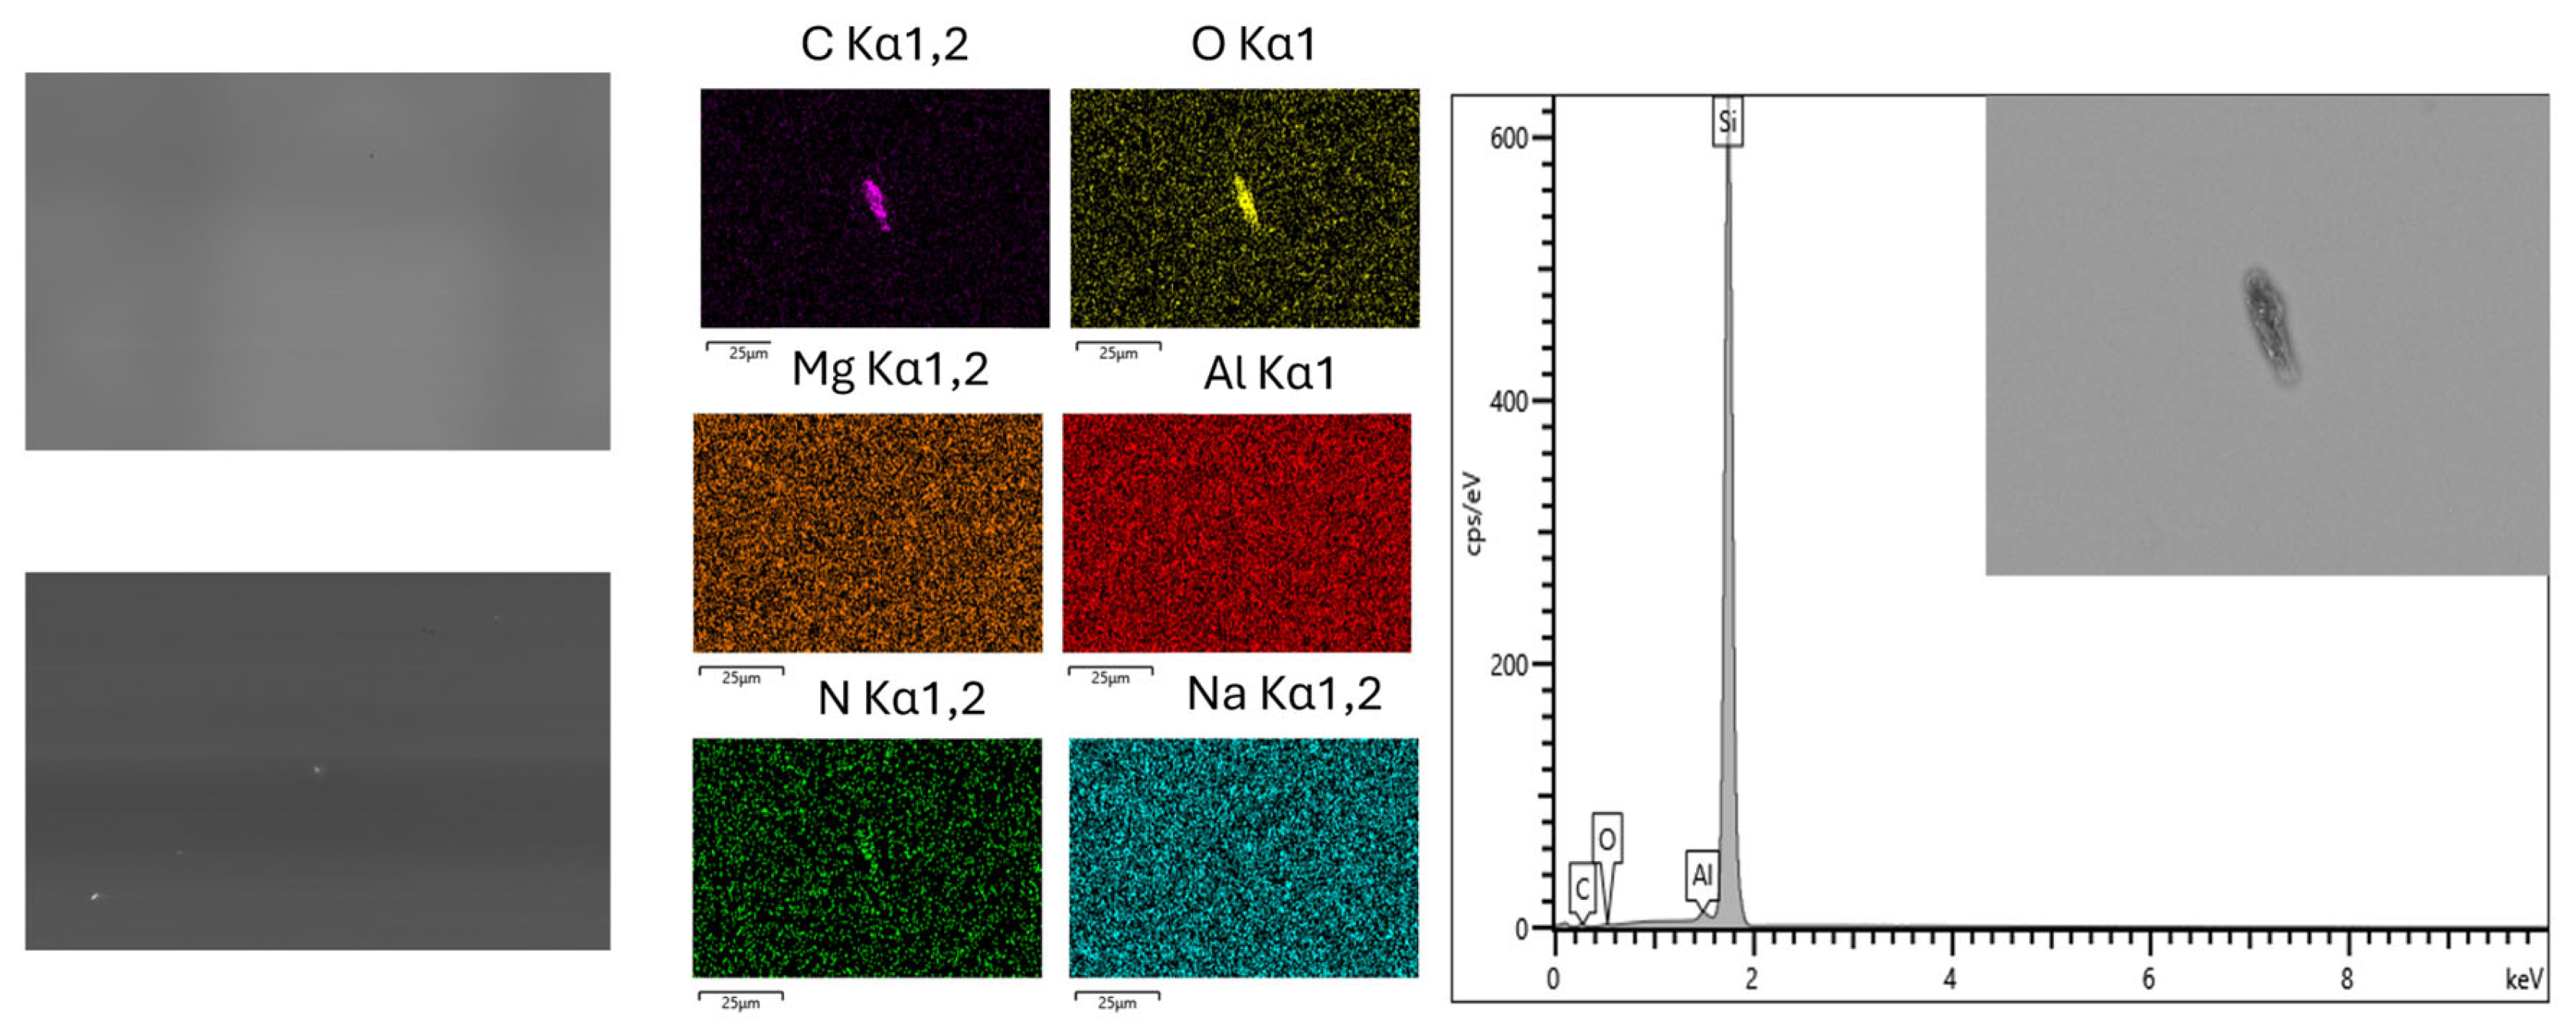
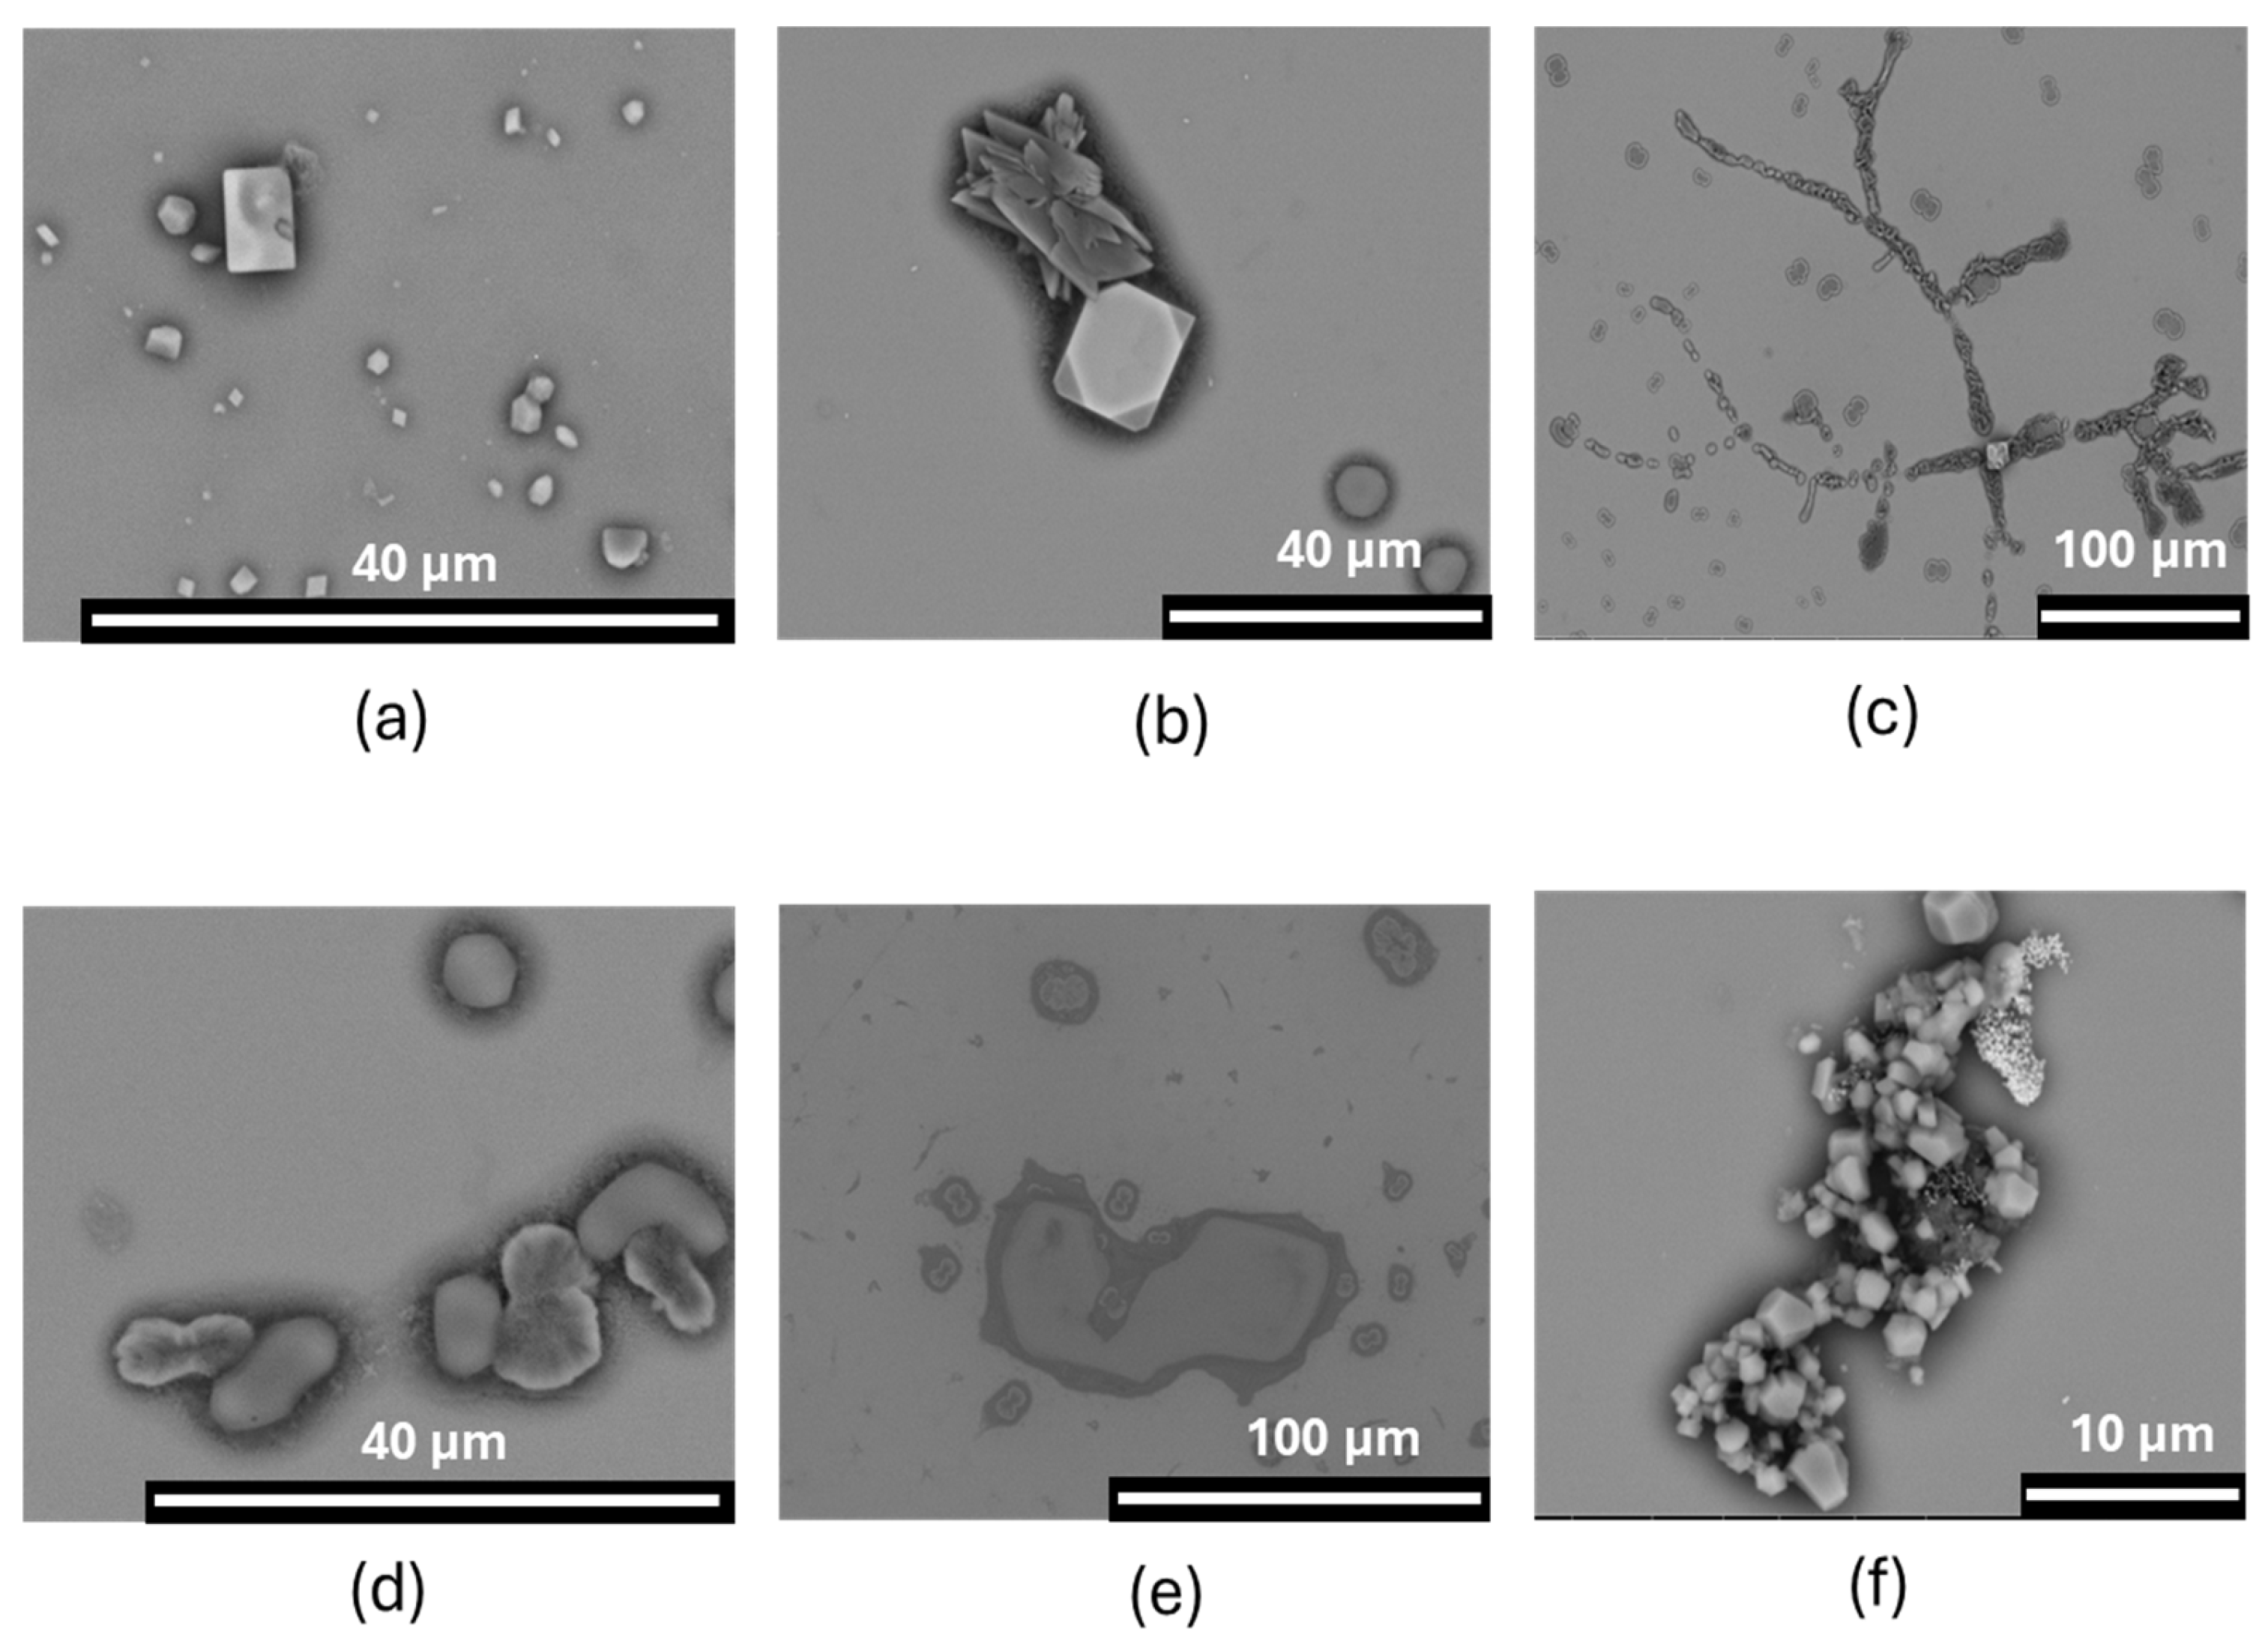
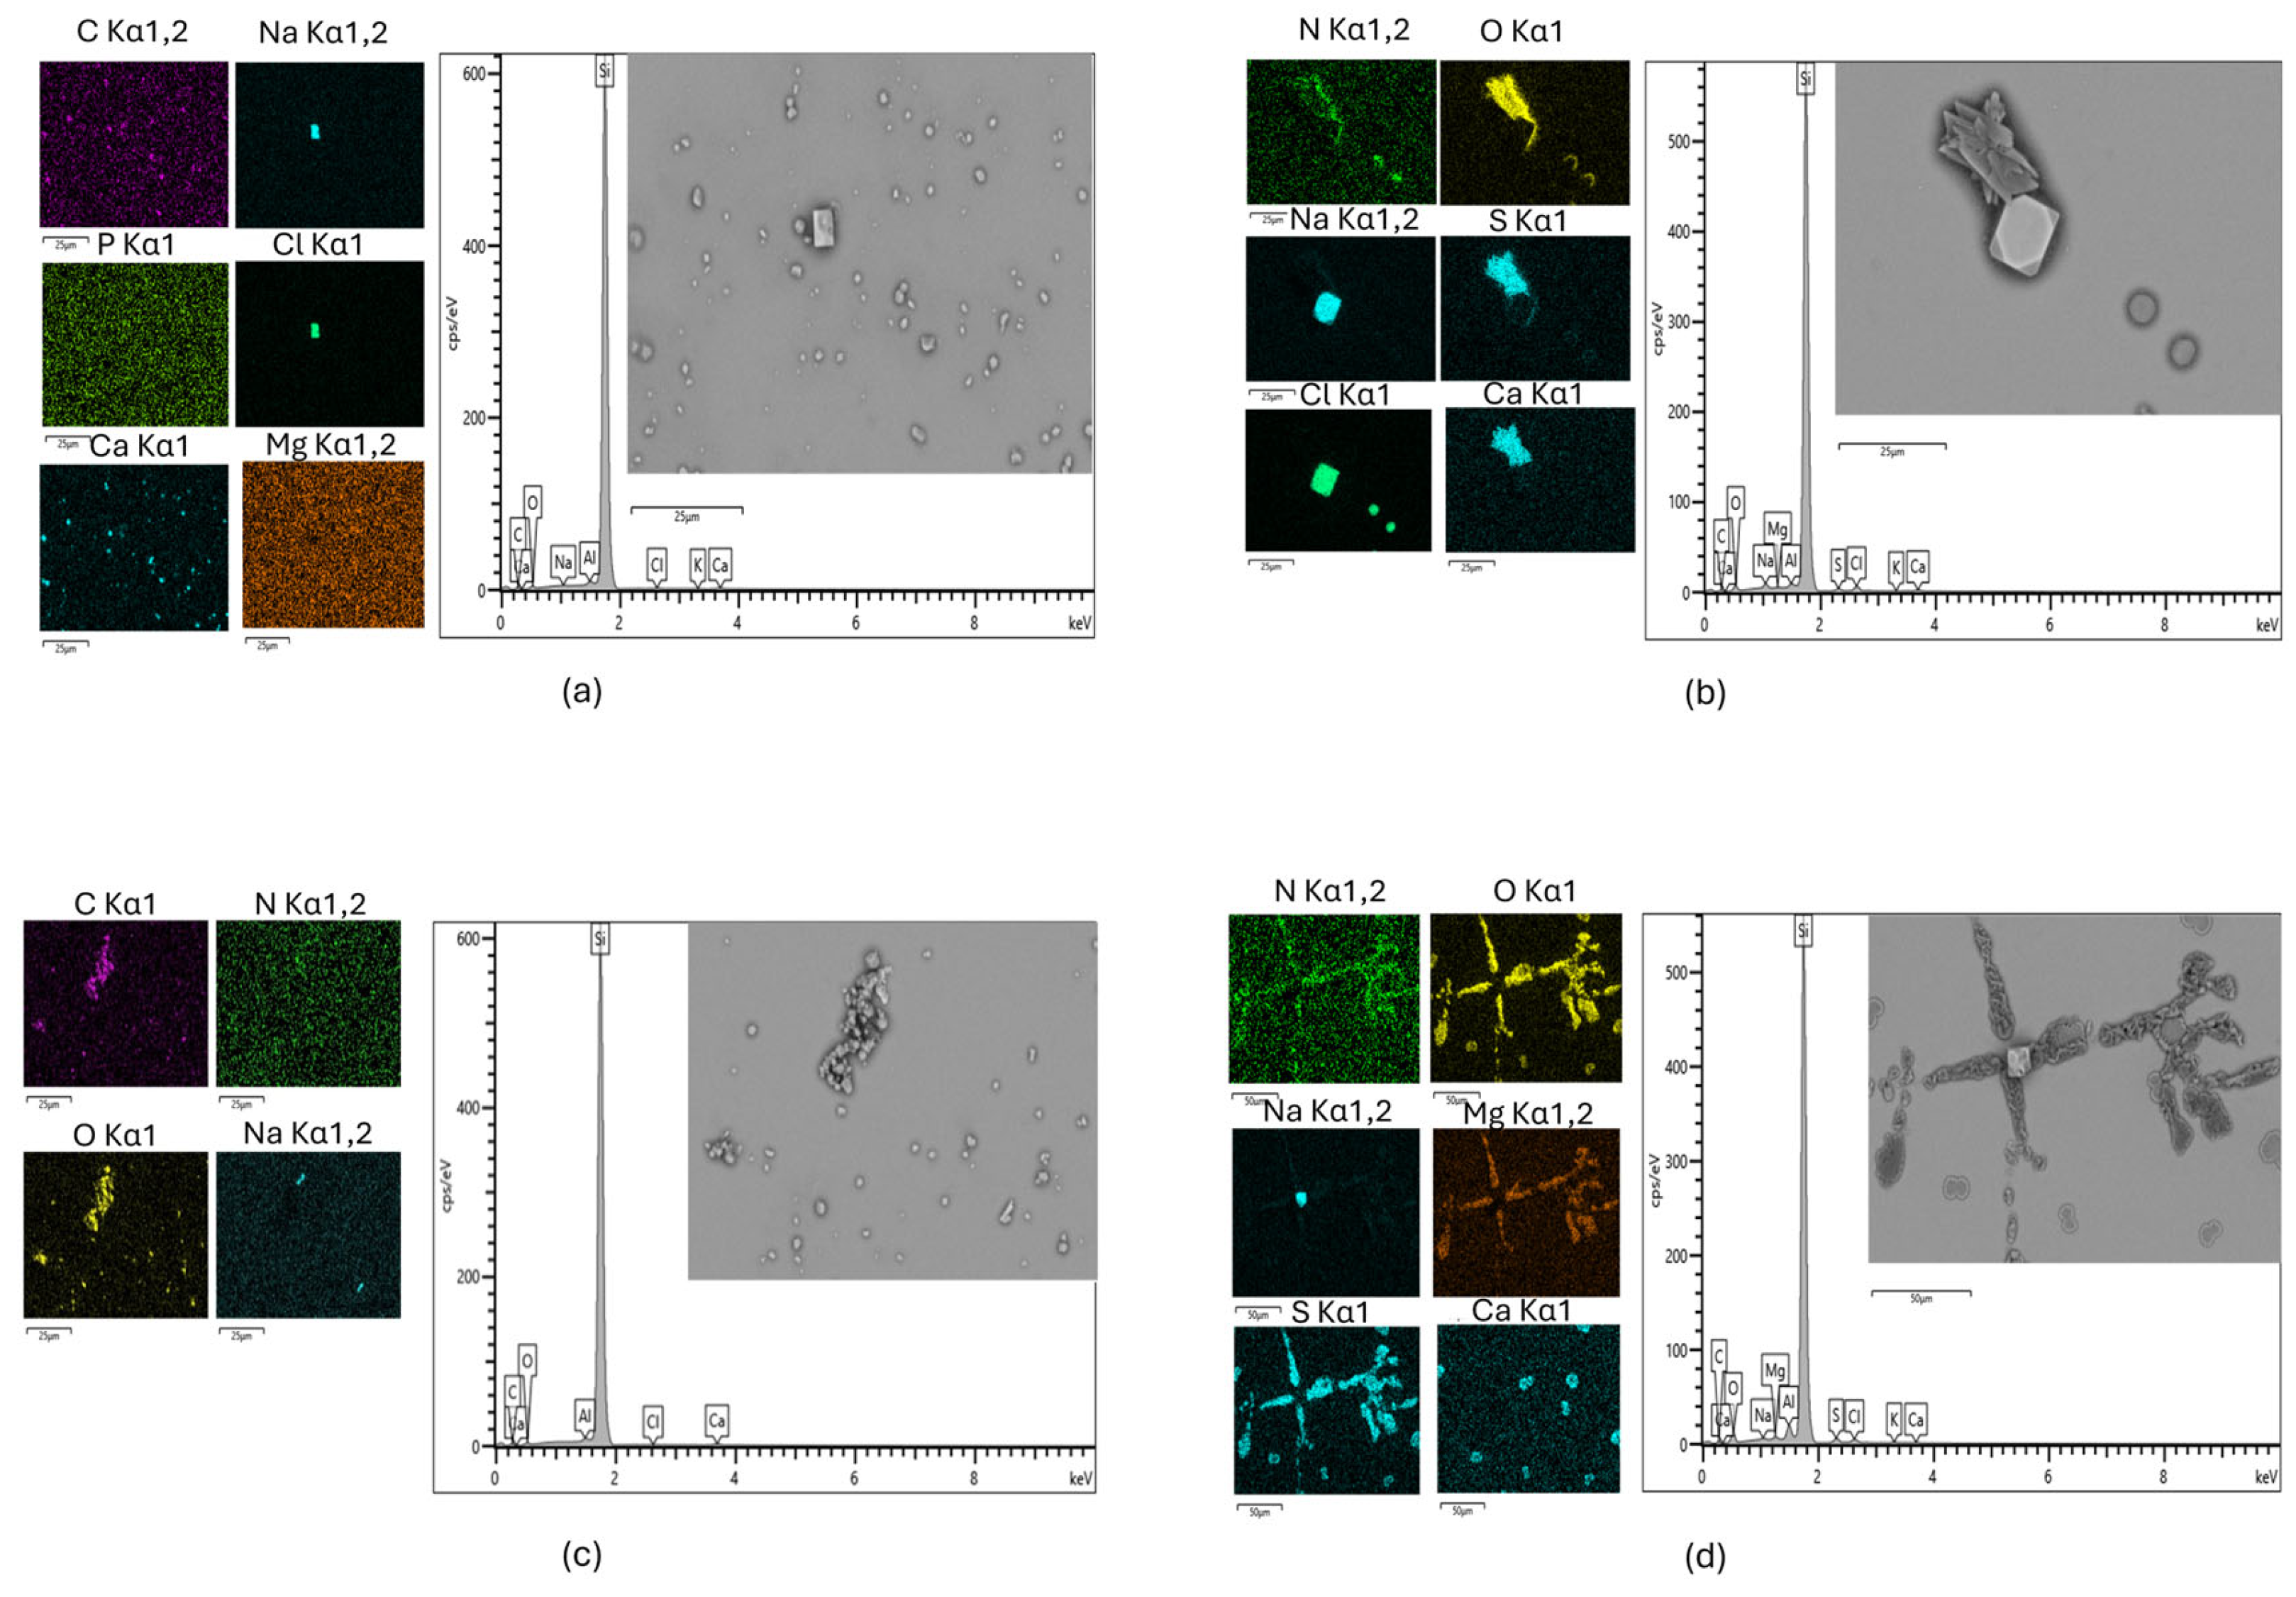
The high ammonia levels in the process water samples detected by ion chromatography supported the observed reduction in NH3 emissions when APA was in operation. Further SEM investigations on water samples revealed soot-like formations, likely due to the natural mineral content in the water and the animal manure. This demonstrates that besides ammonia, the APA system can also remove particulate and organic matter, lowering PM emissions and preventing negative effects on the environment and human health.
-
The APA system allows on-site water treatment and ammonia production, reducing transportation and storage needs. This technology can be effectively used as a polishing step for effective ammonia removal in livestock facilities, preventing ammonia release into the atmosphere and contributing to national NH3 emissions.

Supplementary Materials

The following supporting information can be downloaded at: https://www.mdpi.com/article/10.3390/atmos16070869/s1.

Author Contributions

Conceptualisation, A.P. and A.L.R.; methodology, A.P. and A.L.R.; validation, D.M., F.G. and A.L.R.; formal analysis, A.P.; investigation, A.P. and D.M.; resources, D.M.; data curation, A.L.R. and A.P.; writing—original draft preparation, A.P., F.G. and D.M.; writing—review and editing, A.L.R., F.G. and D.M.; visualisation, A.P.; supervision, A.L.R.; project administration, A.L.R. and D.M. All authors have read and agreed to the published version of the manuscript.

Funding

This research was undertaken as part of the “Filterless and Water-Based Technology for Ammonia Reduction in Agriculture” Project (Project 10109475) for which IGS received funding from Innovate UK under the SBRI competition: Reducing pollution resulting from domestic burning or agricultural practices: Phase 2.

Institutional Review Board Statement

Not applicable.

Informed Consent Statement

Not applicable.

Data Availability Statement

Data are contained within the article and Supplementary Materials.

Acknowledgments

The authors would also like to thank the Nanoscale and Microscale Research Centre (nmRC) of the University of Nottingham for providing access to instrumentation and Ricardo Plc for installing and maintaining the on-site analysers during the two-phase campaign. The authors would also like to thank the IGS colleague John Bardi for his invaluable support during the installation of the APA systems at the farm site and Giuseppe Spanto for his continued support in the technology application.

Conflicts of Interest

The funders had no role in the study design, data collection, and analysis, the decision to publish, or the preparation of the technical and assessment-related parts of this manuscript. Donata Magrin and Fabio Galatioto are directors and owners of Iscleanair Global Solutions-IGS Ltd. APA is a fully patented technology developed by ISCLEANAIR Italia Srl that Iscleanair Global Solutions-IGS Ltd. can test and further develop in virtue of a License, Technology, and Collaboration Agreement between the parties.

References

  1. Mielcarek-Bocheńska, P.; Rzeźnik, W. Reducing Ammonia Emissions in Polish Agriculture, the Implementation of the NEC Directive, and the Context of Sustainable Development—Pilot Studies. Sustainability 2024, 16, 7145. [Google Scholar] [CrossRef]
  2. Carswell, A.M.; Gilhespy, S.L.; Cardenas, L.M.; Anthony, S.G. Inventory of Ammonia Emissions from UK Agriculture 2022. 2024. Available online: https://uk-air.defra.gov.uk/assets/documents/reports/cat07/2407301154_UK_Agriculture_Ammonia_Emission_Report_1990-2022_23072024.pdf (accessed on 4 March 2025).
  3. Philippe, F.-X.; Cabaraux, J.-F.; Nicks, B. Ammonia emissions from pig houses: Influencing factors and mitigation techniques. Agric. Ecosyst. Environ. 2011, 141, 245–260. [Google Scholar] [CrossRef]
  4. Guthrie, S.; Giles, S.; Dunkerley, F.; Tabaqchali, H.; Harshfield, A.; Ioppolo, B.; Manville, C. The Impact of Ammonia Emissions from Agriculture on Biodiversity; RAND Corporation and The Royal Society: Cambridge, UK, 2018. [Google Scholar]
  5. Wyer, K.E.; Kelleghan, D.B.; Blanes-Vidal, V.; Schauberger, G.; Curran, T.P. Ammonia emissions from agriculture and their contribution to fine particulate matter: A review of implications for human health. J. Environ. Manag. 2022, 323, 116285. [Google Scholar] [CrossRef] [PubMed]
  6. Health and Safety Executive. EH40/2005 Workplace Exposure Limits; Containing the List of Workplace Exposure Limits for Use with the Control of Substances Hazardous to Health Regulations 2002 (as Amended); Health and Safety Executive: Bootle, UK, 2020. [Google Scholar]
  7. Tang, Y.S.; Braban, C.F.; Dragosits, U.; Dore, A.J.; Simmons, I.; van Dijk, N.; Poskitt, J.; Dos Santos Pereira, G.; Keenan, P.O.; Conolly, C. Drivers for spatial, temporal and long-term trends in atmospheric ammonia and ammonium in the UK. Atmos. Chem. Phys. 2018, 18, 705–733. [Google Scholar] [CrossRef]
  8. Hassouna, M.; Eglin, T.; Cellier, P.; Colomb, V.; Cohan, J.-P.; Decuq, C.; Delabuis, M.; Edouard, N.; Espagnol, S.; Eugène, M. Measuring Emissions from Livestock Farming: Greenhouse Gases, Ammonia and Nitrogen Oxides; INRA-ADEME: Paris, France, 2016. [Google Scholar]
  9. Wagner, S.; Angenendt, E.; Beletskaya, O.; Zeddies, J. Assessing ammonia emission abatement measures in agriculture: Farmers’ costs and society’s benefits–A case study for Lower Saxony, Germany. Agric. Syst. 2017, 157, 70–80. [Google Scholar] [CrossRef]
  10. Updyke, K.M.; Nguyen, T.B.; Nizkorodov, S.A. Formation of brown carbon via reactions of ammonia with secondary organic aerosols from biogenic and anthropogenic precursors. Atmos. Environ. 2012, 63, 22–31. [Google Scholar] [CrossRef]
  11. World Health Organization. Air Quality Guidelines: Global Update 2005: Particulate Matter, Ozone, Nitrogen Dioxide, and Sulfur Dioxide; World Health Organization: Geneva, Switzerland, 2006. [Google Scholar]
  12. Sheppard, L.J.; Leith, I.D.; Mizunuma, T.; Neil Cape, J.; Crossley, A.; Leeson, S.; Sutton, M.A.; van Dijk, N.; Fowler, D. Dry deposition of ammonia gas drives species change faster than wet deposition of ammonium ions: Evidence from a long-term field manipulation. Glob. Change Biol. 2011, 17, 3589–3607. [Google Scholar] [CrossRef]
  13. Kim, S.W.; Gormley, A.; Jang, K.B.; Duarte, M.E. Current status of global pig production: An overview and research trends. Anim. Biosci. 2023, 37, 719. [Google Scholar]
  14. UK Government. £3m Support Scheme Launched to Reduce Air Pollution from Farming. 2018. Available online: https://www.gov.uk/government/news/3m-support-scheme-launched-to-reduce-air-pollution-from-farming (accessed on 28 March 2025).
  15. Giner, S.G.; Georgitzikis, K.; Scalet, B.M.; Montobbio, P.; Roudier, S.; Delgado, S.L. Best Available Techniques (BAT) Reference Document for the Intensive Rearing of Poultry or Pigs. Industrial Emissions Directive 2010/75/EU (Integrated Pollution Prevention and Control); European Commission: Brussels, Belgium, 2017. [Google Scholar]
  16. Melse, R.W. Air Treatment Techniques for Abatement of Emissions from Intensive Livestock Production; Wageningen University and Research: Wageningen, The Netherlands, 2009. [Google Scholar]
  17. Costantini, M.; Bacenetti, J.; Coppola, G.; Orsi, L.; Ganzaroli, A.; Guarino, M. Improvement of human health and environmental costs in the European Union by air scrubbers in intensive pig farming. J. Clean. Prod. 2020, 275, 124007. [Google Scholar] [CrossRef]
  18. Moore, P.A., Jr.; Li, H.; Burns, R.; Miles, D.; Maguire, R.; Ogejo, J.; Reiter, M.S.; Buser, M.D.; Trabue, S. Development and testing of the ARS air scrubber: A device for reducing ammonia emissions from animal rearing facilities. Front. Sustain. Food Syst. 2018, 2, 23. [Google Scholar] [CrossRef]
  19. Conti, C.; Costantini, M.; Fusi, A.; Manzardo, A.; Guarino, M.; Bacenetti, J. Environmental impact of pig production affected by wet acid scrubber as mitigation technology. Sustain. Prod. Consum. 2021, 28, 580–590. [Google Scholar] [CrossRef]
  20. EEA, A.P.F.S., European Environmental Agency. 2014. Available online: https://www.google.com/search?q=Air+pollution+fact+sheet+2014+-+European+Environment+Agency&oq=Air+pollution+fact+sheet+2014+-+European+Environment+Agency&gs_lcrp=EgZjaHJvbWUyBggAEEUYOTIGCAEQRRg80gEIMTE4NGowajSoAgCwAgE&sourceid=chrome&ie=UTF-8 (accessed on 5 May 2025).
  21. Shen, D.; Wu, S.; Li, Z.; Tang, Q.; Dai, P.; Li, Y.; Li, C. Distribution and physicochemical properties of particulate matter in swine confinement barns. Environ. Pollut. 2019, 250, 746–753. [Google Scholar] [CrossRef] [PubMed]
  22. Cambra-López, M.; Torres, A.; Aarnink, A.J.A.; Ogink, N.W. Source analysis of fine and coarse particulate matter from livestock houses. Atmos. Environ. 2011, 45, 694–707. [Google Scholar] [CrossRef]
  23. Marcato, C.E.; Pinelli, E.; Pouech, P.; Winterton, P.; Guiresse, M. Particle size and metal distributions in anaerobically digested pig slurry. Bioresour. Technol. 2008, 99, 2340–2348. [Google Scholar] [CrossRef]
  24. Patterson, P. Management strategies to reduce air emissions: Emphasis—Dust and ammonia. J. Appl. Poult. Res. 2005, 14, 638–650. [Google Scholar] [CrossRef]
  25. Van Devener, B.; Anderson, S.L. Breakdown and combustion of JP-10 fuel catalyzed by nanoparticulate CeO2 and Fe2O3. Energy Fuels 2006, 20, 1886–1894. [Google Scholar] [CrossRef]
  26. Hu, Y.; Schmidhalter, U. Urease inhibitors: Opportunities for meeting EU national obligations to reduce ammonia emission ceilings by 2030 in EU countries. Environ. Res. Lett. 2021, 16, 084047. [Google Scholar] [CrossRef]
  27. van Grinsven, H.J.; van Dam, J.D.; Lesschen, J.P.; Timmers, M.H.; Velthof, G.L.; Lassaletta, L. Reducing external costs of nitrogen pollution by relocation of pig production between regions in the European Union. Reg. Environ. Change 2018, 18, 2403–2415. [Google Scholar] [CrossRef]
  28. Giannadaki, D.; Giannakis, E.; Pozzer, A.; Lelieveld, J. Estimating health and economic benefits of reductions in air pollution from agriculture. Sci. Total Environ. 2018, 622, 1304–1316. [Google Scholar] [CrossRef]
  29. Giannakis, E.; Kushta, J.; Bruggeman, A.; Lelieveld, J. Costs and benefits of agricultural ammonia emission abatement options for compliance with European air quality regulations. Environ. Sci. Eur. 2019, 31, 93. [Google Scholar] [CrossRef]
  30. Feng, K.; Wang, Y.; Hu, R.; Xiang, R. Continuous Measurement of Ammonia at an Intensive Pig Farm in Wuhan, China. Atmosphere 2022, 13, 442. [Google Scholar] [CrossRef]
  31. Payraudeau, S.; Van der Werf, H.M.; Vertès, F. Analysis of the uncertainty associated with the estimation of nitrogen losses from farming systems. Agric. Syst. 2007, 94, 416–430. [Google Scholar] [CrossRef]
  32. UK Historical Weather. Available online: https://www.wunderground.com/history (accessed on 4 July 2025).
  33. Martin, J.W.; Moore, P.A., Jr.; Li, H.; Ashworth, A.J.; Miles, D.M. Effects of Land-Applied Ammonia Scrubber Solutions on Yield, Nitrogen Uptake, Soil Test Phosphorus, and Phosphorus Runoff. J. Environ. Qual. 2018, 47, 263–269. [Google Scholar] [CrossRef] [PubMed]
  34. Van der Heyden, C.; Demeyer, P.; Volcke, E.I. Mitigating emissions from pig and poultry housing facilities through air scrubbers and biofilters: State-of-the-art and perspectives. Biosyst. Eng. 2015, 134, 74–93. [Google Scholar] [CrossRef]
  35. Haque, M.; Cornou, C.; Madsen, J. Estimation of methane emission using the CO2 method from dairy cows fed concentrate with different carbohydrate compositions in automatic milking system. Livest. Sci. 2014, 164, 57–66. [Google Scholar] [CrossRef]
  36. Haque, M.N.; Hansen, H.H.; Storm, I.M.; Madsen, J. Comparative methane estimation from cattle based on total CO2 production using different techniques. Anim. Nutr. 2017, 3, 175–179. [Google Scholar] [CrossRef]
  37. Zhuang, S.; Van Overbeke, P.; Vangeyte, J.; Sonck, B.; Demeyer, P. Evaluation of a cost-effective ammonia monitoring system for continuous real-time concentration measurements in a fattening pig barn. Sensors 2019, 19, 3669. [Google Scholar] [CrossRef]
  38. Scottish Farm Buildings Investigation Unit. Report of Working Group on Climatization of Animal Houses; Scottish Farm Buildings Investigation Unit: Aberdeen, UK, 1984. [Google Scholar]
  39. McKnight, P.E.; Najab, J. Mann-Whitney U Test. In The Corsini encyclopedia of psychology; Wiley: Hoboken, NJ, USA, 2010; p. 1. [Google Scholar]
  40. Pedersen, S. The influence of diurnal variation in animal activity and digestion on animal heat production. Agric. Eng. Int. CIGR J. 2015, 18–29. [Google Scholar]
  41. Xu, W.; Zheng, K.; Liu, X.; Meng, L.; Huaitalla, R.M.; Shen, J.; Hartung, E.; Gallmann, E.; Roelcke, M.; Zhang, F. Atmospheric NH3 dynamics at a typical pig farm in China and their implications. Atmos. Pollut. Res. 2014, 5, 455–463. [Google Scholar] [CrossRef]
  42. Zarebska, A.; Nieto, D.R.; Christensen, K.V.; Norddahl, B. Ammonia recovery from agricultural wastes by membrane distillation: Fouling characterization and mechanism. Water Res. 2014, 56, 1–10. [Google Scholar] [CrossRef]
  43. de Sousa, P.; Pedersen, S. Ammonia emission from fattening pig houses in relation to animal activity and carbon dioxide production. Agric. Eng. Int. CIGR J. 2004, 6, BC04 003. [Google Scholar]
  44. Feature: Mitigating Ammonia Emissions—Reduction Priorities and Practical on-Farm Solutions. Available online: https://www.pig-world.co.uk/features/emissions-reduction-priorities-and-practical-on-farm-solutions.html (accessed on 5 July 2025).
  45. Advice on Cutting Ammonia Emissions on Poultry Farms. Available online: https://www.fwi.co.uk/livestock/poultry/advice-on-cutting-ammonia-emissions-on-poultry-farms (accessed on 5 July 2025).
  46. Acid Scrubber. Available online: https://emis.vito.be/en/bat/tools-overview/sheets/acid-scrubber#:~:text=Energy%20use%20lies%20between%200.2,EUR%20per%201000%20m%C2%B3/h (accessed on 4 July 2025).
  47. World Health Organization. Ammonia in Drinking-Water; Background Document for Development of WHO Guidelines for Drinking-Water Quality; World Health Organization: Geneva, Switzerland, 2003. [Google Scholar]
  48. Environment Agency. Ammonia Emission Factors for Pig and Poultry Screening, Modelling and Reporting. 2024. Available online: https://www.gov.uk/guidance/ammonia-emission-factors-for-pig-and-poultry-screening-modelling-and-reporting#full-publication-update-history (accessed on 4 March 2025).
  49. Brink, C.; Van Grinsven, H.; Jacobsen, B.H.; Rabl, A.; Gren, M.; Holland, M.; Klimont, Z.; Hicks, K.; Brouwer, R.; Dickens, R. Costs and benefits of nitrogen in the environment. In The European Nitrogen Assessment; Cambridge University Press: Cambridge, UK, 2011; pp. 513–540. [Google Scholar]
  50. Holland, M.; Watkiss, P.; Pye, S.; de Oliveria, A.; Van Regemorter, D. Cost-benefit analysis of the thematic strategy on air pollution. In Service Contract for Carrying out Cost-Benefit Analysis of Air Quality Related Issues, in particular in the Clean Air for Europe (CAFE) Programme; AEAT/ED48763001/Thematic Strategy; AEA Technology Environment: Didcot, UK, 2005. [Google Scholar]
  51. Cowan, N.; Ashwood, D.; Drewer, J.; Toteva, G.; Heal, M.R. A low-tech, low-cost method to capture point-source ammonia emissions and their potential use as a nitrogen fertiliser. PLoS ONE 2024, 19, e0296679. [Google Scholar] [CrossRef]
  52. Broday, D.M.; Rosenzweig, R. Deposition of fractal-like soot aggregates in the human respiratory tract. J. Aerosol Sci. 2011, 42, 372–386. [Google Scholar] [CrossRef]
  53. Heidari Nejad, S.; Takechi, R.; Mullins, B.J.; Giles, C.; Larcombe, A.N.; Bertolatti, D.; Rumchev, K.; Dhaliwal, S.; Mamo, J. The effect of diesel exhaust exposure on blood–brain barrier integrity and function in a murine model. J. Appl. Toxicol. 2015, 35, 41–47. [Google Scholar] [CrossRef]
  54. Adachi, K.; Buseck, P. Internally mixed soot, sulfates, and organic matter in aerosol particles from Mexico City. Atmos. Chem. Phys. 2008, 8, 6469–6481. [Google Scholar] [CrossRef]
Figure 1. (a) Isometric and (b) top views of farm, including ventilation, air pollution abatement (APA) system, and ammonia measuring locations.
Atmosphere 16 00869 g001
Figure 2. (a) APA unit and (b) schematic working principle.
Atmosphere 16 00869 g002
Figure 3. Sample preparation procedure for SEM analysis.
Atmosphere 16 00869 g003
Figure 4. Weekly average ammonia concentrations during (a) 2023; (b) 2024 experimental campaigns and (c) average abatement rate when APA is ON Week 9 in both campaigns was used to test the APA system: on during the baseline and off during the 2024 trial.
Atmosphere 16 00869 g004
Figure 5. Temporal variation in ammonia emissions (a) indoor and (b) across the APA system.
Atmosphere 16 00869 g005
Figure 6. (a) Cumulative ammonia concentrations indoors and (b) average ammonia reduction when APA was in use.
Atmosphere 16 00869 g006
Figure 7. Box plot of the hourly ammonia concentrations indoors: (a) APA ON; (b) APA OFF.
Atmosphere 16 00869 g007
Figure 8. Twenty-point moving average of the ammonia emission factors over time: APA ON vs. APA OFF.
Atmosphere 16 00869 g008
Figure 9. SEM/EDX analysis on the surface of a silicon wafer (no contamination).
Atmosphere 16 00869 g009
Figure 10. SEM pictures of the water samples under investigation. (a,b) regular shape particles; (c) branched structures; (d,e) amorphous particles; and (f) soot-like formation.
Atmosphere 16 00869 g010
Figure 11. SEM pictures of ammonia water samples. (a,b) Regular-shaped particles; (c) soot-like particle; and (d) branched particles.
Atmosphere 16 00869 g011
Table 1. Ammonia concentrations at the different monitoring locations (ppm). STD, Max., and Min. stand for standard deviation, maximum, and minimum values, respectively.
IndoorsAPA InletAPA Outlet
APA ONAPA OFFAPA ONAPA OFFAPA ONAPA OFF
Mean3.414.335.050.100.100.11
STD0.590.901.940.080.030.02
Max.–Min.8.9–2.613.3–2.99.5–0.10.6–00.2–00.17–0
Data points12721288117686612721273
Table 2. Ammonia concentrations in water samples detected by ion chromatography analysis.
SampleAmmonia
(ppm)
Time
(days)
Sample A0.390
Sample B1410
Sample C14038
Sample D14038
Sample E19048
Sample F12060
Sample G15068
Sample H20076
Sample I21080
Sample L53083
Disclaimer/Publisher’s Note: The statements, opinions and data contained in all publications are solely those of the individual author(s) and contributor(s) and not of MDPI and/or the editor(s). MDPI and/or the editor(s) disclaim responsibility for any injury to people or property resulting from any ideas, methods, instructions or products referred to in the content.

