Article

Assessing the Combined Influence of Indoor Air Quality and Visitor Flow Toward Preventive Conservation at the Peggy Guggenheim Collection

by
Maria Catrambone
1,*,
Emiliano Cristiani
2,
Cristiano Riminesi
3,
Elia Onofri
4 and
Luciano Pensabene Buemi
5
1
Istituto di Scienze del Patrimonio Culturale, Consiglio Nazionale delle Ricerche, Monterotondo St., 00015 Rome, Italy
2
Istituto per le Applicazioni del Calcolo, Consiglio Nazionale delle Ricerche, 00185 Rome, Italy
3
Istituto di Scienze del Patrimonio Culturale, Consiglio Nazionale delle Ricerche, Sesto Fiorentino, 50019 Florence, Italy
4
Istituto per le Applicazioni del Calcolo, Consiglio Nazionale delle Ricerche, 80131 Naples, Italy
5
Conservation Department, Peggy Guggenheim Collection, 30123 Venice, Italy
*
Author to whom correspondence should be addressed.
Atmosphere 2025, 16(7), 860; https://doi.org/10.3390/atmos16070860
Submission received: 13 June 2025 / Revised: 8 July 2025 / Accepted: 10 July 2025 / Published: 15 July 2025
(This article belongs to the Section Air Quality)

Abstract

The study at the Peggy Guggenheim Collection in Venice highlights critical interactions between indoor air quality, visitor dynamics, and microclimatic conditions, offering insights into preventive conservation of modern artworks. By analyzing pollutants such as ammonia, formaldehyde, and organic acids, alongside visitor density and environmental data, the research identified key patterns and risks. Through three seasonal monitoring campaigns, the concentrations of SO2 (sulphur dioxide), NO (nitric oxide), NO2 (nitrogen dioxide), NOx (nitrogen oxides), HONO (nitrous acid), HNO3 (nitric acid), O3 (ozone), NH3 (ammonia), CH3COOH (acetic acid), HCOOH (formic acid), and HCHO (formaldehyde) were determined using passive samplers, as well as temperature and relative humidity data loggers. In addition, two specific short-term monitoring campaigns focused on NH3 were performed to evaluate the influence of visitor presence on indoor concentrations of the above compounds and environmental parameters. NH3 and HCHO concentrations spiked during high visitor occupancy, with NH3 levels doubling in crowded periods. Short-term NH3 campaigns confirmed a direct correlation between visitor numbers and the above indoor concentrations, likely due to human emissions (e.g., sweat, breath) and off-gassing from materials. The indoor/outdoor ratios indicated that several pollutants originated from indoor sources, with ammonia and acetic acid showing the highest indoor concentrations. By measuring the number of visitors and microclimate parameters (temperature and humidity) every 3 s, we were able to precisely estimate the causality and the temporal shift between these quantities, both at small time scale (a few minute delay between peaks) and at medium time scale (daily average conditions due to the continuous inflow and outflow of visitors).

1. Introduction

Museums play a vital role in preserving cultural heritage, and effective environmental monitoring is essential to support this mission. Among the various factors influencing the conservation of artworks and historical artifacts, indoor air quality (IAQ) and visitor-related impacts are particularly critical. Art objects are highly sensitive to environmental fluctuations—including changes in temperature (T) and relative humidity (RH), as well as the presence of airborne pollutants such as particulate matter (PM), SO2, NOx, and volatile organic compounds (VOCs)—and can induce irreversible chemical and physical degradation [1,2].
The conservation of contemporary paintings within museum environments has become an increasingly pressing issue, due in part to the widespread use of modern materials, which are often more chemically unstable and reactive than those employed in traditional artworks. Post-mid-20th-century paintings frequently incorporate synthetic binders, modern pigments, and mixed media, all of which are highly susceptible to degradation under environmental stressors, particularly gaseous pollutants [3,4].
While visitors are integral to a museum’s educational and public engagement goals, they also contribute to fluctuations in indoor environmental conditions. Human respiration increases CO2 levels and humidity, while their movement resuspends settled dust and particles. Research has shown that peak visitor periods are associated with elevated concentrations of CO2 and VOCs, potentially compromising both the preservation of art collections and the comfort of occupants [5,6]. Although CO2 itself is not directly harmful to artifacts, elevated levels often signal poor ventilation and correlate with increases in T and RH.
Indoor air pollutants originate from both external and internal sources and pose significant threats to long-term conservation. Particulate matter may enter from outdoors via ventilation systems, open windows, and nearby construction sites, and it may also be generated internally through heating, ventilation and air conditioning (HVAC) operations, and visitor activity. These particles can settle on surfaces, leading to soiling, abrasion, and contamination by corrosive substances [7]. The study [8] found that although larger respiratory droplets can travel through air handling systems, their size and concentration are substantially reduced after filtration, with only a few oral droplets remaining in the air stream.
VOCs, such as formaldehyde and acetic acid, are emitted from building materials, adhesives, wooden display cases, and conservation products. These compounds can corrode metals, weaken paper-based materials, and contribute to the fading and embrittlement of sensitive artworks over time [9,10]. Outdoor sources of VOCs and associated acids include photochemical oxidation, vegetation, biomass combustion, and fossil fuel use [11]. Within museums, key indoor sources include display cases and wooden frames (for acidic emissions), as well as carpets, textiles, surface coatings, and particleboard materials (for formaldehyde) [12].
Other harmful pollutants such as SO2 and NOx, mainly derived from vehicular and industrial emissions, can infiltrate museum interiors in the absence of adequate filtration, promoting acidic reactions that deteriorate paper, textiles, and metals [13]. O3 also poses a significant threat, inducing oxidative degradation that causes fading and cracking in organic materials, including modern synthetic binders and certain acrylic resins commonly found in contemporary artworks [14,15]. While outdoor pollutants can penetrate museum spaces through HVAC systems and building envelopes, indoor sources such as cleaning products, construction materials, and human occupancy also contribute substantially to indoor pollution loads [13,16].
Regarding a more detailed relationship between visitor flows and microclimate parameters such as T and RH, the amount of information available in the literature is scarcer. On the one hand, it is well known that people are natural sources of heat and water vapor [6,17], but on the other hand, quantifying the impact of moving people inside a museum environment is a difficult task. Early approaches typically rely on a static framework (i.e., people are staying still for a certain amount of time); see, e.g., [18,19]. A nice preliminary attempt to consider time-varying effect of visitors can be found in [20]. Similarly, the work [21] puts in relation peaks of presences with those of T and RH. Finally, let us mention the works [22,23], which note that the comfort of visitors (in terms of combined T and RH) is often in contradiction with the best conservation conditions of artworks, which could be, in turn, in contradiction with energy consumption requirements. It is then necessary to find the best compromise among all needs, which is a complicated task that might benefit ad hoc indicators.
Visitor flows significantly impact microclimate parameters in museums, primarily affecting T and RH. These changes pose conservation challenges while highlighting the need to balance public access with environmental control [1,24,25]. The presence of visitors increases the indoor T due to their body heat and activity. The more people present, the greater the heat gain, which can lead to significant short-term fluctuations, especially during peak visiting hours or special events [26,27,28]. Visitors also contribute moisture to the air through breathing and perspiration. As visitor density rises, so does the RH. These increases can be abrupt and may exceed the optimal range for artifact preservation, particularly in spaces without advanced climate control systems [29].
The impact of visitors is not uniform throughout the museum. Localized areas, especially those with poor air circulation or where visitors congregate, may experience more pronounced changes in microclimate parameters. Short-term spikes in T and RH often occur during large events or high-traffic periods, while recovery to baseline conditions depends on the efficiency of the museum’s HVAC and ventilation systems [29].

Aim of the Work

The aim of this study was to assess the correlation between IAQ and visitor presence at the Peggy Guggenheim Collection in Venice, with a view to supporting preventive conservation strategies. Comprehensive environmental monitoring campaigns were conducted over multiple seasons, including measurements of gaseous pollutants, T, and RH.
This study aimed to determine how visitor flow influences microclimatic conditions and pollutant concentrations within exhibition spaces. The ultimate objective was to provide insights into how human occupancy affects the preservation environment for sensitive contemporary artworks and explore the potential for integrating visitor tracking data into environmental management practices within museums.
In contrast to previous studies, we did not consider visitors as static sources of heat and water vapor. Instead, we considered the incessant flow of visitors who enter and exit the rooms during all opening hours, leading to continuous fluctuations in microclimates. Also, and more importantly, we were able to quantify the temporal shift between visitor flow and subsequent changes in microclimate parameters, actually observing two concurrent dynamics: at small scale (<10 min), one can see that a peak in the number of visitors first leads to a well determined peak in the RH, and, after that, to a peak in T; at medium scale (<10 h), one can see that the average occupancy of visitors still affects the average T and RH, but through a more complex dynamics. Note that the quantification of the temporal shift is crucial for devising dynamic, possibly visitor-aware, strategies for the HVAC system.

2. Materials and Methods

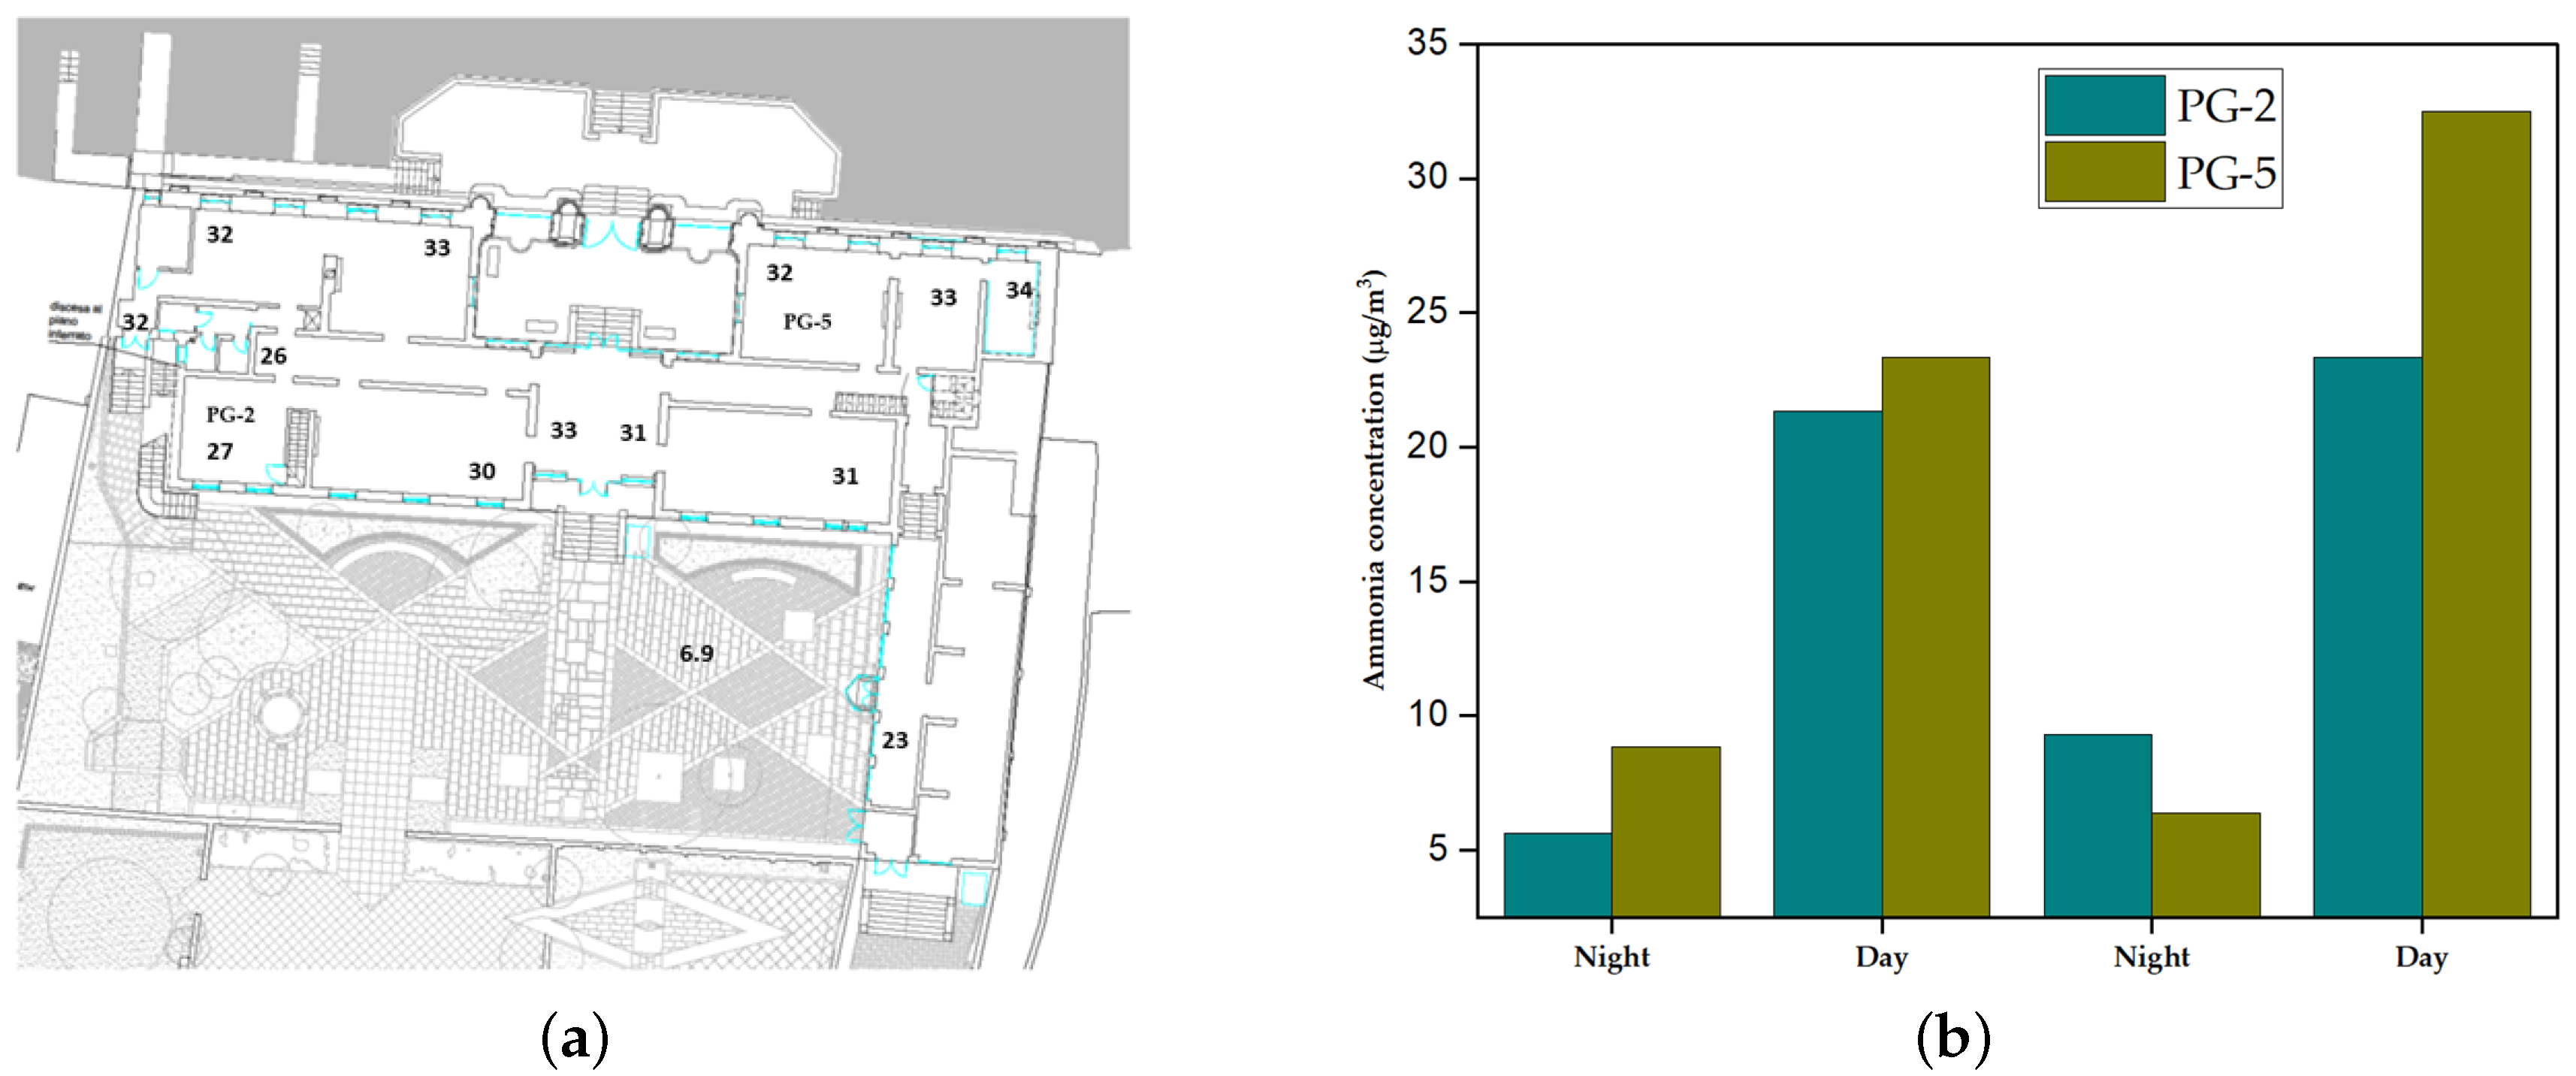
2.1. The Peggy Guggenheim Collection in Venice: Strategy and Planning for Monitoring

The Peggy Guggenheim Collection in Venice is one of the most significant and esteemed collections of modern art in the world. Situated within the historic Palazzo Venier dei Leoni, an architectural gem overlooking the Grand Canal, the collection houses a representative selection of the foremost artistic avantgardes of the twentieth century. Notably, it is distinguished by its temporal breadth and the diverse array of expressive languages, offering a comprehensive record of the principal artistic movements that shaped the century, from Cubism and Surrealism to Abstract Expressionism.
The Peggy Guggenheim Collection is not merely an archive of the artistic innovations of the twentieth century; it also serves as a paradigmatic example of how art, materials, and environment can engage in an ongoing, dynamic dialogue.
The artworks on display span a wide range of media, including painting, sculpture, and drawing, utilizing materials that have become emblematic of the experimental endeavors of the past century. Among the most prevalent mediums we find oil paintings on canvas, which encompass a broad spectrum of sizes and techniques, in addition to the use of alternative supports such as wood panels and cardboard. Beyond oil painting, the collection features numerous works on paper, including watercolors, tempera, gouache, and pastels, which document the evolving practices and methodologies in art. The collection’s sculptural heritage is equally varied, comprising metal, wood, and glass sculptures, all of which reflect the continuous formal and material experimentation characteristic of twentieth-century artistic research.
The preservation of the artworks is of paramount importance for the collection, which employs stringent protocols to ensure the security and longevity of the works. To this end, all paintings are displayed in custom-designed display cases made of MDF and equipped with anti-reflective plexiglass featuring UV protection. These protective systems not only safeguard the works from potential damage caused by accidents, but also mitigate the detrimental effects of light exposure. Furthermore, these cases help maintain a stable internal microclimate, more rigorously controlled than the external environment, thereby ensuring optimal conditions for both the visibility and preservation of the artworks. The museum’s windows are equipped with UV filters to provide additional protection from harmful radiation.
The Palazzo Venier dei Leoni, the home of the collection, facilitates a harmonious interplay between the artworks and their surrounding environment. The building, which faces the Grand Canal, receives natural light that shifts throughout the day and across the seasons, creating a unique and ever-changing atmosphere. In particular, room PG-5, one of the two rooms mainly involved in the extensive campaign (see Figure 1), is oriented southwards, hence being subject to heightened exposure to sunlight, which significantly affects the internal environmental conditions.
Conversely, room PG-2 overlooks the palace’s inner garden, offering a striking contrast between the dynamic natural light and the tranquillity of a protected green space. This side of the building allows for less direct sunlight, contributing to more stable environmental conditions for the artworks.
The architecture of the palace, with its expansive windows overlooking the lagoon, establishes a unique connection between the modern art on display and the historical and natural context in which it resides. The exhibition design takes these architectural features into consideration, carefully orienting and arranging the works to respect both conservation needs and the aesthetic requirements of the public.
Rooms PG-2 and PG-5 showcase some of the most pivotal works by artists whose contributions have been instrumental in shaping the trajectory of modern art history, including Wassily Kandinsky, Kazimir Malevich, El Lissitzky, Theo van Doesburg, and Jackson Pollock.

2.2. T and RH Monitoring

The museum’s HVAC system is managed by a comprehensive and modular control architecture. The application software coordinates several controllers, each assigned to specific functions within the building’s heating, ventilation, and air conditioning infrastructure. These devices communicate with each other to optimize the operation of chillers, boilers, pumps, fan coils, and air handling units. Each controller is responsible for monitoring temperatures, pressures, flow states, and alarm conditions through a wide range of inputs. Based on these readings, they regulate valves, pumps, compressors, and other actuators, using logic that includes proportional-integral (PI) control and time-based switching strategies.
The desired T in all the museum’s rooms is set either at 21 °C or 23 °C (depending on the year), and the desired RH is set to 55%. The ventilation rate automatically varies to adjust the environmental conditions according to the set conditions, in order to maintain an optimal indoor climate and to ensure energy efficiency.
The data loggers used for the IAQ monitoring campaigns are based on the HOBO Data Loggers model MX1101 by Onset Computer Corporation, Bourne, MA 02532, USA, which measures and transmits T and RH data wirelessly to mobile devices or Windows computers via Bluetooth technology. The data logger is contained in a small plastic box that fits the clips used to hold the passive samplers and can then be placed into the same exposition shield. The data logger is battery-operated and programmed to select the sampling frequency and to set up the internal clock. The data loggers were positioned close to the passive samplers for the corresponding T and RH measurements.
Instead, the data loggers used in combination with the visitor monitoring campaigns are based on Tinytag Plus 2 TGP-4500 by Gemini Data Loggers, Chichester, West Sussex, PO19 8UJ, UK. They were positioned at a height of around 2 m on top of the artworks’ framework. All technical specifications are summarized in Table 1.

2.3. Sampling and Analysis of Gaseous Pollutants

Over three years, five campaigns comprising IAQ monitoring were carried out to evaluate the concentration of various gaseous pollutants within the museum and its surrounding environment. The purpose of this activity was to assess the potential risk these pollutants pose to the conservation of the museum’s collections and to characterise IAQ. Detailed periods of the individual campaigns are presented in Table 2.
In more detail, three identical monitoring campaigns were conducted during different periods (Table 2). During each campaign, the same set of pollutants (SO2, NO2, NOx, HONO, HNO3, O3, NH3, CH3COOH, HCOOH, and HCHO) was measured using passive sampling techniques at two indoor locations (PG-2 and PG-5) and one outdoor reference site (the museum garden); see Figure 1. The aim of this study was to capture seasonal variability in pollutant concentrations.
In addition to these seasonal measurements, two specific short-term monitoring campaigns focused on ammonia were carried out to evaluate the influence of visitor presence on indoor concentrations. The first campaign aimed to investigate the spatial distribution of ammonia inside the museum by sampling at multiple points across the first floor, one point on the ground floor (SCHULHOF-1), and an outdoor reference site (garden). The second one was designed to distinguish between opening and closing time ammonia concentrations, allowing for the assessment of short-term variations related to visitor occupancy.
The museum is equipped with an HVAC system to control T and RH. In the two selected rooms, there are two ceiling-mounted air outlets from the air conditioning system, as well as a fan coil unit that supplies treated air (two in PG-5). In the corridor, the system extracts return air, purifies it, and recirculates it back into the system for further conditioning. PG-2 has a volume of 89 m3 and a surface-to-volume ratio of 1.4, PG-5 has instead a volume of 138 m3 and a surface-to-volume ratio of 1.2.
Passive samplers were used to collect both organic and inorganic gaseous species. Seven different types of passive samplers were used during the seasonal sampling campaigns. For each species, three passive samplers were exposed in parallel, while one additional sampler was kept sealed and used as a field blank to account for background contamination.
The samplers inside the museum were placed on a sampler rack fixed on the ceiling of the room, see Figure 2.
In the two additional campaigns, which aimed to map the spatial distribution of ammonia and assess its concentration during day and night cycles, only ammonia-specific passive samplers were employed.
The passive sampling technique [30,31,32,33] is based on the principle of molecular diffusion, as described by Fick’s first law [34]. Gaseous pollutants diffuse through a defined air path and are subsequently adsorbed onto a specific substrate, typically an impregnated filter paper. After the sampling, the passive samplers were extracted and analyzed. Each sample was analyzed three times, yielding a standard deviation of less than 5%. The precision for each type of passive sampler, based on triplicate measurements, was determined to be below 5%.
Formaldehyde analysis was carried out by adding 2 mL of acetonitrile directly into the sampler. After solvent addition, the samplers were subjected to 10 min of ultrasonic agitation and occasionally stirred over a 30 min extraction period. The resulting solution was filtered through a 0.45 μm PTFE membrane and subsequently analysed using high-performance liquid chromatography (HPLC, Varian ProStar, Walnut Creek, CA, USA) equipped with a photodiode array detector. An aliquot of 20 μL of the extract was injected via a sampling loop into a C-18 reversed-phase column (Varian Microsorb MV 100-5, 25 cm length, 4.6 mm i.d.), and detection was performed at a wavelength of 365 nm, following the procedure described in [35].
The remaining samplers were analyzed using an ICS-1000 ion chromatograph (Thermo-Fisher, Sunnyvale, CA, USA). Cation analysis was performed using an IonPac CS12A-4 mm analytical column, a CG12A-4 mm guard column, and a CSRS-ULTRA-4 mm suppressor, with methane sulfonic acid (20 mM) as the eluent under isocratic conditions (flow rate: 1.2 mL/min). For inorganic ions analysis, an IonPac AS11-4 mm analytical column and AG11-4 mm guard column were used in combination with an ASRS-ULTRA 4 mm suppressor. The eluent, potassium hydroxide, was generated using an ECG40 EGC II KOH cartridge in gradient mode (10–60 mM). The analysis of organic acids was carried out utilizing an AS11-HC 4 mm column and a pre-column AG11-HC 4 under an isocratic mode with a KOH concentration of 4 mM and a flow rate of 1.50 mL/min. Each analysis was followed by regeneration with KOH at 50 mM.

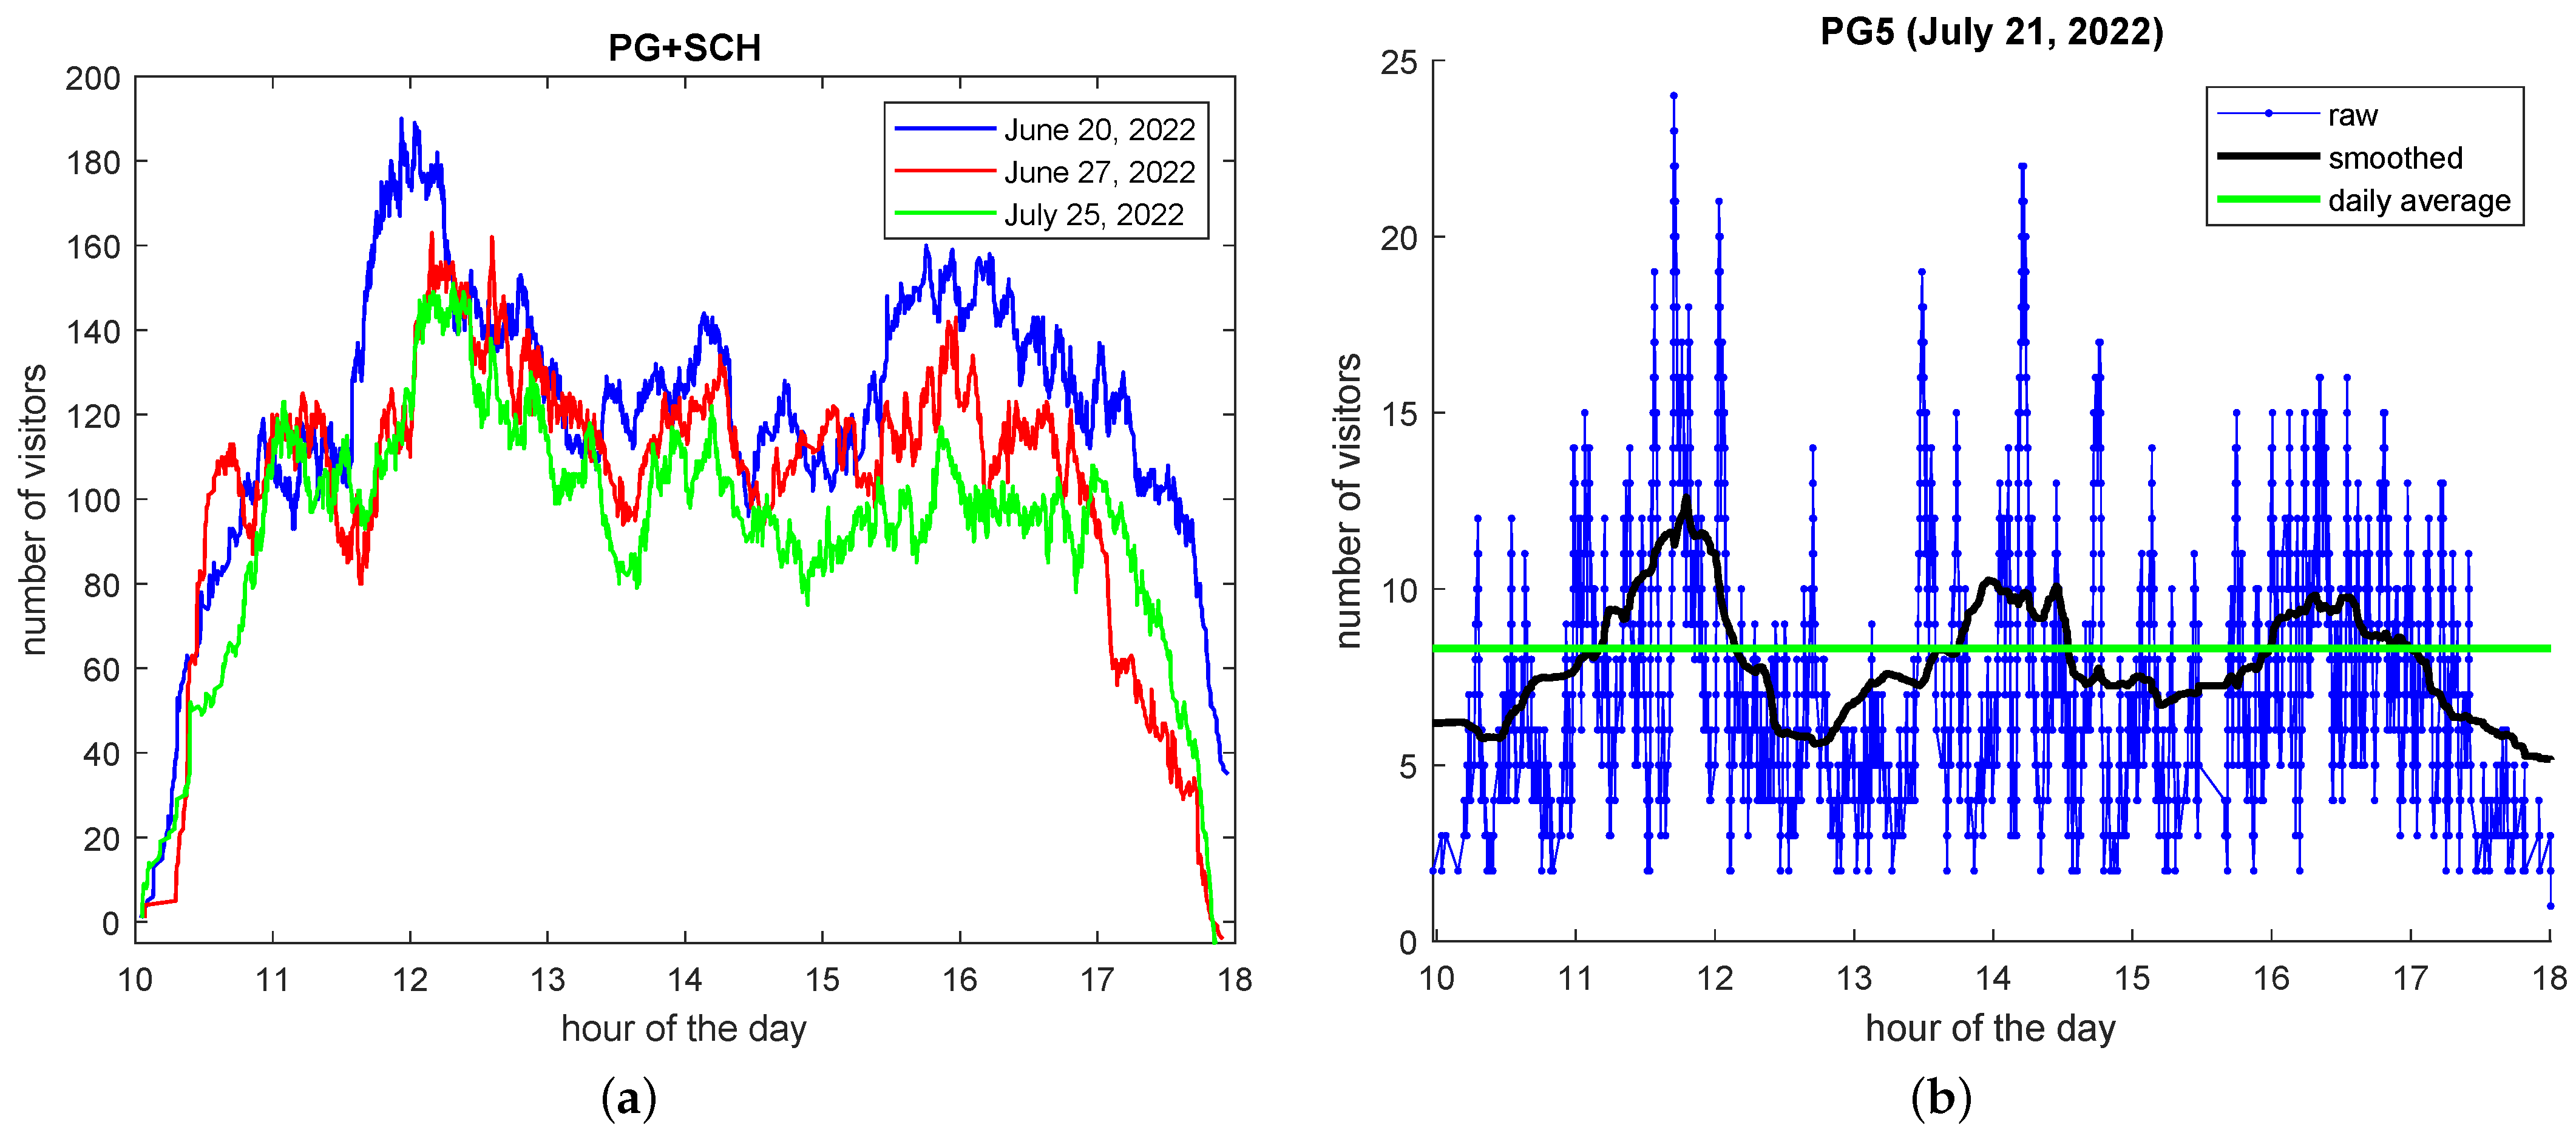
2.4. Visitor Data: Acquisition

One of the main goals of this paper was to study the correlation between visitor flow and microclimate in museum environments. For this purpose, it was necessary to acquire data on the presence of visitors and their movements. There are two types of data, which are collected in different ways for different purposes: Eulerian data, which refers to data collected in single rooms (any visitor), and Lagrangian data, which instead refers to single visitors (any rooms). The first kind of data allows one to have a complete view of the room occupation, measuring the number of visitors in a given room at any time. The second kind of data allows one to have a complete view of the visitor path in the museum (from the ticket office to the exit), but it can hardly be exhaustive since tracking all visitors may require a large effort, especially in crowded museums.
Eulerian data were manually collected with the help of an ad hoc application. The operator pushed on the “+1” (resp., “−1”) button whenever a visitor entered (resp., left) the observed room. Operations were saved on file together with their timestamp. By cumulating the ±1 values, we were able to estimate the number of visitors in the room at any time, with a maximum frequency of 1/5 s (human response time). The accuracy that the operator can reach in this task is hard to estimate precisely; it likely ranges from 100% for <10 visitors to 90% for 100 visitors.
Lagrangian data are inherently harder to collect because of technical and privacy issues. To do that we resorted to the IoT visitor tracking system already used in [36], with some adjustments in order to cope with additional technical constraints; details are postponed to Appendix B.

3. Results and Discussion

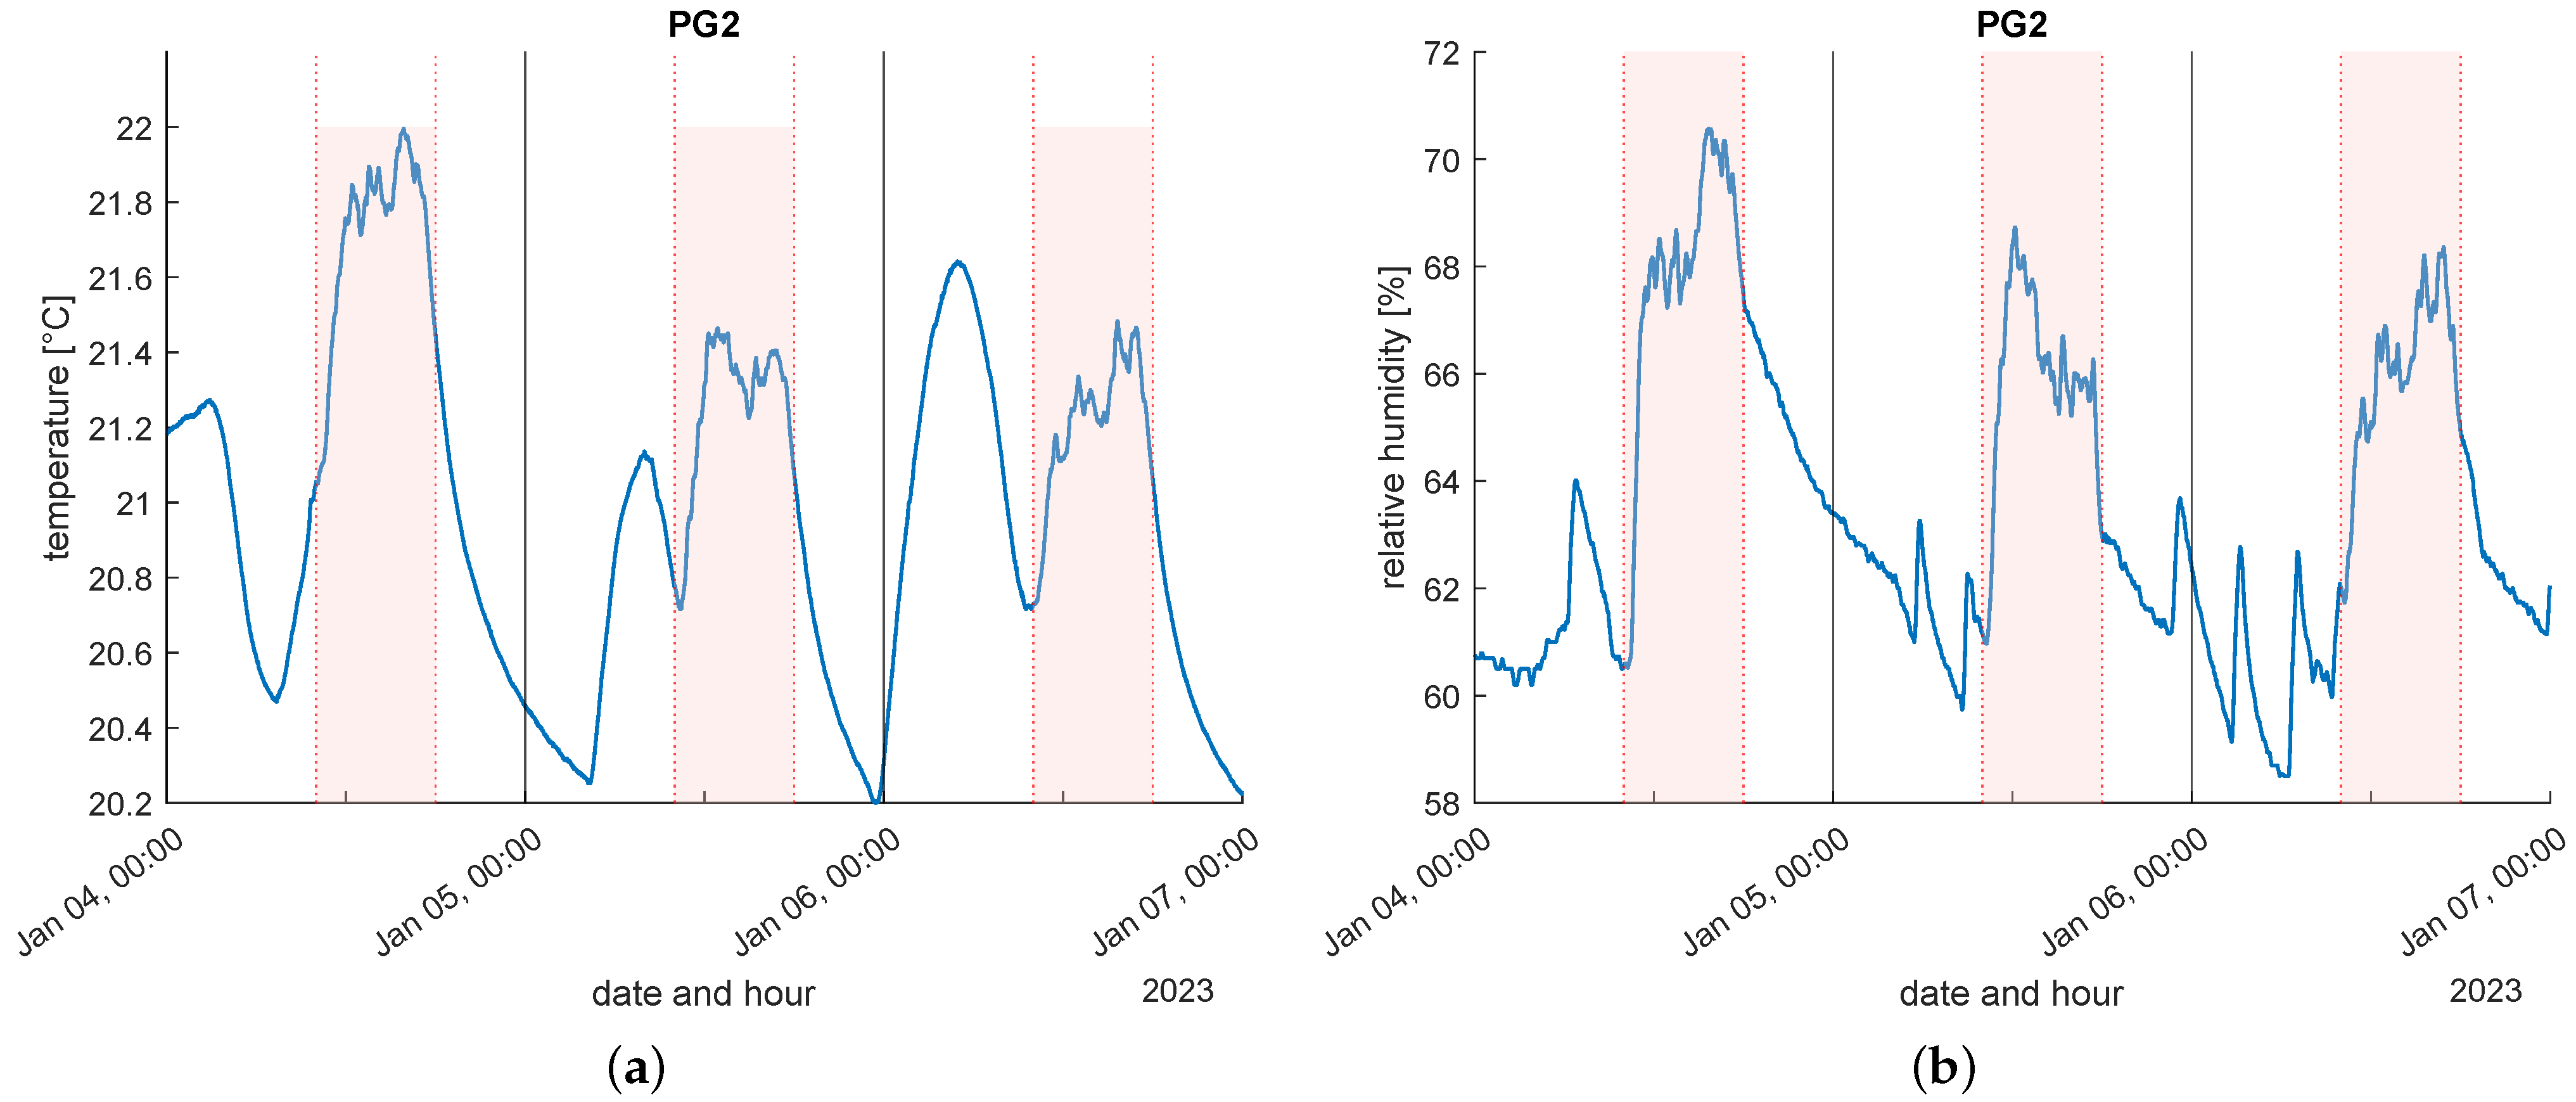
3.1. T and RH Monitoring
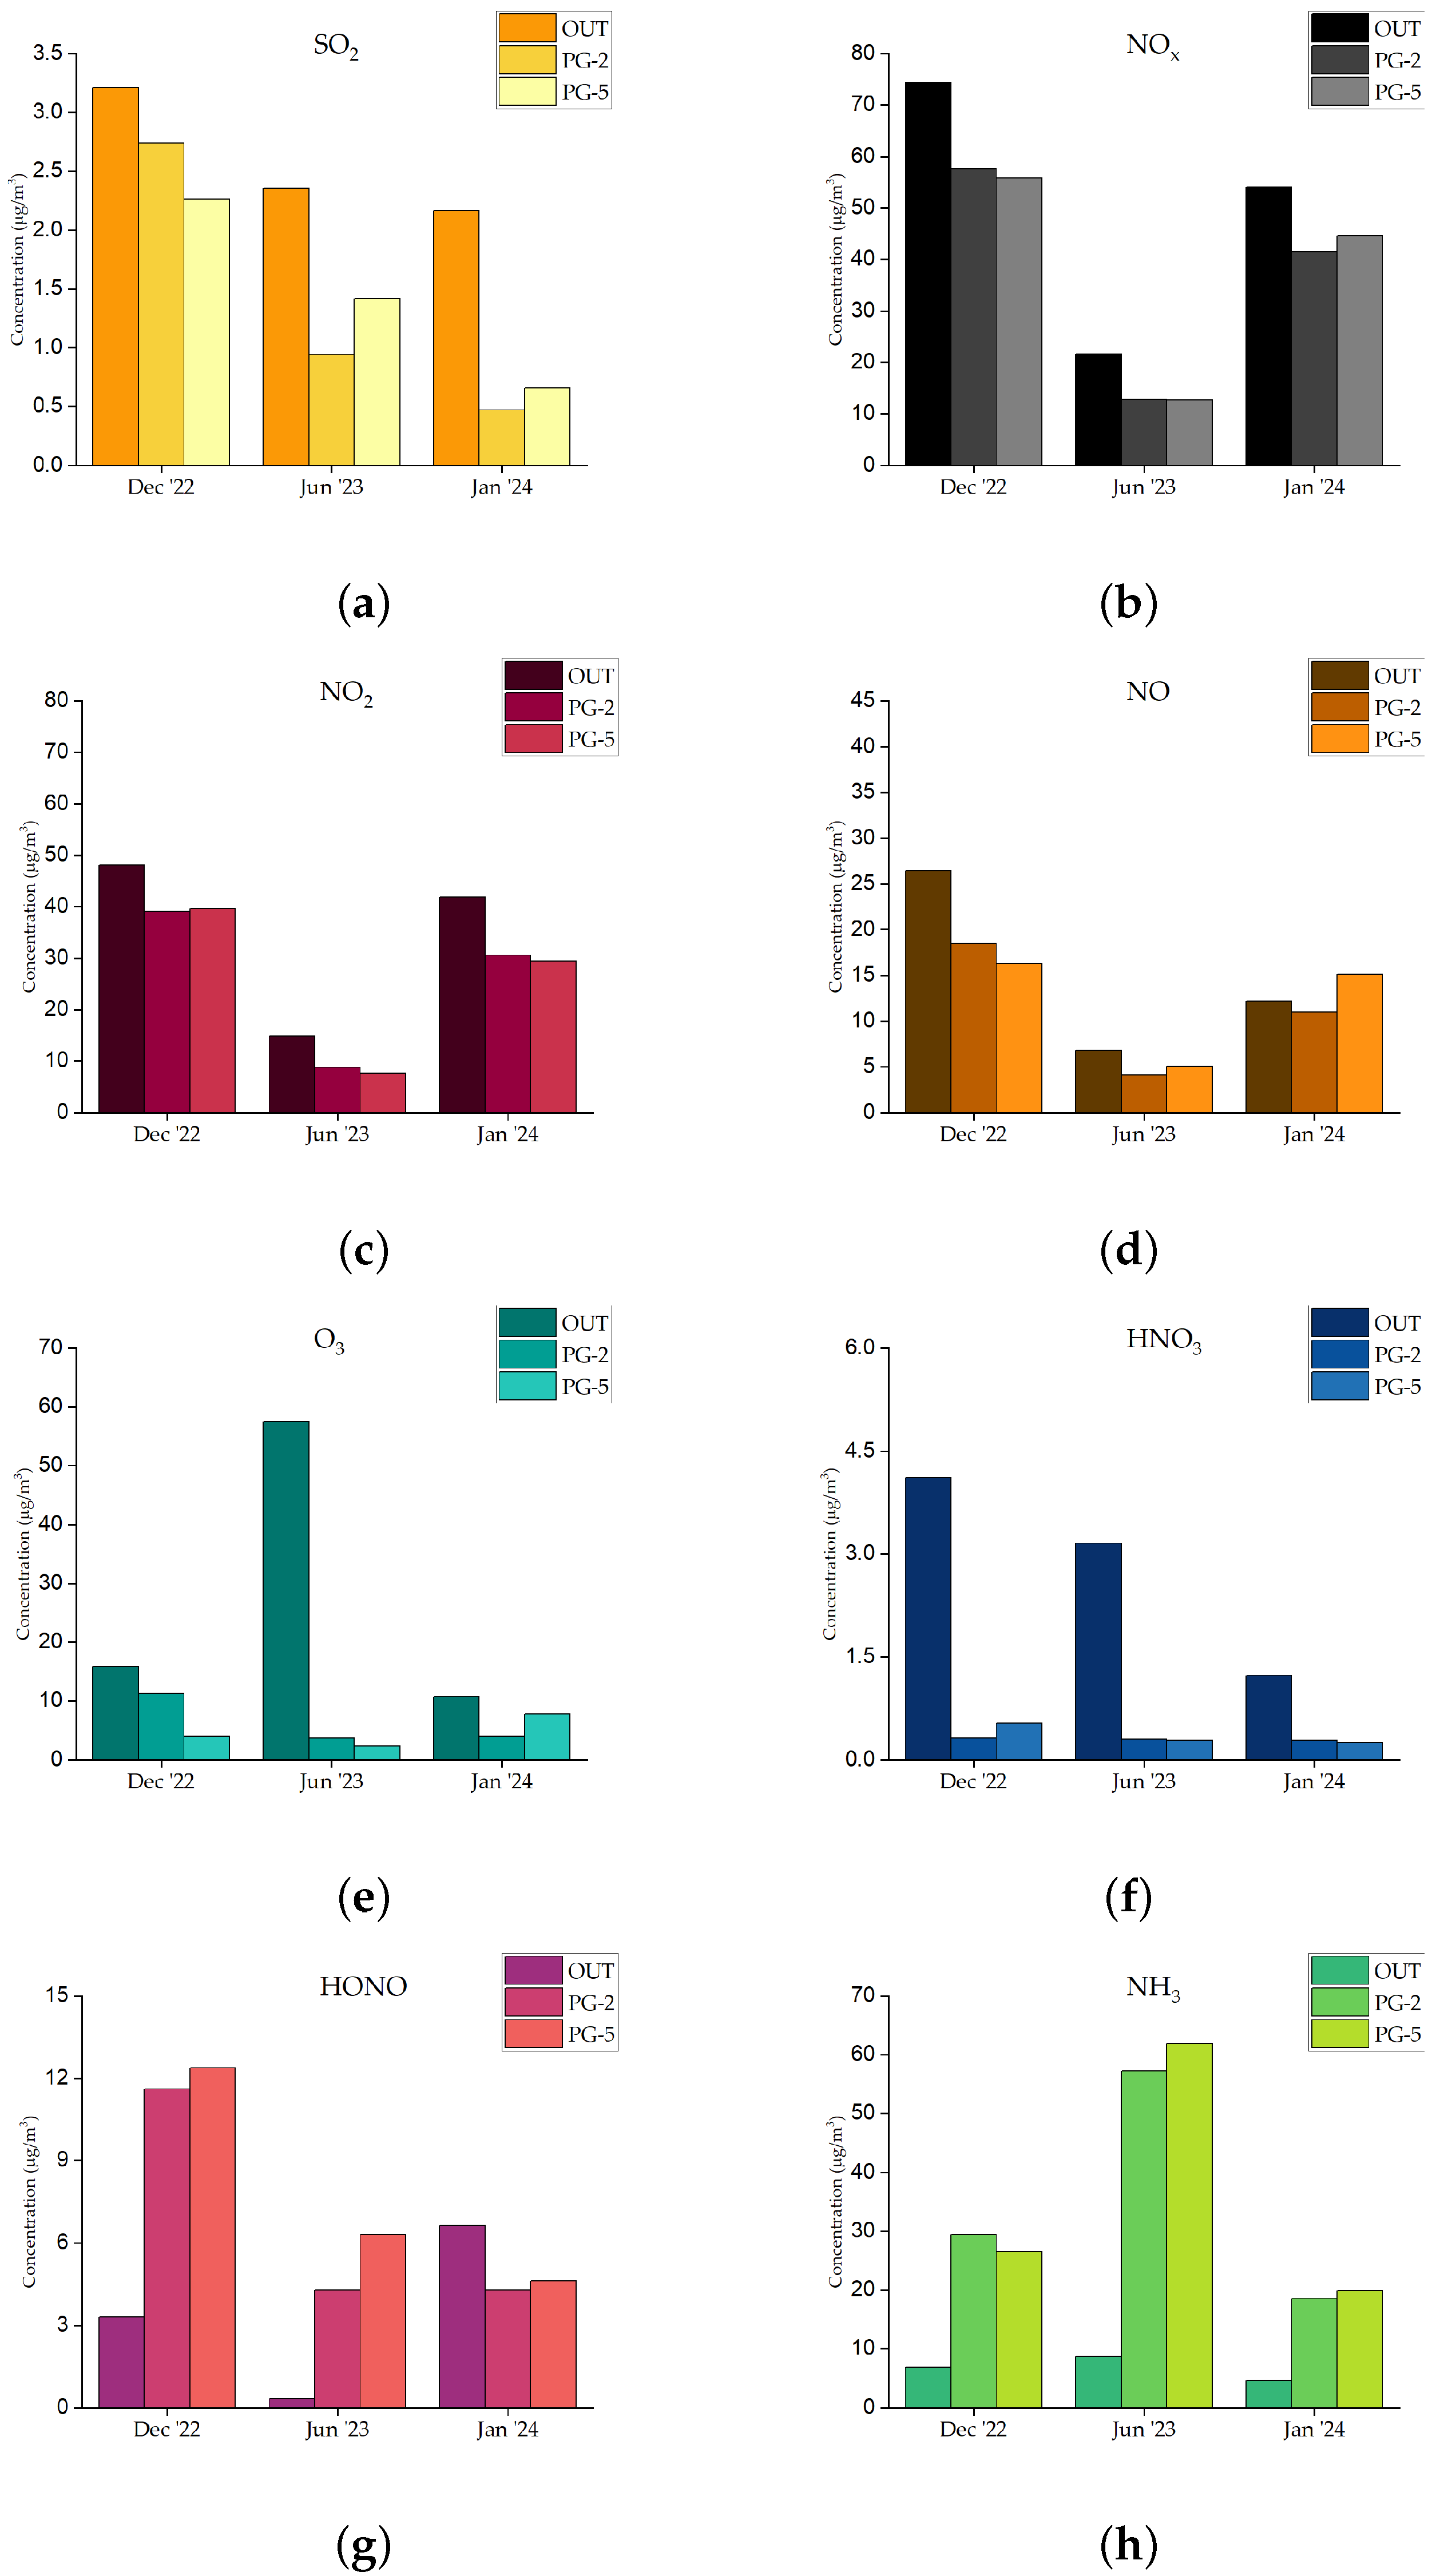
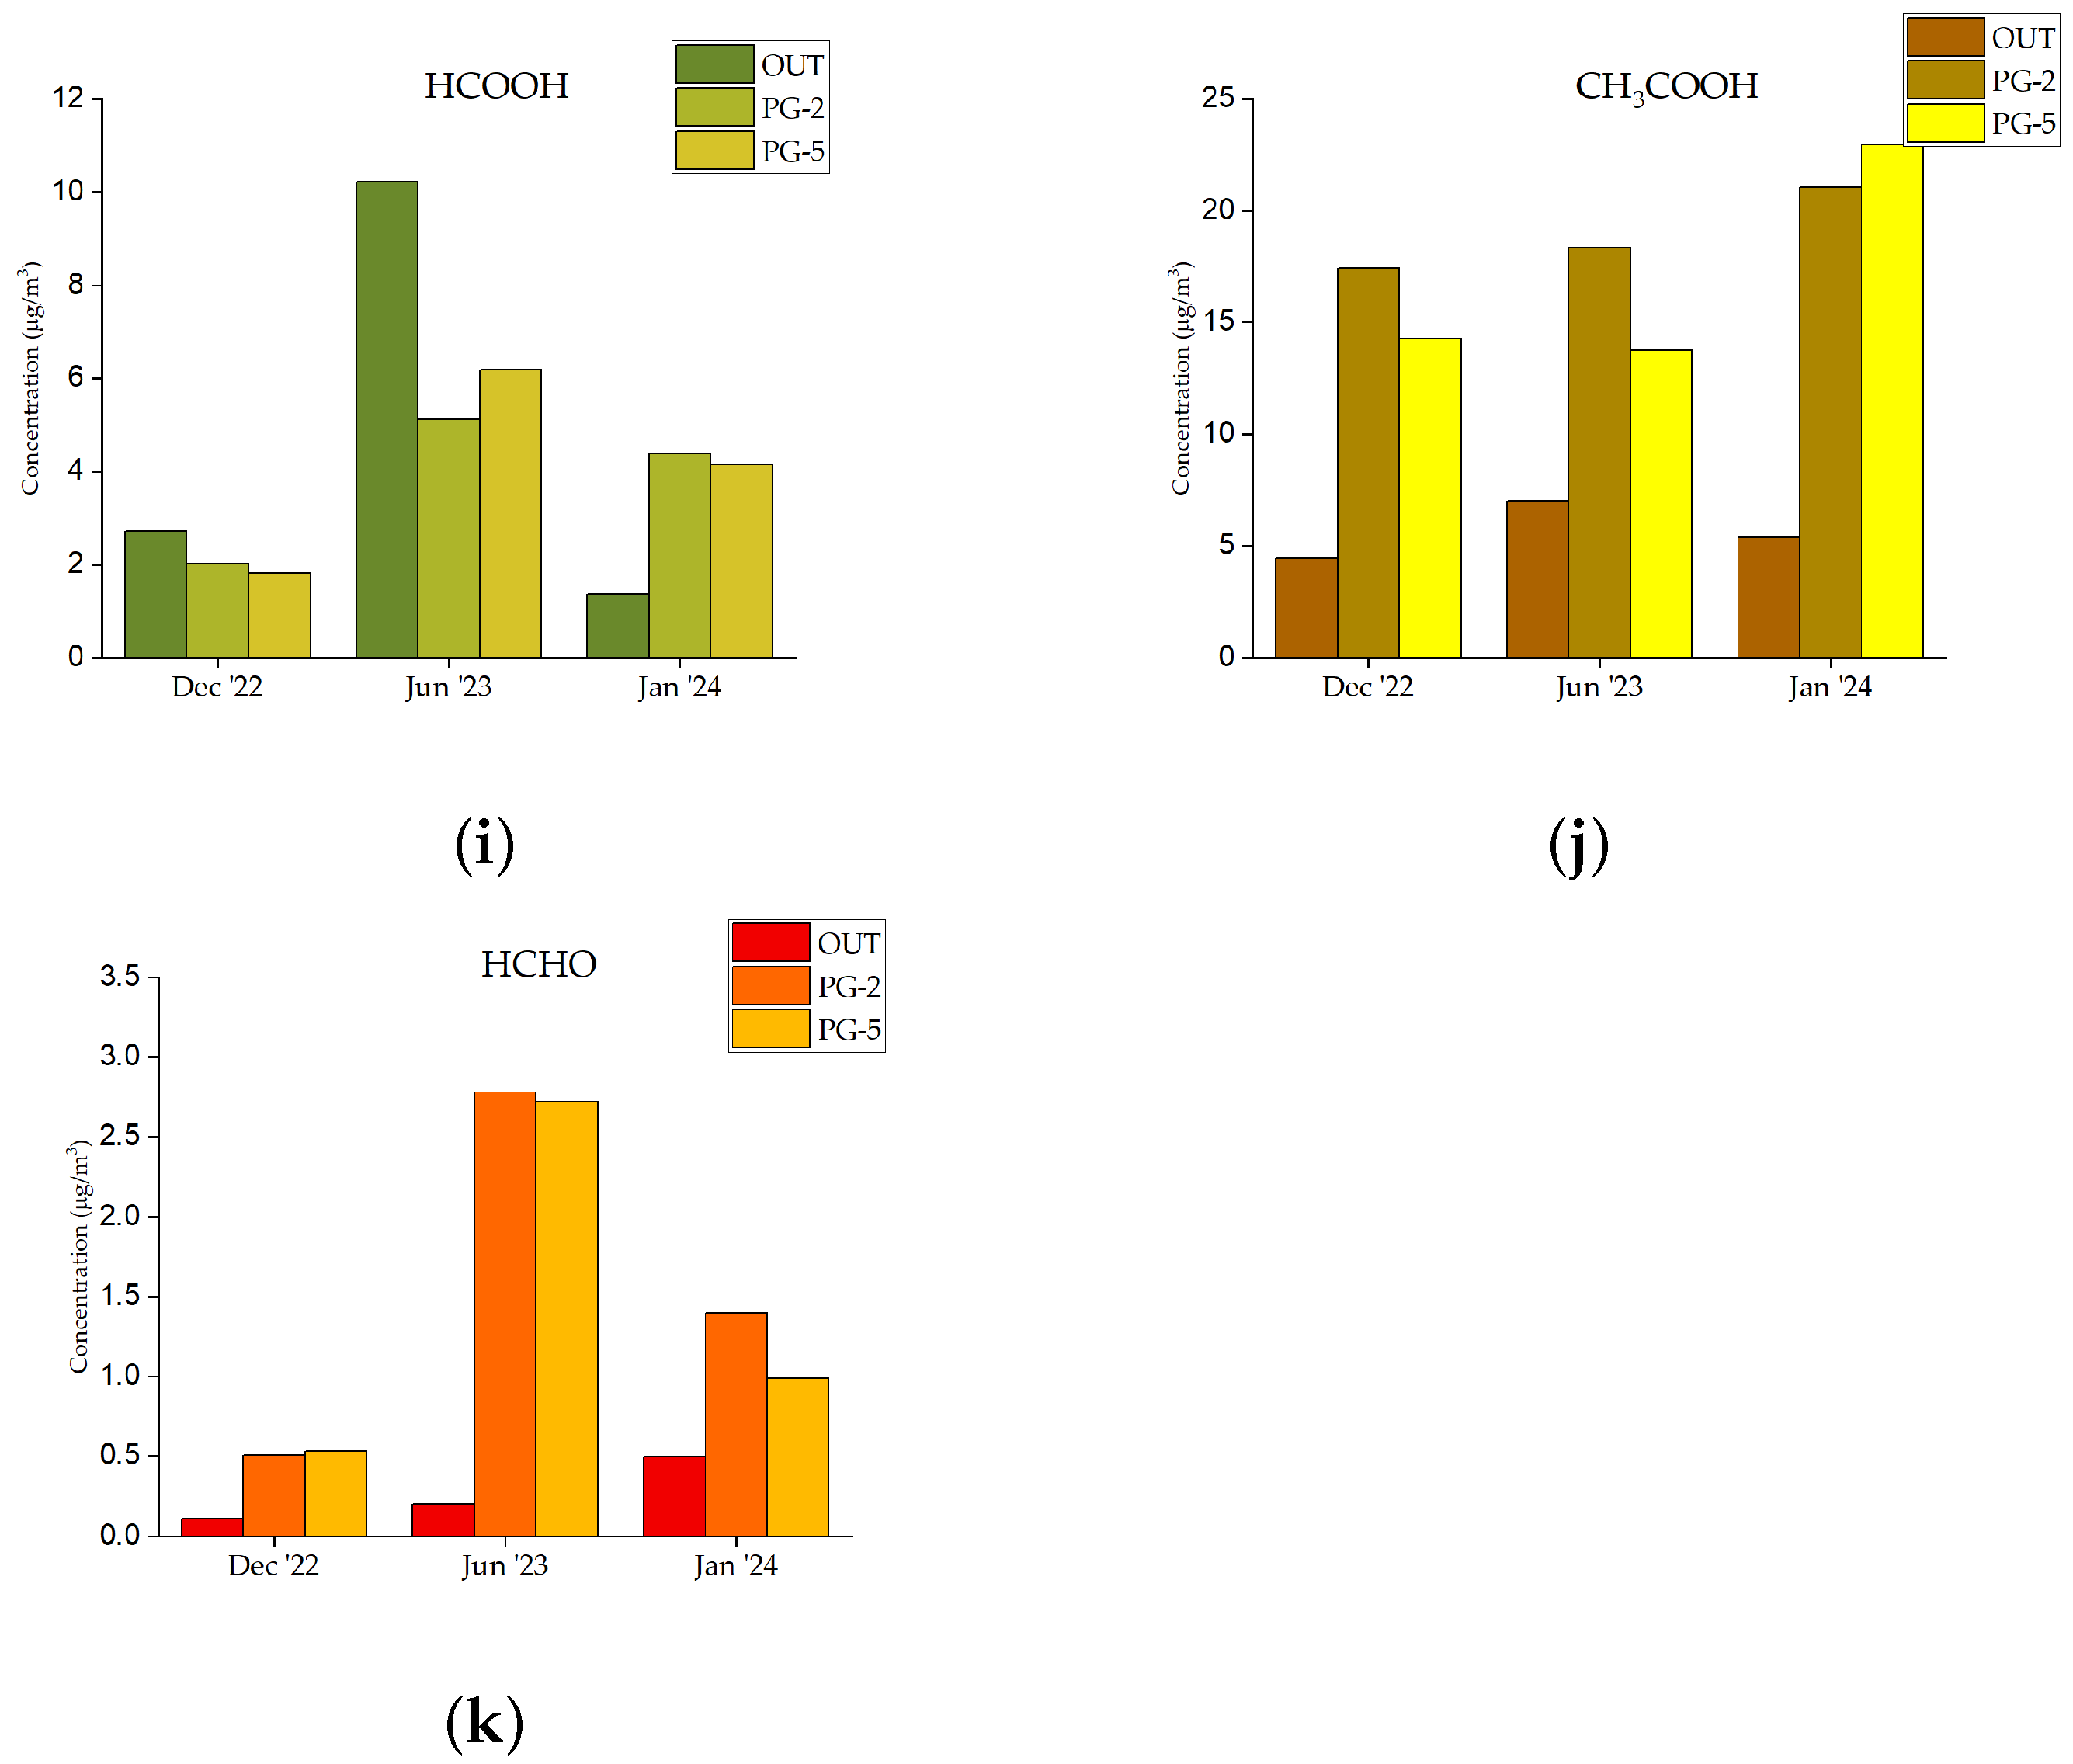
The results from the monitoring campaigns are shown in Table 3 for the T and RH measured close to the passive samplers.
The data for T and RH are reported for each period and for each sampling site (room). As previously mentioned, the sampling time was fixed at 1 min, and the statistical results were extracted for the period of interest.

3.2. IAQ

Over the course of the three sampling campaigns, distinct patterns in the average concentrations of SO2, NO2, NOx, HONO, HNO3, O3, NH3, CH3COOH, HCOOH, and HCHO were identified; see Figure 3. The NO concentration was obtained as the difference between NOx and NO2.
When evaluating IAQ, it is useful to compare the pollutant levels inside a building with those outside. This comparison is known as the indoor/outdoor (I/O) concentration ratio and helps determine whether contaminants originate from outdoor sources or from indoor elements, such as furnishings or construction materials. An I/O ratio greater than 1 suggests that the indoor environment is contributing additional pollutants.
The I/O ratios for these pollutants in the two selected rooms are reported in Table 4.
During the study period, SO2 levels consistently remained low, peaking at 3.2 μg/m3 in December 2022. However, the levels remained consistently below the recommended limit for museum environments (5 μg/m3) [13].
Examining NOx, NO, and NO2, the concentrations indoors and outdoors were quite similar, with indoor levels generally lower, except for NO (I/O > 1) during the winter campaign at PG-5. The highest concentrations were observed in December 2022, with NOx, NO2, and NO levels reaching 74, 48, and 26 μg/m3, respectively. Conversely, the lowest concentrations were recorded during the June campaign, with NOx, NO2, and NO at 22, 14, and 6.8 μg/m3, respectively.
As reported in other studies, the I/O ratio for NO2 tends to be less than 1, typically ranging from 0.7 to 0.9, depending on air exchange rates and relative humidity [37], as well as indoor surface deposition [38]. In [39], one can find measurements conducted in 10 European museums that showed an I/O ratio > 1 for NO2 in summer. However, in our case, the I/O ratio was always < 1, with the lowest value observed in summer (average I/O = 0.55).
Outdoor O3 concentrations were consistently higher than indoor levels, which was expected given the reactivity of O3 and the absence of internal sources. The average outdoor concentration of O3 was 28 μg/m3, with the highest concentration recorded during the June campaign (57 μg/m3). Across all three campaigns and both rooms, it was only in December 2022 that the O3 level (11 μg/m3) overwhelmed the recommended limit for museum environments, which is set at 10 μg/m3 [40].
Considering the homogeneous reaction between O3 and NO2 [41]:
O 3 + NO 2 NO 3 * + O 2
during daylight hours outdoors, this reaction has little impact because the NO 3 * (nitrate radical) is photolytically unstable and rapidly breaks down in sunlight. Indoors, in the absence of direct sunlight, considering also that windows have glass with UV protection, NO 3 * can react with NO2 to form N2O5 (dinitrogen pentoxide), as shown in reaction (2):
NO 3 * + NO 2 N 2 O 5
N2O5 can then undergo hydrolysis with water (reaction (3))
N 2 O 5 + H 2 O 2 HNO 3
or react with organic compounds (ORGs) via reaction (4)
NO 3 * + ORG HNO 3 + ORG *
both of which contribute to the formation of HNO3.
Considering the high concentration of O3, this reaction could result in a decrease in NO2 and the formation of nitric acid. Moreover, NO2 is a precursor of HONO and HNO3 through reaction (5), involving water absorbed on surfaces [42,43]:
2 NO 2 ( g a s ) + H 2 O / surface HONO ( a q ) + H + NO 3 ( a q ) .
Another significant pathway for the loss of NO2 is the presence of water on surfaces, given that the relative humidity in the museum showed an average value of 56%, reaching up to 85% during rainy days, ensuring ample availability of water.
These reactions could explain the I/O < 1 for NO2 in all campaigns, especially the summer one, in which NO2 showed a lower concentration (15 μg/m3) and O3 the highest concentration (57 μg/m3) compared to the others.
Reaction 5 can evolve as follows:
HONO ( a q ) HONO ( g a s )
with the release of acid into the surrounding environment. The concentrations of HONO indoors were invariably higher than those outdoors, with a maximum value of 13 μg/m3 in December (PG-5), while the June campaign showed the highest value of the ratio I/O, with an average of 16. In contrast, indoor concentrations of HNO3 were invariably lower than outdoor concentrations due to the elevated deposition velocity on the surface [44]. The concentration of HNO3 deposited on a surface can be evaluated from the HONO measurements in the atmosphere [45].
The concentrations of NH3 showed a ratio I/O > 1 in all cases. The highest concentration was recorded in June (62 μg/m3, PG-5, I/O = 7.1). The correlation between NH3 and visitor flow is discussed in the next section.
Moving on to the organic pollutants HCOOH, CH3COOH, and HCHO, we note that they are the most abundant VOCs in the atmosphere. HCOOH exhibited variable behavior across the three monitoring campaigns. In the first two campaigns, the I/O ratios were less than 1, indicating outdoor penetration. However, in the third campaign, the I/O ratio exceeded 1, suggesting the presence of indoor sources. The highest concentrations of HCOOH were recorded in June, 10 μg/m3 outdoors and 6.2 μg/m3 indoors. During the January campaign, an I/O ratio greater than 1 confirmed the presence of internal sources.
CH3COOH consistently showed I/O ratios greater than 1 across all campaigns, indicating indoor sources. Concentrations ranged from a minimum of 14 μg/m3 to a maximum of 23 μg/m3, both measured in room PG-5 during the June and January campaigns, respectively. Despite these fluctuations, the average concentrations between rooms remained similar, with 19 μg/m3 in PG-2 and 17 μg/m3 in PG-5. Studies have shown that acetic acid concentrations in museums can range from 2 to 54 μg/m3 [46]. In any case, these acids were below the lower target suggested in [47] (100 μg/m3).
According to Smedemark et al. [16], the emission rates of both formic and acetic acids decrease with lower temperature and humidity. The relatively consistent levels observed across different seasons are likely the result of climate control systems that maintain visitor comfort, as well as the presence of visitors themselves, whose respiration increases both temperature and humidity within the rooms.
The concentration of HCHO peaked during the June monitoring campaign, with average levels in PG-2 and PG-5 reaching 2.75 μg/m3. The I/O ratios consistently remained above 1, suggesting the presence of indoor sources. In June, the I/O ratio for both rooms reached 14, a notably high value that may be linked to increased visitor presence, similar to the trend observed for ammonia, which also showed its highest I/O ratio during this period.
HCHO emissions were detected in a wide variety of personal care products, including moisturisers, foundations, shower gels, shampoos, deodorants, hair conditioners, hair gels, and body lotions. These studies indicate that these individual products and product categories contribute between 1 μg/m3 and 5 μg/m3 to indoor formaldehyde pollution [48,49]. The highest values of ammonia and formaldehyde during the summer campaign were likely correlated not only with the peak number of visitors (20,417), but also with visitors’ body temperature and clothing [50].

3.3. Effect of Visitors on NH3 Concentration

Two sampling campaigns were conducted to assess the impact of visitors on the IAQ. The results of these monitoring campaigns are shown in Figure 4.
In the first campaign (29 December 2022–10 January 2023), ammonia concentration was mapped on the first floor of the museum, plus one sampling point on the lower floor (always less visited), and one sampling point outdoors (garden). The ratio I/O was consistently >1, confirming an internal source. The highest concentration (34 μg/m3, ratio I/O = 5) was recorded in the small room PG-7, even if the ammonia concentration was quite homogeneous.
The concentration of indoor pollutants depends on several factors: the outdoor concentration, the rate at which indoor air is replaced with outdoor one, the efficiency of indoor surfaces in eliminating pollutants, and the speed at which they are either generated or eliminated through deposition and chemical reactions within indoor spaces, as described in [51]. The surface removal rate is defined as the deposition velocity of a pollutant, referred to as the surface-to-volume (S/V) ratio of the room; an increase in the S/V ratio leads to a decrease in the concentration within the confined environment. In general, smaller rooms have higher S/V ratios, as the room under consideration (the smallest, PG-7) has an S/V ratio of 2.1 while the biggest (PG-8) has a S/V ratio of 1, but the two rooms are different in terms of conditioning. There is only one fan coil in PG-7 at present, with no ceiling-mounted air outlets. The lowest value inside the museum was recorded on the lower floor (23 μg/m3), always less visited, confirming the effect of visitors.
In the second campaign (16–18 May 2023), the variation in ammonia levels within rooms PG-2 and PG-5 was investigated. The data compare periods when the museum was open (9:00 a.m. to 6:00 p.m.) with periods when it was closed (6:00 p.m. to 9:00 a.m.), thus reflecting the presence and absence of visitors. During these two days, the museum hosted 2512 visitors.
Ammonia concentrations were consistently higher during the daytime (when the museum was open) than at night (when it was closed), indicating a strong influence of the visitors. The highest concentrations were observed in PG-5 during the day, reaching up to 32 μg/m3. In contrast, the lowest concentrations were recorded at night, with values dropping below 6 μg/m3 in PG-2.
These results are consistent with the findings of other studies in museums [52] and test houses [53], which also identified a correlation between ammonia and visitors.
Elevated ammonia levels can have significant and detrimental effects on cultural artifacts over the long term. These effects can vary based on the material of the artifacts and their environmental exposure. Ammonia is highly soluble in water, which can contribute to chemical reactions that lead to deterioration and can lead to corrosion of metal artifacts. It reacts with copper-based artifacts to form copper ammine complexes, which are water-soluble and can result in a loss of metal from the surface layer [54]. On paintings and coated surfaces, ammonia can act as a catalyst for various degradation processes. It can also potentially react with inorganic pigments, altering the visual properties and historical accuracy of artworks [54]. Moreover NH3 can react with HNO3 (reaction (7))
HNO 3 + NH 3 NH 4 NO 3
to form ammonium nitrate, a strong oxidizer in the aerosol phase, which then deposits on the surfaces [55].

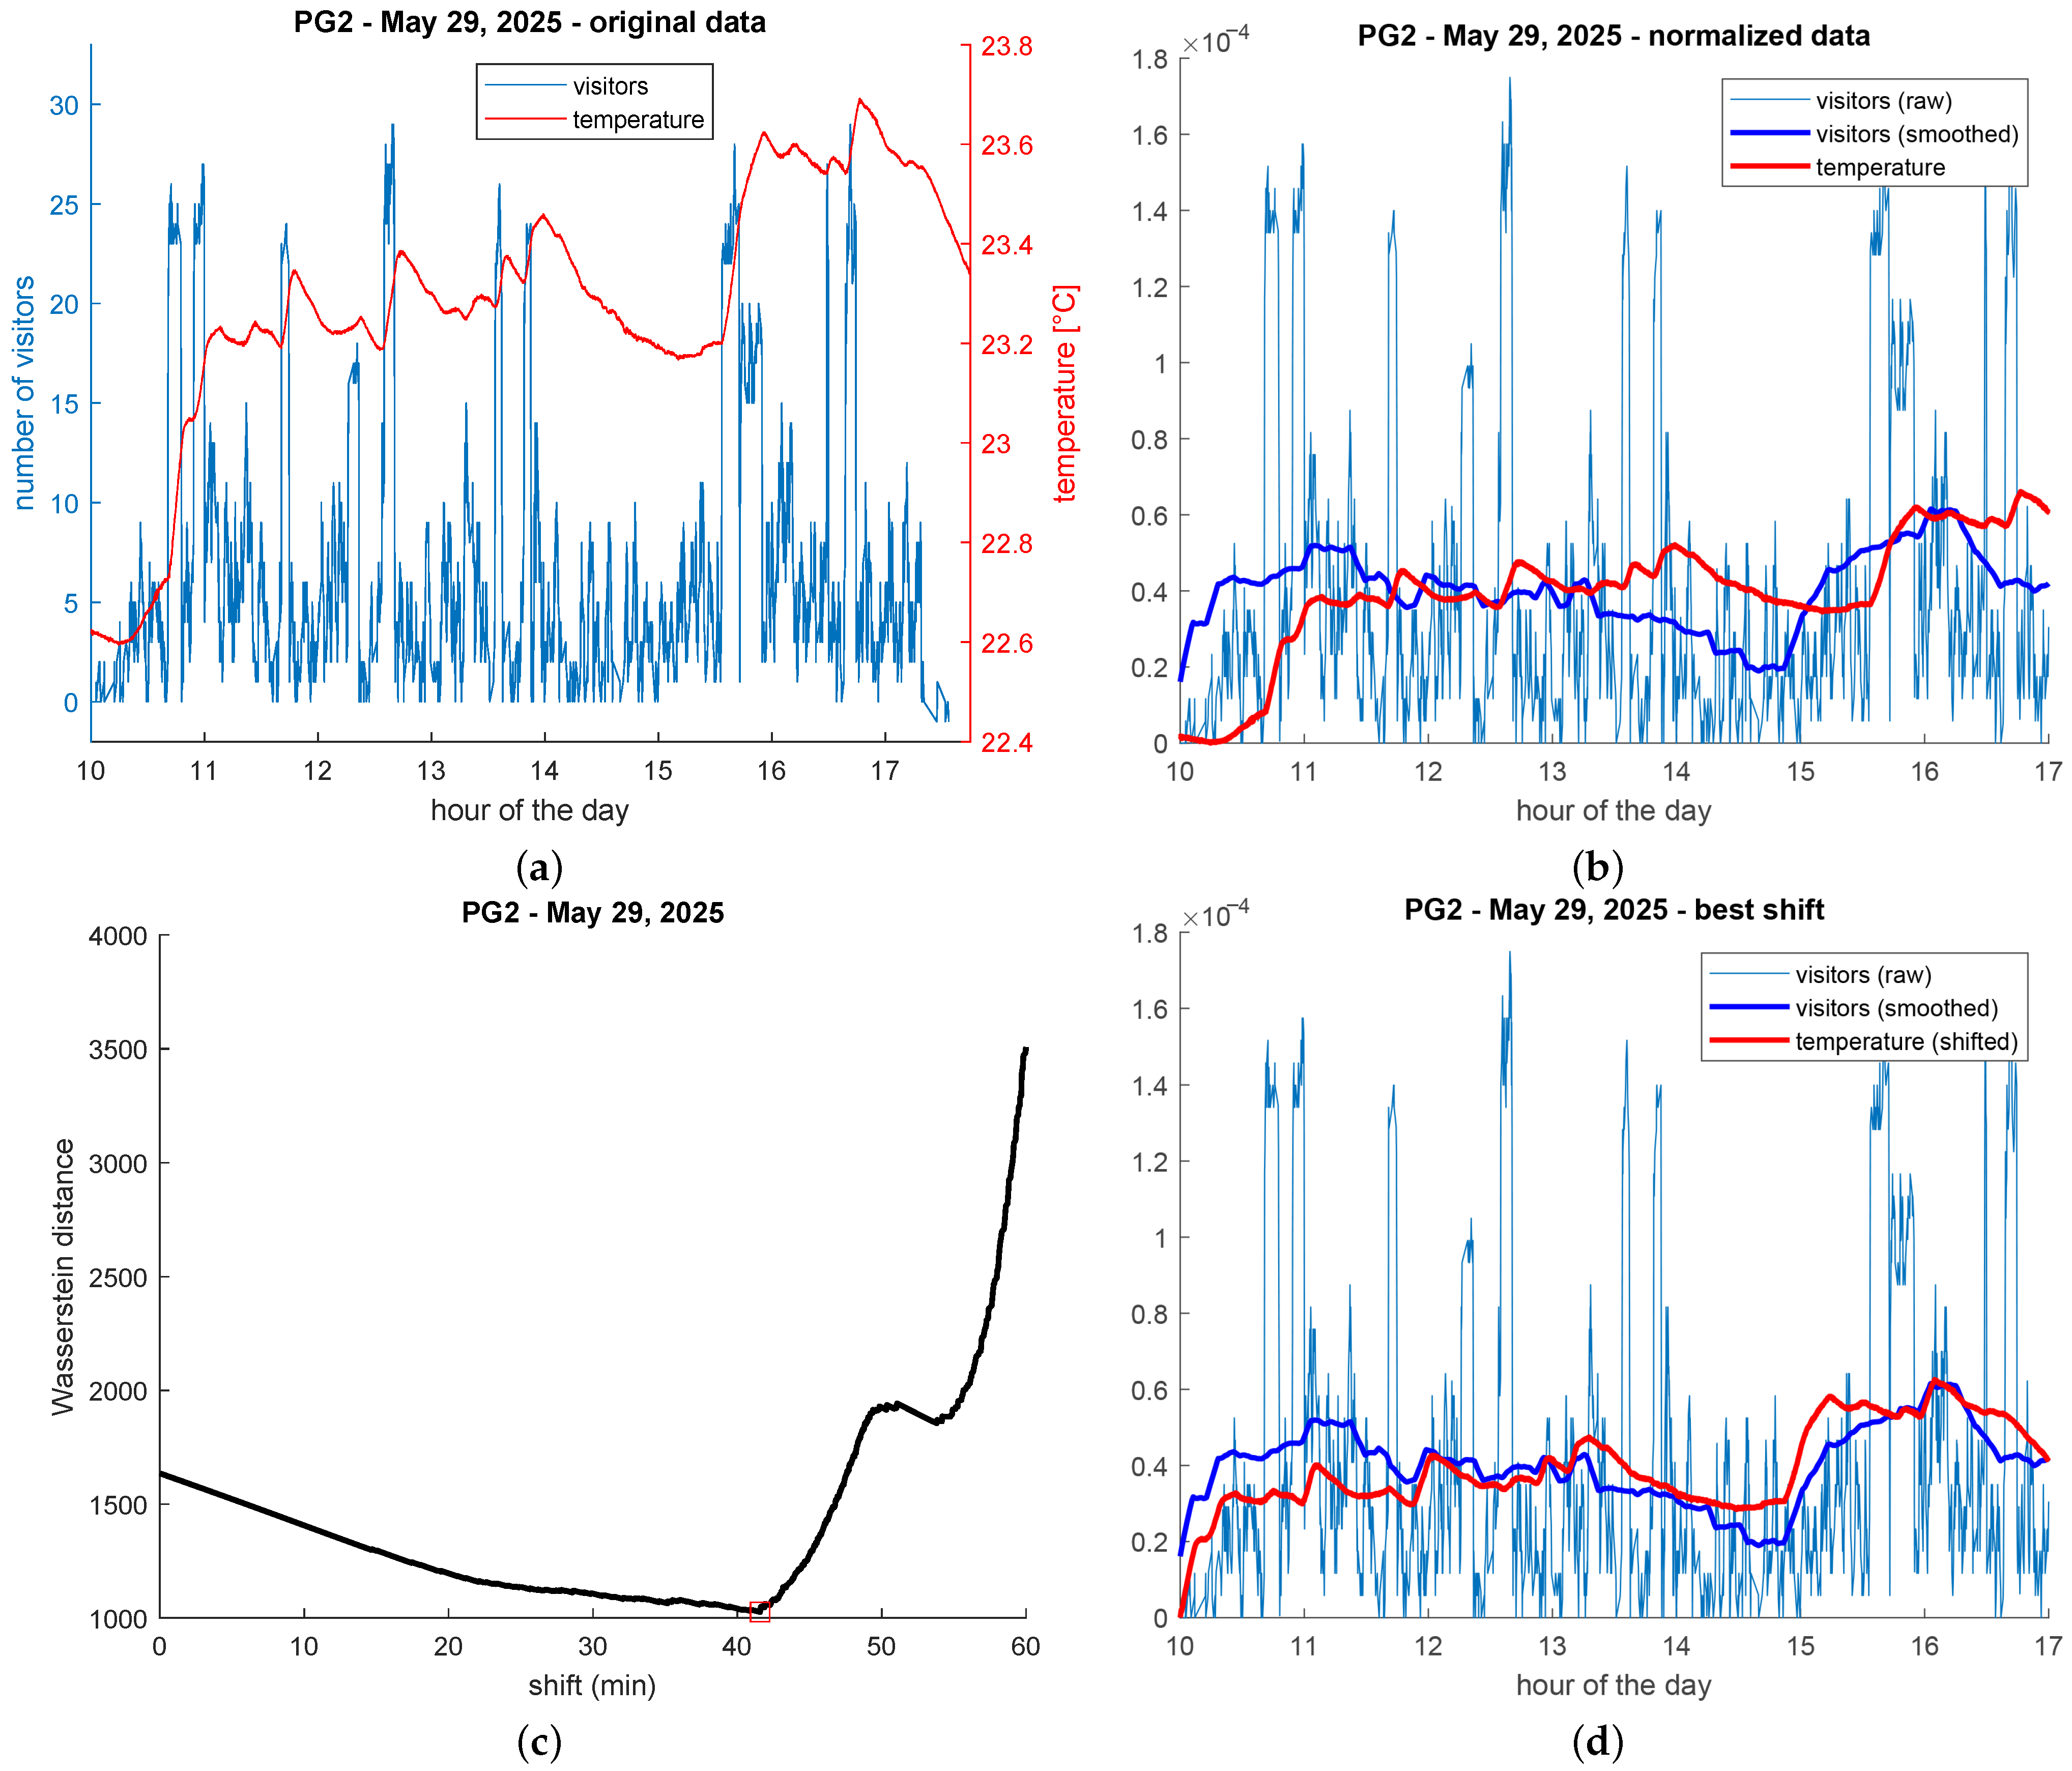
3.4. Effect of Visitors on T and RH

In order to assess the relationship between crowdedness and microclimate parameters, we compared daily data of presences with corresponding T and RH data. More precisely, we were looking for an intrinsic temporal shift between the three datasets, in order to bring to light the causal relationship between the incessant inflow/outflow of visitors and the corresponding variation of the environmental parameters. To begin with, we show in Figure 5 the total number of visitors in all PG and SCHULHOF rooms as a function of time on three days (opening hours only) and the number of visitors in a single room on a single day.
At the aggregated level (Figure 5a), the presence behavior was regular and similar from one day to another, with a clear and recurrent peak around 12 a.m. (before lunch); at the room level (Figure 5b), instead, oscillations were very high, very frequent, and totally unpredictable. Note that smoothing raw data by a Gaussian filter (Figure 5b, black line), we recover a more regular behavior with three peaks, similar to the aggregated one. A similar behavior was also observed in Galleria Borghese, Rome, Italy [36].
Figure 6 shows, instead, T and RH during three consecutive days (including nights).
By comparing opening and closure hours, we immediately see that the presence of visitors affects microclimate parameters, making them highly oscillating and hardly predictable.
Figure 7a shows overlapped data, T and RH, on the number of visitors in a single room in a single day during opening hours. This particular day was characterized by the scarce presence of normal visitors and the large presence of guided groups. This is well visible by observing the numerous peaks in the number of visitors.
There is a clear relationship between peaks of visitors and peaks of microclimate parameters: the peak of T follows that of RH, which, in turn, follows that of visitors; see an example in Figure 7b. We have manually isolated 20 peaks in three days, and we obtained an average delay of 2.64 ± 1.24 min for RH and of 6.48 ± 3.39 min for T. We have not observed significant differences between small and large rooms, nor between high and low peaks. This was probably due to two facts: the HVAC system is well proportioned to the room’s size, and the sensors were located close to the groups’ position.
It is also very clear that, around peaks, temperature increased faster than it decreased. This suggests that there exists a daily-scale dynamic that goes beyond the simple shift between peaks. In order to investigate this hypothesis, we have progressively shifted backward in time the graph of the temperature until it superimposes, at its best, with that of the number of visitors. For evaluating the discrepancy between the two graphs, we have used the Wasserstein distance, which it is the most appropriate for horizontal displacements, see Appendix A for technical details.
In Figure 8 and Figure 9, we show the complete pipeline for computing the daily-scale temporal shift between the number of visitors and temperature on two sample days. On the first day, we had a situation similar to that of Figure 7, with a scarce presence of normal visitors and a large presence of groups. The best temporal shift here was found at about 41 min. On the second day, we had instead the opposite situation, with many normal visitors and no groups. The best temporal shift here was found at about 17 min, much less than in the previous case. We think that the difference between the two cases can be explained by the fact that on the second day, the dynamics of the number of visitors was much more regular, thus the temperature was permanently closer to the equilibrium.

4. Conclusions

This study underscores the complexity of IAQ in modern art museums, where human activity and indoor materials jointly drive pollutant levels. Addressing these factors is essential for balancing public access with artifact preservation. NH3 and HCHO concentrations spiked during high visitor occupancy, with NH3 levels doubling in crowded periods. Short-term NH3 campaigns confirmed a direct correlation between visitor numbers and indoor concentrations, likely due to human emissions.
HCHO showed the same trend of NH3 in the 3-week campaign, revealing the same impact from visitors.
CH3COOH showed that the I/O ratio is always >1, indicating predominantly indoor sources such as display materials.
Outdoor O3 concentrations were consistently higher than indoor levels, as expected due to their reactivity and lack of indoor sources. The observed indoor decrease of NO2 (I/O < 1), particularly during the summer campaign, can be explained by its reactions with O3 and surface-adsorbed water, leading to the formation of secondary pollutants such as HNO3 and HONO.
Indoor HONO levels were consistently higher than the levels outdoors, while HNO3 was lower due to high deposition rates. These heterogeneous reactions, influenced by seasonal and microclimatic conditions, highlight the importance of indoor chemistry in museum environments and its potential impact on cultural heritage preservation.
Daily trends linked visitor flow to gradual T and RH shifts, with RH varying up to 10 percentage points, and T up to 1 °C, stressing the need for real-time climate control via a smart, connected HVAC system.
Some considerations about the conservation management could be implemented:
  • Prioritize NH3 and HCHO reduction through improved ventilation during peak hours;
  • Cost-effective passive samplers (as used in this study) can provide reliable data for long-term IAQ assessment to balance public access with long-term conservation goals;
  • Keep to the minimum fluctuations of the number of visitors in each room;
  • Limit occupancy in sensitive areas and use real-time IAQ monitoring to adjust connected HVAC systems dynamically.

Author Contributions

Conceptualization, M.C., C.R. and L.P.B.; methodology, M.C., E.C., C.R. and E.O.; software, E.C. and E.O.; validation, M.C.; formal analysis, E.C. and E.O.; investigation, M.C., E.C., C.R. and E.O.; data curation, M.C., E.C., C.R. and E.O.; writing—original draft preparation, M.C., E.C., C.R. and L.P.B.; writing—review and editing, M.C., E.C., C.R. and E.O.; visualization, M.C., E.C. and C.R.; supervision, M.C., E.C. and C.R.; All authors have read and agreed to the published version of the manuscript.

Funding

M.C. thanks the project “Innovazione tecnologica per la protezione, valorizzazione e sicurezza del patrimonio culturale”, Quota FOE 2019 (Fondo ordinario per gli enti e le istituzioni di ricerca, DUS.AD017.108, CUP B68D19001970001).

Institutional Review Board Statement

Not applicable.

Informed Consent Statement

Not applicable.

Data Availability Statement

All the raw data collected have been used in the manuscript, presented in the tables and in the text.

Acknowledgments

The authors wish to express their sincere gratitude to Francesca Vichi and Andrea Imperiali of the Institute of Atmospheric Pollution Research (CNR-IIA) for their valuable support in the analysis of formaldehyde samples. Authors also gratefully acknowledge the Peggy Guggenheim Collection for hosting the measurement campaigns.

Conflicts of Interest

The authors declare no conflicts of interest. The funders had no role in the design of the study; in the collection, analyses, or interpretation of data; in the writing of the manuscript; or in the decision to publish the results.

Appendix A. Wasserstein Distance

Let us fix a time interval [ 0 , t f i n ] for some final time t f i n , and denote by v ( t ) the number of visitors in a given room at time t, for any t [ 0 , t f i n ] , and by x ( t ) , t [ 0 , t f i n ] , another function which keeps track of some environmental parameters such as T or RH. Whenever two real-valued functions defined on the same domain have to be compared, one can resort to several mathematical tools. The most used ones are the L p distances, defined, for p 1 , as
D p v , x = 0 t f i n | v t x ( t ) | p d t 1 / p .
These distances are often said to be “vertical” since they are related to the measure of the area found in between the graphs of the two functions v and x. In our case, it seems more appropriate to use the L p -Wasserstein distance, which has, only for p = 1 , a nice representation formula which reads as
W 1 ( v , x ) = 0 t f i n | V ( t ) X ( t ) | d t , with V ( t ) = t v ( s ) d s and X ( t ) = t x ( s ) d s .
Conversely to the previous one, this distance is referred to be “horizontal”, since it measures the “cost” to superimpose the graph of v over the graph of x by horizontal translations and stretching [56]. Let us recall here that the standard Wasserstein distance is defined only for probability functions, meaning that the condition 0 t f i n v = 0 t f i n x = 1 is required. We will enforce this condition on our data by means of suitable normalization.
Since we are searching for the best temporal shift which allows us to superimpose the two functions as much as possible, our problem is then reduced to finding σ * : = arg min σ W 1 ( v , x ˜ σ ) , where x ˜ σ ( t ) = x ( t + σ ) is the function obtained by translating backwards in time by σ time units the function x.

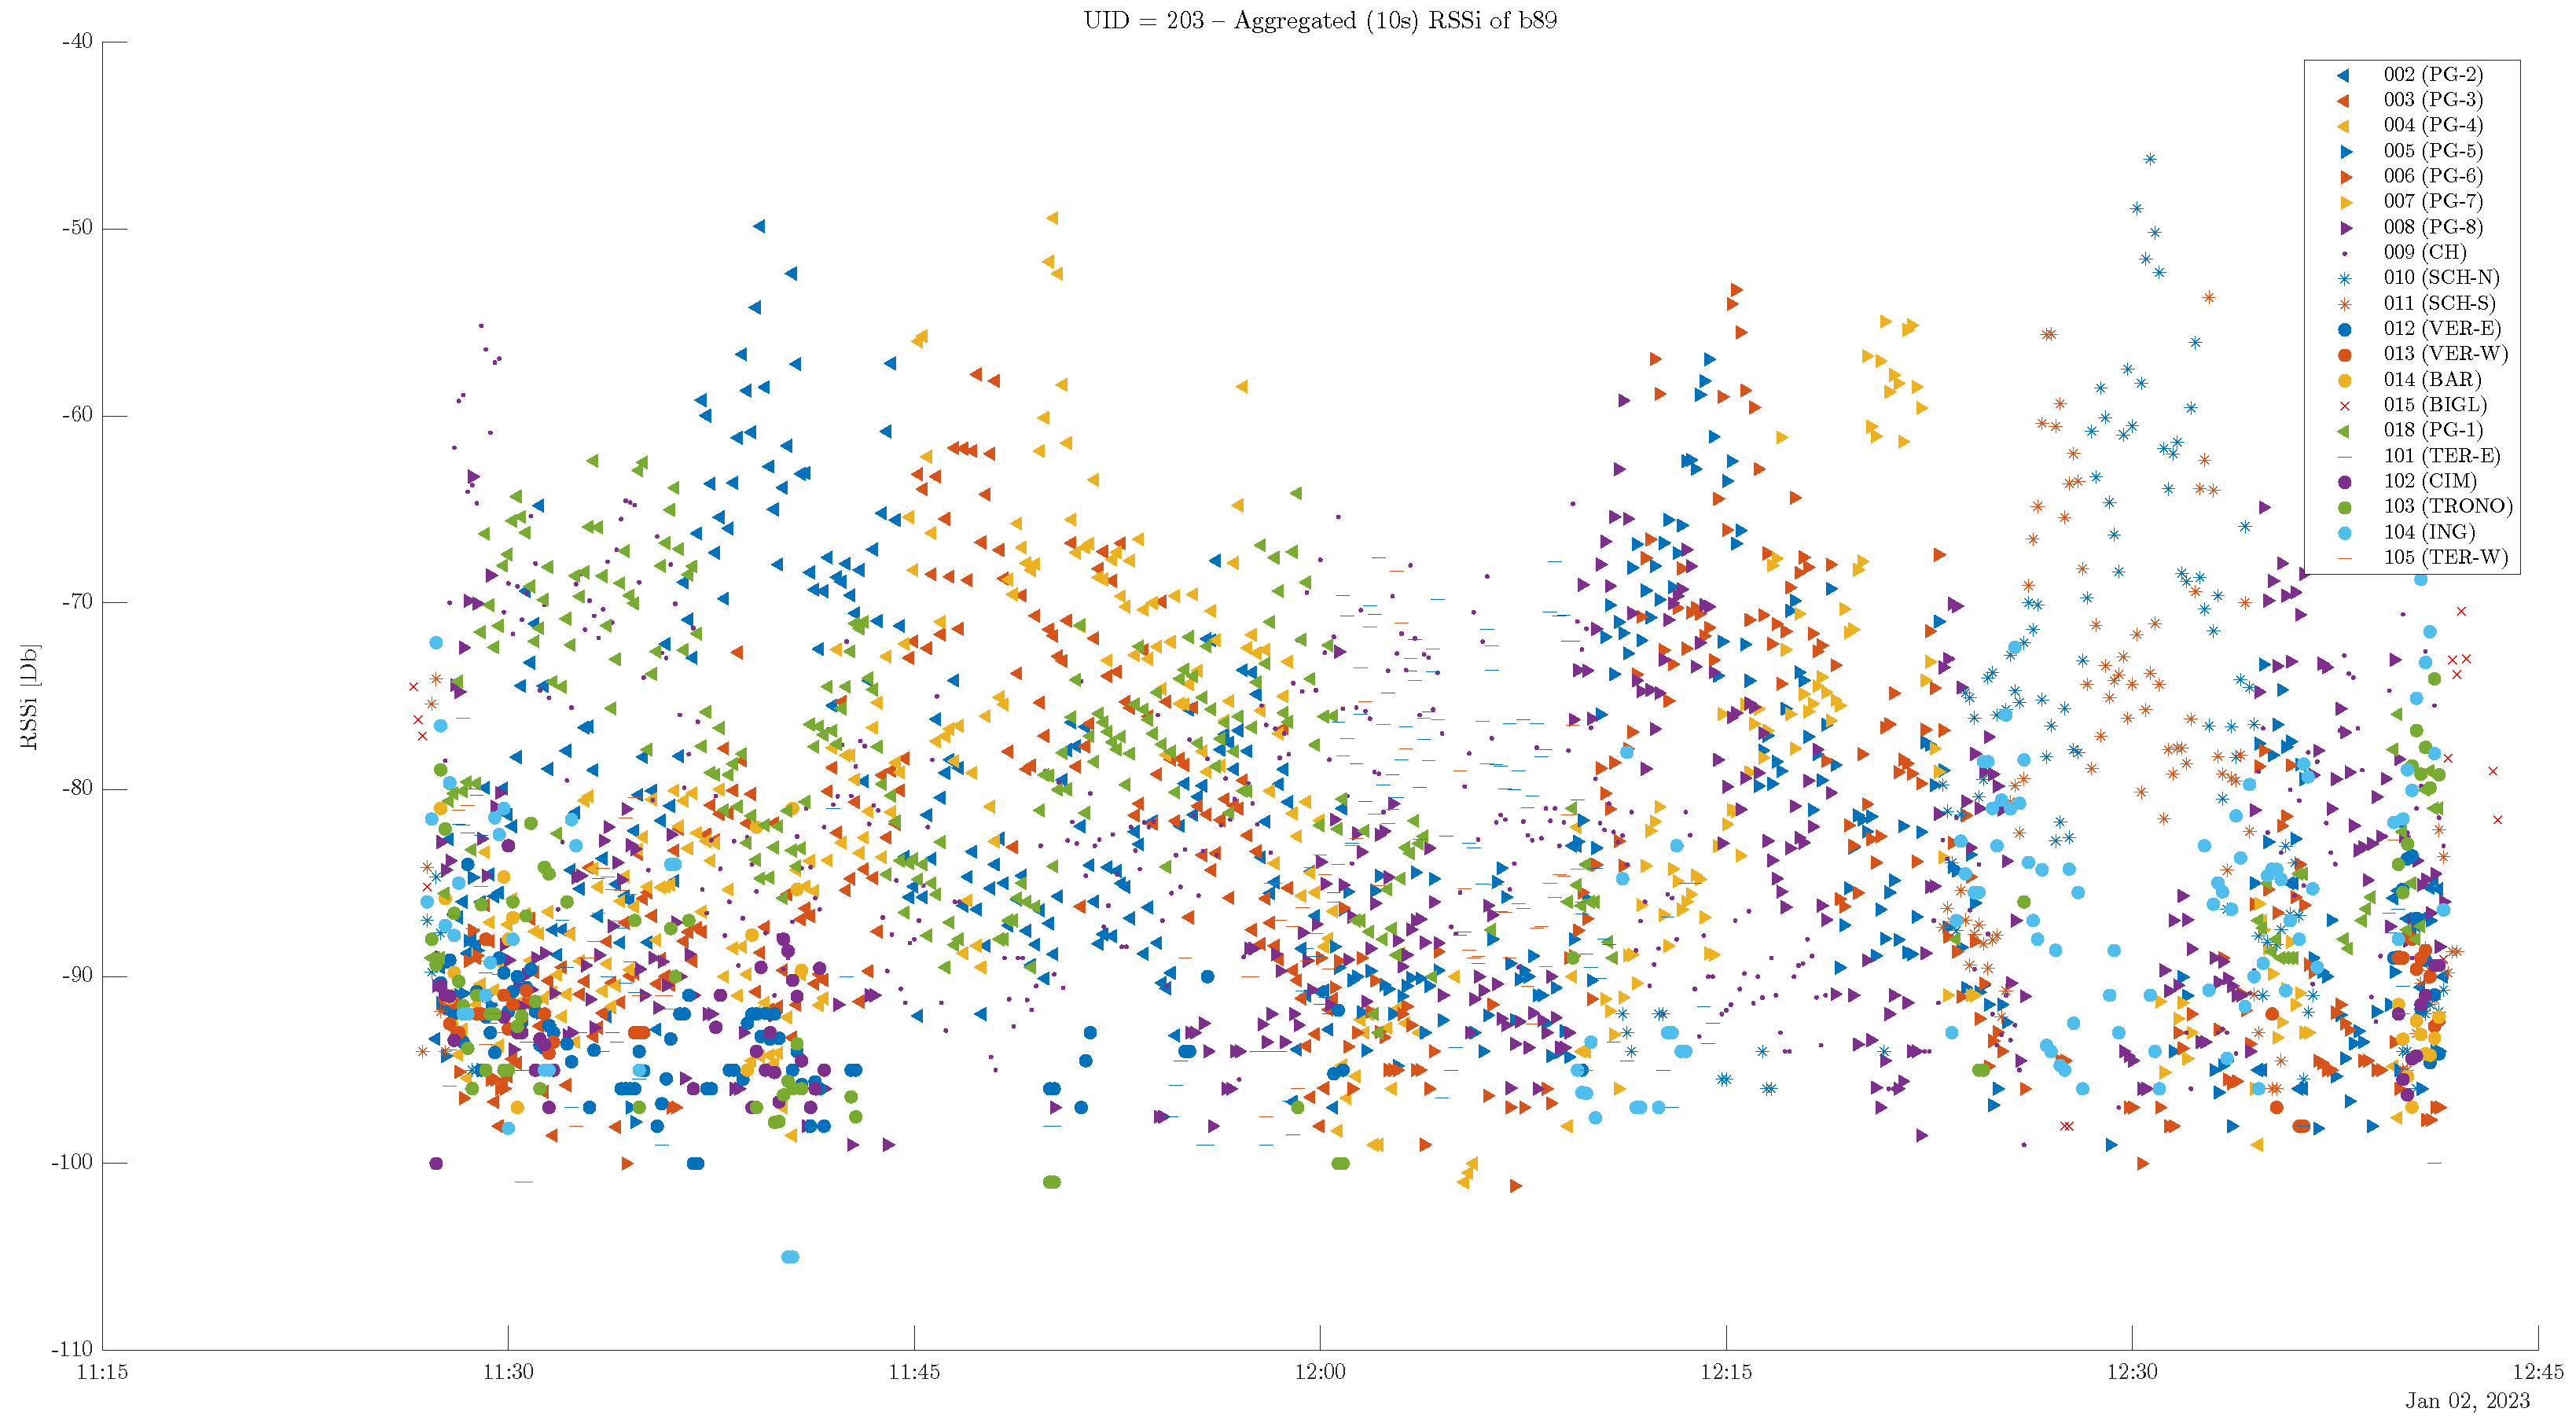
Appendix B. Tracking Visitors and Visitor Flow Re-Organization

Lagrangian data were collected by means of an IoT system composed of the following:
  • A small Bluetooth Low Energy beacon, to be worn by the tracked visitor;
  • A fleet of Raspberry Pi’s, model 3B+ (RPi’s), placed one in each room as receiving antenna and connected to the Internet by a WiFi network;
  • A central server for collecting all data.
The beacon came with the visitor and transmitted every second a signal at +4 dB carrying a unique identifier (UUID). Python 3 code running on each RPi continuously scanned the surrounding area, listening for beacon signals. Each signal was stored as a tuple containing the beacon’s identity, the RSSI, and the timestamp of reception. Every 5 s, a data packet was created; it was signed with the RPi identity, and it was posted on the central server. Finally, the server received data packets from all RPi’s and stored them in a SQL database. The central SQL server received records corresponding to 524 visitors’ trajectories between 28 December 2022 and 7 January 2023. As is usually the case, the vast majority of visitors came in groups (family, friends, guided tours, etc.); in this case, we tracked only one member of each group.
In contrast to the data collection described in [36], here, RPi’s were powered by portable 5 V 3 A power banks, avoiding the use of electrical outlets. This was a great improvement since outlets are often missing in historical buildings. Also, we have positioned some RPi’s outdoors, specifically in the garden and in the Terrazza Marini, protected by plastic cases.
The IoT tracking system provided, for every single visitor, a data map like the one shown in Figure A1.
Every mark represents a signal received by the visitor’s beacon. The height of the marks represents the strength of the signal, while the color of each mark identifies the receiver ID and its shape identifies the zone of the museum (left-side PG, right-side PG, Terrazza, garden, Schulhof, etc.). Marks below −80 dB are likely noise and must be discarded, unless no data with higher power is present at the same time.
One can see that in the region [−75,−50] some clusters appeared: for example, around 11:37 a cluster of blue leftward arrows are visible, meaning that the visitor consistently remained in PG-2 for about 3 min; or, at 12:00, the visitor entered the Terrazza and remained there for about 10 min.
Figure A1. Raw RSSI map of a single beacon.
Atmosphere 16 00860 g0a1
From this kind of data, a number of very useful pieces of information can be extracted:
  • Total duration of visit;
  • time of permanence in each room;
  • followed path (as a sequence of rooms).
A bit more arbitrary, but still measurable, is the degree of interest in the visit. In fact, listless visits are readily recognizable by the short time of permanence in exhibition rooms, by the tendency to skip rooms, and by the large time of permanence in non-exhibition rooms (e.g., Terrazza).
For our purposes, the paths are the most interesting piece of information. For example, the dataset has shown that more than 30% of people visit the museum in a nonlinear manner, re-passing through already-visited rooms in order to reach other, not yet visited, rooms. This behavior increases fluctuations (cf. Figure 6) which, instead, must be avoided by duly suggesting, or forcing if necessary, visitors to follow some predetermined paths. Also, a reorganization of the visitor flow, obtained, e.g., by duly suggesting to new-coming people the first room to visit, allows to have a more uniform occupancy rate in each room at any time, again minimizing fluctuations [36].

References

  1. Camuffo, D. Microclimate for Cultural Heritage: Measurement, Risk Assessment, Conservation, Restoration, and Maintenance of Indoor and Outdoor Monuments; Elsevier: Amsterdam, The Netherlands, 2019. [Google Scholar] [CrossRef]
  2. Martellini, T.; Berlangieri, C.; Dei, L.; Carretti, E.; Santini, S.; Barone, A.; Cincinelli, A. Indoor levels of volatile organic compounds at Florentine museum environments in Italy. Indoor Air 2020, 30, 900–913. [Google Scholar] [CrossRef]
  3. Pagnin, L.; Wiesinger, R.; Koyun, A.N.; Schreiner, M. The effect of pollutant gases on surfactant migration in acrylic emulsion films: A comparative study and preliminary evaluation of surface cleaning. Polymers 2021, 13, 1941. [Google Scholar] [CrossRef] [PubMed]
  4. Colombini, M.P.; Andreotti, A.; Bonaduce, I.; Modugno, F.; Ribechini, E. Analytical strategies for characterizing organic paint media using gas chromatography/mass spectrometry. Acc. Chem. Res. 2010, 43, 715–727. [Google Scholar] [CrossRef] [PubMed]
  5. Blades, N.; Oreszczyn, T.; Bordass, B.; Cassar, M. Guidelines on Pollution Control in Heritage Buildings; Technical Report, Technical Report; UCL: London, UK, 2000. [Google Scholar]
  6. Gysels, K.; Delalieux, F.; Deutsch, F.; Van Grieken, R.; Camuffo, D.; Bernardi, A.; Sturaro, G.; Busse, H.J.; Wieser, M. Indoor environment and conservation in the Royal Museum of Fine Arts, Antwerp, Belgium. J. Cult. Herit. 2004, 5, 221–230. [Google Scholar] [CrossRef]
  7. Nazaroff, W.W. Indoor particle dynamics. Indoor Air 2004, 14, 175–183. [Google Scholar] [CrossRef] [PubMed]
  8. Pease, L.F.; Salsbury, T.I.; Anderson, K.; Underhill, R.M.; Flaherty, J.E.; Vlachokostas, A.; Burns, C.A.; Wang, N.; Kulkarni, G.; James, D.P. Size dependent infectivity of SARS-CoV-2 via respiratory droplets spread through central ventilation systems. Int. Commun. Heat Mass Transf. 2022, 132, 105748. [Google Scholar] [CrossRef]
  9. Paolin, E.; Strlič, M. Volatile organic compounds (VOCs) in heritage environments and their analysis: A review. Appl. Sci. 2024, 14, 4620. [Google Scholar] [CrossRef]
  10. Wang, N.; Ernle, L.; Bekö, G.; Wargocki, P.; Williams, J. Emission rates of volatile organic compounds from humans. Environ. Sci. Technol. 2022, 56, 4838–4848. [Google Scholar] [CrossRef]
  11. Permar, W.; Wielgasz, C.; Jin, L.; Chen, X.; Coggon, M.M.; Garofalo, L.A.; Gkatzelis, G.I.; Ketcherside, D.; Millet, D.B.; Palm, B.B.; et al. Assessing formic and acetic acid emissions and chemistry in western U.S. wildfire smoke: Implications for atmospheric modeling. Environ. Sci. Atmos. 2023, 3, 1620–1641. [Google Scholar] [CrossRef]
  12. Carvalho, L.H.; Magalhães, F.D.; Ferra, J.M. Formaldehyde emissions from wood-based panels - Testing methods and industrial perspectives. In Formaldehyde: Chemistry, Applications and Role In Polymerization; Cheng, C.B., Lin, F.H., Eds.; Nova Science Publishers, Inc.: Hauppauge, NY, USA, 2012; Chapter 2. [Google Scholar]
  13. Brimblecombe, P. The composition of museum atmospheres. Atmos. Environ. B 1990, 24, 1–8. [Google Scholar] [CrossRef]
  14. Reiss, R.; Ryan, P.B.; Koutrakis, P.; Tibbetts, S.J. Ozone Reactive Chemistry on Interior Latex Paint. Environ. Sci. Technol. 1995, 29, 1906–1912. [Google Scholar] [CrossRef] [PubMed]
  15. Shashoua, Y. Conservation of Plastics: Materials Science, Degradation and Preservation; Routlege: Abingdon, UK, 2008. [Google Scholar]
  16. Smedemark, S.H.; Ryhl-Svendsen, M.; Schieweck, A. Quantification of formic acid and acetic acid emissions from heritage collections under indoor room conditions. Part I: Laboratory and field measurements. Herit. Sci. 2020, 8, 58. [Google Scholar] [CrossRef]
  17. Camuffo, D.; Bernardi, A.; Sturaro, G.; Valentino, A. The microclimate inside the Pollaiolo and Botticelli rooms in the Uffizi Gallery, Florence. J. Cult. Herit. 2002, 3, 155–161. [Google Scholar] [CrossRef]
  18. Bonello, M.; Micallef, D.; Borg, S.P. Humidity distribution in high-occupancy indoor micro-climates. Energies 2021, 14, 681. [Google Scholar] [CrossRef]
  19. Jelec, P.A. The microclimate parameters change in the occupied zone inside some large-volume buildings with significant influence of the heat emission from people staying inside. In E3S Web of Conferences; EDP Sciences: Les Ulis, France, 2017; Volume 19, p. 01015. [Google Scholar] [CrossRef]
  20. Maekawa, S.; Ankersmit, B.; Neuhaus, E.; Schellen, H.L.; Beltran, V.; Boersma, F. Investigation into impacts of large numbers of visitors on the collection environment at Our Lord in the Attic. In Proceedings of the Museum Microclimates Conference, Copenhagen, Denmark, 19–23 November 2007; Padfield, T., Borchersen, K., Eds.; The National Museum of Denmark: København, Denmark, 2007. [Google Scholar]
  21. Ferdyn-Grygierek, J.; Kaczmarczyk, J.; Blaszczok, M.; Lubina, P.; Koper, P.; Bulińska, A. Hygrothermal risk in museum buildings located in moderate climate. Energies 2020, 13, 344. [Google Scholar] [CrossRef]
  22. La Gennusa, M.; Lascari, G.; Rizzo, G.; Scaccianoce, G. Conflicting needs of the thermal indoor environment of museums: In search of a practical compromise. J. Cult. Herit. 2008, 9, 125–134. [Google Scholar] [CrossRef]
  23. Schito, E.; Conti, P.; Testi, D. Multi-objective optimization of microclimate in museums for concurrent reduction of energy needs, visitors’ discomfort and artwork preservation risks. Appl. Energy 2018, 224, 147–159. [Google Scholar] [CrossRef]
  24. Thomson, G. The Museum Environment; Butterworths: London, UK, 1978. [Google Scholar]
  25. Stolow, N. Conservation and Exhibitions. Packing, Transport, Storage and Environmental Considerations; Butterworths: London, UK, 1986. [Google Scholar]
  26. Cirrincione, L.; La Gennusa, M.; Peri, G.; Rizzo, G.; Scaccianoce, G. Indoor parameters of museum buildings for guaranteeing artworks preservation and people’s comfort: Compatibilities, constraints, and suggestions. Energies 2024, 17, 1968. [Google Scholar] [CrossRef]
  27. Pretelli, M.; Signorelli, L.; De Vivo, M.A. Improving the accessibility of cultural sites during pandemic through microclimate control. The case of CapsulART applied to the MANN museum in Naples. Stud. Health Technol. Inform. 2022, 297, 507–514. [Google Scholar] [CrossRef]
  28. Nakielska, M.; Pawłowski, K. Conditions of the internal microclimate in the museum. J. Ecol. Eng. 2020, 21, 205–209. [Google Scholar] [CrossRef]
  29. Kompatscher, K. Identifying Indoor Local Microclimates for Safekeeping of Cultural Heritage. Ph.D. Thesis, Technische Universiteit Eindhoven, Eindhoven, The Netherlands, 2021. [Google Scholar]
  30. Perrino, C.; Catrambone, M. Development of a variable-path-length diffusive sampler for ammonia and evaluation of ammonia pollution in the urban area of Rome, Italy. Atmos. Environ. 2004, 38, 6667–6672. [Google Scholar] [CrossRef]
  31. De Santis, F.; Dogeroglu, T.; Fino, A.; Menichelli, S.; Vazzana, C.; Allegrini, I. Laboratory development and field evaluation of a new diffusive sampler to collect nitrogen oxides in the ambient air. Anal. Bioanal. Chem. 2002, 373, 901–907. [Google Scholar] [CrossRef] [PubMed]
  32. De Santis, F.; Allegrini, I.; Fazio, M.C.; Pasella, D.; Piredda, R. Development of a passive sampling technique for the determination of nitrogen dioxide and sulphur dioxide in ambient air. Anal. Chim. Acta 1997, 346, 127–134. [Google Scholar] [CrossRef]
  33. Gibson, L.T.; Cooksey, B.G.; Littlejohn, D.; Tennent, N.H. Determination of experimental diffusion coefficients of acetic acid and formic acid vapours in air using a passive sampler. Anal. Chim. Acta 1997, 341, 1–10. [Google Scholar] [CrossRef]
  34. Roadman, M.J.; Scudlark, J.R.; Meisinger, J.J.; Ullman, W.J. Validation of Ogawa passive samplers for the determination of gaseous ammonia concentrations in agricultural settings. Atmos. Environ. 2003, 37, 2317–2325. [Google Scholar] [CrossRef]
  35. Villanueva, F.; Colmenar, I.; Mabilia, R.; Scipioni, C.; Cabañas, B. Field evaluation of the Analyst® passive sampler for the determination of formaldehyde and acetaldehyde in indoor and outdoor ambient air. Anal. Methods 2013, 5, 516–524. [Google Scholar] [CrossRef]
  36. Centorrino, P.; Corbetta, A.; Cristiani, E.; Onofri, E. Managing crowded museums: Visitors flow measurement, analysis, modeling, and optimization. J. Comput. Sci. 2021, 53, 101357. [Google Scholar] [CrossRef]
  37. Nazaroff, W.W.; Weschler, C.J. Indoor acids and bases. Indoor Air 2020, 30, 559–644. [Google Scholar] [CrossRef]
  38. Spicer, C.W.; Coutant, R.W.; Ward, G.F.; Joseph, D.W.; Gaynor, A.J.; Billick, I.H. Rates and mechanisms of NO2 removal from indoor air by residential materials. Environ. Int. 1989, 15, 643–654. [Google Scholar] [CrossRef]
  39. Grøntoft, T. The influence of photochemistry on outdoor to indoor NO2 in some European museums. Indoor Air 2022, 32, e12999. [Google Scholar] [CrossRef]
  40. Tétreault, J. Polluants Dans Les Musées et Les Archives: Évaluation Des Risques, Stratégies de Contrôle et Gestion de la Preservation; Canadian Conservation Institute: Ottawa, ON, Canada, 2003. [Google Scholar]
  41. Weschler, C.J.; Shields, H.C.; Naik, D.V. Indoor chemistry involving O3, NO, and NO2 as evidenced by 14 months of measurements at a site in southern California. Environ. Sci. Technol. 1994, 28, 2120–2132. [Google Scholar] [CrossRef]
  42. Pitts JR, J.N.; Sanhueza, E.; Atkinson, R.; Carter, W.P.L.; Winer, A.M.; Harris, G.W.; Plum, C.N. An investigation of the dark formation of nitrous acid in environmental chambers. Int. J. Chem. Kinet. 1984, 16, 919–939. [Google Scholar] [CrossRef]
  43. Schwartz, S.E. Trace Atmospheric Constituents. Properties, Transformation and Fates; Wiley and Sons: New York, NY, USA, 1983. [Google Scholar]
  44. Salmon, L.G.; Nazaroff, W.W.; Ligocki, M.P.; Jones, M.C.; Cass, G.R. Nitric acid concentrations in southern California museums. Environ. Sci. Technol. 1990, 24, 1004–1013. [Google Scholar] [CrossRef]
  45. Febo, A.; Perrino, C. Prediction and experimental evidence for high air concentration of nitrous acid in indoor environments. Atmos. Environ. A 1991, 25, 1055–1061. [Google Scholar] [CrossRef]
  46. Kraševec, I.; Menart, E.; Strlič, M.; Kralj Cigić, I. Validation of passive samplers for monitoring of acetic and formic acid in museum environments. Herit. Sci. 2021, 9, 19. [Google Scholar] [CrossRef]
  47. Tétreault, J.; Sirois, J.; Stamatopoulou, E. Studies of lead corrosion in acetic acid environments. Stud. Conserv. 1998, 43, 17–32. [Google Scholar] [CrossRef]
  48. Dimitroulopoulou, C.; Lucica, E.; Johnson, A.; Ashmore, M.R.; Sakellaris, I.; Stranger, M.; Goelen, E. EPHECT I: European household survey on domestic use of consumer products and development of worst-case scenarios for daily use. Sci. Total Environ. 2015, 536, 880–889. [Google Scholar] [CrossRef] [PubMed]
  49. Lefebvre, M.A.; Meuling, W.J.A.; Engel, R.; Coroama, M.C.; Renner, G.; Pape, W.; Nohynek, G.J. Consumer inhalation exposure to formaldehyde from the use of personal care products/cosmetics. Regul. Toxicol. Pharm. 2012, 63, 171–176. [Google Scholar] [CrossRef]
  50. Li, M.; Weschler, C.J.; Bekö, G.; Wargocki, P.; Lucic, G.; Williams, J. Human ammonia emission rates under various indoor environmental conditions. Environ. Sci. Technol. 2020, 54, 5419–5428. [Google Scholar] [CrossRef]
  51. Weschler, C.J.; Shields, H.C.; Naik, D.V. Indoor Ozone Exposures. JAPCA 1989, 39, 1562–1568. [Google Scholar] [CrossRef]
  52. Motta, O.; Pironti, C.; Ricciardi, M.; Rostagno, C.; Bolzacchini, E.; Ferrero, L.; Cucciniello, R.; Proto, A. Leonardo da Vinci’s “Last Supper”: A case study to evaluate the influence of visitors on the museum preservation systems. Environ. Sci. Pollut. Res. 2021, 29, 29391–29398. [Google Scholar] [CrossRef] [PubMed]
  53. Ampollini, L.; Katz, E.F.; Bourne, S.; Tian, Y.; Novoselac, A.; Goldstein, A.H.; Lucic, G.; Waring, M.S.; DeCarlo, P.F. Observations and contributions of real-time indoor ammonia concentrations during HOMEChem. Environ. Sci. Technol. 2019, 53, 8591–8598. [Google Scholar] [CrossRef] [PubMed]
  54. Grzywacz, C.M. Monitoring for Gaseous Pollutants in Museum Environments; Getty Conservation Institute: Los Angeles, CA, USA, 2006. [Google Scholar]
  55. Lunden, M.M.; Revzan, K.L.; Fischer, M.L.; Thatcher, T.L.; Littlejohn, D.; Hering, S.V.; Brown, N.J. The transformation of outdoor ammonium nitrate aerosols in the indoor environment. Atmos. Environ. 2003, 37, 5633–5644. [Google Scholar] [CrossRef]
  56. Cristiani, E.; Piccoli, B.; Tosin, A. Multiscale Modeling of Pedestrian Dynamics; Springer: Berlin/Heidelberg, Germany, 2014. [Google Scholar]
Figure 1. Planimetry of the part of the museum to be monitored, with rooms’ names. Rooms in SCHULHOF are on the ground level, while rooms in PG are on a higher level (referred to as the first floor in the rest of the paper).
Atmosphere 16 00860 g001
Figure 2. Room PG-5. Red arrows indicate the exact position of sampler racks with passive samplers.
Atmosphere 16 00860 g002
Figure 3. Average concentrations of (a) SO2, (b) NOx, (c) NO2, (d) NO, (e) O3, (f) HNO3, (g) HONO, (h) NH3, (i) HCOOH, (j) CH3COOH, and (k) HCHO measured in the rooms PG-2, PG-5, and in the garden of the museum (OUT).
Atmosphere 16 00860 g003aAtmosphere 16 00860 g003b
Figure 4. (a) Mapping of ammonia concentration in the museum in μg/m3. (b) Concentration of ammonia in the two selected rooms (PG-2 and PG-5) during the opening (Day) and closing (Night) times of the museum.
Atmosphere 16 00860 g004
Figure 5. (a) Total number of visitors in PG and SCHULHOF (three days) during the opening hours of the museum. (b) Number of visitors in a single room (one day only, same interval of time).
Atmosphere 16 00860 g005
Figure 6. (a) Temperature and (b) RH during three consecutive days. Shaded areas denote opening hours.
Atmosphere 16 00860 g006
Figure 7. (a) Number of visitors, temperature, and RH in a single room. (b) Zoom around the visitor peak happening between 2 and 3 p.m.
Atmosphere 16 00860 g007
Figure 8. Complete pipeline for computing the daily-scale temporal shift between the number of visitors and temperature: (a) original data; (b) data are normalized to make them comparable; (c) all possible shifts are tested, and the minimal Wasserstein distance is found; (d) visitor data is plotted against the best-shifted temperature.
Atmosphere 16 00860 g008
Figure 9. Same as in Figure 8, but for a different day.
Atmosphere 16 00860 g009
Table 1. Data loggers’ technical specifications.
NameTinytag Plus 2 TGP-4500 https://assets.geminidataloggers.com/pdfs/original/3751-tgp-4500.pdf (accessed on 14 July 2025)HOBO MX1101 https://www.onsetcomp.com/sites/default/files/2023-01/17840-U%20MX1101%20Manual.pdf (accessed on 14 July 2025)
T range[−25 °C, 85 °C][−20 °C, 70 °C]
T accuracy±0.45 °C at 25 °C±0.21 °C from 0 °C to 50 °C
T resp. time25 min to 90% FSD in mov. air7:30 min in mov. air 1 m/s
RH range[0%, 100%][1%, 90%]
RH accuracy±3.0% RH at 25 °C±2.0% from 20% to 80%
RH resp. time40 s to 90% FSD20 s to 90% FSD in mov. air 1 m/s
frequency adopted3 s1 min
Table 2. Monitored parameters, sampling time, and site.
Monitored ParameterPeriodSampling TimeSampling SiteVisitors
SO2, NO2, NOx, HONO,
HNO3, O3, NH3, CH3COOH,
HCOOH, HCHO
22 November 2022–13 December 2022
20 June 2023–10 July 2023
10 Janaury 2024–30 January 2024
3 weeksPG-2, PG-5,
outdoor (garden)
16,250
20,417
11,879
NH329 December 2022–10 January 202313 days13 in PG (first floor),
1 in SCHULHOF
(ground floor),
1 outdoor (garden)
15,934
NH316 May 2023–18 May 20233 days
(9:00 a.m.–6:00 p.m.,
6:00 p.m.–9:00 a.m.)
PG-2, PG-52512
Table 3. Statistical summary of the temperature and relative humidity data monitored during measurement campaigns.
T (°C) RH (%)
MinMaxAvgMinMaxAvg
22 November 2022–13 December 2022PG-2202322498260
PG-5192322448256
20 June 2023–10 July 2023PG-2213624457956
PG-5203523466557
10 January 2024–30 January 2024PG-2132423428356
PG-5142423388556
29 December 2022–10 January 2023PG-2192321517060
PG-5182120557564
16 May 2023–18 May 2023PG-2212222585858
PG-5202221626363
Table 4. I/O ratio in the sampling campaigns with average values.
Dec 2022 Jun 2023 Jan 2024
PG-2PG-5Avg.PG-2PG-5Avg.PG-2PG-5Avg.
SO20.850.700.780.400.600.500.220.300.26
NO20.820.830.820.590.520.550.730.700.72
NO0.700.610.660.600.740.670.901.241.07
NOx0.770.750.760.590.590.590.770.820.80
HONO3.53.73.61320161.41.501.5
HNO30.710.250.480.070.040.050.370.720.55
O30.080.130.100.090.090.090.230.200.22
NH34.33.94.16.67.16.94.04.34.2
CH3COOH3.93.23.52.62.02.33.94.34.1
HCOOH0.740.670.700.500.610.553.23.13.1
HCHO4.74.94.81414142.82.02.4
Disclaimer/Publisher’s Note: The statements, opinions and data contained in all publications are solely those of the individual author(s) and contributor(s) and not of MDPI and/or the editor(s). MDPI and/or the editor(s) disclaim responsibility for any injury to people or property resulting from any ideas, methods, instructions or products referred to in the content.

