Article

Photochemical Ozone Production Along Flight Trajectories in the Upper Troposphere and Lower Stratosphere and Route Optimisation

by
Allan W. Foster
1,*,
Richard G. Derwent
2,
M. Anwar H. Khan
1,
Dudley E. Shallcross
1,3,
Mark H. Lowenberg
4 and
Rukshan Navaratne
5
1
Atmospheric Chemistry Research Group, School of Chemistry, University of Bristol, Bristol BS8 1TS, UK
2
rdscientific, Newbury RG14 2LR, UK
3
Department of Chemistry, University of the Western Cape, Robert Sobukwe Road, Bellville 7375, South Africa
4
School of Civil, Aerospace and Design Engineering, University of Bristol, Bristol BS8 1TR, UK
5
School of Engineering, University of Cardiff, Cardiff CF24 3AA, UK
*
Author to whom correspondence should be addressed.
Atmosphere 2025, 16(7), 858; https://doi.org/10.3390/atmos16070858
Submission received: 30 April 2025 / Revised: 3 July 2025 / Accepted: 8 July 2025 / Published: 14 July 2025
(This article belongs to the Section Air Pollution Control)

Abstract

Aviation is widely recognised to have global-scale climate impacts through the formation of ozone (O3) in the upper troposphere and lower stratosphere (UTLS), driven by emissions of nitrogen oxides (NOX). Ozone is known to be one of the most potent greenhouse gases formed from the interaction of aircraft emission plumes with atmospheric species. This paper follows up on previous research, where a Photochemical Trajectory Model was shown to be a robust measure of ozone formation along flight trajectories post-flight. We use a combination of a global Lagrangian chemistry-transport model and a box model to quantify the impacts of aircraft NOX on UTLS ozone over a five-day timescale. This work expands on the spatial and temporal range, as well as the chemical accuracy reported previously, with a greater range of NOX chemistry relevant chemical species. Based on these models, route optimisation has been investigated, through the use of network theory and algorithms. This is to show the potential inclusion of an understanding of climate-sensitive regions of the atmosphere on route planning can have on aviation’s impact on Earth’s Thermal Radiation balance with existing resources and technology. Optimised flight trajectories indicated reductions in O3 formation per unit NOX are in the range 1–40% depending on the spatial aspect of the flight. Temporally, local winter times and equatorial regions are generally found to have the most significant O3 formation per unit NOX; moreover, hotspots were found over the Pacific and Indian Ocean.

1. Introduction

Aviation plays a critical role in the modern world, contributing to an estimated USD 2.7 trillion and employing 65 million people in 2016 [1]. Aviation’s emissions mass are comparatively low for the transport sector as a whole [2]. However, the unique location in the atmosphere where aviation is active is in the upper troposphere lower stratosphere (referred to as the UTLS hereafter) during cruise altitudes, where emissions have an outsized impact on the climate. Perturbations to the climate associated with the emissions of aviation at cruise altitude are understood to include, in descending order, radiative forcing, contrail (condensation-trail) cirrus, CO2, NOX, aerosols, hydrocarbons, and water vapour, amongst others [3]. In this study, the influence of the emissions of nitrogen oxides (NO, nitric oxide, and NO2, nitrogen dioxide, collectively referred to as NOX) and background and unburnt emissions of volatile organic compounds (VOCs) from aircraft at cruise altitude is investigated using a combination of a global Lagrangian chemistry-transport model and a box model which is a further development of previous work by Derwent et al. [4]. Derwent et al. (2024) [4] investigated the consequences of aircraft NOX emissions on ozone formation in the UTLS using a global chemistry transport model followed by a box model. Ozone impacts were quantified at hourly intervals along 21 real intercontinental flight paths which followed air traffic corridors. The study found NOX impacts to be greatest nearer to the tropics and least significant when involving trans-polar routes. NOX impacts were also found to be significantly smaller than identified from global models used in aviation NOX assessments. The research objective was to analyse how the NOX–O3 relationship for aircraft emissions varies on a global scale with a focus on an expanded spatial-temporal output, and then, to bring to light the significance and relevance of such information in mitigating the impact of aviation on the atmosphere, by elucidating how much the formation of ozone can be reduced in hypothetical flights at a cruise altitude. This was achieved by comparing various path trajectories.
Numerous studies [5,6,7,8,9] have developed different models to estimate the spatial and temporal distribution of ground-level ozone; however, this focuses on aircraft emissions in the UTLS. Reportedly, 90% of aviation’s emissions by mass are emitted in the UTLS [10]; therefore, it is prudent to focus on the perturbations in the chemical and physical interactions in this region of the atmosphere. The UTLS describes the region ±5 km from the tropopause (~8–18 km above sea level [11]). The UTLS region is also particularly climatically and radiatively sensitive to perturbations in gases such as greenhouse gases, as well as aerosols. This is due to greater radiative efficiencies compared to ground level, increased residence times of pollutants, and lower background concentrations and temperatures of chemical species [12,13].
Aviation typically utilises paraffinic kerosene as a fuel, which under clean combustion would lead to emissions of a stoichiometrically set ratio of CO2 and H2O. However, Jet-Fuel A-1 is the standard fuel used for commercial aircraft, which is composed predominantly of kerosene, with impurities and additives [14]. However, any propulsion involving the intake of atmospheric air into engines inherently involves NOX emissions due to the intake of atmospheric nitrogen (N2). The amount of NOX emissions is coupled with the temperature of the intake air in the engines. Aviation’s NOX emissions have been recognised since the 1990s to enhance ozone production and to reduce methane concentrations [15,16]. NOX emissions lead to a non-linear NOX–O3 relationship, whereby, at low NOX concentrations, hydroperoxyl (HO2) radicals increasingly react with NO (Equation (1)), as opposed to its self-reaction radical loss (Equation (2)), leading to hydroxyl radicals (OH). M represents background air molecules.
HO 2 + NO OH + NO 2
HO 2 + HO 2 H 2 O 2 + O 2
To the point where photochemical ozone formation is inhibited, at very low NOX, by hydroxyl radical loss via its conversion to HNO3 in Equation (3):
OH + NO 2 + M HNO 3 + M
From Equation (1), NO2 photolysis produces ground-state atmospheric oxygen, O(3P), and subsequently O3 via the reaction of O(3P) with O2.
NO 2 + h ν λ < 420 nm NO + O P 3
O P 3 + O 2 + M O 3 + M
The ozone production rate is dependent on the availability of O3 in the polluted atmosphere, and described as NOX sensitive (NOX-limited) when increases in NOX leads to promoted levels of photochemical O3, with changes in VOCs having little effect [4,17]. Thus, VOC is limited (VOC-sensitive/NOX saturated) when photochemical ozone formation becomes increasingly sensitive to NOX mixing ratios, to a point where it decreases with increasing NOX.
The hydroperoxy and NO are provided in a generalised scheme for Equations (1) and (2) for VOCs, where RH represents a VOC:
RH + OH R + H 2 O
R + O 2 OH + NO 2
H O 2 + NO OH + NO 2
Alkoxy radicals, RO, are formed by the oxidation of VOCs (RH) by hydroxyl radicals and NO2:
RO 2 + NO RO + NO 2
Net reaction:
RO + 2 O 2 RO 2 + O 3
The ozone production from NOX and VOCs is simplified and summarised in Figure 1.
Incentives, policies, and an industry-wide pledge to reach net-zero carbon emissions by 2050 [19] from the aviation industry have led to developments toward alternative aviation fuels, such as so-called Synthetic/Sustainable Aviation Fuels, hydrogen, and to a lesser extent ammonia [20,21,22,23,24,25,26,27]. Implicit in the combustion of fuels in the air are NOX emissions. Therefore, it is still prudent to have an understanding of the consequences of fuels on the chemistry of NOX. Ozone plays an important role in maintaining the influence of the Earth’s radiation budget [28]; however, perturbations in its mixing ratio are known to alter this radiation budget, thus contributing toward global warming, as well as potentially meteorological effects which may lead to changes in cloud formation and tropospheric stability. The net result of the ozone production, due to direct NOX emissions, constitutes to approximately 16% of aviation’s global warming (of a total radiative forcing of 100.9 mWm−2) for the years 1940 to 2018. This makes NOX-induced effects the third most significant aviation contributor toward climate change after the effects of contrails and CO2 emissions. The comparisons of radiative forcing effects are valid for current aviation fuels; however, as mentioned, ozone formation due to NOX emissions will still contribute with an uptake of alternative fuels. Niklaß et al. [29] showed the potential to re-route aircraft with virtually no additional fuel burn, resulting in a 12% reduction in climate impact associated with aircraft emissions, with other studies suggesting a 10–20% reduction with only a few percent increase in fuel burn. In terms of ozone formation due to aviation emissions in the UTLS, three main sources are understood to exist: NOX photochemical reactions, heterogenous reactions of aerosols, and contrail effects. Heterogenous reactions on aerosol particles have a reported negligible impact on ozone production, but contrail ice can affect the ozone response from aircraft emissions by ±0.5% on a macroscopic scale depending on the time of year and day [30].
Previously, we have reported on the ozone production along flight trajectories on 21 intercontinental routes between major aviation hubs [4]. NOX emissions have two distinct components acting on different time-scales. Only the initial rapid ozone production occurring over a period of hours to days is analysed here. The hydroxyl radical–methane–ozone (OH-CH4-O3)-driven chemistry, which acts over timescales of months and years resulting in the decay of net ozone, is not analysed in this study. In this study, our previous work has been expanded on to cover the whole globe. Ozone formation along a variety of trajectories have then been investigated. Mitigating climate effects of emissions through the optimisation of flight trajectories to reduce the impact on climate sensitive regions has been gaining interest over recent decades [29]. Such trajectory optimisation has primarily focussed on mitigating the formation of persistent contrails and is a significant logistical task requiring cooperation with stakeholders including air traffic management. Trajectory optimisation to reduce ozone formation can also be applicable given the strong spatial and chemical variability in NOX–O3.

2. Materials and Methods

2.1. Algorithms for Optimal Routing

To find optimal routes, including the least ozone produced per unit NOX emissions, Dijkstra’s algorithm, based on network theory, was applied. To do this, a network was set up, where each unit coordinate was set as a node with it is four nearest neighbours, corresponding to north, east, south, and west connected by vertices, with the weight of each vertex set by the ozone part per billion (ppb) produced per unit NOX (ppb). Dijkstra’s algorithm is frequently used in navigation such as the popular navigation application Google Maps [31]. Dijkstra’s algorithm was originally conceived to determine the shortest path to travel between two cities in the Netherlands [32]. Dijkstra’s algorithm was selected due to its ability to always obtain the shortest path between two points with weighted vertices. To act as a comparison between an optimised route and an unoptimised route, the Haversine formula, which falls within the broader category of great-circle calculations, is used. The Haversine formula describes a formula commonly used within navigation to obtain the shortest geographical distance between two coordinate points requiring the longitude and latitude of the origin and destination [33].
Section 2.3 addresses how the NOX–O3 relationship was modelled for aircraft emissions, which varies on a global scale, and Section 2.4 addresses how a model with algorithms brings to light the significance and relevance of such information in mitigating the impact of aviation on the atmosphere, by elucidating how much the formation of ozone can be reduced in hypothetical flights at a cruise altitude. This is achieved by comparing various path trajectories.

2.2. Overview

Derwent et al. (2024) [4] showed the global Lagrangian chemistry-transport and box model approach for the identification of NOX versus VOC sensitivity to be a robust model for the use of five metrics: PO3, O3/NOZ, HCHO/NO2, H2O2/HNO3, and α CH3O2. As part of this study, a Python programme was set up, whereby the IATA (International Air Transport Association) or ICAO (International Civil Aviation Organisation) airport codes for the origin and destination for a flight can be input and the trajectory of least ozone production weight is calculated along with its respective weight, as well as the route of shortest geographical distance, often referred to as the great circle route. This has also been set up to allow for waypoints to be added. Three different flight trajectories are compared: the route of least weight for ozone production by Dijkstra’s algorithm, the route of shortest geographical distance using the Haversine formula, and some real-world flight trajectories obtained from Automatic Dependant Surveillance-Broadcast (ADS-B) data [34]. The programme constructs a connected network from the input data, computes paths following the procedures of the algorithms with their respective weights, and plots these.
Background conditions, in particular mixing ratios of chemical species, were obtained using STOCHEM-CRI; these conditions were then input into the box model. The outputs of which were analysed. Various trajectories and weights were then computed using the network and algorithms.

2.3. STOCHEM-CRI and PTM Model

The STOchastic CHEMistry (STOCHEM) model, (v2-R5, UK Met Office, Exeter, UK) a Lagrangian-based three-dimensional global chemistry transport model, was originally developed to model global distributions of O3, NOX, and CH4. STOCHEM was updated in 2008, to include the Common Representative Intermediate (CRI) chemical mechanisms. STOCHEM has been widely used to describe atmospheric trace gases compositions, simulating the transport and chemical transformation of trace chemical species [35,36,37]. STOCHEM splits the world into 5 by 5 degree grids with 9 vertical layers (0–16 km above ground level), for computational efficiency, and outputs are averaged to a monthly basis to the gridded system. These chemical and meteorological datasets were then input into a box model, i.e., the Particle Tracking Model (PTM), details of which can be found in Witham et al. [38]. The PTM, employing a chemical mechanism based on the Master Chemical Mechanism v3.3.1 [39], followed the chemical development within a parcel for five days (120 h). The box model was set to run, at each geographical location input, initiated at 18:00 h (UTC), so as to include a complete nocturnal period within the spin-up period. A period of five days allows for NOy to return to NOX but not for the diversion from a linear regime [4].
Key parameters were obtained from the UK MetOffice Unified model and include the Meteorological data which is key to the kinetics and transport of the atmospheric STOCHEM model. The chemical data, retaining NOX emissions from lightning, contained species concentrations required for to be followed following the initiation of the box model.
Background chemical conditions were set from the UK MetOffice Unified model and input into the STOCHEM-CRI model for the following tropospheric trace chemical species: CH4, CO, H2, O3, NOX = NO + NO2, HNO3, 15 VOCs (ethane, propane, butane, ethylene, propylene, ethyne, isoprene, formaldehyde, acetaldehyde, methyl ethyl ketone (MEK), propionaldehyde, oxyl (o-xylene), benzene, toluene, but-2-ene), CH3OOH, and two peroxyacylnitrates (PAN, peroxyacetyl nitrate, and MPAN (methacryloyl peroxylnitrate)). Newly added species compared to those studied by Derwent et al. [4] included ethyne, MEK, propionaldehyde, o-xyl, benzene, toluene, and but-2-ene.
To estimate the sensitivity of NOX and VOCs’ sensitivity to O3 formation, three scenarios were set, (1) base case, (2) a 30% reduction in VOC emissions from the base case, and (3) a 30% reduction in NOX and NOy emissions from the base case.
Outputs from the PTM box model were then analysed via the following definitions: locations where the Δ PO3NOX > Δ PO3VOC were defined as NOX-sensitive, where Δ PO3VOC > Δ PO3NOX, VOC-sensitive, and Δ PO3NOX = Δ PO3VOC, equally sensitive. Here, Δ PO3 represents the rate of photochemical ozone formation over a five-day period. Superscripts denote the scenario, e.g., VOC represents scenario 2 with a 30% reduction in VOCs
The ozone production produced was defined as the change in ozone (ppb) normalised by the change in unit NOX (ppb):
O 3 NO X = Δ P O 3 N O X Δ NO X ,
where Δ O3 represents the O3 response to the 30% reduction in NOX and NOy, and Δ P O 3 N O X is normalised by the NOX reduction ( Δ NOX).
Initial NOX mixing ratios are used as these are robust originating from the STOCHEM-CRI output and ozone production is proportional to the initial NOX levels at release from engines.
This measure (O3 ppb per NOX ppb) allows for the ozone production to be compared between locations for any engine type and fuel burn. However, these findings are not to give a definitive or precise representation of the ozone production for flights but an indication of which regions of the globe are most susceptible and sensitive along with the temporal variation and what sort of mitigation can be performed.

2.4. Optimal Routing

Due to the coarse nature of the outputs of the models ( 5 × 5 degree grids), Tensorflow [40] was trained on the STOCHEM outputs to predict ozone concentrations using non-linear regression on a finer 0. 1 × 0 . 1 degree grid scale to allow for trajectory analysis. Tensorflow was set up with an Adam optimiser, a Dense Rectified Linear Unit to capture the non-linear nature of the situation, with 1000 epochs, the setup was found by analysing mean absolute error, mean squared error as the loss function, and r2 between the training and testing data sets split at 80% training data. In these methods, regression employing Tensorflow is applied in downscaling climate models’ resolutions [41,42,43,44]. Dijkstra’s algorithm is computed by initiating at the origin node and iteratively selecting unvisited vertices with the smallest distance from the source, continuing until either all vertices have been visited or the destination node is reached. For the analysis, a few Python (Python 3.9.7-2021.7) [45] packages were used to achieve the computation of route optimisation, i.e., Cartopy [46] (0.24.1), Folium [47] (0.19.4), Matplotlib [48] (3.8.2), pandas [49] (2.2.0), and networkx (3.2), to set up the network of nodes, vertices, and weights and apply Dijkstra’s algorithm [50], Geopy for Haversine trajectory calculations [33] (2.3.0), and Tensorflow (2.17.0) for regression [40].
In summary, a STOCHEM-CRI model was run with aircraft present as a base case scenario. STOCHEM background conditions were then used in the box model, to give a spatial and temporal view of the ozone production across the year over the globe. A programme was then set up, which used a finer scale-regression-based prediction of the global O3 production using Tensorflow, to calculate the optimal route, with the least weight of ozone production, between an origin and a destination as well as comparing this to alternative trajectories such as the route of shortest geographical distance.

3. Results

The following section analyses the NOX–O3 relationship for aircraft emission variations on a global scale with a focus on an expanded spatial-temporal output. The following section brings to light the significance and relevance of such information in mitigating the impact of aviation on the atmosphere, by elucidating how much the formation of ozone can be reduced in hypothetical flights at a cruise altitude. This is achieved by comparing various path trajectories.
Figure 2 presents the sensitivity to NOX and VOC on the STOCHEM gridded globe, with red representing NOX-sensitive regions, blue represents VOC sensitive regions, and green equally sensitive regions. NOX-sensitive regions clearly dominate the globe throughout the year. There is significant variation between NOX-sensitive to VOC-sensitive areas in regions within 30 latitude of the poles on the change from summer to winter seasons, predominantly in the Antarctic region. The fact that NOX regions are dominant aids in focussing on how to reduce ozone formation in the UTLS. For example, recent work on formation flight and its associated NOX saturation is valid.
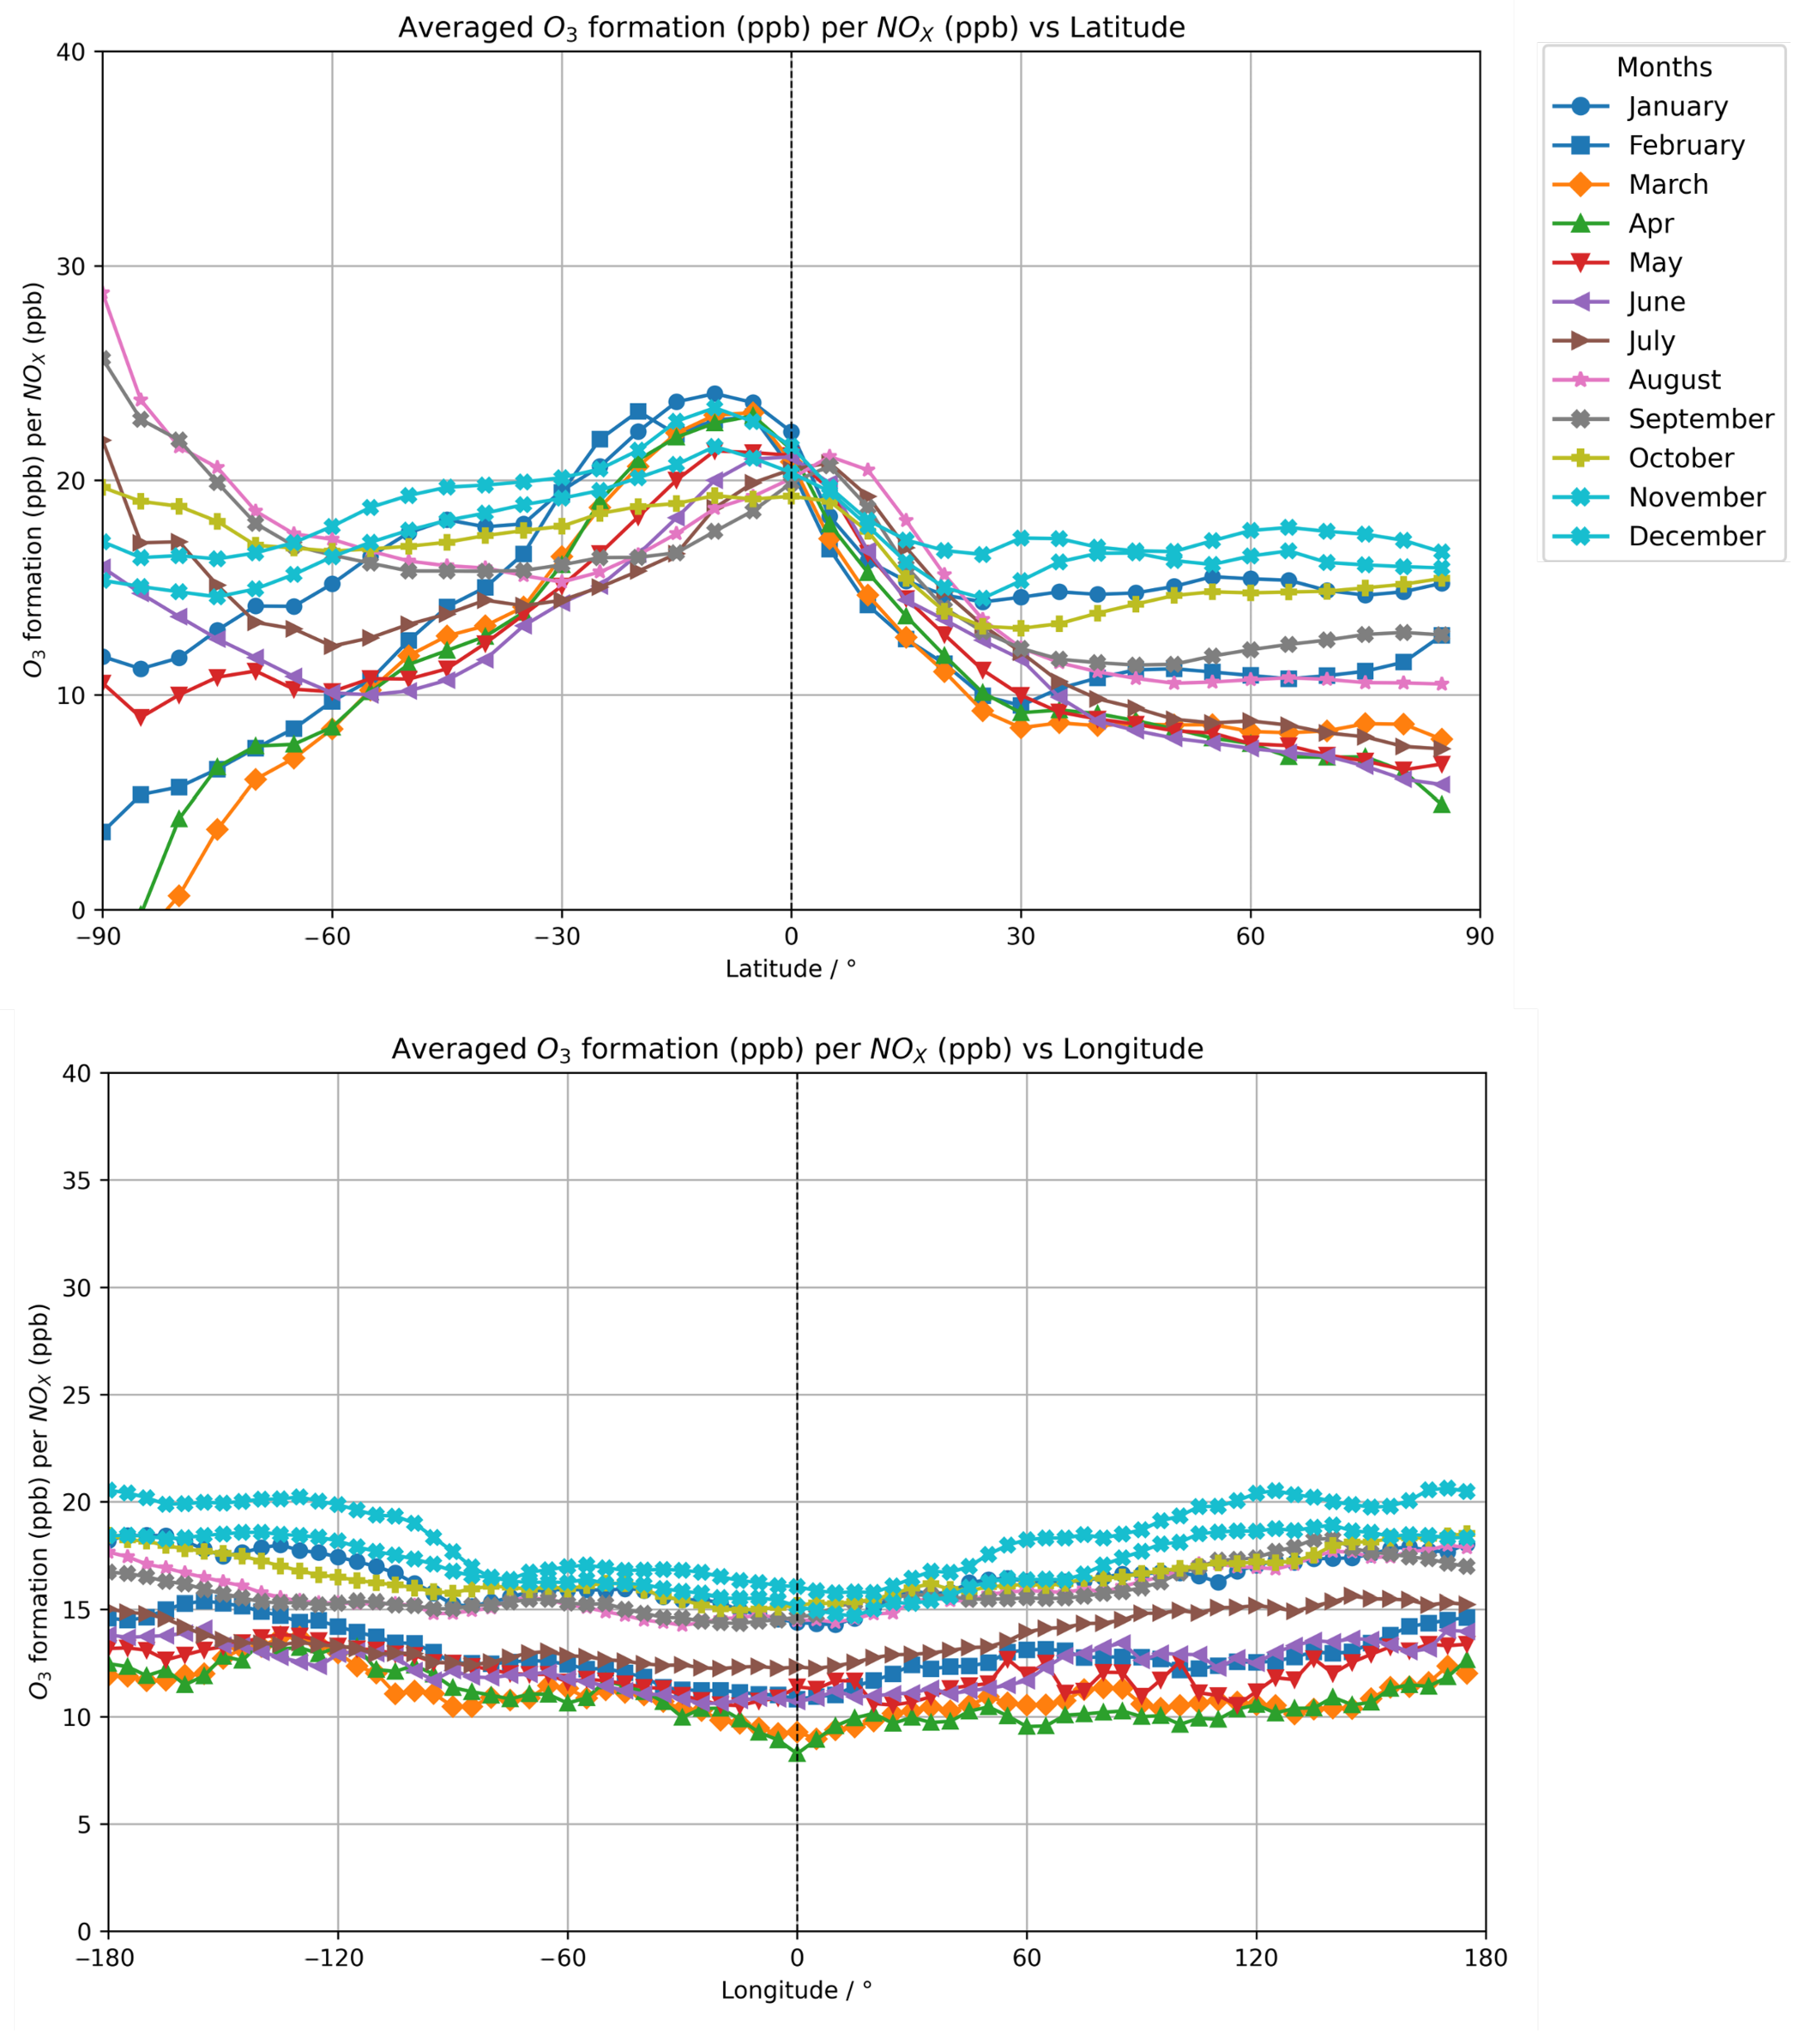
Outputs for the O3 formation (ppb) per NOX (ppb) per 5 × 5 STOCHEM grid were averaged per latitude and per longitude and plotted in Figure 3. Figure 3 shows that average O3 formation (ppb) per NOX (ppb) varies little with longitude bar; though a slight increase can be seen around the Pacific Ocean longitudes, there is a consistency throughout the months. However, the latitude appears to play a significant role in explaining variations in the O3 formation (ppb) per NOX (ppb). This could be due to the inherent link between latitude and solar irradiance with the month of the year. This is further supported by a narrow range across the months for O3 formation (ppb) per NOX (ppb) at the equatorial regions and then toward the poles significant divergence in the range of O3 formation (ppb) per NOX (ppb) values with the month. November to January appears to show the largest O3 formation (ppb) per NOX (ppb) and March to July the lowest O3 formation (ppb) per NOX (ppb). The general decrease in O3 formation (ppb) per NOX (ppb) poleward and minima O3 formation (ppb) per NOX (ppb) during the boreal spring months is consistent with our previous study, as are the magnitudes of O3 formation (ppb) per NOX (ppb).
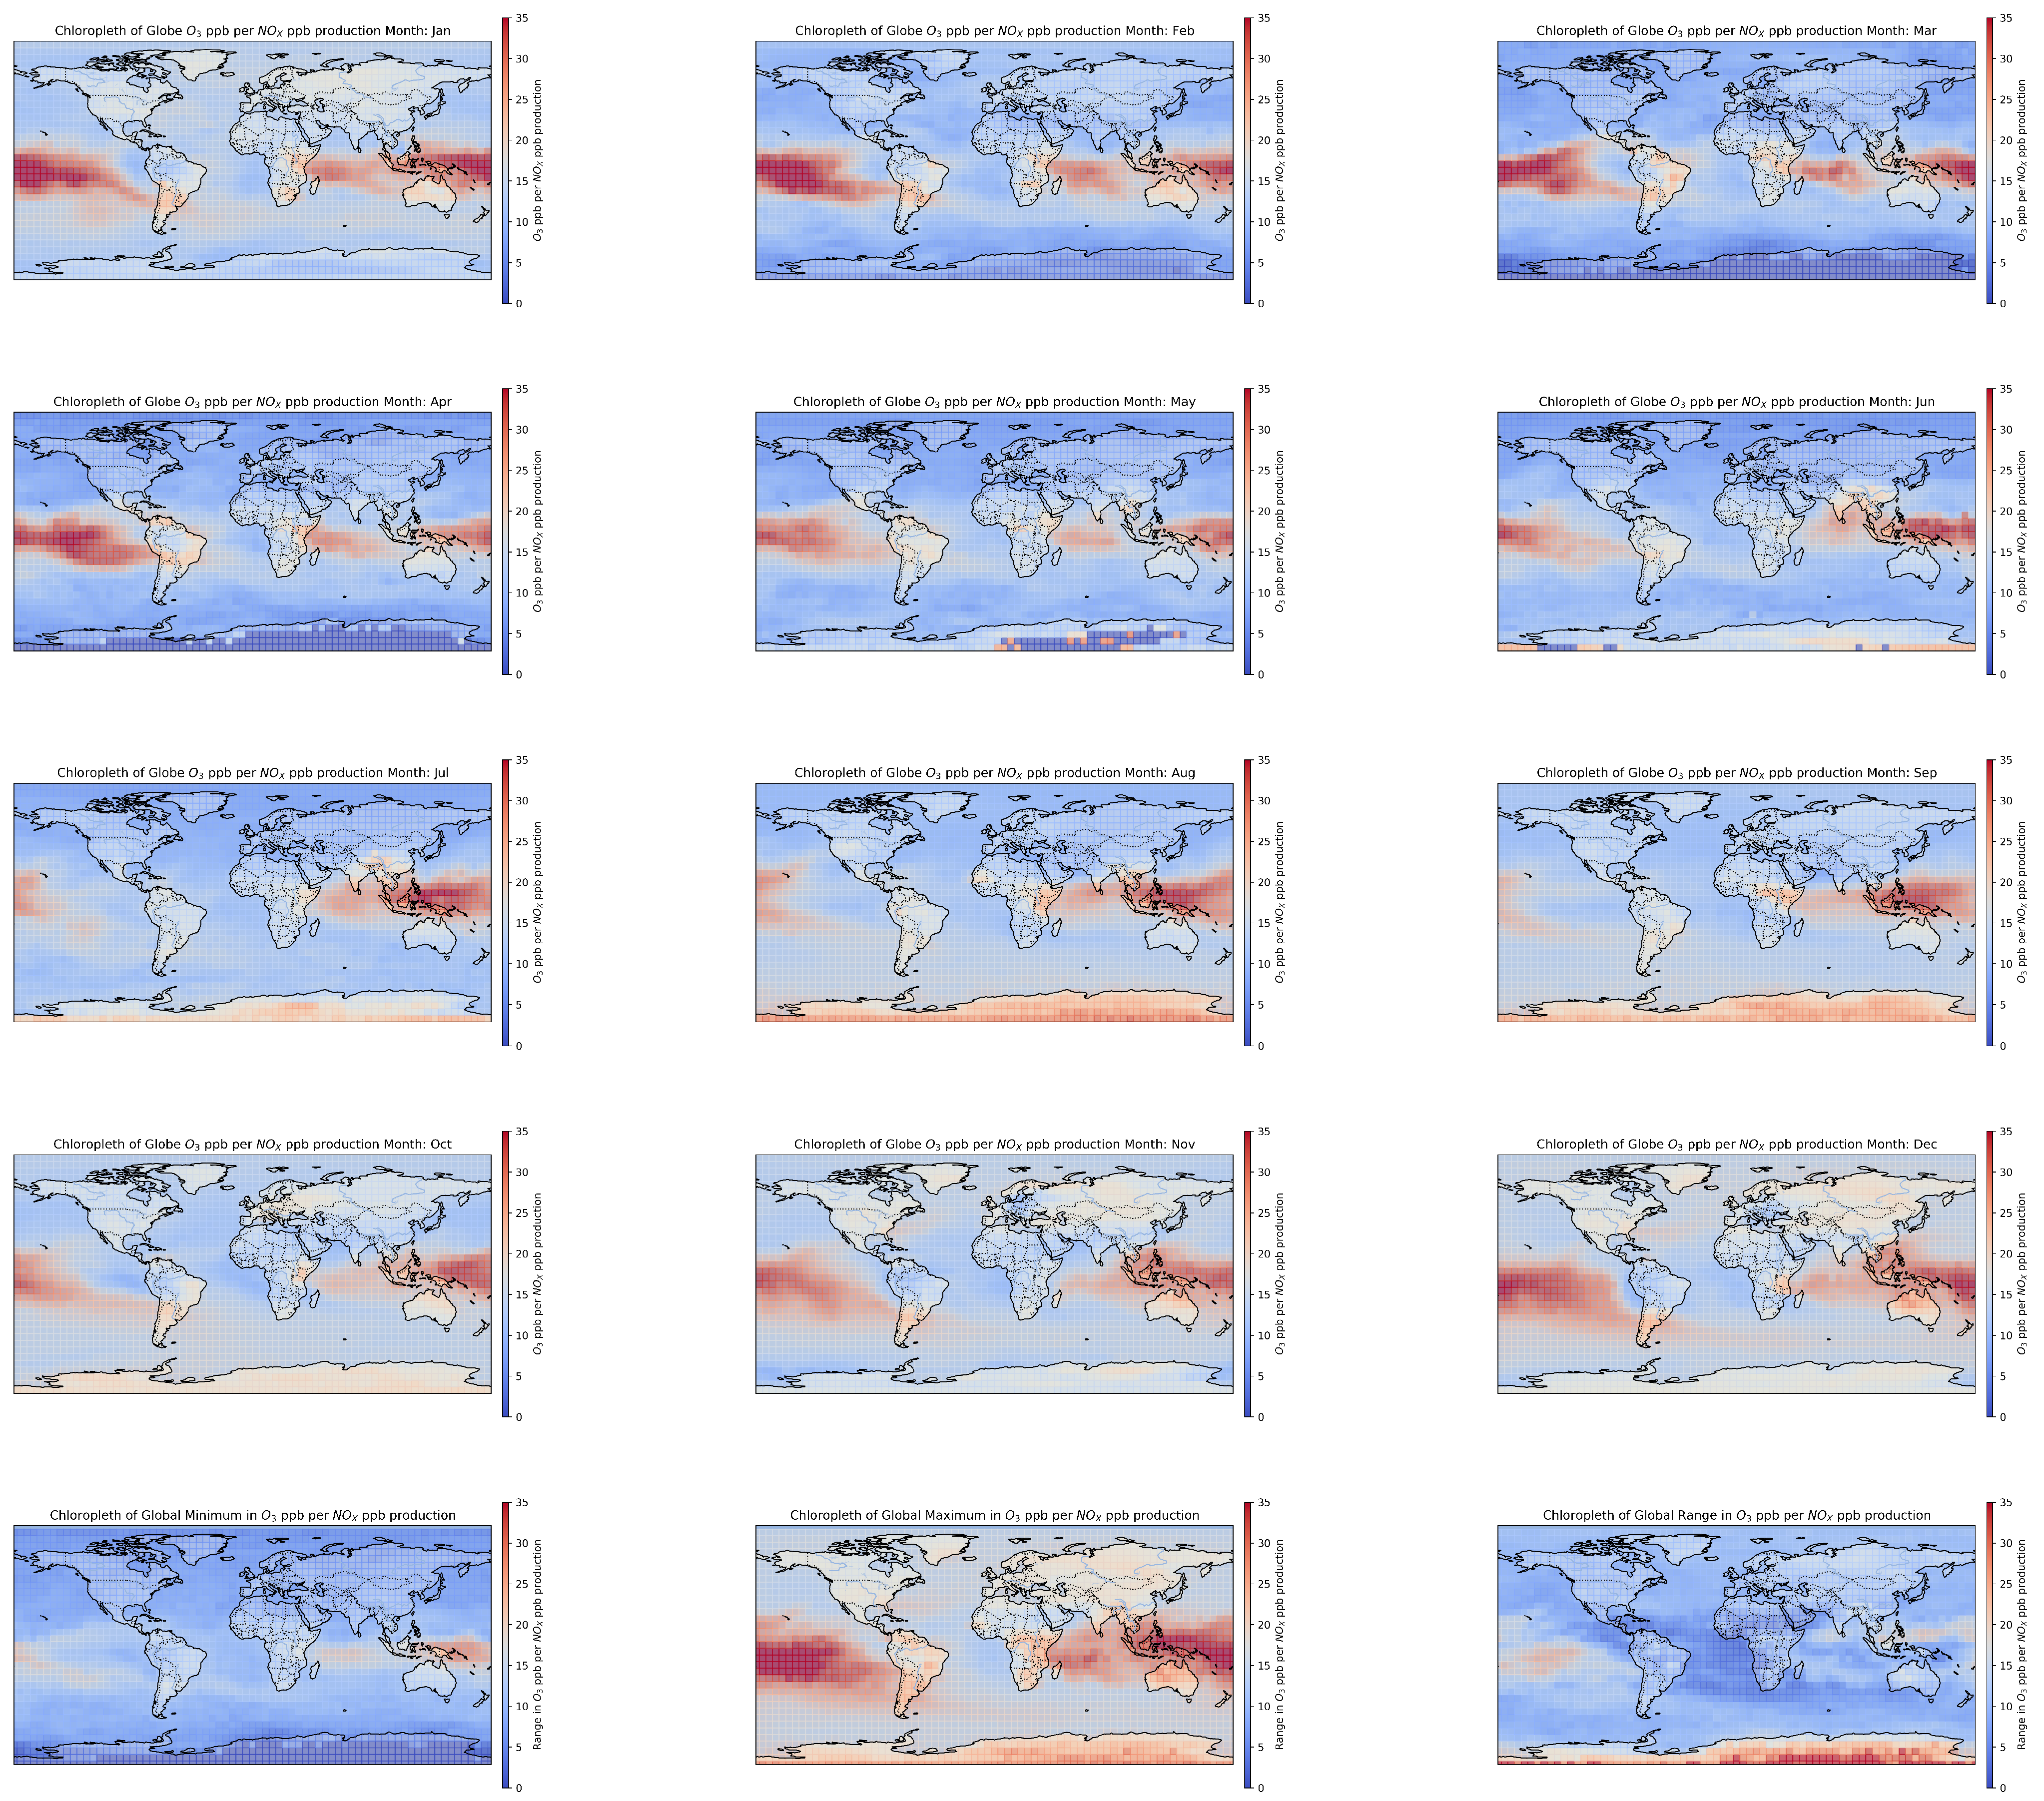
Modelled outputs of O3 formation (ppb) per NOX (ppb) based on STOCHEM and PTM models for the globe in a 5 × 5 degree grid are presented in Figure 4. It should be stressed that these plots show the ozone formation per NOX ppb, and thereby, they are not necessarily the regions with the highest ozone mixing ratios when including aviation plume effects; it is the influence of additional emissions that is of interest here. As evident from the plots in Figure 4, regions over the mid-southern latitudes of the Eastern Pacific Ocean through to the Northern Indian Ocean are susceptible to the greatest ozone formation for a unit of NOX. These marine-based regions align with regions known to exhibit monsoons and El Niño and La Niña, where vertical transport between atmospheric layers may be influencing convection patterns. There are also more local hotspots over the continental land masses, in particular over the regions of Africa and South America, which align with regions with regions of known lightning hotspots which may be enhancing NOX levels. Local hotspots also exist over Europe, North America, and Asia, most prominently in the boreal winter months. Temperate and polar regions show a correlation with the season, with ozone formation peaking in northern latitudes in the boreal winter and in the austral winter for the southern hemisphere. There appears to be a coupling between the season and ozone formation in regions, potentially due to the inherent dependence of many reactions on the photolysis, and hence, solar irradiance, thereby being coupled to the season. The Antarctic continent also displays significant fluctuations and abnormal responses, likely due to the strong coupling to seasonality, and the fact that it receives significantly less solar irradiance due to its geographical position. This may warrant more investigation into this region. However, very few flights are known to traverse the Antarctic continent. The range plot, defined to be the difference in the minimum from the maximum P(O3) per cell, shows the variation in P(O3) across the year, with the majority of regions varying by 5–15 O3 (ppb) per NOX (ppb). Variation occurs mostly over the marine hotspots described, but with little variation over the South Atlantic Ocean. Minimum and maximum plots show the minimum and maximum P(O3) per gridded cell, respectively. Minimum values are fairly consistent and of the order of 5–15 O3 (ppb) per NOX (ppb). Maximum values are broadly over three marine hotspots and over land masses to a lesser degree, with significantly more variation from 10 to 35 O3 (ppb) per NOX (ppb)]. This geospatial variation follows closely with that of the literature [51,52].
An understanding of the geo-spatial sensitivity to ozone provides important information allows trajectories to be planned that avoid regions that are most sensitive to perturbation by plumes of emissions from aviation. Therefore, route optimisation based solely on O3 formation along flight trajectories was tested.
Optimal routing was computed to find the routes and weights of least ozone formation per NOX. Table 1 shows 10 example routes, 3 short-haul and 7 long-haul routes, with typical flight lengths, great circle distances, as well as the weight of ozone (ppb) formation per NOX (ppb) for unoptimised routes (via the Haverine path), an optimised path, and a real-world flight. Routes were selected to cover a global range and regions indicated to be most sensitive to NOX. Optimal routing can be seen to reduce the O3 formation (ppb) per NOX (ppb) of the order of approximately ~40%, which is not insignificant. Trajectories, in Table 1, traversing through tropical regions have significantly larger atmospheric responses from ozone formation than those in boreal or austral regions. Optimal routing would also be more beneficial for long-haul missions, as deviations in flight may be less significant proportionally. The variation in ozone formation along different flight trajectories illustrates the potential to reduce the impact of NOX emissions on the atmospheric response. This highlights the potential and increasingly important balancing of route optimisation to reduce persistent contrail effects, NOX emissions, fuel burn, turbulence, and phenomena.
Based on the O3 ppb per NOX ppb, ozone formation can be estimated for entire flight trajectories, for any aircraft type, and any engine configuration and type based on fuel burn and meteorological conditions, because NOX emissions are a function of the temperature and pressure of the air at intake and fuel burn.
It is not always practical nor feasible for aircraft to fly the optimal in terms of climate impact trajectory due to weather and safety issues. Air Traffic Control, responsible for flight trajectory decision making, takes into account many factors, including weather, payload, and air traffic constraints [53]. Therefore, alternative metrics can be conceived, giving valid weighting to the ozone production and its climate impact together with the increased fuel burn for alternative routes, etc. The programme created has the option to add waypoints along the trajectory, for situations where an aircraft may want to avoid particular geographical areas in flight or to follow pre-determined airway flight plans as closely as possible, to account for such scenarios.
It is important to acknowledge the limitations of this work. Dijkstra’s algorithm uses pre-defined and static weights for the graph at the time of computation. Although in this case, MetOffice data from the Unified Model was used in the STOCHEM process, the graph can be updated with forecast data or alternatives. The setup was designed to represent the physical–chemical behaviour. Tensorflow was applied with a non-linear method to generate a finer scale grid. This is, thus, a predicted graph. Alternative approaches such as various forms of Generative Adversarial Networks. In terms of the algorithms, the great circle trajectory was chosen to represent the shortest possible path and follow what would be typically regarded as the most straightforward path. Alternatively, the A* or Bellman–Ford approach could be applied towards the use of dynamic programming algorithms. The heuristic A* approach, which priorities nodes nearest to the destination, may reduce the runtime, but will not elucidate the degree to which ozone formation could be reduced along flight trajectories. The Bellman–Ford approach allows for graphs with negative weights unlike Dijkstra’s algorithm; however, this was not found to be needed for this application. Dijkstra’s algorithm is a greedy algorithm, that is to say it finds the locally optimal choices to find the global solution as opposed to considering the consequences, and can therefore have long runtimes. However, for the purposes of this work, runtimes were not found to be an issue and not in the timescales for route planning. Real-world operations would not have to follow the path of least weight, but follow the intended trajectories, and in cases where regions are sensitive to ozone formation, avoid such regions with either vertical or horizontal deviations where it is feasible. One could conceive a multi-objective approach, such as a weighted sum method, for optimising the path for contrail, Ozone, fuel burn, flight time, and turbulence factors.
Should such a route optimisation procedure be adopted, the process could be conceptually similar to that of contrail avoidance, minimisation, or mitigation planning. As an example, flight planning analyses weather, air traffic, and operational constraints to determine an ensemble of possible trajectories for a route along with the trajectory, posed here, which avoids regions most prone to forming ozone. Pilots approve the trajectory to be followed and submits the flight plan to air traffic management. The flight then follows the planned route with adjustments for turbulence and or air traffic congestion following air traffic control procedures.
To develop this model further, the timing of departure of an aircraft could be include to further improve the current understanding of diurnal variations. Additionally, focusing on all pressure levels of the STOCHEM-CRI model would allow for the inclusion of the ascent, descent, and taxiing phases of flight to be taken into account in route optimisation, thereby developing a three-dimensional model and flight trajectory. However, this may not be as useful given the lack of flexibility in re-routing in these stages of flight. This model has been developed on offline data and has not yet been used such that it can generate predictions based on forecasts of meteorological and chemical conditions, which is due to the model using chemical and meteorological data from the MetOffice Unified model (UK Met Office, Exeter, UK).

4. Conclusions

Aviation is a significant sector and plays a non-negligible impact on anthropogenic perturbations to the radiation balance of Earth’s atmosphere, with ozone formation being the third most potent contribution from aircraft emissions. A combination of global Lagrangian chemistry-transport model and a box model has been utilised to examine the background NOX and VOC sensitivity of the UTLS. Seasonal and geospatial variations in the sensitivity of the atmosphere have been commented on, finding anomalous behaviour around the Antarctic continent which needs further investigation, hotspots around the Indian and Pacific Oceans, local hotspots, increased O3 ppb per NOX toward equatorial regions, and maxima in O3 ppb per NOX during the local autumn and winter months and minima during boreal spring months. This has then been used to suggest the potential for route optimisation, which has been approached via two algorithms to show optimal routing can reduce ozone formation due to NOX emissions by of the order of 1–40%. Developments have been suggested to make the model more useful in terms of flight planning to reduce it is climate impact as well as improvements to the chemical accuracy.

Author Contributions

Conceptualization, A.W.F., R.G.D., M.A.H.K. and D.E.S.; Methodology, A.W.F., R.G.D., M.A.H.K. and D.E.S.; Software, A.W.F., R.G.D. and M.A.H.K.; Formal analysis, A.W.F., M.A.H.K. and R.G.D.; Resources, A.W.F., M.A.H.K. and D.E.S.; Data curation, A.W.F.; Writing—original draft, A.W.F.; Writing—review & editing, A.W.F., M.A.H.K. and R.G.D.; Visualization, A.W.F.; Supervision, R.G.D., M.A.H.K., D.E.S., M.H.L. and R.N.; Project administration, D.E.S.; Funding acquisition, M.A.H.K., D.E.S., M.H.L. and R.N. All authors have read and agreed to the published version of the manuscript.

Funding

This publication is supported by the GW4+ Doctoral Landscape Training Partnership (DLP) NE/S007504/1.

Institutional Review Board Statement

Not applicable.

Informed Consent Statement

Not applicable.

Data Availability Statement

The raw data supporting the conclusions of this article will be made available by the authors on request.

Acknowledgments

A.W.F. wishes to thank the GW4+ DTP (NERC, UKRI). This publication is supported by the GW4+ Doctoral Landscape Training Partnership (DLP) NE/S007504/1. This work was carried out using the computational facilities of the Advanced Computing Research Centre, University of Bristol—http://www.bristol.ac.uk/acrc/ Access date: 20 January 2025.

Conflicts of Interest

Author Richard G. Derwent was employed by the company RdScientific, Newbury, UK. The remaining authors declare that the research was Conducted in the absence of any commercial or financial relationships that could be construed as a potential conflict of interest.

Abbreviations

The following abbreviations are used in this manuscript:
UTLSUpper Troposphere Lower Stratosphere
NOXNO + NO2
VOCsVolatile Organic Compounds
STOCHEM-CRISTOCHastic chemistry transport model-Common Representative Intermediates
PTMParticle Tracking Model
ppbparts per billion
ADS-BAutomatic Dependent Surveillance–Broadcast
IATAInternational Air Transport Association

References

  1. Oxford Economics. Aviation: Benefits Beyond Borders. 2018. Available online: https://www.oxfordeconomics.com/resource/6cd06413-2aa3-460f-81fd-42984cf7dd14/ (accessed on 3 March 2025).
  2. Hartmann, D.L.; Klein Tank, A.M.G.; Rusticucci, M.; Alexander, L.V.; Brönnimann, S.; Charabi, Y.; Dentener, F.J.; Dlugokencky, E.J.; Easterling, D.R.; Kaplan, A.; et al. Observations: Atmosphere and Surface. In Climate Change 2013: The Physical Science Basis. Contribution of Working Group I to the Fifth Assessment Report of the Intergovernmental Panel on Climate Change; Stocker, T.F., Qin, D., Plattner, G.-K., Tignor, M., Allen, S.K., Boschung, J., Nauels, A., Xia, Y., Bex, V., Midgley, P.M., Eds.; Cambridge University Press: Cambridge, UK; New York, NY, USA, 2013; pp. 159–254. [Google Scholar] [CrossRef]
  3. Lee, D.S.; Fahey, D.W.; Skowron, A.; Allen, M.R.; Burkhardt, U.; Chen, Q.; Doherty, S.J.; Freeman, S.; Forster, P.M.; Fuglestvedt, J.; et al. The contribution of global aviation to anthropogenic climate forcing for 2000 to 2018. Atmos. Environ. 2021, 244, 117834. [Google Scholar] [CrossRef] [PubMed]
  4. Derwent, R.G.; Dosa, M.; Khan, M.A.H.; Holland, R.; Shallcross, D.E. Atmospheric chemistry regimes in intercontinental air traffic corridors: Ozone versus NOx sensitivity. Atmos. Environ. 2024, 328, 120521. [Google Scholar] [CrossRef]
  5. Dai, J.X.; Wang, F.; Zhang, K.; Zhai, H.; Jin, D.; Duan, Y.; Yaluk, E.; Wang, Y.; Huang, L.; Li, Y.; et al. Elucidate long-term changes of ozone in Shanghai based on an integrated machine learning method. Front. Environ. Sci. Eng. 2023, 17, 138. [Google Scholar] [CrossRef]
  6. Zhang, X.; Waugh, D.W.; Kerr, G.H.; Miller, S.M. Surface Ozone-Temperature Relationship: The Meridional Gradient Ratio Approximation. Geophys. Res. Lett. 2022, 49, e2022GL098680. [Google Scholar] [CrossRef]
  7. Chen, Y.; Chen, X.; Xu, A.; Sun, Q.; Peng, X. A hybrid CNN-Transformer model for ozone concentration prediction. Air Qual. Atmos. Health 2022, 15, 1533–1546. [Google Scholar] [CrossRef]
  8. Zhan, J.; Liu, Y.; Ma, W.; Zhang, X.; Wang, X.; Bi, F.; Zhang, Y.; Wu, Z.; Li, H. Ozone formation sensitivity study using machine learning coupled with the reactivity of VOC species. Atmos. Meas. Tech. 2021, 21, 16001–16025. [Google Scholar] [CrossRef]
  9. Ren, J.; Guo, F.; Xie, S. Diagnosing ozone–nox–voc sensitivity and revealing causes of ozone increases in China based on 2013–2021 satellite retrievals. Atmos. Chem. Phys. 2020, 22, 15035–15047. [Google Scholar] [CrossRef]
  10. Vennam, L.P.; Arunachalam, S.; Baek, B.H.; Omary, M.; Binkowski, F.S.; Olsen, S. A Multiscale Modeling Study to Assess Impacts of Full-Flight Aircraft Emissions on Upper Troposphere and Surface Air Quality; Springer: Cham, Switzerland, 2014; pp. 197–203. Available online: https://link.springer.com/chapter/10.1007/978-3-319-04379-1_32 (accessed on 5 February 2025).
  11. Hoinka, K.P. Temperature, Humidity, and Wind at the Global Tropopause. Mon. Wea. Rev. 1999, 127, 2248–2265. [Google Scholar] [CrossRef]
  12. Johnson, C.; Henshaw, J.; McInnes, G. Impact of aircraft and surface emissions of nitrogen oxides on tropospheric ozone and global warming. Atmos. Environ. 1992, 355, 723–733. [Google Scholar] [CrossRef]
  13. Schumann, U. The impact of nitrogen oxides emissions from aircraft upon the atmosphere at flight altitudes—Results from the aeronox project. Atmos. Environ. 1997, 32, 1723–1733. [Google Scholar] [CrossRef]
  14. Romanczyk, M. Chemical compositional analysis of jet fuels: Contributions of mass spectrometry in the 21st century. Mass Spectrom. Rev. 2022, 43, 345–368. [Google Scholar] [CrossRef] [PubMed]
  15. Penner, J.E.; Lister, D.H.; Griggs, D.J.; Dokken, D.J.; McFarland, M. Intergovernmental Panel on Climate Change (IPCC). In Aviation and the Global Atmosphere: A Special Report of IPCC Working Groups I and III; Cambridge University Press: Cambridge, UK, 1999; Available online: https://archive.ipcc.ch/ipccreports/sres/aviation/index.php?idp=0 (accessed on 18 February 2025).
  16. Skowron, A.; Lee, D.S.; Raper, D.W. The impact of aviation NOx emissions on tropospheric ozone: A global model study. Atmos. Environ. 2015, 106, 219–228. [Google Scholar] [CrossRef]
  17. Sillman, S.; Logan, J.A.; Wofsy, S.C. The sensitivity of ozone to nitrogen oxides and hydrocarbons in regional ozone episodes. J. Geophys. Res. 1990, 95, 1837–1851. [Google Scholar] [CrossRef]
  18. Jenkin, M.E.; Watson, L.A.; Utembe, S.R.; Shallcross, D.E. A Common Representative Intermediates (CRI) mechanism for VOC degradation. Part 1: Gas phase mechanism development. Atmos. Environ. 2008, 42, 7185–7195. [Google Scholar] [CrossRef]
  19. IATA Airline Commitment to Net Zero 2050. 2021. Available online: https://www.iata.org/contentassets/d13875e9ed784f75bac90f000760e998/iata-agm-resolution-on-net-zero-carbon-emissions.pdf (accessed on 18 February 2025).
  20. Cheng, J. The Adoption of Hydrogen Fuel in Aviation: Incentives and Challenges for Decarbonization. Highlights Sci. Eng. Technol. 2024, 119, 16–22. [Google Scholar] [CrossRef]
  21. Zhang, Y. Towards Greener Skies: Exploring the Potential of Hydrogen Energy in Aviation. Theor. Nat. Sci. 2024, 56, 105–111. [Google Scholar] [CrossRef]
  22. Eoukich, K.; Kohen, A.E.; Bouskouk, N.; Azergui, F.Z.; Salhi, A.; Alj, Y.S. Viability Study of Ammonia as Aircraft Fuel for Airbus A320 with Integrated Carbon Fiber Structures. In Proceedings of the 2024 IEEE International Conference on Mechatronics and Automation (ICMA), Tianjin, China, 4–7 August 2024; pp. 172–177. [Google Scholar] [CrossRef]
  23. Patel, K.; Goyal, V.; Cotto, B.; Otto, M.; Veselý, L.; Kapat, J.; Shi, M. Transient Modeling of an Aero-Engine Using Ammonia As a Fuel Carrier. In Proceedings of the ASME Turbo Expo 2024: Turbomachinery Technical Conference and Exposition, London, UK, 24–28 June 2024. [Google Scholar] [CrossRef]
  24. Köse, Y.; Polat, E.O. An Empirical Analysis on the Use of Sustainable Fuels in the Aviation Industry. Int. J. Aviat. Sci. Technol. 2024, vm05, 90–100. [Google Scholar] [CrossRef]
  25. Zhi, Y. Electric Aviation: Pioneering the Future through Advances in Electric Vehicle Technologies. Highlights Sci. Eng. Technol. 2024, 121, 202–207. [Google Scholar] [CrossRef]
  26. Pattanayak, T.; Mavris, D.N. Battery Technology in Aviation: Current State and Future Prospects. Preprint 2024. [Google Scholar] [CrossRef]
  27. Jadhav, P.S.N.; Hg, P.; Faizulla, M.; Naik, V. A Comprehensive Overview of Electric Aircraft Propulsion. Int. Adv. Res. J. Sci. Eng. Technol. 2024, 11, 243–250. [Google Scholar] [CrossRef]
  28. Deitrick, R.; Goldblatt, C. Effects of ozone Levels on Climate Through Earth History. Clim. Past 2022, 19, 1201–1218. [Google Scholar] [CrossRef]
  29. Niklaß, M.; Lührs, B.; Grewe, V.; Dahlmann, K.; Luchkova, T.; Linke, F.; Gollnick, V. Potential to reduce the climate impact of aviation by climate restricted airspaces. Transp. Policy 2019, 83, 102–110. [Google Scholar] [CrossRef]
  30. Meilinger, S.K.; Kärcher, B.; Peter, T. Microphysics and heterogeneous chemistry in aircraft plumes—High sensitivity on local meteorology and atmospheric composition. Atmos. Chem. Phys. 2005, 5, 533–545. [Google Scholar] [CrossRef]
  31. Lanning, D.; Harrell, G.; Wang, J. Dijkstra’s algorithm and Google maps. In Proceedings of the 2014 ACM Southeast Regional Conference, Kennesaw, GA, USA, 28–29 March 2014; pp. 1–3. [Google Scholar] [CrossRef]
  32. Dijkstra, E.W. A note on two problems in connexion with graphs. Numer. Math. 1959, 1, 269–271. [Google Scholar] [CrossRef]
  33. GeoPy Contributors. GeoPy: Geocoding Library for Python, Version 2.4.0.; GitHub: San Francisco, CA, USA, 2024; Available online: https://geopy.readthedocs.io/ (accessed on 20 January 2025).
  34. Flightradar24. ADS-B Data. 2025. Available online: https://www.flightradar24.com/data/ (accessed on 8 December 2024).
  35. Utembe, S.R.; Cooke, M.C.; Archibald, A.T.; Jenkin, M.E.; Derwent, R.G.; Shallcross, D.E. Using a reduced Common Representative Intermediates (CRI v2-R5) mechanism to simulate tropospheric ozone in a 3-D Lagrangian chemistry transport model. Atmos. Environ. 2010, 13, 1609–1622. [Google Scholar] [CrossRef]
  36. Khan, M.A.H.; Cooke, M.C.; Utembe, S.R.; Archibald, A.T.; Derwent, R.G.; Jenkin, M.E.; Morris, W.C.; South, N.; Hansen, J.C.; Francisco, J.S.; et al. Global analysis of peroxy radicals and peroxy radical-water complexation using the STOCHEM-CRI global chemistry and transport model. Atmos. Environ. 2015, 106, 278–287. [Google Scholar] [CrossRef]
  37. Wasiuk, D.K.; Khan, M.A.H.; Shallcross, D.E.; Lowenberg, M.H. The impact of global aviation NOx emissions on tropospheric composition changes from 2005 to 2011. Atmos. Res. 2016, 178–179, 73–83. [Google Scholar] [CrossRef]
  38. Derwent, R.G.; Witham, C.S.; Utembe, S.R.; Jenkin, M.E.; Passant, N.R. Ozone in Central England: The impact of 20 years of precursor emission controls in Europe. Environ. Sci. Policy 2010, 13, 195–204. [Google Scholar] [CrossRef]
  39. Jenkin, M.E.; Young, J.C.; Rickard, A.R. The MCM v3.3.1 degradation scheme for isoprene. Atmos. Chem. Phys. 2015, 15, 11433–11459. [Google Scholar] [CrossRef]
  40. Abadi, M.; Agarwal, A.; Barham, P.; Brevdo, E.; Chen, Z.; Citro, C.; Corrado, G.S.; Davis, A.; Dean, J.; Devin, M.; et al. TensorFlow: Large-Scale Machine Learning on Heterogeneous Systems. 2015. Available online: https://tensorflow.org (accessed on 20 January 2025).
  41. Li, G.; Cao, G. Generative Adversarial Models for Extreme Downscaling of Climate Datasets. arXiv 2024, arXiv:2402.14049. [Google Scholar] [CrossRef]
  42. Ballard, T.; Erinjippurath, G. Contrastive Learning for Climate Model Bias Correction and Super-Resolution. arXiv 2022, arXiv:2211.07555. [Google Scholar] [CrossRef]
  43. Stengel, K.; AhtHettinger, D.; King, R. Adversarial super-resolution of climatological wind and solar data. Proc. Natl. Acad. Sci. USA 2020, 117, 16805–16815. [Google Scholar] [CrossRef] [PubMed]
  44. Prathom, C.; Champrasert, P. An Exploration of Interpolation—Machine Learning Model for Climate Model Downscaling Under the Limitation of Data Quantity. In Proceedings of the 2023 International Technical Conference on Circuits/Systems, Computers, and Communications (ITC-CSCC), Jeju, Republic of Korea, 25–28 June 2023. [Google Scholar] [CrossRef]
  45. Python Language Reference, Version 3; Python Software Foundation: Beaverton, OR, USA, 2008. Available online: https://www.python.org (accessed on 1 December 2024).
  46. Met Office. Cartopy: A Cartographic Python Library with a Matplotlib Interface. 2010–2015. Available online: https://scitools.org.uk/cartopy (accessed on 1 December 2024).
  47. Python-Visualization. Folium: Interactive Maps in Python. 2020. Available online: https://python-visualization.github.io/folium/ (accessed on 1 December 2024).
  48. Hunter, J.D. Matplotlib: A 2D graphics environment. Comput. Sci. Eng. 2007, 9, 90–95. [Google Scholar] [CrossRef]
  49. McKinney, W. Data Structures for Statistical Computing in Python. In Proceedings of the 9th Python in Science Conference, Austin, TX, USA, 28 June–3 July 2010; Van der Walt, S., Millman, J., Eds.; pp. 56–61. [Google Scholar] [CrossRef]
  50. Hagberg, A.A.; Schult, D.A.; Swart, P.J. Exploring network structure, dynamics, and function using NetworkX. In Proceedings of the 7th Python in Science Conference, Pasadena, CA, USA, 19–24 August 2008; Varoquaux, G., Vaught, T., Millman, J., Eds.; pp. 11–15. Available online: https://networkx.org (accessed on 20 November 2024).
  51. Khan, M.A.H.; Miles, B.; Jenkin, M.E.; Richard, G.; Percival, C.J.; Shallcross, D.E. Investigating the Impacts of Nonacyl Peroxy Nitrates on the Global Composition of the Troposphere Using a 3-D Chemical Transport Model, STOCHEM-CRI. ACS Earth Space Chem. 2020, 4, 1201–1212. [Google Scholar] [CrossRef]
  52. Gilmore, C.K.; Barrett, S.R.H.; Koo, J.; Wang, Q. Temporal and spatial variability in the aviation NOx-related O3 impact. Environ. Res. Lett. 2013, 8, 034027. [Google Scholar] [CrossRef]
  53. Soler, M.; Olivares, A.; Staffetti, E. Multiphase optimal control framework for commercial aircraft four-dimensional flight-planning problems. J. Aircr. 2015, 52, 274–286. [Google Scholar] [CrossRef]
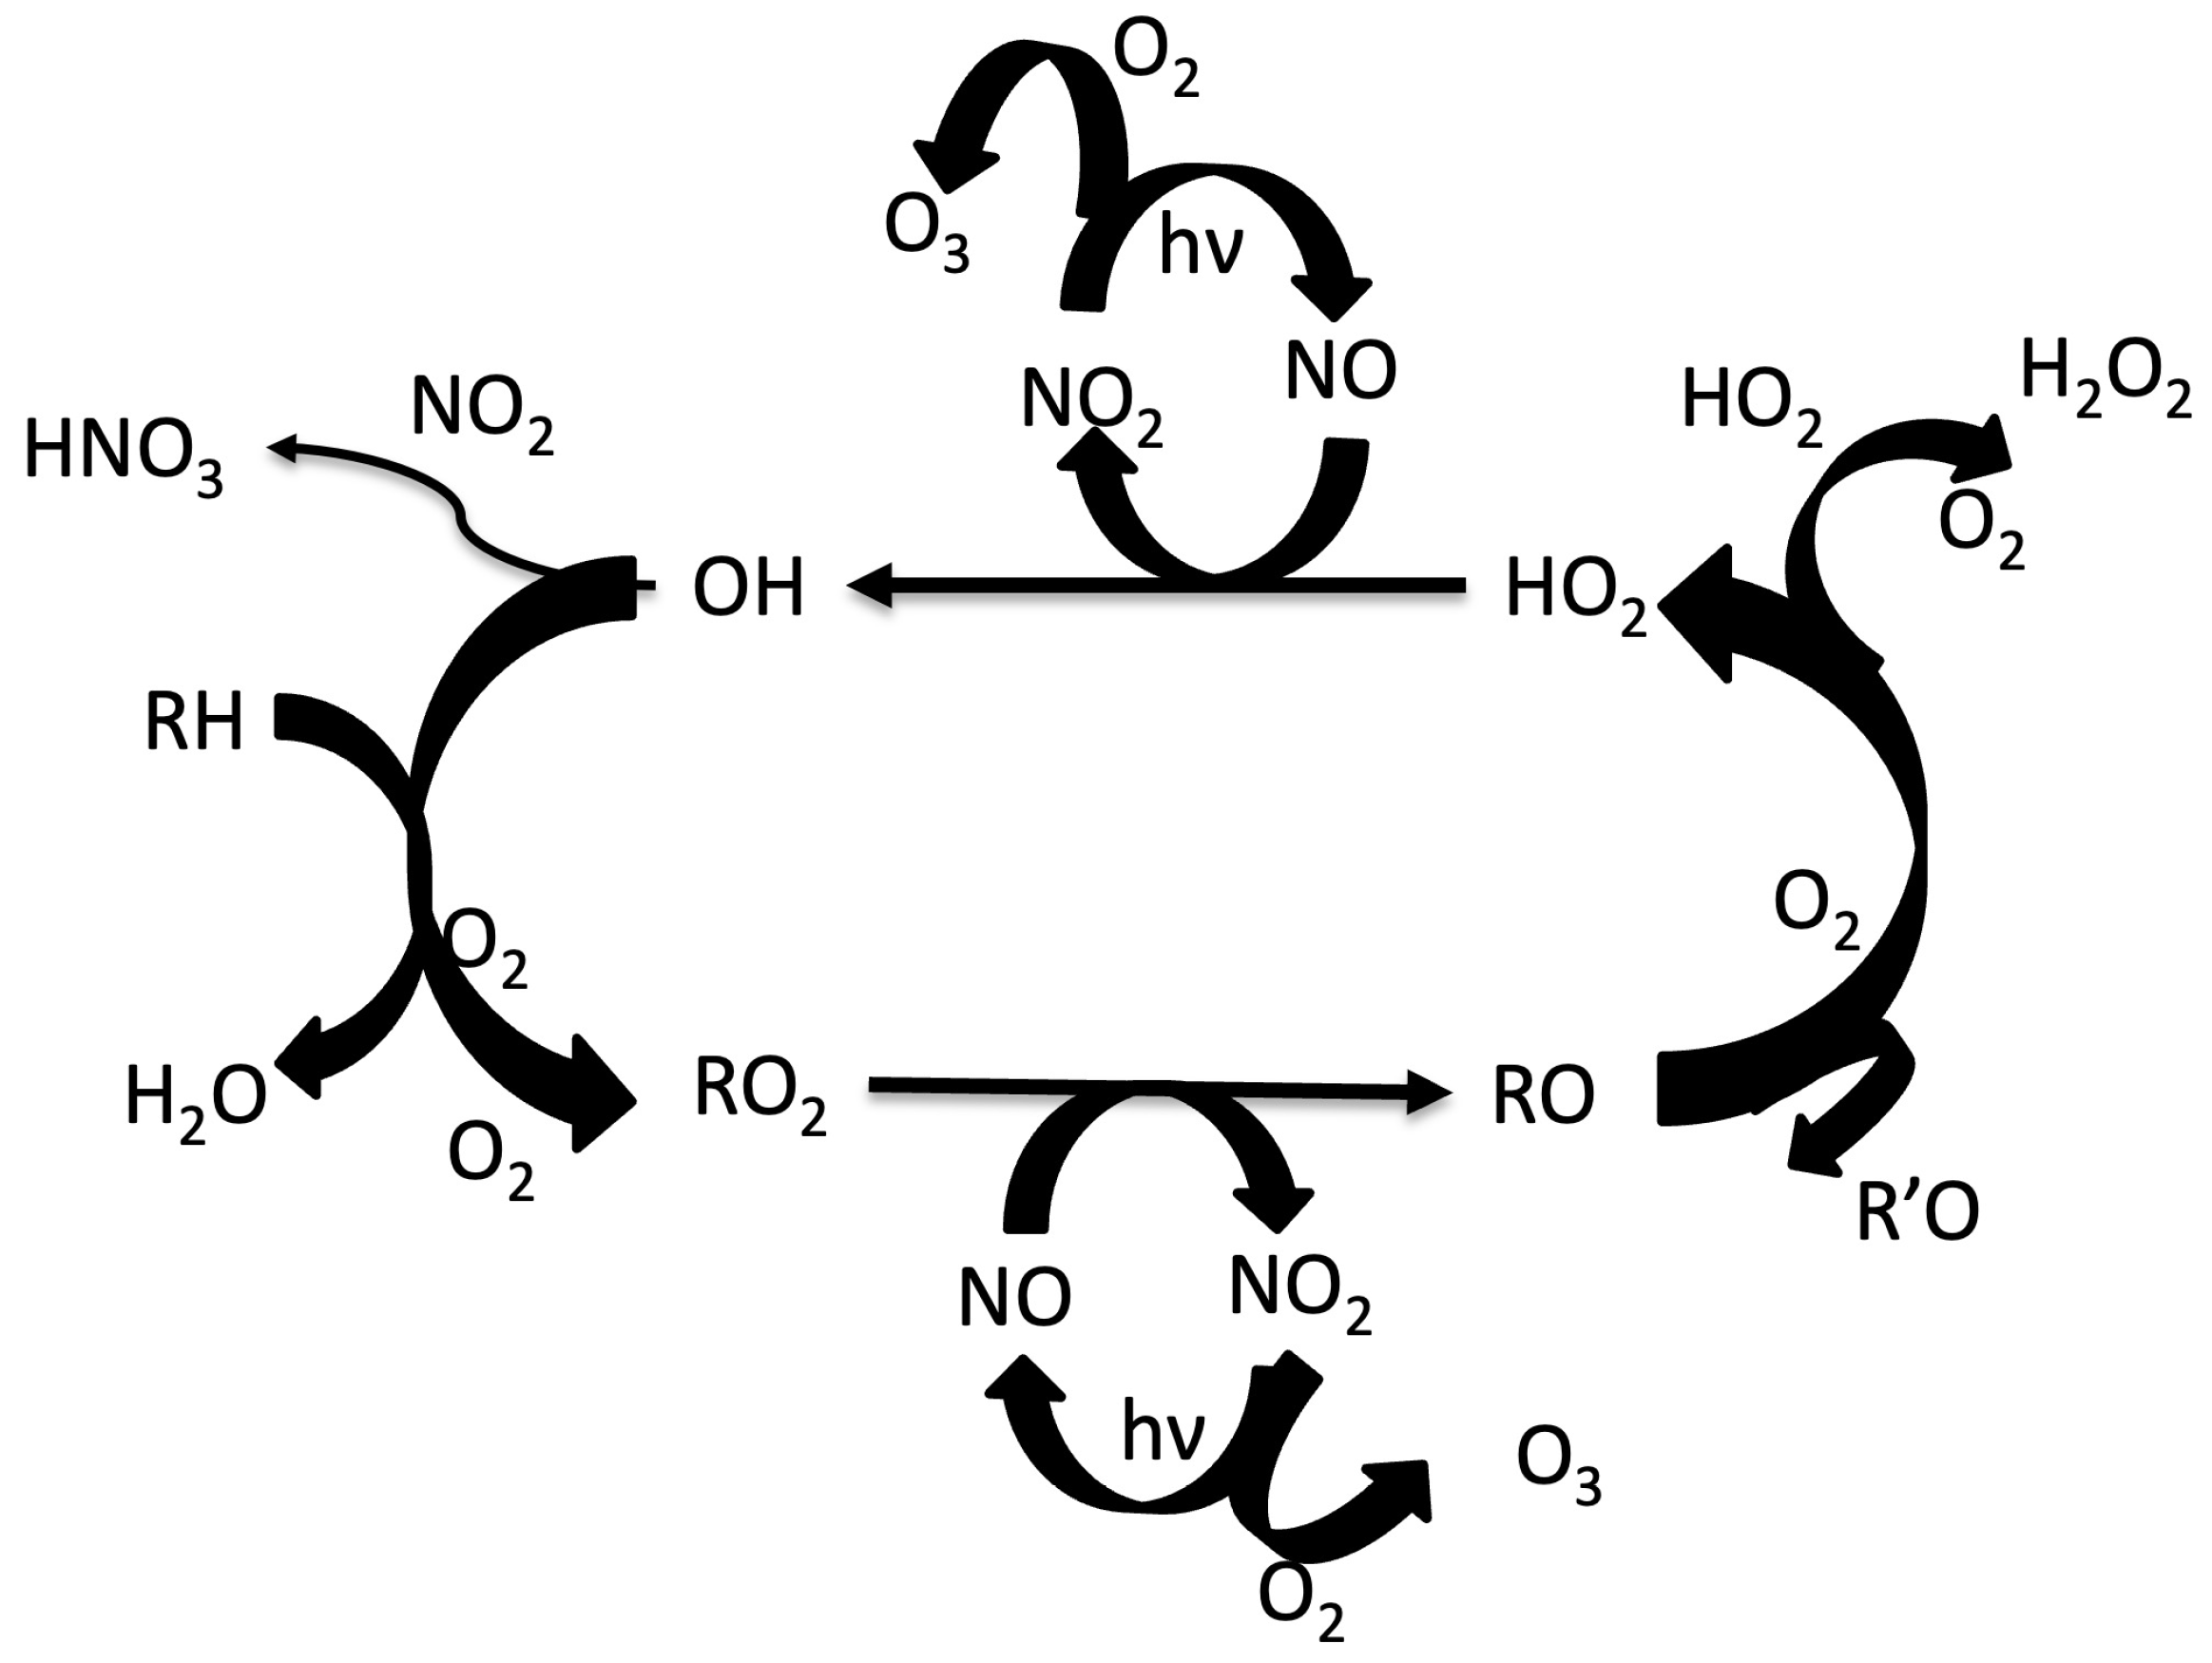
Figure 1. Summarising the reaction pathways by which ozone is produced via the reaction for CO and CH4 with NOX emissions from background concentrations and enhanced by the emissions of aircraft. Figure based on the concept by Jenkin et al. [18].
Atmosphere 16 00858 g001
Figure 2. Chloropleths for global runs of O3 formation (ppb) per NOX (ppb). From top to bottom left to right, January through to December in chronological order. Gridded squares of the colour red represent NOX-sensitive regions, green represents regions equally sensitive to NOX and VOC levels, and blue represents VOC-sensitive regions.
Atmosphere 16 00858 g002
Figure 3. Line charts for the averaged O3 formation (ppb) per NOX (ppb) STOCHEM-CRI globe gridded to 5 × 5 . The top plot displays the averaged O3 formation (ppb) per NOX (ppb) vs. latitude and the bottom plot the averaged O3 formation (ppb) per NOX (ppb) vs. longitude. Lines of best fit, between the points, are overlayed for every monthly averaged STOCHEM output, and colour coded in the legend.
Atmosphere 16 00858 g003
Figure 4. Chloropleths for global runs of O3 formation (ppb) per NOX (ppb). From top to bottom left-hand side to right-hand side, January through to December in chronological order. The bottom row provides plots of the gridded cells’ minimum, maximum, and the range in those values. Colour bars represent 0 O3 formation (ppb) per NOX (ppb) in dark blue through to 40 O3 formation (ppb) per NOX (ppb) in dark red.
Atmosphere 16 00858 g004
Table 1. Presents weighted O3 (ppb) per NOX (ppb) per 0. 1 by 0. 1 cell for various flight routes as calculated for the respective Haversine trajectory (column 4), Dijkstra’s trajectory (column 5), and Real-World ADS-B trajectory (column 6). Three-letter Origin and Destination codes (column 1) are defined by IATA. Based on known NOX per unit 0. 1 traversed in flight, the quantities of ozone formation can be estimated and attributed to a flight. Typical flight duration (hours) and great circle flight distances (km), as from ADS-B data, are presented (column 2 and 3, respectively). Calculations are based on model outputs for September. Note that the majority of real-world (ADS-B) data was insufficient for complete trajectory estimations in some cases. Figures are quoted to three significant figures. Routes presented were selected to give a global perspective over a range of trajectory lengths. The IATA airport codes, airport names, and respective countries in brackets used are listed below: AMS—Amsterdam Schiphol Airport (the Netherlands), CGK—Soekarno-Hatta International Airport (Indonesia), GRU—São Paulo/Guarulhos–Governador André Franco Montoro International Airport (Brazil), HKG—Hong Kong International Airport (Hong Kong), HND—Tokyo Haneda Airport (Japan), JFK—John F. Kennedy International Airport (United States of America), JNB—O.R. Tambo International Airport (South Africa), LHR—London Heathrow Airport (United Kingdom), SIN—Singapore Changi Airport (Singapore), SYD—Sydney Kingsford Smith Airport (Australia), YYZ—Toronto Pearson International Airport (Canada).
RouteTypical FlightHaversineO3 (ppb) per NOX (ppb) Weight
IATA CodeDuration (Hours: Minutes)Distance (km)HaversineDijkstraReal-World
LHR-AMS0:41372129012401250
JFK-YYZ1:0958910801070-
SIN-CGK1:2187855005000-
LHR-JFK7:01555414,10013,100-
JFK-HKG15:0612,99031,70026,900-
LHR-JNB10:22904515,00013,000-
JNB-SYD11:2211,04418,80015,000-
JNB-GRU9:29745112,20010,800-
HND-SYD9:14778588508810-
HND-LHR13:12961524,00018,800-
Disclaimer/Publisher’s Note: The statements, opinions and data contained in all publications are solely those of the individual author(s) and contributor(s) and not of MDPI and/or the editor(s). MDPI and/or the editor(s) disclaim responsibility for any injury to people or property resulting from any ideas, methods, instructions or products referred to in the content.