

Multi-Scale Analysis of the Mitigation Effect of Green Space Morphology on Urban Heat Islands


Abstract
1. Introduction
2. Materials and Methods
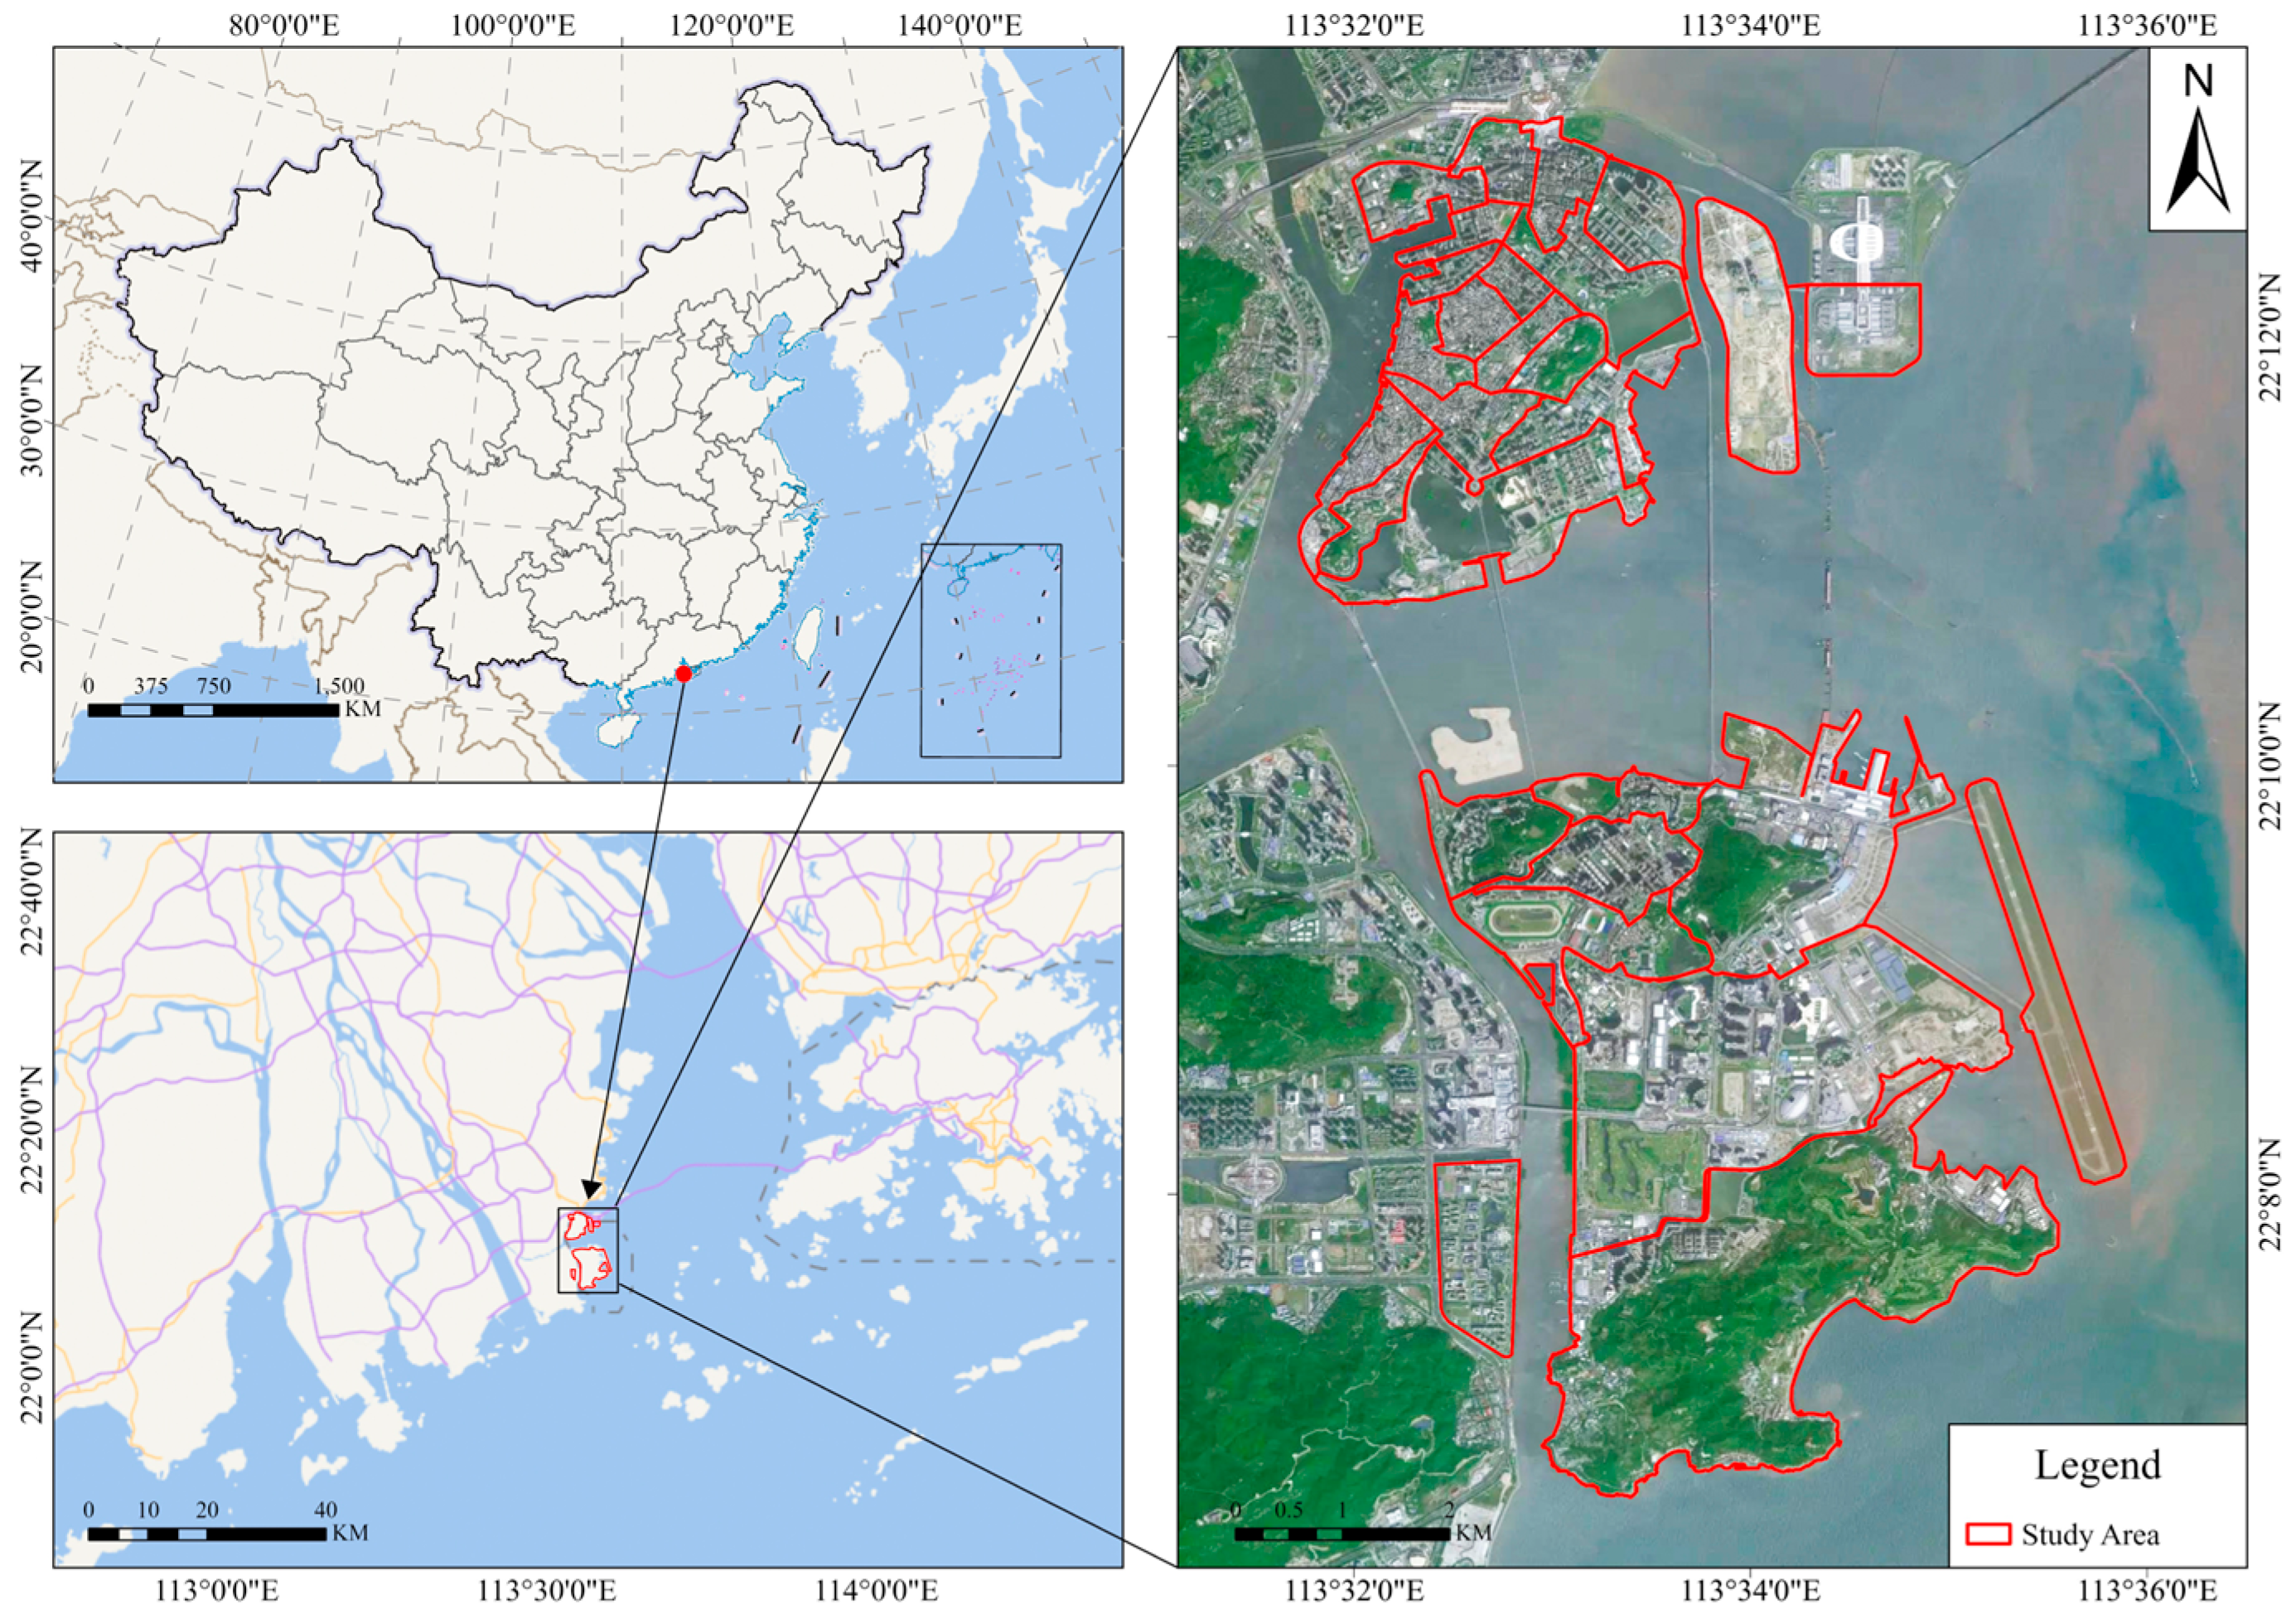
2.1. Study Area
2.2. Data
2.3. Methods
2.3.1. Identify UGS Morphology at the City and Patch Scales
2.3.2. Quantify UGS Cooling Effects at the City and Patch Scales
- (1)
- Average temperature within UGSs (AT): Defined as the mean temperature within each UGS, directly reflecting the thermal condition.
- (2)
- Immediate Cooling Magnitude (IC): Defined as the temperature difference between the green patch and its immediate surrounding buffer zone. This metric reflects the relative cooling intensity of the green space by comparing mean LST within the patch to the surrounding zone. This metric was developed to adapt to the highly compact and heterogeneous landscape environment of Macao and can accurately characterize the local cooling intensity of UGS.
- (3)
- Maximum Cooling Intensity (MC): Defined as the maximum temperature difference observed between any buffer zone and the patch interior. This metric captures the peak cooling capacity of the UGS, representing its strongest temperature gradient. This metrics is commonly used in patch-based UGS cooling effects analysis, especially for parks [36,40,41].
- (4)
- Cooling Distance (CD): Refers to the farthest buffer ring at which the LST difference between the green patch and its surroundings remains detectable. This indicates the spatial extent of the green space’s cooling effect. It is obtained through visual interpretation method, as this method is the most accurate, reliable and direction-sensitive recommended by recent research [42].
2.3.3. Analyze UGS–LST Relationships at the City and Patch Scales
3. Results
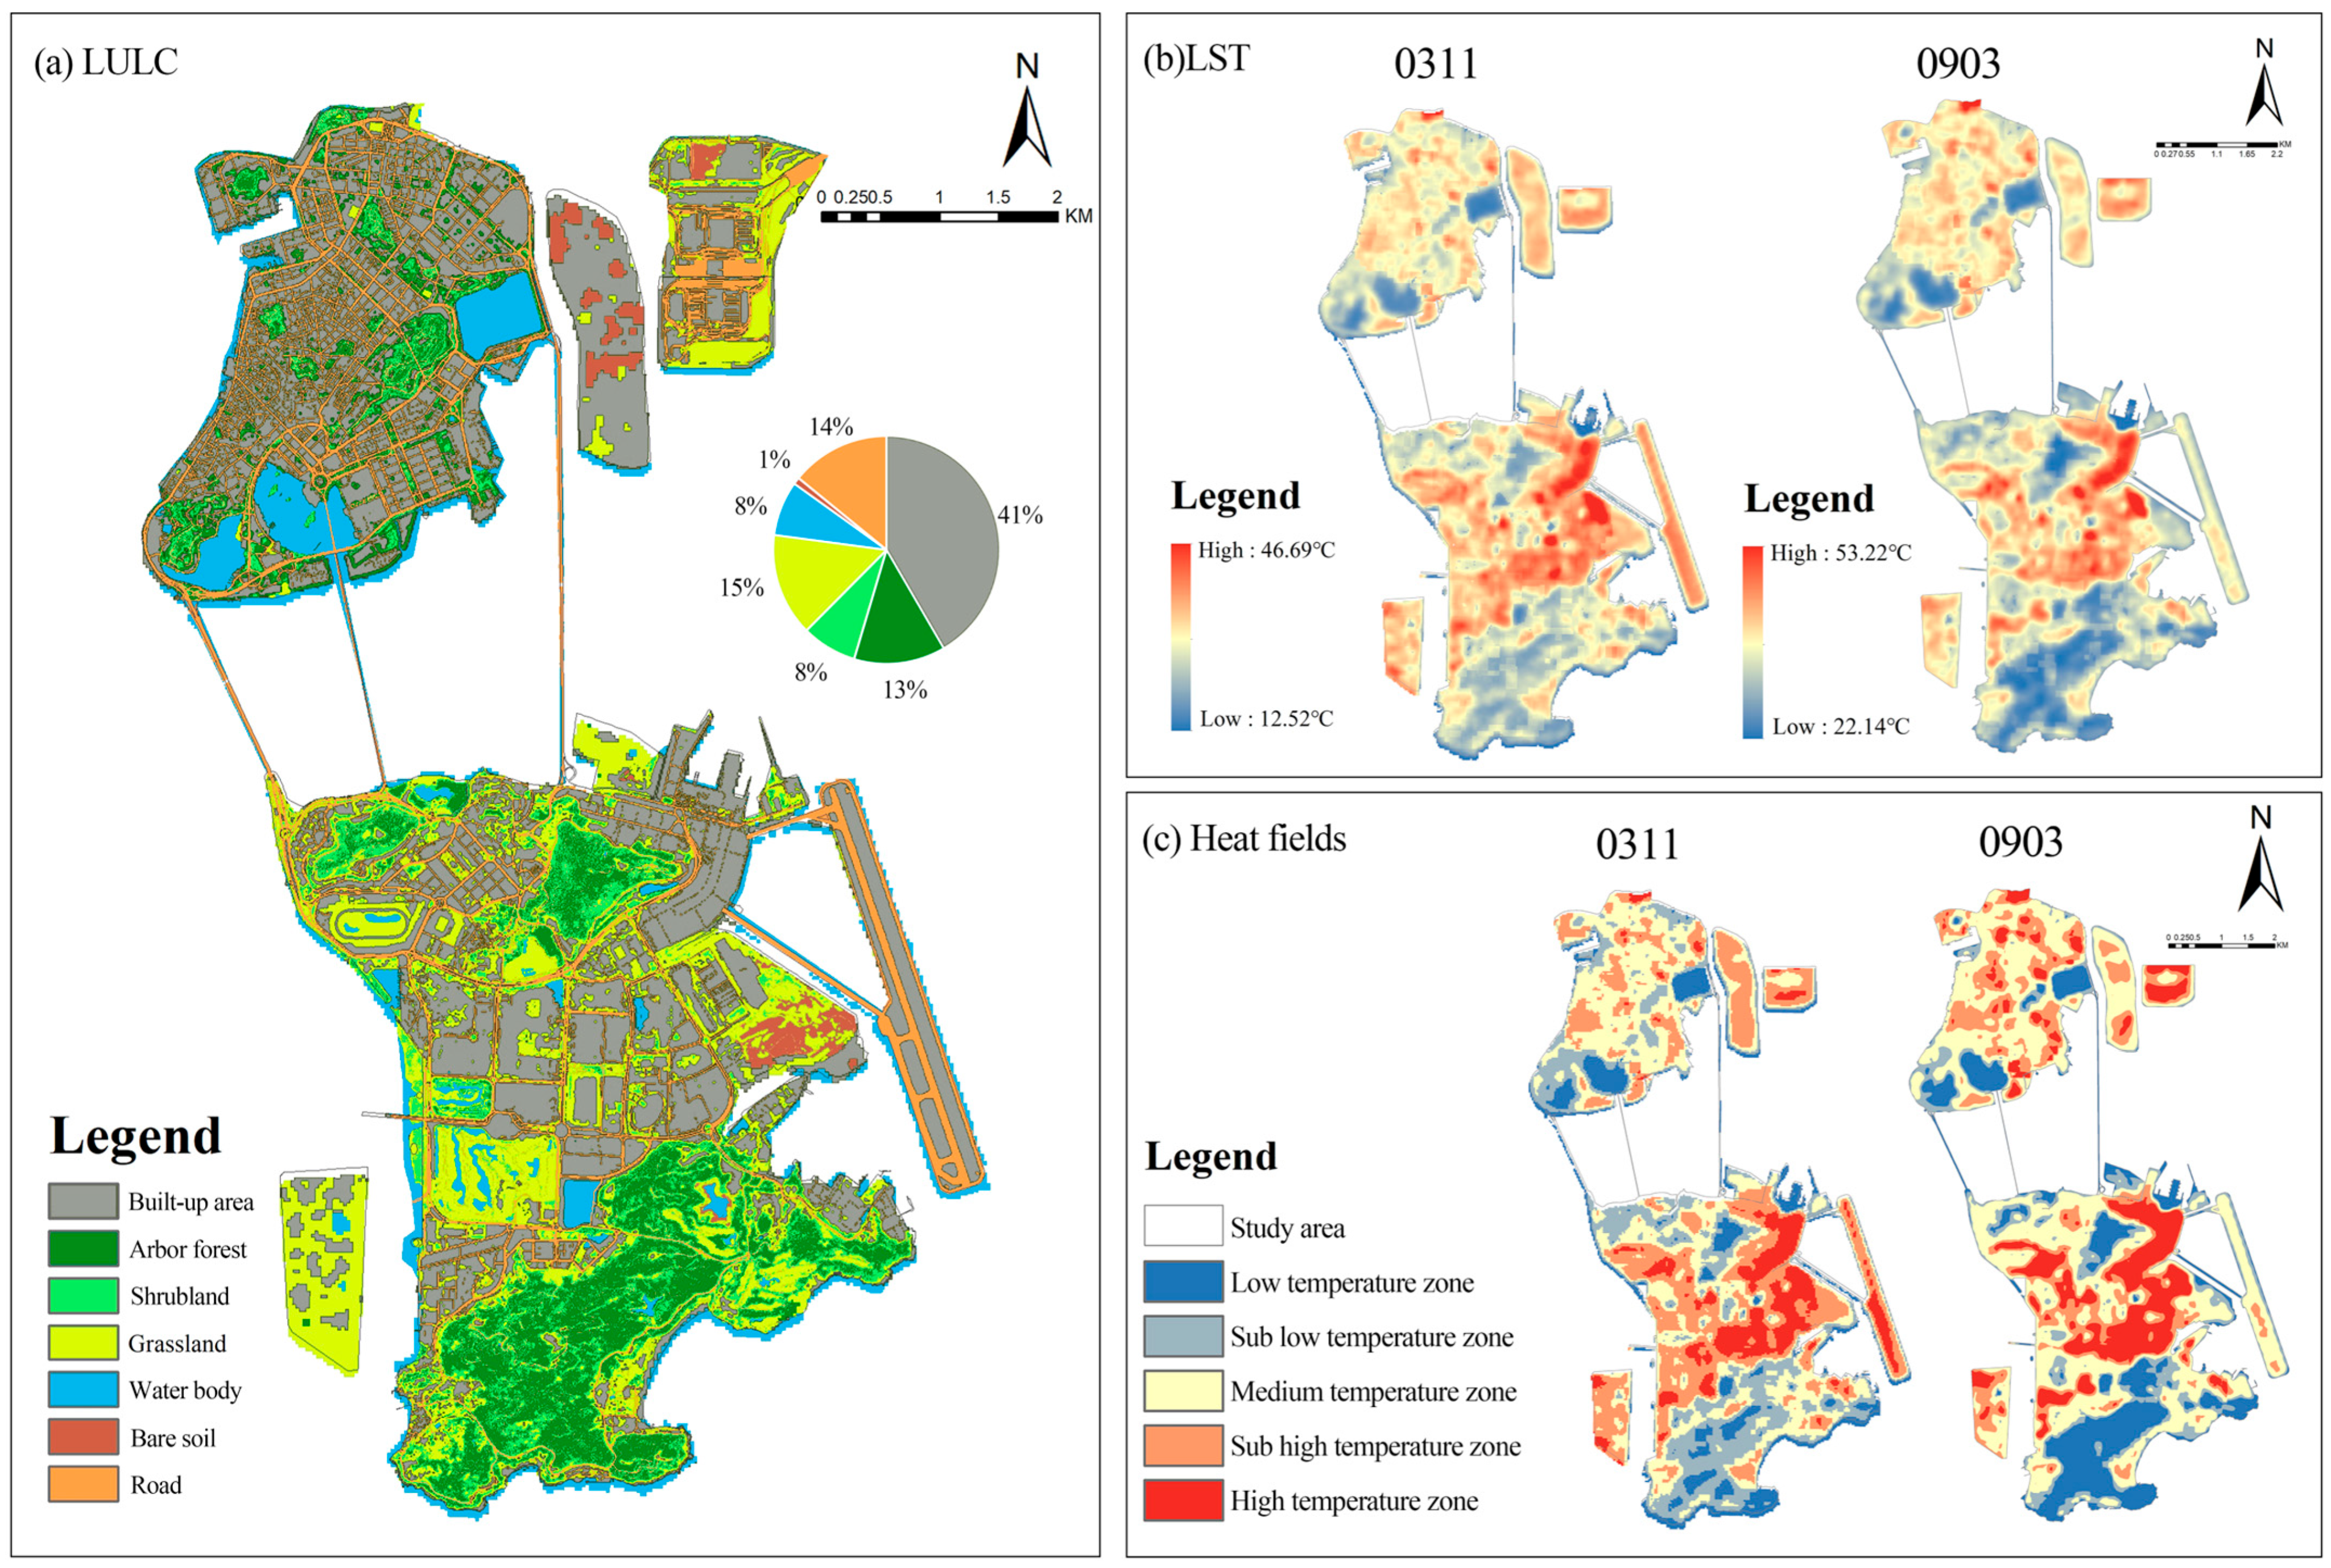
3.1. UGS Spatial Morphology and Seasonal LST Distribution at City Scale
3.2. Spatial Morphology and Seasonal City-Wide Cooling Effects
3.2.1. High UGS Integrity (Grid Cells with Core Area Proportion ≥ 35%)
3.2.2. Moderate UGS Integrity (Grid Cells with Core Area Proportion Between 12% and 35%)
3.2.3. Low UGS Integrity (Grid Cells with Core Area Proportion ≤ 12%)
3.3. Geometric Morphology and Seasonal Patch-Scale Cooling Effects
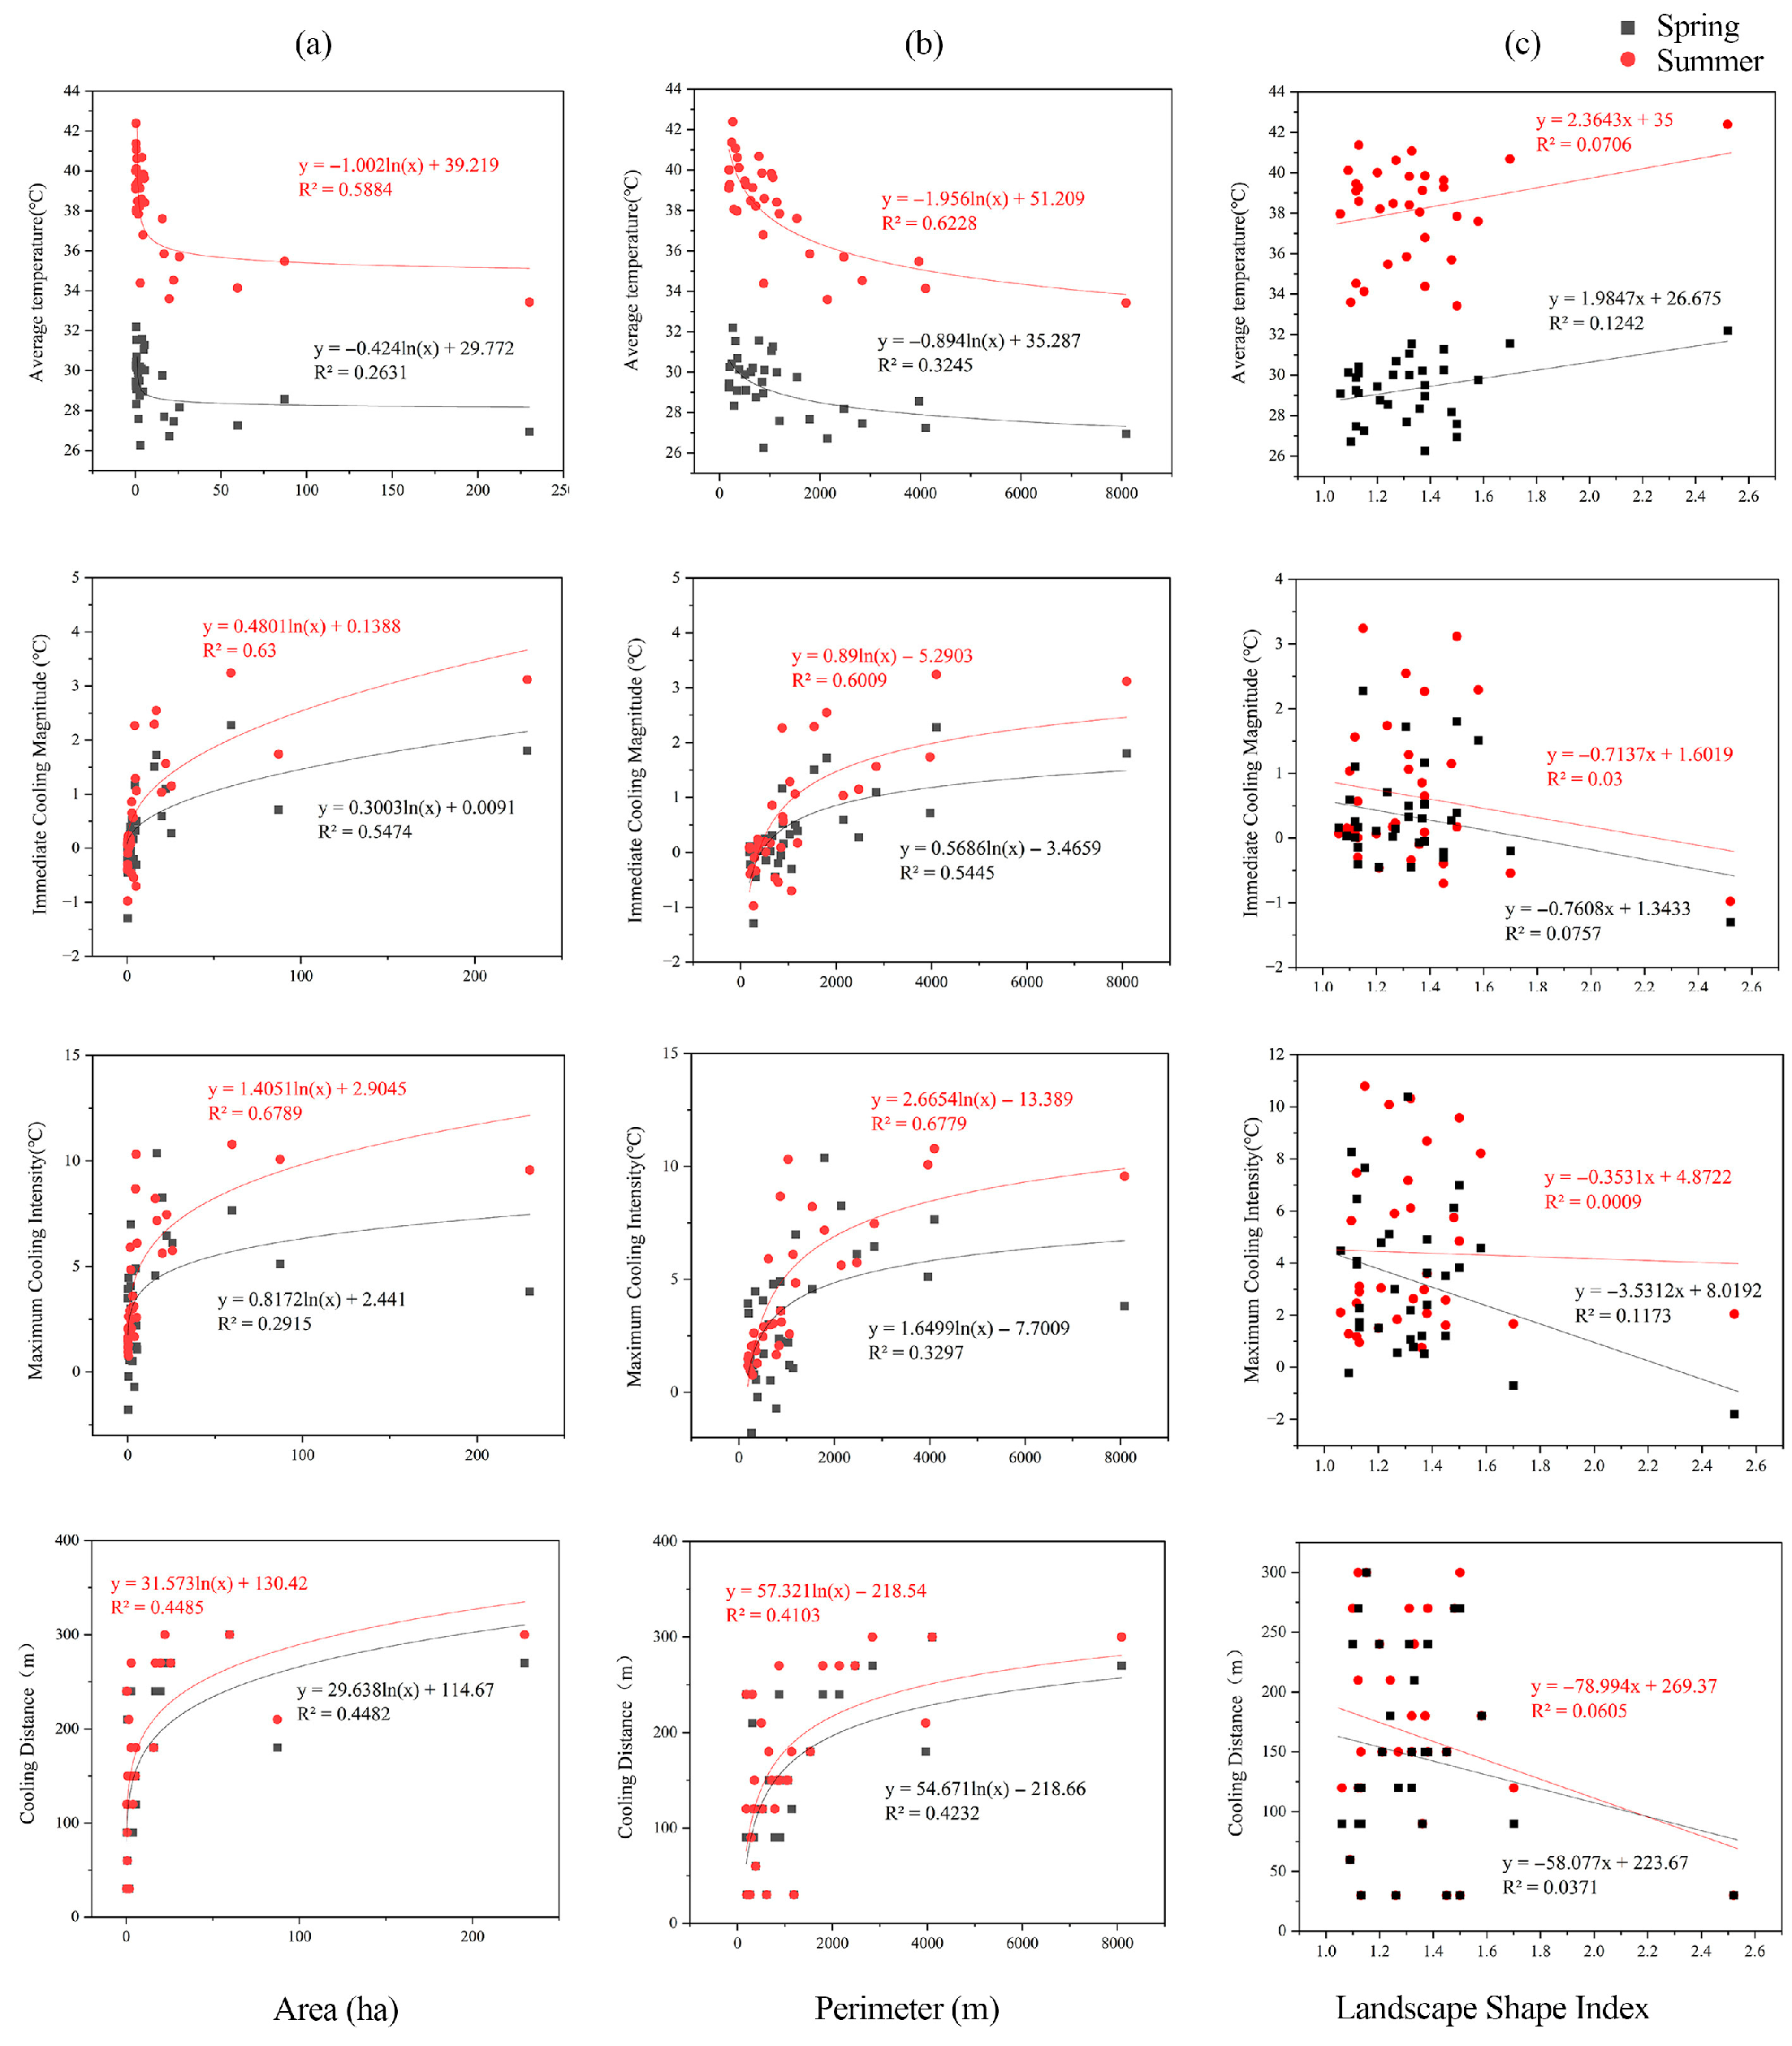
3.3.1. Correlation Between Patch Characteristics and Cooling Metrics
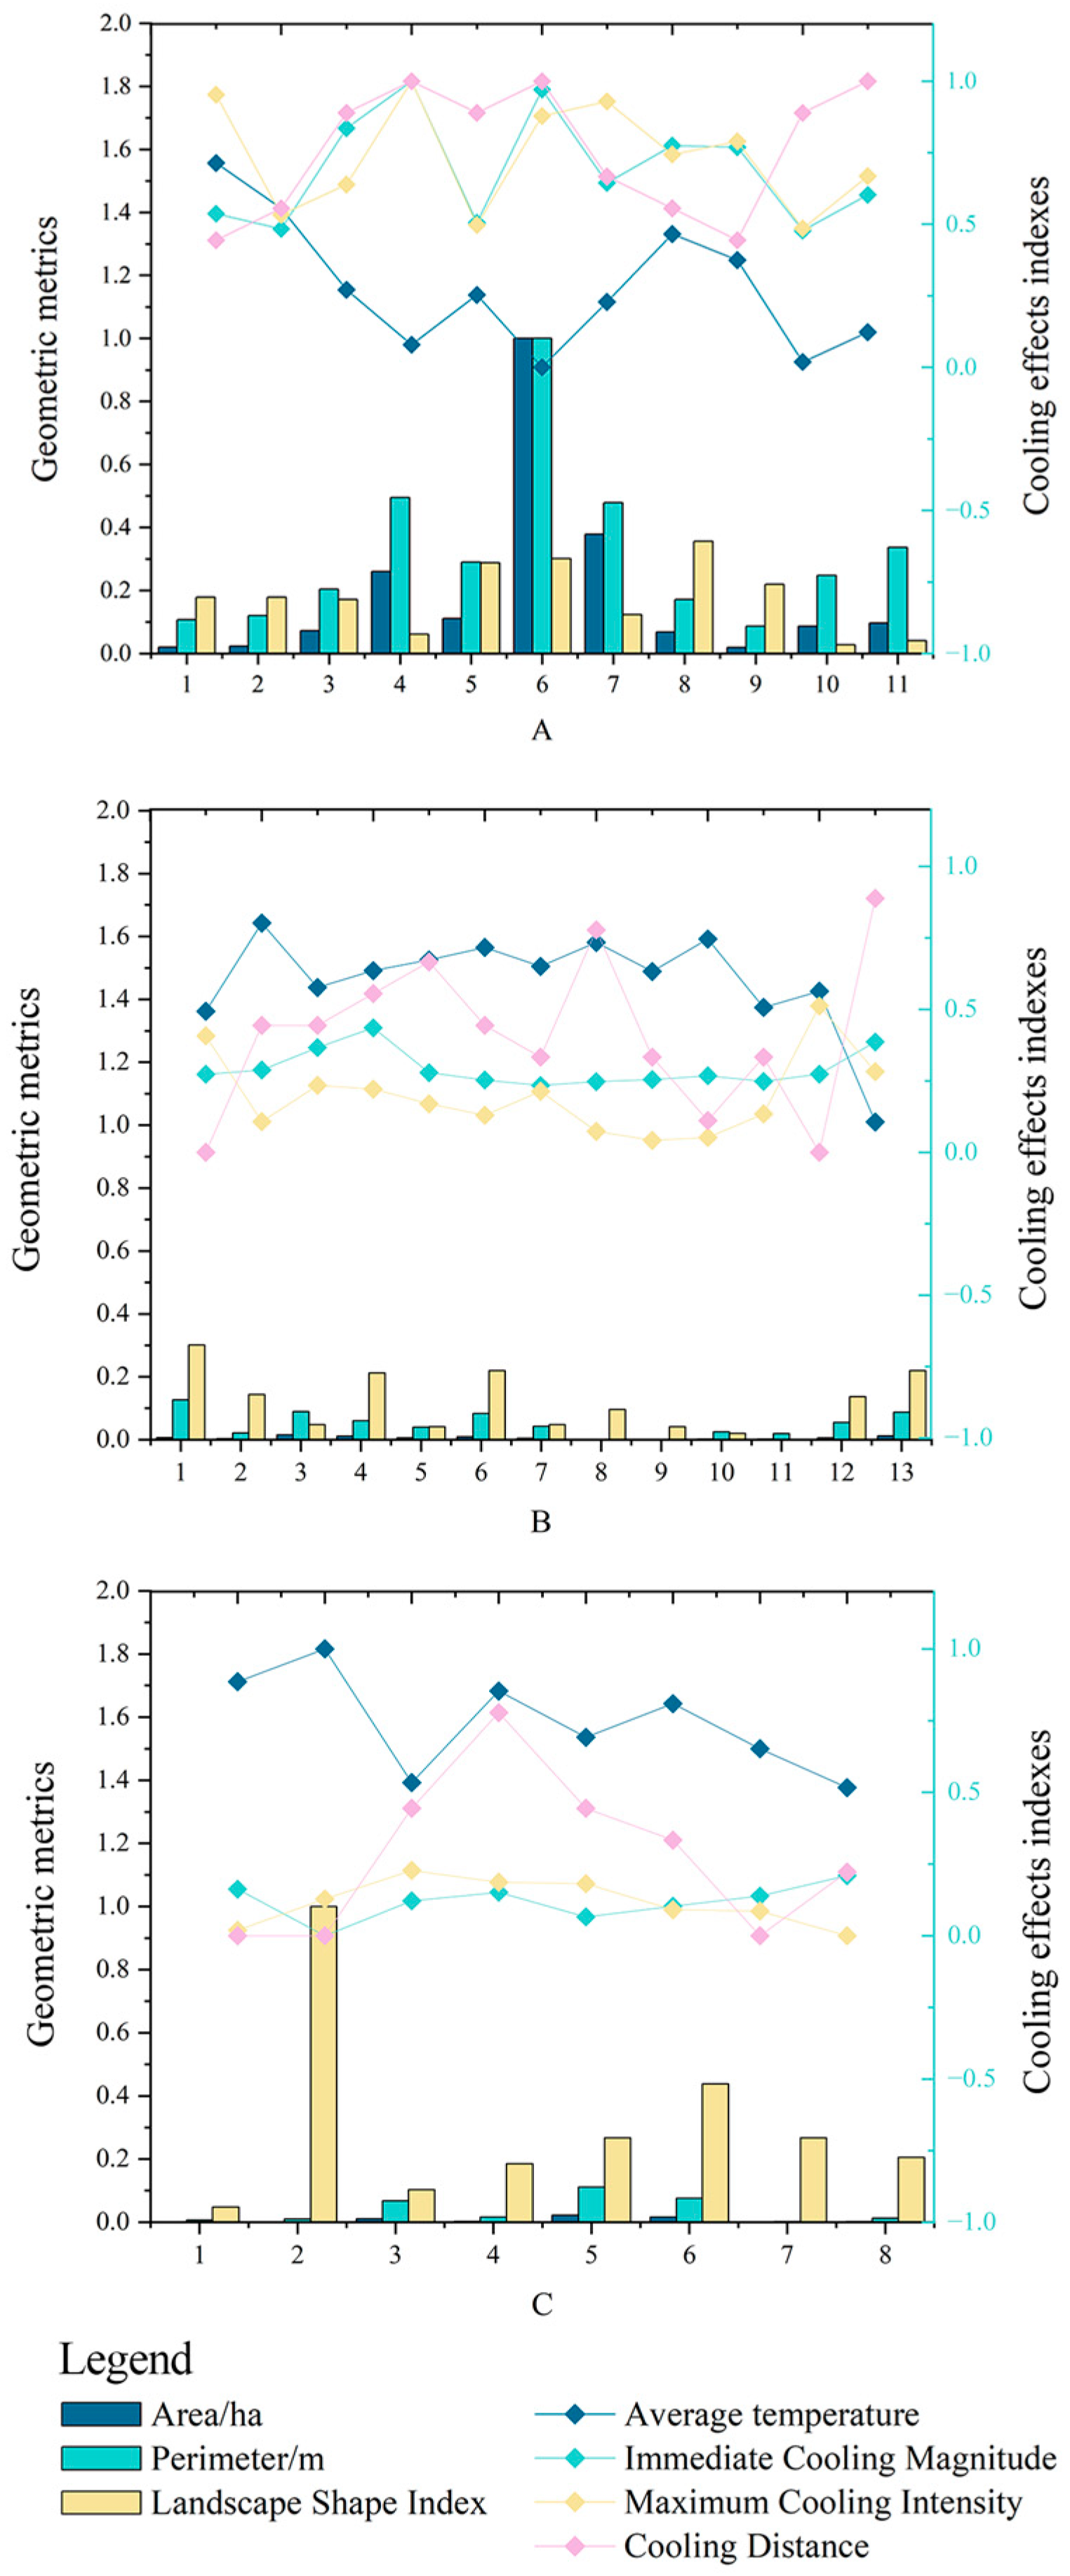
3.3.2. Classification of Patches Based on Cooling Performance
4. Discussion
4.1. Impacts of Green Space on the Thermal Environment at the Regional Scale
4.2. Cores Exhibits Greater Cooling Capacity in the Summer Months
4.3. Differences in the Share of Cores Will Produce Different Heat Island Mitigation Effects
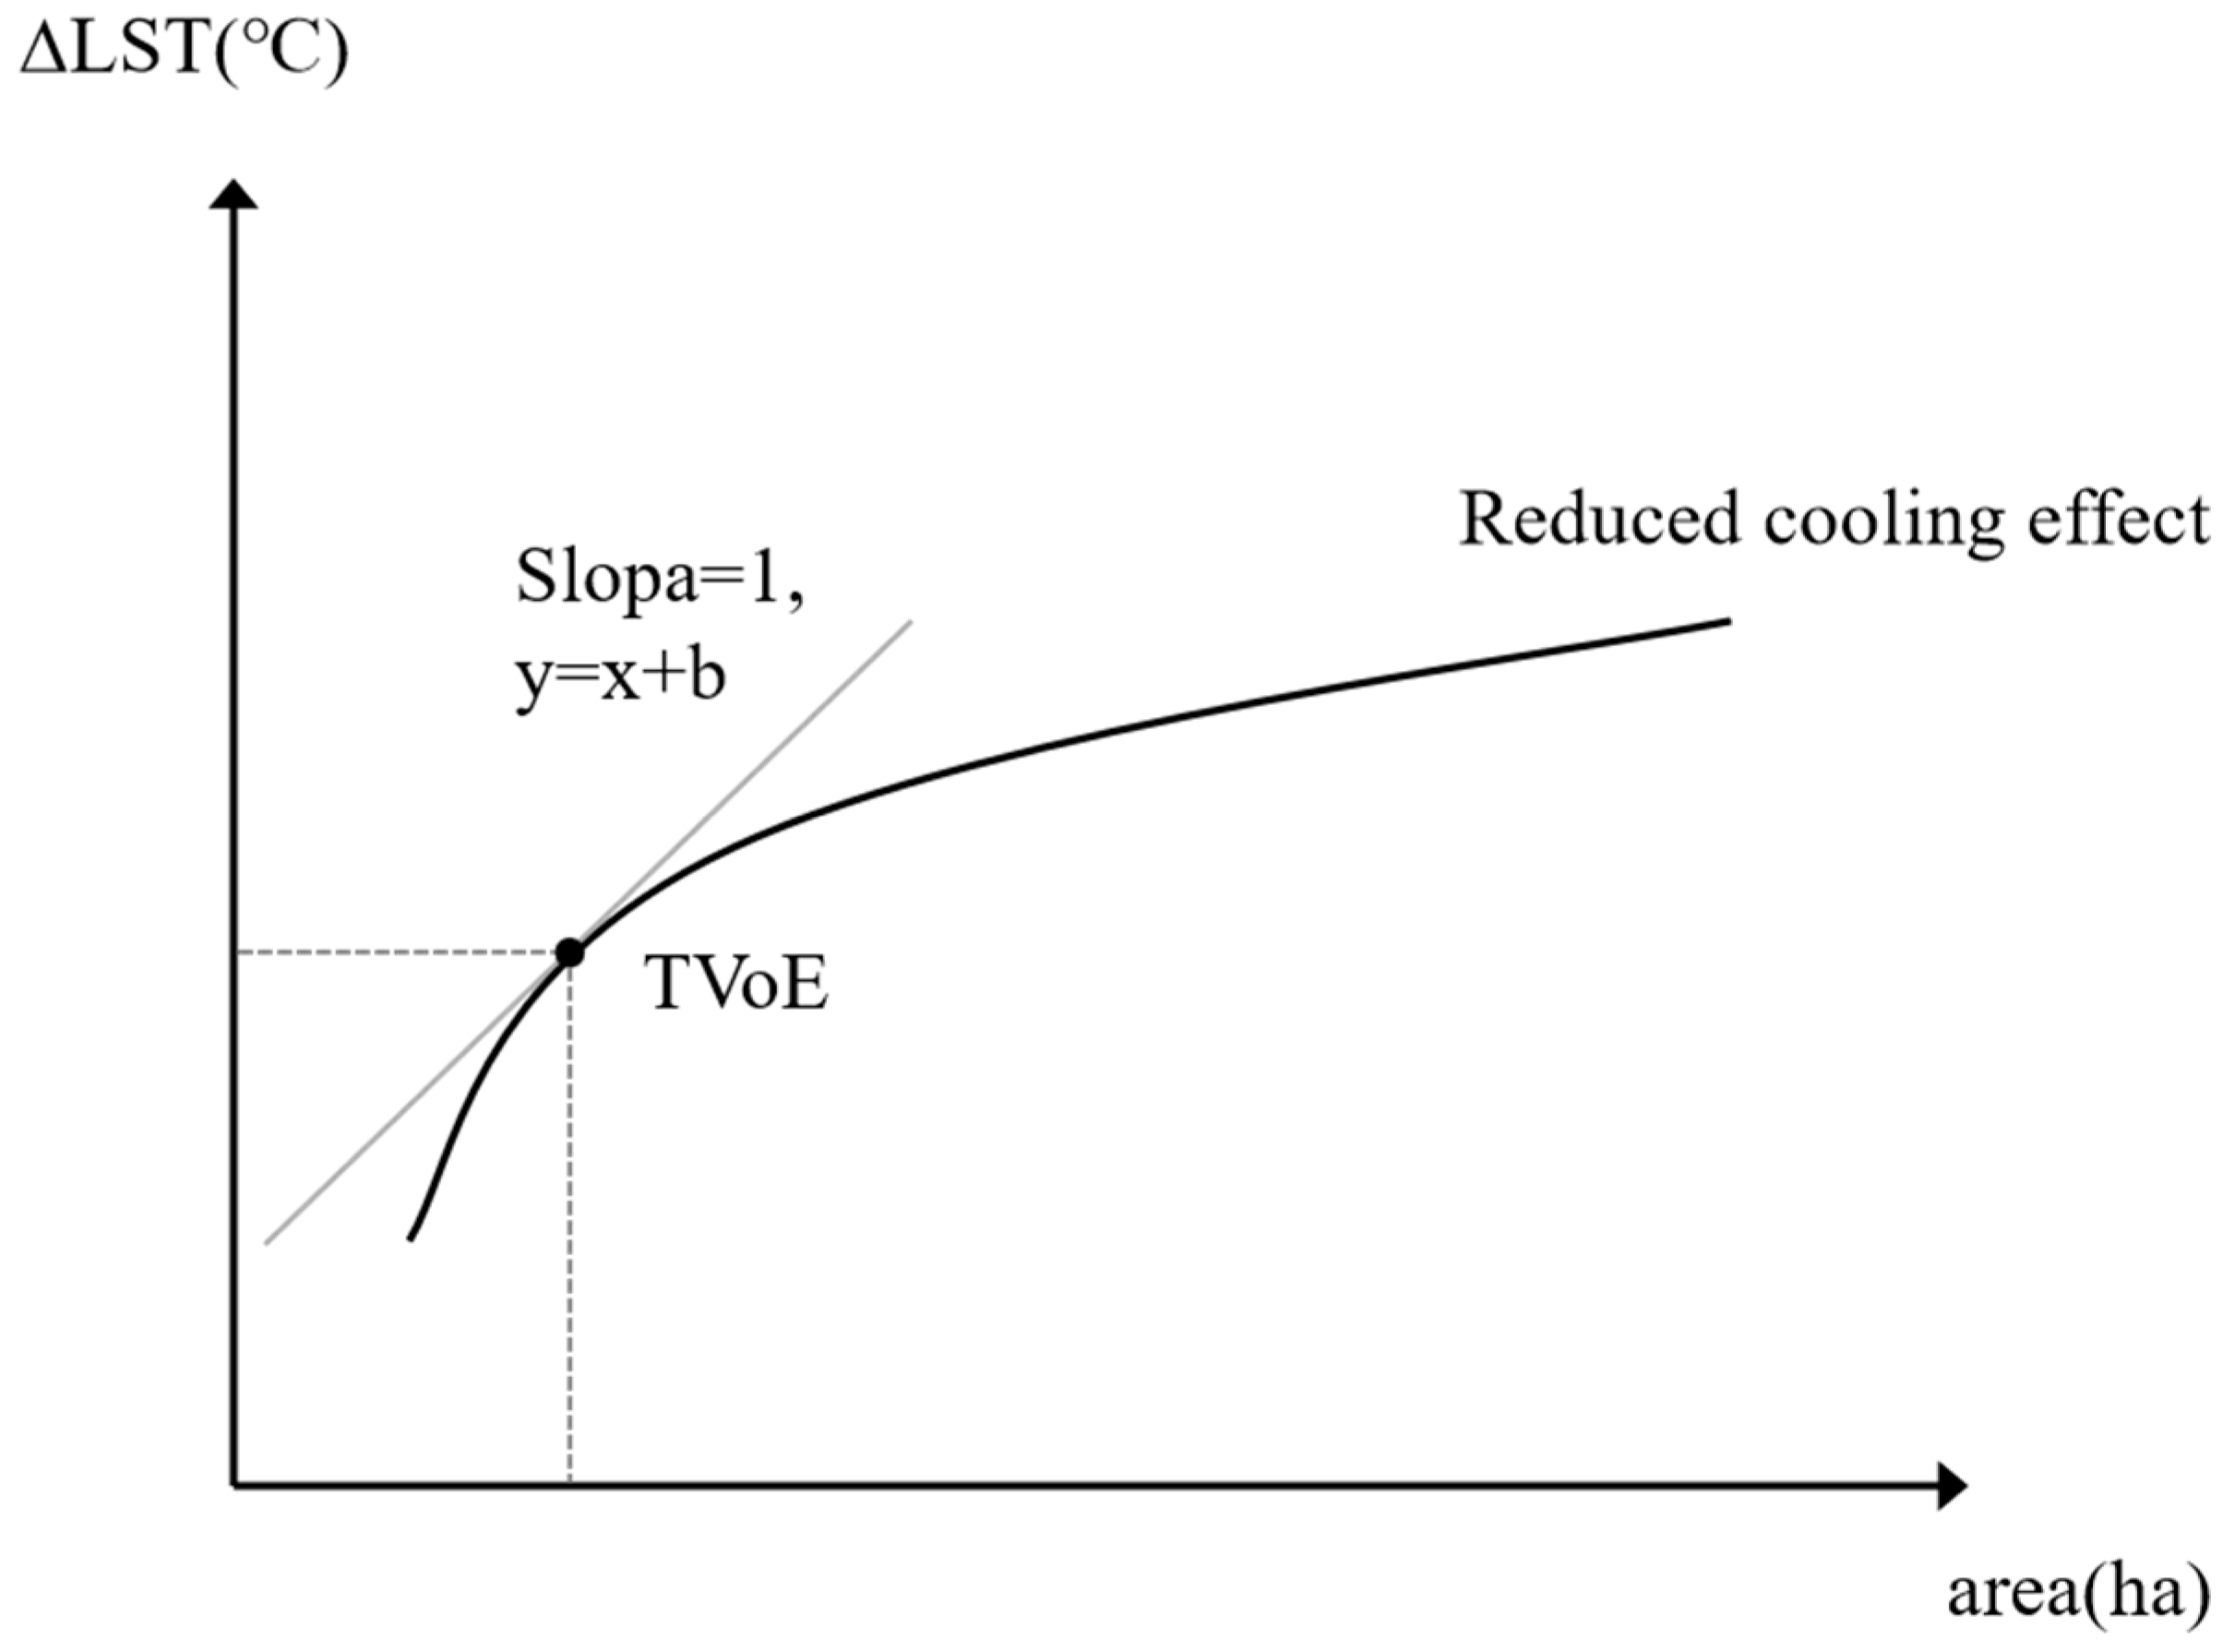
4.4. Non-Linear Threshold Effects Between Various Metrics and Cooling Efficiency at the Patch Scale
4.5. Different Types of UHI Have Different Mitigating Capacities
4.6. Limitations of This Study
5. Conclusions
Author Contributions
Funding
Institutional Review Board Statement
Informed Consent Statement
Data Availability Statement
Acknowledgments
Conflicts of Interest
References
- Zhong, Y.; Li, S.; Liang, X.; Guan, Q. Causal Inference of Urban Heat Island Effect and Its Spatial Heterogeneity: A Case Study of Wuhan, China. Sustain. Cities Soc. 2024, 115, 105850. [Google Scholar] [CrossRef]
- Wan, Y.; Du, H.; Yuan, L.; Xu, X.; Tang, H.; Zhang, J. Exploring the Influence of Block Environmental Characteristics on Land Surface Temperature and Its Spatial Heterogeneity for a High-Density City. Sustain. Cities Soc. 2025, 118, 105973. [Google Scholar] [CrossRef]
- Liu, Y.; Chen, H.; Wu, J.; Wang, Y.; Ni, Z.; Chen, S. Impact of Urban Spatial Dynamics and Blue-Green Infrastructure on Urban Heat Islands: A Case Study of Guangzhou Using Local Climate Zones and Predictive Modeling. Sustain. Cities Soc. 2024, 115, 105819. [Google Scholar] [CrossRef]
- Tomasso, L.P.; Studer, K.; Bloniarz, D.; Escandon, D.; Spengler, J.D. Development of Visualization Tools for Sharing Climate Cooling Strategies with Impacted Urban Communities. Atmosphere 2025, 16, 258. [Google Scholar] [CrossRef]
- Zhang, H.; Kang, M.; Guan, Z.; Zhou, R.; Zhao, A.; Wu, W.; Yang, H. Assessing the Role of Urban Green Infrastructure in Mitigating Summertime Urban Heat Island (UHI) Effect in Metropolitan Shanghai, China. Sustain. Cities Soc. 2024, 112, 105605. [Google Scholar] [CrossRef]
- Li, Z.; Liu, Q.; Yan, K.; Xiong, D.; Xu, P.; Yan, Y.; Lin, L. Cooling Effects of Urban Parks under Various Ecological Factors. Urban Clim. 2024, 58, 102134. [Google Scholar] [CrossRef]
- Zhong, Q.; Li, Z.; Zhu, J.; Yuan, C. Revealing Multiscale and Nonlinear Effects of Urban Green Spaces on Heat Islands in High-Density Cities: Insights from MSPA and Machine Learning. Sustain. Cities Soc. 2025, 120, 106173. [Google Scholar] [CrossRef]
- Lopes, H.S.; Vidal, D.G.; Cherif, N.; Silva, L.; Remoaldo, P.C. Green Infrastructure and Its Influence on Urban Heat Island, Heat Risk, and Air Pollution: A Case Study of Porto (Portugal). J. Environ. Manag. 2025, 376, 124446. [Google Scholar] [CrossRef]
- Lencastre, M.P.A.; Vidal, D.G.; Lopes, H.S.; Curado, M.J. Biophilia in Pieces: Critical Approach of a General Concept. Environ. Soc. Psychol. 2023, 8, 1869. [Google Scholar] [CrossRef]
- Pan, L.; Gan, W.; Chen, J.; Xian, X. Ecological Planning for Mitigating Urban Heat Based on Thermal Network Simulation: A Case Study of Guangzhou-Foshan Metropolitan Area. J. Chin. Urban For. 2024, 22, 10–19. [Google Scholar]
- Yu, Z.; Yang, G.; Zuo, S.; Jørgensen, G.; Koga, M.; Vejre, H. Critical Review on the Cooling Effect of Urban Blue-Green Space: A Threshold-Size Perspective. Urban For. Urban Green. 2020, 49, 126630. [Google Scholar] [CrossRef]
- Li, Y.; Ren, C.; Ho, J.Y.; Shi, Y. Landscape Metrics in Assessing How the Configuration of Urban Green Spaces Affects Their Cooling Effect: A Systematic Review of Empirical Studies. Landsc. Urban Plan. 2023, 239, 104842. [Google Scholar] [CrossRef]
- Ming, T.; Hu, Y.; Shi, T.; Li, Y.; Hu, S.; Yang, D.; Lv, B.; Peng, C.; Chen, Y. Effect of Blue–Green Infrastructure in Mitigating Microenvironmental Heat Islands: Field- and Simulation-Based Insights. Atmosphere 2025, 16, 134. [Google Scholar] [CrossRef]
- Yu, Z.; Zhang, J.; Yang, G. How to Build a Heat Network to Alleviate Surface Heat Island Effect? Sustain. Cities Soc. 2021, 74, 103135. [Google Scholar] [CrossRef]
- Wu, D.; Sun, H.; Xu, H.; Zhang, T.; Xu, Z.; Wu, L. How Can Ecological Land Be Deployed to Cool the Surface Thermal Environment? A Case Study from the Perspectives of Patch and Network. Remote Sens. 2023, 15, 1061. [Google Scholar] [CrossRef]
- Chen, M.; Sun, Y.; Yang, B.; Jiang, J. MSPA-Based Green Space Morphological Pattern and Its Spatiotemporal Influence on Land Surface Temperature. Heliyon 2024, 10, e31363. [Google Scholar] [CrossRef] [PubMed]
- Basu, T.; Das, A. Urbanization Induced Degradation of Urban Green Space and Its Association to the Land Surface Temperature in a Medium-Class City in India. Sustain. Cities Soc. 2023, 90, 104373. [Google Scholar] [CrossRef]
- Zoulia, I.; Santamouris, M.; Dimoudi, A. Monitoring the Effect of Urban Green Areas on the Heat Island in Athens. Environ. Monit. Assess. 2009, 156, 275–292. [Google Scholar] [CrossRef]
- Lin, J.; Wei, K.; Guan, Z. Exploring the Connection between Morphological Characteristic of Built-up Areas and Surface Heat Islands Based on MSPA. Urban Clim. 2024, 53, 101764. [Google Scholar] [CrossRef]
- Soille, P.; Vogt, P. Morphological Segmentation of Binary Patterns. Pattern Recognit. Lett. 2009, 30, 456–459. [Google Scholar] [CrossRef]
- Pan, L.; Gan, W.; Chen, J.; Ren, K. An Integrated Model for Constructing Urban Ecological Networks and Identifying the Ecological Protection Priority: A Case Study of Wujiang District, Suzhou. Sustainability 2023, 15, 4487. [Google Scholar] [CrossRef]
- Wang, H.; Pei, Z. Urban Green Corridors Analysis for a Rapid Urbanization City Exemplified in Gaoyou City, Jiangsu. Forests 2020, 11, 1374. [Google Scholar] [CrossRef]
- Yue, X.; Liu, W.; Wang, X.; Yang, J.; Lan, Y.; Zhu, Z.; Yao, X. Constructing an Urban Heat Network to Mitigate the Urban Heat Island Effect from a Connectivity Perspective. Sustain. Cities Soc. 2024, 114, 105774. [Google Scholar] [CrossRef]
- Zhao, Z.; Li, W.; Zhang, J.; Zheng, Y. Constructing an Urban Heat Island Network Based on Connectivity Perspective: A Case Study of Harbin, China. Ecol. Indic. 2024, 159, 111665. [Google Scholar] [CrossRef]
- Qian, W.; Li, X. A Cold Island Connectivity and Network Perspective to Mitigate the Urban Heat Island Effect. Sustain. Cities Soc. 2023, 94, 104525. [Google Scholar] [CrossRef]
- Li, Y.; Wang, S.; Zhang, S.; Wei, M.; Chen, Y.; Huang, X.; Zhou, R. The Creation of Multi-Level Urban Ecological Cooling Network to Alleviate the Urban Heat Island Effect. Sustain. Cities Soc. 2024, 114, 105786. [Google Scholar] [CrossRef]
- Rezaei, T.; Shen, X.; Chaiyarat, R.; Pumijumnong, N. Effective Cooling Networks: Optimizing Corridors for Urban Heat Island Mitigation. Remote Sens. Appl. Soc. Environ. 2024, 36, 101372. [Google Scholar] [CrossRef]
- Xie, M.; Gao, Y.; Cao, Y.; Breuste, J.; Fu, M.; Tong, D. Dynamics and Temperature Regulation Function of Urban Green Connectivity. J. Urban Plan. Dev. 2015, 141, A5014008. [Google Scholar] [CrossRef]
- Chen, J.; Zhan, W.; Du, P.; Li, L.; Li, J.; Liu, Z.; Huang, F.; Lai, J.; Xia, J. Seasonally Disparate Responses of Surface Thermal Environment to 2D/3D Urban Morphology. Build. Environ. 2022, 214, 108928. [Google Scholar] [CrossRef]
- Liu, Y.; Zhang, W.; Liu, W.; Tan, Z.; Hu, S.; Ao, Z.; Li, J.; Xing, H. Exploring the Seasonal Effects of Urban Morphology on Land Surface Temperature in Urban Functional Zones. Sustain. Cities Soc. 2024, 103, 105268. [Google Scholar] [CrossRef]
- Yang, M.; Ye, P.; He, J. Green and Blue Infrastructure for Urban Cooling: Multi-Scale Mechanisms, Spatial Optimization, and Methodological Integration. Sustain. Cities Soc. 2025, 129, 106501. [Google Scholar] [CrossRef]
- Wang, M.; Yan, Y.; Li, M.; Zhou, L. Differences in Emotional Preferences toward Urban Green Spaces among Various Cultural Groups in Macau and Their Influencing Factors. Land 2024, 13, 414. [Google Scholar] [CrossRef]
- Li, J.; Lin, F.; Cui, H.; Chen, Y.; Yang, S. Planning Strategies for Increasing the Occupancy Rate of Green Open Space Based on Urban Geographic Data in Macau: An Investigation of Ultra-High-Density Cities. Buildings 2025, 15, 257. [Google Scholar] [CrossRef]
- Xi, Z.; Li, C.; Zhou, L.; Yang, H.; Burghardt, R. Built Environment Influences on Urban Climate Resilience: Evidence from Extreme Heat Events in Macau. Sci. Total Environ. 2023, 859, 160270. [Google Scholar] [CrossRef]
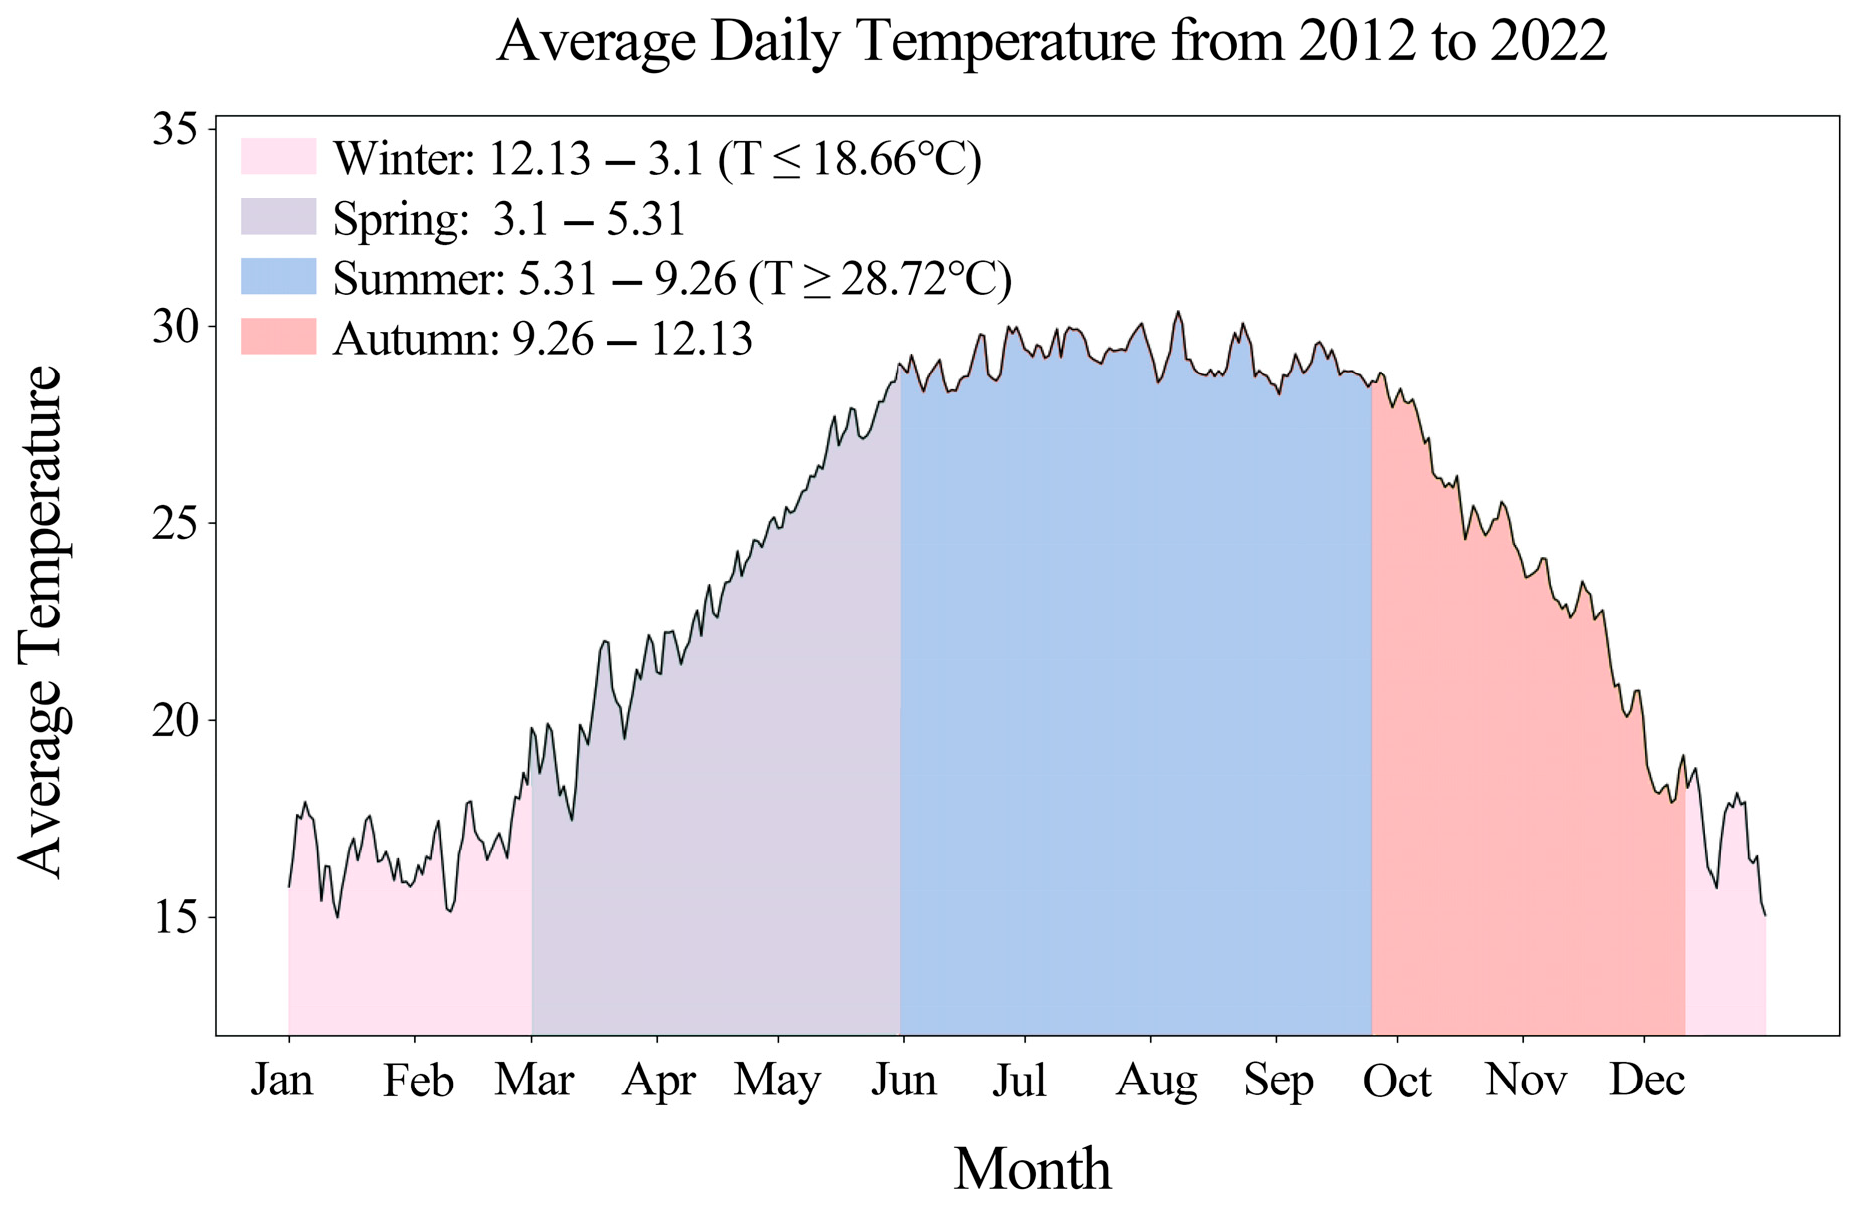
- Lin, W.; Sun, X.; Ren, G.; Zhang, J. A review of seasonal division and change research. Prog. Geogr. 2024, 43, 826–840. [Google Scholar] [CrossRef]
- Liao, W.; Guldmann, J.-M.; Hu, L.; Cao, Q.; Gan, D.; Li, X. Linking Urban Park Cool Island Effects to the Landscape Patterns inside and Outside the Park: A Simultaneous Equation Modeling Approach. Landsc. Urban Plan. 2023, 232, 104681. [Google Scholar] [CrossRef]
- Li, J.; Stouffs, R. Assessing and Optimizing Cooling Intensity of UGS via Improved Metrics: A Study Based on Machine Learning Simulation Model. Build. Environ. 2025, 278, 112959. [Google Scholar] [CrossRef]
- Sheng, S.; Wang, Y. Configuration Characteristics of Green-Blue Spaces for Efficient Cooling in Urban Environments. Sustain. Cities Soc. 2024, 100, 105040. [Google Scholar] [CrossRef]
- McGarigal, K.; Marks, B.J. FRAGSTATS: Spatial Pattern Analysis Program for Quantifying Landscape Structure; General Technical Report PNW; U.S. Department of Agriculture, Forest Service, Pacific Northwest Research Station: Portland, OR, USA, 1995.
- Peng, J.; Dan, Y.; Qiao, R.; Liu, Y.; Dong, J.; Wu, J. How to Quantify the Cooling Effect of Urban Parks? Linking Maximum and Accumulation Perspectives. Remote Sens. Environ. 2021, 252, 112135. [Google Scholar] [CrossRef]
- Liu, H.; Huang, B.; Cheng, X.; Yin, M.; Shang, C.; Luo, Y.; He, B.-J. Sensing-Based Park Cooling Performance Observation and Assessment: A Review. Build. Environ. 2023, 245, 110915. [Google Scholar] [CrossRef]
- Zhou, W.; Yu, Y.; Zhang, S.; Xu, J.; Wu, T. Methods for Quantifying the Cooling Effect of Urban Green Spaces Using Remote Sensing: A Comparative Study. Landsc. Urban Plan. 2025, 256, 105289. [Google Scholar] [CrossRef]
- Neuberg, L.G. Causality: Models, Reasoning, and Inference, by Judea Pearl, Cambridge University Press, 2000. Econ. Theory 2003, 19, 675–685. [Google Scholar] [CrossRef]
- Yu, Z.; Guo, X.; Jørgensen, G.; Vejre, H. How Can Urban Green Spaces Be Planned for Climate Adaptation in Subtropical Cities? Ecol. Indic. 2017, 82, 152–162. [Google Scholar] [CrossRef]
- Yao, X.; Yu, K.; Zeng, X.; Lin, Y.; Ye, B.; Shen, X.; Liu, J. How Can Urban Parks Be Planned to Mitigate Urban Heat Island Effect in “Furnace Cities”? An Accumulation Perspective. J. Clean. Prod. 2022, 330, 129852. [Google Scholar] [CrossRef]
- Liu, X.; Zhang, J.; Wang, C.; Yan, D.; Liu, X.; Ma, D.; Bao, Y. Temporal and Spatial Dynamic Distribution of Drought Risk over the Northwest of Liaoning Province Based on Remote Sensing Data. Sci. Technol. Rev. 2012, 30, 34–39. [Google Scholar] [CrossRef]
- Lin, P.; Lau, S.S.Y.; Qin, H.; Gou, Z. Effects of Urban Planning Indicators on Urban Heat Island: A Case Study of Pocket Parks in High-Rise High-Density Environment. Landsc. Urban Plan. 2017, 168, 48–60. [Google Scholar] [CrossRef]
- Lin, J.; Qiu, S.; Tan, X.; Zhuang, Y. Measuring the Relationship between Morphological Spatial Pattern of Green Space and Urban Heat Island Using Machine Learning Methods. Build. Environ. 2023, 228, 109910. [Google Scholar] [CrossRef]
- Liu, F.; Liu, J.; Zhang, Y.; Hong, S.; Fu, W.; Wang, M.; Dong, J. Construction of a Cold Island Network for the Urban Heat Island Effect Mitigation. Sci. Total Environ. 2024, 915, 169950. [Google Scholar] [CrossRef]
- Hong, T.; Huang, X.; Deng, X.; Yang, Y.; Tang, X. Study on the Relationship between Urban Green Infrastructure and Thermal Environment Based on Morphological Spatial Pattern Analysis—A Case Study of Central Urban Area of Fuzhou City. Chin. Landsc. Archit. 2023, 39, 97. [Google Scholar]
- Ma, Y.; Kuang, Y.; Huang, N. Coupling Urbanization Analyses for Studying Urban Thermal Environment and Its Interplay with Biophysical Parameters Based on TM/ETM+ Imagery. Int. J. Appl. Earth Obs. Geoinf. 2010, 12, 110–118. [Google Scholar] [CrossRef]
- Xu, J.; Jin, Y.; Ling, Y.; Sun, Y.; Wang, Y. Exploring the Seasonal Impacts of Morphological Spatial Pattern of Green Spaces on the Urban Heat Island. Sustain. Cities Soc. 2025, 125, 106352. [Google Scholar] [CrossRef]
- Lu, Y.; Wu, J.; Liu, M. Decoding the Cooling Potential of Urban Green Spaces: A Cross-City Investigation of Driving Factors in 311 Chinese Cities under Varying Climate Zones. Sustain. Cities Soc. 2025, 126, 106410. [Google Scholar] [CrossRef]
- Gunawardena, K.R.; Wells, M.J.; Kershaw, T. Utilising Green and Bluespace to Mitigate Urban Heat Island Intensity. Sci. Total Environ. 2017, 584–585, 1040–1055. [Google Scholar] [CrossRef]
- Urban Green Space Cooling Effect in Cities: Heliyon. Available online: https://www.cell.com/heliyon/fulltext/S2405-8440(19)30070-2 (accessed on 3 June 2025).
- Zhang, J.; Zhang, H.; Qi, R. A Study of Size Threshold for Cooling Effect in Urban Parks and Their Cooling Accessibility and Equity. Sci. Rep. 2024, 14, 16176. [Google Scholar] [CrossRef]
- Huang, M.; Cui, P.; He, X. Study of the Cooling Effects of Urban Green Space in Harbin in Terms of Reducing the Heat Island Effect. Sustainability 2018, 10, 1101. [Google Scholar] [CrossRef]
- Verma, R.; Zawadzka, J.E.; Garg, P.K.; Corstanje, R. The Relationship between Spatial Configuration of Urban Parks and Neighbourhood Cooling in a Humid Subtropical City. Landsc. Ecol. 2024, 39, 34. [Google Scholar] [CrossRef]
- Bao, T.; Li, X.; Zhang, J.; Zhang, Y.; Tian, S. Assessing the Distribution of Urban Green Spaces and Its Anisotropic Cooling Distance on Urban Heat Island Pattern in Baotou, China. ISPRS Int. J. Geo-Inf. 2016, 5, 12. [Google Scholar] [CrossRef]
- Yang, Y.; Hsieh, C.-M.; Wu, X.-Y. How the Urban Morphology Affects the Suitable Solar Energy Techniques and Performance: A Block-Scale Study Based on the Typological Method in Macau. Sol. Energy 2024, 275, 112620. [Google Scholar] [CrossRef]
- Zhang, J.; Gou, Z.; Cheng, B.; Khoshbakht, M. A Study of Physical Factors Influencing Park Cooling Intensities and Their Effects in Different Time of the Day. J. Therm. Biol. 2022, 109, 103336. [Google Scholar] [CrossRef]
- Gao, Z.; Zaitchik, B.F.; Hou, Y.; Chen, W. Toward Park Design Optimization to Mitigate the Urban Heat Island: Assessment of the Cooling Effect in Five U.S. Cities. Sustain. Cities Soc. 2022, 81, 103870. [Google Scholar] [CrossRef]
- Kim, J.Y.; Park, C.Y.; Lee, D.K.; Yun, S.H.; Hyun, J.H.; Kim, E.S. The Cooling Effect of Trees in High-Rise Building Complexes in Relation to Spatial Distance from Buildings. Sustain. Cities Soc. 2024, 114, 105737. [Google Scholar] [CrossRef]


| Level | Classification Criteria |
|---|---|
| High-Temperature Zone | LST > u + std |
| Sub-High-Temperature Zone | u + 0.5std < LST < u + std |
| Medium-Temperature Zone | u − 0.5std < LST < u + 0.5std |
| Sub-Low-Temperature Zone | u − std < LST < u − 0.5std |
| Low-Temperature Zone | LST > u − std |
| Type | Definition | Ecological Meaning |
|---|---|---|
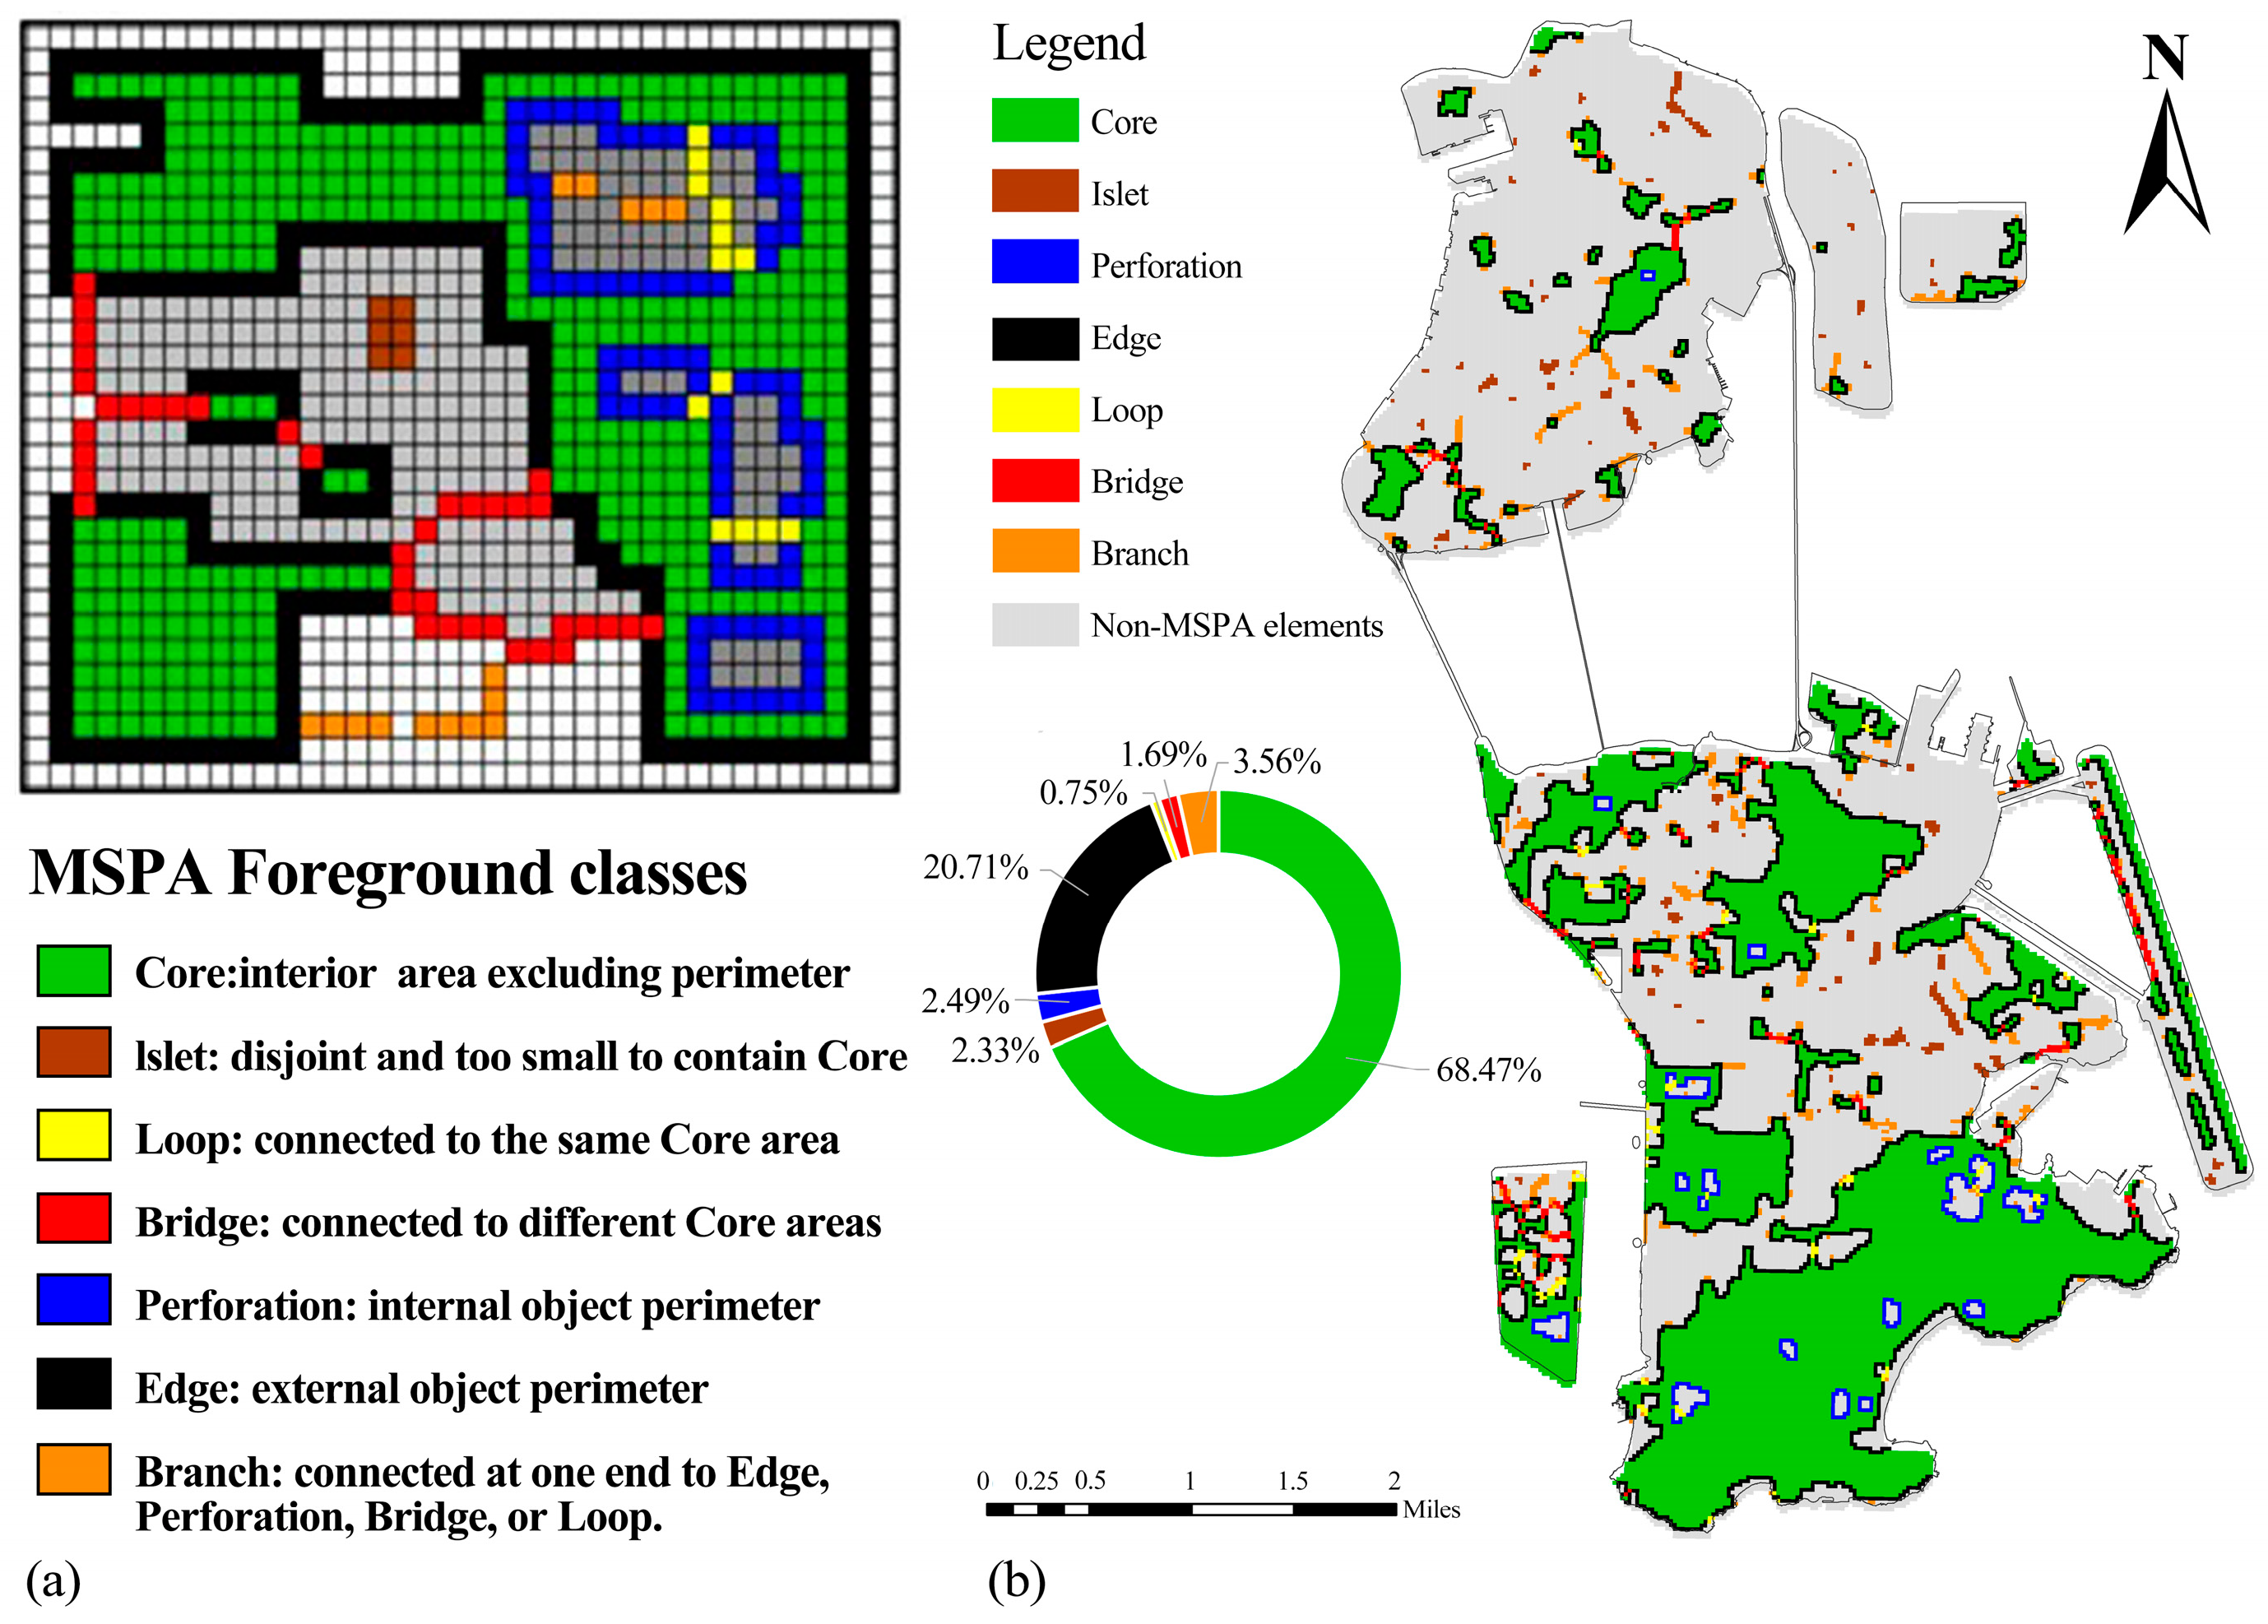
| Core | A set of primitives whose foreground primitives are farther away from background primitives than a certain parameter of a specified size | Large natural patches, wildlife habitats, forest reserves, etc. |
| Islet | Patches that are not connected to any foreground area and whose area is smaller than the minimum value of the core area | Small, isolated, fragmented natural patches that are not connected to one another, often including small urban green spaces within built-up areas. |
| Perforation | Holes inside the center area, composed of background | Construction land within the core area that does not have ecological benefits. |
| Edge | Edges outside the foreground | The transition between the core area and the construction land has an edge effect. |
| Bridge | At least 2 points are connected to different core areas | The strips of ecological land connecting the core areas, i.e., the corridors in the regional green space, promote the migration of species, energy flow and network formation within the region. |
| Loop | At least 2 points are connected to the same core area | Ecological corridors connecting the same core area are small in scale and have low connectivity with surrounding natural patches. |
| Branch | Only one side is connected to the edge area, bridge area or loop area | Ecological patches that are only connected to one end of the core area have poor landscape connectivity. |
| MSPA Account | T (Spring) | T (Summer) |
|---|---|---|
| Core | −0.340 ** | −0.537 ** |
| Islet | 0.303 ** | 0.352 ** |
| Loop | 0.006 | −0.111 |
| Bridge | 0.342 ** | 0.388 ** |
| Perforation | 0.068 | 0.077 |
| Edge | 0.248 ** | 0.203 |
| Branch | 0.425 ** | 0.505 ** |
| MSPA Account | T | |||||
|---|---|---|---|---|---|---|
| High UGS Integrity (≤12%) | Moderate UGS Integrity (12% < 35%) | Low UGS Integrity (>35%) | ||||
| Spring | Summer | Spring | Summer | Spring | Summer | |
| Core | −0.020 | −0.181 | −0.463 * | −0.429 * | −0.120 | −0.491 ** |
| Islet | 0.391 * | 0.472 * | 0.255 | 0.296 | −0.025 | 0.145 |
| Loop | 0.158 | 0.150 | −0.188 | −0.135 | 0.404 * | 0.256 |
| Bridge | 0.594 ** | 0.552 ** | 0.280 | 0.263 | 0.180 | 0.485 ** |
| Perforation | −0.072 | 0.085 | 0.030 | 0.047 | 0.216 | 0.188 |
| Edge | 0.445 * | 0.210 | 0.069 | 0.018 | 0.177 | 0.251 |
| Branch | 0.513 ** | 0.481 ** | 0.384 * | 0.484 ** | 0.242 | 0.423 * |
| Classification | R2 | Adjusted R-Square | AICc | SSE |
|---|---|---|---|---|
| High UGS integrity | 0.43 | 0.29 | 120.66 | 65.00 |
| Moderate UGS integrity | 0.45 | 0.35 | 132.65 | 106.01 |
| Low UGS integrity | 0.39 | 0.34 | 102.85 | 45.57 |
| Types | Amount | Average Temperature (°C) | Coolong Range (°C) | Maximum Temperature Difference (°C) | Cooling Distance (m) |
|---|---|---|---|---|---|
| A | 11 | 35.94 | 1.94 | 8.16 | 234.55 |
| B | 13 | 38.83 | 0.26 | 2.75 | 140.77 |
| C | 8 | 40.09 | −0.48 | 1.91 | 105.00 |
Disclaimer/Publisher’s Note: The statements, opinions and data contained in all publications are solely those of the individual author(s) and contributor(s) and not of MDPI and/or the editor(s). MDPI and/or the editor(s) disclaim responsibility for any injury to people or property resulting from any ideas, methods, instructions or products referred to in the content. |
© 2025 by the authors. Licensee MDPI, Basel, Switzerland. This article is an open access article distributed under the terms and conditions of the Creative Commons Attribution (CC BY) license (https://creativecommons.org/licenses/by/4.0/).
Share and Cite
Liu, J.; Wu, X.; Pan, L.; Hsieh, C.-M. Multi-Scale Analysis of the Mitigation Effect of Green Space Morphology on Urban Heat Islands. Atmosphere 2025, 16, 857. https://doi.org/10.3390/atmos16070857
Liu J, Wu X, Pan L, Hsieh C-M. Multi-Scale Analysis of the Mitigation Effect of Green Space Morphology on Urban Heat Islands. Atmosphere. 2025; 16(7):857. https://doi.org/10.3390/atmos16070857
Chicago/Turabian StyleLiu, Jie, Xueying Wu, Liyu Pan, and Chun-Ming Hsieh. 2025. "Multi-Scale Analysis of the Mitigation Effect of Green Space Morphology on Urban Heat Islands" Atmosphere 16, no. 7: 857. https://doi.org/10.3390/atmos16070857
APA StyleLiu, J., Wu, X., Pan, L., & Hsieh, C.-M. (2025). Multi-Scale Analysis of the Mitigation Effect of Green Space Morphology on Urban Heat Islands. Atmosphere, 16(7), 857. https://doi.org/10.3390/atmos16070857