Article

Temporal-Spatial Thermal Comfort Across Urban Blocks with Distinct Morphologies in a Hot Summer and Cold Winter Climate: On-Site Investigations in Beijing

College of Architecture and Urban Planning, Beijing University of Technology, Beijing 100124, China
*
Author to whom correspondence should be addressed.
Atmosphere 2025, 16(7), 855; https://doi.org/10.3390/atmos16070855
Submission received: 1 June 2025 / Revised: 9 July 2025 / Accepted: 10 July 2025 / Published: 14 July 2025
(This article belongs to the Section Biometeorology and Bioclimatology)

Abstract

Urban outdoor thermal comfort (OTC) has become an increasingly critical issue under the pressures of urbanization and climate change. Comparative analyses of urban blocks with distinct spatial morphologies are essential for identifying OTC issues and proposing targeted optimization strategies. However, existing studies predominantly rely on microclimate numerical simulations, while comparative assessments of OTC from the human thermal perception perspective remain limited. This study employs the thermal walk method, integrating microclimatic measurements with thermal perception questionnaires, to conduct on-site OTC investigations across three urban blocks with contrasting spatial morphologies—a business district (BD), a residential area (RA), and a historical neighborhood (HN)—in Beijing, a hot summer and cold winter climate city. The results reveal substantial OTC differences among the blocks. However, these differences demonstrated great seasonal and temporal variations. In summer, BD exhibited the best OTC (mTSV = 1.21), while HN performed the worst (mTSV = 1.72). In contrast, BD showed the poorest OTC in winter (mTSV = −1.57), significantly lower than HN (−1.11) and RA (−1.05). This discrepancy was caused by the unique morphology of different blocks. The sky view factor emerged as a more influential factor affecting OTC over building coverage ratio and building height, particularly in RA (r = 0.689, p < 0.01), but its impact varied by block, season, and sunlight conditions. North–South streets generally perform better OTC than East–West streets, being 0.26 units cooler in summer and 0.20 units warmer in winter on the TSV scale. The study highlights the importance of incorporating more applicable physical parameters to optimize OTC in complex urban contexts and offering theoretical support for designing climate adaptive urban spaces.

1. Introduction

Owing to rapid urbanization and climate change, an increasing number of cities are facing urban heat problems, e.g., deteriorated urban thermal environments, human thermal discomfort, public health risks, and urban livability status degradation [1]. Therefore, tackling urban heat comes to an important issue for many authorities. Outdoor thermal comfort (OTC) is necessary for people creating comfortable and healthy outdoor environments. Improving the OTC is an area of interest for researchers, and OTC-related studies have been conducted in North America [2,3], South America [4,5], Europe [6,7], Africa [8,9], Asia [10,11], and Australia [12], covering nearly all climate zones. China is a vast country with huge regional climate variation and a markedly continental monsoon-influenced climate. Therefore, it is necessary to conduct more studies on OTC in Chinese cities across distinct climate zones. Currently, there are many OTC studies on in Southern China, characterized by a long duration of a hot summer. However, for cities with distinct seasons and meteorological conditions, the exploration of temporal variations in OTC remains limited [10]. Beijing, located in northern China, has a humid continental climate (Dwa). It is characterized by hot, humid summers and cold, dry winters with comparably long durations. Further exploration of temporal variations in OTC in this climate type could better assist in thermal environment improvement.
Increasing urbanization is inevitably manifested by the physio-morphological modification of built-up areas [13]. Complicated real urban environments generate varied thermal performances and OTC. Therefore, conducting comparative evaluations of OTC across different types of urban blocks is essential for identifying existing thermal comfort issues in a city and subsequently proposing optimization strategies. Extensive research has been carried out on the microclimatic analysis of various urban block types using numerical simulation methods [14,15,16,17,18]. However, microclimatic assessments alone fail to accurately represent thermal comfort, as it is also substantially affected by human thermal perceptional factors [19]. Unfortunately, comparative studies of OTC across different block types from the perspective of human thermal perception remain limited. Most existing studies based on human thermal sensation focus on a single urban block and rely on a limited number of measurement points. This limitation is primarily due to the fact that research involving human thermal perception requires both on-site meteorological measurements and simultaneous questionnaire surveys [20]. Moreover, such studies must be conducted at multiple locations at the same time, which poses significant challenges in terms of equipment availability and volunteer recruitment.
The thermal walk method, in which field measurements and questionnaire surveys are typically conducted simultaneously during a single walking campaign, has been developed and validated in several previous studies. For example, Dzyuban et al. applied this method to evaluate thermal comfort in a neighborhood in Phoenix, USA [21]. Peng et al. employed the same approach to assess thermal comfort in two areas of Rome, Italy, and further explored dynamic human thermal comfort [22]. Deng et al. conducted a thermal comfort assessment using the thermal walk method in both the old and new urban districts of Guangzhou, a city in southern China, and examined the influence of different urban spatial morphologies on thermal comfort [23]. During the thermal walk investigation, a group of interviewees is expected to walk along a designated route in each urban area and complete questionnaires at several measuring points to collect human thermal comfort data, including human thermal perception and climatic parameters. Compared with horizontal surveys [24,25], where questionnaires are distributed to random citizens, the thermal walk experiment can control some key variables including survey period, location, weather condition, and human parameters such as age, clothing, body activities, and thermal experiences. This method allows for the collection of data at multiple locations within a short time interval by using a single set of instruments during one campaign, thereby ensuring a high level of accuracy when comparing thermal comfort across different sites [26]. Therefore, the thermal walk approach holds strong potential for comparative investigations aimed at revealing spatial variations in OTC across distinct urban blocks from the perspective of human thermal perception.
The physical characteristics of the urban morphology can alleviate urban thermal and environmental problems [27]. Commonly studied physical parameters include the sky view factor (SVF), street orientation, building coverage ratio (BCR), and building height (BH), which define the morphology of the studied areas. The SVF is used to describe the percentage of visible sky at specific locations [28] and is proven to be the most useful tool for planners to conduct OTC related studies in urban open spaces [29]. Street orientation, which describes how buildings and canyons are oriented, can affect the amount of solar access, wind speed in urban open spaces, and length of the sun exposure period [30], subsequently impacting pedestrian OTC [31]. For example, east–west (E–W)-oriented streets are exposed to solar radiation longer than north–south (N–S)-oriented streets; thus, the former show low thermal comfort levels [32]. BCR also affects thermal comfort level, but it is highly dependent on the built environment. Air temperature in densely built-up areas can be reduced by up to 0.7 °C [33]. The BH is also a design parameter to represent built density that may affect SVF and solar radiation [34]. However, many studies have also demonstrated that the applicability of spatial morphological parameters may vary under different urban spatial configurations. For example, Deng et al. found that changes in spatial morphology in the new districts of Guangzhou, China, had a more significant impact on thermal comfort compared to the old districts [23]. Similarly, Narimani et al. observed that the influence of SVF on OTC showed uncertainty across streets with different orientations [35]. Therefore, the applicability and effectiveness of physical parameters that define urban morphology for assessing OTC in complex urban context should be explored.
In summary, existing research on OTC presents the following limitations. First, studies that conduct comparative evaluations of thermal comfort across urban areas with different spatial morphologies based on human thermal perception remain limited, particularly under the contrasting climatic conditions of hot summers and cold winters. Second, the applicability of key spatial morphological factors in various urban forms and seasonal climatic conditions—such as those in cities like Beijing—remains uncertain. Therefore, this study aims to comprehensively quantify OTC by examining climatic, temporal, and spatial variations in Beijing, which features a monsoon-influenced humid continental climate with significant seasonal and diurnal meteorological fluctuations. The specific research objectives are to:
(1)
systematically examine the OTC distributions in different urban blocks with distinct built environments;
(2)
thoroughly reveal the relationships between OTC and urban morphological features in different urban blocks over time; and
(3)
critically explore the applicability and effectiveness of physical parameters that could better define urban morphology in evaluating OTC variations.
These results can further our understanding of OTC in real urban environments. This study can also help urban planners and policy makers improve the urban thermal environment.

2. Methodology

2.1. Climatic Condition of the Study Area

This study was conducted in Beijing, a metropolis in northern China (39.9° N, 116.4° E) with a population of approximately 20 million. Beijing falls within the Dwa category of the Köppen–Geiger climate classification. This climate type is characterized by hot, humid summers and cold, dry winters, which may cause considerable OTC variance during different seasons. For outdoor thermal comfort (OTC) research, it is advisable to select months with relatively extreme climatic conditions for field investigations. This approach enables the assessment of thermal comfort conditions and improvement requirements under the most adverse climate scenarios. Figure 1 shows the monthly mean air temperature, wind speed, daily accumulated solar radiation, and relative humidity from 2002 to 2022. Data were obtained from the National Meteorological Information Center of China (http://data.cma.cn/, accessed on 20 January 2024). July experiences the peak air temperature, followed by August and June, while January records the coldest temperatures, followed by December and February. The climate during autumn and spring is comparatively mild and agreeable. Fieldwork was conducted in July and January, corresponding to the hottest and coldest months, respectively.

2.2. Selection of Urban Blocks

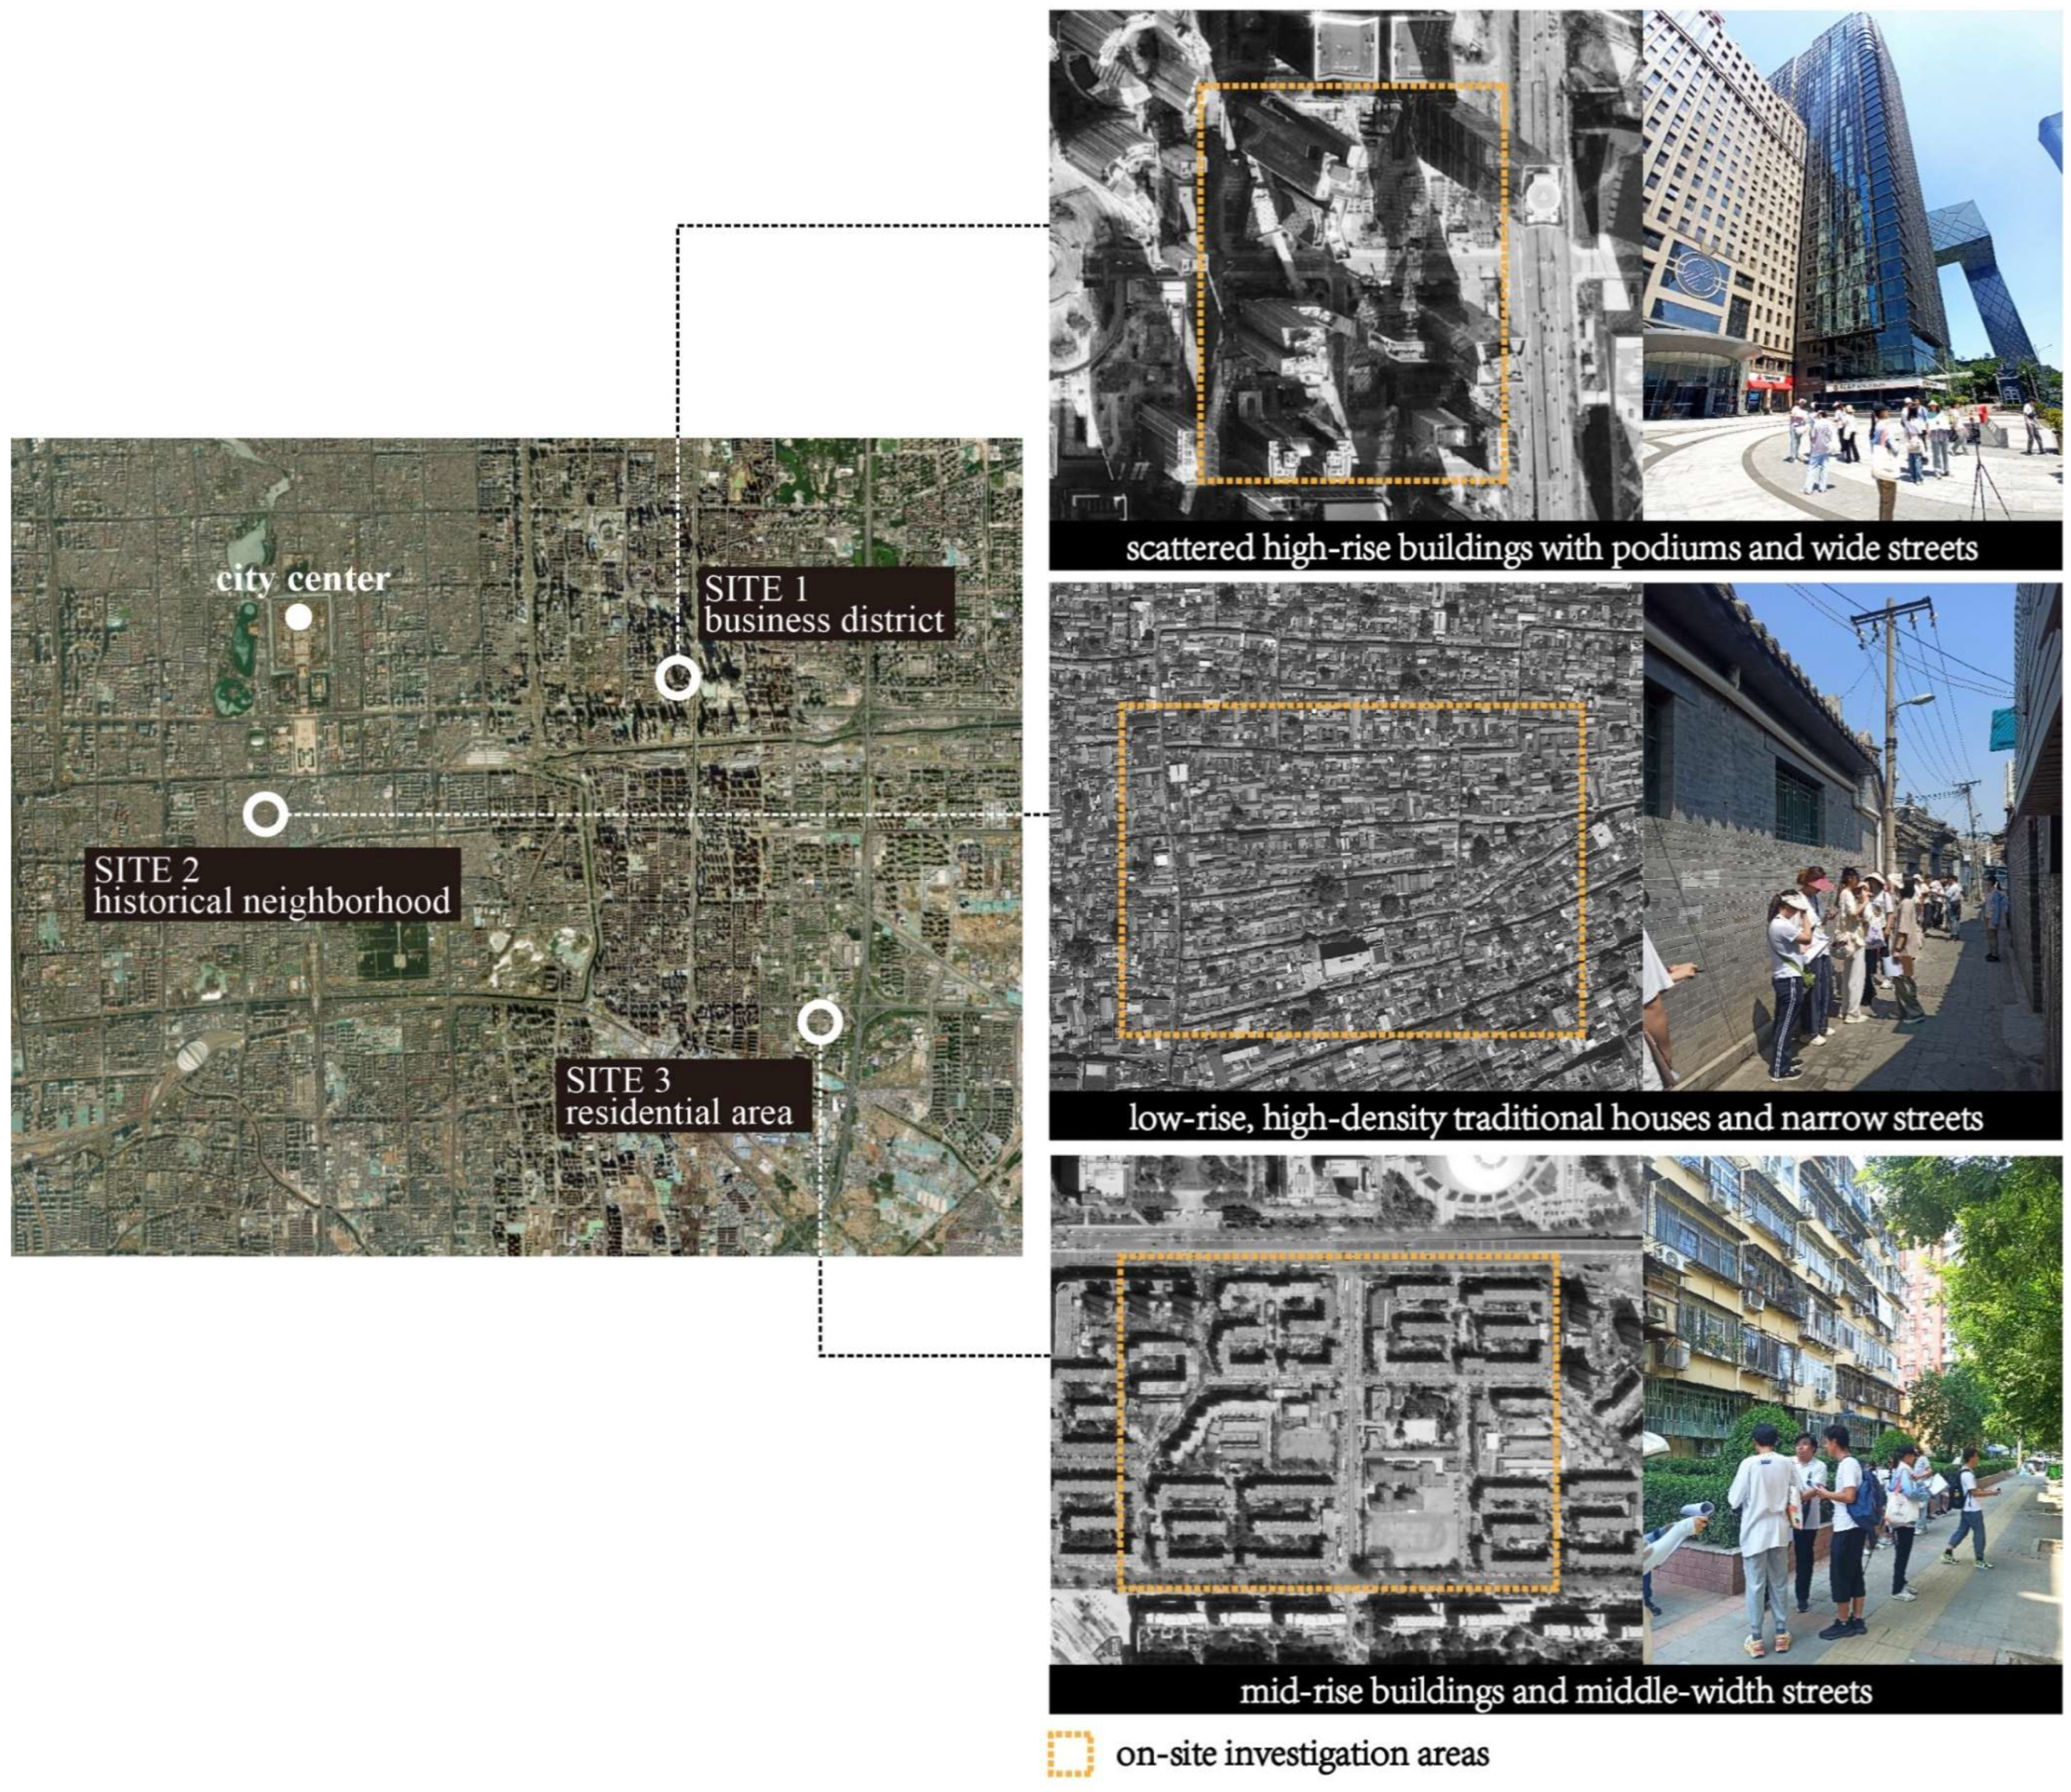
Three urban blocks representing the spatial forms of typical urban blocks in Beijing were selected as the study sites. They are the business district (BD), residential area (RA), and historical neighborhood (HN). The locations and street views of the selected urban districts are shown in Figure 2. BD is a newly developed modern urban block located 5 km east of the city center, with a spatial morphology of scattered high-rise buildings with podiums and wide streets. HN is a historical urban block located near the city center, which was developed during the late 19th and early 20th centuries, with a spatial morphology of low-rise but high-density traditional houses and narrow streets. RA was constructed in the 1990s and is located 9 km away from downtown areas. The spatial morphology of this block features mid-rise buildings and middle-width streets. All three blocks had two perpendicular street orientations: N–S and E–W.

2.3. Thermal Walk

2.3.1. Experiment Design and Schedule

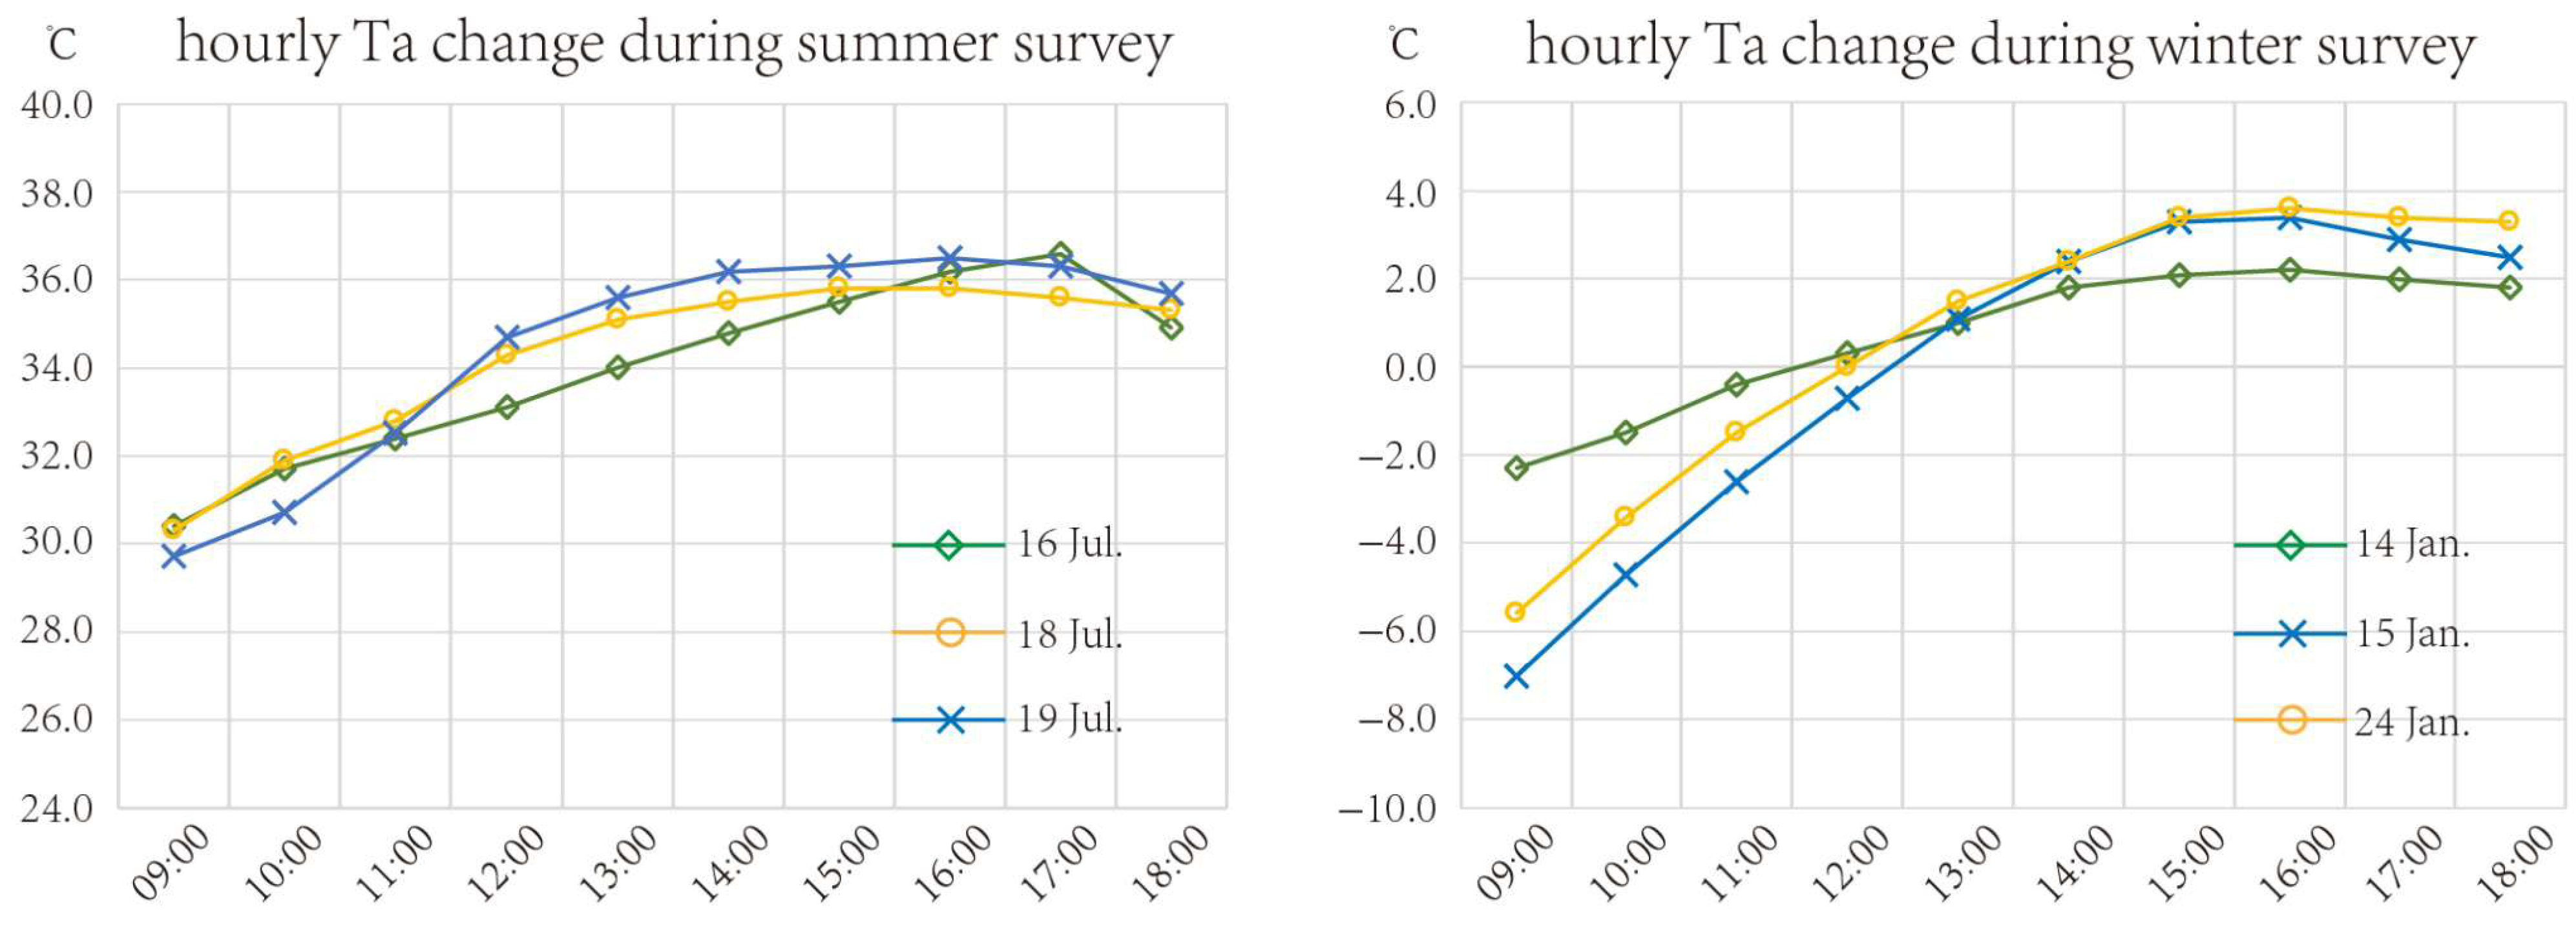
The thermal walk experiments were conducted in three selected urban areas over three days in summer and winter. The daily experiment was divided into three rounds—morning (R1), midday (R2), and afternoon (R3)—to ensure that the experiment captured the variations in temperature and solar radiation throughout the day. Table 1 lists the dates, locations, and time for each round on survey days. The time variation between two seasons was due to shorter daylight hours in winter. Clear sunny days were selected for the survey to ensure that the weather conditions were as close as possible to the typical meteorological days in Beijing in July and January. Figure 3 illustrates the hourly air temperature change pattern in survey days during two seasons. Due to considerations of labor and equipment costs, surveys at different locations were conducted on separate days. However, the selected survey dates shared similar climatic conditions, which helped to ensure the consistency of the experimental results as much as possible.
The route for each urban block contained 16 measurement points, as shown in Figure 4. The design of the routes and measuring points were optimized to ensure a variety of sun-exposure conditions and urban spatial forms. Specifically, in the BD area, points 1, 2, 3, 8, 9, and 13 were located along east–west-oriented streets; points 4, 5, 6, 14, 15, and 16 were situated on north–south-oriented streets; and points 7, 10, 11, and 12 were positioned at street corners or in open spaces in front of buildings. In the HN area, points 3, 4, 5, 10, 11, 12, 14, 15, and 16 were located on east–west-oriented streets; points 2, 7, 8, 9, and 13 were on north–south-oriented streets; and points 1 and 6 were positioned at street intersections. In the RA area, points 3, 4, 7, 8, 13, and 14 were located along east–west-oriented streets; points 1, 5, 6, 11, 12, and 15 were on north–south-oriented streets; and points 2, 9, 10, and 16 were situated at street corners or in open spaces near buildings. All measurement points were deliberately selected to represent locations with varying degrees of spatial openness. This ensured significant differences in solar radiation among the points at different times of the day, facilitating the analysis of the relationship between spatial morphology and thermal comfort. The Sky View Factor (SVF) values of each point in the two seasons are shown in Appendix A and Appendix B. The walking routine was properly designated to keep background environmental variables relatively stable, like surface material and anthropogenic heat, etc.

2.3.2. Questionnaire Survey

At each measuring point, the interviewees were asked to complete questionnaires to obtain thermal perception data. The questionnaire was designed according to previous studies (Deng et al., 2023 [23]) and contained two essential questions for thermal perception: a thermal sensation vote (TSV) and thermal comfort vote (TCV). The TSV was adapted from ASHRAE’s 7-point scale, from very cold (−3) to neutral (0) to very hot (3). The TCV was indicated on a 3-point scale, as comfortable (1), slightly uncomfortable but acceptable (2), and uncomfortable (3). Nineteen interviewees (nine males and ten females) participated in the survey in the summer and 18 interviewees (nine males and nine females) in winter. All the interviewees were students at a university in Beijing. The ages of the interviewees ranged from 19 to 28 years, and all had lived in Beijing for more than one year to ensure that they adapted to the local climate. All participants were requested to stay at each measuring point for at least 3 min before answering the questions to adapt to the current weather conditions. All participants received training on the experimental process and questionnaire before the start of the survey. No ethical approval was required in this study. Verbal informed consent has been obtained from all participants in this study.

2.3.3. Meteorological Parameters Measurement

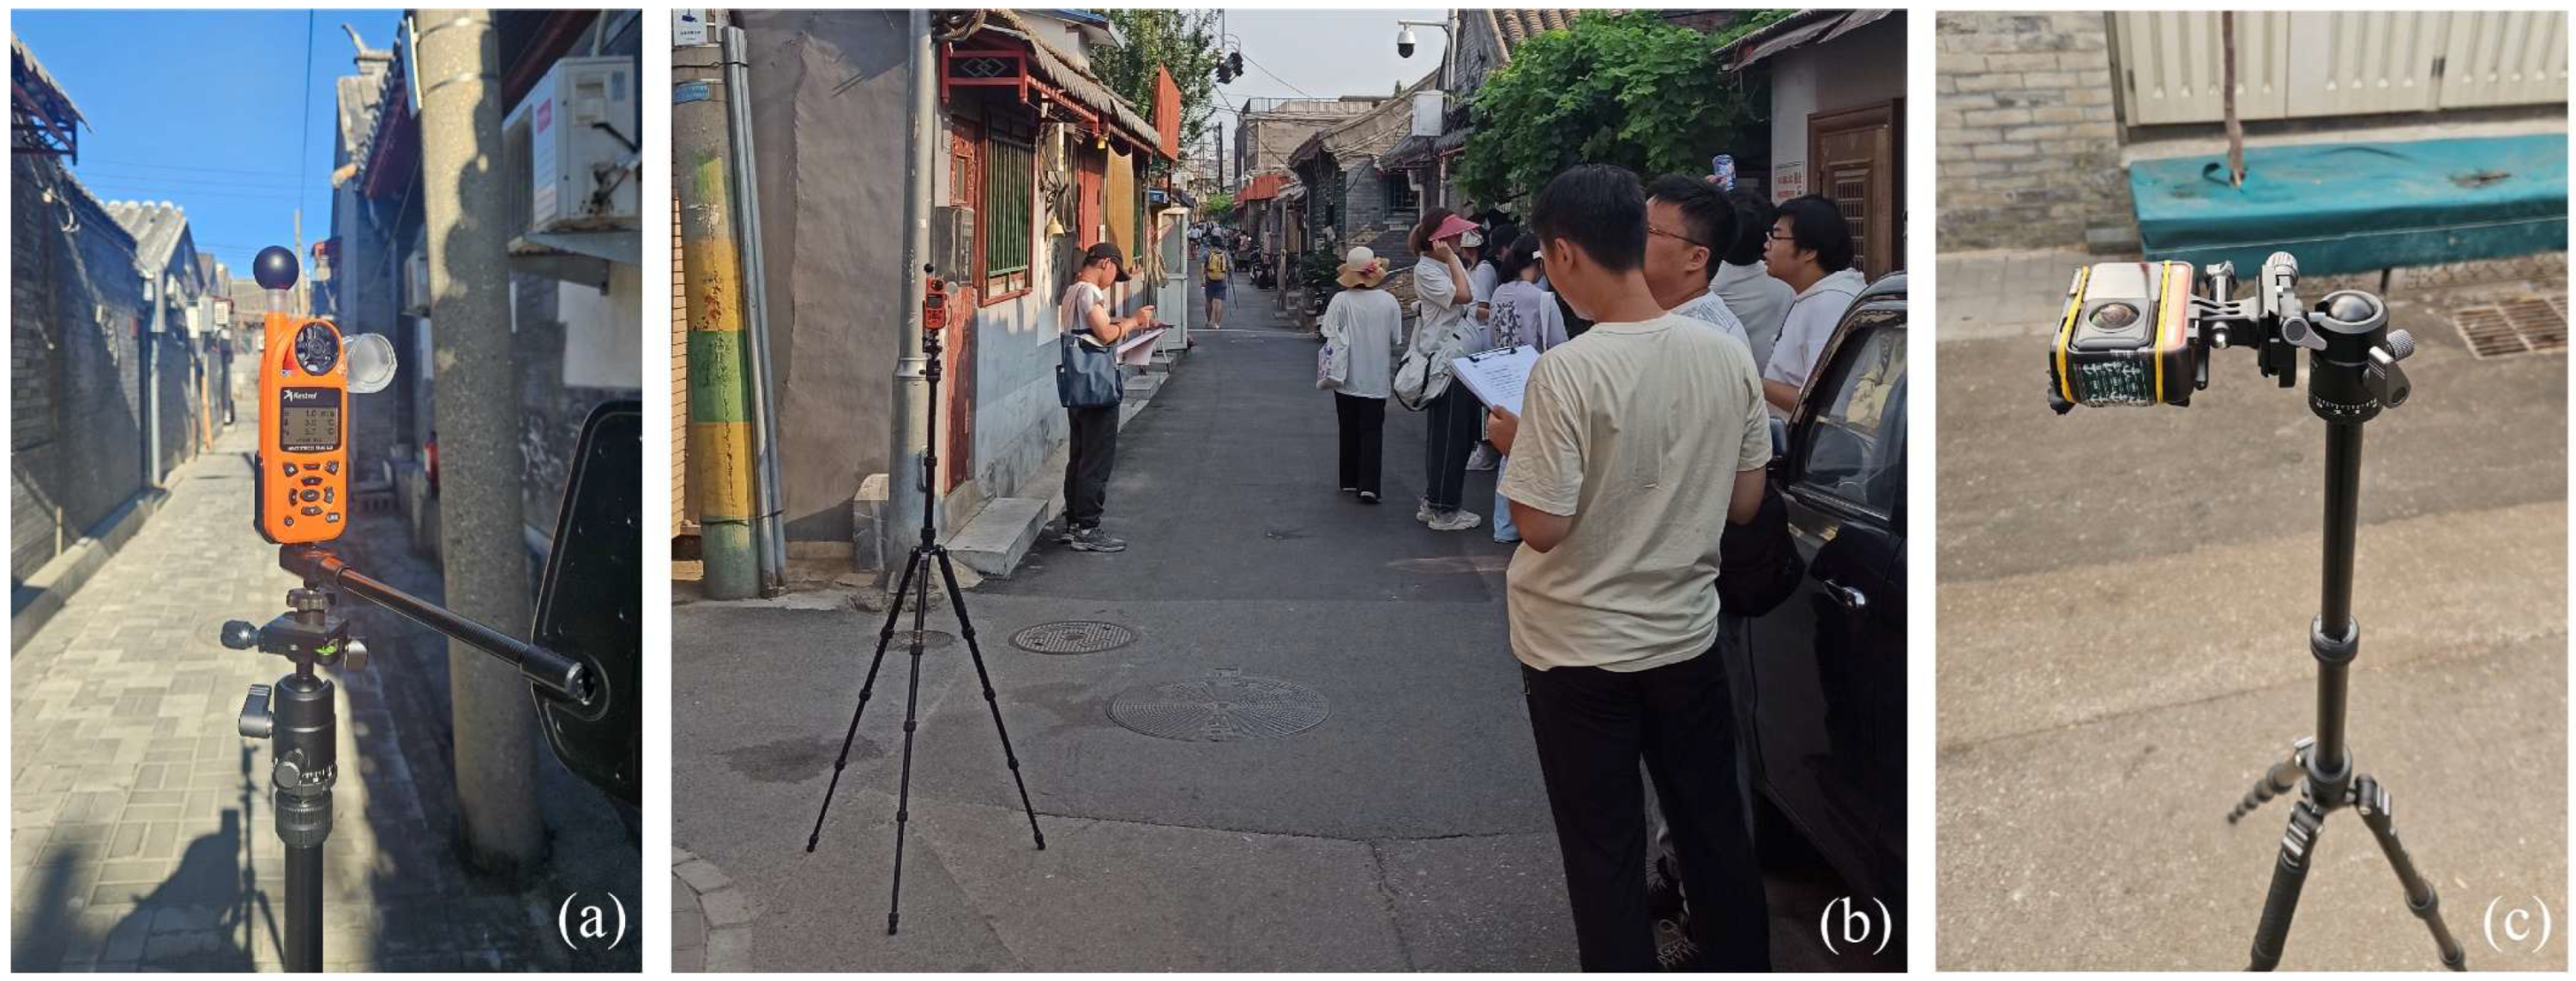
The microclimate parameters for each point are also measured during the questionnaire survey. Two Kestrel NK5400 (Kestrel Instruments, Boothwyn, PA, USA) portable meteorological stations, fixed approximately 1.5 m height above the ground using tripods, were used to collect air temperature (Ta), wind speed (Va), relative humidity (RH), and black globe temperature (Tg) data (Figure 5a,b). The Ta, RH, Va, and Tg data were recorded automatically at 5-s intervals. The specifications of the environmental monitoring equipment are shown in Table 2. The use of Kestrel NK5400 portable meteorological stations provides relative lower accuracy in measurements of globe temperature compared with ISO 7243. Large amount of measurement points requires mobile measurement, and portable device enables the reliability. Considering the limitation of the equipment and manpower, NK5400 was employed.
During the survey, when data collection began at one location, an NK5400 weather station was placed in advance at the next measuring point to ensure that each instrument had approximately 10 min to acclimatize to ensure data accuracy upon being moved to the new position. All interviewees were asked to stay within 10 m of the weather station to ensure they could receive the same climate conditions as the weather station. They were kept at least 2 m from the weather station to avoid disturbing the microclimate data recorded by the sensors. During the survey, all ground surfaces were made of common urban pavement materials, including concrete and granite.

2.4. Calculation of Morphological Indicators

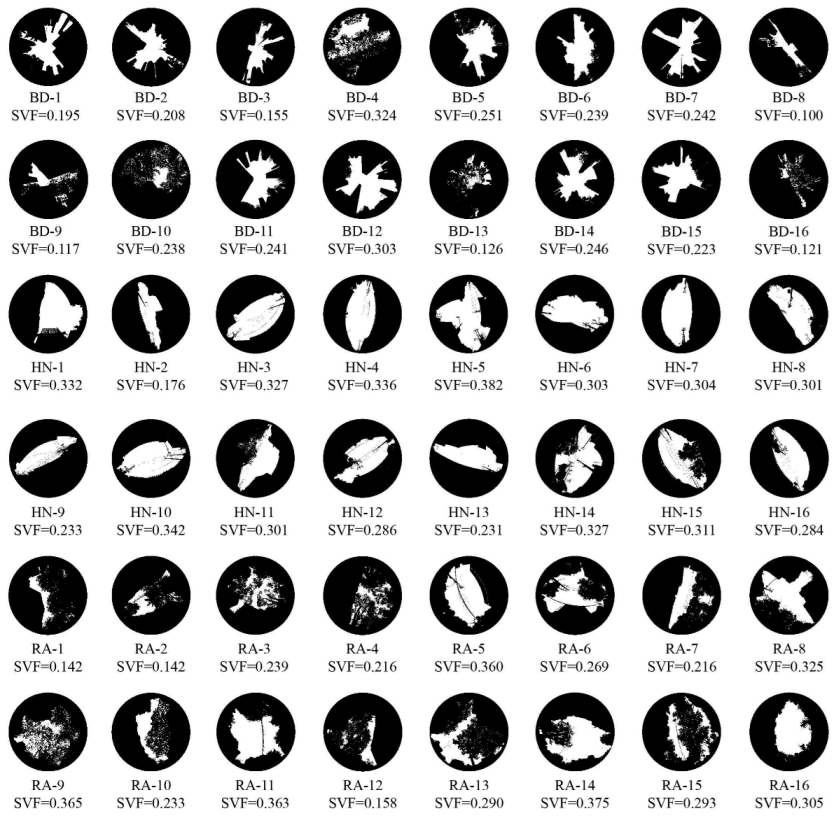
The impacts of SVF (the most commonly used spatial morphological indicator in OTC studies) as well as BCR and BH (two morphological indicators frequently used in urban design) on OTC were investigated. The SVF for each measuring point was collected using an Insta360 One R spherical camera (Insta 360, Shenzhen, China). During the survey, the camera was mounted horizontally on a tripod approximately 1.5 m above the ground (Figure 5c). One lens was directed upwards, and another was directed downward. The downward-facing lens was obscured by a black opaque material to ensure that the upward-facing lens could capture a fisheye photograph without interference. The reliability of this method for obtaining the SVF has been verified in previous studies [36]. Fisheye photos of each point during the two seasons are shown in Appendix A and Appendix B. The BCR and BH of each measurement point within a buffer zone of radius 60 m were calculated. Equation (1) indicates the calculation method of the BCR, where AP is the footprint area of each building within the buffer zone and AT is the area of the buffer zone. Equation (2) indicates the calculation method of BH, where AP is the footprint area of each building and HP is the height of each building within the buffer zone. Therefore, BH is not the arithmetic mean of the height of each building but a weighted mean height considering the building footprint area. The outline and the height of the buildings were obtained from satellite remoting images and on-site investigation and then converted into 3D model using AutoCAD (version 2020) and Rhino (version V6) software. The spatial morphological indicators of each block and measuring point were then calculated from block models. The BCR and BH values for each measurement point and the average BCR and BH values for each block are listed in Appendix C.
B C R = p = 1 n A P A T
B H = p = 1 n A P · H P p = 1 n A P

2.5. Applicability of Black Globe Temperature

Numerous existing studies have demonstrated that solar radiation is one of the most critical factors affecting thermal comfort in both summer and winter [37,38]. Ma and Zhang, in their study of the Beijing area, point out that globe temperature (Tg), which accounts for both air temperature and solar radiation, plays a decisive role in thermal comfort during both seasons [39]. Its applicability to Beijing’s climatic conditions was also tested in this study. It should be mentioned that the recorded Tg tends to be slightly underestimated due to equipment limitation.
First, Pearson correlation analysis was conducted between the meteorological variables (Ta, RH, Va, and Tg) measured using the Kestrel NK5400 (Kestrel Instruments, Boothwyn, PA, USA) and the TSV obtained from questionnaires, to identify and exclude factors with no significant impact on thermal comfort. Correlation analysis indicated that in summer, TSV was positively correlated with Ta (Pearson correlation coefficient = 0.640, Sig. = 0.000) and Tg (Pearson’s correlation coefficient = 0.894, Sig. = 0.000), negatively correlated with RH (Pearson’s correlation coefficient = −0.278, Sig. = 0.000), and not correlated with Va (Pearson’s correlation coefficient = −0.001, Sig. = 0.493). In winter, TSV was positively correlated with Ta (Pearson’s correlation coefficient = 0.660, Sig. = 0.000) and Tg (Pearson’s correlation coefficient = 0.880, Sig. = 0.000), negatively correlated with Va (Pearson’s correlation coefficient = −0.303, Sig. = 0.000), and not correlated with RH. Therefore, Va and RH were excluded from the factors affecting OTC in summer and winter, respectively.
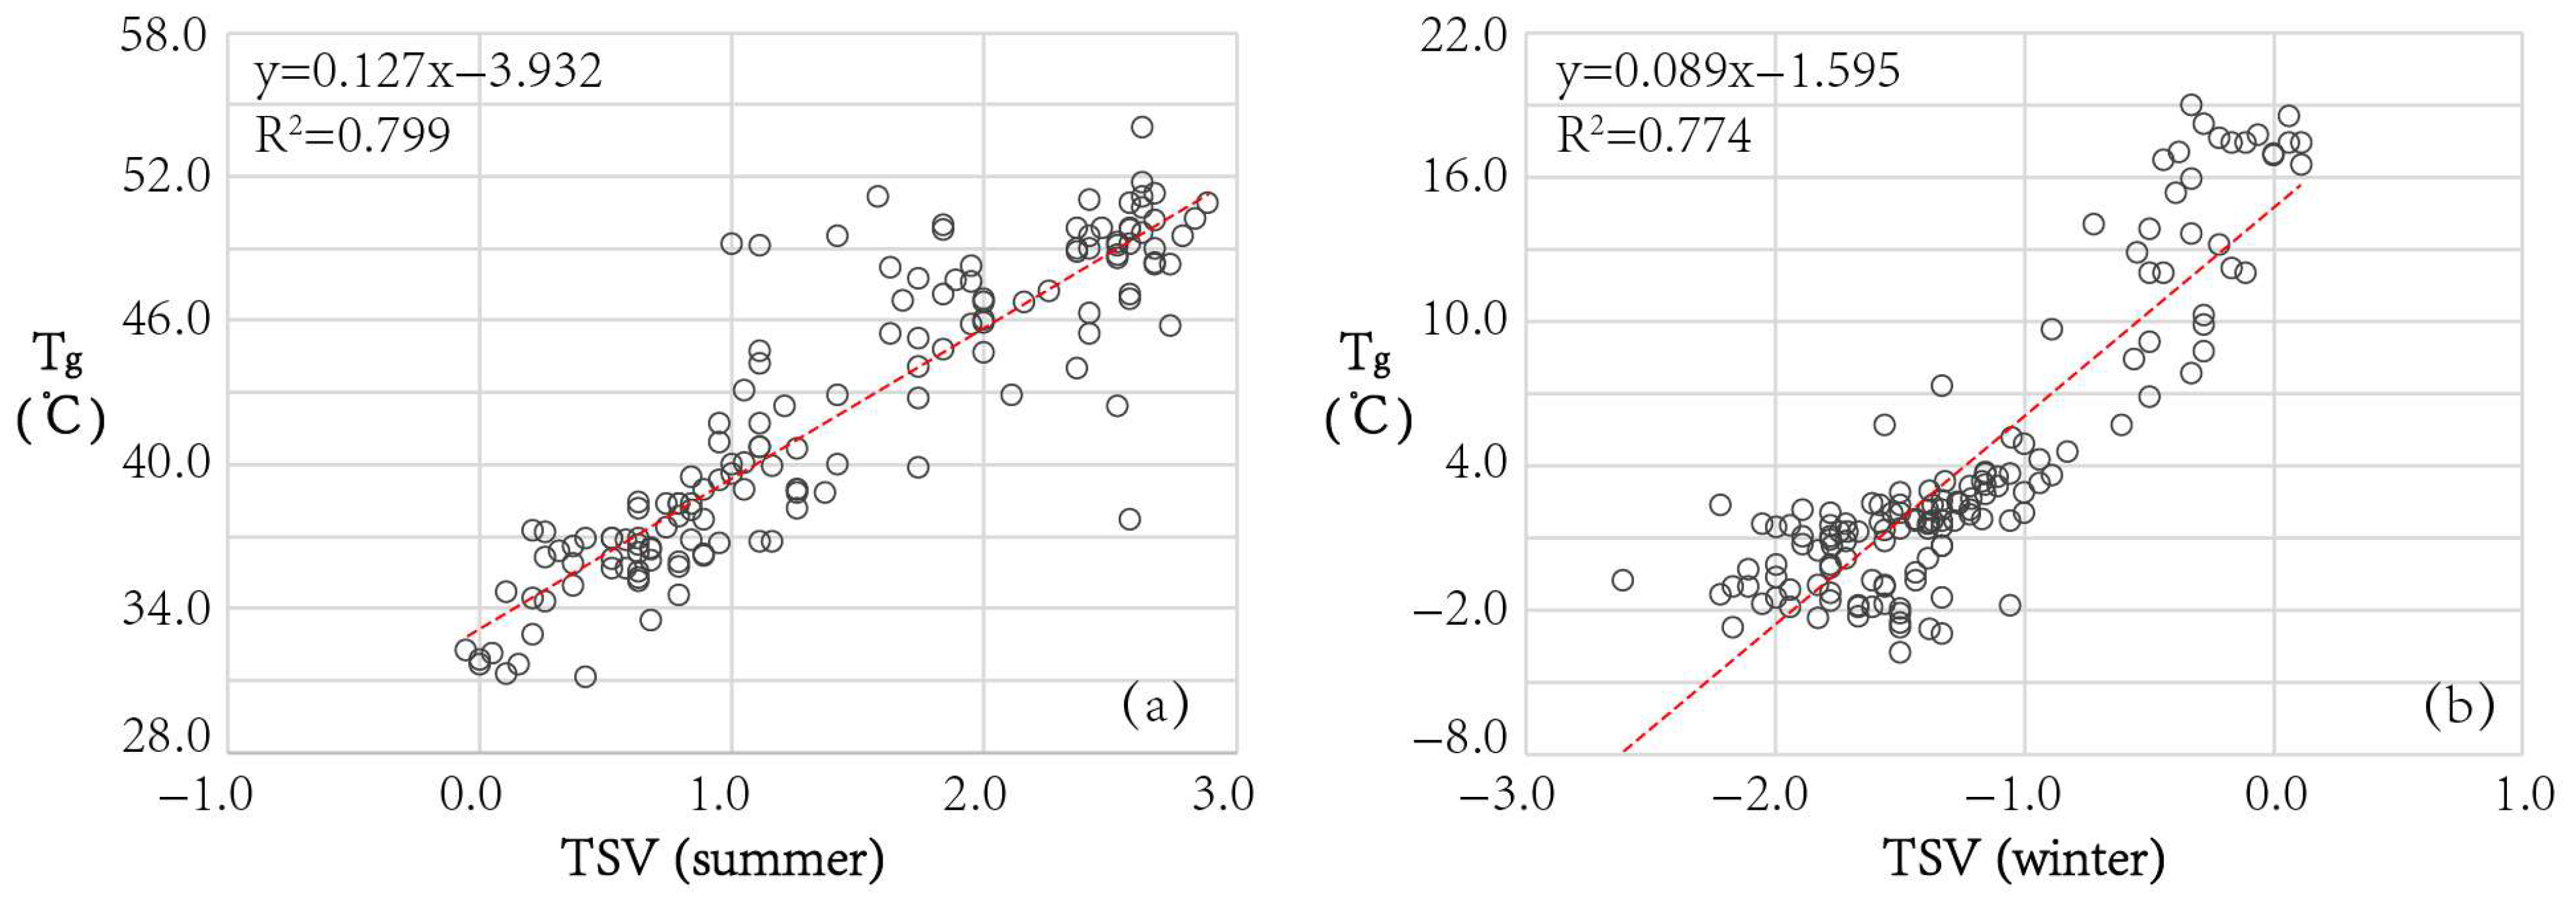
A stepwise linear regression model was then employed to determine the contribution of each meteorological variable to the TSV. During summer, Tg emerged as the most influential factor (R2 = 0.799) (Figure 6a), whereas RH and Ta were excluded from regression model. Meanwhile, in winter, Tg remained the dominant predictor of TSV (R2 = 0.774) (Figure 6b), followed by Va, which had a relatively minor influence (R2 = 0.092). Ta was again excluded from the contributing variables. Since the impact of Va on OTC was limited in winter, it can be summarized that Tg was the most suitable indicator as a benchmark for comparing OTC across different blocks for both seasons.

3. Results and Analysis

A total of 5378 questionnaires were collected during the survey, with 2786 in summer and 2592 in winter. During the summer investigation, the measured Ta ranged from 30.8 to 41.5 °C, RH from 22% to 51%, Tg from 31.1 °C to 54.0 °C, and Va from 0.00 m/s to 3.59 m/s. During the winter investigation, the measured Ta from −2.8 °C to 5.7 °C, RH from 15% to 37%, Tg from −3.8 °C to 19.0 °C, and Va from 0.00 m/s to 4.65 m/s. The mean TSV (mTSV) and mean TCV (mTCV) were calculated as the average TSV and TCV of all interviewees for each measurement point, round, and day, respectively. The mean values of Tg, Ta, RH, and Va were calculated for each measurement point, round, and day.

3.1. OTC Variation Across Different Blocks

3.1.1. All-Day Average OTC Comparison

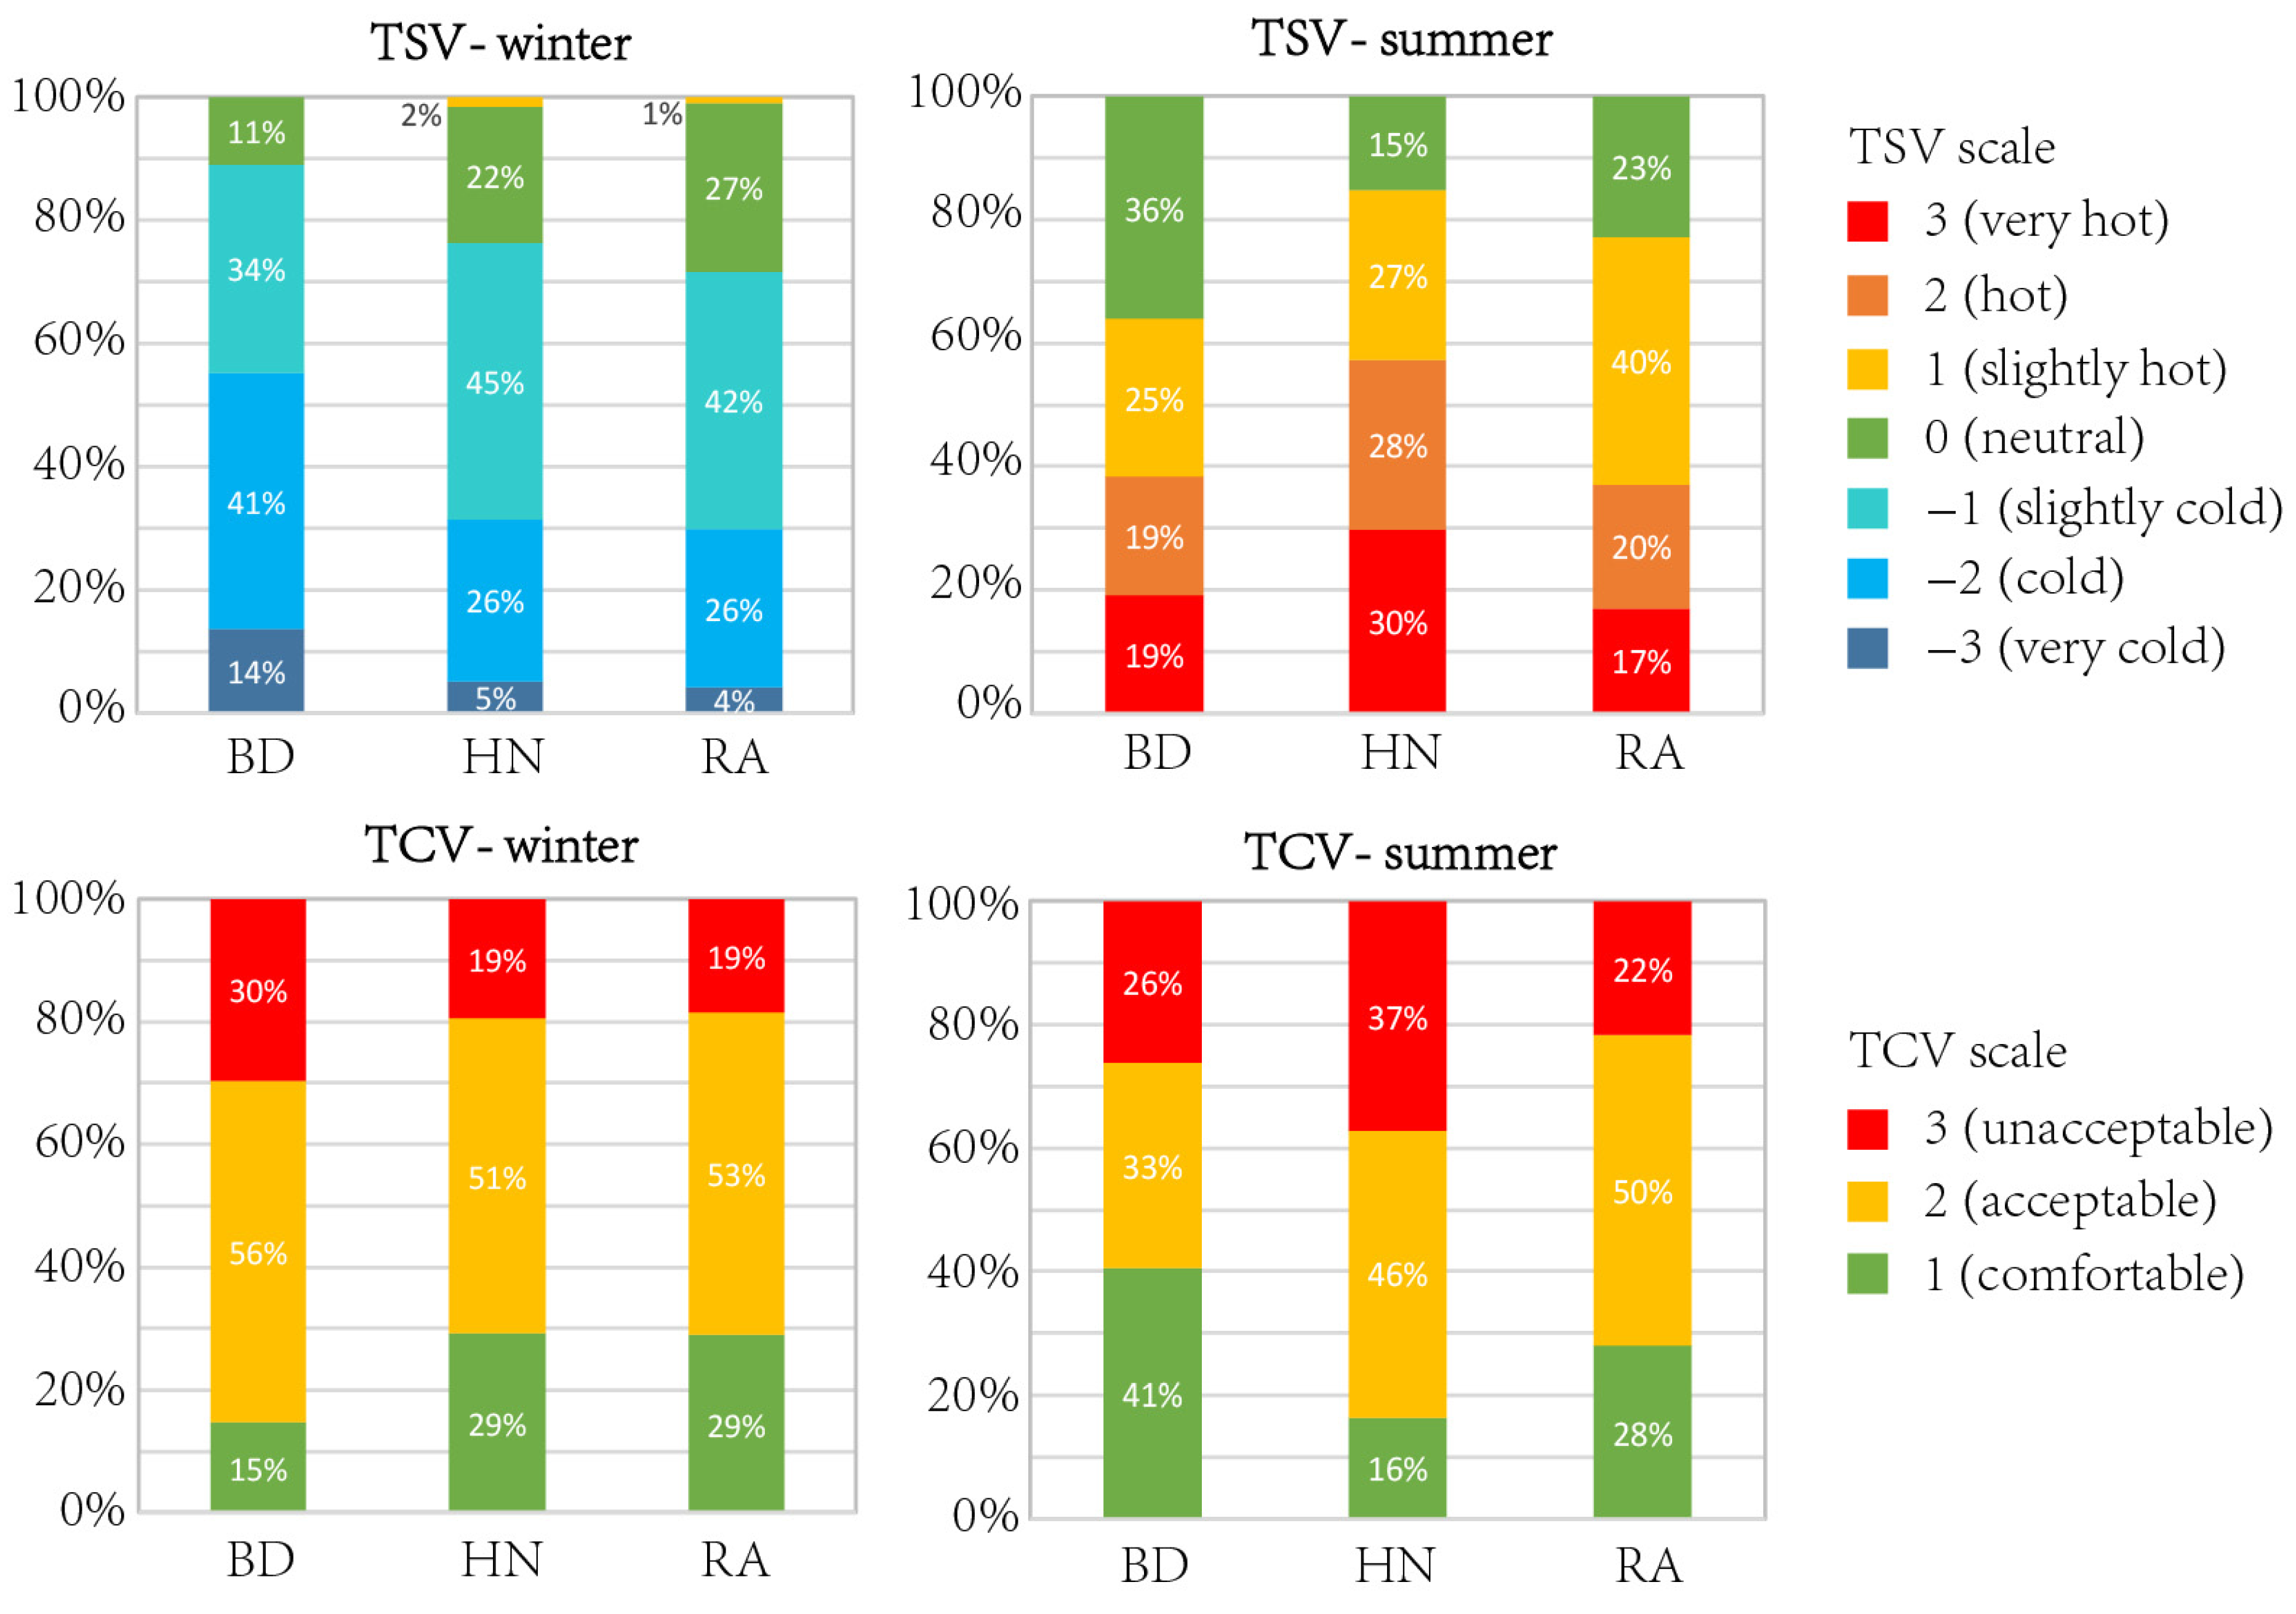
Figure 7 illustrates the proportions of TSV and TCV, and Table 3 lists the mTSV and mTCV for the entire day for the three types of blocks in the two seasons. A comparative analysis revealed significant differences in OTC among the three neighborhoods, with distinct trends evident across the two seasons.
In summer, 36% of the respondents in BD selected TSV = 0 (neutral), which was 21% and 13% higher than those in HN and RA, respectively. In addition, 41% of the respondents in BD chose TCV = 1 (comfortable), which exceeded the selections for HN and RA by 25% and 13%, respectively. Further comparisons of mTSV and mTCV revealed that the mTSV of BD was 0.51 lower than that of HN and only 0.10 lower than that of RA. The mTCV of BD was 0.35 lower than that of HN but only 0.08 lower than that of RA. Therefore, it can be concluded that when considering the overall OTC across the three time periods throughout the day during summer, BD exhibited the best OTC condition among the three areas. The OTC condition of RA was slightly inferior to that of BD; however, the difference was not significant. In contrast, the OTC condition of HN was significantly worse than that of the other two areas.
During winter, the OTC conditions in the three blocks differed significantly from those during summer. In BD, only 11% of respondents chose TSV = 0 (neutral), which was 11% and 16% lower than in HN and RA, respectively. Additionally, 14% of respondents in BD selected TSV = −3 (very cold), which was 9% and 10% higher compared to HN and RA, respectively. Furthermore, for the TCV options, the proportion of respondents in BD reporting discomfort was significantly higher than that in the other two areas, whereas the proportion reporting comfort was significantly lower. The mTSV in BD was 0.46 and 0.52 lower than HN and RA, while the mTCV in BD was also higher by 0.25 and 0.26 compared to HN and RA, respectively. These findings confirm that during winter, the OTC of BD was significantly poorer than that of HN and RA. In contrast, there were no significant differences between HN and RA indices.

3.1.2. OTC Comparison Across Different Time Periods

This section compares the investigation results from three time periods, including R1, R2, and R3 to further examine the OTC across different types of blocks.
  • Summer
Figure 8 illustrates the proportional distribution of the TSV and TCV options in different survey periods across the three blocks during the summer investigation. Table 4 shows the mTSV, mTCV, and mean globe temperature (mTg) for each period.
In R1, the proportion of respondents in BD selecting TSV = 0 (neutral) and TCV = 1 (comfortable) was significantly higher than those in HN and RA. BD also exhibited lower mTSV, mTCV, and mTg values than the other two blocks, indicating that BD had the optimal OTC of the three blocks during this period. Meanwhile, the mTSV, mTCV, and mTg of RA were 0.13, 0.14, and 0.23 °C lower than those of HN. This demonstrates that the OTC of RA was marginally better than that of HN during this period.
In R2, the OTC conditions of HN significantly deteriorated compared to the other two types of blocks. In HN, 57% of the respondents chose TSV = 3 (very hot), and 56% selected TCV = 3 (unacceptable). Both were significantly higher than in BD and RA. Additionally, the mTSV of HN was 0.54 and 0.63 higher than those of BD and RA, respectively; mTCV was higher by 0.26 and 0.31, respectively; and mTg was higher by 2.8 °C and 3.5 °C, respectively. In the comparison between BD and RA during this period, the mTSV, mTCV, and mTg of RA were all slightly lower than those of BD, indicating that RA had slightly better OTC than BD and was the best of the three blocks during this period.
In R3, the OTC of HN markedly underperformed relative to the other districts, while the comparative metrics between BD and RA exhibited no significant divergences. In HN, the proportion of respondents selecting TSV = 0 was 16%, which was 19% lower than in BD and 16% lower than in RA, respectively. The proportion of respondents selecting TCV = 1 was 17%, which was 24% lower than that selecting BD and 21% lower than that selecting RA, respectively. Furthermore, the mTSV, mTCV, and mTg of HN were substantially higher than those recorded in other districts.
Consequently, it was evident that the OTC of HN in R2 and R3 significantly underperformed compared with the other two areas, contributing to its suboptimal average daily OTC during the summer. Although the OTC of BD trailed slightly behind that of RA during the hottest times of the day (R2), its superior OTC in the morning (R1) significantly enhanced its average OTC over summer, positioning it as the best among the three districts.
b.
Winter
Figure 9 illustrates the proportional distribution of the TSV and TCV options in different survey periods across the three blocks during the winter investigation. Table 5 presents the values of mTSV, mTCV, and mTg for each period.
In R1, the OTC in BD was markedly inferior than that of HN and RA. In BD, the proportion of respondents selecting TSV = −3 (very cold) was significantly higher by 18% and 17% than that in HN and RA, respectively. Similarly, the proportion selecting TCV = 3 (unacceptable) was 10% and 14% higher than in HN and RA, respectively. Additionally, the mTSV and mTCV of BD were significantly higher than those of the other two districts. The proportion of respondents in RA selecting TSV = 0 (neutral) and TCV = 1 (comfortable) was 14% and 11% higher, respectively, than that in HN. Additionally, RA exhibited superior mTSV, mTCV, and mTg to HN. Therefore, it can be inferred that the OTC of RA in the morning was slightly better than that of HN.
In R2, the OTC disadvantage in BD was more pronounced than that in R1. Compared to HN and RA, the mTSV of BD was lower by 0.89 and 0.75, its mTCV was higher by 0.58 and 0.47, and its mTg was lower by 5.6 °C and 4.8 °C, respectively. During this period, the OTC conditions of HN were slightly better than those of RA. In addition to having a higher proportion of respondents selecting TSV = 0 and TCV = 1, the mTSV of HN was 0.14 higher than that of RA, while its mTCV was 0.11 lower.
In R3, the mTSV, mTCV, and mTg in BD still slightly underperformed relative to HN and RA but the differences became insignificant compared to R1 and R2. In addition, when comparing HN and RA, the differences in all indices between the two blocks were not significant.
Consequently, it can be concluded that BD consistently exhibited the poorest OTC performance across all periods in the three blocks, with this discrepancy being particularly pronounced in R2. Based on a comprehensive analysis of all periods throughout the day, there was no substantial difference in OTC between HN and RA. The OTC of RA was slightly superior to that of HN in R1, while this situation was reversed in R2.

3.1.3. OTC Variation Among Different Measuring Points in Three Blocks

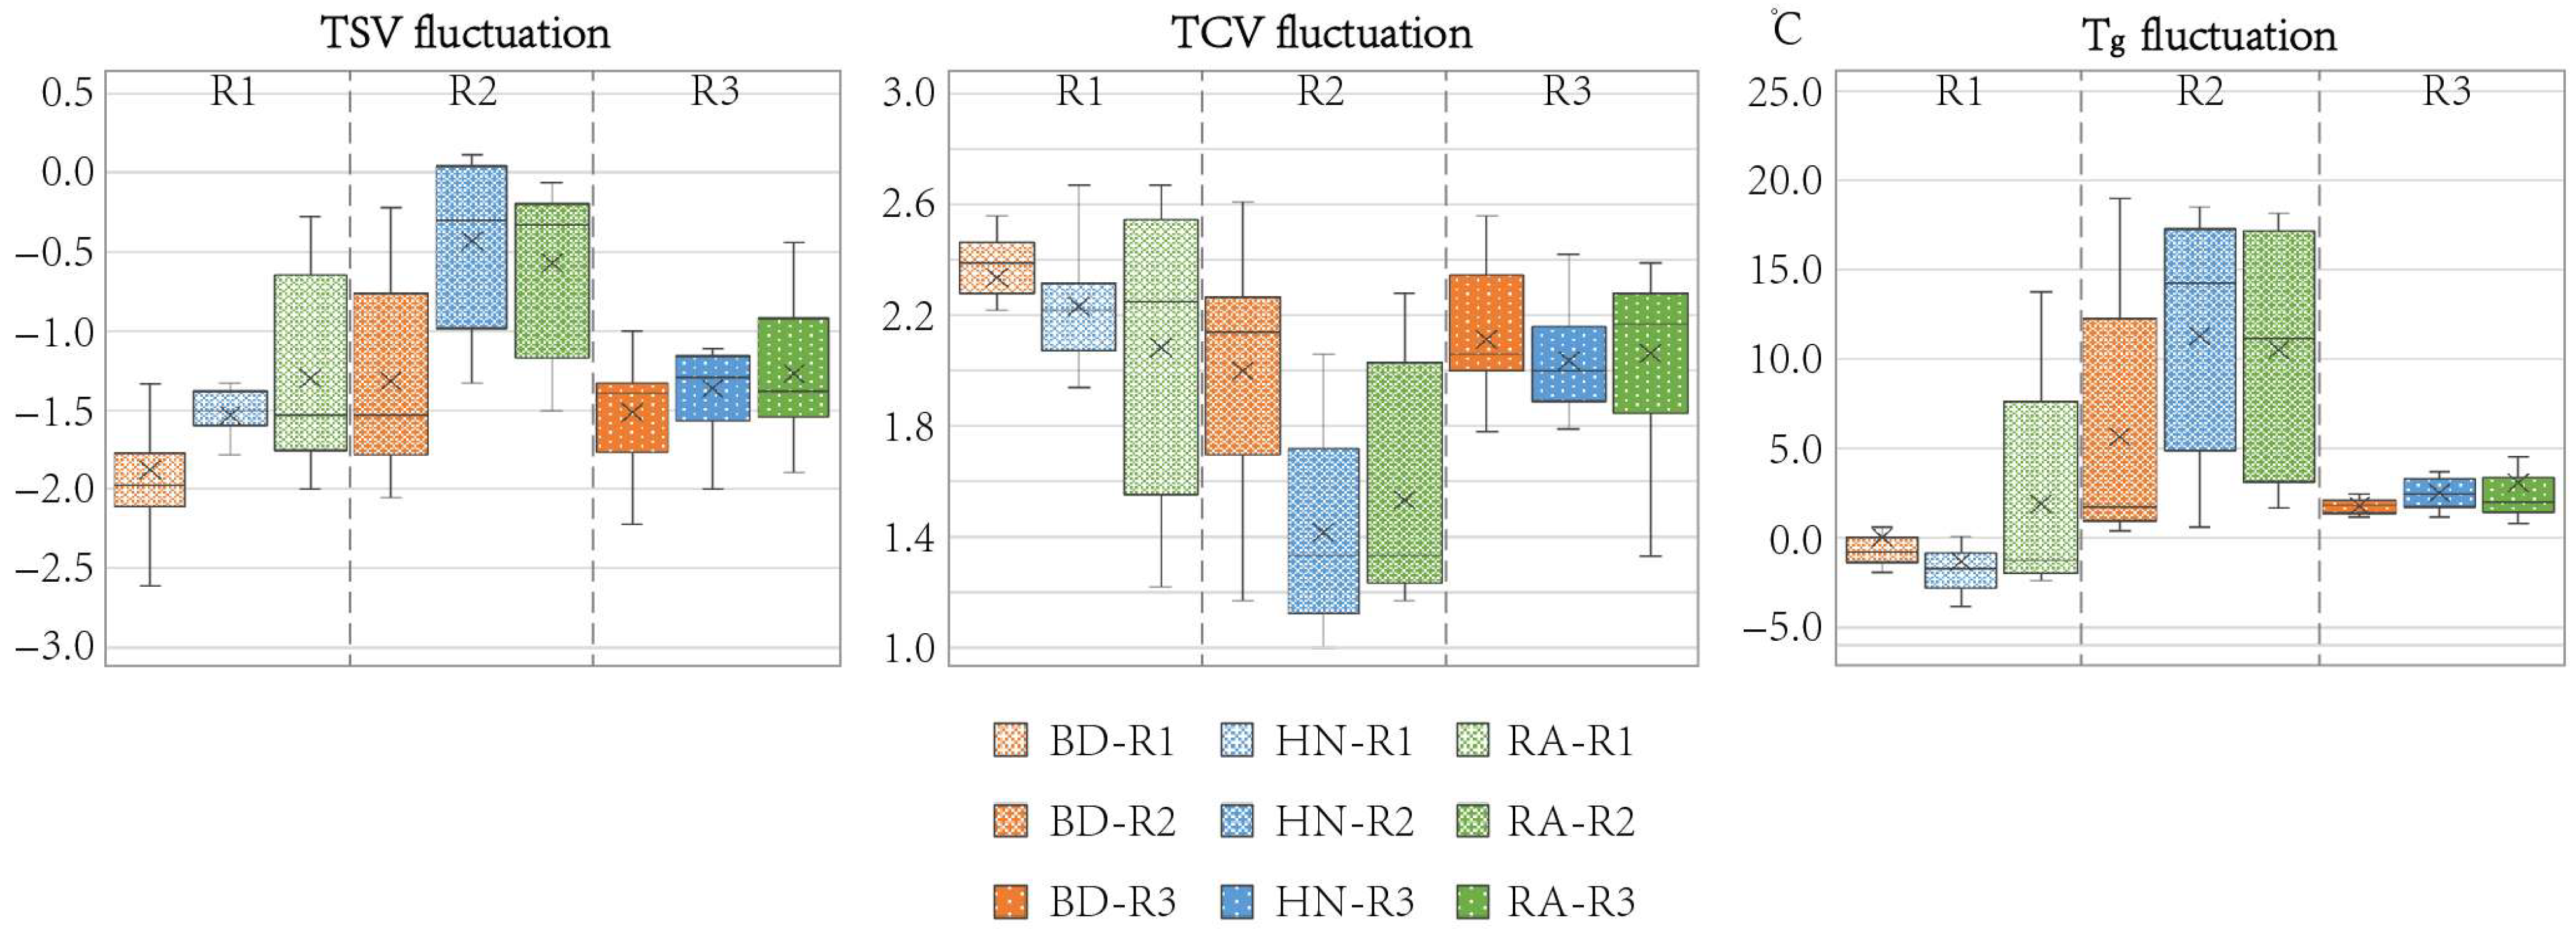
The OTC discrepancy between the three blocks in the previous section was based on the average values from the 16 measurement points. However, even within the same block, there were OTC fluctuations among different measurement points, which further caused an OTC difference among the three blocks. Figure 10 and Figure 11 illustrate fluctuations in mTSV, mTCV, and Tg across the 16 measurement points in BD, HN, and RA during the three rounds of surveys in summer and winter. In summer, BD exhibited a wider range of values for mTSV, mTCV, and Tg, compared to the other two blocks. This result indicates that the OTC difference between each point in BD was more significant than that in HN and RA. These fluctuations were particularly pronounced in R2. Conversely, the OTC fluctuations at various points in HN were the least noticeable, indicating the relatively stable OTC condition of this block.
However, during winter, the OTC fluctuations at the 16 measurement points were substantially different from those during summer. The measurement points in BD did not exhibit the same significant fluctuations across various indicators as those observed in the summer. HN exhibited characteristics consistent with those in summer with no strong fluctuations among the 16 points. In contrast, the measurement points in RA displayed greater fluctuations during the morning than those in BD and HN. Meanwhile, the overall OTC fluctuation for all measuring points during winter was not as obvious as in summer, with a standard deviation of TSV of 0.43 in winter and 0.74 in summer.

3.2. Impact of Built Environment Variables on OTC

3.2.1. Morphological Factors

Table 6 lists the correlations between various morphological indicators and TSV across distinct blocks, periods, and seasons. SVF, BCR, and BH had a significant impact on the all-day mTSV. Regardless of the season, SVF showed a significant positive correlation with all-day mTSV, implying that as SVF increased, the interviewees felt hotter/warmer. During summer, BCR exhibited a significant positive correlation with the all-day mTSV, indicating that as BCR increased, the interviewees felt hotter. Regardless of the season, the BH demonstrated a significant negative correlation with the all-day mTSV, indicating that as the BH increased, the interviewees felt cooler/colder. When examined by specific time segments, the correlation between the SVF and mTSV was significant in R1 and R2 in summer, with Pearson’s correlation coefficients of 0.481 and 0.530, respectively (sig. < 0.01). However, in R3, this correlation was not significant. SVF and mTSV were positively correlated in R2 in winter, with a Pearson correlation coefficient of 0.402 (sig. < 0.01). The BCR showed a significant positive correlation with the mTSV in R3 in summer, with a Pearson correlation coefficient of 0.304 (sig. < 0.05); however, it did not exhibit any substantial correlation with the mTSV during any period in winter. For BH, there was a significant negative correlation with mTSV in R1 in summer, with a Pearson correlation coefficient of −0.339 (sig. < 0.05). In winter, BH was significantly negatively correlated with mTSV in R1 and R2, with Pearson correlation coefficients of −0.388 and −0.384, respectively (sig. < 0.01). Stepwise logistic regression analysis was then conducted to determine the weight of the influence of each factor. The sequences of influential weights on the TSV were SVF, BH, and BCR in summer. Meanwhile, in winter, the contributions of SVF and BH to TSV are almost equal.
Table 7 lists the correlations among SVF, BCR, BH, and mTSV within each block across different seasons and periods. The spatial morphology indicators demonstrated a stronger correlation with OTC during summer than during winter. However, the spatial morphology factors exhibited varying degrees of influence on OTC across different urban blocks. In BD, none of the three spatial morphological factors showed any correlation with mTSV during either summer or winter.
In HN, the SVF demonstrated a significant positive correlation with the all-day mTSV during summer, with a Pearson’s correlation coefficient of 0.569 (Sig. < 0.05). However, when analyzed by specific time segments, this correlation was only evident in R3. The BCR also showed a significant positive correlation with the all-day mTSV, with a Pearson correlation coefficient of 0.604 (Sig. < 0.05). However, when analyzed according to specific time segments, this correlation was only evident in R1. In winter, BCR was significantly positively correlated with mTSV in R1, with a Pearson correlation coefficient of 0.619 (Sig. < 0.05). However, the BH of HN did not exhibit any correlation with mTSV at any time segment during either season.
Compared with the other two areas, the correlation between SVF and mTSV in RA was more pronounced. During summer, the SVF showed a significant positive correlation with the all-day mTSV, with a Pearson correlation coefficient of 0.689 (Sig. < 0.01). This correlation was particularly significant for both R1 and R2. In winter, SVF was significantly positively correlated with mTSV only in R2 in RA. The BCR did not show any correlation with the mTSV during any period or throughout the day in either season. In BH, it was negatively correlated with all-day mTSV, with a Pearson correlation coefficient of −0.588 (Sig. < 0.01). When analyzed by specific time segments, this negative correlation was only evident in R2. In winter, BH did not exhibit any correlation with TSV in any time segment. In summary, the impact of spatial morphology indicators on OTC varied significantly across the three urban blocks.

3.2.2. Effect of Street Orientation on OTC

The relationship between street orientation and OTC were also verified. A cross-tabulation chi-square analysis was used to reveal whether there were significant TSV discrepancies between E–W- and N–S-oriented streets (Table 8). In summer, the all-day mTSV of the E–W streets in BD, HN, and RA were 0.20, 0.40, and 0.18 higher compared to the N–S streets, respectively. This situation was particularly pronounced in R1 and R3; however, in R2, there were no significant differences in the mTSV between the two street orientations.
However, in winter, the comparison of the mTSV between the two street orientations yielded results that were contrary to those observed in summer. The all-day mTSV of the E–W streets in BD, HN, and RA were 0.19, 0.20, and 0.20 lower than those of the N–S streets, respectively. This demonstrated that in winter, the N–S streets offered better outdoor comfort than the E–W streets. Unlike summer, the higher comfort levels of the N–S streets were more pronounced in R2 in winter.
Therefore, it could be concluded that although there were some exceptions, such as in R1 in BD and in R3 in RA during winter, the relationship between street orientation and mTSV generally exhibited opposite patterns in the two seasons. However, regardless of the season, the OTC of N–S-oriented streets was superior to that of E–W streets.

4. Discussion

4.1. Impact of Block Morphology on OTC

Different spatial morphologies result in vastly different microclimatic conditions within urban blocks [40]. Most existing research focusing on the relationship between spatial morphology and OTC has concentrated on the impact of changes in spatial morphology on OTC [21,34] and on identifying critical spatial morphology factors [41]. In studies evaluating and comparing different types of actual urban blocks, existing studies tend to utilize numerical simulations [17,42,43], whereas studies revealing the differences in thermal perception among different types of urban blocks using empirical measurements are less common. This study employed the thermal walking method to conduct an on-site thermal perception investigation of three representative urban blocks in Beijing during the summer and winter. The results revealed substantial variations in OTC across different types of blocks during different seasons.
Deng et al. demonstrated that the impact of spatial morphology factors on the OTC varies between old cities and new urban districts in the hot climate of southern China [23]. However, their findings differed significantly from those for the climatic and urban conditions in Beijing. Our research further substantiates that under the climatic conditions of Beijing, differences in spatial morphology across various types of urban blocks lead to significant OTC discrepancies.
During the summer, BD exhibited optimal OTC conditions, especially in the morning. At this time, the low solar altitude combined with BD’s lower SVF and higher average building height (80.4 m) obstructed sunlight, resulting in a lower TSV for the area. In the early afternoon, a higher solar altitude meant that the buildings could no longer provide adequate shade. During this period, RA exhibited higher tree coverage than BD, with solar radiation at multiple sites being obstructed by surrounding tree canopies (as demonstrated in the fisheye photographs in Appendix A). Consequently, the mTSV values in RA were slightly lower than those in BD, making RA the most optimal block for OTC in the early afternoon. In the late afternoon, as the solar altitude angle decreased and the intensity of sunlight diminished, the difference in the OTC between BD and RA became less significant. HN had the poorest OTC conditions throughout the three periods of the day, facing severe issues of exposure to sunlight, as indicated by its highest TSV and globe temperature values. The low average building height (3.8 m) and lack of vegetation of HN meant that sunlight was unobstructed, exacerbating OTC during the summer.
However, the situation was completely different during the winter. The low-rise buildings in HN allowed the area to receive ample sunlight around midday, resulting in HN becoming the area with optimal OTC during this period. In the morning and late afternoon, owing to the relatively low solar elevation angle, the scattered architectural layout of RA allowed certain areas to receive sunlight, making it the area with the best OTC during these periods. This also explains the greater variability in OTC among the different points within RA during periods R1 and R2. The overall OTC of BD was noticeably lower than that of the other two blocks, particularly in R2. This was mainly due to the lower solar altitude in winter than in summer, meaning that even at midday, tall buildings in BD effectively blocked sunlight. It should be noted that tall trees in Beijing are mostly deciduous; therefore, vegetation does not affect the winter OTC in all urban blocks.
Substantial variations in OTC across different types of blocks during different seasons and different times have been revealed. Climatic, temporal, and spatial variations of OTC distributions in different urban blocks in Beijing were systematically examined and quantified, providing comprehensive information for future thermal environment improvement in this climate type.

4.2. Applicability of Spatial Morphological Factors in Evaluating OTC Across Different Blocks

4.2.1. Applicability of SVF, BCR, and BH

SVF, BCR, and BH are key morphological indicators that affect OTC [44]. The experimental results of this study show that SVF and BCR generally exhibit a positive correlation with TSV, while BH generally shows a negative correlation with TSV, which is consistent with existing research. However, studies by Darbani et al. [42], Narimani et al. [35], and Mohite et al. [41] indicate that the impact of SVF on OTC may vary across seasons, times of the day, and urban areas. Through the investigation of urban blocks with varying spatial morphologies across different times of day and seasons in cold winter and hot summer regions, this study further confirmed the complexity of the relationship between spatial morphology factors and OTC. Under the climatic conditions of Beijing, the impact of SVF on OTC was more significant in summer than in winter, and SVF exerted a stronger influence than BCR and BH. Furthermore, the effect of SVF on OTC was most pronounced at midday. This demonstrates that even during the daytime, SVF only has a noticeable impact on OTC when solar radiation is strong. In winter, the influence of BH on OTC was more pronounced than that of SVF, indicating that direct shading from tall buildings is a key factor affecting OTC during colder months.
However, in different types of urban blocks, the impact of spatial morphological factors on OTC varies substantially. In BD, none of the three morphological factors had a noticeable effect on OTC. This was due to the unique spatial morphology of BD, with the buildings in this area predominantly being irregularly distributed high-rise towers (Figure 12a). This block geometry results in the solar radiation received at each measurement point largely depending on whether the point is in the shadow of nearby high-rise buildings, which in turn leads to considerable randomness of the OTC at each measurement point. The experimental results in Section 3.2 also support this argument, indicating that in BD, the TSV and globe temperature at different measurement points exhibit significant variability during the summer. Therefore, we suggest that a new spatial morphological indicator for urban design be established for this type of urban block in future studies to optimize its comfort conditions.
In HN, the impact of the SVF on OTC was primarily evident in R3. The buildings in HN were uniformly low rise, and the spatial morphology of each location exhibited strong homogeneity (Figure 12b). Consequently, the buildings provided almost no shade during the morning and early afternoon, allowing each measuring point to receive a substantial amount of direct solar radiation, which weakened the impact of the SVF on the OTC. In the late afternoon, as the altitude of the sun decreases, the amount of solar radiation received at each point varies according to the degree of sky exposure. Moreover, owing to the uniform height of the buildings, the BH had no notable impact on the OTC. The BCR is positively correlated with the mTSV in R1 in both seasons, implying that as urban density increases, the mTSV also increases [45]. However, this correlation was not significant in R2 and R3, confirming that solar radiation remained a critical factor affecting thermal comfort.
In the RA, SVF showed a significant positive correlation with TSV in R1 and R2, while BH was significantly negatively correlated with TSV in R2. As the height of the buildings near the measurement points increased, the degree of sky exposure decreased, thereby affecting the OTC. This was consistent with the conclusions of most previous studies [34,46,47,48]. Compared to the homogeneous geometry of HN and the randomness of BD, the spatial morphology of RA lies in between (Figure 12c). This allowed for spatial differences among the measurement points without making these differences overly random. Consequently, the spatial morphology of the measurement points in RA established a more significant correlation with the OTC. Consequently, in the practice of block thermal comfort optimization, it is necessary to verify the applicability of spatial morphology factors based on local climatic conditions and block morphology.

4.2.2. Applicability of Street Orientation

Street orientation is an important aspect of OTC optimization [35]. Many existing studies [17,21,48] indicate that N–S-oriented streets are cooler during summer than E–W-oriented streets. This is because N–S-oriented streets receive solar radiation for a shorter duration of the day [49]. However, most of these studies focused on hot climates. The experimental results of this study in summer validate the patterns summarized in previous studies. However, this pattern was reversed in winter. In BD, HN, and RA, the mTSV for N–S-oriented streets was higher by 0.19, 0.20, and 0.20, respectively, compared to E–W-oriented streets in winter. This occurs because Beijing’s low solar altitude in winter makes it difficult for E–W streets to receive sufficient solar radiation for comfort at any time of the day, whereas N–S streets receive ample solar radiation at midday. Consequently, regardless of the season, the overall OTC for N–S-oriented streets in Beijing was superior to that for E–W-oriented streets. Therefore, E–W streets are critical areas for thermal comfort optimization in urban design, particularly during summer in HN and winter in BD.
Applicability of spatial morphological factors across different blocks were conducted. The relationships between OTC and urban morphological features in different urban blocks over time have been thoroughly revealed. The applicability and effectiveness of physical parameters that could better define urban morphology in evaluating OTC variations have been critically explored. It also facilitates efficient OTC improvements.

4.3. Emphasis of OTC Optimization in Different Blocks

In previous studies on thermal comfort in regions with hot summers and cold winters, measures to improve OTC in the summer and winter seasons have often presented contradictions [39,50]. This study demonstrates that the importance of thermal comfort optimization varies between different urban blocks and across different seasons. In summer, the ranking of the OTC conditions for the three districts was BD > RA > HN, whereas in winter, the ranking changed to HN = RA > BD. Consequently, within the climatic context of Beijing, the requirement for OTC enhancement in historical neighborhoods is more pronounced during the summer months. Conversely, the business district exhibited a heightened necessity for OTC optimization in winter compared with summer. The RA area showed no significant difference in OTC between seasons; thus, the importance of optimizing OTC in both seasons was equal.
Those above findings enhanced the effectiveness of thermal comfort improvements in regions with hot summers and cold winters. The priority improvements can be found. The potential contradictions of measures to improve OTC in different seasons and times could be defused.
The applicability of morphological indicators in different blocks can provide more specific guidance for urban planning. The SVF indicator has a significant impact on OTC in the HN and RA areas, so improving thermal comfort can be achieved by reducing SVF, changing building forms, or increasing vegetation coverage, etc. However, when improving summer OTC in the BD area, the SVF cannot be used as a key morphological indicator. Due to the randomness of solar radiation in different positions in this area, it is necessary to conduct parametric analysis using numerical simulation to optimize OTC and explore specific design strategies instead of utilizing a certain indicator. Thus, OTC optimization in different blocks is emphasized.

4.4. Limitations

This study had several limitations, and improvements can be made in future research. First, all participants in the experiment were young university students whose thermal perceptions may differ from those of older demographics. Second, due to budgetary constraints, the experiment did not account for air temperature variations that occurred within the 90-min duration of each session. In addition, the surveys of the three sites were not conducted on the same day. Third, the use of Kestrel NK5400 portable meteorological stations provides relative lower accuracy in measurements of globe temperature; however, considering the limitation of the equipment and manpower, NK5400 was employed [51]. Finally, the impacts of morphological indicators on OTC were studied independently, but there may be a combined effect of those factors on OTC. The potential interactions among them are valuable and need further research using complex modelling. Therefore, although efforts were made to ensure consistent weather conditions within three days, variation was inevitable.

5. Conclusions and Future Implications

This study conducted an on-site investigation across three diverse urban blocks in Beijing—a metropolis subject to cold winters and hot summers—specifically BD, HN, and RA, to assess their OTC conditions. The aim was to compare the OTC conditions across different blocks, identify the cause of existing thermal comfort issues, and reveal the impact of spatial morphological factors on the OTC. Compared with existing studies, this study emphasizes the climatic, temporal, and spatial differences in OTC between blocks with different morphologies across different seasons and times of day under the Dwa climate with comparative lengths of hot summers and cold winters. In addition, this study also presents the applicability and effectiveness of physical parameters that could better define urban morphology in evaluating OTC. The findings also provide theoretical support for climate-adaptive urban design in cities with comparable climatic conditions. The following conclusions were drawn.
(1)
Thermal sensation votes and globe temperature measurements indicated significant discrepancies in OTC distributions across different urban blocks. During summer, the OTC conditions were ranked as BD > RA > HN. In contrast, during the winter, the OTC conditions were HN = RA > BD. Consequently, BD in Beijing need to prioritize the optimization of OTC during winter, whereas historical districts require a primary focus on enhancing OTC during summer. The OTC discrepancy was attributed to differences in the spatial morphology of each block.
(2)
SVF, BCR, and BH were identified as key morphological indicators affecting the OTC of Beijing’s urban blocks, with the impact of SVF being the most pronounced. However, the influential indicators varied across different blocks. None of the spatial morphology factors significantly affected the OTC in BD because the irregular distribution of tall buildings resulted in random OTC conditions at different locations.
(3)
Street orientation has been proven to be a crucial factor affecting OTC. In Beijing, N–S-oriented streets were cooler in the summer and warmer in the winter compared to E–W-oriented streets, resulting in better OTC conditions for N–S-oriented streets throughout the year.
(4)
The influence of spatial morphology on OTC varied greatly across seasons and times of day. The impact was more substantial in summer than in winter and more substantial during midday than in the morning or late afternoon. Consequently, more targeted OTC studies must be conducted from climatic, temporal, and spatial aspects.
(5)
SVF, BCR, BH, and orientation demonstrate great applicability in assessing OTC. However, the effectiveness varied with weather conditions, times of day, and blocked spatial morphologies. Generally, SVF is the most effective parameter. In addition, more applicable design parameters, such as BCR, BH, and orientation, could be involved as effective supplements of dimensionless parameters in evaluating OTC in complex urban contexts.
In general, the OTC distributions in different urban blocks with distinct built environments have been systematically examined. The relationships between OTC and urban morphological features in different urban blocks over time have been thoroughly revealed. The applicability and effectiveness of physical parameters that could better define urban morphology in evaluating OTC variations have been critically explored. Efficient proposals to optimize OTC in cities with hot summers and cold winters from climatic, temporal, and spatial aspects are necessary. This comprehensive and precise perspective can better facilitate urban planners to improve urban thermal environment under similar climates. This problem solving process can be extrapolated to practitioners in built environment optimization. The findings also provide insights for climate-adaptive urban design. Actionable recommendations regarding the optimal values of morphological factors need to be studied in the future using systematic parametric studies with modelling.

Author Contributions

T.Z.: Conceptualization; Methodology; Data curation; Investigation; Analyzation; Visualization; Writing—original draft. T.M.: Conceptualization; Data curation; Investigation; Formal analysis; Funding acquisition; Project administration; Validation; Writing—original draft; Writing—review & editing. All authors have read and agreed to the published version of the manuscript.

Funding

This work was supported by NSFC (National Natural Science Foundation of China) project: The mechanism and optimization of thermal comfort for urban public space in cold region based on human thermal sensation difference (Grant No. 52208002).

Institutional Review Board Statement

Not applicable.

Informed Consent Statement

No ethical approval was required in this study. Verbal informed consent has been obtained from all participants in this study.

Data Availability Statement

The original contributions presented in this study are included in the article. Further inquiries can be directed to the corresponding author.

Conflicts of Interest

The authors declare that they have no known competing financial interests or personal relationships that could have appeared to influence the work reported in this paper.

Nomenclature

BCRBuilding Coverage Ratio (%)mTgMean Tg (°C)
BDBuilding DistrictVaWind Speed (m/s)
BHBuilding Height (m)RAResidential Area
DwaHot Humid Continental ClimateRHRelative Humidity
E–WEast–WestSVFSky View Factor
HNHistorical NeighborhoodTCVThermal Comfort Vote
mTCVMean TCVTSVThermal Sensation Vote
mTSVMean TSVTaAir Temperature (°C)
N–SNorth–SouthTgBlack Globe Temperature (°C)
OTCOutdoor Thermal Comfort

Appendix A. The Fisheye Photos of Each Measuring Point During Summer
Atmosphere 16 00855 i001

Appendix B. The Fisheye Photos of Each Measuring Point During Winter

Atmosphere 16 00855 i002

Appendix C. The BCR and BH Value of Each Measuring Point and Each Block

Business District (BD)Historical Neighborhood (HN)Residential Area (RA)
Point No.BCRBH (m)Point No.BCRBH (m)Point No.BCRBH (m)
123.7%95.9168.6%3.6122.5%24.9
223.5%36.9263.4%3.5229.9%22.6
348.2%57.8363.7%3.7321.1%16.1
424.7%68.0469.5%4421.3%15.1
516.7%107.2566.8%3.5515.9%8.5
630.2%39.6662.2%3.6627.3%13.4
714.2%122.4768.0%3.6714.5%17.9
852.2%42.0867.8%4.2829.1%12.0
929.4%137.9964.7%3.9931.5%18.0
1019.2%232.91067.8%3.91026.8%18.0
1112.6%212.21158.4%3.41125.3%18.0
122.3%3.01267.0%3.61233.5%17.8
1321.9%29.81367.0%4.21315.2%21.0
1426.7%17.31467.2%3.71415.4%18.0
1515.7%20.21565.5%3.91522.2%14.4
1619.4%62.91666.9%3.81626.5%17.1
Mean23.8%80.4Mean65.9%3.8Mean23.6%17.0

References

  1. Fong, C.S.; Aghamohammadi, N.; Ramakreshnan, L.; Sulaiman, N.M.; Mohammadi, P. Holistic recommendations for future outdoor thermal comfort assessment in tropical Southeast Asia: A critical appraisal. Sustain. Cities Soc. 2019, 46, 101428. [Google Scholar] [CrossRef]
  2. Hedquist, B.; Brazel, A.J. Seasonal variability of temperatures and outdoor human comfort in Phoenix, Arizona, USA. Build. Environ. 2014, 72, 377–388. [Google Scholar] [CrossRef]
  3. Wang, Y.P.; Berardi, U.; Akbari, H. Comparing the effects of urban heat island mitigation strategies for Toronto, Canada. Energy Build. 2016, 114, 2–19. [Google Scholar] [CrossRef]
  4. Smith, P.; Henríquez, C. Perception of thermal comfort in outdoor public spaces in the medium-sized city of Chillán, Chile, during a warm summer. Urban Clim. 2019, 30, 100525. [Google Scholar] [CrossRef]
  5. Vieira, J.T.S.; Silveira, Q.S.H. Predicting urban thermal comfort from calibrated UTCI assessment scale—A case study in Belo Horizonte city, southeastern Brazil. Urban Clim. 2021, 36, 100652. [Google Scholar] [CrossRef]
  6. Mazzeo, D.; Kontoleon, J.K. The role of inclination and orientation of different building roof typologies on indoor and outdoor environment thermal comfort in Italy and Greece. Sustain. Cities Soc. 2020, 60, 102111. [Google Scholar] [CrossRef]
  7. Diz-Mellado, E.; Nikolopoulou, M.; López-Cabeza, V.P.; Rivera-Gómez, C.; Galán-Marín, C. Cross-evaluation of thermal comfort in semi-outdoor spaces according to geometry in Southern Spain. Urban Clim. 2023, 49, 101491. [Google Scholar] [CrossRef]
  8. Baruti, M.M.; Johansson, E.; Yahia, W.M. Urbanites’ outdoor thermal comfort in the informal urban fabric of warm-humid Dar es Salaam, Tanzania. Sustain. Cities Soc. 2020, 62, 102380. [Google Scholar] [CrossRef]
  9. Hassan, S.A.A.; Ahmed, M.R.M. Urban morphology as an adaptation strategy to improve outdoor thermal comfort in urban residential community of new Assiut city, Egypt. Sustain. Cities Soc. 2022, 78, 103648. [Google Scholar] [CrossRef]
  10. Li, J.; Liu, N. The perception, optimization strategies and prospects of outdoor thermal comfort in China: A review. Build. Environ. 2020, 170, 106614. [Google Scholar] [CrossRef]
  11. Kim, Y.; Yu, S.; Li, D.; Gatson, S.N.; Brown, R.D. Linking landscape spatial heterogeneity to urban heat island and outdoor human thermal comfort in Tokyo: Application of the outdoor thermal comfort index. Sustain. Cities Soc. 2022, 87, 104262. [Google Scholar] [CrossRef]
  12. Shooshtarian, S.; Lam, C.K.C.; Kenawy, I. Outdoor thermal comfort assessment: A review on thermal comfort research in Australia. Build. Environ. 2020, 177, 106917. [Google Scholar] [CrossRef]
  13. Tan, Z.; Lau, K.K.-L.; Ng, E. Urban tree design approaches for mitigating daytime urban heat island effects in a high-density urban environment. Energy Build. 2016, 114, 265–274. [Google Scholar] [CrossRef]
  14. Middel, A.; Häb, K.; Brazel, A.J.; Martin, C.A.; Guhathakurta, S. Impact of urban form and design on mid-afternoon microclimate in Phoenix Local Climate Zones. Landsc. Urban Plan. 2014, 122, 16–28. [Google Scholar] [CrossRef]
  15. Peng, C.; Ming, T.; Tao, Y.; Peng, Z. Numerical analysis on the thermal environment of an old city district during urban renewal. Energy Build. 2015, 89, 18–31. [Google Scholar] [CrossRef]
  16. Salata, F.; Golasi, I.; Petitti, D.; de Lieto Vollaro, E.; Coppi, M.; de Lieto Vollaro, A. Relating microclimate, human thermal comfort and health during heat waves: An analysis of heat island mitigation strategies through a case study in an urban outdoor environment. Sustain. Cities Soc. 2017, 30, 79–96. [Google Scholar] [CrossRef]
  17. Galal, O.M.; Sailor, D.J.; Mahmoud, H. The impact of urban form on outdoor thermal comfort in hot arid environments during daylight hours, case study: New Aswan. Build. Environ. 2020, 184, 107222. [Google Scholar] [CrossRef]
  18. Callejas, I.J.A.; Krüger, E. Microclimate and thermal perception in courtyards located in a tropical savannah climate. Int. J. Biometeorol. 2022, 66, 1877–1890. [Google Scholar] [CrossRef]
  19. Nikolopoulou, M.; Steemers, K. Thermal comfort and psychological adaptation as a guide for designing urban spaces. Energy Build. 2003, 35, 95–101. [Google Scholar] [CrossRef]
  20. Kumar, P.; Sharma, A. Assessing the outdoor thermal comfort conditions of exercising people in the semi-arid region of India. Sustain. Cities Soc. 2022, 76, 103366. [Google Scholar] [CrossRef]
  21. Dzyuban, Y.; Ching, G.N.Y.; Yik, S.K. Outdoor thermal comfort research in transient conditions: A narrative literature review. Landsc. Urban Plan. 2022, 226, 104496. [Google Scholar] [CrossRef]
  22. Peng, Z.; Bardhan, R.; Ellard, C.; Steemers, K. Urban climate walk: A stop-and-go assessment of the dynamic thermal sensation and perception in two waterfront districts in Rome, Italy. Build. Environ. 2022, 221, 109267. [Google Scholar] [CrossRef]
  23. Deng, X.; Nie, W.; Li, X.; Wu, J.; Yin, Z.; Han, J.; Pan, H.; Lam, C.K.C. Influence of built environment on outdoor thermal comfort: A comparative study of new and old urban blocks in Guangzhou. Build. Environ. 2023, 234, 110133. [Google Scholar] [CrossRef]
  24. Tian, Y.; Hong, B.; Zhang, Z.; Wu, S.; Yuan, T. Factors influencing resident and tourist outdoor thermal comfort: A comparative study in China’s cold region. Sci. Total Environ. 2022, 808, 152079. [Google Scholar] [CrossRef]
  25. Zhu, R.; Zhang, X.; Yang, L.; Liu, Y.; Cong, Y.; Gao, W. Correlation analysis of thermal comfort and physiological responses under different microclimates of urban park. Case Stud. Therm. Eng. 2022, 34, 102044. [Google Scholar] [CrossRef]
  26. Vasilikou, C.; Nikolopoulou, M. Outdoor thermal comfort for pedestrians in movement: Thermal walks in complex urban morphology. Int. J. Biometeorol. 2020, 64, 277–291. [Google Scholar] [CrossRef]
  27. Yang, Z.; Peng, J.; Jiang, S.; Yu, X.; Hu, T. Optimizing building spatial morphology to alleviate human thermal stress. Sustain. Cities Soc. 2024, 106, 105386. [Google Scholar] [CrossRef]
  28. Ariane, M.; Jonas, L.; Ross, M.; Matthias, D.; Matthias, R. Sky View Factor footprints for urban climate modeling. Urban Clim. 2018, 25, 120–134. [Google Scholar] [CrossRef]
  29. Chen, L.; Ng, E.; An, X.; Ren, C.; Lee, M.; Wang, U.; He, Z. Sky view factor analysis of street canyons and its implications for daytime intra-urban air temperature differ-entials in high-rise, high-density urban areas of Hong Kong: A GIS-based simulation approach. Int. J. Climatol. 2012, 32, 121–136. [Google Scholar] [CrossRef]
  30. Acero, J.A.; Koh, E.J.Y.; Ruefenacht, L.A.; Norford, L.K. Modelling the influence of high-rise urban geometry on outdoor thermal comfort in Singapore. Urban Clim. 2021, 36, 100775. [Google Scholar] [CrossRef]
  31. Ali-Toudert, F.; Mayer, H. Numerical study on the effects of aspect ratio and orientation of an urban street canyon on outdoor thermal comfort in hot and dry climate. Build. Environ. 2006, 41, 94–108. [Google Scholar] [CrossRef]
  32. Johansson, E. Influence of urban geometry on outdoor thermal comfort in a hot dry climate: A study in Fez, Morocco. Build. Environ. 2006, 41, 1326–1338. [Google Scholar] [CrossRef]
  33. Bhaskar, D.; Mukherjee, M. Optimizing street canyon orientation for Rajarhat Newtown, Kolkata, India. Environ. Clim. Technol. 2017, 21, 5–17. [Google Scholar] [CrossRef]
  34. Zhang, J.; Cui, P.; Song, H. Impact of urban morphology on outdoor air temperature and microclimate optimization strategy base on Pareto optimality in Northeast China. Build. Environ. 2020, 180, 107035. [Google Scholar] [CrossRef]
  35. Narimani, N.; Karimi, A.; Brown, R.D. Effects of street orientation and tree species thermal comfort within urban canyons in a hot, dry climate. Ecol. Inform. 2022, 69, 101671. [Google Scholar] [CrossRef]
  36. Honjo, T.; Lin, T.-P.; Seo, Y. Sky view factor measurement by using a spherical camera. J. Agric. Meteorol. 2019, 75, 59–66. [Google Scholar] [CrossRef]
  37. Kántor, N.; Unger, J. The most problematic variable in the course of human-biometeorological comfort assessment—The mean radiant temperature. Cent. Eur. J. Geosci. 2011, 3, 90–100. [Google Scholar] [CrossRef]
  38. Zhao, H.; Xu, G.; Shi, Y.; Zhai, Y.; Zhao, L.; Brown, R.D. Evaluation of pedestrian thermal comfort from a whole-trip perspective: An outdoor empirical study. Sustain. Cities Soc. 2024, 115, 105872. [Google Scholar] [CrossRef]
  39. Ma, T.; Zhang, J. Integrating thermal perception and public space use—An experimental outdoor comfort study in cold winter-hot summer zone: Beijing, China. Urban Clim. 2024, 58, 102138. [Google Scholar] [CrossRef]
  40. Lai, D.; Liu, W.; Gan, T.; Liu, K.; Chen, Q. A review of mitigating strategies to improve the thermal environment and thermal comfort in urban outdoor spaces. Sci. Total Environ. 2019, 661, 337–353. [Google Scholar] [CrossRef]
  41. Mohite, S.; Surawar, M. Impact of urban street geometry on outdoor pedestrian thermal comfort during heatwave in Nagpur city. Sustain. Cities Soc. 2024, 108, 105450. [Google Scholar] [CrossRef]
  42. Darbani, E.S.; Rafieian, M.; Parapari, D.M.; Guldmann, J.-M. Urban design strategies for summer and winter outdoor thermal comfort in arid regions: The case of historical, contemporary, and modern urban areas in Mashhad, Iran. Sustain. Cities Soc. 2023, 89, 104339. [Google Scholar] [CrossRef]
  43. Guo, L.; Guo, X.; Li, B.; Wang, E. The impact of block morphology on urban microclimates: A case study of three cities in cold regions of China. Urban Clim. 2024, 57, 102098. [Google Scholar] [CrossRef]
  44. Jamei, E.; Rajagopalan, P.; Seyedmahmoudian, M.; Jamei, Y. Review on the impact of urban geometry and pedestrian level greening on outdoor thermal comfort. Renew. Sustain. Energy Rev. 2016, 54, 1002–1017. [Google Scholar] [CrossRef]
  45. Cui, P.; Lu, J.; Wu, Y.; Tang, J.; Jiang, J. Effect of urban morphology on microclimate and building cluster energy consumption in cold regions of China. Sustain. Cities Soc. 2024, 115, 105838. [Google Scholar] [CrossRef]
  46. Bourbia, F.; Awbi, H.B. Building cluster and shading in urban canyon for hot dry climate: Part 2: Shading simulations. Renew. Energy 2004, 29, 291–301. [Google Scholar] [CrossRef]
  47. Labdaoui, K.; Mazouz, S.; Acidi, A.; Cools, M.; Moeinaddini, M.; Teller, J. Utilizing thermal comfort and walking facilities to propose a comfort walkability index (CWI) at the neighbourhood level. Build. Environ. 2021, 193, 107627. [Google Scholar] [CrossRef]
  48. Abdollahzadeh, N.; Biloria, N. Outdoor thermal comfort: Analyzing the impact of urban configurations on the thermal performance of street canyons in the humid subtropical climate of Sydney. Front. Archit. Res. 2021, 10, 394–409. [Google Scholar] [CrossRef]
  49. Kim, S.W.; Brown, R.D. Pedestrians’ behavior based on outdoor thermal comfort and micro-scale thermal environments, Austin, TX. Sci. Total Environ. 2022, 808, 152143. [Google Scholar] [CrossRef]
  50. Canan, F.; Golasi, I.; Falasca, S.; Salata, F. Outdoor thermal perception and comfort conditions in the Köppen-Geiger climate category BSk. One-year field survey and measurement campaign in Konya, Turkey. Sci. Total Environ. 2020, 738, 140295. [Google Scholar] [CrossRef]
  51. Cooper, E.; Grundstein, A.; Rosen, A.; Miles, J.; Ko, J.; Curry, P. An Evaluation of Portable Wet Bulb Globe Temperature Monitor Accuracy. J. Athl. Train. 2017, 52, 1161–1167. [Google Scholar] [CrossRef]
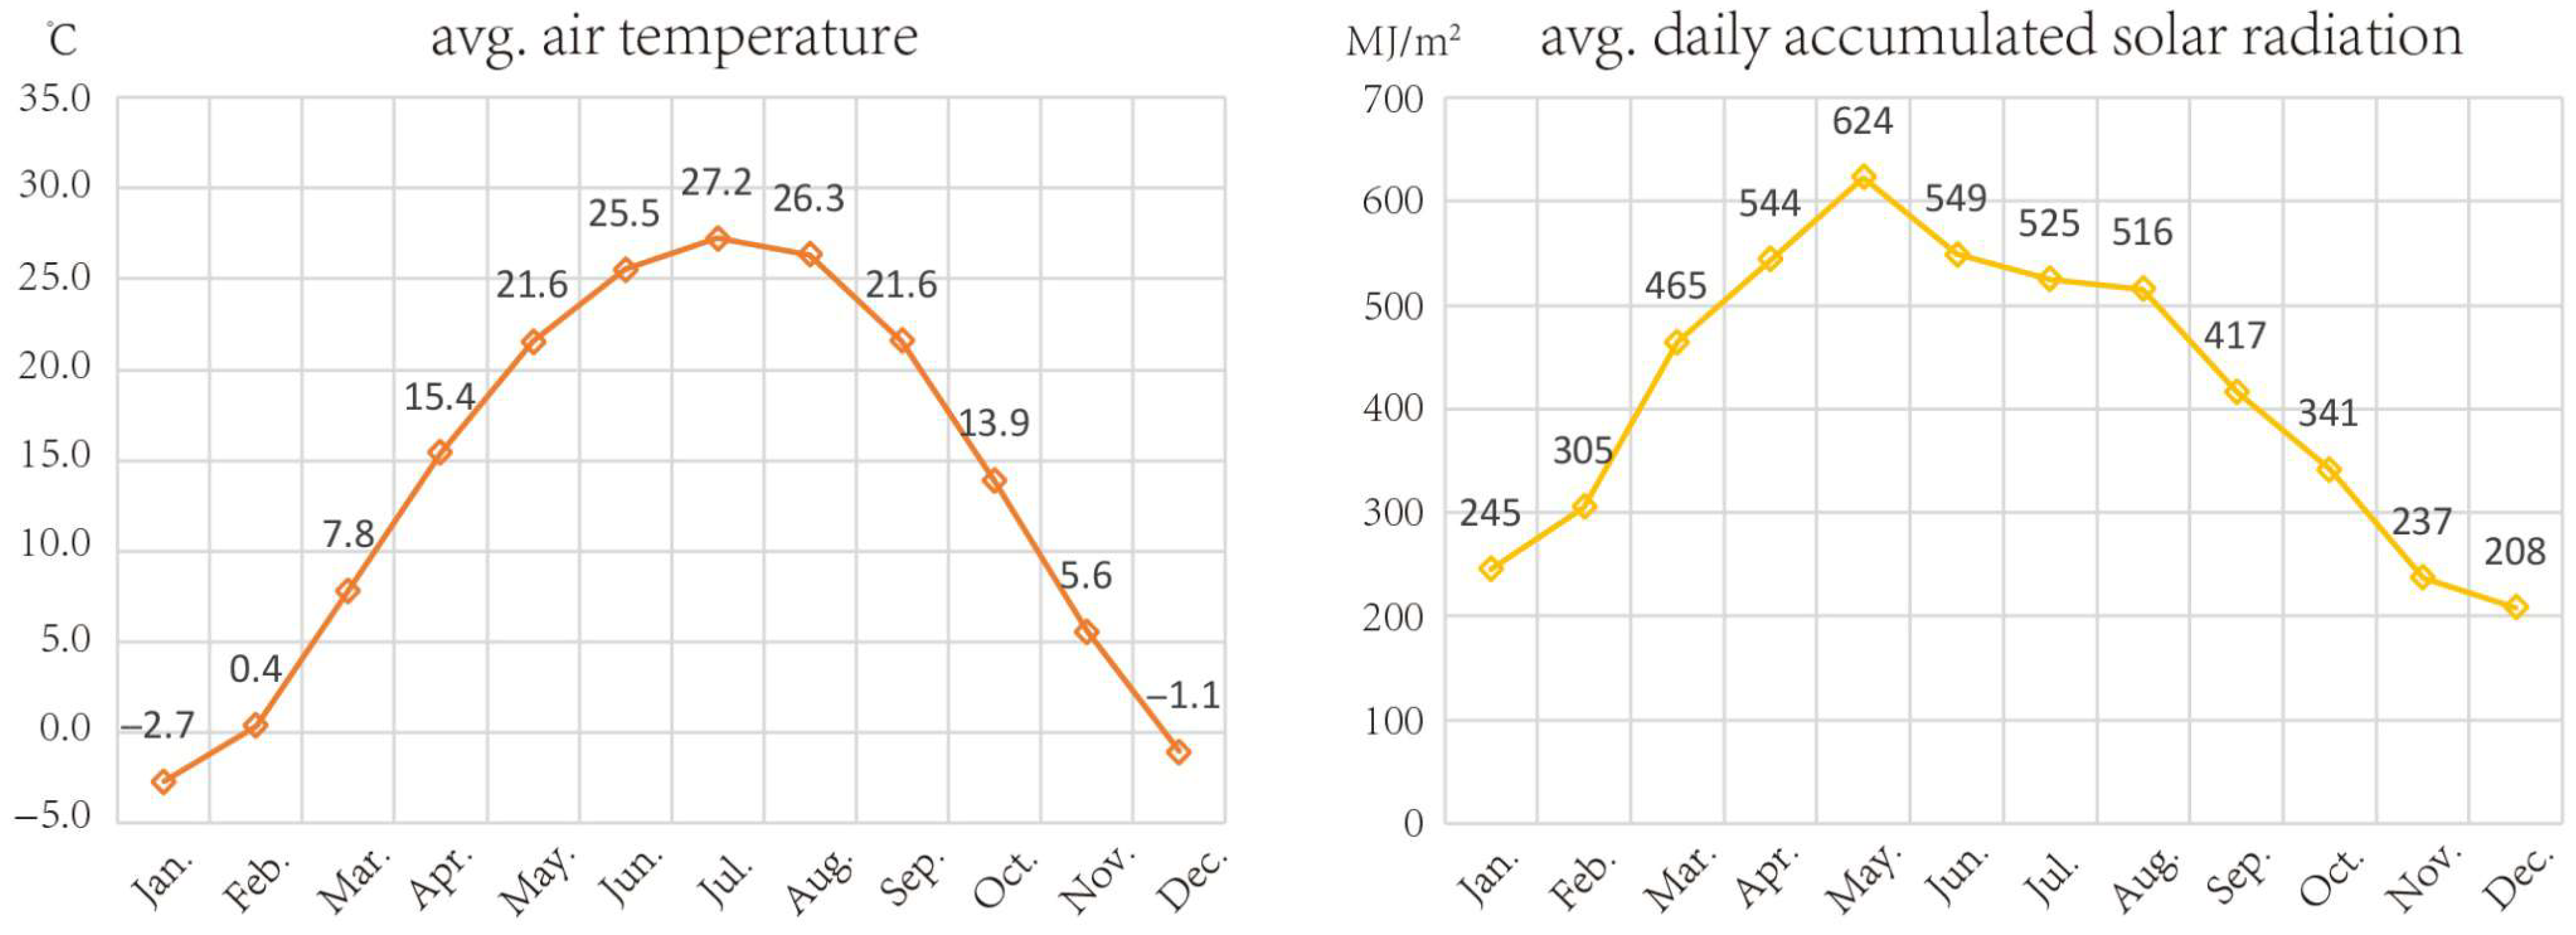
Figure 1. The monthly change pattern of air temperature and solar radiation in Beijing (2002–2022).
Atmosphere 16 00855 g001
Figure 2. The locations, site plans, and street views of the three study sites.
Atmosphere 16 00855 g002
Figure 3. Hourly air temperature change during summer and winter survey.
Atmosphere 16 00855 g003
Figure 4. The route and measuring points of three urban areas.
Atmosphere 16 00855 g004
Figure 5. (a) Kestrel NK 5400 portable weather station; (b) Instruments used during the field investigation; (c) Insta 360 spherical camera.
Atmosphere 16 00855 g005
Figure 6. Regression results showing the relationship between TSV and Tg for (a) summer and (b) winter.
Atmosphere 16 00855 g006
Figure 7. The proportional distribution of TSV and TCV options across two seasons in three blocks.
Atmosphere 16 00855 g007
Figure 8. The mTSV and mTCV of three blocks at different time of a day during summer.
Atmosphere 16 00855 g008
Figure 9. The mTSV and mTCV of three blocks at different time of a day during winter.
Atmosphere 16 00855 g009
Figure 10. The range and fluctuation of mTSV, mTCV, and Tg of 16 measuring points in summer.
Atmosphere 16 00855 g010
Figure 11. The range and fluctuation of mTSV, mTCV, and Tg of 16 measuring points in winter.
Atmosphere 16 00855 g011
Figure 12. The simplified block geometry of (a) BD, (b) HN and (c) RA.
Atmosphere 16 00855 g012
Table 1. The dates, locations, and weather conditions on survey days.
SeasonDateLocation
Summer16 July 2023BD
18 July 2023TN
19 July 2023RA
Winter14 January 2024BD
15 January 2024RA
24 January 2024TN
Table 2. The specifications of the environmental monitoring equipment.
Measured ParameterLoggerMeasurement RangeAccuracyMeasured Interval
Air temperature (°C)Kestrel NK5400 Heat Stress Tracker−29–70 °C±0.5 °C5 s
Relative humidity (%)0–100%±2%5 s
Wind speed (m/s)0.6–40 m/s±3%5 s
Globe temperature (°C)−29–60 °C±1.4 °C5 s
Table 3. The mTSV and mTCV across two seasons in three blocks.
SeasonSummerWinter
BDHNRABDHNRA
mTSV1.211.721.31−1.57−1.11−1.05
mTCV1.862.211.942.151.901.89
Table 4. The mTSV, mTCV, and Tg of each round in three blocks during summer.
LocationRoundmTSVmTCVmTg (°C)
BDR10.781.5939.1
R21.772.2144.2
R31.091.7740.2
HNR11.332.0441.7
R22.312.4847.0
R31.512.1043.5
RAR11.201.9039.4
R21.682.1743.5
R31.051.7639.4
Table 5. The mTSV, mTCV, and Tg of each round in three blocks during winter.
LocationRoundmTSVmTCVmTg (°C)
BDR1−1.882.330.1
R2−1.322.005.7
R3−1.512.111.8
HNR1−1.532.23−1.3
R2−0.431.4211.3
R3−1.362.042.5
RAR1−1.302.081.9
R2−0.571.5310.5
R3−1.272.063.1
Table 6. Pearson correlation coefficient of TSV and three morphological indicators, * = sig. < 0.05, ** = sig. < 0.01.
SeasonTimeSVFBCRBH
SummerR10.481 **0.182−0.339 *
R20.530 **0.212−0.259
R30.2490.304 *−0.260
All day0.554 **0.301 *−0.369 *
WinterR10.2790.085−0.388 **
R20.402 **0.277−0.384 **
R30.1810.011−0.120
All day0.434 **0.212−0.454 **
Table 7. Pearson correlation coefficient of TSV and three morphological indicators across different blocks and time periods, * = sig. < 0.05, ** = sig. < 0.01.
Summer Winter
BlockTimeSVFBCRBHBlockTimeSVFBCRBH
BDR10.203−0.158−0.249BDR10.312−0.034−0.131
R20.456−0.298−0.258R20.148−0.432−0.069
R3−0.0390.247−0.285R30.1710.0110.221
All day0.291−0.109−0.333All day0.377−0.362−0.041
HNR10.2670.554 *0.417HNR1−0.1480.619 *0.358
R20.1810.335−0.325R20.155−0.194−0.096
R30.651 **0.243−0.099R3−0.1410.171−0.037
All day0.569 *0.601 *0.004All day0.0130.1210.028
RAR10.662 **−0.210−0.381RAR1−0.2530.3790.329
R20.773 **−0.338−0.534 *R20.495 *−0.218−0.423
R30.143−0.290−0.505 *R3−0.02−0.2180.009
All day0.689 **−0.361−0.652 **All day0.0900.019−0.016
Table 8. mTSV of E–W- and N-S-oriented street in three blocks, * refers to sig. < 0.05, underline refers to the result is opposite to most other results.
BlockSummer Winter
Round of SurveymTSV of
E–W Street
mTSV of
N–S Street
Round of SurveymTSV of
E–W Street
mTSV of
N–S Street
BDR1 *0.930.62R1 *1.691.94
R21.641.68R2 *−1.80−1.00
R3 *1.330.98R3−1.51−1.49
All-day *1.301.10All-day *−1.67−1.48
HNR1 *1.471.10R1−1.56−1.49
R22.322.29R2 *−0.59−0.16
R3 *1.811.02R3−1.40−1.30
All-day *1.871.47All-day *−1.18−0.98
RAR1 *1.261.12R1 *−1.44−1.12
R21.631.66R2 *−0.71−0.24
R3 *1.360.91R3 *1.111.31
All-day *1.421.24All-day *−1.09−0.89
Disclaimer/Publisher’s Note: The statements, opinions and data contained in all publications are solely those of the individual author(s) and contributor(s) and not of MDPI and/or the editor(s). MDPI and/or the editor(s) disclaim responsibility for any injury to people or property resulting from any ideas, methods, instructions or products referred to in the content.