Article

Analysis of CO2 Concentration and Fluxes of Lisbon Portugal Using Regional CO2 Assimilation Method Based on WRF-Chem

1
Shanghai Carbon Data Research Team, Advanced Energy Systems and Equipment Development Center, Shanghai Advanced Research Institute, Chinese Academy of Sciences, Shanghai 201210, China
2
Guangdong-Hong Kong-Macao Greater Bay Area Weather Research Center for Monitoring Warning and Forecasting, Shenzhen Institute of Meteorological Innovation, Shenzhen 523335, China
3
Jiangsu Key Laboratory of Atmospheric Environment Monitoring & Pollution Control, Jiangsu Collaborative Innovation Center of Atmospheric Environment and Equipment Technology, School of Environmental Science and Engineering, Nanjing University of Information Science & Technology, Nanjing 210044, China
4
Innovation Academy for Microsatellites of Chinese Academy of Sciences, Shanghai 201304, China
5
Shanghai Environment Monitoring Center, Application Technology Department, Shanghai 200235, China
*
Authors to whom correspondence should be addressed.
Atmosphere 2025, 16(7), 847; https://doi.org/10.3390/atmos16070847
Submission received: 3 June 2025 / Revised: 5 July 2025 / Accepted: 9 July 2025 / Published: 11 July 2025

Abstract

Cities house more than half of the world’s population and are responsible for more than 70% of the world anthropogenic CO2 emissions. Therefore, quantifications of emissions from major cities, which are only less than a hundred intense emitting spots across the globe, should allow us to monitor changes in global fossil fuel CO2 emissions in an independent, objective way. The study adopted a high-spatiotemporal-resolution regional assimilation method using satellite observation data and atmospheric transport model WRF-Chem/DART to assimilate CO2 concentration and fluxes in Lisbon, a major city in Portugal. It is based on Zhang’s assimilation method, combined OCO-2 XCO2 retrieval data, ODIAC 1 km anthropogenic CO2 emissions and Ensemble Adjustment Kalman Filter Assimilation. By employing three two-way nested domains in WRF-Chem, we refined the spatial resolution of the CO2 concentrations and fluxes over Lisbon to 3 km. The spatiotemporal distribution characteristics and main driving factors of CO2 concentrations and fluxes in Lisbon and its surrounding cities and countries were analyzed in March 2020, during the period affected by COVID-19 pandemic. The results showed that the monthly average CO2 and XCO2 concentrations in Lisbon were 420.66 ppm and 413.88 ppm, respectively, and the total flux was 0.50 Tg CO2. From a wider perspective, the findings provide a scientific foundation for urban carbon emission management and policy-making.

1. Introduction

With the intensification of global climate change, as the main area for human activities, cities are the main carriers of energy consumption and greenhouse gas emissions. They have become a key issue in climate governance in terms of their CO2 concentration and CO2 emission characteristics. The global average concentration of atmospheric CO2 reached 413.2 ± 0.2 ppm in 2020 [1]. The rapid increase in atmospheric CO2 concentration caused by human activities is currently the main cause of global climate change [2]. According to the International Energy Agency [3], cities as the centers of human socio-economic activities gather 50% of the world’s population and contribute about 70% of the world’s fossil energy-related CO2 emissions. Europe as a highly urbanized region has large city clusters such as Paris, Berlin, and Milan with CO2 concentrations consistently exceeding 400 ppm, far beyond preindustrial levels of 280 ppm. This phenomenon is closely related to dense transportation networks, building energy consumption, and industrial activities. Peter’s [4] research showed that for the year 2000, GHG emissions in Europe were about 23% of the global total, 50.8% of which were used for energy conversion, followed by transportation (14.9%), residential (12.1%), industry (11.2%), agricultural (7.8%), and water (3.2%). At the same time, CO2 is the main Greenhouse Gas (GHG) leading to global warming [5].
As a highly urbanized region, Europe exhibits high heterogeneity in its CO2 concentration emission sources (transportation, construction, industry, etc.). Research on urban CO2 concentration and emissions started earlier, forming a multi-scale and interdisciplinary research system. In terms of monitoring technology, Europe relies on large-scale scientific research infrastructure such as the Integrated Carbon Observing System (ICOS) [6] and the Total Carbon Column Observing Network (TCCON) [7] to establish the stereoscopic monitoring network covering urban stations, transportation, and industrial areas. By combining satellite remote sensing data from Orbiting Carbon Observatory-2 (OCO-2) and OCO-3 with ground-based sensor measurements, real-time dynamic tracking of CO2 concentrations has been achieved.
Traditional emission inventories, such as Emissions Database for Global Atmospheric Research (EDGAR) [8], are often based on macro statistics and static assumptions, making it difficult to capture the complex spatiotemporal dynamics within cities, and it is often delayed by several years. In recent years, the atmospheric assimilation inversion algorithms have provided a new path for refined inversion of urban CO2 emissions by integrating multi-source observation data (ground monitoring stations, satellite remote sensing, mobile sensors) with atmospheric transport models such as Global Chemistry Transport Model 5 (TM5) [9], Weather Research and Forecasting model coupled with Vegetation Photosynthesis and Respiration (WRF-VPRM) [10,11], Global Modeling and Assimilation Office model coupled with Chemistry (GEOS-Chem), and Weather Research and Forecasting model coupled with Chemistry (WRF-Chem) [12,13]. This has been used successfully to estimate regional fluxes at finer scales [14,15,16,17,18] and compared to existing agricultural inventories [19]. Lin Wu et al. [20] assessed the performance of atmospheric CO2 inversion for the monitoring of total and sectoral fossil fuel emissions in the Paris metropolitan area by the Bayesian inversion method, based on observing system simulation experiments (OSSEs). Lauvaux et al. [21] used a state-of-the-art mesoscale model to characterize daily CO2 emissions from Davos, Switzerland. Lowry et al. [22] used a mass-balance approach to quantify London, England, CH4 emissions and their trend over several years. Using amultiple box model, Strong et al. [23] estimated the emissions from Salt Lake City, Utah and the contributions from biogenic and anthropogenic sources. However, urban assimilation inversion still faces such challenges of the heterogeneity of the surface properties [24] and the simulation of fine-scale structures such as plumes from point sources [25]. The accuracy of the atmospheric transport models can lead to large uncertainties unless the full complexity of the local dynamics is correctly simulated [26].
COVID-19 (Coronavirus 2019) in 2020 led to the stagnation of global economic activities, and the global CO2 emissions fell sharply in the short term, but the atmospheric CO2 concentration continued to rise, becoming a “natural experiment” to study the relationship between anthropogenic emissions and atmospheric CO2 concentration. In 2020, global CO2 emissions decreased by about 7% year-on-year, but atmospheric CO2 concentrations continued to increase at a rate of 2.5 ppm per year [27]. And this phenomenon was also observed from space by the OCO-2 satellite [28]. This contradictory phenomenon highlights the long-term and complex nature of climate action, triggering in-depth discussions in the scientific community on the effectiveness of emission reduction and carbon cycle response mechanisms.
As a major country in southwestern Europe, Portugal’s spatiotemporal distribution characteristics and driving factors of urban CO2 concentration have not been fully studied. As the capital of Portugal and one of the largest cities on the Iberian Peninsula, Lisbon’s urbanization process and energy consumption patterns have a significant impact on regional air quality and climate change.
This study aims to use Mizzi’s and Zhang’s assimilation system [29,30,31,32] combined with OCO-2 retrieval data and three two-way nested domains in WRF-Chem to analyze the CO2 concentrations and fluxes of Lisbon, Portugal in March 2020. The paper is organized as follows. Section 2 describes research materials and methods. Results and discussion are given in Section 3, followed by conclusion in Section 4.

2. Materials and Methods

2.1. ODIAC Emission Dataset

We use the Open-Source Data Inventory for Anthropogenic CO2 (ODIAC) as prior fluxes in our experiment. The ODIAC dataset was created using a hybrid approach that disaggregates national emissions estimates produced by Carbon Dioxide Information Analysis Center (CDIAC), but it distributes them using nightlight data and the location of Local Point Sources (LPSs) inventoried in Carbon Monitoring and Action (CARMA). ODIAC is published at the same resolution as the nightlight data, approximately 1 km, or 0.008333 [33].
Using the version ODIAC 2023 which is the latest version with anthropogenic CO2 emissions in prior fluxes, the spatial distribution of monthly anthropogenic CO2 emissions in March 2020 in the assimilation experiment area is shown in Figure 1.

2.2. OCO-2 XCO2 Retrieval Dataset

We used the Orbiting Carbon Observatory-2 (OCO-2) V11.1r as satellite observation data for our experiment, which is NASA’s first dedicated CO2 monitoring satellite, launched on 2 July 2014. OCO-2 satellite routinely makes around 1 million observations each day, and more than 10% of these observations are sufficiently cloud-free to retrieve XCO2 precisely [34,35,36]. The XCO2 retrieved from OCO-2 V11.1r are consistently lower than Total Carbon Column Observing Network (TCCON) (about 1 ppm).
According to the “xco2_quality_flag”, which indicates the quality of OCO-2 XCO2 retrievals, a value of 0 represents good retrieval, while a value of 1 indicates poor retrieval quality and is not recommended for use. XCO2 retrievals from the nadir observation mode with good quality were selected from the OCO-2 Level 2 (L2) Lite data product V11.1r. These selected retrievals were first screened by a filter to reject the outlies that drift away from the mean value of the background more than three times of the standard deviation of the background. The preprocessing approach it employs is outlined as follows [31]:
O C O 2 X C O 2 ˜ = i = 1 n O C O 2 X C O 2 i σ O C O 2 i 2 / i = 1 n σ O C O 2 i 2
σ O C O 2 ˜ = 1 / N 1 i = 1 n σ O C O 2 i 2
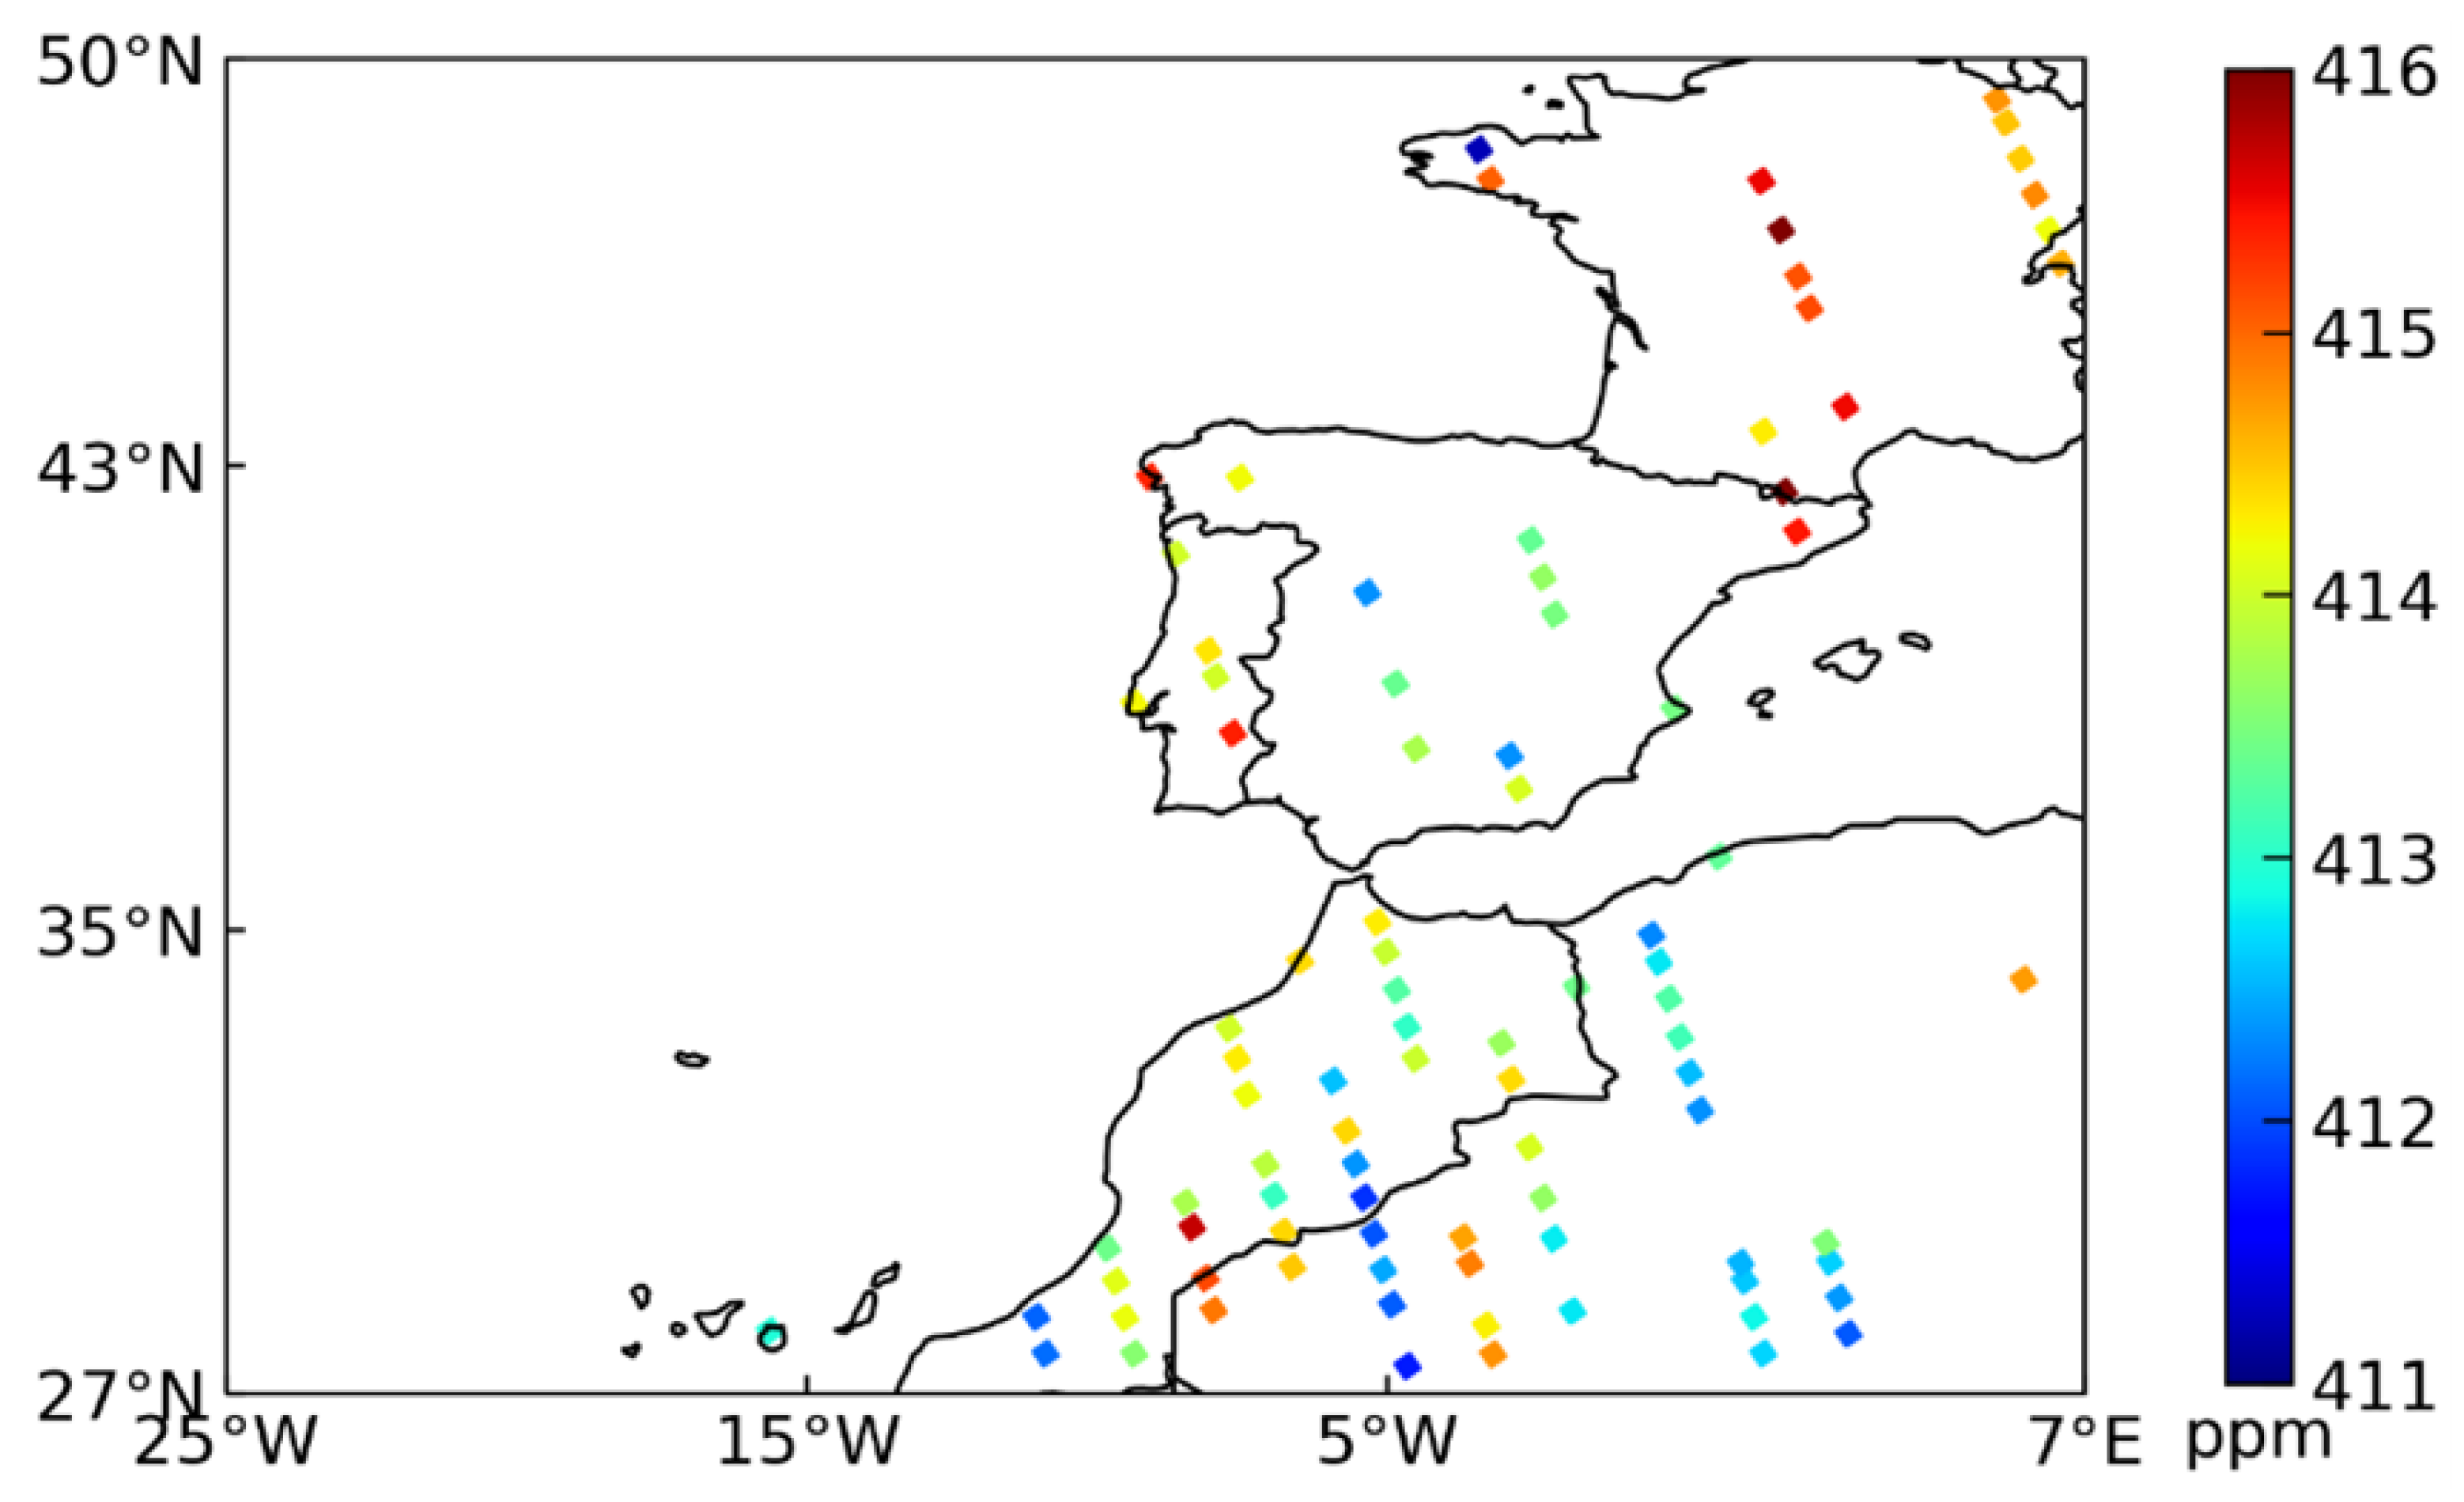
where O C O 2 X C O 2 ˜ and σ O C O 2 ˜ denote the representative mean XCO2 value and its uncertainty of a model grid cell, respectively, which was calculated and assimilated according to the strategy of Crowell et al. [34]. The OCO-2 10s mean XCO2 retrieval results over the assimilation experiment area in research time were processed by this strategy, as shown in Figure 2.
Within this area, there are 91 OCO-2 XCO2 observations. To convert vertically layered CO2 concentrations simulated by WRF-Chem into XCO2 with the same physical dimensions as those of OCO-2 observations for data assimilation purposes, we adopted the observation operator H, as defined in Equation (3), following the approach described by Connor et al. [37]:
X C O 2 m = X C O 2 a + j h j a j ( C O 2 m C O 2 a )
where X C O 2 a , h j , a j and C O 2 a are the prior XCO2 value, the pressure weighting function, the column averaging kernel, and the prior CO2 concentration profile used by OCO-2 XCO2 retrieval pretreatment, respectively. C O 2 m is the optimal CO2 concentration profile interpolated to the pressure levels of OCO-2 XCO2 retrievals from the WRF-Chem model. X C O 2 m is the column-average CO2 concentration in the observation space transformed from C O 2 m by the OCO-2 XCO2 retrieval observation operator H.

2.3. CO2 Assimilation System

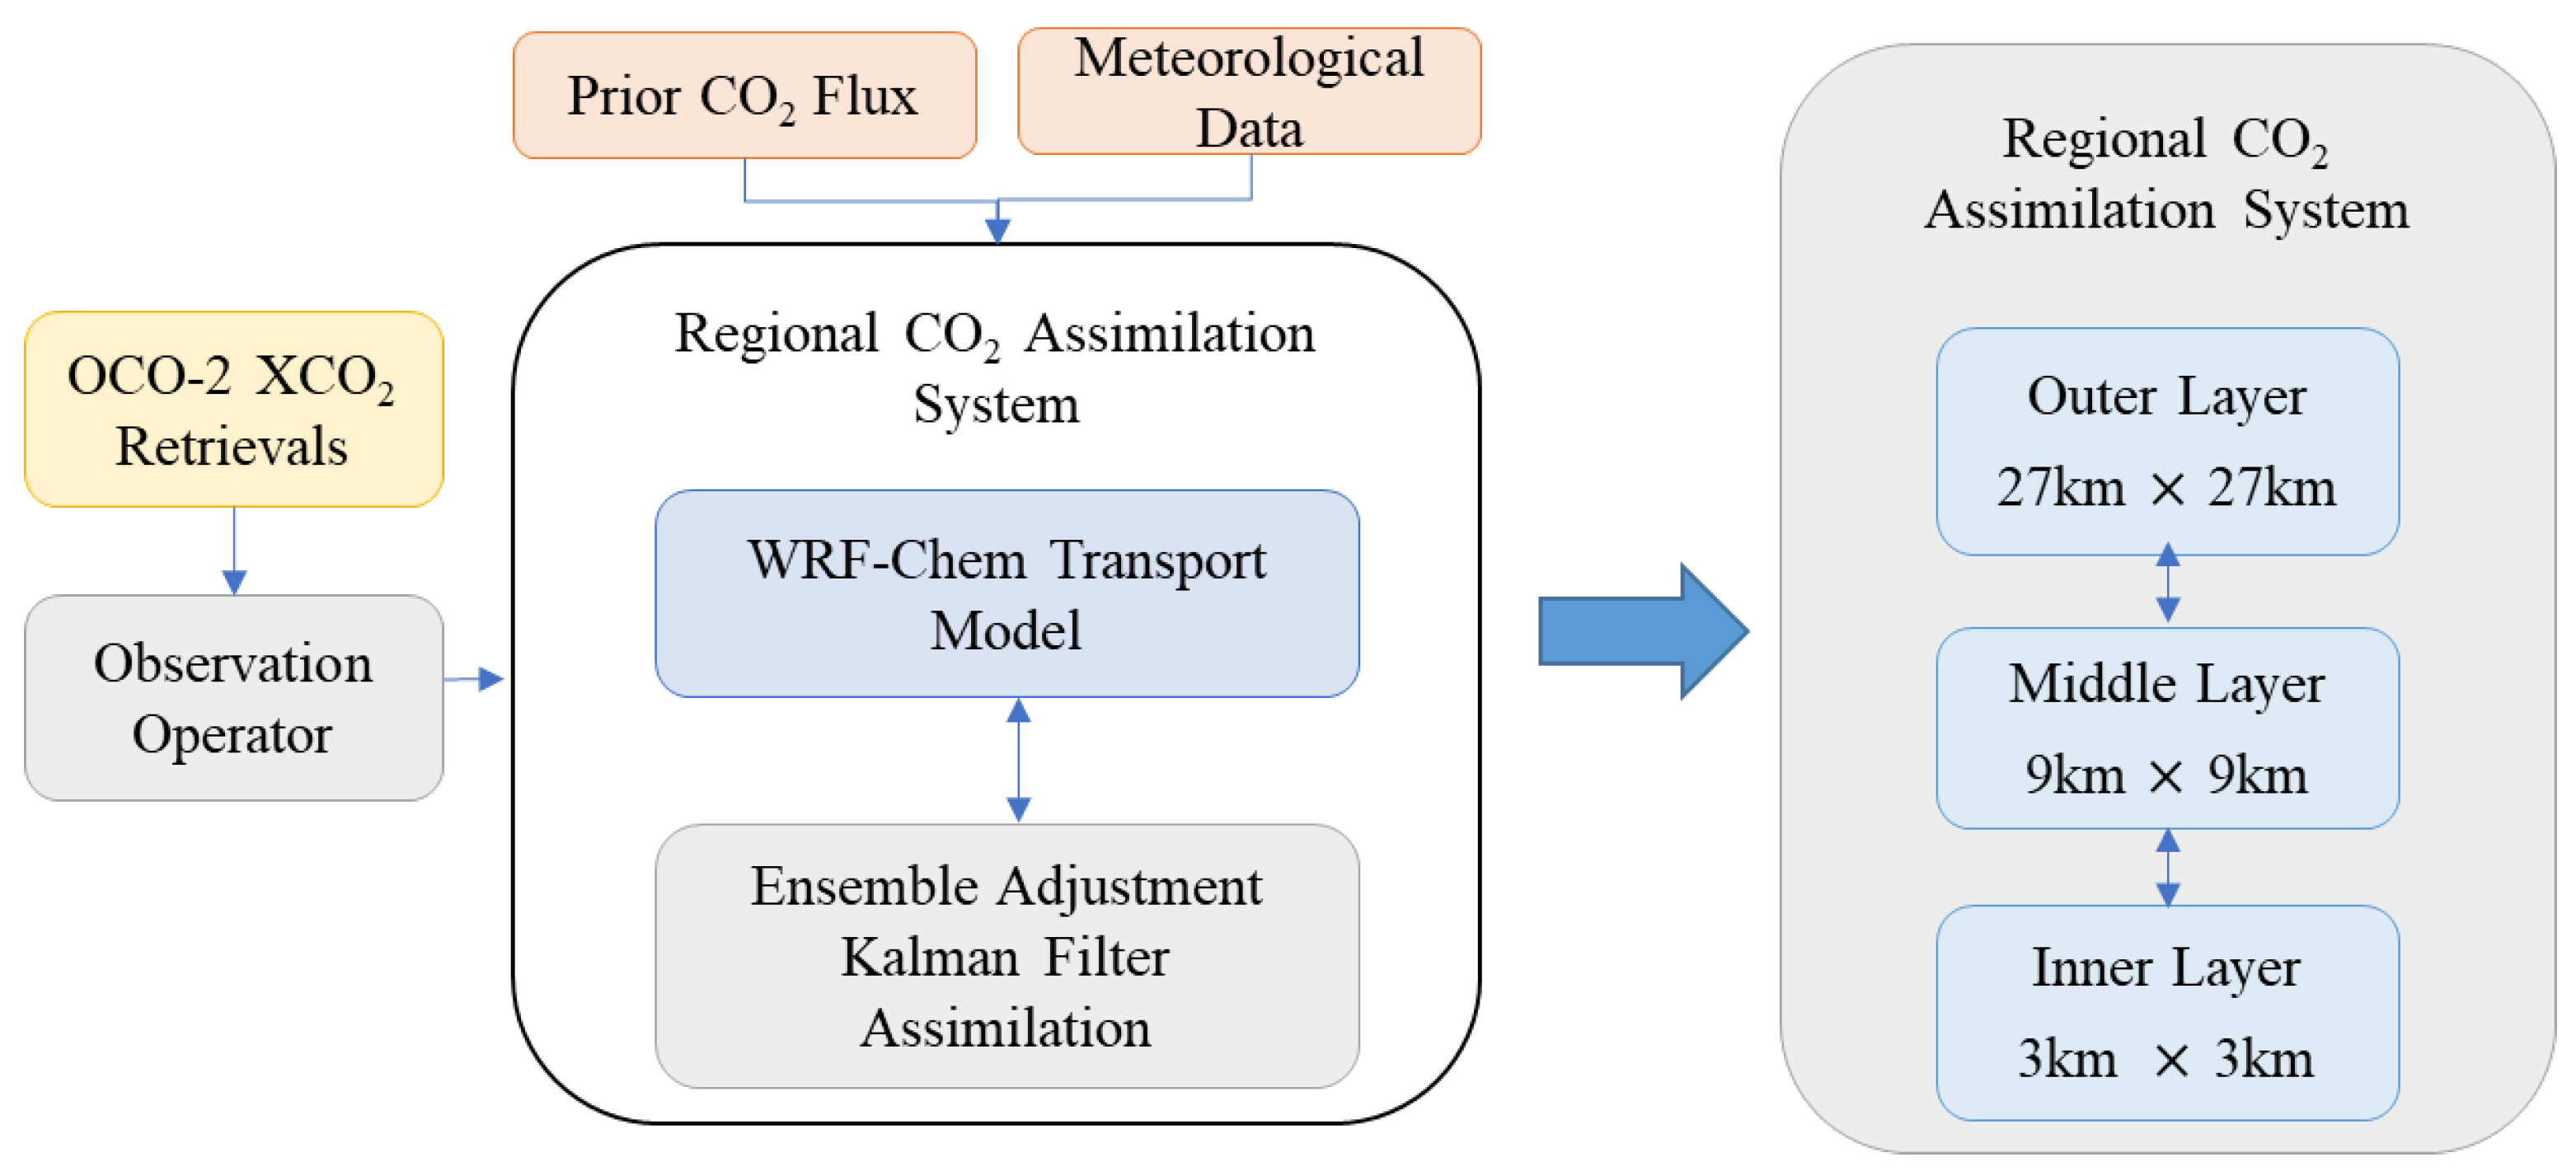
The study is based on the assimilation system followed by Mizzi et al. [29,30] and Zhang et al. [31], a regional CO2 concentration assimilation system with OCO-2 XCO2 retrievals extended by DART [32]. We construct a high-spatiotemporal-resolution regional CO2 assimilation system. It adopts three two-way nesting domains, based on the WRF-Chem/DART transport model, with resolutions of 27 km, 9 km, and 3 km, respectively. Figure 3 shows the structure of our CO2 assimilation system.
Within the regional CO2 assimilation framework, the OCO-2 XCO2 V11.1r retrievals are employed as the satellite-based observational data. The ODIAC emissions inventory and Carbontracker CT2022 fluxes [38] serve as the prior CO2 fluxes, while the MERRA2 dataset provides the necessary meteorological information.
The regional CO2 assimilation method follows the approach described in Zhang et al. [31], employing an extended ensemble adjustment Kalman filter (EAKF) to assimilate WRF-Chem simulations with OCO-2 observation and to inverse the CO2 emissions.

2.4. Research Area

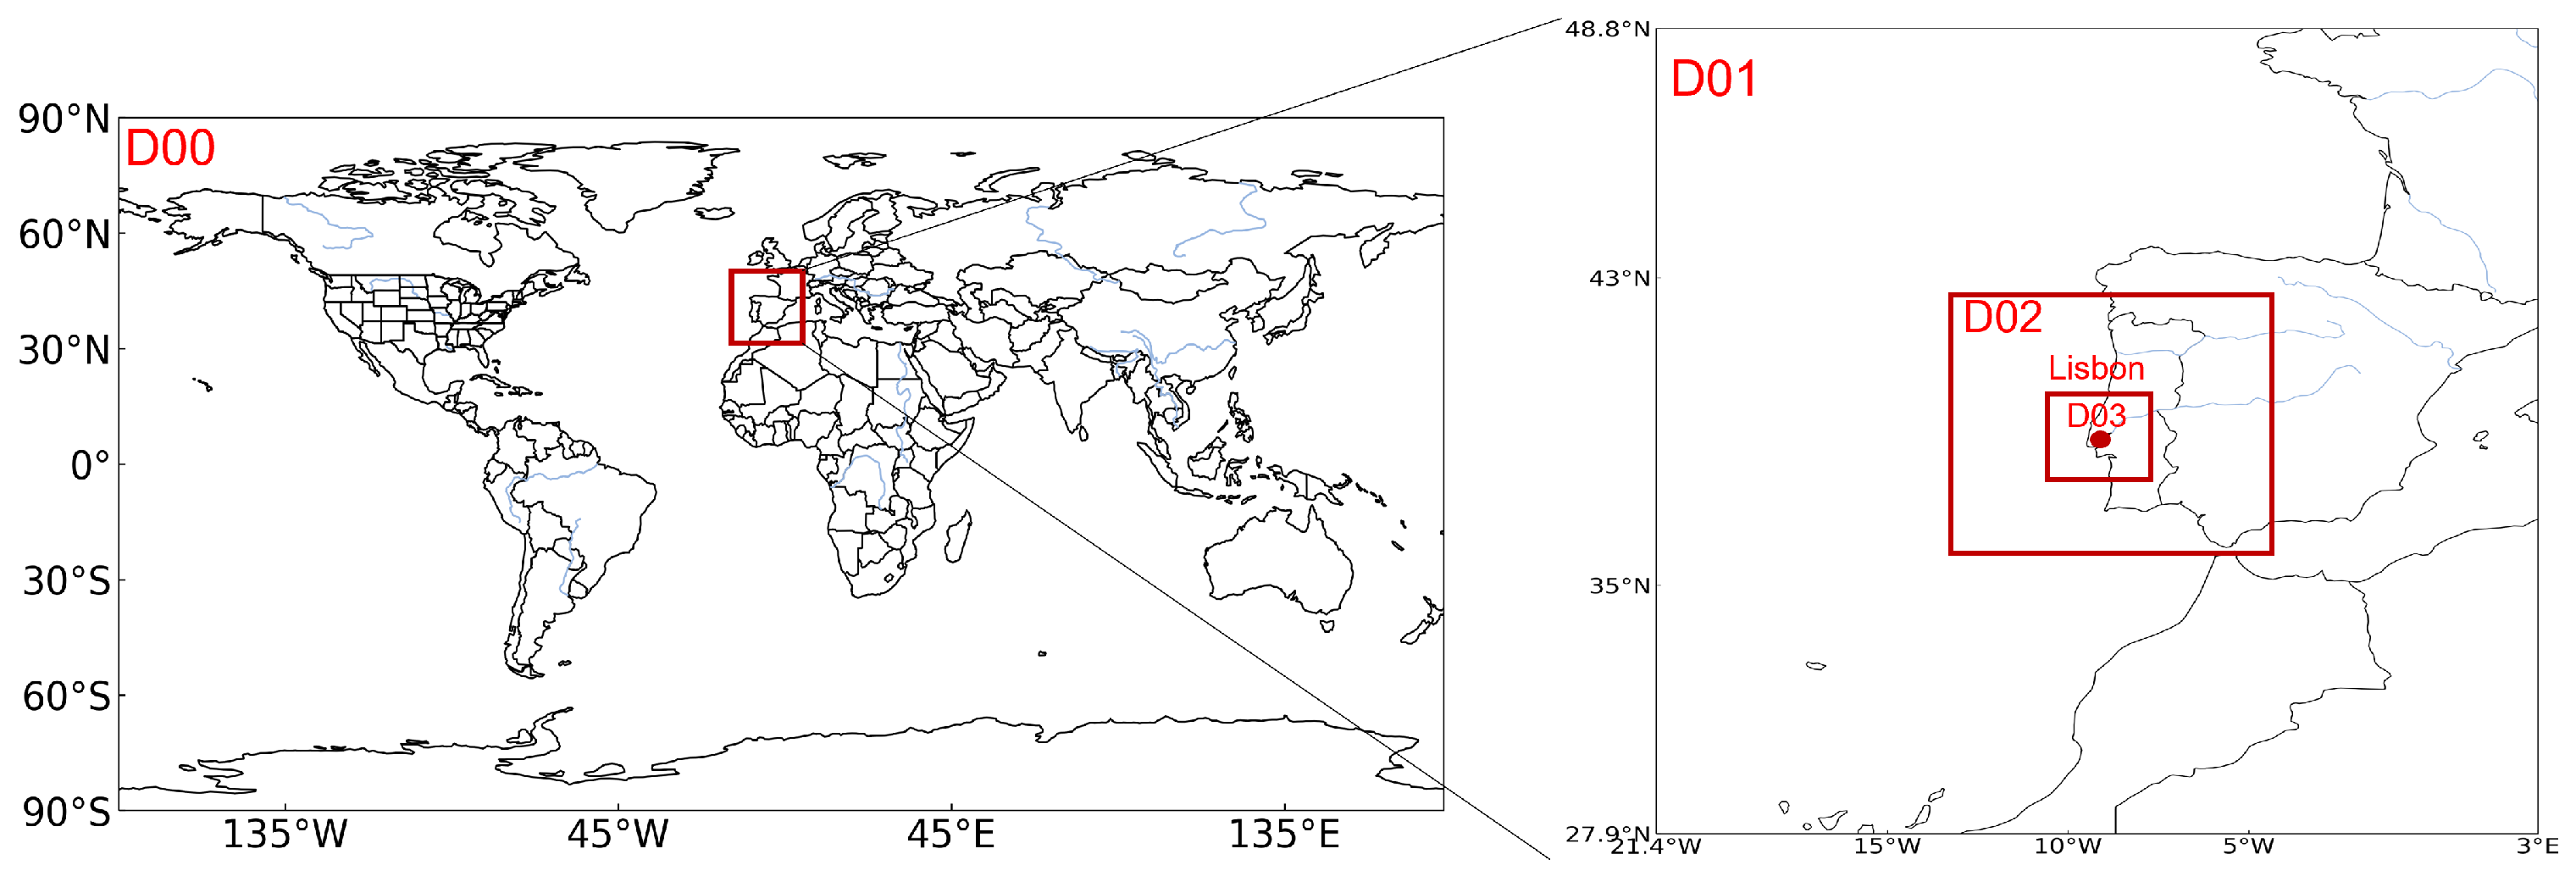
In the study, we aimed to acquire the high-spatial-resolution CO2 concentration centered on Lisbon, Portugal. To achieve this, we devised three two-way nested domains based on WRF-Chem/DART for the purpose of regional assimilation of CO2 concentration. The boundary conditions of the regional CO2 concentration assimilation model were interpolated from the CO2 assimilation result of GEOS-Chem, a Global Environmental Multiscale Model, which has 0.5 × 0.625 spatial resolution and 6-hour resolution.
The geographical coverage of the experiment illustrated in Figure 4. We designated the four domains, D00, D01, D02, and D03. The D00 domain includes the whole world. The D01 domain encompasses western Europe, northern Africa, and a portion of the North Atlantic Ocean. The D02 domain covers Spain and Portugal. Meanwhile, the D03 domain, which is centered on Lisbon, includes part of Portugal and a section of the North Atlantic Ocean.

2.5. Experiment Conditions and Materials

The WRF-Chem model version 4.4 was used as the CO2 transport model [39,40]. The research area is shown in Figure 4. The research period is March 2020. The settings of the WRF-Chem parameter configurations are shown in Table 1 [41,42].
The WRF-Chem model used the ds083.2 dataset (DOI: 10.5065/D6M043C6) and MERRA2 (The Modern-Era Retrospective Analysis for Research and Applications, Version 2) data as initial and boundary meteorological conditions. The ds083.2 dataset, provided by the National Centers for Environmental Prediction (NCEP) Final (FNL) Operational Model Global Tropospheric Analyses, offers a spatial resolution of 1 × 1 and a temporal resolution of 6 h, with continuous data available since July 1999. The MERRA-2 dataset, developed by the National Aeronautics and Space Administration (NASA), features a spatial resolution of 0.5 × 0.625 and a temporal resolution of one hour. It has been available since 1980, providing a long-term and comprehensive record for atmospheric modeling and analysis.
The prior CO2 fluxes were obtained by interpolating ODIAC emissions combined with CarbonTracker CT2022 fluxes, where the CarbonTracker CT2022 fluxes only include fire emissions, biogenic fluxes, and ocean fluxes. These CarbonTracker CT2022 emissions have a spatial resolution of 1 × 1 and a temporal resolution of 3 h. ODIAC emissions serve as the source of anthropogenic emissions for the prior CO2 fluxes. They have a high spatial resolution of 1 km and a monthly temporal resolution. However, for the purpose of this study, these emissions needed to be preprocessed to achieve a 3-hour temporal resolution. Its weekly/diurnal emissions can be modeled by applying the TIMES [49] temporal scaling factors to the ODIAC monthly emission fields. The scaling factor is defined on a 0.25 × 0.25 scale. The gridded scaling data product can be downloaded from the website of the Oak Ridge National Laboratory (https://data.ess-dive.lbl.gov/view/doi%3A10.15485%2F1463822 (accessed on 29 May 2025)). To ensure compatibility with the spatial resolutions of each domain within the regional CO2 assimilation system, it was necessary to resample the ODIAC 1 km data and CarbonTracker CT2022 fluxes. The data were resampled to resolutions of 3 km, 9 km, and 27 km, respectively, to align with the different domain requirements of the assimilation system.

3. Results and Discussion

3.1. Assimilation Experiment Results

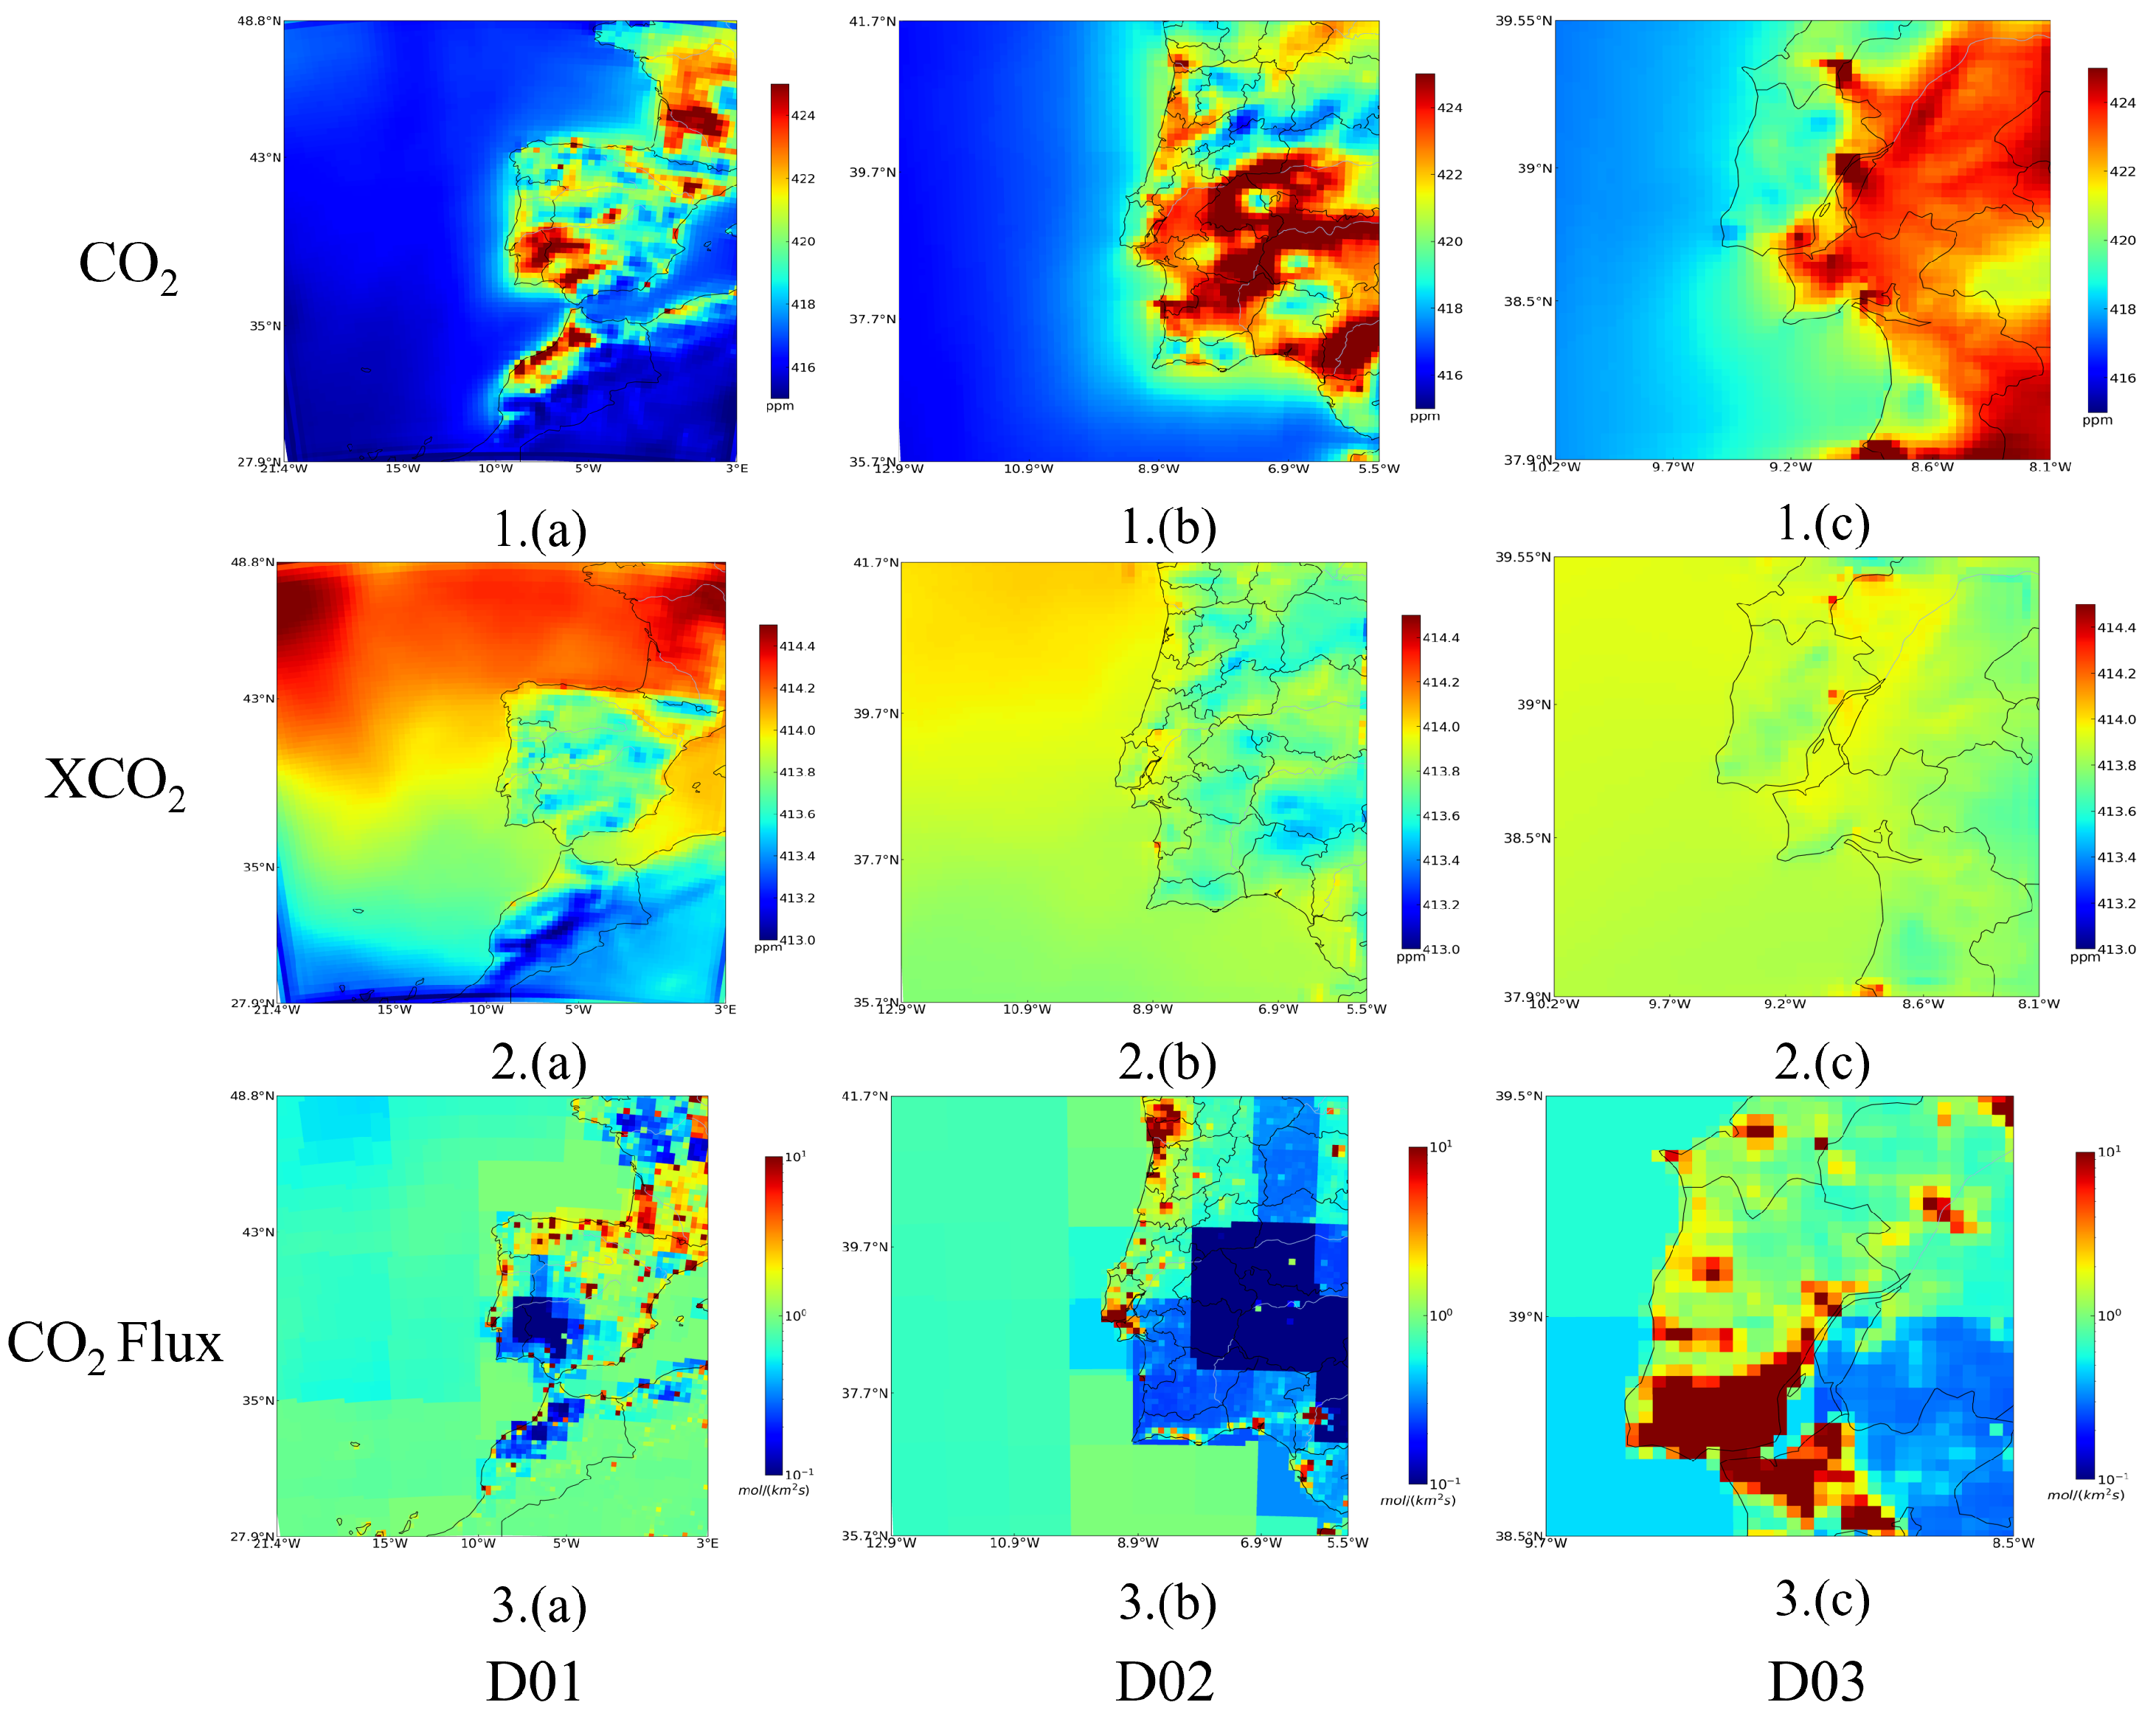
The OCO-2 XCO2 retrievals were assimilated using the regional CO2 concentration assimilation system. The optimized CO2 concentration and CO2 fluxes for the three experimental domains (D01, D02, and D03) in March 2020 are illustrated in Figure 5. For the month of March 2020, the assimilated monthly mean CO2 concentration for the D01, D02, and D03 domains was 417.24 ppm, 419.14 ppm, and 420.62 ppm, respectively. Meanwhile, the monthly mean XCO2 concentrations for these domains were 413.87 ppm, 413.83 ppm, and 413.87 ppm, respectively. Moving from the D01 domain to the D03 domain, the area covered by each domain decreases progressively. Notably, the monthly mean CO2 concentration shows a gradual increase across these domains. In contrast, the monthly mean XCO2 concentrations remain largely unchanged, indicating a relatively stable pattern in terms of column-averaged CO2 across the different-sized domains.
Regarding the CO2 fluxes, the total flux of D01, D02, and D03 domains in March 2020 were −43.68 Tg CO2, −15.36 Tg CO2, and 0.53 Tg CO2, respectively. As illustrated in Figure 5, CO2 emissions in the D01 and D02 dimains were negative, whereas in domain D03 they were positive. From Figure 5, it is evident that in March 2020, CO2 emissions in the southwestern regions of Spain, including areas like the Andalusia region, were relatively low, even lower than those in Portugal. This phenomenon is mainly due to the blockade measures triggered by the COVID-19 epidemic. These measures led to a sudden drop in energy demand and were also influenced by the regional differences in economic structure. Spain was the first country to impose a nationwide lockdown on 14 March 2020. This lockdown involved the closure of non-essential businesses, travel restrictions, and other similar measures. In contrast, Portugal, with its high proportion of renewable energy, introduced its lockdown policy later, on 18 March. During the lockdown period, the southwestern region of Spain, which includes severely affected areas such as Seville and Malaga, witnessed a significant decline in transportation and industrial activities. Social activities in these regions also virtually ground to a halt, further contributing to the reduction in CO2 emissions.
As depicted in Figure 6, the monthly mean CO2 concentration of Lisbon was 420.66 ppm. The CO2 concentration in the eastern of Lisbon was higher compared to the western coastal area. The monthly mean XCO2 concentration in Lisbon stood at 413.88 ppm. Overall, the trend of XCO2 changes within the city was not significant. However, there was a distinct high-concentration point located in the northeast region of Lisbon, and emissions at this specific location were also quite substantial. The total CO2 fluxes for Lisbon were 0.50 Tg CO2, and the CO2 fluxes in the southern of Lisbon were higher than those in the northern regions.

3.2. Comparison with TCCON

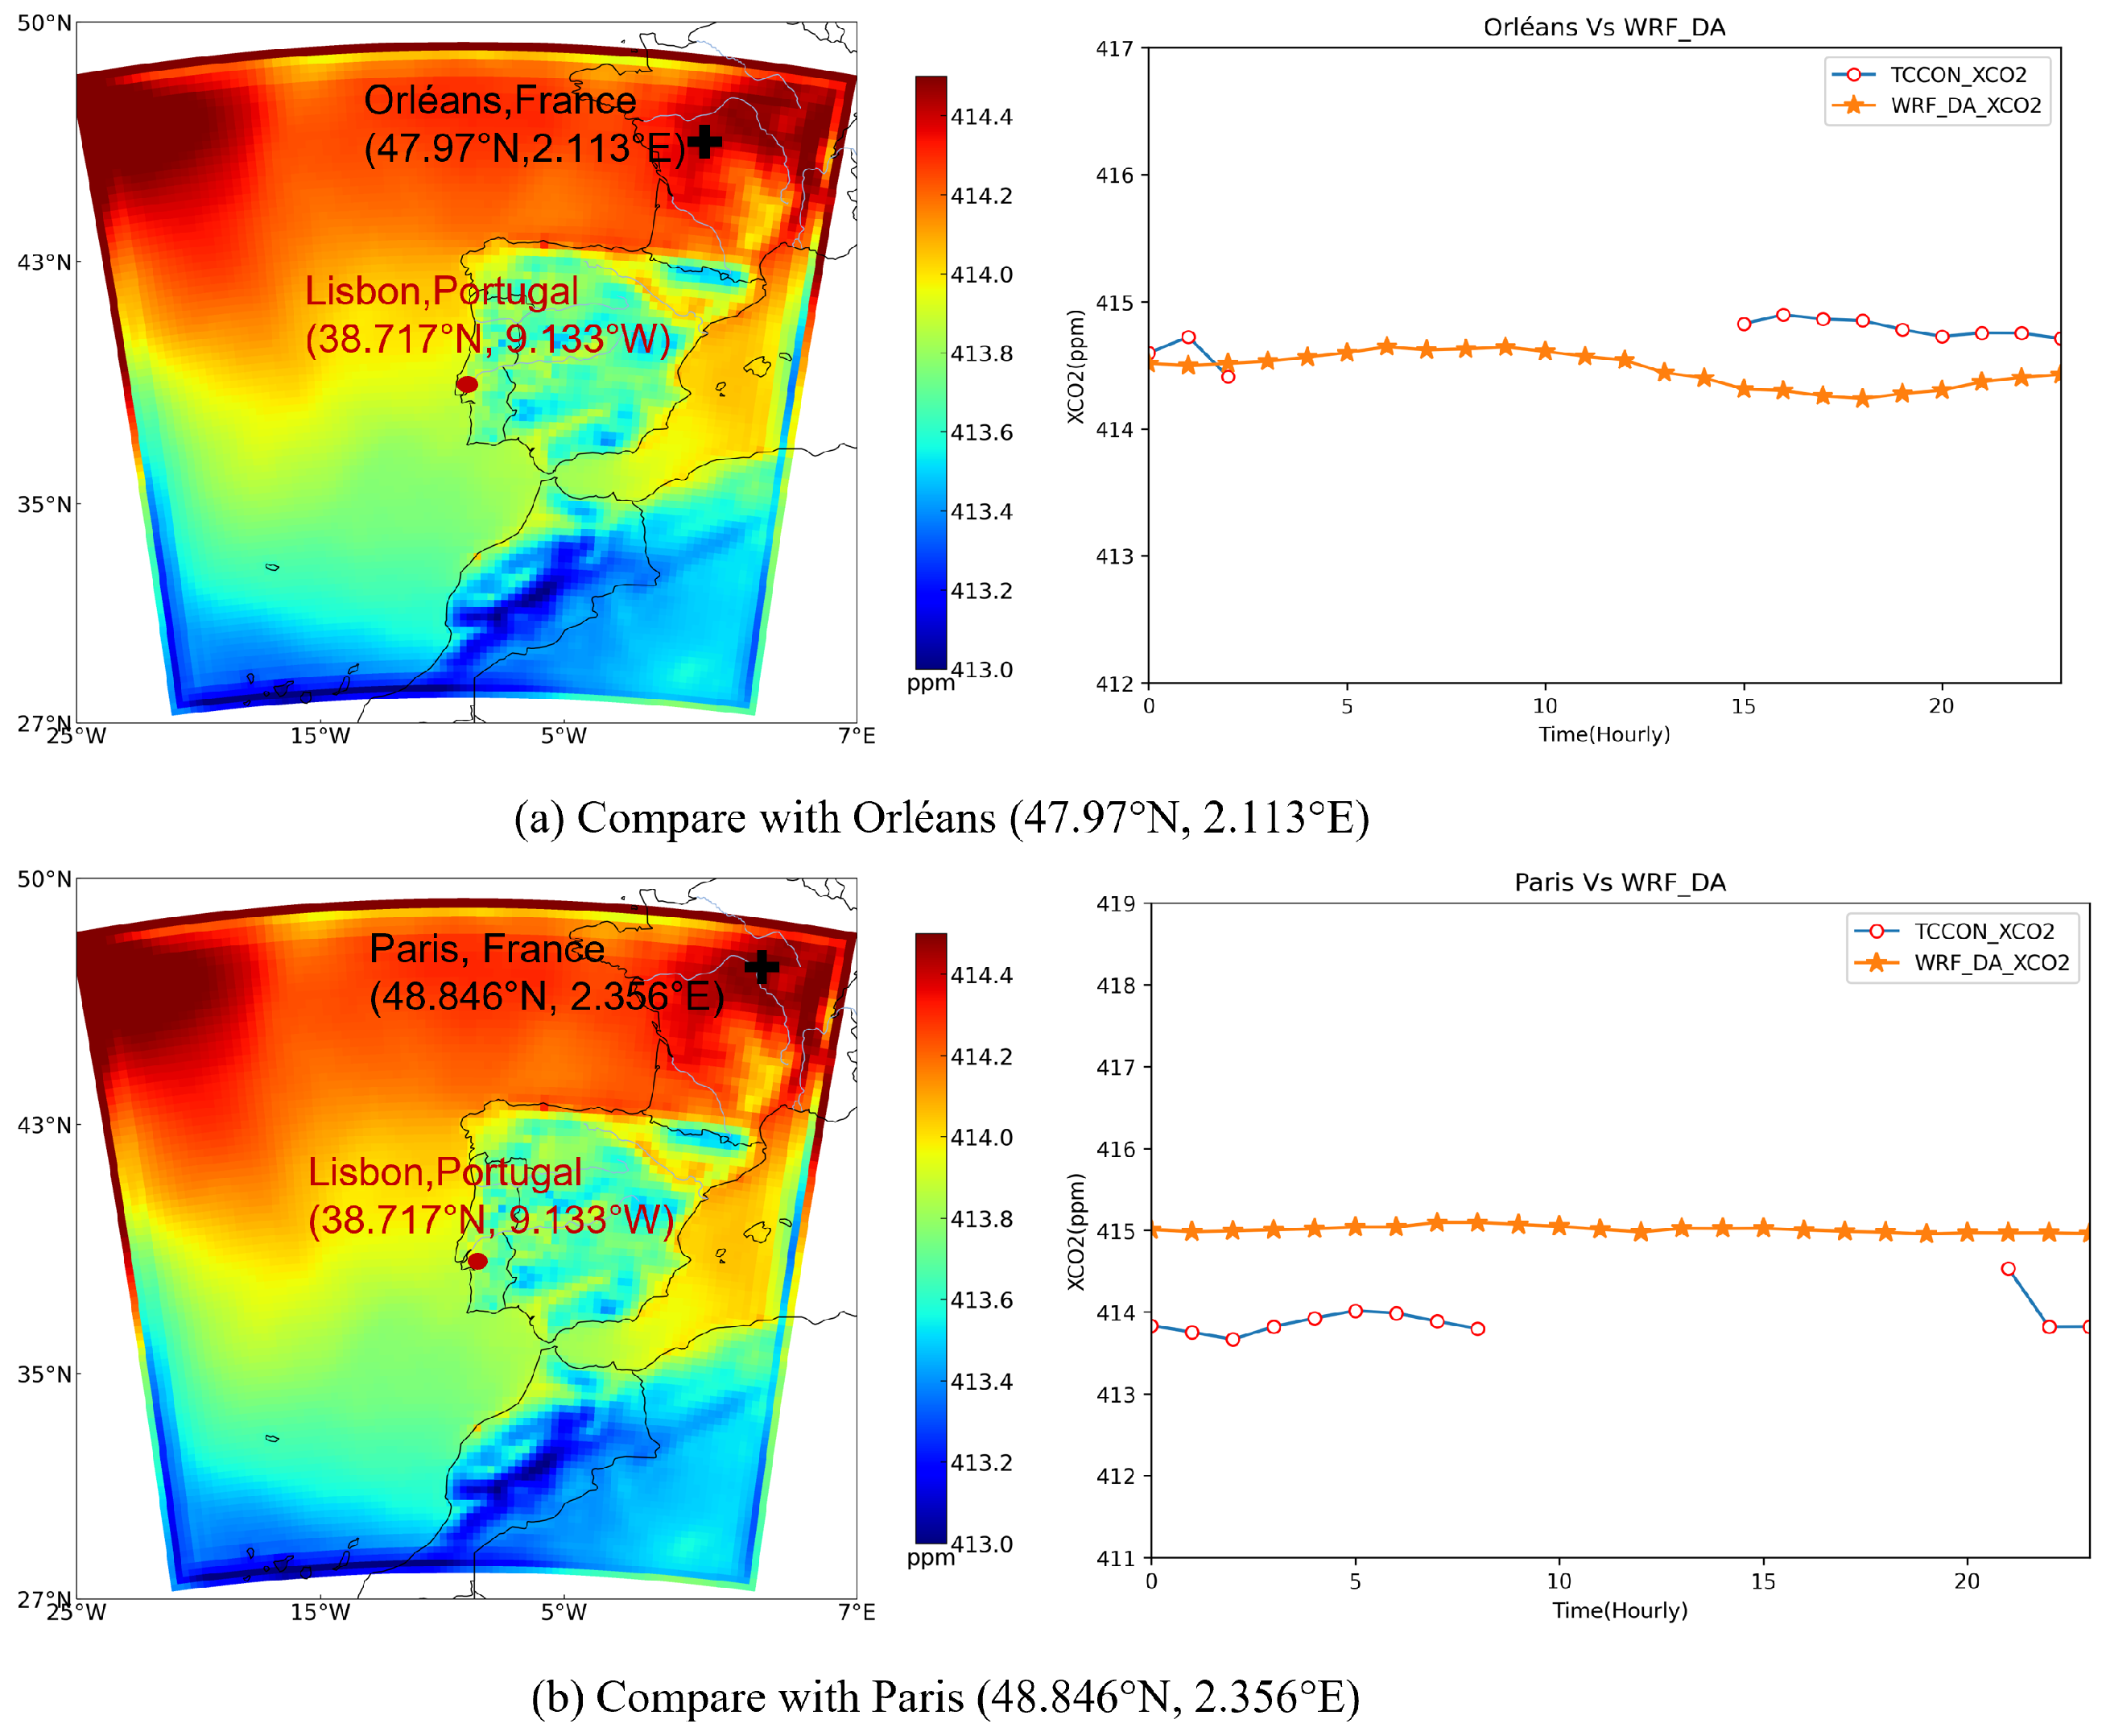
Within the D01 domain of our experiment, there are two Total Carbon Column Observing Network (TCCON) sites: Orléans (located at 47.97 N, 2.113 E) and Paris (located at 48.846 N, 2.356 E). Both of these sites are situated in France. We extracted the XCO2 concentration data from these two sites within the D01 domain, subsequently comparing them with the corresponding TCCON data. The outcomes of this comparison are presented in Figure 7 and Table 2.
In March 2020, the Orléans TCCON site recorded 1639 data points with an average XCO2 concentration of 414.78 ppm. Meanwhile, the Paris TCCON site gathered 2313 data points during the same period, and its mean XCO2 concentration was 413.85 ppm. We compared the assimilated XCO2 results with the data from these two TCCON sites on an hourly average, respectively. The compare results are presented in the right-hand panel of Figure 7. In this panel, the x-axis represents hourly time intervals, while the y-axis indicates the XCO2 value. The comparison reveals that the difference in ΔXCO2 between Orléans site and the assimilation results is 0.31 ppm. On the other hand, the ΔXCO2 between Paris site and the assimilation results is 1.16 ppm.

3.3. Comparison with ObsPack

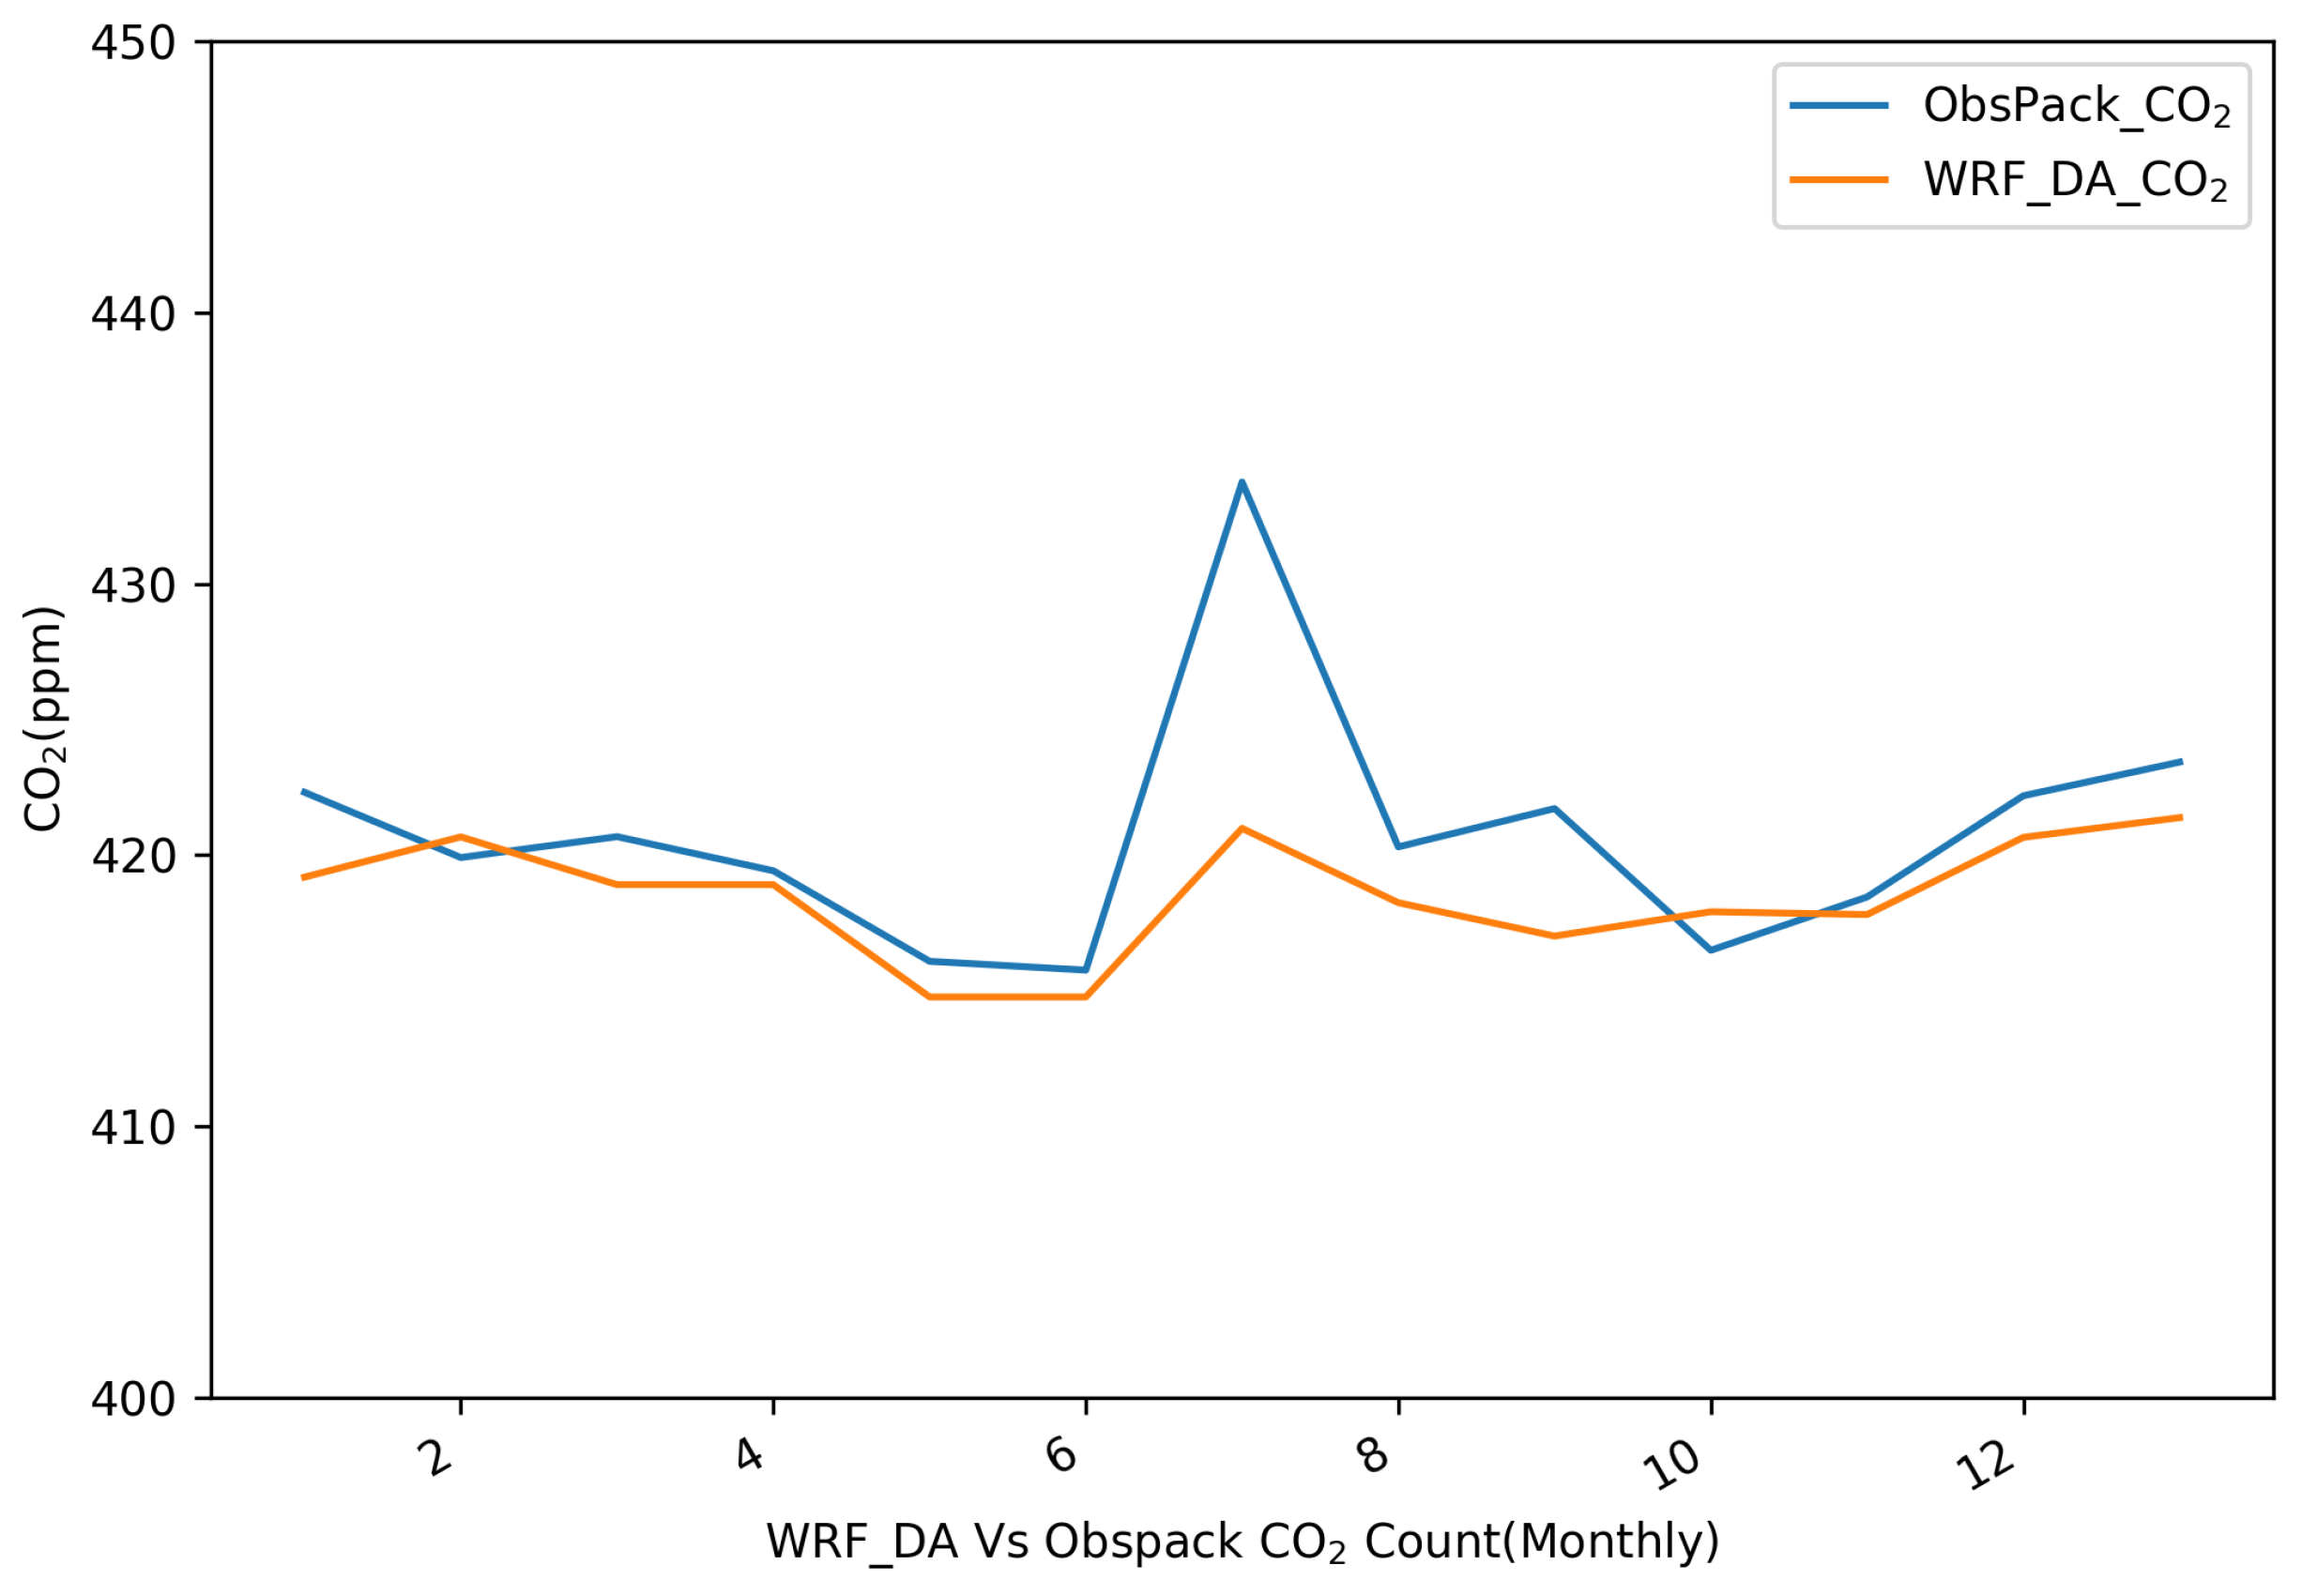
We compared the assimilated CO2 concentration in the D01 domain with Observation Package Data Products (ObsPack) [50]. ObsPack data are specifically designed to stimulate and support carbon cycle modeling studies. The comparison was carried out for the month of March 2020. Within the D01 domain, we obtained 13 data points from ObsPack. Based on the statistical analysis of these points, the monthly mean CO2 concentration from ObsPack was found to be 420.81 ppm. In contrast, the monthly mean CO2 concentration from our assimilation experiment was 418.55 ppm, which is 2.26 ppm lower than the ObsPack data. The Root Mean Square Error (RMSE) between the assimilation results and ObsPack data was calculated to be 4.06 ppm, and the correlation coefficient (CORR) was 0.68. These comparative results are presented in Table 3 and Figure 8. Figure 9 illustrates the spatial distribution of the monthly mean CO2 concentration for both the CO2 assimilation results and the ObsPack data within D01 domain for March 2020.

4. Conclusions

The paper presents a comprehensive assessment of CO2 concentration and fluxes in Lisbon, Portugal during March 2020, employing a high-spatio-temporal resolution regional CO2 assimilation system based on WRF-Chem/DART with three nested domains. The assimilation results indicate that in March 2020, Lisbon recorded CO2 and XCO2 concentrations of 420.66 ppm and 413.88 ppm, respectively, along with CO2 fluxes of 0.50 Tg CO2. We compared the XCO2 concentration with the data from two TCCON sites, Orléans and Paris, revealing a monthly mean ΔXCO2 of 0.74 ppm, which is less than 1 ppm. Moreover, the discrepancy with the Orléans site was merely 0.31 ppm. However, when comparing the surface CO2 concentration with Obspack data, the monthly mean ΔCO2 was found to be 2.26 ppm, with a Root Mean Square Error (RMSE) of 4.06 ppm, indicating a relatively significant gap on CO2 concentration.
An examination of the CO2 flux distribution across the D01 domain clearly illustrates that, in March 2020, Spain’s social and economic activities stagnated due to the blockade of COVID-19. This led to a sharp decline in CO2 emissions in southwestern Spain. This short-term phenomenon underscores the strong correlation between human activities and carbon emissions. Additionally, CO2 flux distribution in Lisbon pinpointed a hotspot for CO2 emissions at coordinates ( 9 W, 39 E).
This study provides valuable information on the dynamics of urban CO2 and highlights the impact of sudden socioeconomic changes such as COVID-19 on carbon emissions. The regional CO2 assimilation method employed can be adapted for other megacities to support the development of low-carbon policies.

Author Contributions

Conceptualization, Q.G.; methodology, J.J. and Y.H.; software, J.J. and Y.H.; validation, J.J.; formal analysis, J.J.; investigation, J.J.; resources, J.J.; data curation, J.J.; writing—original draft preparation, J.J.; writing—review and editing, J.J., Y.H., C.W., Q.G., M.W., X.W. and X.X.; visualization, J.J.; supervision, C.W., Q.G. and M.W.; project administration, J.J.; funding acquisition, C.W., Q.G. and M.W. All authors have read and agreed to the published version of the manuscript.

Funding

This research is funded by Shanghai 2022 “Science and Technology Innovation Action Plan” Science and Technology Support for Carbon Peak and Carbon Neutrality Special Project (Grant number: 22dz1208806) and (Grant number: 22dz1208702), Road Transportation Carbon Emission Accounting Model Research Based on the Combination of Satellite, Ground Station Observation Data (Grant number: 22dz1207503), National Natural Science Foundation of China (Grant No.52178060).

Institutional Review Board Statement

Not applicable.

Informed Consent Statement

Not applicable.

Data Availability Statement

CarbonTracker CT2022 data and ObsPack data are provided by the National Oceanic and Atmospheric Administration (NOAA) and available from Global Monitoring Laboratory https://gml.noaa.gov/aftp/products/carbontracker/co2/CT2022/ (accessed on 29 May 2025), https://gml.noaa.gov/ccgg/obspack/data.php (accessed on 29 May 2025); OCO-2 V11.1r data and MERRA2 Meteorological data are provied by NASA and available from EARTHDATA https://disc.gsfc.nasa.gov/datasets/OCO2_L2_Lite_FP_11.1r/summary?keywords=OCO-2 (accessed on 29 May 2025),https://disc.gsfc.nasa.gov/datasets?keywords=MERRA2&page=1 (accessed on 29 May 2025). Meteorological observation data are provied by National Centers for Environmental Prediction (NCEP) and availible from http://database.rish.kyoto-u.ac.jp/arch/ncep/data/ncep.reanalysis2/gaussian_grid/ (accessed on 29 May 2025). ODIAC emissions from CGER(Center for Global Environmental Research) https://db.cger.nies.go.jp/dataset/ODIAC/DL_odiac2020b.html (accessed on 29 May 2025).

Acknowledgments

The authors acknowledge the free availability of the WRF-Chem model https://www2.acom.ucar.edu/wrf-chem (accessed on 29 May 2025), DART system https://docs.dart.ucar.edu/en/latest/index.html (accessed on 29 May 2025), and sincerely thank Arthur P. Mizzi for contributions to WRF-Chem/DART system. The meteorological data were obtained from NCEP https://rda.ucar.edu/datasets/ds337.0/ (accessed on 29 May 2025). CarbonTracker CT2022 results were provided by NOAA https://gml.noaa.gov/aftp/products/carbontracker/co2/CT2022/ (accessed on 29 May 2025). OCO-2 V11.1r data were gathered from the NASA https://disc.gsfc.nasa.gov/datasets?keywords=OCO-2 (accessed on 29 May 2025). ODIAC emissions were obtained from CGER (Center for Global Environmental Research) https://db.cger.nies.go.jp/dataset/ODIAC/DL_odiac2020b.html (accessed on 29 May 2025).

Conflicts of Interest

The authors declare no conflicts of interest.

References

  1. The State of Greenhouse Gases in the Atmosphere Based on Global Observations through 2020. WMO Greenh. Gas Bull. 2021, 17. Available online: https://reliefweb.int/report/world/wmo-greenhouse-gas-bulletin-state-greenhouse-gases-atmosphere-based-global-2 (accessed on 29 May 2025).
  2. Masson-Delmotte, V.; Zhai, P.; Pirani, A.; Connors, S.L.; Péan, C.; Berger, S.; Caud, N.; Chen, Y.; Goldfarb, L.; Gomis, M.I.; et al. (Eds.) The Physical Science Basis. Contribution of Working Group I to the Sixth Assessment Report of the Intergovernmental Panel on Climate Change. In IPCC(2021): Climate Change 2021; Cambridge University Press: Cambridge, UK; New York, NY, USA, 2021. [Google Scholar]
  3. Agency, I.E. World Energy Outlook 2008. SourceOECD Energy 2008, 2008, 578. [Google Scholar]
  4. Marcotullio, P.J.; Sarzynski, A.; Albrecht, J.; Schulz, N. A Top-Down Regional Assessment of Urban Greenhouse Gas Emissions in Europe. Ambio 2014, 43, 957–968. [Google Scholar] [CrossRef]
  5. Sonwani, S.; Saxena, P. Introduction to greenhouse gases: Sources, sinks and mitigation. In Greenhouse Gases: Sources, Sinks and Mitigation; Springer: Berlin/Heidelberg, Germany, 2022; pp. 1–7. [Google Scholar] [CrossRef]
  6. ICOS RI. ICOS Atmosphere Station Specifications V2.0; Laurent, O., Ed.; ICOS ERIC: Helsinki, Finland, 2020. [Google Scholar]
  7. Wennberg, P.O.; Wunch, D.; Roehl, C.M.; Blavier, J.-F.; Toon, G.C.; Allen, N.T. TCCON Data from Caltech (US). Release GGG2014.R1. 2015. Available online: https://data.caltech.edu/records/285 (accessed on 29 May 2025).
  8. Crippa, M.; Janssens-Maenhout, G.; Guizzardi, D.; Muntean, M.; Schaaf, E. Emissions Database for Global Atmospheric Research, Version v7.0 Part II Air Pollutants (Gridmaps); European Commission: Brussels, Belgium; Joint Research Centre (JRC): Ispra, Italy, 2018; Available online: https://edgar.jrc.ec.europa.eu/emissions_data_and_maps (accessed on 29 May 2025).
  9. Huijnen, V.; Williams, J.; van Weele, M.; van Noije, T.; Krol, M.; Dentener, F.; Segers, A.; Houweling, S.; Peters, W.; de Laat, J.; et al. The global chemistry transport model TM5: Description and evaluation of the tropospheric chemistry version 3.0. Geosci. Mod. Develop. 2010, 3, 445–473. [Google Scholar] [CrossRef]
  10. Skamarock, W.C.; Klemp, J.B. A time-split nonhydrostatic atmospheric model for weather research and forecasting applications. J. Comput. Phys. 2008, 227, 3465–3485. [Google Scholar] [CrossRef]
  11. Skamarock, W.C.; Klemp, J.; Dudhia, J.; Gill, D.; Barker, M.; Duda, K.; Wang, W.; Powers, J.G. A Description of the Advanced Research WRF Version 3; NCAR Tech. Note TN-475_STR; University Corporation for Atmospheric Research: Boulder, CO, USA, 2008. [Google Scholar]
  12. Grell, G.A.; Peckham, S.E.; Schmitz, R.; McKeen, S.A.; Frost, G.; Skamarock, W.C.; Eder, B. Fully coupled “online” chemistry within the WRF model. Atmos. Envir. 2005, 39, 6957–6975. [Google Scholar] [CrossRef]
  13. Fast, J.D.; Gustafson, W.I., Jr.; Easter, R.C.; Zaveri, R.A.; Barnard, J.C.; Chapman, E.G.; Grell, G.A.; Peckham, S.E. Evolution of ozone, particulates, and aerosol direct radiative forcing in the vicinity of Houston using a fully coupled meteorology-chemistry-aerosol model. J. Geophys. Res. Atmos. 2006, 111. [Google Scholar] [CrossRef]
  14. Peters, W.; Jacobson, A.R.; Sweeney, C.; Andrews, A.E.; Conway, T.J.; Masarie, K.; Miller, J.B.; Bruhwiler, L.M.P.; Pétron, G.; Hirsch, A.I.; et al. An atmospheric perspective on north american carbon dioxide exchange: CarbonTracker. Proc. Natl. Acad. Sci. USA 2007, 104, 18925–18930. [Google Scholar] [CrossRef]
  15. Lauvaux, T.; Uliasz, M.; Sarrat, C.; Chevallier, F.; Bousquet, P.; Lac, C.; Davis, K.J.; Ciais, P.; Denning, A.S.; Rayner, P.J. Mesoscale inversion: First re-sults from the CERES campaign with synthetic data. Atmos. Chem. Phys. 2008, 8, 3459–3471. [Google Scholar] [CrossRef]
  16. Lauvaux, T.; Davis, K.; Miles, N.; Richardson, S.; Stauffer, D. A WRF-Chem realtime modeling system for monitoring CO2 emissions. Extended Abstracts. In Proceedings of the 13th An-nual WRF Users’ Workshop, Boulder, CO, USA, 25–29 June 2012; p. 33. [Google Scholar]
  17. Lauvaux, T.; Gioli, B.; Sarrat, C.; Rayner, P.J.; Ciais, P.; Chevallier, F.; Noilhan, J.; Miglietta, F.; Brunet, Y.; Ceschia, E.; et al. Bridging the gap between atmospheric concentrations and local ecosystem measurements. Geophys. Res. Lett. 2009, 36. [Google Scholar] [CrossRef]
  18. Schuh, A.E.; Denning, A.S.; Corbin, K.D.; Baker, I.T.; Uliasz, M.; Parazoo, N.; Andrews, A.E.; Worthy, D.E.J. A re-gional high-resolution carbon flux inversion of North America for 2004. Biogeosciences 2010, 7, 1625–1644. [Google Scholar] [CrossRef]
  19. Schuh, A.E.; Lauvaux, T.; West, T.O. Evaluating atmospheric CO2 inversions at multiple scales over a highly inventoried agricultural landscape. Glo. Chan. Bio. 2013, 19, 1424–1439. [Google Scholar] [CrossRef]
  20. Wu, L.; Broquet, G.; Ciais, P.; Bellassen, V.; Vogel, F.; Chevallier, F.; Xueref-Remy, I.; Wang, Y. What would dense atmospheric observation networks bring to the quantification of city CO2 emissions? Atmos. Chem. Phys. 2016, 16, 7743–7771. [Google Scholar] [CrossRef]
  21. Lauvaux, T.; Miles, N.L.; Richardson, S.J.; Deng, A.; Stauffer, D.R.; Davis, K.J.; Jacobson, G.; Rella, C.; Calonder, G.-P.; DeCola, P.L. Urban Emissions of CO2 from Davos, Switzerland: The First Real-Time Monitoring System Using an Atmospheric Inversion Technique. J. Appl. Meteo. Climat. 2013, 52, 2654–2668. [Google Scholar] [CrossRef]
  22. Lowry, D.; Holmes, C.W.; Rata, N.D.; O’Brien, P.; Nisbet, E.G. London methane emissions: Use of diurnal changes in concentration and d13Cto identify urban sources and verify inventories. J. Geophys. Res. 2001, 106, 7427–7448. [Google Scholar] [CrossRef]
  23. Strong, C.; Stwertka, C.; Bowling, D.R.; Stephens, B.B.; Ehleringer, J.R. Urban carbon dioxide cycles within the Salt Lake Valley: A multiple-box model validated by bservations. J. Geophys. Res. 2011, 116, D15307. [Google Scholar] [CrossRef]
  24. Masson, V.; Grimmond, C.; Oke, T. Evaluation of the town energy balance (TEB) scheme with direct measurements from dry districts in two cities. J. Appl. Meteor. 2002, 41, 1011–1026. [Google Scholar]
  25. Hanna, S.R.; Paine, R.; Heinold, D.; Kintigh, E.; Baker, D. Uncertainties in air toxics calculated by the dispersion models AERMOD and ISCST3 in the Houston ship channel area. J. Appl. Meteor. Climatol. 2007, 46, 1372–1382. [Google Scholar] [CrossRef]
  26. Lac, C.; Donnelly, R.P.; Masson, V.; Pal, S.; Riette, S.; Donier, S.; Queguiner, S.; Tanguy, G.; Ammoura, L.; Xueref-Remy, I. CO2 dispersion modelling over paris region within the CO2-MEGAPARIS project. Atmos. Chem. Phys. Discuss. 2012, 12, 28155–28193. [Google Scholar] [CrossRef]
  27. Friedlingstein, P.; Jones, M.W.; O’Sullivan, M.; Andrew, R.M.; Bakker, D.C.E.; Hauck, J.; Quéré, C.L.; Peters, G.P.; Peters, W.; Pongratz, J.; et al. Global Carbon Budget 2021. Earth Syst. Sci. Data Discuss. 2022, 14, 1917–2005. [Google Scholar] [CrossRef]
  28. Weir, B.; Crisp, D.; O’Dell, C.W.; Basu, S.; Chatterjee, A.; Kolassa, J.; Oda, T.; Pawson, S.; Poulter, B.; Zhang, Z.; et al. Regional impacts of COVID-19 on carbon dioxide detected worldwide from space. Sci. Adv. 2021, 7, eabf9415. [Google Scholar] [CrossRef] [PubMed]
  29. Mizzi, A.P.; Edwards, D.P.; Anderson, J.L. Assimilating compact phase space retrievals (CPSRs): Comparison with independent observations (MOZAIC in situ and IASI retrievals) and extension to assimilation of truncated retrieval profiles. Geosci. Mod. Develop. 2018, 11, 3727–3745. [Google Scholar] [CrossRef]
  30. Mizzi, A.P.; Arellano, A.F., Jr.; Edwards, D.P.; Anderson, J.L.; Pfister, G.G. Assimilating compact phase space retrievals of atmospheric composition with WRF-Chem/DART: A regional chemical transport/ensemble Kalman filter data assimilation system. Geosci. Mod. Develop. 2016, 9, 965–978. [Google Scholar] [CrossRef]
  31. Zhang, Q.; Li, M.; Wei, C.; Mizz, A.P.; Huang, Y.; Gu, Q. Assimilation of OCO-2 retrievals with WRF-Chem/DART: A case study for the Midwestern United States. Atmos. Envir. 2021, 246, 118106. [Google Scholar] [CrossRef]
  32. Anderson, J.; Hoar, T.; Raeder, K.; Liu, H.; Collins, N.; Torn, R.; Avellano, A. The Data Assimilation Research Testbed A Community Facility. Bull. Ameri. Meteor. Soci. 2009, 90, 1283–1296. [Google Scholar] [CrossRef]
  33. Oda, T.; Maksyutov, S. A very high-resolution (1 km × 1 km) global fossil fuel CO2 emission inventory derived using a point source database and satellite observations of nighttime lights. Atmos. Chem. Phys. 2011, 11, 543–556. [Google Scholar] [CrossRef]
  34. Crowell, S.; Baker, D.; Schuh, A.; Basu, S.; Jacobson, A.R.; Chevallier, F.; Liu, J.; Deng, F.; Feng, L.; McKain, K.; et al. The 2015–2016 carbon cycle as seen from OCO-2 and the global in situ network. Atmos. Chem. Phys. 2019, 9, 9797–9831. [Google Scholar] [CrossRef]
  35. Osterman, G.; Eldering, A.; Avis, C.; Chafin, B.; O’Dell, C.; Frankenberg, C.; Fisher, B.; Mandrake, L.; Wunch, D.; Granat, R.; et al. Orbiting carbon observatory–2 (OCO-2) data product user’s guide, operational L1 and L2 data versions 8 and lite file version 9, version 1. ReVision J. 2018. Available online: https://disc.gsfc.nasa.gov/datasets?page=1 (accessed on 29 May 2025).
  36. Wunch, D.; Wennberg, P.O.; Osterman, G.; Fisher, B.; Naylor, B.; Roehl, C.M.; O’Dell, C.; Mandrake, L.; Viatte, C.; Kiel, M.; et al. Comparisons of the orbiting carbon observatory-2 (OCO-2) XCO2 measurements with TCCON. Atmos. Measure. Tech. 2017, 10, 2209–2238. [Google Scholar] [CrossRef]
  37. Connor, B.J.; Boesch, H.; Toon, G.; Sen, B.; Miller, C.; Crisp, D. Orbiting Carbon Observatory: Inverse method and prospective error analysis. J. Geophys. Res. Atmos. 2008, 113. [Google Scholar] [CrossRef]
  38. Jacobson, A.R.; Schuldt, K.N.; Tans, P.; Andrews, A.; Miller, J.B.; Oda, T.; Basu, S.; Mund, J.; Weir, B.; Ott, L.; et al. CarbonTracker CT20222. Model Published by NOAA Global Monitoring Laboratory. 2023. Available online: https://gml.noaa.gov/ccgg/carbontracker/CT2022/ (accessed on 29 May 2025).
  39. Giordano, C.; Vernin, J.; Trinquet, H.; Muñoz-Tuñón, C. Weather Research and Forecasting prevision model as a tool to search for the best sites for astronomy: Application to La Palma, Canary Islands. Month. Noti. Royal Astro. Soci. 2014, 440, 1964–1970. [Google Scholar] [CrossRef]
  40. Shikhovtsev, A.Y.; Kovadlo, P.G.; Lezhenin, A.A.; Gradov, V.S.; Zaiko, P.O.; Khitrykau, M.A.; Kirichenko, K.E.; Driga, M.B.; Kiselev, A.V.; Russkikh, I.V.; et al. Simulating Atmospheric Characteristics and Daytime Astronomical Seeing Using Weather Research and Forecasting Model. Appl. Sci. 2023, 13, 6354. [Google Scholar] [CrossRef]
  41. Huang, Y.; Wei, J.; Jin, J.; Zhou, Z.; Gu, Q. CO Fluxes in Western Europe during 2017–2020 Winter Seasons Inverted by WRF-Chem/Data Assimilation Research Testbed with MOPITT Observations. Remot. Sens. 2022, 14, 1133. [Google Scholar] [CrossRef]
  42. Zhang, Q.; Li, M.; Wang, M.; Mizzi, A.P.; Huang, Y.; Wei, C.; Jin, J.; Gu, Q. CO2 Flux over the Contiguous United States in 2016 Inverted by WRF-Chem/DART from OCO-2 XCO2 Retrievals. Remot. Sens. 2021, 13, 2996. [Google Scholar] [CrossRef]
  43. Schneising, O.; Reuter, M.; Buchwitz, M.; Heymann, J.; Bovensmann, H.; Burrows, J.P. Terrestrial carbon sink observed from space: Variation of growth rates and seasonal cycle amplitudes in response to interannual surface temperature variability. Atmos. Chem. Phys. 2014, 14, 133–141. [Google Scholar] [CrossRef]
  44. Michael, B.; Maximilian, R.; Noël, S.; Bramstedt, K.; Schneising, O.; Hilker, M.; Andrade, B.F.; Bovensmann, H.; Burrows, J.P.; Noia, A.D.; et al. Can a regional-scale reduction of atmospheric CO2 during the COVID-19 pandemic be detected from space? A case study for East China using satellite XCO2 retrievals. Atmos. Meas. Tech. 2021, 14, 2141–2166. [Google Scholar]
  45. Hong, S.Y.; Dudhia, J.; Chen, S.H. A Revised Approach to Ice Microphysical Processes for the Bulk Parameterization of Clouds and Precipitation. Month. Weath. Rev. 2004, 132, 103–120. [Google Scholar] [CrossRef]
  46. Kain, J.S.; Kain, J. The Kain - Fritsch convective parameterization: An update. J. Applied Meteor. 2004, 43, 170–181. [Google Scholar] [CrossRef]
  47. Mlawer, E.J.; Taubman, S.J.; Brown, P.D.; Iacono, M.J.; Clough, S.A. Radiative transfer for inhomogeneous atmospheres: RRTM, a validated correlated-k model for the longwave. J. Geophys. Res. Bio. 1997, 102, 16663–16682. [Google Scholar] [CrossRef]
  48. Dudhia, J. Numerical Study of Convection Observed during the Winter Monsoon Experiment Using a Mesoscale Two-Dimensional Model. J. Atmos. Sci. 1989, 46, 3077–3107. [Google Scholar] [CrossRef]
  49. Anderson, J.L. An ensemble adjustment Kalman filter for data assimilation. Month. Weath. Rev. 2001, 129, 2884–2903. [Google Scholar] [CrossRef]
  50. Schuldt, K.N.; Mund, J.; Aalto, T.; Abshire, J.B.; Aikin, K.; Allen, G.; Andrade, M.; Andrews, A.; Apadula, F.; Arnold, S.; et al. Multi-Laboratory Compilation of Atmospheric Carbon Dioxide DATA for the period 1957–2023. obspack_co2_1_GLOBALVIEWplus_v10.1_2024-11-13. 2024. Available online: https://gml.noaa.gov/ccgg/obspack/citation.php (accessed on 29 May 2025).
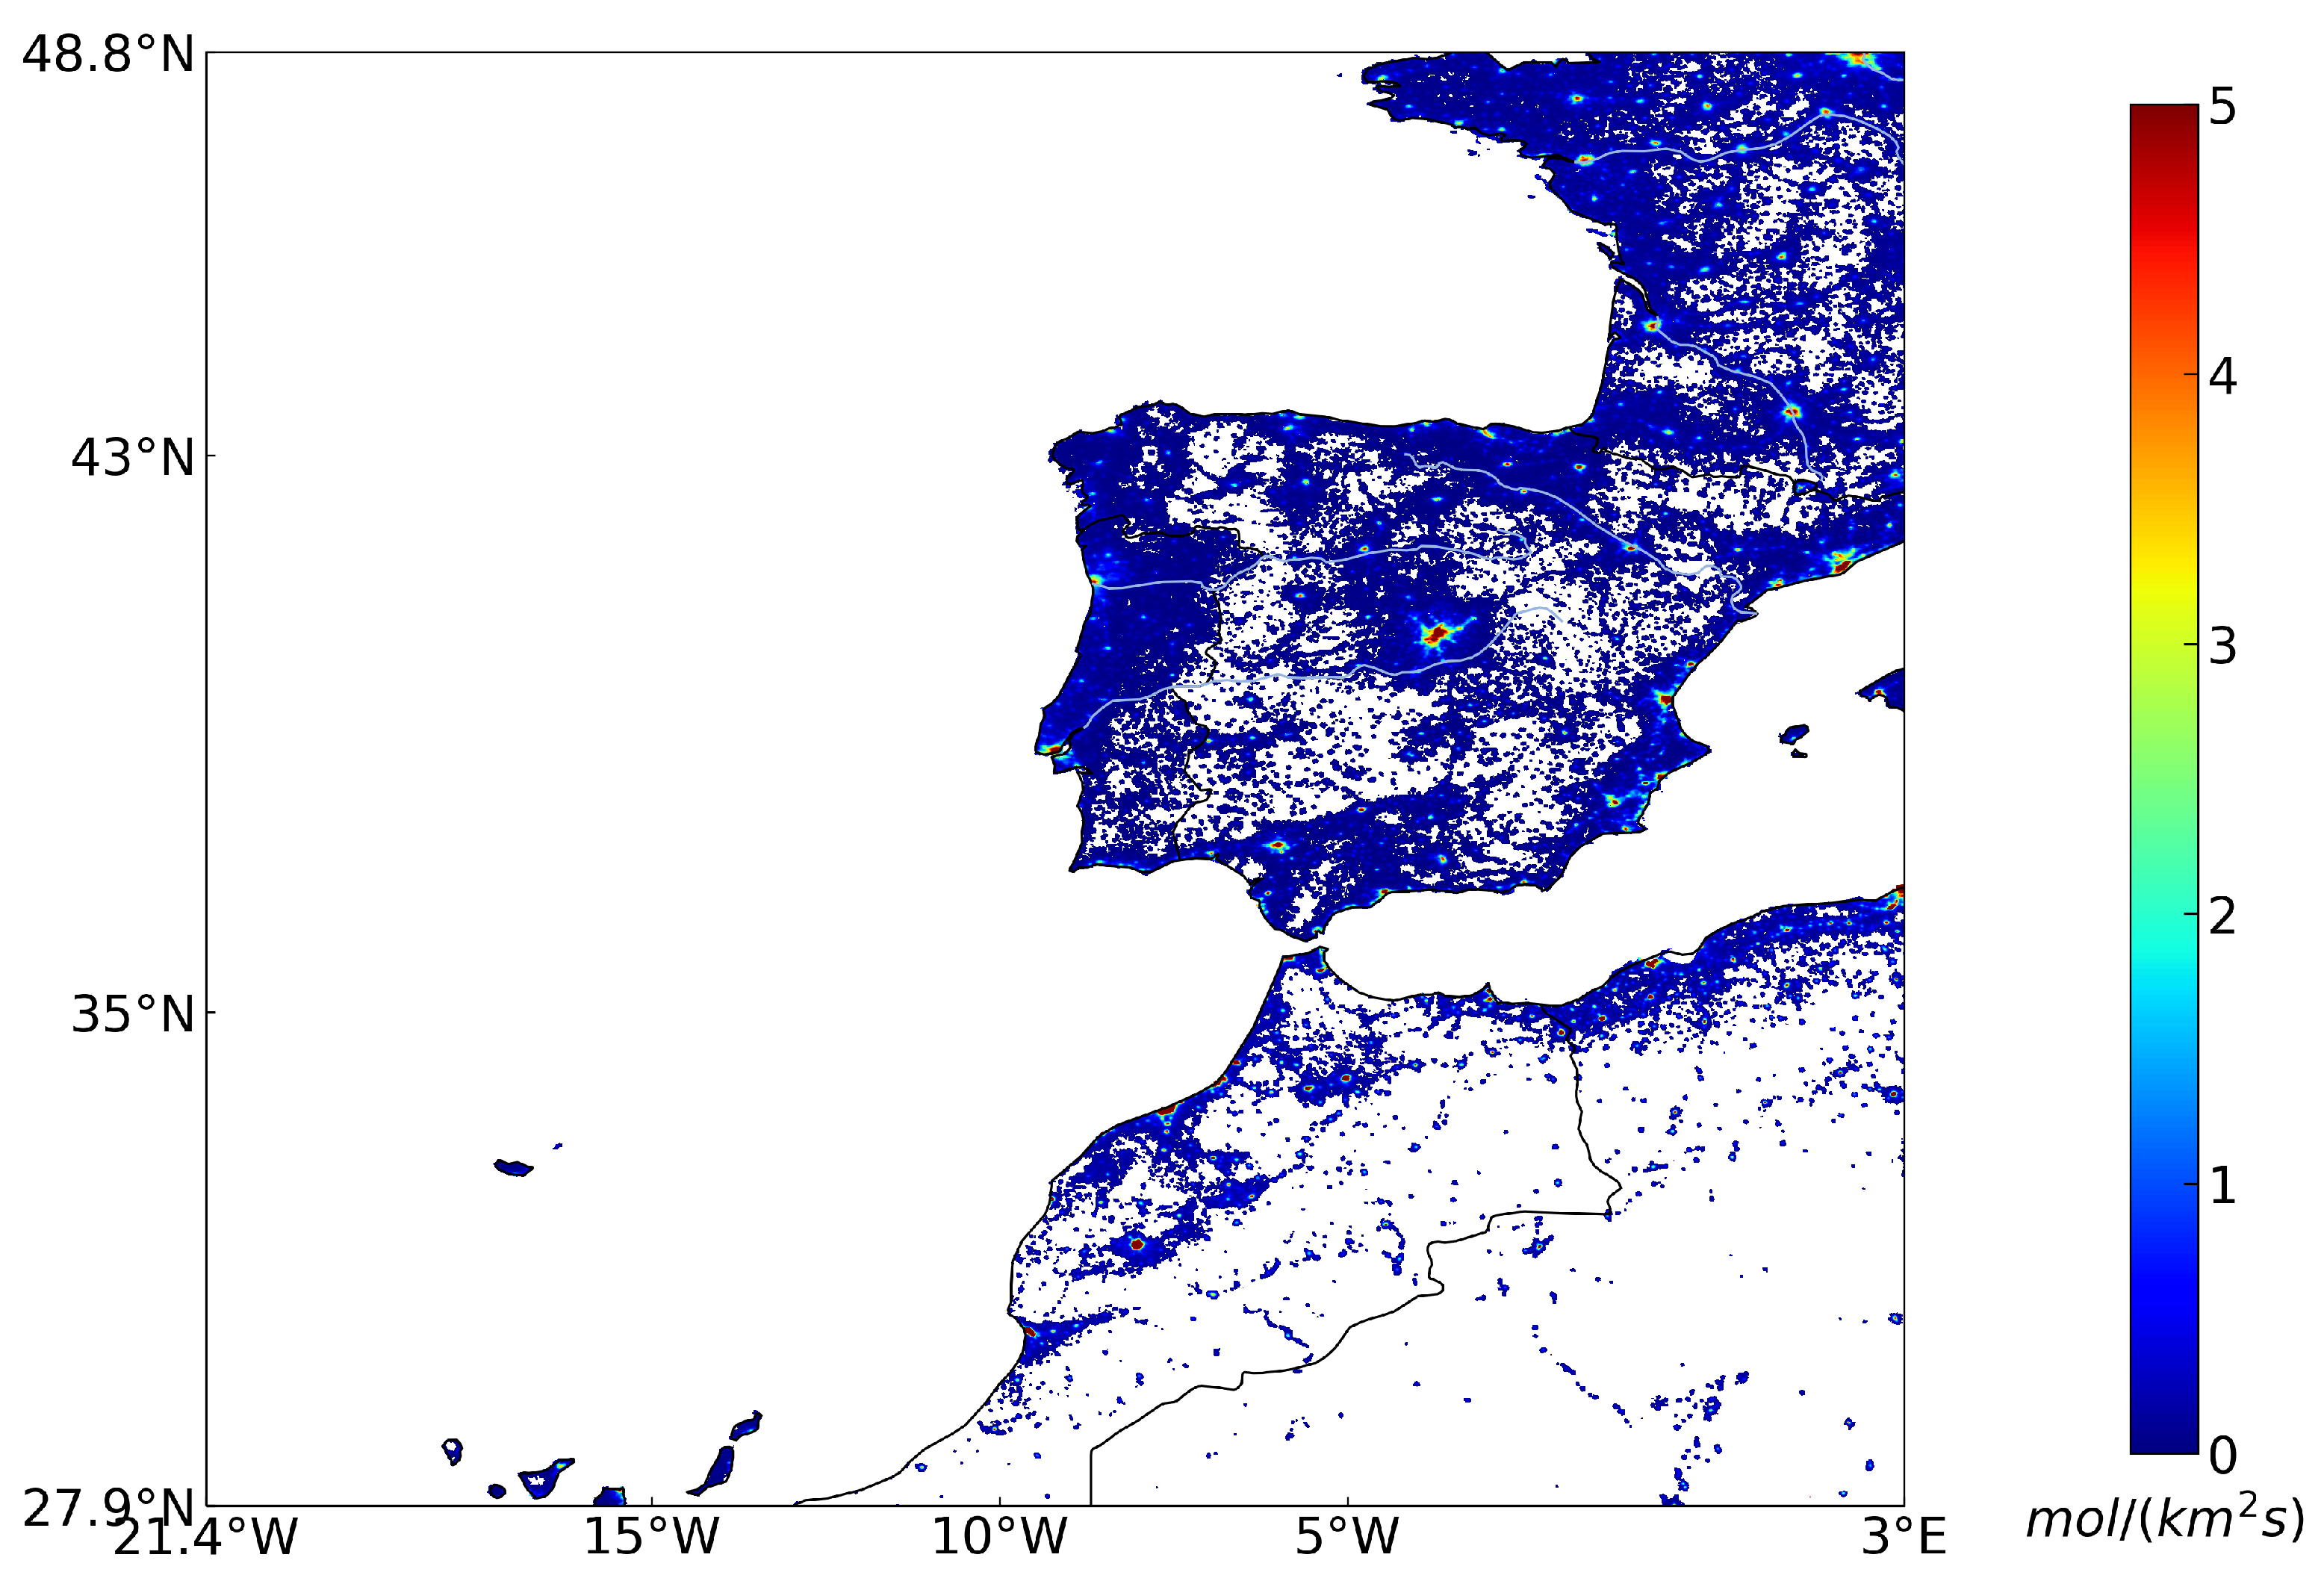
Figure 1. The ODIAC 2023 anthropogenic CO2 emissions of the outermost layer of assimilation experiment in March 2020.
Atmosphere 16 00847 g001
Figure 2. Representative 10 s mean XCO2 retrievals of OCO-2 in March 2020 over the assimilation experiment area.
Atmosphere 16 00847 g002
Figure 3. The structure of the CO2 concentration assimilation system.
Atmosphere 16 00847 g003
Figure 4. Research area of assimilation experiment.
Atmosphere 16 00847 g004
Figure 5. The monthly mean CO2, XCO2 concentration and flux distribution for our assimilation experiment during March 2020. (a) D01 domain, (b) D02 domain, (c) D03 domain.
Atmosphere 16 00847 g005
Figure 6. The monthly mean CO2, XCO2 concentration and flux distribution for assimilation experiment of Lisbon during March 2020. (a) The monthly mean CO2 distribution, (b) The monthly mean XCO2 distribution, (c) The monthly mean CO2 fluxes.
Atmosphere 16 00847 g006
Figure 7. The assimilation XCO2 result compared with two TCCON sites. (a) Orléans ( 47.97 N, 2.113 E); (b) Paris ( 48.846 N, 2.356 E).
Atmosphere 16 00847 g007
Figure 8. The assimilation CO2 result compared with ObaPack data in D01 domain, March 2020.
Atmosphere 16 00847 g008
Figure 9. The distribution of the monthly mean CO2 concentration in D01 domain March 2020. (a) CO2 assimilation results, (b) ObsPack data.
Atmosphere 16 00847 g009
Table 1. The WRF-Chem parameter configuration setting.
OptionsConfigurations
WRF_CoreARW
Domain center38.717° N, −9.133° W
Max_dom3
Grid resolution27 km, 9 km, 3 km
Vertical level( nz)48
Nx_CR, Nx_FR, Nx_IR90, 76, 64
Ny_CR, Ny_FR, Ny_IR90, 76, 64
Interval seconds21,600 s/6 h
Time steps90 s
Start date1 March 2020 00:00:00
End date31 March 2020 18:00:00
Microphysics processWSM 5-class simple ice scheme [43]
Cumulus parameterizationKain–Fritsch scheme [44]
Longwave atmospheric radiationRRTM scheme [45]
Shortwave atmospheric radiationDudhia scheme [46]
Planetary boundary layer schemeMYNN 2.5 level TKE [47]
Surface layer schemeMYNN [48]
Land surface schemeUnified Noah Land surface model
Chemistry optionchem_opt = 16 (CO2 only)
Table 2. The assimilation XCO2 results compared with TCCON sites with hourly average.
Vs. OrléansVs. Paris
TCCONDA ExperimentTCCONDA Experiment
Numer16397332313733
Mean XCO2414.78 ppm414.47 ppm413.85 ppm415.01 ppm
Δ X C O 2 0.31 ppm1.16 ppm
Table 3. The assimilation CO2 results compared with ObsPack.
ObsPackDA Experiment
Numer1313
Mean CO2420.81 ppm418.55 ppm
Δ C O 2 2.26 ppm
MBE2.25 ppm
MAE2.59 ppm
RMSE4.06 ppm
CORR0.68
Disclaimer/Publisher’s Note: The statements, opinions and data contained in all publications are solely those of the individual author(s) and contributor(s) and not of MDPI and/or the editor(s). MDPI and/or the editor(s) disclaim responsibility for any injury to people or property resulting from any ideas, methods, instructions or products referred to in the content.