New Insights into Meteorological and Hydrological Drought Modeling: A Comparative Analysis of Parametric and Non-Parametric Distributions
Abstract
1. Introduction
2. Methodology
2.1. Standardized Drought Indices (DIs)
2.1.1. Standardized Precipitation Index (SPI)
2.1.2. Standardized Precipitation Evapotranspiration Index (SPEI)
2.1.3. Streamflow Drought Index (SDI)
2.2. Theoretical Probability Distribution Function (PDFs)
2.3. Empirical Probability Distribution Function
2.4. Comparison Scheme
- R2 measures the ratio of the variation in the dependent variable that may be forecasted from the independent variable(s). In the context of this study, it indicates how well the empirical or theoretical CDF-based drought indices explain the variance in the observed data. The ideal value of R2 is 1, which would indicate a strong relationship.
- Pearson’s Correlation Coefficient (CC) assesses the linear relationship between two datasets. This research measures the degree of linear correlation between drought indices derived from theoretical and empirical CDFs. A CC of +1 indicates a strong positive linear relationship, 0 indicates no linear correlation, and −1 indicates a strong negative linear relationship.
- Mean Squared Error (MSE) measures the average of the squares of the errors, specifically the average squared deviation between the theoretical and empirical CDF values. A lower MSE indicates a better fit, showing that the data points are closer to the fitted line. The ideal value of MSE is 0.
- Root Mean Squared Error (RMSE) is the square root of the mean of the squared errors and provides a measure of the magnitude of the error. Like MSE, it measures how close empirical CDF values are to the model’s values. RMSE is particularly useful because it gives a relatively high weight to large errors. The ideal RMSE value is 0, indicating no error.
- Mean Absolute Error (MAE) is the average of the absolute differences between theoretical and empirical CDF values. Unlike MSE or RMSE, MAE provides a linear error scale, allowing for an easier interpretation. A MAE of 0 indicates no error.
- Mean Bias Error (MBE) measures the average bias in the model predictions, the average difference between the theoretical and empirical CDF values. A positive MBE indicates a model’s tendency to overpredict, whereas a negative MBE indicates underprediction. The ideal MBE value is 0, which signifies no bias.
3. Application
4. Results
4.1. Empirical and Theoretical Cumulative Distribution Functions
4.2. Temporal Evaluation of Empirical and Theoretical CDFs
4.3. Statistical Metrics Results
4.4. Evaluating Theoretical CDFs: An Example for SPI-3
4.5. Drought Characteristics
5. Discussion
5.1. Importance of the Selected Theoretical Function
5.2. Comparison with the Existing Empirical Approaches
5.3. Comparison Between Empirical and Theoretical Approaches
5.4. Meteorological and Hydrological Droughts
5.5. Drought Characteristics
5.6. Applications, Limitations, and Future Implications
6. Conclusions
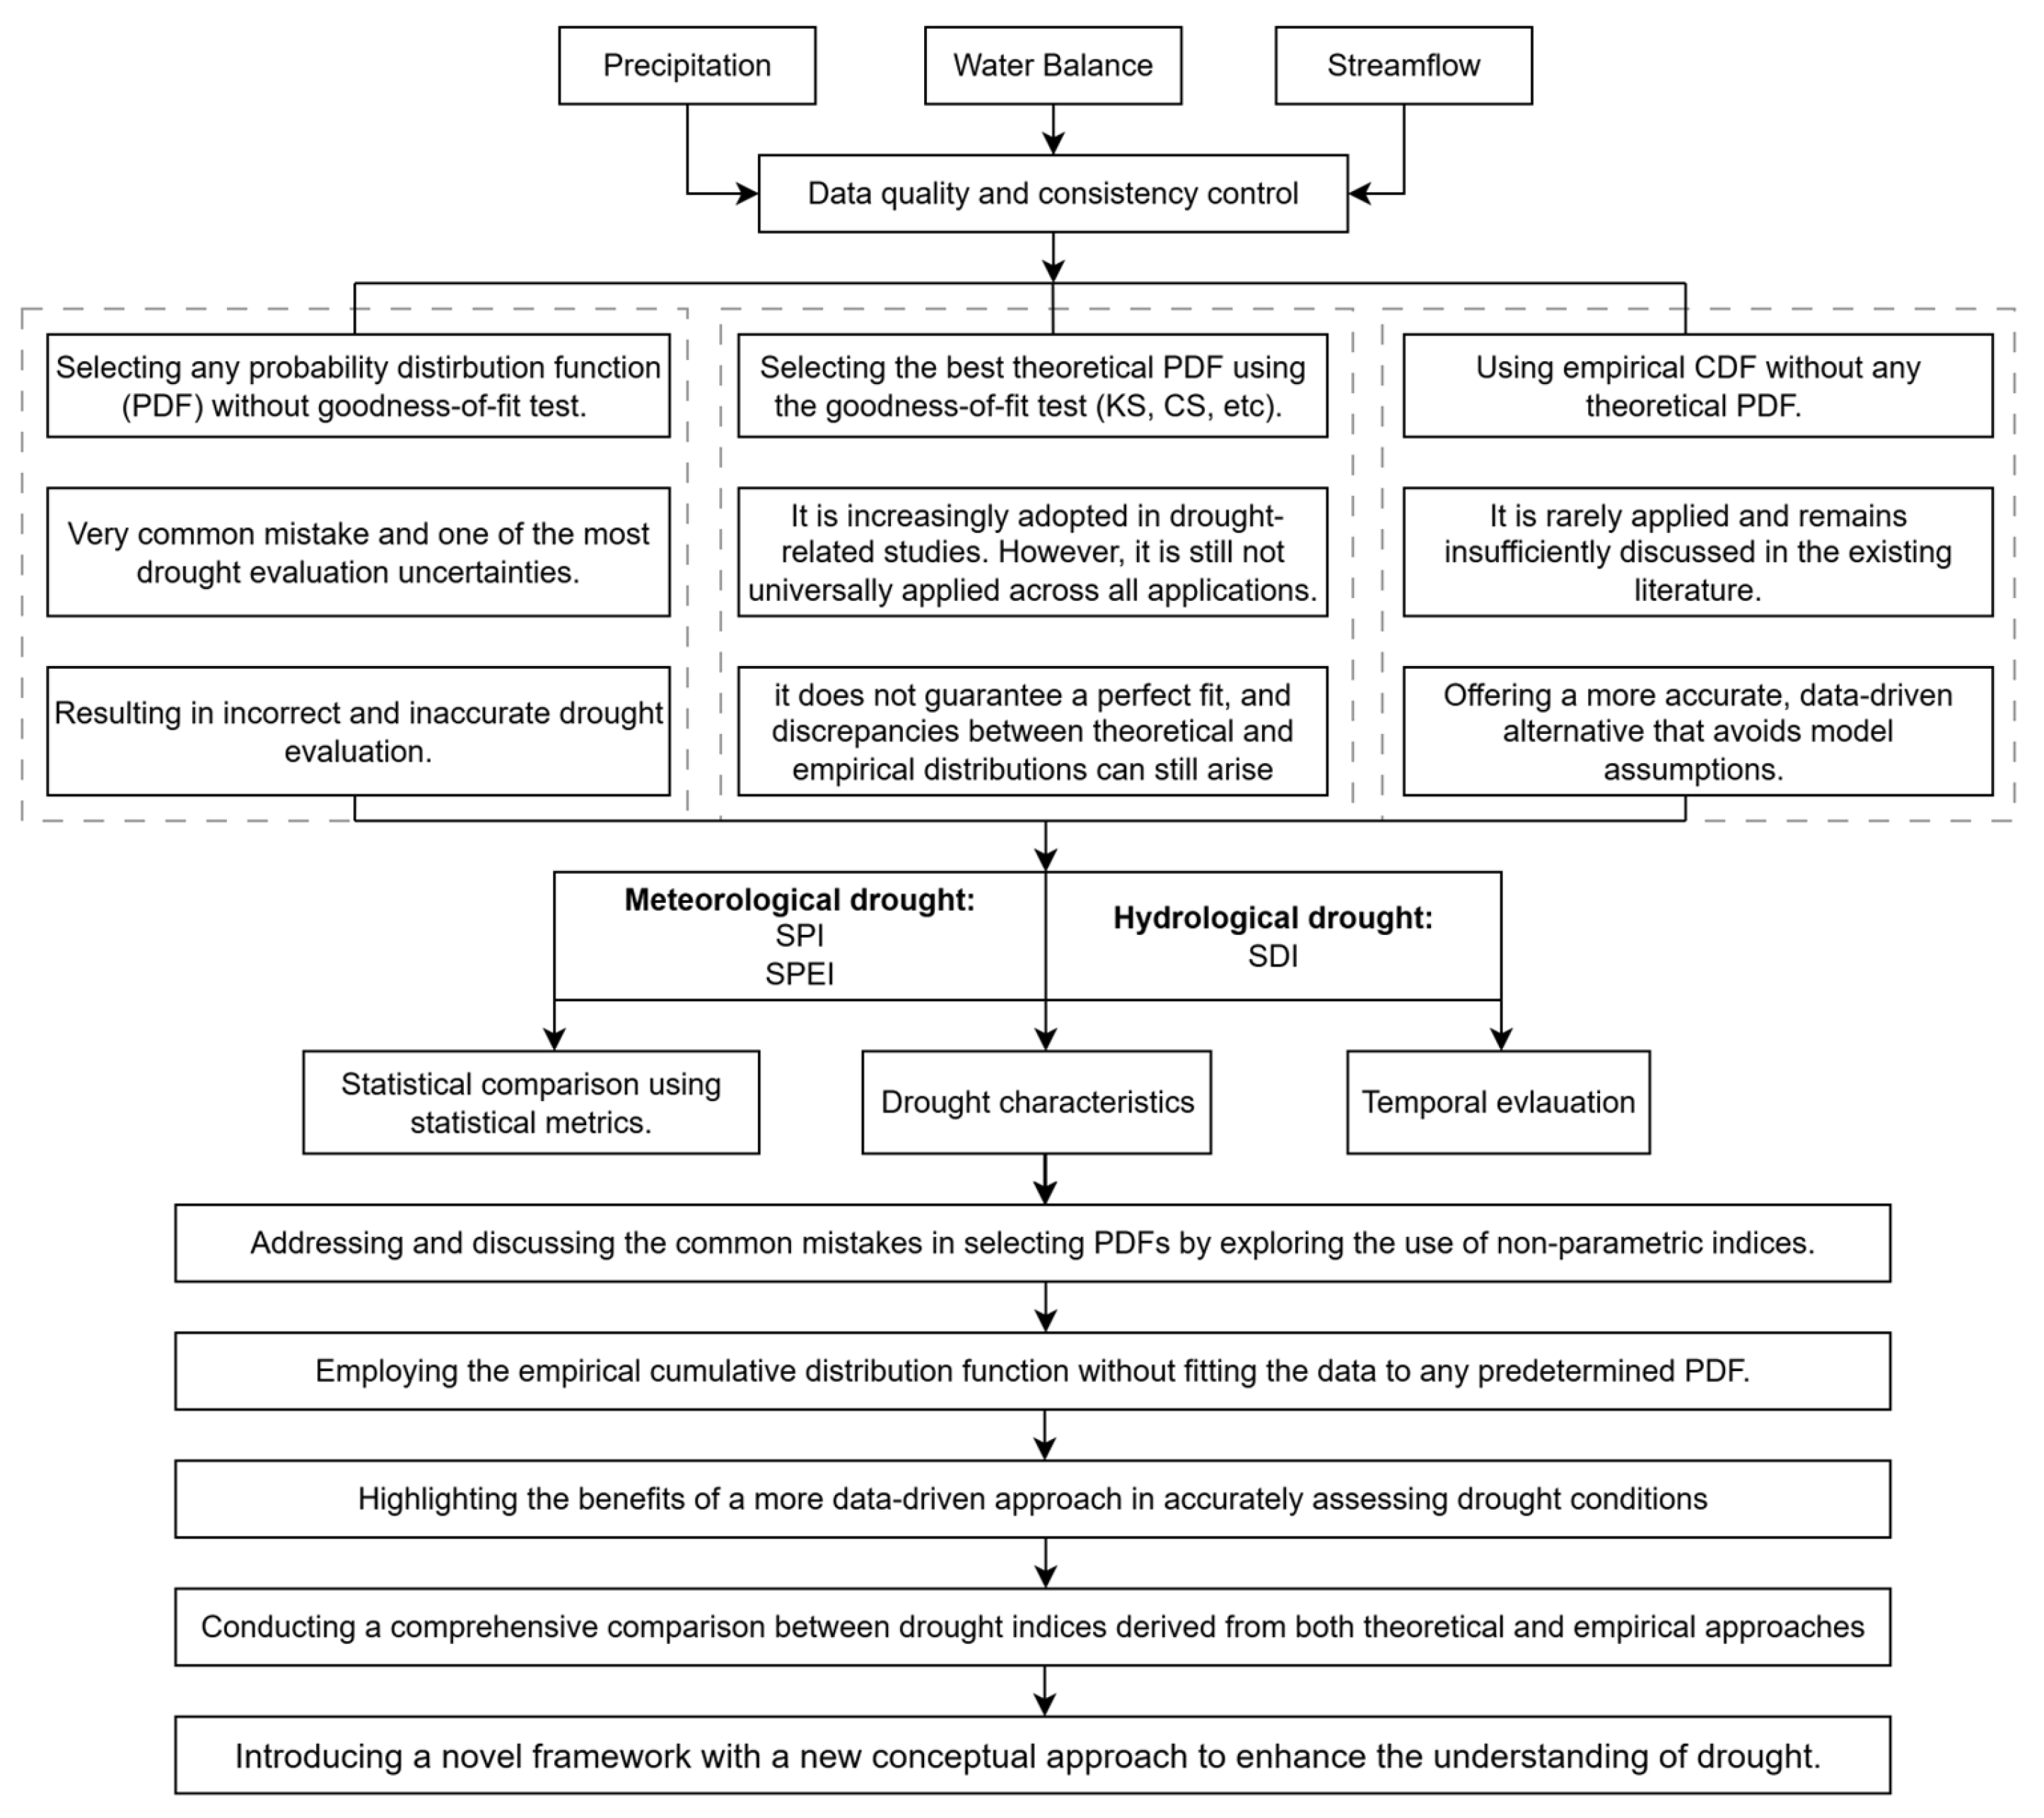
- Choosing the best theoretical CDF through goodness-of-fit tests is essential for precise drought assessment.
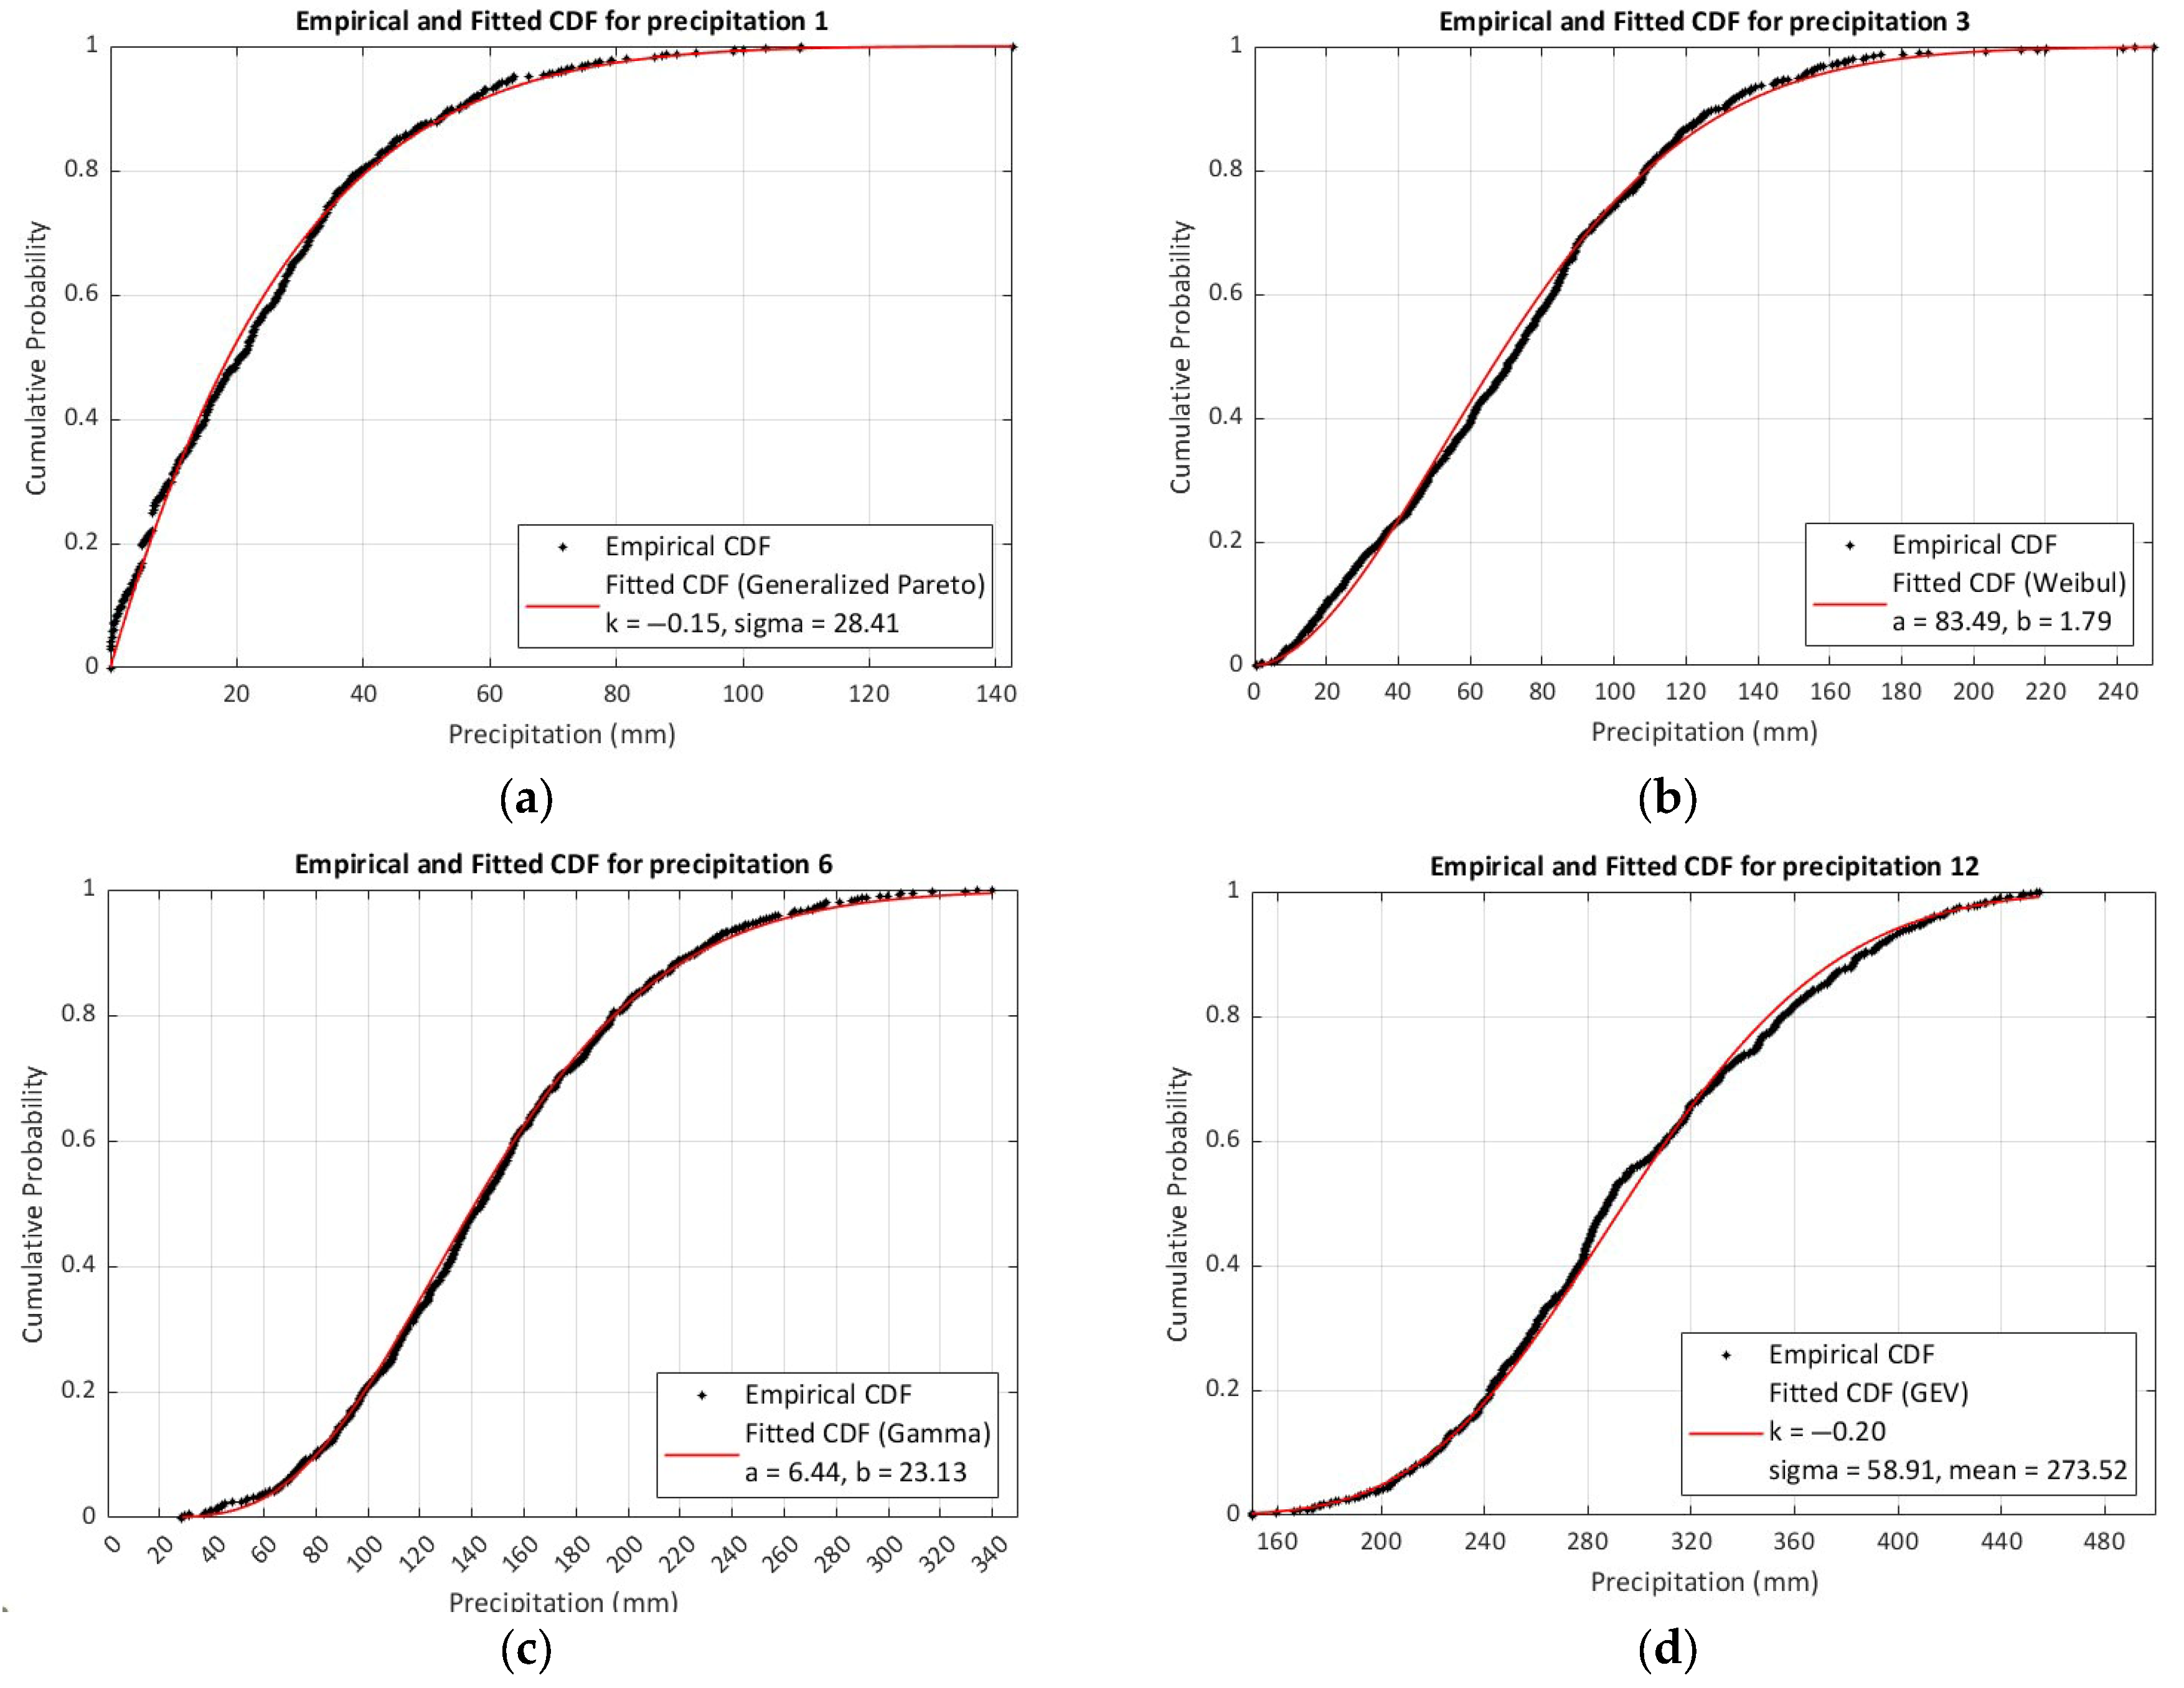
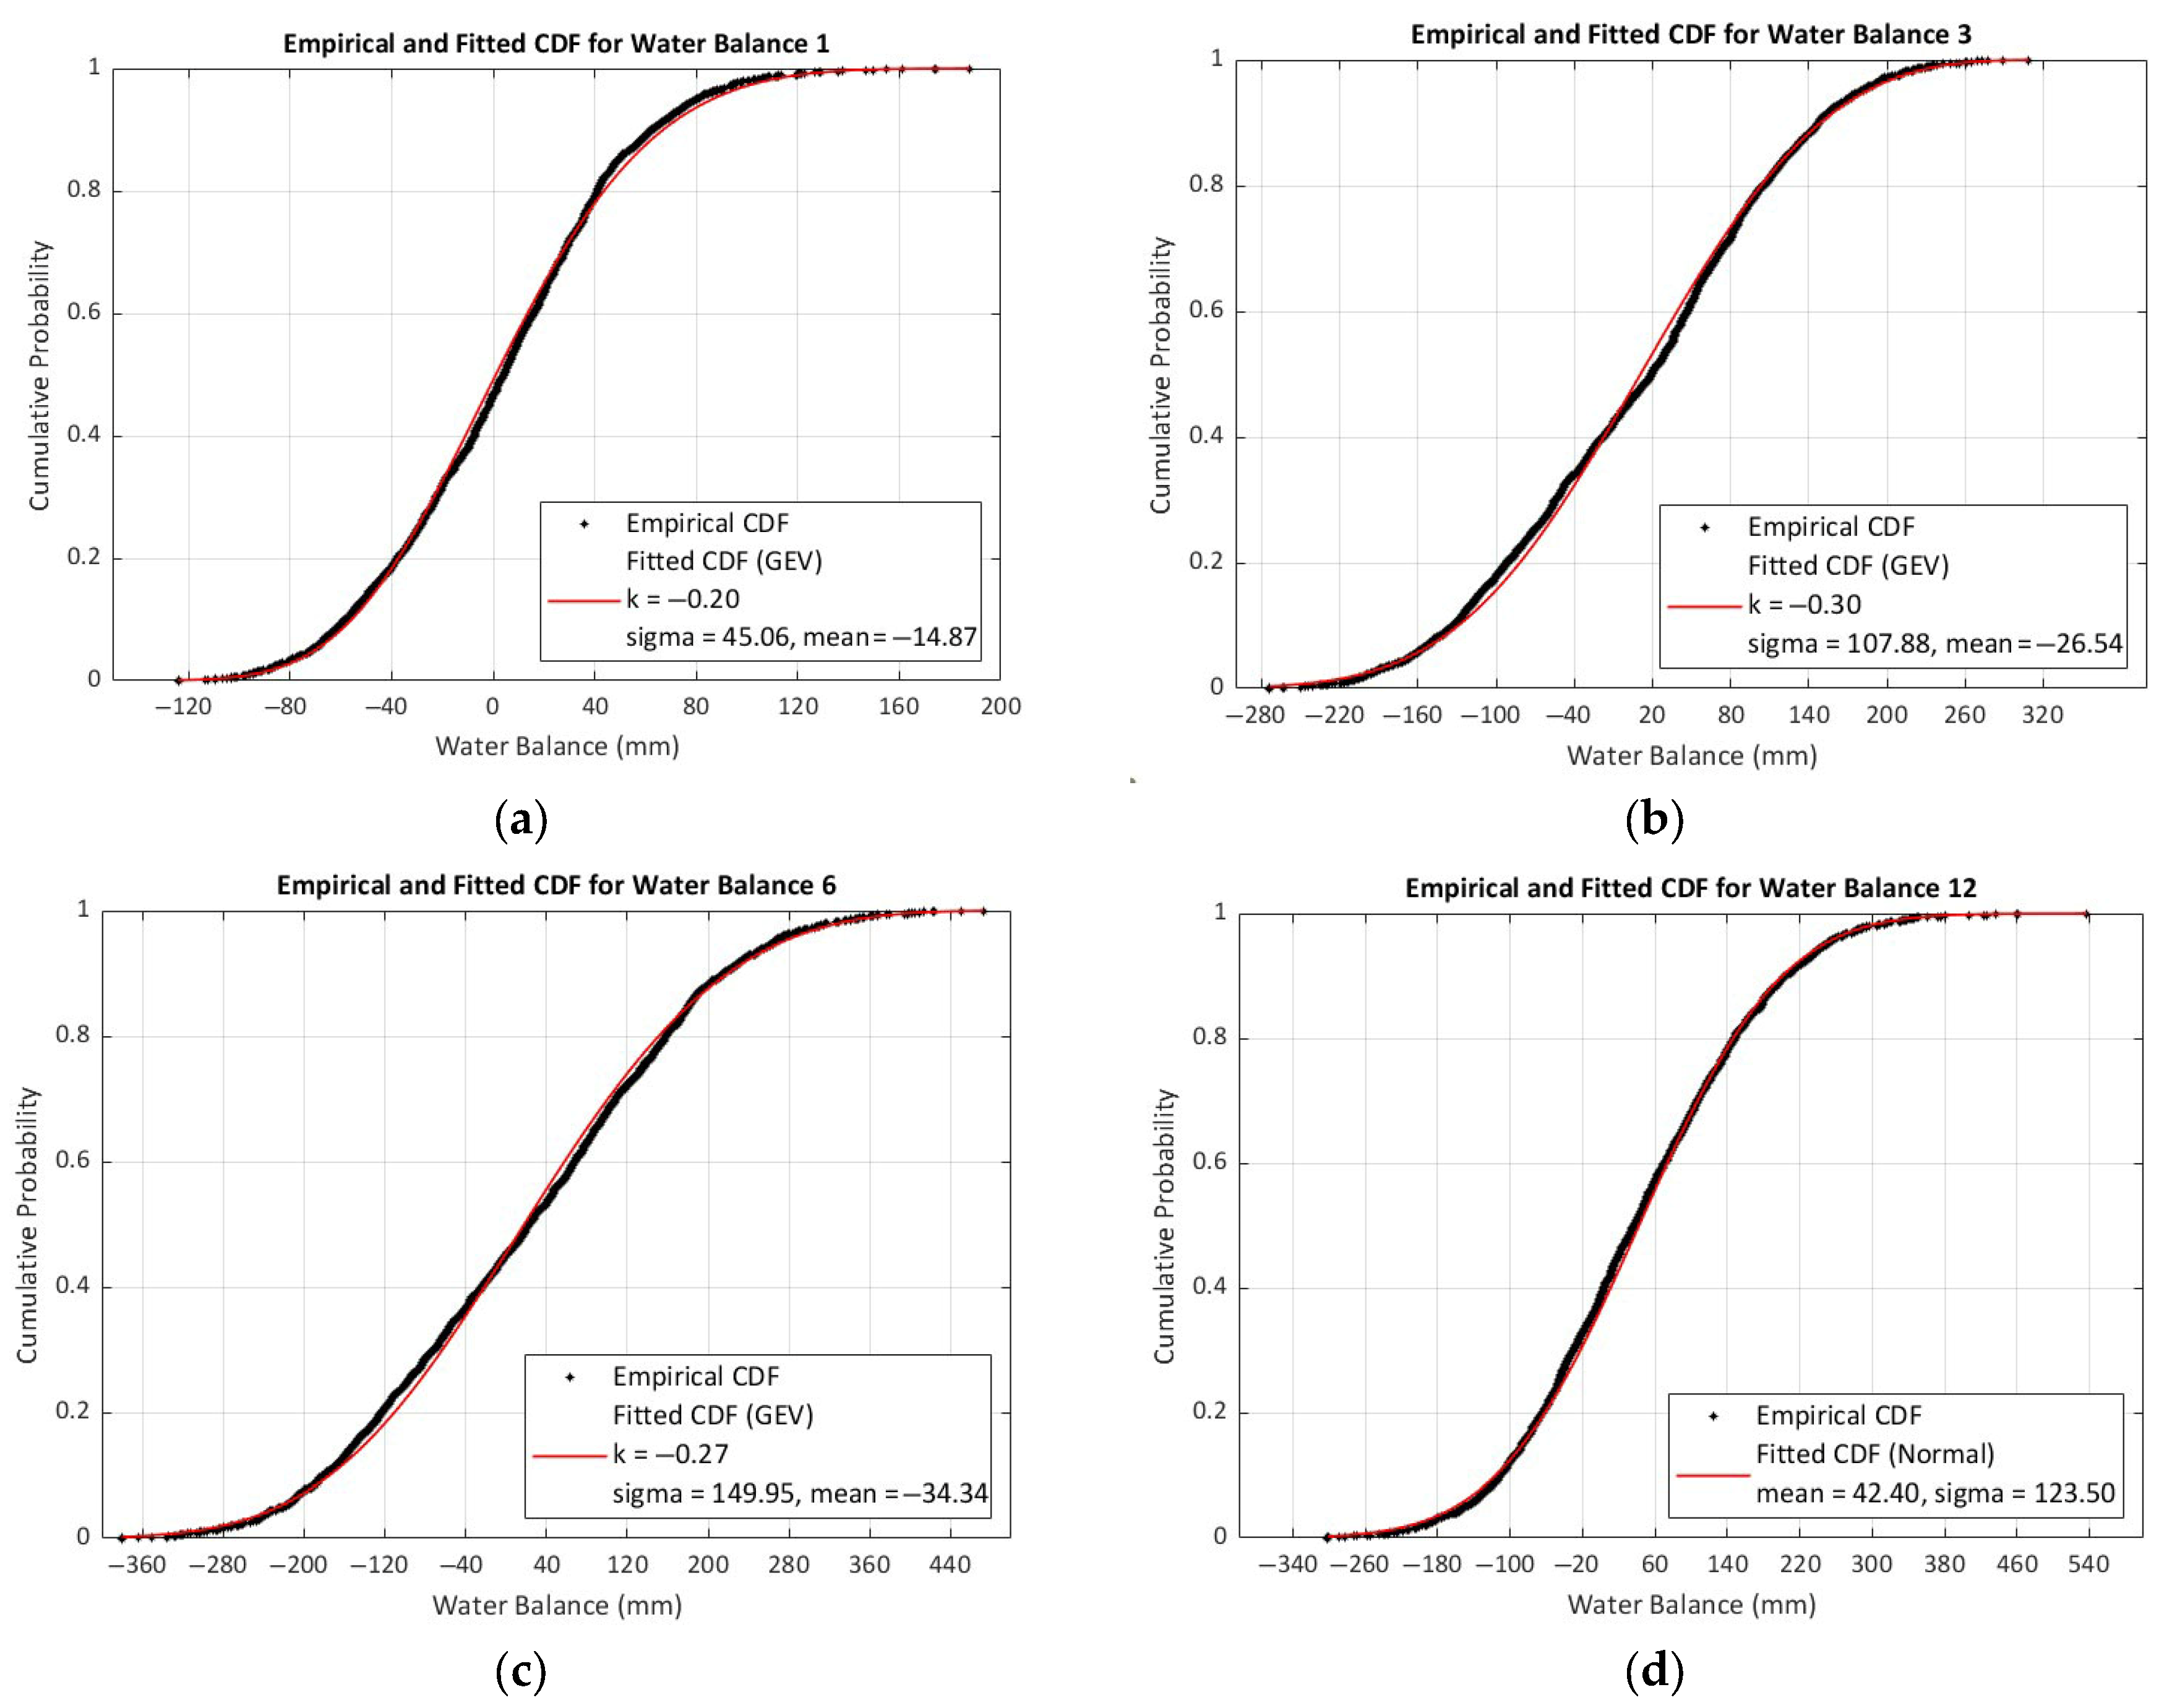
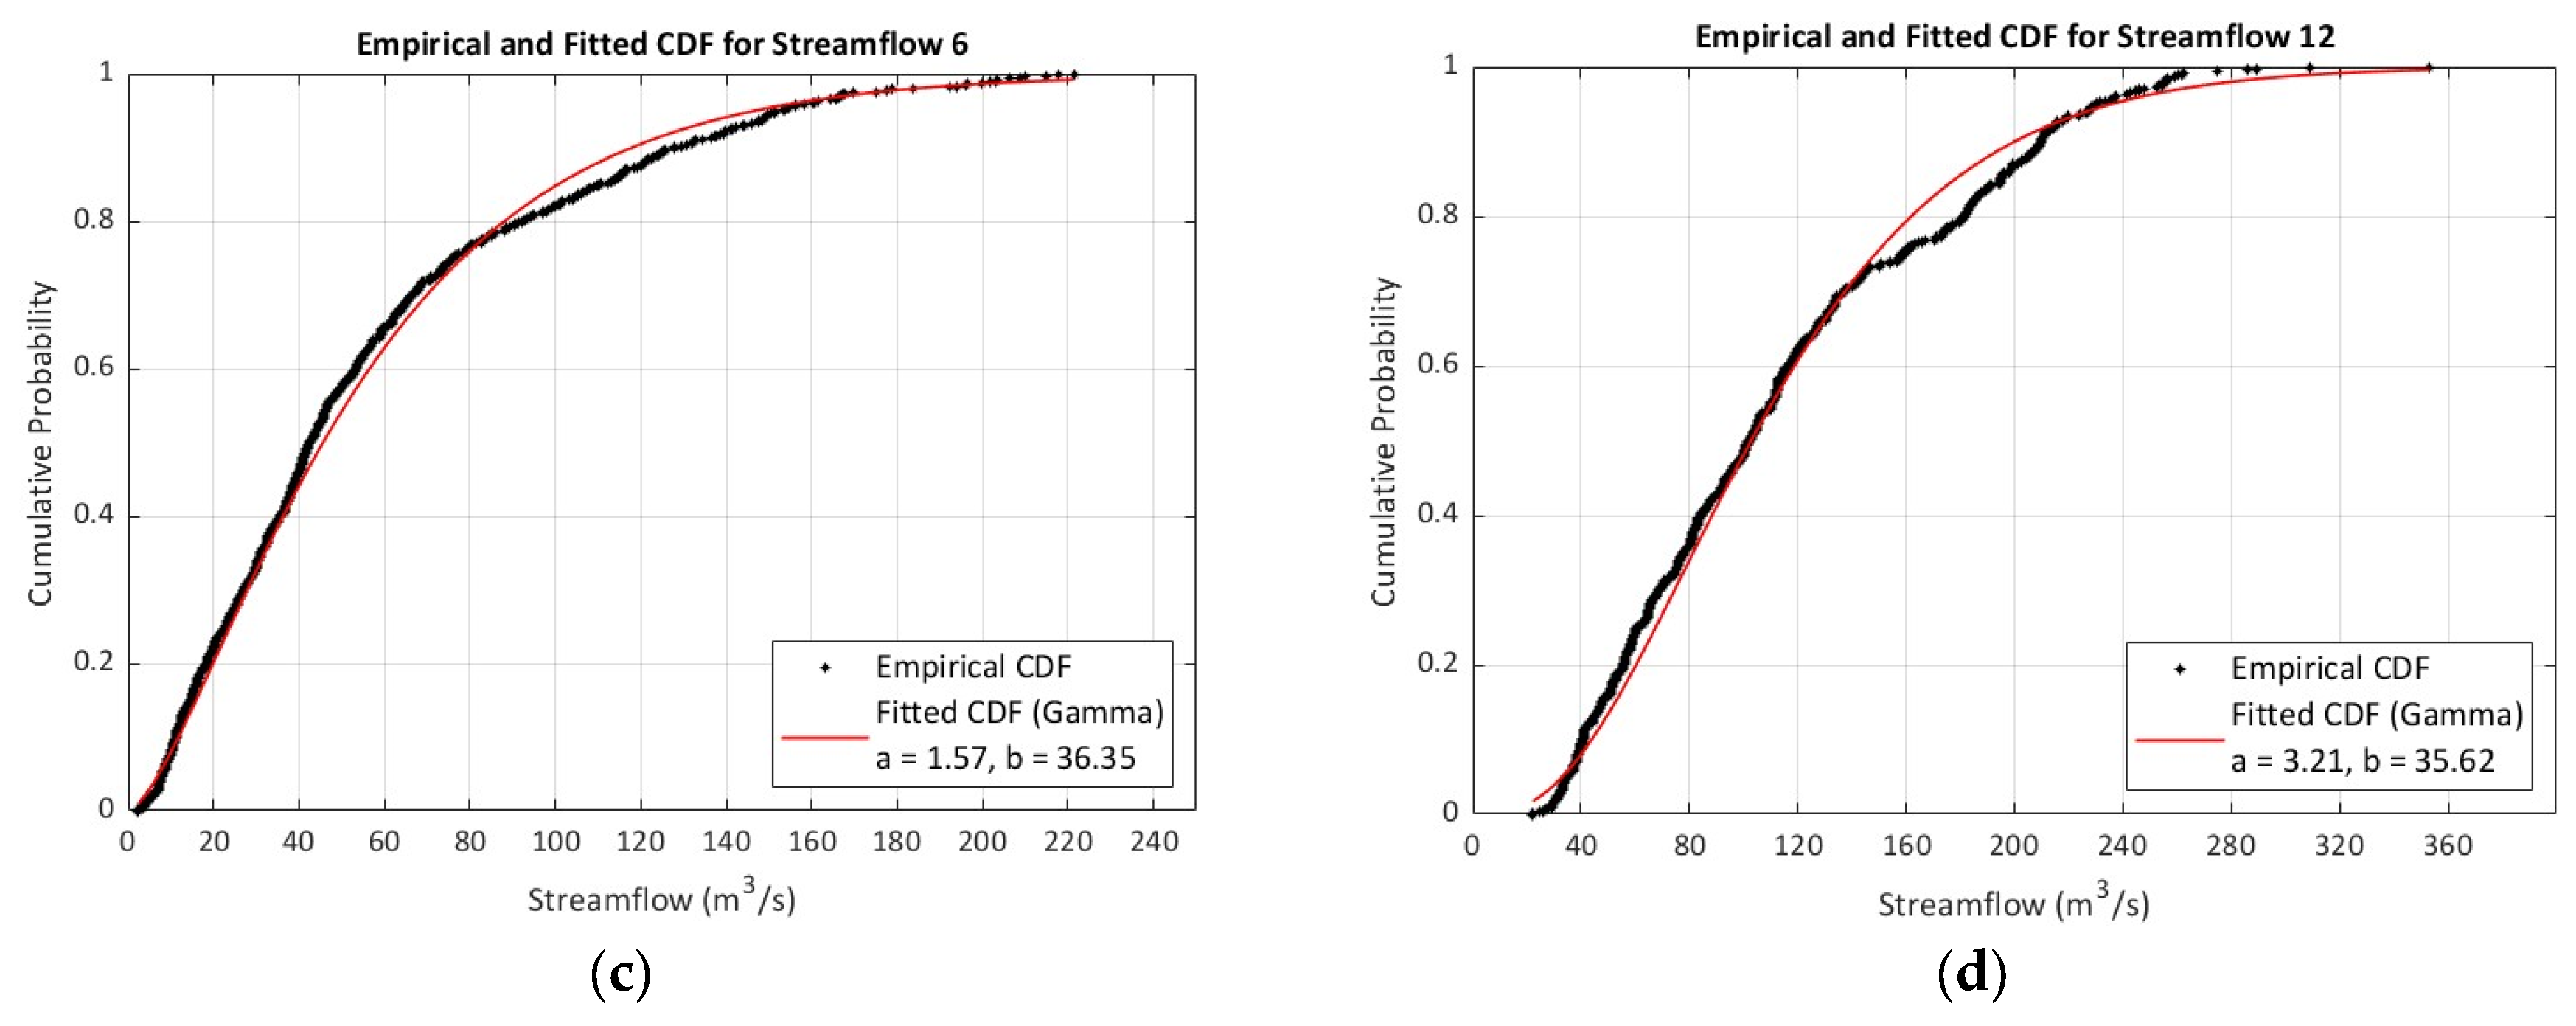
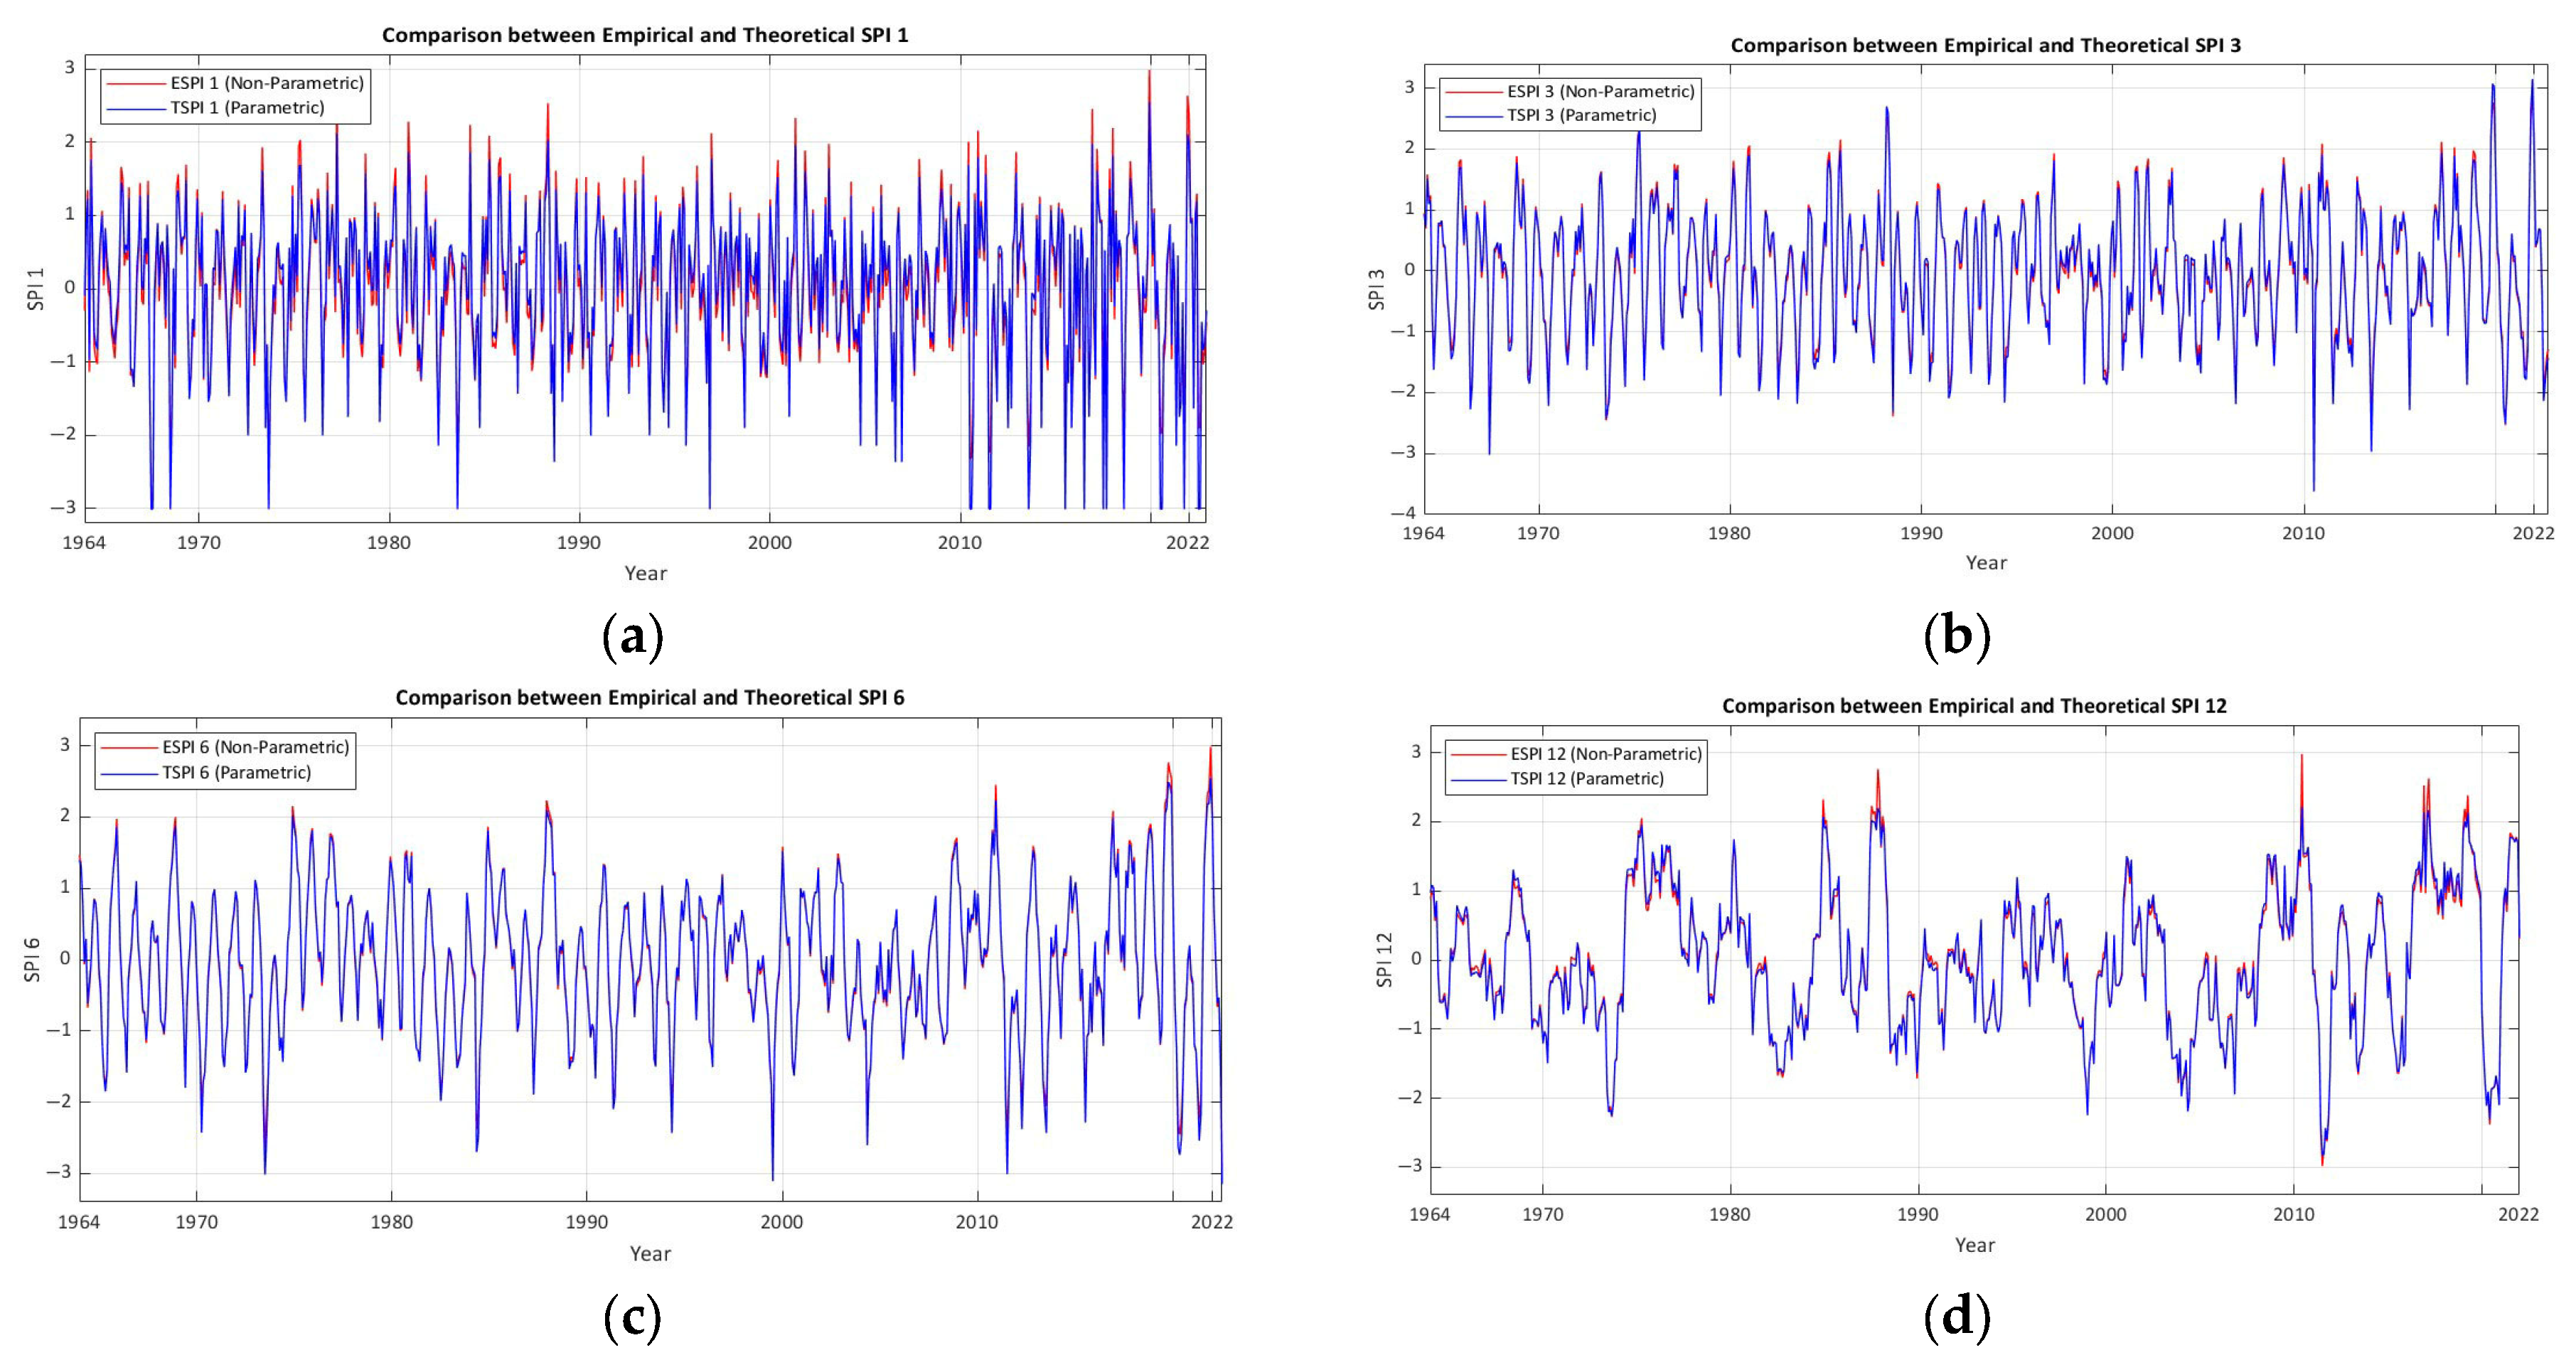
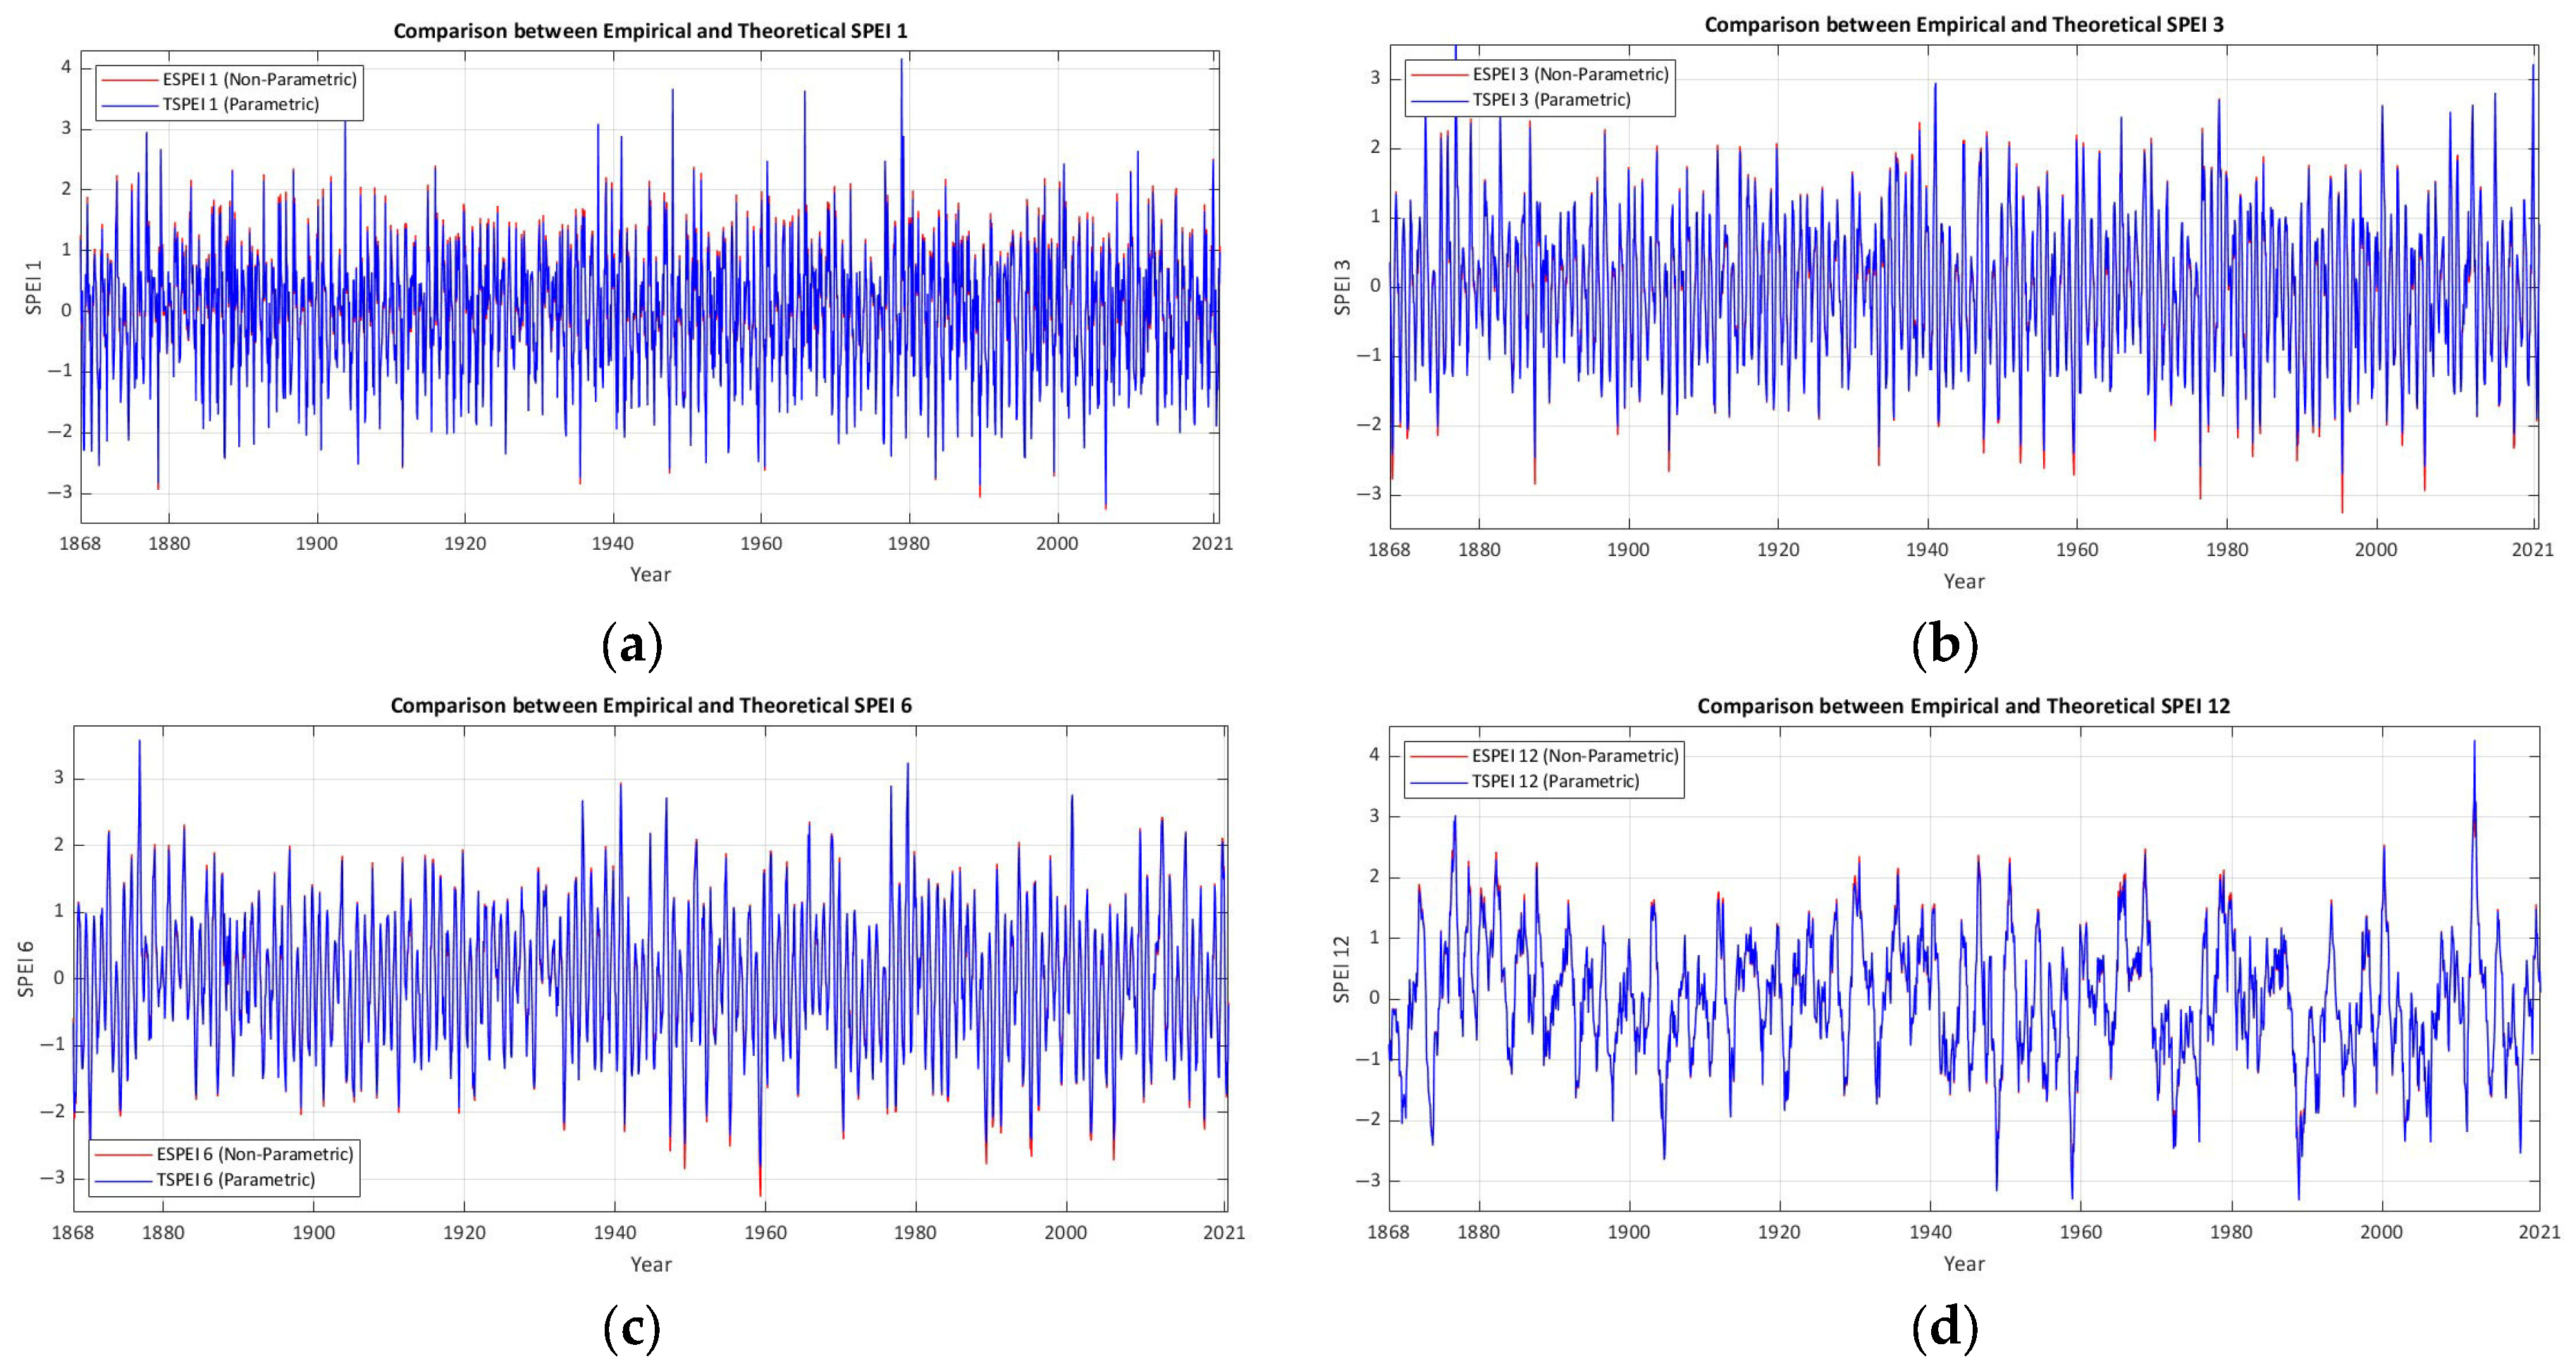
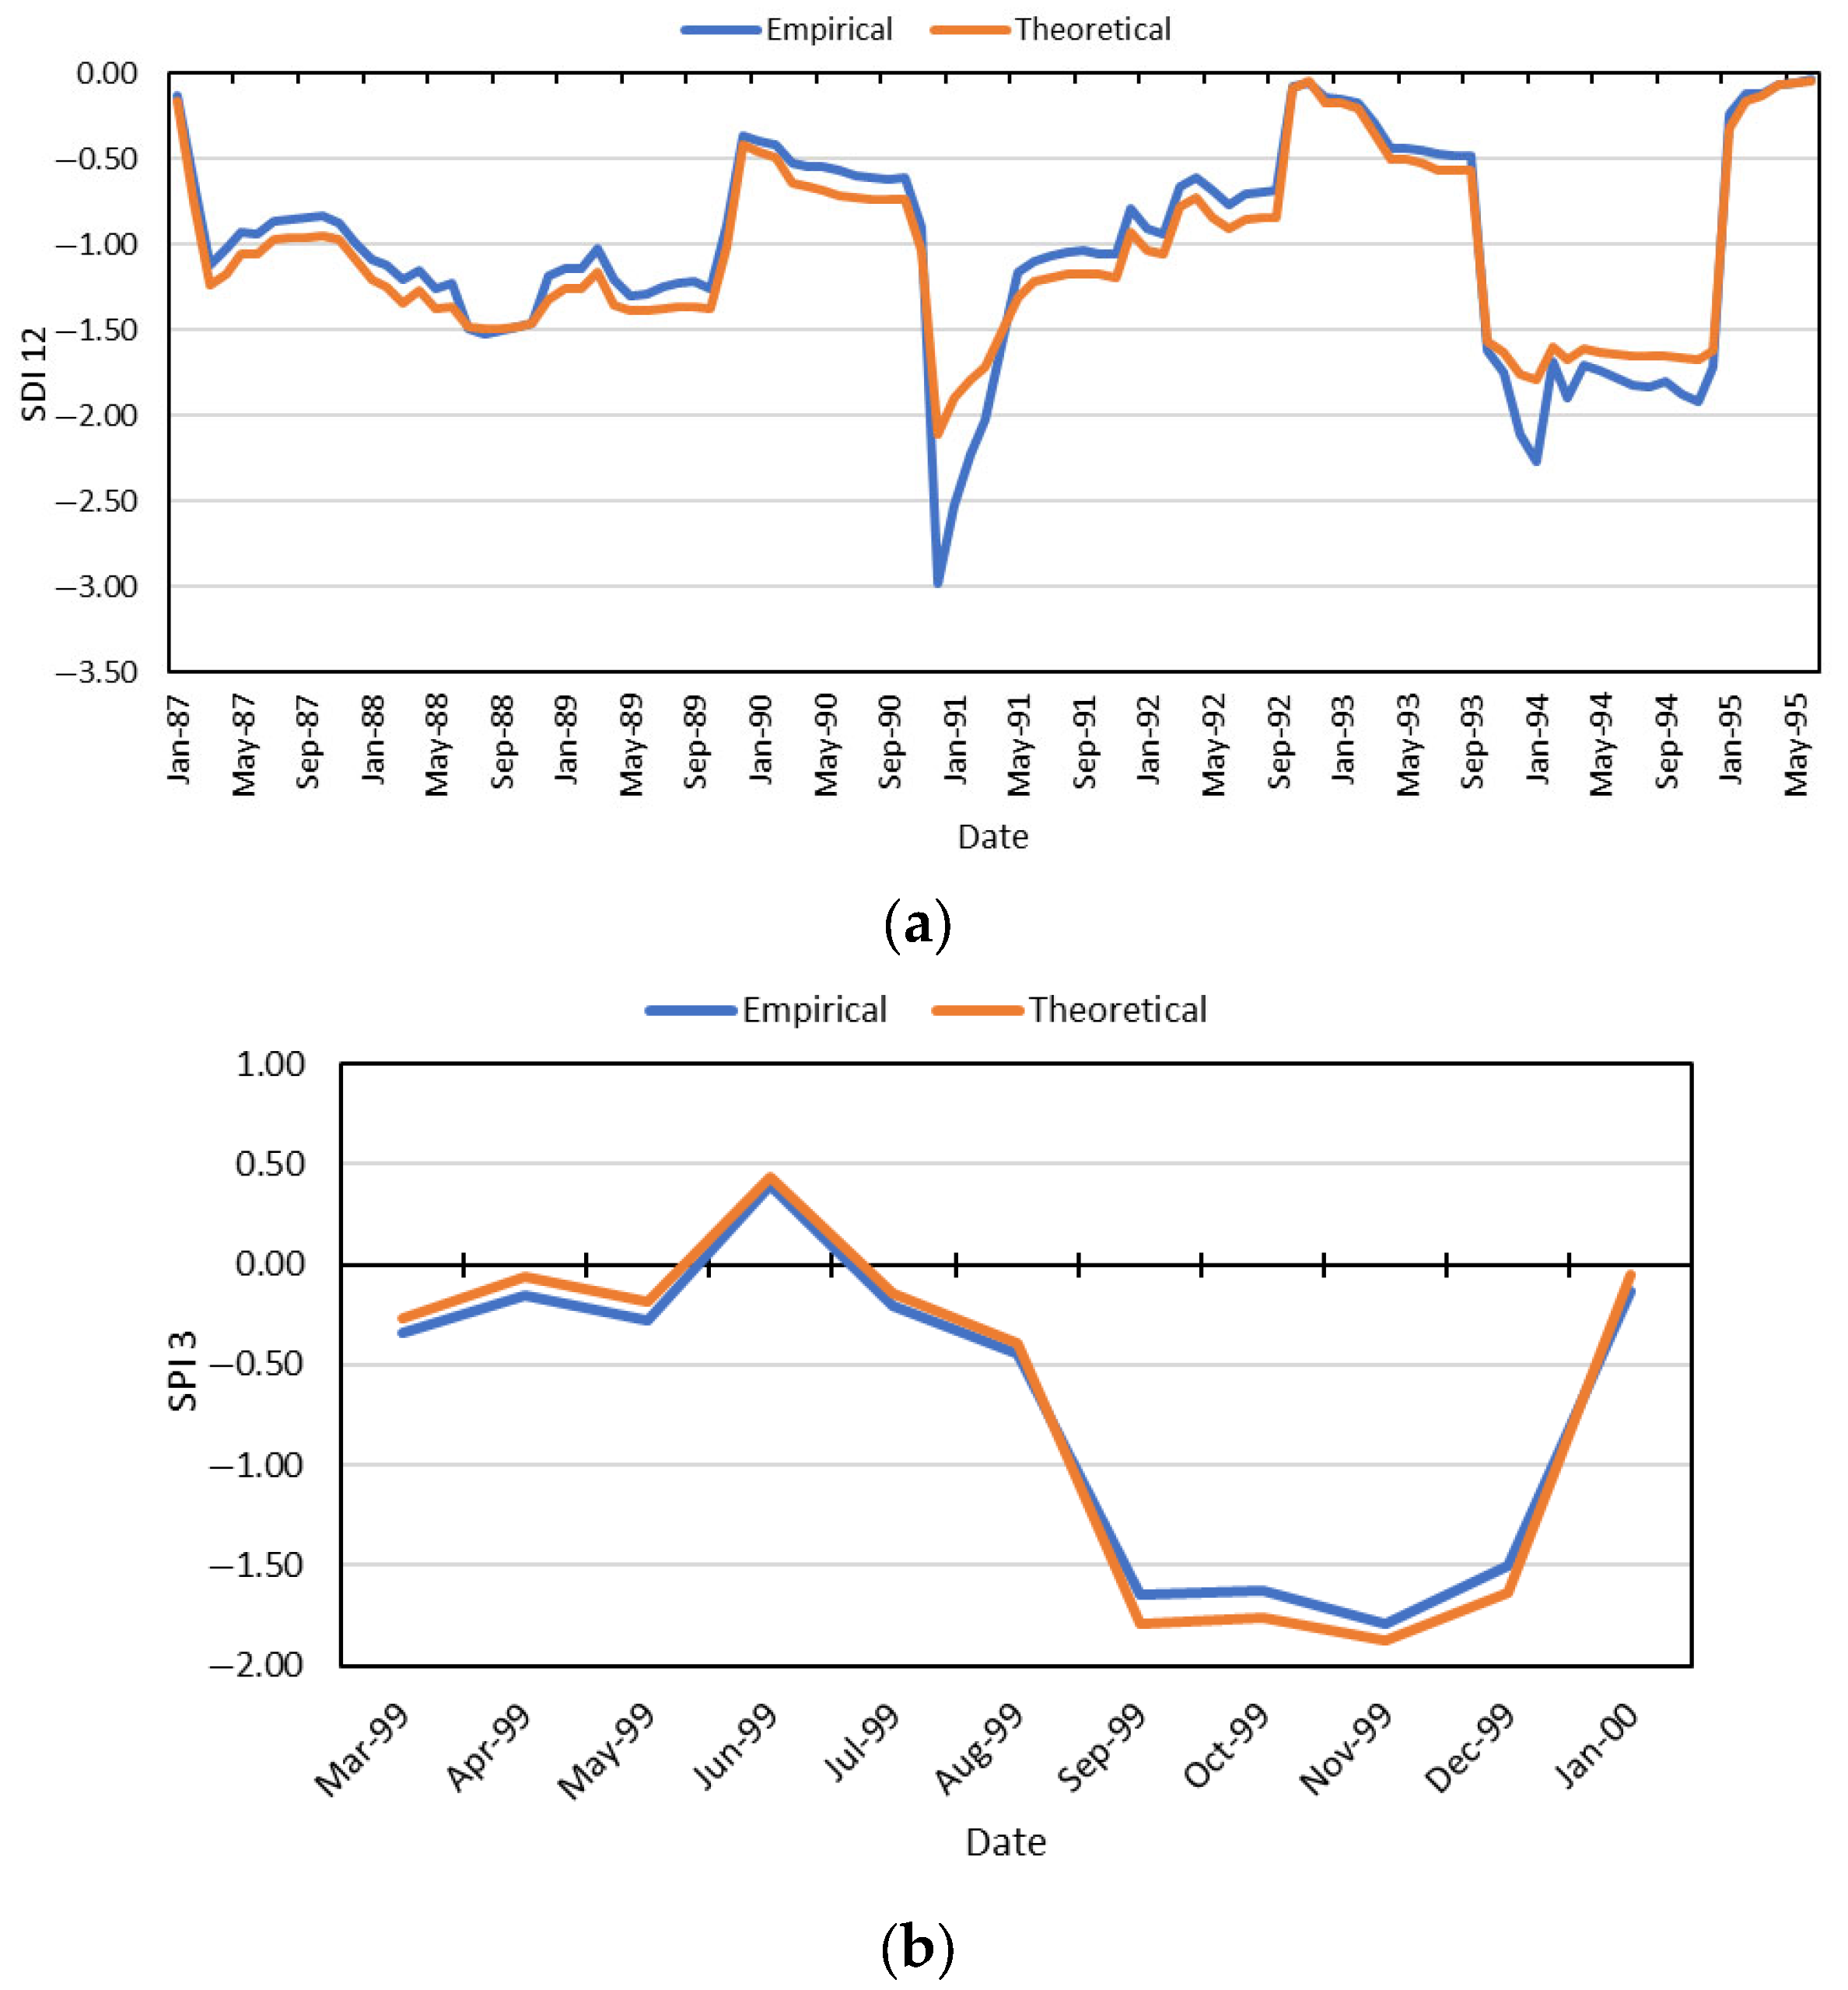
- Despite selecting suitable theoretical CDFs, there were notable differences between theoretical and empirical CDFs, particularly for hydrological drought at long time scales (12-month).
- The assessment process must be conducted at a micro-scale rather than a macro-scale to understand the differences between theoretical and empirical CDFs.
- In certain drought events, theoretical CDFs may underestimate drought by as much as 50%. The RMSE may be up to 0.15, which is about 100% more than the empirical approach.
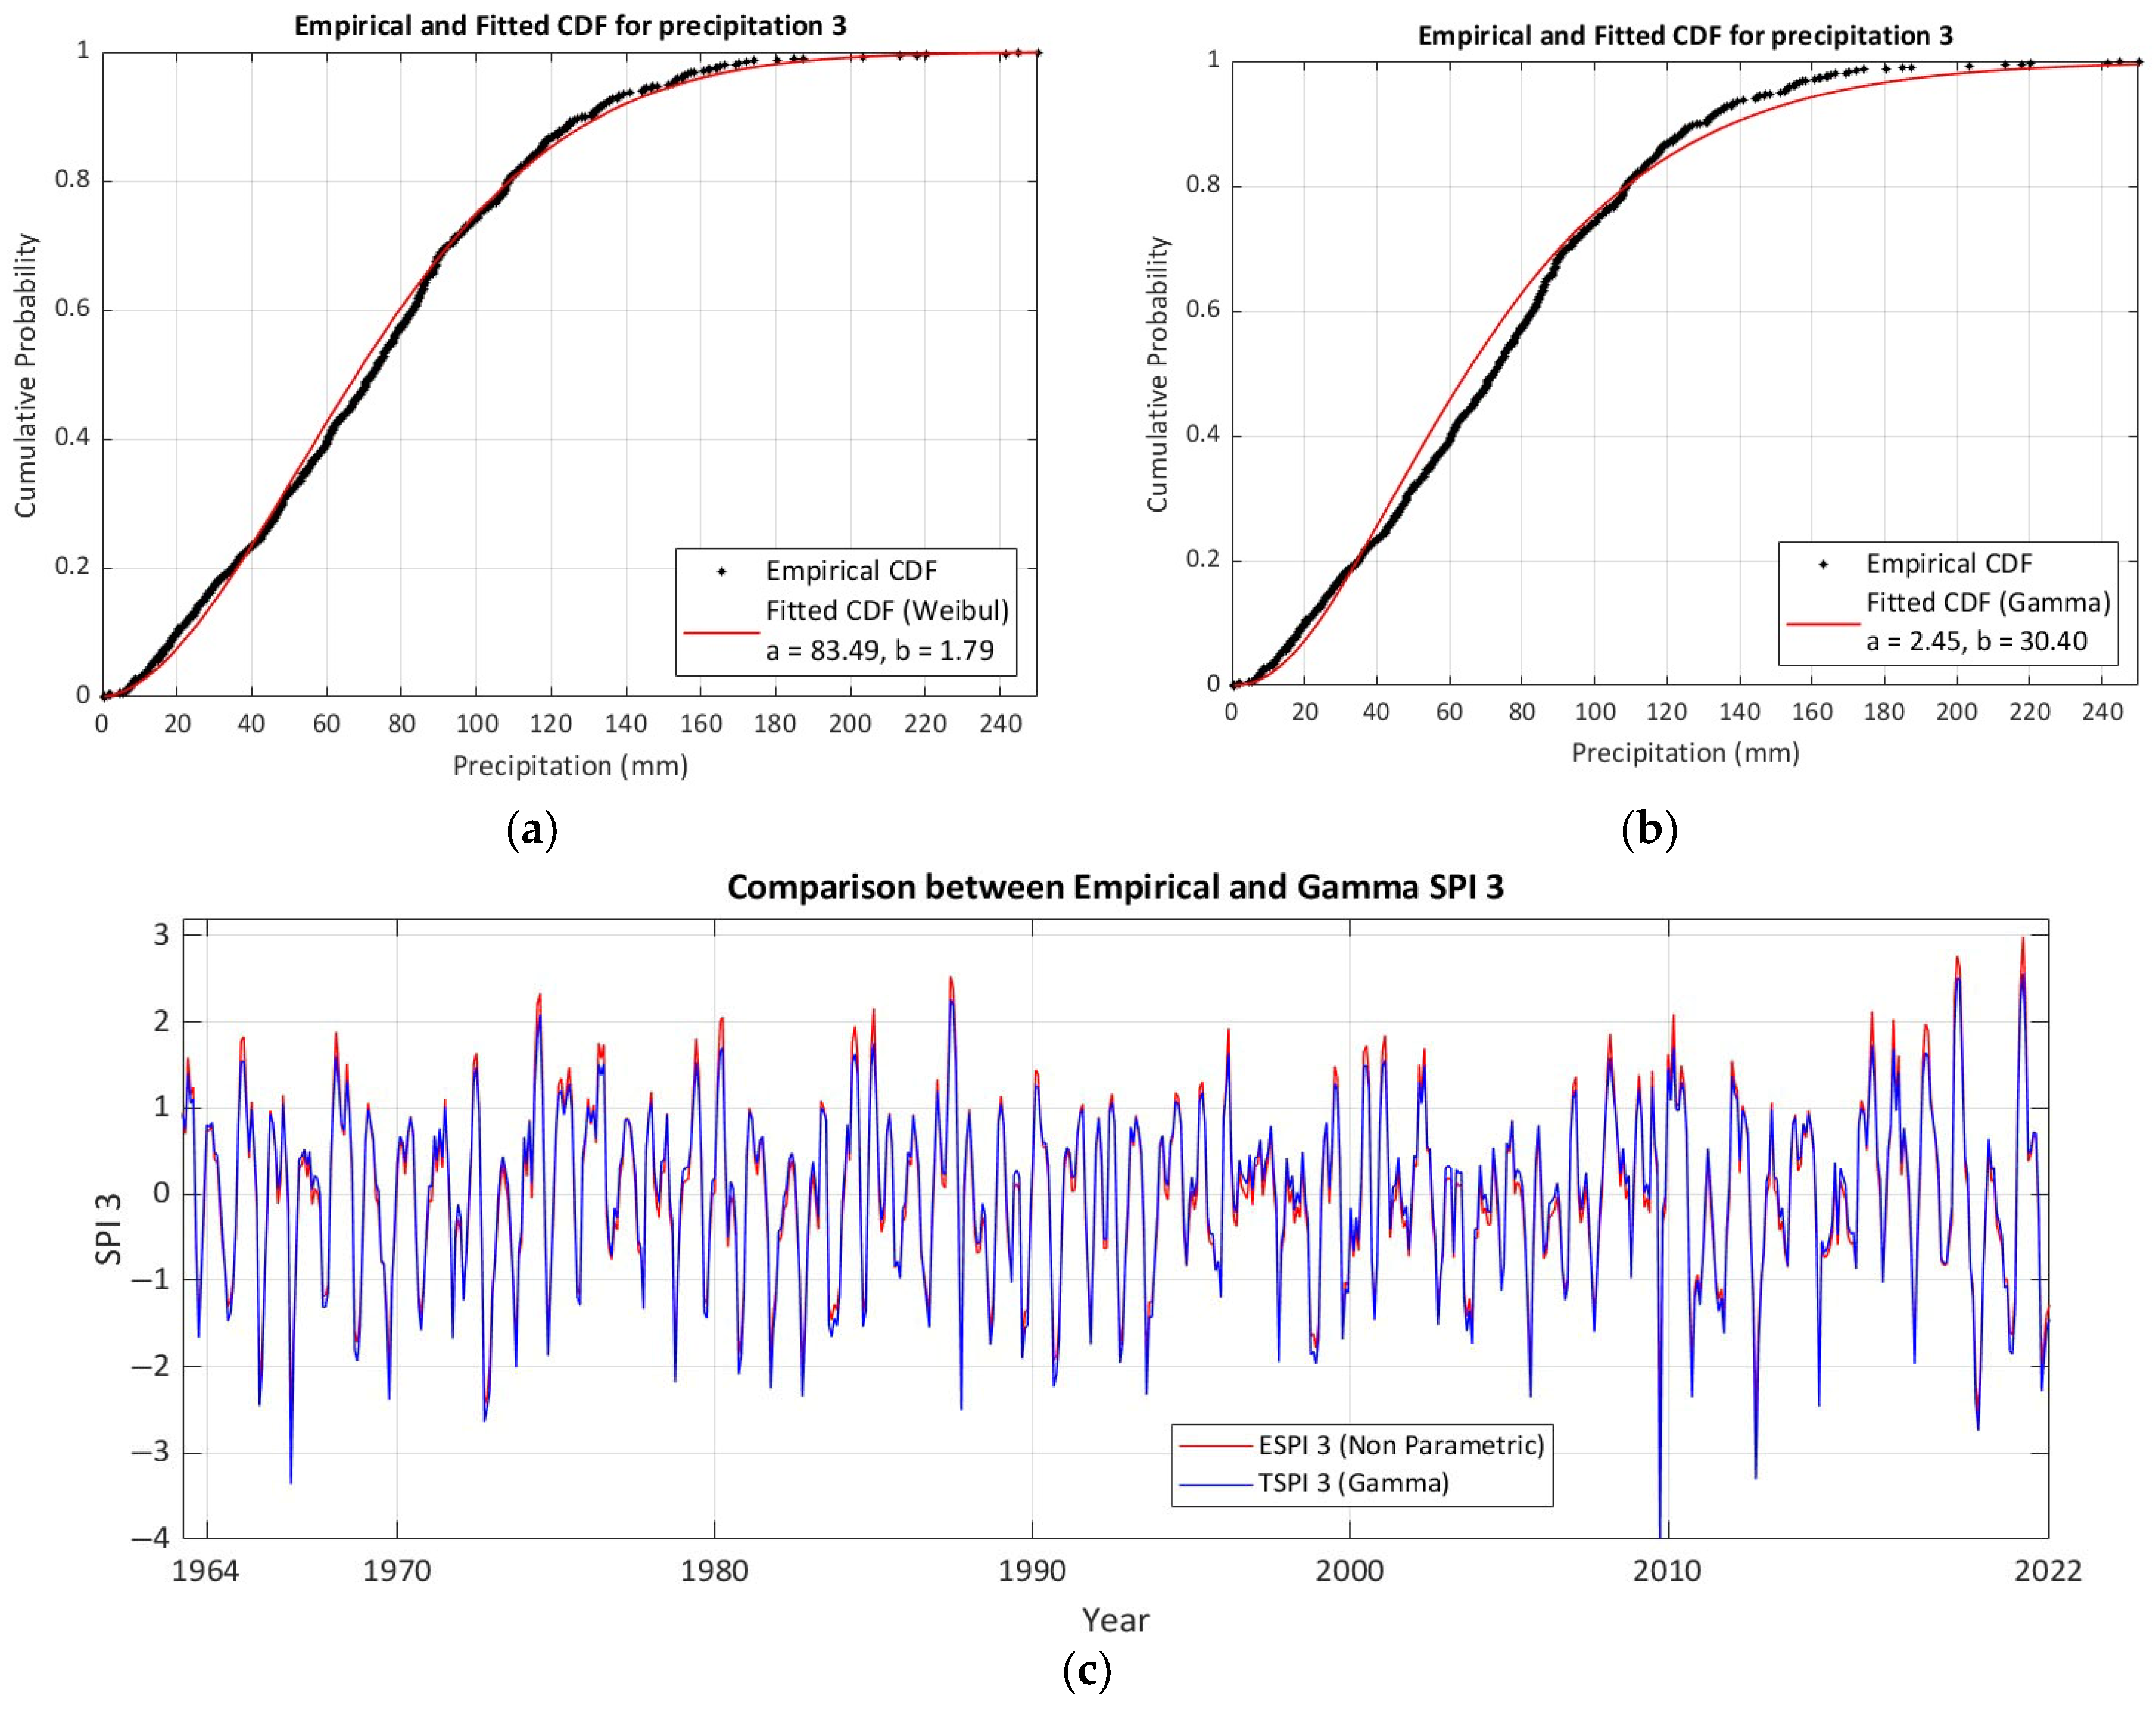
- In terms of simplicity and reliability, empirical CDFs provide more accurate results and minimize errors. For example, in SPI-3, the RMSE was 0.087, the MAE was 0.071, and the MBE was 0.003.
- Many previous studies used the Gamma distribution for SPI without testing its suitability, which can lead to inaccurate drought analysis. In contrast, the empirical distribution offers a more realistic and less biased representation, making it a better choice, especially when theoretical distributions fall short.
- There is no consistent or specific relationship between the empirical and theoretical approaches for drought characteristics. However, the empirical/non-parametric approach gives more reliable and actual results.
- The empirical distribution function proved more effective and reliable for drought assessment, offering valuable insights for water resource management and related fields.
Author Contributions
Funding
Institutional Review Board Statement
Informed Consent Statement
Data Availability Statement
Acknowledgments
Conflicts of Interest
References
- Dabanli, I.; Şişman, E.; Güçlü, Y.S.; Birpınar, M.E.; Şen, Z. Climate change impacts on sea surface temperature (SST) trend around Turkey seashores. Acta Geophys. 2021, 69, 295–305. [Google Scholar] [CrossRef]
- Tiwari, A.K.; Kumar, A.; Singh, A.K.; Singh, T.N.; Suozzi, E.; Matta, G.; Russo, S.L. (Eds.) Water Scarcity, Contamination and Management; Elsevier: Amsterdam, The Netherlands, 2022. [Google Scholar]
- Abu Arra, A.; Alashan, S.; Şişman, E. Advancing innovative trend analysis for drought trends: Incorporating drought classification frequencies for comprehensive insights. Nat. Hazards 2025, 121, 9195–9219. [Google Scholar] [CrossRef]
- IPCC. Summary for policymakers. In Climate Change 2023: Synthesis Report. Contribution of Working Groups I, II and III to the Sixth Assessment Report of the Intergovernmental Panel on Climate Change; Core Writing Team, Lee, H., Romero, J., Eds.; IPCC: Geneva, Switzerland, 2023; pp. 1–34. [Google Scholar] [CrossRef]
- Habibi, B.; Meddi, M.; Emre, T.; Boucefiane, A.; Rahmouni, A. Drought assessment and characterization using SPI, EDI and DEPI indices in northern Algeria. Nat. Hazards 2024, 120, 5201–5231. [Google Scholar] [CrossRef]
- Şen, Z. Water structures and climate change impact: A review. Water Resour. Manag. 2020, 34, 4197–4216. [Google Scholar] [CrossRef]
- Şen, Z.; Şişman, E.; Dabanli, I. Wet and dry spell feature charts for practical uses. Nat. Hazards 2020, 104, 1975–1986. [Google Scholar] [CrossRef]
- Bayissa, Y.; Tadesse, T.; Demisse, G.; Shiferaw, A. Evaluation of satellite-based rainfall estimates and application to monitor meteorological drought for the Upper Blue Nile Basin, Ethiopia. Remote Sens. 2017, 9, 669. [Google Scholar] [CrossRef]
- Alsafadi, K.; Bashir, B.; Mohammed, S.; Abdo, H.G.; Mokhtar, A.; Alsalman, A.; Cao, W. Response of Ecosystem Carbon–Water Fluxes to Extreme Drought in West Asia. Remote Sens. 2024, 16, 1179. [Google Scholar] [CrossRef]
- Sadhwani, K.; Eldho, T.I. Assessing the Effect of Future Climate Change on Drought Characteristics and Propagation from Meteorological to Hydrological Droughts—A Comparison of Three Indices. Water Resour. Manag. 2024, 38, 441–462. [Google Scholar] [CrossRef]
- Hussain, M.A.; Shuai, Z.; Moawwez, M.A.; Umar, T.; Iqbal, M.R.; Kamran, M.; Muneer, M. A Review of Spatial Variations of Multiple Natural Hazards and Risk Management Strategies in Pakistan. Water 2023, 15, 407. [Google Scholar] [CrossRef]
- Abu Arra, A.; Alashan, S.; Şişman, E. A new framework for innovative trend analysis: Integrating extreme precipitation indices, standardization, enhanced visualization, and novel classification approaches (ITA-NF). Nat. Hazards 2025, 1–33. [Google Scholar] [CrossRef]
- Khorrami, B.; Pirasteh, S.; Ali, S.; Sahin, O.G.; Vaheddoost, B. Statistical downscaling of GRACE TWSA estimates to a 1-km spatial resolution for a local-scale surveillance of flooding potential. J. Hydrol. 2023, 624, 129929. [Google Scholar] [CrossRef]
- McKee, T.B.; Doesken, N.J.; Kleist, J. The relationship of drought frequency and duration to time scales. In Proceedings of the 8th Conference on Applied Climatology, Anaheim, CA, USA, 17–22 January 1993; Volume 17, pp. 179–183. [Google Scholar]
- Vicente-Serrano, S.M.; Beguería, S.; López-Moreno, J.I. A multiscalar drought index sensitive to global warming: The standardized precipitation evapotranspiration index. J. Clim. 2010, 23, 1696–1718. [Google Scholar] [CrossRef]
- Nalbantis, I.; Tsakiris, G. Assessment of hydrological drought revisited. Water Resour. Manag. 2009, 23, 881–897. [Google Scholar] [CrossRef]
- Tsakiris, G.; Pangalou, D.; Vangelis, H. Regional drought assessment based on the Reconnaissance Drought Index (RDI). Water Resour. Manag. 2007, 21, 821–833. [Google Scholar] [CrossRef]
- WMO World Meteorological Organization. Standardized Precipitation Index User Guide; Svoboda, M., Hayes, M., Wood, D., Eds.; WMO World Meteorological Organization: Geneva, Switzerland, 2012. [Google Scholar]
- Bruno, G.; Avanzi, F.; Alfieri, L.; Libertino, A.; Gabellani, S.; Duethmann, D. Hydrological model skills change with drought severity; insights from multi-variable evaluation. J. Hydrol. 2024, 634, 131023. [Google Scholar] [CrossRef]
- Abu Arra, A.; Alashan, S.; Şişman, E. Trends of meteorological and hydrological droughts and associated parameters using innovative approaches. J. Hydrol. 2024, 640, 131661. [Google Scholar] [CrossRef]
- Abu Arra, A.; Şişman, E. Innovative Drought Classification Matrix and Acceptable Time Period for Temporal Drought Evaluation. Water Resour. Manag. 2024, 38, 2811–2833. [Google Scholar] [CrossRef]
- Mahmoudi, P.; Rigi, A.; Kamak, M.M. A comparative study of precipitation-based drought indices with the aim of selecting the best index for drought monitoring in Iran. Theor. Appl. Climatol. 2019, 137, 3123–3138. [Google Scholar] [CrossRef]
- Şan, M.; Nacar, S.; Kankal, M.; Bayram, A. Spatiotemporal analysis of transition probabilities of wet and dry days under SSPs scenarios in the semi-arid Susurluk Basin, Türkiye. Sci. Total Environ. 2024, 912, 168641. [Google Scholar] [CrossRef]
- Abu Arra, A.; Birpınar, M.E.; Gazioğlu, Ş.A.; Şişman, E. Critical drought characteristics: A new concept based on dynamic time period scenarios. Atmosphere 2024, 15, 768. [Google Scholar] [CrossRef]
- Şen, Z.; Şişman, E. Probabilistic standardization index adjustment for standardized precipitation index (SPI). Theor. Appl. Climatol. 2023, 155, 1–10. [Google Scholar] [CrossRef]
- Laimighofer, J.; Laaha, G. How standard are standardized drought indices? Uncertainty components for the SPI & SPEI case. J. Hydrol. 2022, 613, 128385. [Google Scholar] [CrossRef]
- Pieper, P.; Düsterhus, A.; Baehr, J. A universal Standardized Precipitation Index candidate distribution function for observations and simulations. Hydrol. Earth Syst. Sci. 2020, 24, 4541–4565. [Google Scholar] [CrossRef]
- Moccia, B.; Mineo, C.; Ridolfi, E.; Russo, F.; Napolitano, F. SPI-based drought classification in Italy: Influence of different probability distribution functions. Water 2022, 14, 3668. [Google Scholar] [CrossRef]
- Svensson, C.; Hannaford, J.; Prosdocimi, I. Statistical distributions for monthly aggregations of precipitation and streamflow in drought indicator applications. Water Resour. Res. 2017, 53, 999–1018. [Google Scholar] [CrossRef]
- Angelidis, P.; Maris, F.; Kotsovinos, N.; Hrissanthou, V. Computation of drought index SPI with alternative distribution functions. Water Resour. Manag. 2012, 26, 2453–2473. [Google Scholar] [CrossRef]
- Wang, H.; Chen, Y.; Pan, Y.; Chen, Z.; Ren, Z. Assessment of candidate distributions for SPI/SPEI and sensitivity of drought to climatic variables in China. Int. J. Climatol. 2019, 39, 4392–4412. [Google Scholar] [CrossRef]
- Sienz, F.; Bothe, O.; Fraedrich, K. Monitoring and quantifying future climate projections of dryness and wetness extremes: SPI bias. Hydrol. Earth Syst. Sci. 2012, 16, 2143–2157. [Google Scholar] [CrossRef]
- Chong, K.L.; Huang, Y.F.; Koo, C.H.; Ahmed, A.N.; El-Shafie, A. Spatiotemporal variability analysis of standardized precipitation indexed droughts using wavelet transform. J. Hydrol. 2022, 605, 127299. [Google Scholar] [CrossRef]
- Sobral, B.S.; Oliveira-Júnior, J.F.; de Gois, G.; Pereira-Júnior, E.R. Spatial variability of SPI and RDIst drought indices applied to intense episodes of drought occurred in Rio de Janeiro State, Brazil. Int. J. Climatol. 2018, 38, 3896–3916. [Google Scholar] [CrossRef]
- Gumus, V. Evaluating the effect of the SPI and SPEI methods on drought monitoring over Turkey. J. Hydrol. 2023, 626, 130386. [Google Scholar] [CrossRef]
- Ortiz-Gómez, R.; Flowers-Cano, R.S.; Medina-García, G. Sensitivity of the RDI and SPEI drought indices to different models for estimating evapotranspiration potential in semiarid regions. Water Resour. Manag. 2022, 36, 2471–2492. [Google Scholar] [CrossRef]
- Merabti, A.; Meddi, M.; Martins, D.S.; Pereira, L.S. Comparing SPI and RDI applied at local scale as influenced by climate. Water Resour. Manag. 2018, 32, 1071–1085. [Google Scholar] [CrossRef]
- Paulo, A.; Martins, D.; Pereira, L.S. Influence of precipitation changes on the SPI and related drought severity. An analysis using long-term data series. Water Resour. Manag. 2016, 30, 5737–5757. [Google Scholar] [CrossRef]
- Farahmand, A.; AghaKouchak, A. A generalized framework for deriving nonparametric standardized drought indicators. Adv. Water Resour. 2015, 76, 140–145. [Google Scholar] [CrossRef]
- Gringorten, I.I. A plotting rule for extreme probability paper. J. Geophys. Res. 1963, 68, 813–814. [Google Scholar] [CrossRef]
- Cheval, S.; Busuioc, A.; Dumitrescu, A.; Birsan, M.V. Spatiotemporal variability of meteorological drought in Romania using the standardized precipitation index (SPI). Clim. Res. 2014, 60, 235–248. [Google Scholar] [CrossRef]
- Stagge, J.H.; Tallaksen, L.M.; Gudmundsson, L.; Van Loon, A.F.; Stahl, K. Candidate distributions for climatological drought indices (SPI and SPEI). Int. J. Climatol. 2015, 35, 4027–4040. [Google Scholar] [CrossRef]
- Raziei, T. Performance evaluation of different probability distribution functions for computing Standardized Precipitation Index over diverse climates of Iran. Int. J. Climatol. 2021, 41, 3352–3373. [Google Scholar] [CrossRef]
- Soľáková, T.; De Michele, C.; Vezzoli, R. Comparison between parametric and nonparametric approaches for the calculation of two drought indices: SPI and SSI. J. Hydrol. Eng. 2014, 19, 04014010. [Google Scholar] [CrossRef]
- Mallenahalli, N.K. Comparison of parametric and nonparametric standardized precipitation index for detecting meteorological drought over the Indian region. Theor. Appl. Climatol. 2020, 142, 219–236. [Google Scholar] [CrossRef]
- Vangelis, H.; Kourtis, I.M. Parametric vs. Non-Parametric Approach for the Estimation of the SPI Drought Index. Water 2025, 17, 450. [Google Scholar] [CrossRef]
- Stephens, M.A. Use of the Kolmogorov–Smirnov, Cramer–Von Mises and related statistics without extensive tables. J. R. Stat. Soc. Ser. B Stat. Methodol. 1970, 32, 115–122. [Google Scholar] [CrossRef]
- D’Agostino, R. Goodness-of-Fit-Techniques; Routledge: Oxfordshire, UK, 2017. [Google Scholar]
- Stedinger, J.R.; Vogel, R.M.; Foufoula-Georgiou, E. Frequency Analysis of Extreme Events. In Handbook of Hydrology; Maidment, D.R., Ed.; McGraw-Hill: New York, NY, USA, 1993; pp. 18.1–18.66. [Google Scholar]
- Tallaksen, L.M.; Laaha, G. Frequency analysis. In Hydrological Drought; Elsevier: Amsterdam, The Netherlands, 2023; pp. 233–304. [Google Scholar] [CrossRef]
- Johnson, N.L.; Kotz, S.; Balakrishnan, N. Continuous Univariate Distributions; John Wiley & Sons: Hoboken, NJ, USA, 1995; Volume 2, p. 289. [Google Scholar]
- Qin, F.; Ao, T.; Chen, T. Bivariate frequency of meteorological drought in the upper Minjiang River based on copula function. Water 2021, 13, 2056. [Google Scholar] [CrossRef]
- Pandya, P.; Gontia, N.K. Development of drought severity–duration–frequency curves for identifying drought proneness in semi-arid regions. J. Water Clim. Change 2023, 14, 824–842. [Google Scholar] [CrossRef]
- Evans, M.; Hastings, N.; Peacock, B. Statistical distributions. Meas. Sci. Technol. 2001, 12, 117. [Google Scholar] [CrossRef]
- Mishra, A.K.; Singh, V.P. A review of drought concepts. J. Hydrol. 2010, 391, 202–216. [Google Scholar] [CrossRef]
- Cunnane, C. Unbiased plotting positions—A review. J. Hydrol. 1978, 37, 205–222. [Google Scholar] [CrossRef]
- Hazen, A. Storage to be provided in impounding municipal water supply. Trans. Am. Soc. Civ. Eng. 1914, 77, 1539–1640. [Google Scholar] [CrossRef]
- Tukey, J.W. Exploratory Data Analysis; Addison-Wesley: Reading, MA, USA, 1977; Volume 2, pp. 131–160. [Google Scholar]
- Blom, G. Statistical Estimates and Transformed Beta-Variables. Ph.D. Thesis, Almqvist & Wiksell, Stockholm, Sweden, 1958. [Google Scholar]
- Burt, S.; Burt, T. Durham Weather and Climate Since 1841; Oxford University Press: Oxford, UK, 2022. [Google Scholar]
- Yevjevich, V.M. Objective Approach to Definitions and Investigations of Continental Hydrologic Droughts. Ph.D. Thesis, Colorado State University, Fort Collins, CO, USA, 1967. [Google Scholar]
- Abu Arra, A.; Şişman, E. A comprehensive analysis and comparison of SPI and SPEI for spatiotemporal drought evaluation. Environ. Monit. Assess. 2024, 196, 980. [Google Scholar] [CrossRef]
- Abu Arra, A.; Şişman, E. Characteristics of hydrological and meteorological drought based on intensity-duration-frequency (IDF) curves. Water 2023, 15, 3142. [Google Scholar] [CrossRef]
- Bouabdelli, S.; Zeroual, A.; Meddi, M.; Assani, A. Impact of temperature on agricultural drought occurrence under the effects of climate change. Theor. Appl. Climatol. 2022, 148, 191–209. [Google Scholar] [CrossRef]
- Tejada Jr, A.T.; Sanchez, P.A.J.; Faderogao, F.J.F.; Gigantone, C.B.; Luyun Jr, R.A. Spatiotemporal analysis of extreme rainfall and meteorological drought events over the Angat watershed, Philippines. Atmosphere 2023, 14, 1790. [Google Scholar] [CrossRef]
- Bio Sidi, D.; Bouko, A.A.; Gao, B.; Abubakar, J.; Annan, R.F.; Djessou, R.D.; Mutelo, A.M.; Dehah, L. Characteristics of Meteorological Droughts Across Different Climatic Zones in Benin. Atmosphere 2025, 16, 611. [Google Scholar] [CrossRef]
- Zhang, X.; Wang, H.; Yu, Z.; Yan, D.; Liu, R.; Liu, S.; Wu, Z. Study on the Probability of Meteorological-to-Hydrological Drought Propagation Based on a Bayesian Network. Land 2025, 14, 445. [Google Scholar] [CrossRef]
- Ding, X.; Yu, Y.; Yang, M.; Wang, Q.; Zhang, L.; Guo, Z.; Yu, R. Investigating the Effect of Climate Change on Drought Propagation in the Tarim River Basin Using Multi-Model Ensemble Projections. Atmosphere 2023, 15, 50. [Google Scholar] [CrossRef]
- Alawsi, M.A.; Zubaidi, S.L.; Al-Ansari, N.; Al-Bugharbee, H.; Ridha, H.M. Tuning ANN hyperparameters by CPSOCGSA, MPA, and SMA for short-term SPI drought forecasting. Atmosphere 2022, 13, 1436. [Google Scholar] [CrossRef]
- Kumar, P.; Shah, S.F.; Uqaili, M.A.; Kumar, L.; Zafar, R.F. Forecasting of drought: A case study of water-stressed region of Pakistan. Atmosphere 2021, 12, 1248. [Google Scholar] [CrossRef]
- Wei, J.; Tang, W.; Ditthakit, P.; Shang, J.; Guo, H.; Zhao, B.; Guo, Y. Enhancing Drought Forecast Accuracy Through Informer Model Optimization. Land 2025, 14, 126. [Google Scholar] [CrossRef]
- Pande, C.B.; Al-Ansari, N.; Kushwaha, N.L.; Srivastava, A.; Noor, R.; Kumar, M.; Elbeltagi, A. Forecasting of SPI and meteorological drought based on the artificial neural network and M5P model tree. Land 2022, 11, 2040. [Google Scholar] [CrossRef]


| Drought Index_DI | Drought Classification | Probability (%) |
|---|---|---|
| 2.0 ≤ DI | Extreme wet (EW) | 2.31% |
| 1.5 ≤ DI < 2.0 | Severe wet (SW) | 4.42% |
| 1.0 ≤ DI < 1.5 | Moderate wet (MW) | 9.22% |
| −1.0 ≤ DI < 1.0 | Normal (N) | 68.1% |
| −1.5 ≤ DI < −1.0 | Moderate drought (MD) | 9.22% |
| −2.0 ≤ DI < −1.5 | Severe drought (SD) | 4.42% |
| −2.0 > DI | Extreme drought (ED) | 2.31% |
| Probability Distributions Type | Probability Density Function (PDF) | Parameters |
|---|---|---|
| Weibull | ) | |
| Normal | ||
| Gama | ) | |
| General Extreme Value (GEV) | ) | |
| Generalized Pareto (GP) | ) |
| ECDF Type | Equation | Reference |
| Standard ECDF | Stedinger et al. [49] | |
| Weibull Plotting Position ECDF | Cunnane [56] | |
| Gringorten Plotting Position ECDF | Gringorten [40] | |
| Hazen Plotting Position ECDF | Hazen [57] | |
| Tukey Plotting Position ECDF | Tukey [58] | |
| Blom Plotting Position ECDF | Blom [59] |
| Statistic Metric | Equation | Value Range | Ideal Value |
|---|---|---|---|
| Correlation Coefficient (CC) | (−1)–(1) | 1 | |
| Coefficient of determination (R2) | (0)–(1) | 1 | |
| Mean Square Error (MSE) | (0)–(∞) | 0 | |
| Root Mean Square Error (RMSE) | (0)–(∞) | 0 | |
| Mean Absolute Error (MAE) | (0)–(∞) | 0 | |
| Mean Bias Error (MBE) | (−∞)–(∞) | 0 |
| Station | Latitude | Longitude | Variable | Average | Standard Deviation | Time Period |
|---|---|---|---|---|---|---|
| Karapınar station | 37.71 (N) | 33.52 (E) | Annual precipitation (mm) | 297.5 | 21.57 | 1964–2022 |
| Durham station | 54.77 (N) | 1.59 (W) | Annual precipitation (mm) | 652.5 | 31.74 | 1868–2021 |
| Monthly Temperature (°C) | 8.59 | 4.46 | 1868–2021 | |||
| Lüleburgaz station | 41.35 (N) | 27.35 (E) | Annual streamflow (m3/s) | 114.84 | 13.2 | 1957–2015 |
| SPI | R2 | CC | MSE | RMSE | MAE | MBE | KS Test p-value | |
| 1-month | 0.932 | 0.984 | 0.067 | 0.260 | 0.122 | 0.069 | 0.312 | GP |
| 3-month | 0.992 | 0.997 | 0.008 | 0.087 | 0.071 | 0.003 | 0.538 | Weibull |
| 6-month | 0.995 | 0.997 | 0.005 | 0.072 | 0.042 | −0.001 | 0.935 | Gamma |
| 12-month | 0.994 | 0.997 | 0.006 | 0.077 | 0.054 | 0.000 | 0.487 | GEV |
| SPEI | R2 | CC | MSE | RMSE | MAE | MBE | KS Test p-value | |
| 1-month | 0.996 | 0.998 | 0.004 | 0.066 | 0.052 | 0.003 | 0.359 | GEV |
| 3-month | 0.996 | 0.998 | 0.004 | 0.065 | 0.051 | −0.002 | 0.148 | GEV |
| 6-month | 0.996 | 0.998 | 0.004 | 0.060 | 0.051 | −0.002 | 0.426 | GEV |
| 12-month | 0.998 | 0.999 | 0.002 | 0.043 | 0.023 | 0.001 | 0.999 | Normal |
| SDI | R2 | CC | MSE | RMSE | MAE | MBE | KS Test p-value | |
| 1-month | 0.984 | 0.992 | 0.015 | 0.124 | 0.081 | −0.001 | 0.125 | GEV |
| 3-month | 0.992 | 0.996 | 0.008 | 0.090 | 0.064 | −0.003 | 0.343 | Weibull |
| 6-month | 0.990 | 0.995 | 0.010 | 0.101 | 0.077 | 0.004 | 0.535 | Gamma |
| 12-month | 0.979 | 0.990 | 0.021 | 0.143 | 0.100 | 0.001 | 0.105 | Gamma |
| R2 | CC | MSE | RMSE | MAE | MBE | |
|---|---|---|---|---|---|---|
| Empirical vs. Weibull | 0.992 | 0.997 | 0.008 | 0.087 | 0.071 | 0.003 |
| Gamma vs. Weibull | 0.992 | 0.996 | 0.008 | 0.091 | 0.067 | 0.010 |
| Empirical vs. Gamma | 0.977 | 0.989 | 0.023 | 0.152 | 0.127 | −0.007 |
Disclaimer/Publisher’s Note: The statements, opinions and data contained in all publications are solely those of the individual author(s) and contributor(s) and not of MDPI and/or the editor(s). MDPI and/or the editor(s) disclaim responsibility for any injury to people or property resulting from any ideas, methods, instructions or products referred to in the content. |
© 2025 by the authors. Licensee MDPI, Basel, Switzerland. This article is an open access article distributed under the terms and conditions of the Creative Commons Attribution (CC BY) license (https://creativecommons.org/licenses/by/4.0/).
Share and Cite
Abu Arra, A.; Şişman, E. New Insights into Meteorological and Hydrological Drought Modeling: A Comparative Analysis of Parametric and Non-Parametric Distributions. Atmosphere 2025, 16, 846. https://doi.org/10.3390/atmos16070846
Abu Arra A, Şişman E. New Insights into Meteorological and Hydrological Drought Modeling: A Comparative Analysis of Parametric and Non-Parametric Distributions. Atmosphere. 2025; 16(7):846. https://doi.org/10.3390/atmos16070846
Chicago/Turabian StyleAbu Arra, Ahmad, and Eyüp Şişman. 2025. "New Insights into Meteorological and Hydrological Drought Modeling: A Comparative Analysis of Parametric and Non-Parametric Distributions" Atmosphere 16, no. 7: 846. https://doi.org/10.3390/atmos16070846
APA StyleAbu Arra, A., & Şişman, E. (2025). New Insights into Meteorological and Hydrological Drought Modeling: A Comparative Analysis of Parametric and Non-Parametric Distributions. Atmosphere, 16(7), 846. https://doi.org/10.3390/atmos16070846


