Article

Evaluation of a BCC-CPSv3-S2Sv2 Model for the Monthly Prediction of Summer Extreme Precipitation in the Yellow River Basin

Electric Power Science Research Institute, State Grid Henan Electric Power Company, Zhengzhou 450052, China
*
Author to whom correspondence should be addressed.
Atmosphere 2025, 16(7), 830; https://doi.org/10.3390/atmos16070830 (registering DOI)
Submission received: 20 May 2025 / Revised: 13 June 2025 / Accepted: 30 June 2025 / Published: 9 July 2025
(This article belongs to the Section Atmospheric Techniques, Instruments, and Modeling)

Abstract

The performance of monthly prediction of extreme precipitation from the BCC-CPSv3-S2Sv2 model over the Yellow River Basin (YRB) using historical hindcast data from 2008 to 2022 was evaluated in this study, mainly from three aspects: overall performance in predicting daily precipitation rates, systematic biases, and monthly prediction of extreme precipitation metrics. The results showed that the BCC-CPSv3-S2Sv2 model demonstrates approximately 10-day predictive skill for summer daily precipitation over the YRB. Relatively higher skill regions concentrate in the central basin, while skill degradation proves more pronounced in downstream areas compared to the upper basin. After correcting model systematic biases, prediction skills for total precipitation-related metrics significantly surpass those of extreme precipitation indices, and metrics related to precipitation amounts demonstrate relatively higher skill compared to those associated with precipitation days. Total precipitation (TP) and rainy days (RD) exhibit comparable skills in June and July, with August showing weaker performance. Nevertheless, basin-wide predictions within 10-day lead times remain practically valuable for most regions. Prediction skills for extreme precipitation amounts and extreme precipitation days share similar spatiotemporal patterns, with high-skill regions shifting progressively south-to-north from June to August. Significant skills for June–July are constrained within 10-day leads, while August skills rarely exceed 1 week. Further analysis reveals that the predictive capability of the model predominantly originates from normal or below-normal precipitation years, whereas the accurate forecasting of extremely wet years remains a critical challenge, which highlights limitations in capturing mechanisms governing exceptional precipitation events.

1. Introduction

Extreme precipitation events pose severe threats to human safety, socioeconomic development, and natural ecosystems. Under global warming, the frequency and intensity of such events have increased worldwide [1,2,3]. The Yellow River Basin (YRB), located in northern China, traverses diverse geomorphological units including the Tibetan Plateau, Loess Plateau, and North China Plain (Figure 1). Characterized by high sediment load, the basin is highly vulnerable to flooding triggered by heavy rainfall [3,4,5]. Spanning vast longitudinal distances, the basin exhibits heterogeneous climate zones: the upper reaches feature a cold, arid plateau–mountain climate with sparse precipitation, the mid-reaches experience a semi-arid climate marked by concentrated summer storms that exacerbate soil erosion, and the lower reaches transition to a semi-humid climate with increased but seasonally uneven precipitation, notably spring droughts [6,7,8]. These regional climatic disparities, driven by distinct influencing factors, complicate climate prediction across the basin. Approximately 60% of the basin’s annual precipitation occurs during summer, often as extreme events [9,10]. For instance, the 2023 flood season witnessed 10 large-scale precipitation events, including the most intense storm from July 27–31 under the influence of Typhoon Doksuri, which triggered the largest flood of the year in the Jinghe River across Shaanxi, Henan, and Shandong provinces [11,12]. Enhancing the accuracy of regional precipitation forecasts, particularly for extreme events, is thus an urgent priority for disaster prevention and mitigation in the YRB [13,14].
Climate models, as critical tools for climate simulation and projection, have been widely applied to extreme precipitation modeling and forecasting [15,16,17,18]. Sub-seasonal forecasting is influenced not only by initial conditions but also by boundary conditions. According to Lorenz’s research, predictions within two weeks fall under initial value problems, while seasonal-scale climate predictions are boundary value problems, with sub-seasonal forecasting positioned between these two regimes [19,20]. On the one hand, initial errors grow rapidly over time, reaching maximum predictability limits beyond two weeks, after which increasing errors render forecasts unreliable. On the other hand, the atmosphere begins to respond to external forcings but is not yet fully governed by them. Consequently, neither weather forecasting nor climate prediction theories fully apply to sub-seasonal forecasting. Currently, sub-seasonal forecasting lacks a robust theoretical foundation, representing a significant challenge in climate research and earning the moniker “predictability desert” [21].
In 2011, the World Weather Research Programme (WWRP) and World Climate Research Programme (WCRP) under the World Meteorological Organization jointly launched the Subseasonal-to-Seasonal (S2S) Prediction Project [22]. This initiative aims to explore the potential predictability of high-impact weather events at S2S timescales, enhance forecasting capabilities of numerical models for 2 weeks to 2 months ahead, and prioritize extreme event prediction and model validation [23,24]. China’s independently developed BCC-CPSv3 model from the National Climate Center (NCC) has joined the S2S project, providing real-time global forecast data [25]. The China Meteorological Administration has explicitly mandated the establishment of an objective S2S prediction system for the YRB to operationalize grid-based S2S forecasting [26]. These efforts underscore the broad applicability and urgent societal demand for S2S prediction in disaster preparedness and climate resilience [27,28].
In recent years, meteorologists have conducted predictive skill analyses on S2S model outputs for various phenomena, including heatwaves [29], precipitation [30,31,32], monsoons [33,34,35], Madden–Julian Oscillation (MJO) teleconnections [36,37], soil moisture [38], and typhoons [39,40]. As a frontier in forecasting research, S2S precipitation predictions extend warning lead times for flood risks [41], enabling proactive disaster mitigation by local governments. Studies demonstrate that S2S products exhibit potential for predicting the onset, evolution, and decay of large-scale extreme events weeks in advance [42,43,44]. For instance, S2S models (ECMWF, CNRM, JMA, BoM) successfully forecasted the most severe week of the 2010 Russian heatwave three weeks prior, capturing extreme 2 m temperature anomalies [24]. Similarly, S2S models leverage large-scale predictors like MJO phase to derive probabilistic tropical storm forecasts [45].
Model skill evaluation forms the foundation for understanding performance and effectively utilizing forecast information [46,47,48]. However, few studies have systematically assessed or operationally applied S2S models for precipitation predictions—particularly for extreme precipitation—in the YRB. Addressing this gap, this study evaluates S2S model skill in forecasting extreme precipitation events over the basin, aligning with operational needs for disaster risk reduction. The analysis aims to establish a scientific basis for improving prediction accuracy and extending forecast lead times through the enhanced interpretation and application of model products. The rest of this paper is organized as follows: The model and observational data and methodology are described in Section 2. Section 3 presents the overall performance in predicting daily precipitation rate, representations of monthly prediction for climatological features, and monthly prediction of extreme precipitation in the YRB. Section 4 outlines the Discussion and Conclusions of the study.

2. Model, Data and Methodology

The BCC-CPSv3-S2Sv2 model constitutes the operational S2S prediction subsystem product within the integrated sub-seasonal–seasonal–interannual climate prediction system developed by the China Meteorological Administration (CMA) [25]. The atmospheric component employs the Beijing Climate Center Atmospheric General Circulation Model version 3—High Resolution (BCC-AGCM3-HR) with a horizontal resolution of T266 (~45 km), 56 vertical levels, and a model top at 0.1 hPa. The oceanic component utilizes the Modular Ocean Model version 5 (MOM5), configured at (1/4)° horizontal resolution with 50 vertical levels. Land surface processes are simulated by BCC-AVIM2, while sea ice dynamics are represented by the Geophysical Fluid Dynamics Laboratory Sea Ice Simulator version 5 (GFDL SIS5). The ensemble prediction strategy remains Lagged Average Forecasting (LAF). This model began quasi-operational operation at CMA in November 2019, providing forecasts for the next 60 days every Wednesday and Saturday. So far, the model has produced a complete daily operational hindcast dataset for the study of sub-seasonal prediction. Each hindcast consists of 4 ensemble members, which are initialized at 00 UTC of the first forecast day and 18, 12 and 06 UTC of the previous day, respectively. This study directly applies equal-weight averaging to these four members. The prediction capability covers lead times of 0–60 days, thereby enabling monthly-scale prediction within the sub-seasonal framework.
The daily surface precipitation observations utilized are derived from the CN05.1 gridded precipitation dataset, constructed using data from over 2400 national-level meteorological stations across China, with a spatial resolution of 0.25° × 0.25° [49]. To address discrepancies between the selected prediction products and observational data, the climatological mean values of both observations and model outputs are standardized to the 2008–2022 period, with the summer season defined as June–July–August (JJA). Observations and model data are regridded to a uniform 0.25° × 0.25° resolution using the bilinear interpolation method. Additionally, the ensemble mean forecast for evaluation is derived by applying equal-weight averaging to the four ensemble members of the BCC-CPSv3-S2Sv2 model products.
Four precipitation indices are utilized to represent precipitation and extreme precipitation in the YRB, as listed in Table 1. The temporal correlation coefficient (TCC) is used to express the prediction performance. Statistical significance is evaluated using the two-tailed Student’s t-test.

3. Results

3.1. Overall Performance in Predicting Daily Precipitation Rate in JJA

Firstly, we evaluated the performance of the BCC-CPSv3-S2Sv2 model in predicting daily precipitation rate, as illustrated in Figure 2. It is clear that predictive skill progressively diminishes with increasing forecast lead time. Statistically significant TCC skills persist across the entire YRB within 9-day leads, indicating that the direct predictive capacity of the model for summer daily precipitation is limited within 10 days. Relatively higher skill regions concentrate in the central basin, while skill degradation proves more pronounced in downstream areas compared to the upper basin. Useful predictive skills nearly vanish basin-wide at 15-day leads. The precipitation prediction performance of the BCC-CPSv3-S2Sv2 model remains comparable to most worldwide operational systems, which is consistent with expectations and aligns with the baseline performance levels of domestic and international models [24,32,34].

3.2. Representations of Monthly Prediction for Climatological Features

Before conducting the monthly prediction assessment, the climatological features for the three months of summer in model predictions were examined. Figure 3 illustrates the monthly climatological distributions of observed precipitation and model-predicted precipitation across varying forecast lead times in the YRB during June, July, and August. Observations reveal that precipitation in the middle–lower reaches of the YRB predominantly occurs in July and August, with the daily precipitation rate exceeding 4 mm/day and reaching over 7 mm/day in localized areas. The upper reaches exhibit average precipitation of 2–3 mm/day or higher. To evaluate the impact of forecast lead time on monthly mean precipitation prediction, predictions from 0 to 15 days were compared.
Overall, the model systematically overestimates precipitation intensity in the upper basin across all months while underestimating it in most middle reaches and downstream areas. The magnitude of prediction biases shows no clear association with forecast lead times. Specifically, for June, the 3-day lead forecast predominantly exhibits overestimated precipitation in the upper basin and underestimated values in the middle–lower reaches. As lead times extend, the entire basin gradually transitions to positive precipitation biases. In contrast, during July and August, the model consistently maintains positive biases in the upper basin and negative biases in the middle–lower reaches throughout all lead times.
The standard deviation results are illustrated in Figure 4. The monthly distributions of standard deviations resemble the climatological patterns, with the strongest variability occurring in the central middle reaches and downstream areas of the YRB, while weaker variability characterizes the upper basin. July exhibits the highest variability across the basin, followed by August, with June showing relatively minimal variability—a pattern consistent with the principal rainy season occurring in July and August across northern China.
Overall, the model initially overestimates precipitation variability across most regions of the basin in all months. However, precipitation variability in model outputs markedly decreases with increasing forecast lead times. Beyond 9-day leads, simulated variability becomes systematically lower than observations throughout the basin, and this is particularly pronounced in July. The upper basin constitutes an exception, where the model persistently overestimates the inherently low observed variability. This temporal attenuation of simulated variability likely reflects the inherent characteristics of models. Following initialization, as integration time progresses, the model’s climate state gradually drifts from the observation-based initial conditions toward its intrinsic climatological state—a phenomenon termed climatological drift. This adjustment process amplifies systematic biases and introduces spurious long-term trends that compromise prediction reliability. The weakening variability may exert more pronounced impacts on extended-range prediction of extreme precipitation compared to mean precipitation, resulting in the absence of high-intensity precipitation events in model outputs beyond approximately 10-day leads. In addition, this may also be due to the large uncertainty in heavy precipitation across the four ensemble members of BCC-CPSv3-S2Sv2 at 10-day or longer lead times, which is worth further study.

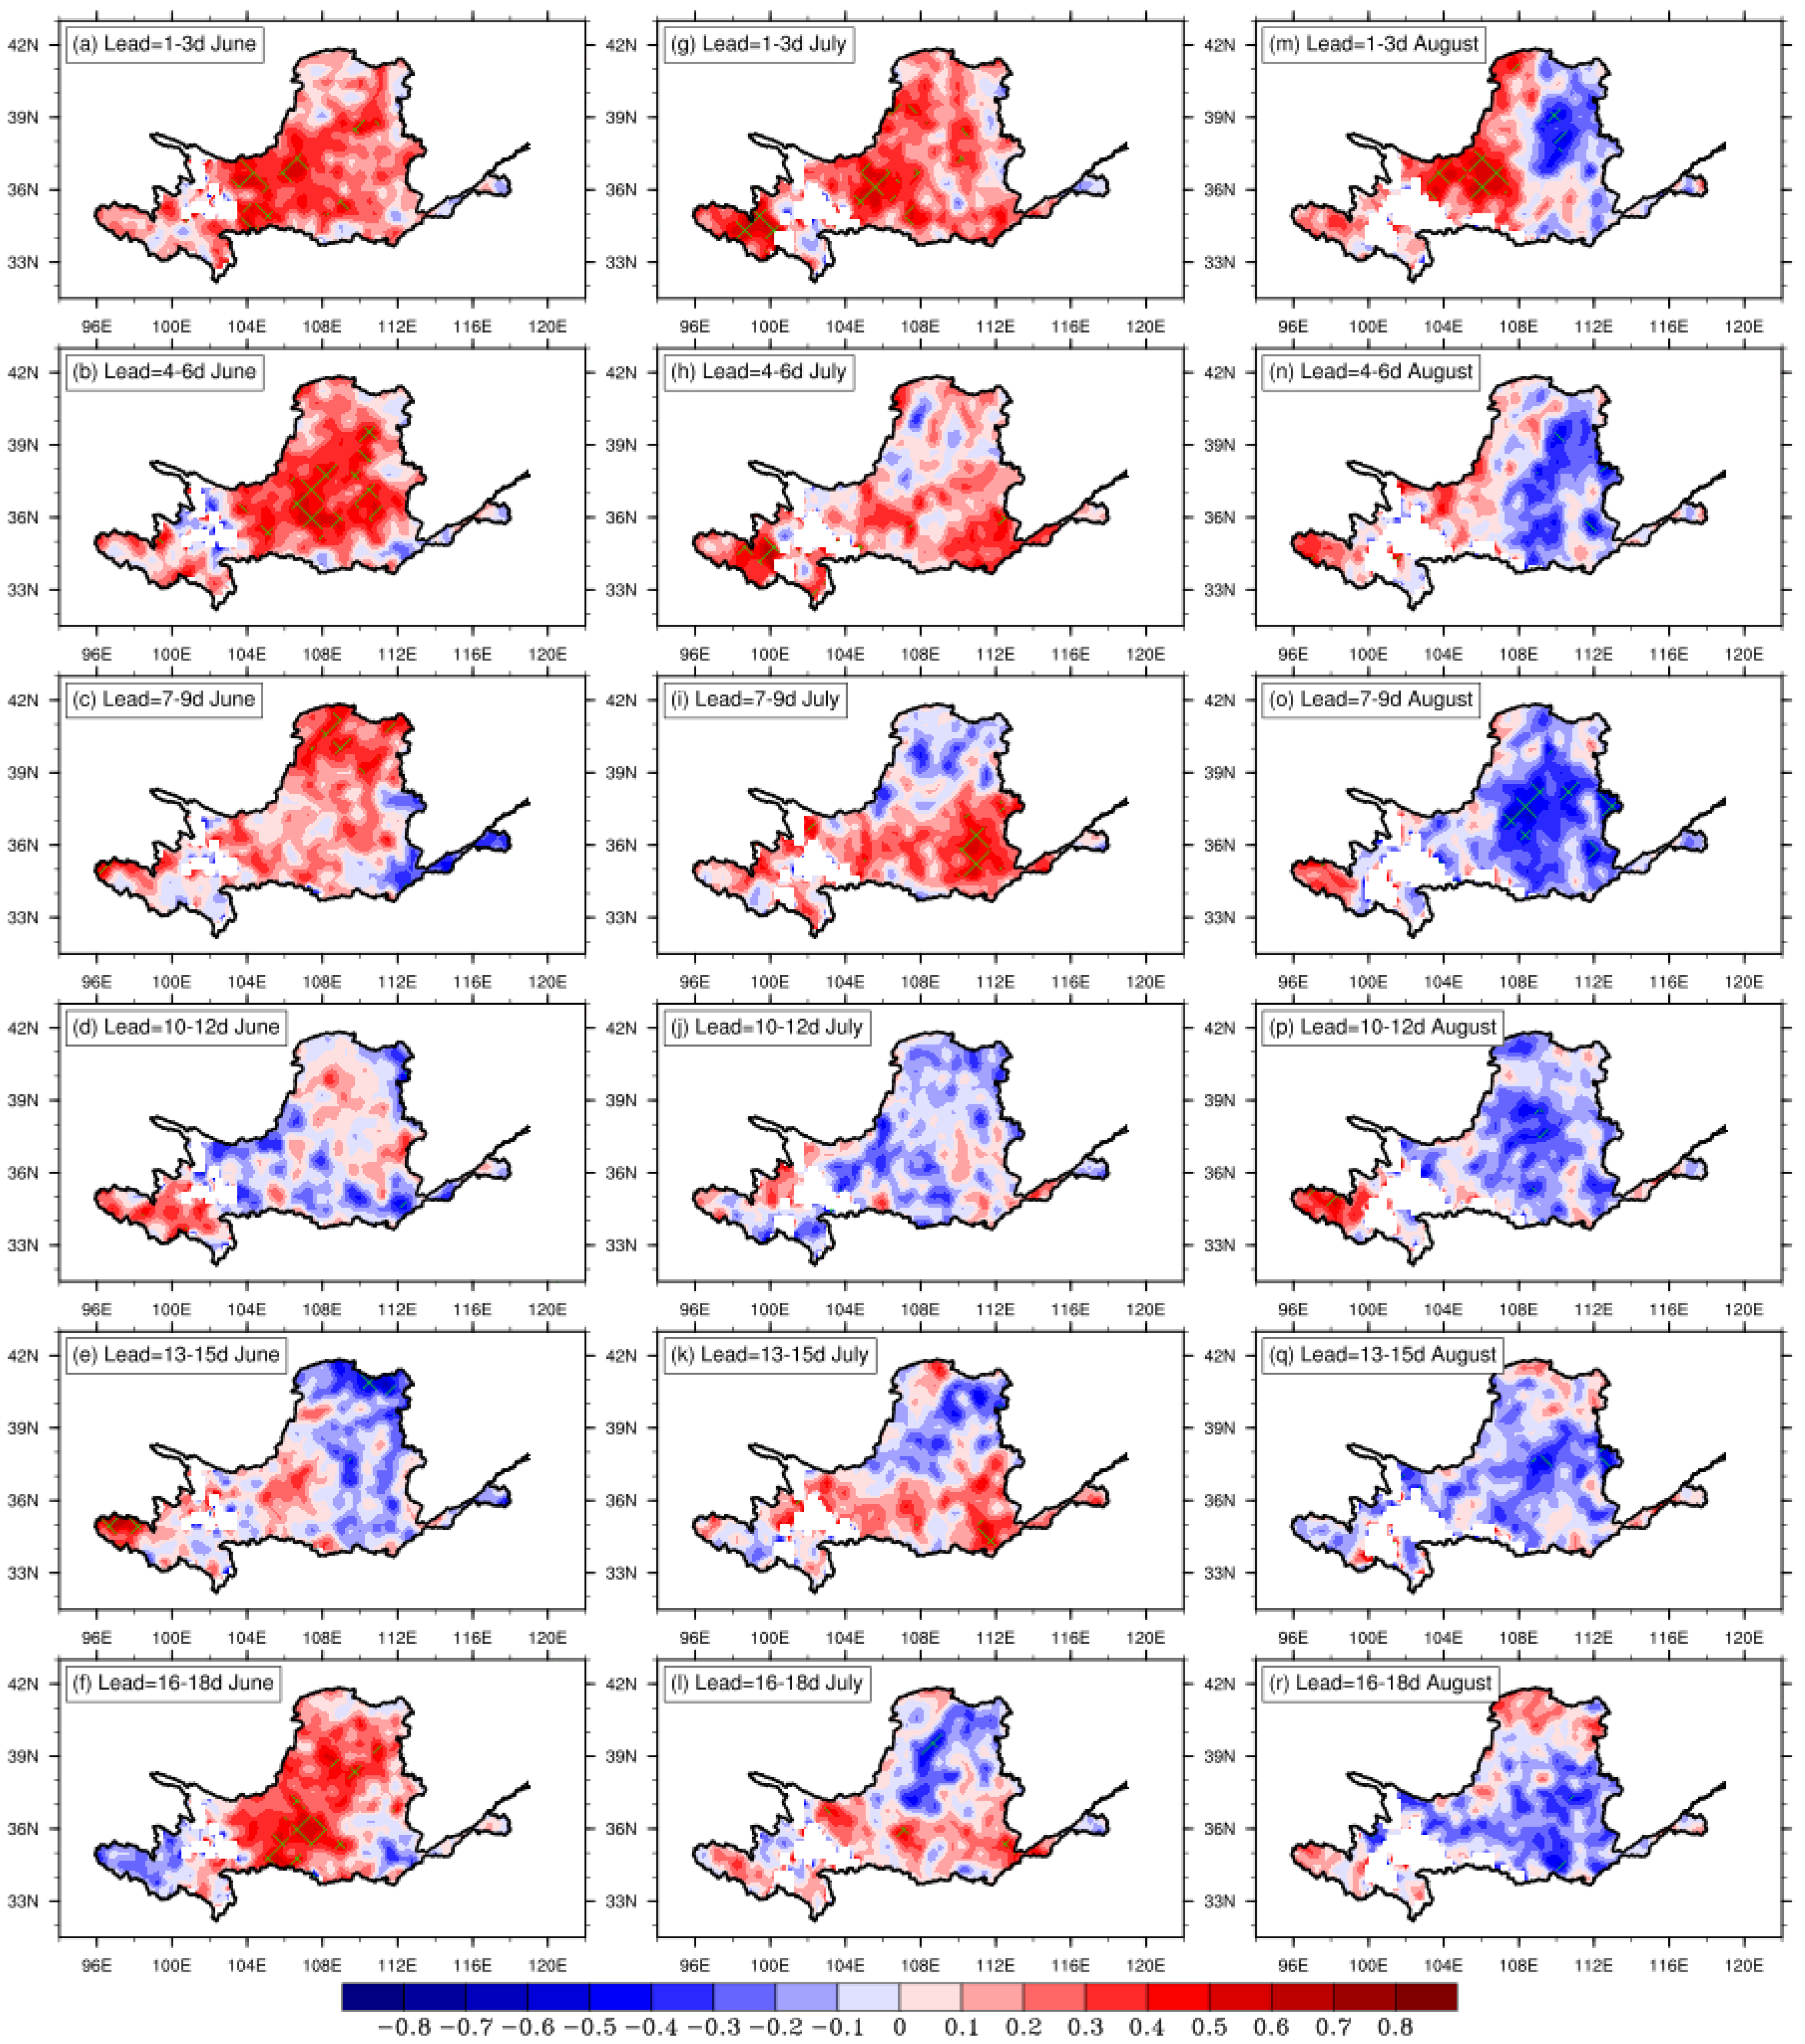
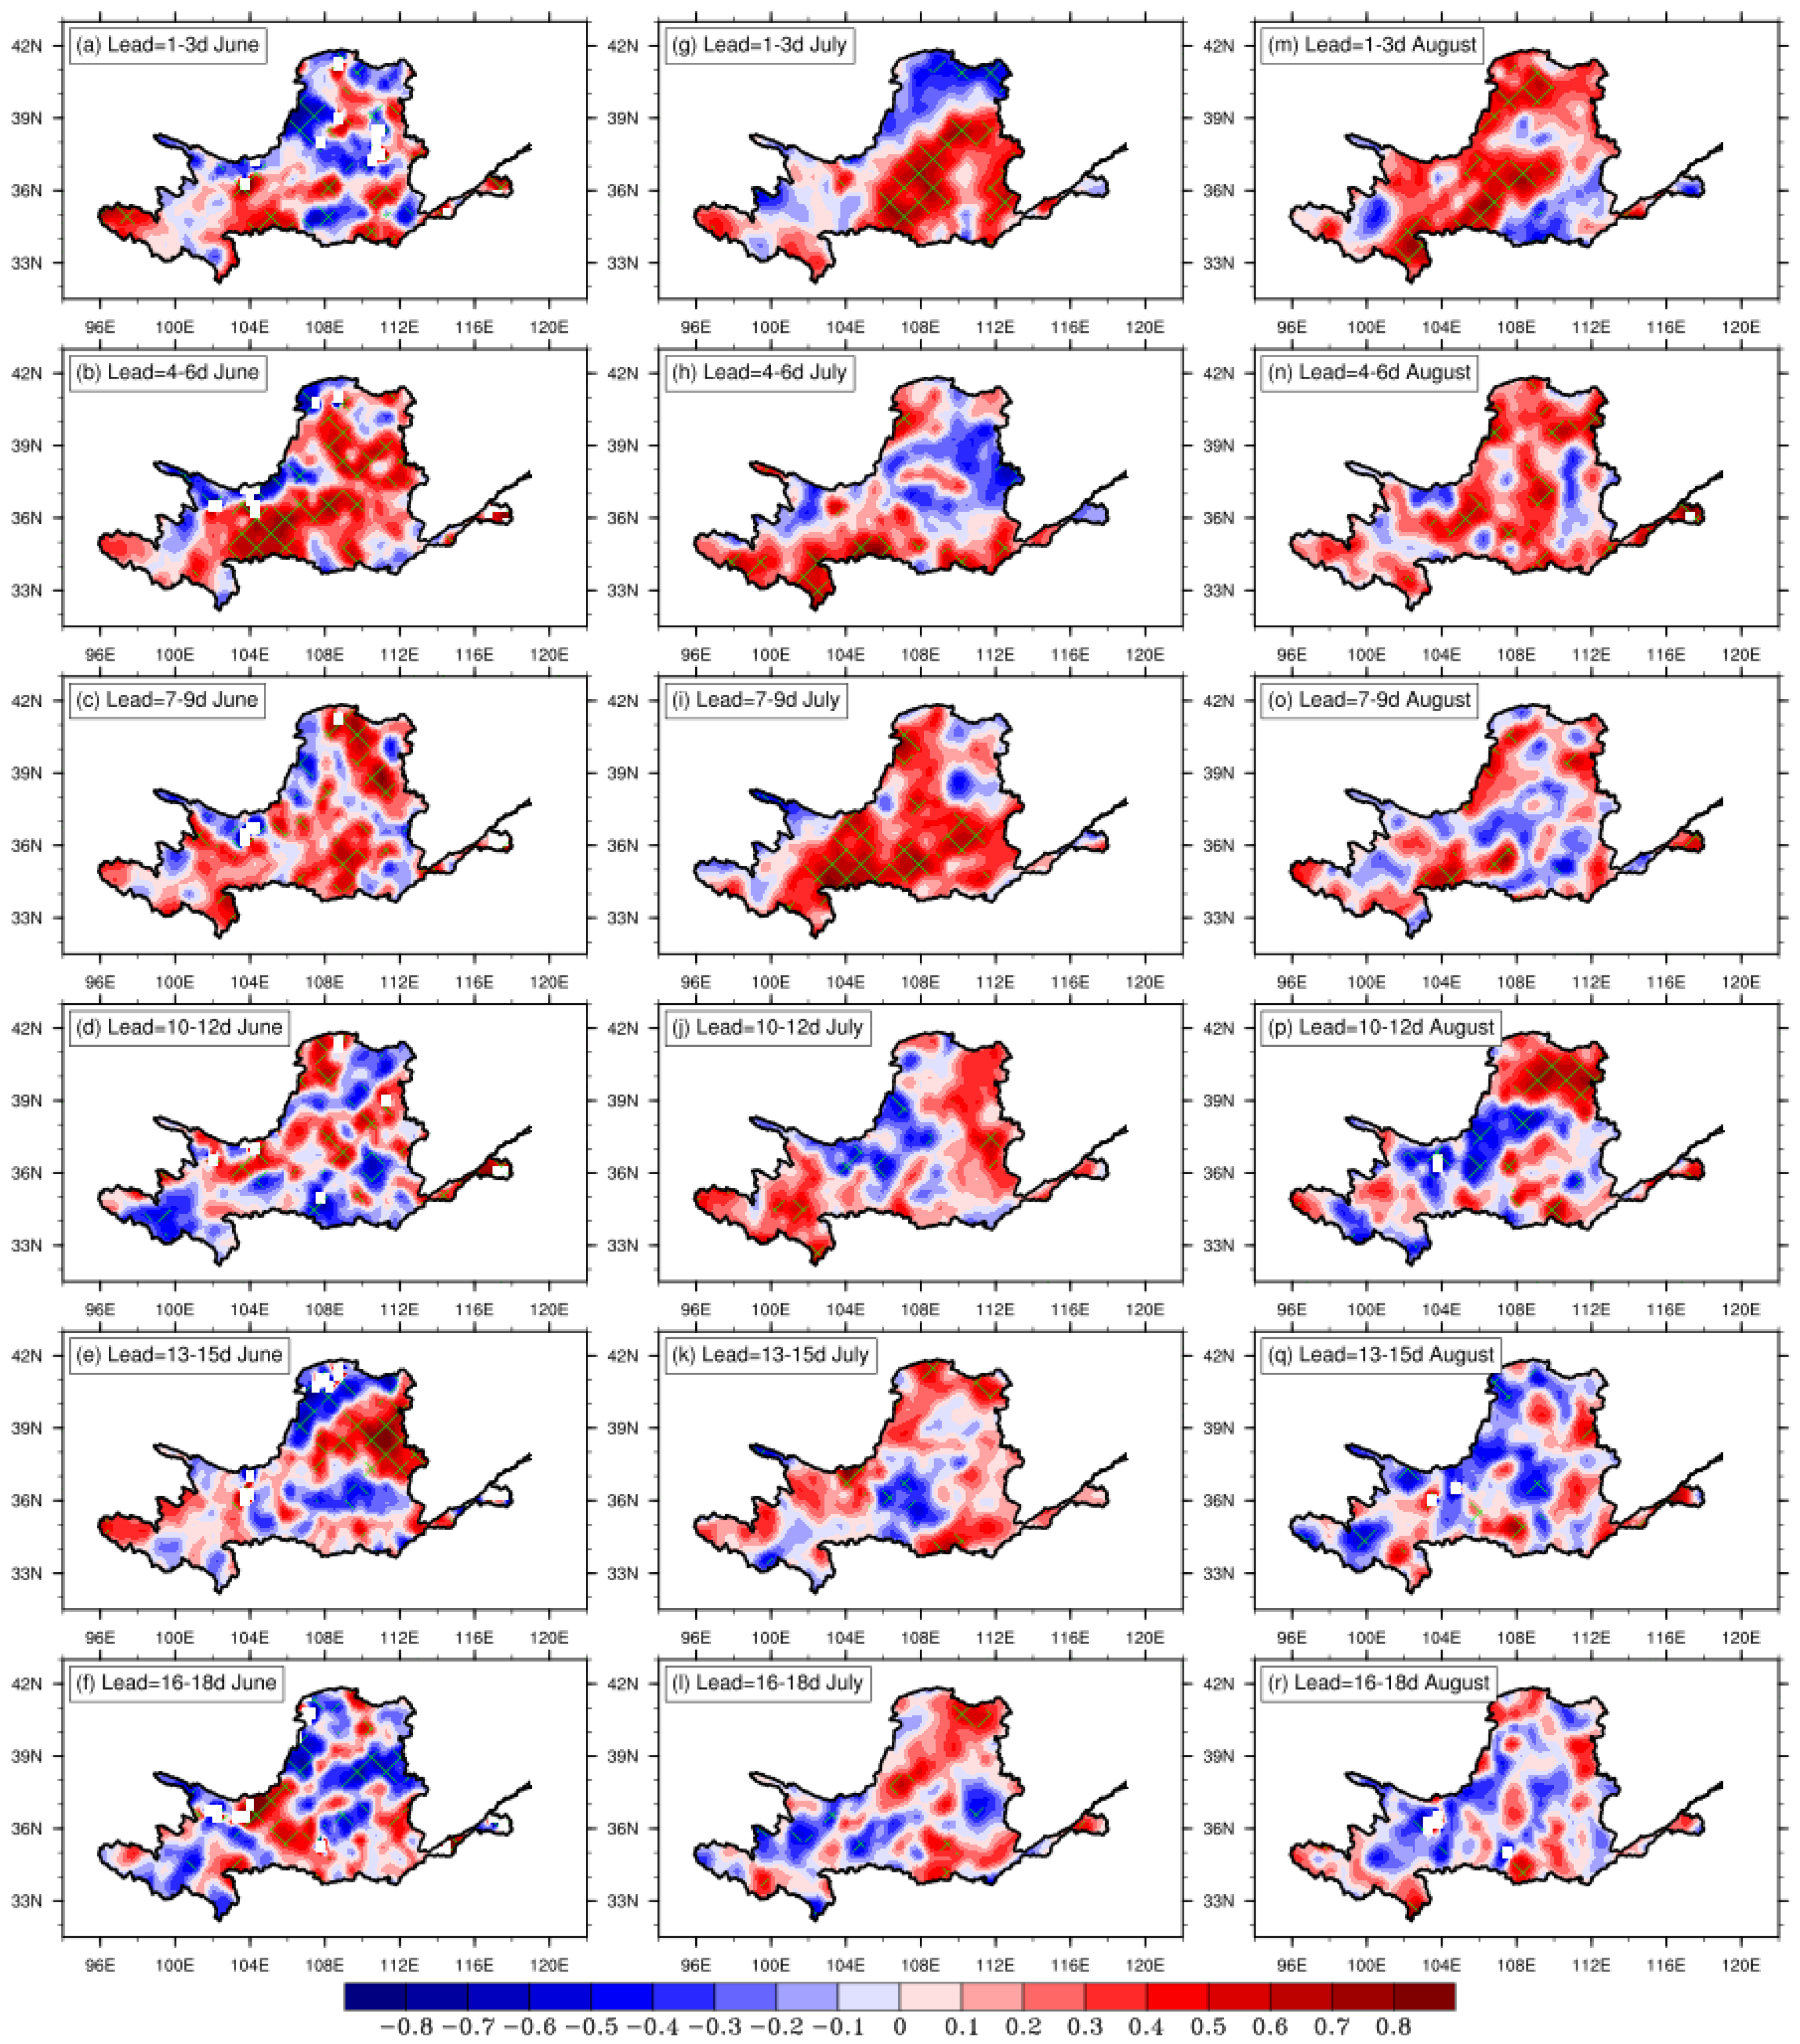
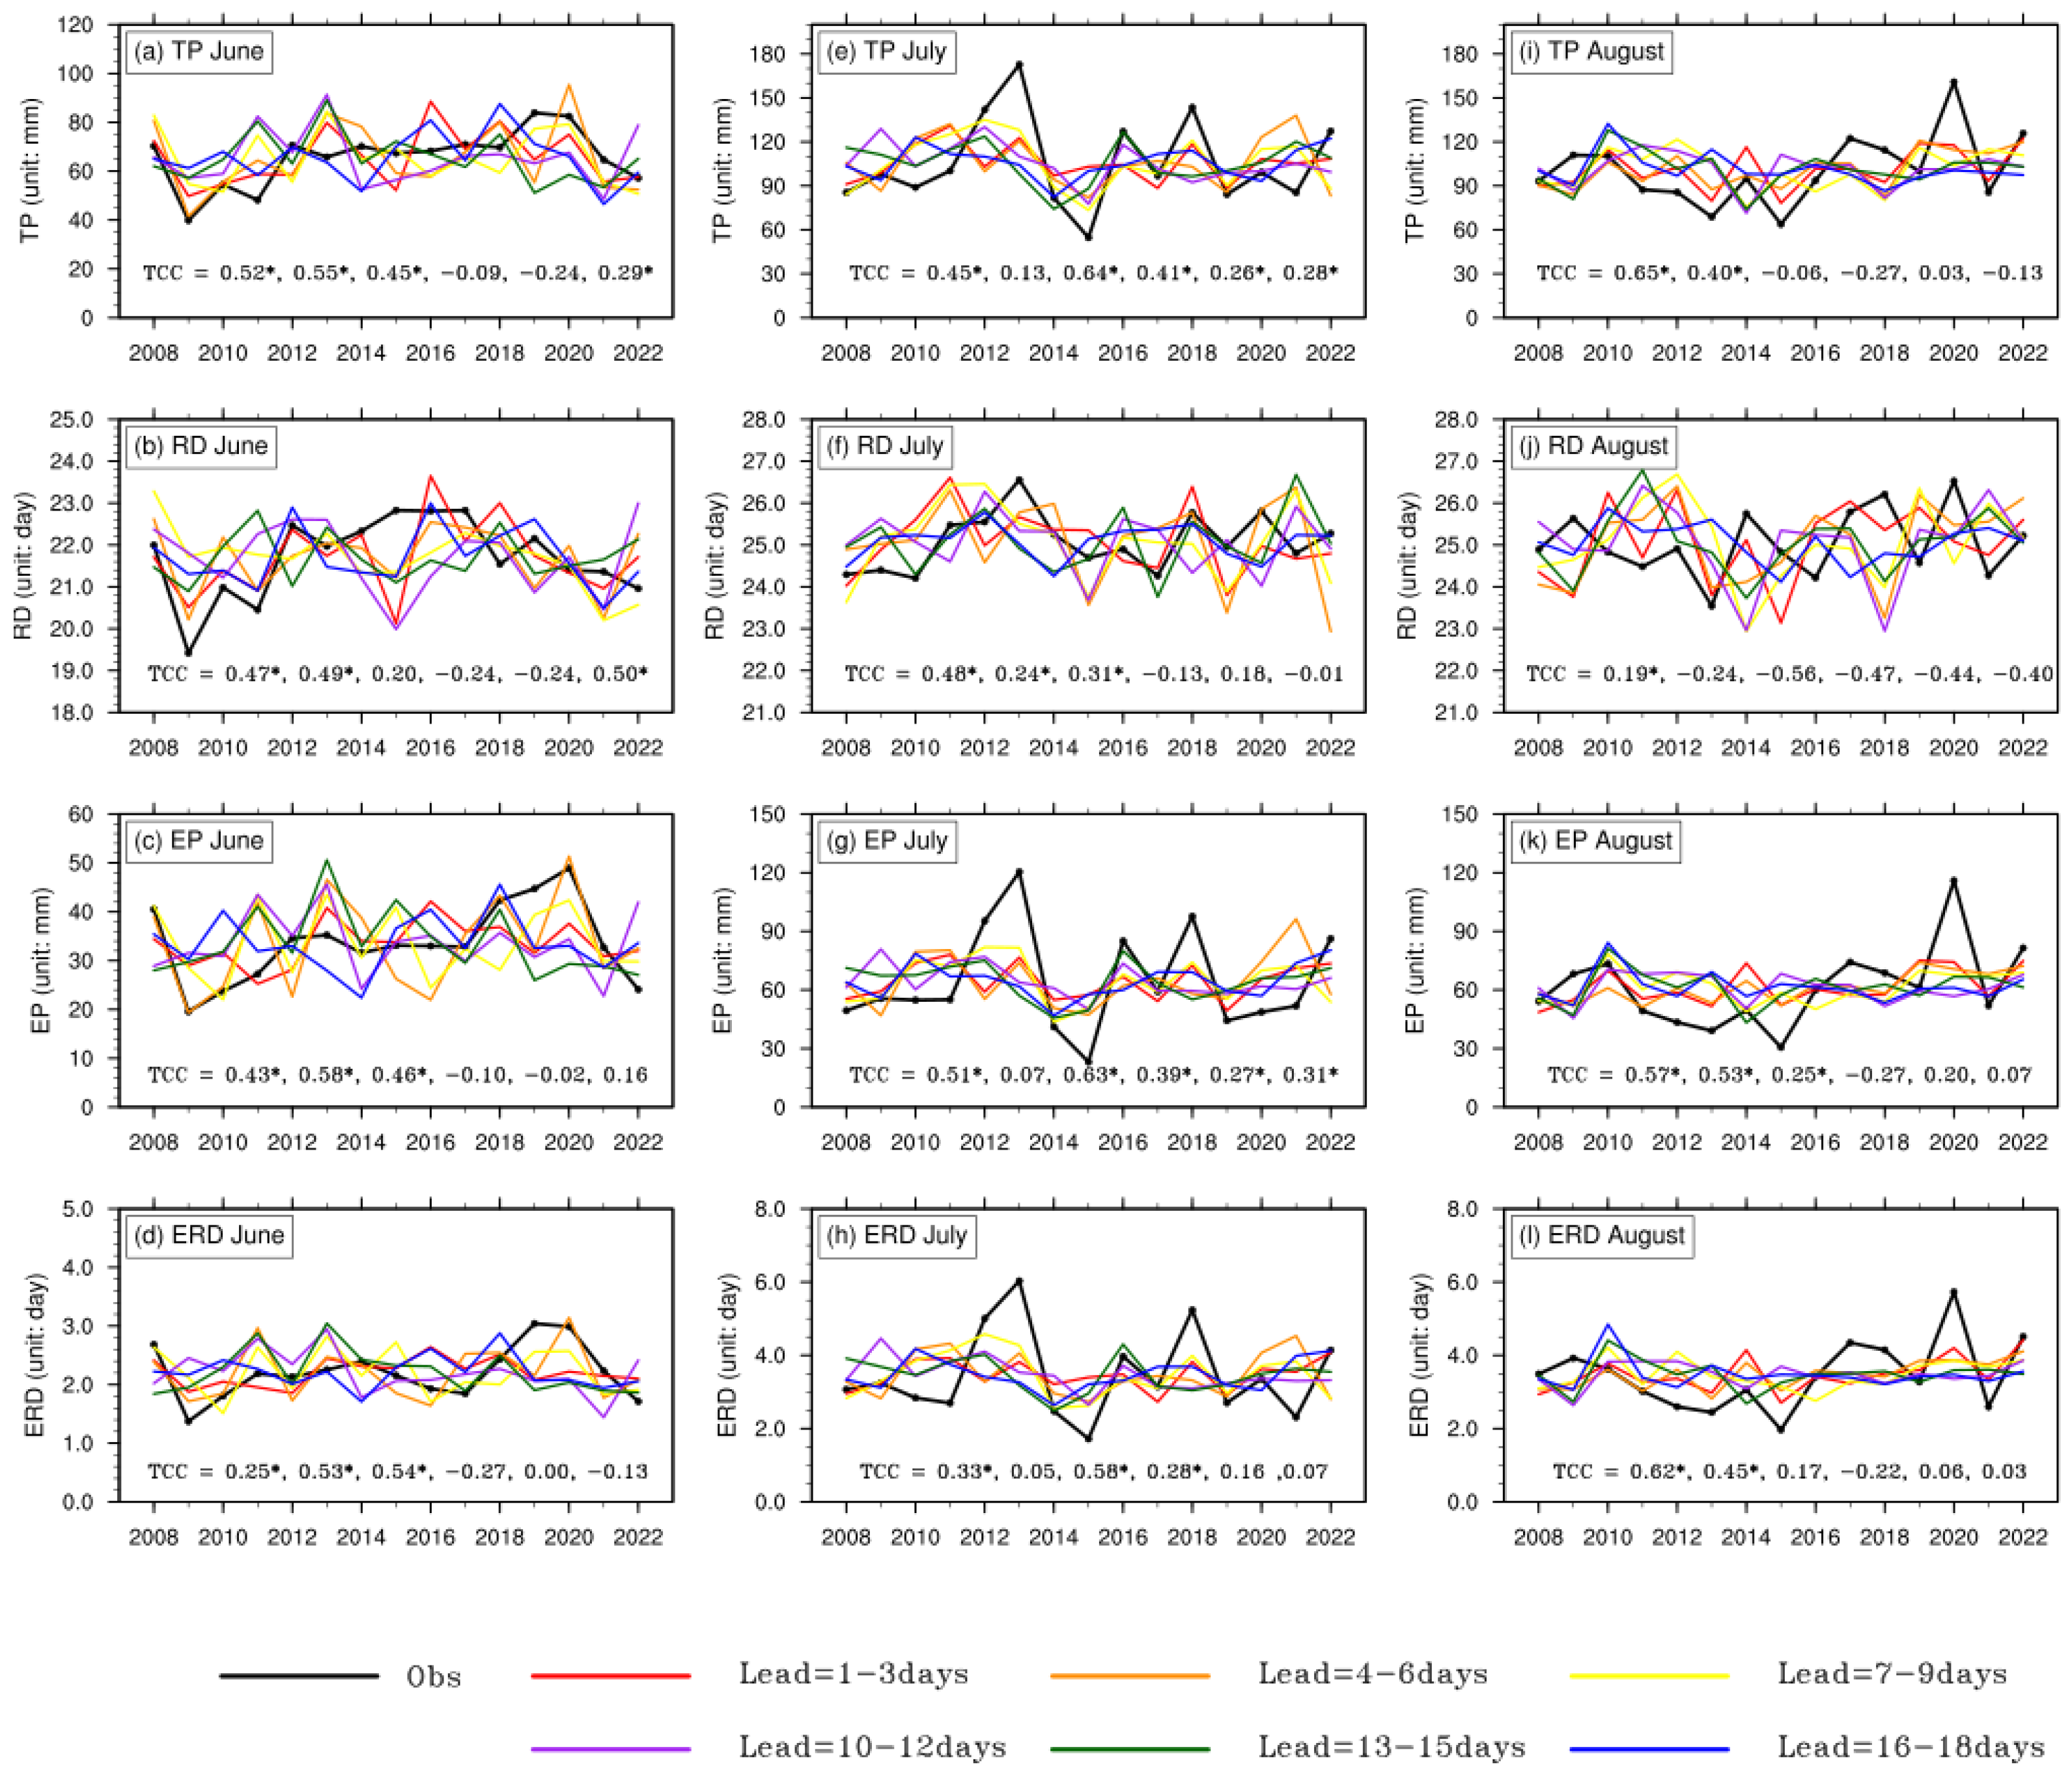
3.3. Monthly Prediction of Extreme Precipitation in the YRB

As revealed by the analysis in Section 3.2, systematic biases exist in the mean state and variability of the model. Consequently, for subsequent precipitation and extreme precipitation screening processes, we replaced the climatological mean state and standard deviation in model direct prediction with observational results to accurately adjust these systematic biases. The correction formula for a given grid point i in predicting the calendar day t at n days lead can be expressed as follows; P r e c i , l e a d = n , t c a l i b r a t i o n = P r e c i , l e a d = n , t B C C C P S v 3 S 2 S v 2 P r e c ¯ i , l e a d = n , t B C C C P S v 3 S 2 S v 2 S D i , l e a d = n , t B C C C P S v 3 S 2 S v 2 S D i , t C N 05.1 + P r e c ¯ i , t C N 05.1 , where P r e c ¯ and S D indicate the climatological mean precipitation and its standard deviation corresponding to the calendar day t, respectively. Based on this correction, Figure 5 presents the spatial distributions of TCC skills between monthly accumulation of precipitation from the BCC-CPSv3-S2Sv2 model predictions and observations over the YRB for June, July, and August. Here, the lead days (e.g., “1–3 days”, “4–6 days”, etc.) were defined as follows: For a target month (e.g., June 2010), lead of 1–3 days was calculated as accumulations of 1–30 June from forecasts initialized on 28–31 May. Lead 4–6 is calculated as accumulations of 1–30 June from forecasts initialized on 25–27 May. The rest can be performed in the same manner. Results show that at lead 1–3 days, most regions of the basin exhibit positive TCC. In June, TCC exceeds 0.4 in the upper basin, central–southern middle reaches, and downstream areas, with values surpassing 0.6 in partial middle reaches, while northwestern regions show skills below 0.2 or even negative values. When lead times extend to 4–9 days, relatively high skill persists in the upper basin and central middle reaches, but diminishes notably in other regions, particularly downstream.
For July, prediction skill in the upper basin decreases compared to June. At lead 1–3 days, high-skill areas (greater than 0.5) are concentrated in central and southern portions of the basin, whereas northern regions demonstrate negative skills. During 4–6 and 7–9 day leads, moderate skill persists in southern central areas, but most northern regions experience further skill degradation, which is particularly pronounced at 4–6 day leads. In August, significant high-skill regions (greater than 0.5) are primarily located in central basin areas at 1–3 day leads. Although most regions maintain positive skills at 4–6 day leads, these correlations generally fail to pass statistical significance tests. Prediction skills substantially deteriorate at 7–9 day leads, falling below those achieved during corresponding periods in June and July. Beyond 10-day leads, predictive skills for each month deteriorate markedly. Note that the negative TCC for July TP in the northern YRB may stem from the northward advance of the East Asian summer monsoon. This statistically insignificant negative TCC, combined with the weak positive TCC (also not significant) in June for northern YRB, collectively reflects the low predictability of interannual precipitation variability when monsoon circulation has not yet fully established dominance over the northern YRB region. In contrast, during August, after stable monsoon circulation governs the entire YRB, the predictive skill for the 1–3-day and 4–7-day lead can exceed that in June and July.
In addition to predictions of monthly accumulated precipitation, we also evaluated the prediction skill of the model for monthly accumulated precipitation days, as presented in Figure 6. Overall, the prediction skill for accumulated precipitation days is substantially lower than that for precipitation amounts. This is plausibly because TP, as a continuous variable, allows compensation for errors in weak precipitation events by heavy rainfall events. In contrast, RD is a discrete metric defined as the count of days with daily precipitation ≥ 1 mm, which exhibits high sensitivity to the detection accuracy of weak precipitation events. In any case, June exhibits the highest skill, followed by July, while August demonstrates the weakest performance, with forecast skills deteriorating markedly as lead times extend. For the accumulated precipitation day predictions in June, statistically significant skills are confined to central basin regions and persist only within approximately one-week leads. Predictions in July show limited skill concentrated in the southern middle reaches, which also maintains significance for about one week. The accumulated precipitation days in August prove particularly challenging to predict, displaying significant positive correlations only in the central and western parts of the basin with a 1–3 day lead.
The spatial pattern of skills may arise from enhanced precipitation variability during July–August following the onset of the rainy season in North China, which amplifies fluctuations in precipitation days. There are currently limitations in understanding mid-latitude precipitation day mechanisms, combined with difficulties in S2S models in capturing multi-scale temporal influences on precipitation days.
The aforementioned analysis reveals that the BCC-CPSv3-S2Sv2 model demonstrates suboptimal performance in monthly-scale predictions of both precipitation amounts and precipitation days. To further investigate extreme precipitation prediction capabilities, we define extreme precipitation amounts as precipitation exceeding the 90th percentile threshold and extreme precipitation days as days with precipitation ≥ the 90th percentile (Table 1), subsequently evaluating their monthly prediction skills, as illustrated in Figure 7 and Figure 8.
Overall, the model exhibits weaker predictive skills for extreme precipitation compared to total precipitation. Regarding extreme precipitation amounts (Figure 7), statistically significant skills in June and July are primarily confined to the southern–middle reaches of the basin, with July showing marginally higher skill than June, though predictive capability diminishes beyond 10-day leads. August demonstrates limited skill concentrated in the northern–middle reaches, persisting only within 1-week leads. Prediction skills for extreme precipitation days (Figure 8) mirror those of extreme precipitation amounts, with high-skill regions shifting progressively south-to-north from June to August. Significant skills for June–July are constrained within 10-day leads, while August skills rarely exceed 1 week. This spatial–temporal skill pattern reflects the northward progression of the rain belt over northern China during the summer. Notably, accurate prediction of extreme precipitation becomes increasingly challenging during late summer (August) when precipitation frequency peaks, likely due to enhanced atmospheric instability and complex multi-scale interactions characteristic of the mature monsoon phase.
In summary, we calculated the whole YRB-averaged interannual evolution of monthly total and extreme precipitation from observations and forecasts at different lead times, with the results presented in Figure 9. Consistent with previous analyses, statistically significant predictive skills for all metrics across months are essentially confined within a 10-day lead. Metrics related to precipitation amounts demonstrate relatively higher skill compared to those associated with precipitation days. However, from a basin-averaged perspective, extreme precipitation indices exhibit comparable prediction skills to total precipitation metrics. Notably, the interannual evolution reveals that predictive skill primarily originates from normal or below-normal precipitation years. For instance, the model successfully captured below-normal precipitation months such as June 2009, July 2019, and August 2021. Conversely, it completely failed to predict extreme wet months like July 2013, July 2018, and August 2020, which featured anomalously intense precipitation events.
These findings highlight that monthly extreme precipitation prediction using the BCC-CPSv3-S2Sv2 model remains a critical challenge, particularly for extremely wet years. Addressing this limitation requires enhanced understanding of extreme precipitation processes at monthly scales. Leveraging the extended forecast window of S2S models and developing dynamical–statistical downscaling approaches that integrate multi-scale physical mechanisms governing extreme precipitation could represent pivotal pathways for advancing monthly extreme precipitation prediction, but this still needs substantial research.

4. Summary and Discussion

This study systematically evaluates the monthly extreme precipitation prediction performance of the BCC-CPSv3-S2Sv2 model over the YRB using historical hindcast data from 2008 to 2022 and gridded observational data from the CN05.1 dataset. The evaluation encompasses three key aspects: overall performance in predicting daily precipitation rates, systematic biases, and monthly prediction of extreme precipitation metrics. The principal findings are summarized as follows.
The BCC-CPSv3-S2Sv2 model exhibits approximately 10-day predictive skill for summer daily precipitation over the YRB. Relatively higher skill regions concentrate in the central basin, while skill degradation proves more pronounced in downstream areas compared to the upper basin. Climatologically, the model systematically underestimates summer monthly mean precipitation rates and precipitation days across the basin, with this bias being particularly pronounced in the middle reaches. Results from different forecast initialization times consistently demonstrate weakened precipitation intensity across most middle basin regions during all three summer months, while the upper and downstream regions exhibit relatively stronger precipitation compared to observations. Biases in standard deviations exhibit patterns broadly similar to those of the climatological mean.
Following the correction of systematic model biases, the monthly predictions of TP, RD, EP, and ERD over the YRB were evaluated. Results indicate that prediction skills for total precipitation-related metrics significantly surpass those of extreme precipitation indices, and metrics related to precipitation amounts demonstrate relatively higher skill compared to those associated with precipitation days. TP and RD exhibit comparable skills in June and July, with August showing a weaker performance. Nevertheless, basin-wide predictions within 10-day leads remain practically valuable for all three months.
Prediction skills for extreme precipitation amounts and days demonstrate similar spatial–temporal patterns, with high-skill regions shifting progressively south-to-north from June to August. Significant skills for June–July are constrained within 10-day leads, while August skills rarely exceed 1 week. Basin-averaged results reveal that the predictive capability of the model primarily originates from normal or below-normal years, whereas the accurate prediction of extremely wet years (e.g., anomalously heavy precipitation episodes) still remains a critical challenge—highlighting fundamental limitations in capturing nonlinear physical mechanisms governing exceptional precipitation events.
Under global warming, extreme weather and climate events in the YRB have exhibited intensified characteristics of increased intensity, frequency, concurrency, and recurrence. The Chinese government explicitly mandated “one-month-ahead prediction of major weather processes” in the development objectives of meteorological operation, highlighting the urgent societal demand for monthly extreme precipitation prediction across multiple sectors. While this study primarily employs TCC to evaluate predictive skill, it may have inherent limitations in characterizing amplitude accuracy for operational forecasting. Some probabilistic metrics might be an appropriate aspect for predicting extreme precipitation, especially in monthly predictions. For instance, the hit rate of extreme events and some binary metrics better serve event-based decision-making. Future work should integrate probabilistic skill scores to bridge this gap. In addition, the current understanding of sub-seasonal evolution mechanisms and formation dynamics of extreme precipitation processes still remains insufficient. Particularly regarding multiscale influences, existing research has demonstrated that the sub-seasonal initiation and evolution characteristics of extreme precipitation processes are not only modulated by intraseasonal oscillations, but are also regulated by seasonal–interannual scale variability and even multidecadal oscillations [50,51,52]. Overall, it is difficult to claim that this model satisfies or does not satisfy the requirements of operational predictions for extreme precipitation, necessitating focused research on validation indices used in practical requirements, sub-seasonal prediction mechanisms, and technical methodologies specifically targeting extreme precipitation events in the future.

Author Contributions

Conceptualization, Z.L.; methodology, Z.L. and Z.X.; software, Z.X.; validation, Z.L. and Z.X.; formal analysis, Z.L. and Z.X.; data curation, J.K.; writing—original draft preparation, Z.X.; writing—review and editing, Z.L. and J.K.; visualization, Z.X., Z.L. and J.K. All authors have read and agreed to the published version of the manuscript.

Funding

This work was supported by the Science and Technology Project of State Grid Henan Electric Power Company (No. 52170223000N).

Institutional Review Board Statement

Not applicable.

Informed Consent Statement

Not applicable.

Data Availability Statement

The data will be available on request.

Conflicts of Interest

Zhe Li, Zhongyuan Xia, and Jiaying Ke are employees of Electric Power Science Research Institute, State Grid Henan Electric Power Company. The paper reflects the views of the scientists and not the company.

References

  1. Martinez-Villalobos, C.; Neelin, J.D. Regionally High Risk Increase for Precipitation Extreme Events under Global Warming. Sci. Rep. 2023, 13, 5579. [Google Scholar] [CrossRef] [PubMed]
  2. Myhre, G.; Alterskjær, K.; Stjern, C.W.; Hodnebrog, Ø.; Marelle, L.; Samset, B.H.; Sillmann, J.; Schaller, N.; Fischer, E.; Schulz, M.; et al. Frequency of Extreme Precipitation Increases Extensively with Event Rareness under Global Warming. Sci. Rep. 2019, 9, 16063. [Google Scholar] [CrossRef]
  3. Sheng, B.; Dong, B.; Wang, H.; Zhang, M.; Liu, Y.; Li, Q. Extremely Persistent Precipitation Events during April–June 2022 in the Southern China: Projected Changes at Different Global Warming Levels and Associated Physical Processes. Clim. Dyn. 2025, 63, 217. [Google Scholar] [CrossRef]
  4. Zhang, P.; Sun, W.; Xiao, P.; Yao, W.; Liu, G. Driving Factors of Heavy Rainfall Causing Flash Floods in the Middle Reaches of the Yellow River: A Case Study in the Wuding River Basin, China. Sustainability 2022, 14, 8004. [Google Scholar] [CrossRef]
  5. Hu, L.; Zhang, Q.; Wang, G.; Singh, V.P.; Wu, W.; Fan, K.; Shen, Z. Flood Disaster Risk and Socioeconomy in the Yellow River Basin, China. J. Hydrol. Reg. Stud. 2022, 44, 101272. [Google Scholar] [CrossRef]
  6. Liu, Q.; Yang, Z.; Cui, B. Spatial and Temporal Variability of Annual Precipitation during 1961–2006 in Yellow River Basin, China. J. Hydrol. 2008, 361, 330–338. [Google Scholar] [CrossRef]
  7. Ma, L.; Xia, H.; Sun, J.; Wang, H.; Feng, G.; Qin, F. Spatial–Temporal Variability of Hydrothermal Climate Conditions in the Yellow River Basin from 1957 to 2015. Atmosphere 2018, 9, 433. [Google Scholar] [CrossRef]
  8. Liang, K.; Liu, S.; Bai, P.; Nie, R. The Yellow River Basin Becomes Wetter or Drier? The Case as Indicated by Mean Precipitation and Extremes during 1961–2012. Theor. Appl. Climatol. 2015, 119, 701–722. [Google Scholar] [CrossRef]
  9. Xu, K.; Diao, Y.; Huang, P. Summer Precipitation Extremes over the Yellow River Loop Valley and Its Link to European Blocking. Atmosphere 2022, 13, 1140. [Google Scholar] [CrossRef]
  10. Wang, H.; Yang, Z.; Saito, Y.; Liu, J.P.; Sun, X. Interannual and Seasonal Variation of the Huanghe (Yellow River) Water Discharge over the Past 50 Years: Connections to Impacts from ENSO Events and Dams. Glob. Planet. Change 2006, 50, 212–225. [Google Scholar] [CrossRef]
  11. Yan, Z.; Wang, Z.; Peng, M. Impacts of Climate Trends on the Heavy Precipitation Event Associated with Typhoon Doksuri in Northern China. Atmos. Res. 2025, 314, 107816. [Google Scholar] [CrossRef]
  12. Xu, Y.; Fan, J.; Zhang, J.; Tian, L.; Zhang, H.; Cui, T.; Wang, Y.; Wang, R. Characteristics of Atmospheric Rivers and the Impact of Urban Roof Roughness on Precipitation during the “23.7” Extreme Rainstorm against the Background of Climate Warming. Atmosphere 2024, 15, 824. [Google Scholar] [CrossRef]
  13. Chen, S.; Lv, X.; Men, B. Impact of Cumulus Parameterization Schemes on Summer Extreme Precipitation Simulation in the Yellow River Basin: The 2018 Case. J. Water Clim. Change 2024, 15, 2267–2281. [Google Scholar] [CrossRef]
  14. Li, W.; Zhang, J.; Sun, R.; Duan, Q. Evaluation of Tianji and ECMWF High-Resolution Precipitation Forecasts for Extreme Rainfall Event in Henan in July 2021. Water Sci. Eng. 2023, 16, 122–131. [Google Scholar] [CrossRef]
  15. Feng, T.; Zhu, X.; Dong, W. Historical Assessment and Future Projection of Extreme Precipitation in CMIP6 Models: Global and Continental. Intl. J. Climatol. 2023, 43, 4119–4135. [Google Scholar] [CrossRef]
  16. Wei, L.; Xin, X.; Li, Q.; Wu, Y.; Tang, H.; Li, Y.; Yang, B. Simulation and Projection of Climate Extremes in China by Multiple Coupled Model Intercomparison Project Phase 6 Models. Intl. J. Climatol. 2023, 43, 219–239. [Google Scholar] [CrossRef]
  17. Xiao, H.; Zhuo, Y.; Jiang, P.; Zhao, Y.; Pang, K.; Zhang, X. Evaluation and Projection of Extreme Precipitation Using CMIP6 Model Simulations in the Yellow River Basin. J. Water Clim. Change 2024, 15, 2326–2347. [Google Scholar] [CrossRef]
  18. He, K.; Chen, X.; Zhou, J.; Zhao, D.; Yu, X. Compound Successive Dry-Hot and Wet Extremes in China with Global Warming and Urbanization. J. Hydrol. 2024, 636, 131332. [Google Scholar] [CrossRef]
  19. Lorenz, E.N. The Predictability of a Flow Which Possesses Many Scales of Motion. Tellus A Dyn. Meteorol. Oceanogr. 1969, 21, 289. [Google Scholar] [CrossRef]
  20. Lorenz, E.N. Atmospheric Predictability Experiments with a Large Numerical Model. Tellus A Dyn. Meteorol. Oceanogr. 1982, 34, 505. [Google Scholar] [CrossRef]
  21. Waliser, D.E.; Jin, K.; Kang, I.-S.; Stern, W.F.; Schubert, S.D.; Wu, M.L.C.; Lau, K.-M.; Lee, M.-I.; Krishnamurthy, V.; Kitoh, A.; et al. AGCM Simulations of Intraseasonal Variability Associated with the Asian Summer Monsoon. Clim. Dyn. 2003, 21, 423–446. [Google Scholar] [CrossRef]
  22. Vitart, F.; Ardilouze, C.; Bonet, A.; Brookshaw, A.; Chen, M.; Codorean, C.; Déqué, M.; Ferranti, L.; Fucile, E.; Fuentes, M.; et al. The Subseasonal to Seasonal (S2S) Prediction Project Database. Bull. Am. Meteorol. Soc. 2017, 98, 163–173. [Google Scholar] [CrossRef]
  23. Vitar, F.; Robertson, A.W.; Anderson, D. Subseasonal to Seasonal Prediction Project: Bridging the Gap between Weather and Climate. Bull. World Meteorol. Organ. 2012, 61, 23–28. [Google Scholar]
  24. Vitart, F.; Robertson, A.W. The Sub-Seasonal to Seasonal Prediction Project (S2S) and the Prediction of Extreme Events. npj Clim. Atmos. Sci. 2018, 1, 3. [Google Scholar] [CrossRef]
  25. Ren, H.-L.; Bao, Q.; Zhou, C.; Wu, J.; Gao, L.; Wang, L.; Ma, J.; Tang, Y.; Liu, Y.; Wang, Y.; et al. Seamless Prediction in China: A Review. Adv. Atmos. Sci. 2023, 40, 1501–1520. [Google Scholar] [CrossRef]
  26. Liu, L.; Wang, G.; Xiao, C. Application of S2S Climate Model Products in Runoff Prediction in the Yellow River Basin. Meteor. Mon. 2023, 49, 1396–1404. (In Chinese) [Google Scholar]
  27. White, C.J.; Carlsen, H.; Robertson, A.W.; Klein, R.J.T.; Lazo, J.K.; Kumar, A.; Vitart, F.; Coughlan De Perez, E.; Ray, A.J.; Murray, V.; et al. Potential Applications of Subseasonal-to-seasonal (S2S) Predictions. Meteorol. Appl. 2017, 24, 315–325. [Google Scholar] [CrossRef]
  28. White, C.J.; Domeisen, D.I.V.; Acharya, N.; Adefisan, E.A.; Anderson, M.L.; Aura, S.; Balogun, A.A.; Bertram, D.; Bluhm, S.; Brayshaw, D.J.; et al. Advances in the Application and Utility of Subseasonal-to-Seasonal Predictions. Bull. Am. Meteorol. Soc. 2022, 103, E1448–E1472. [Google Scholar] [CrossRef]
  29. Hudson, D.; Marshall, A.G.; Alves, O. Intraseasonal Forecasting of the 2009 Summer and Winter Australian Heat Waves Using POAMA. Wea. Forecast. 2011, 26, 257–279. [Google Scholar] [CrossRef]
  30. Liang, P.; Lin, H. Sub-Seasonal Prediction over East Asia during Boreal Summer Using the ECCC Monthly Forecasting System. Clim. Dyn. 2018, 50, 1007–1022. [Google Scholar] [CrossRef]
  31. Li, X.; Wei, Z.; Ma, L. Prediction Abilities of Subseasonal-to-seasonal Models for Regional Rainstorm Processes in South China. Intl J. Climatol. 2023, 43, 2896–2912. [Google Scholar] [CrossRef]
  32. Liu, S.; Li, W.; Duan, Q. Spatiotemporal Variations in Precipitation Forecasting Skill of Three Global Subseasonal Prediction Products over China. J. Hydrometeorol. 2023, 24, 2075–2090. [Google Scholar] [CrossRef]
  33. Marshall, A.G.; Hendon, H.H. Subseasonal Prediction of Australian Summer Monsoon Anomalies. Geophys. Res. Lett. 2015, 42, 10913–10919. [Google Scholar] [CrossRef]
  34. Jie, W.; Vitart, F.; Wu, T.; Liu, X. Simulations of the Asian Summer Monsoon in the Sub-seasonal to Seasonal Prediction Project (S2S) Database. Quart. J. R. Meteoro Soc. 2017, 143, 2282–2295. [Google Scholar] [CrossRef]
  35. Yan, Y.; Liu, B.; Zhu, C. Subseasonal Predictability of South China Sea Summer Monsoon Onset with the ECMWF S2S Forecasting System. Geophys. Res. Lett. 2021, 48, e2021GL095943. [Google Scholar] [CrossRef]
  36. Zhou, Y.; Yang, B.; Chen, H.; Zhang, Y.; Huang, A.; La, M. Effects of the Madden–Julian Oscillation on 2-m Air Temperature Prediction over China during Boreal Winter in the S2S Database. Clim. Dyn. 2019, 52, 6671–6689. [Google Scholar] [CrossRef]
  37. Wu, J.; Ren, H.; Jia, X.; Zhang, P. Climatological Diagnostics and Subseasonal-to-seasonal Predictions of Madden–Julian Oscillation Events. Intl. J. Climatol. 2023, 43, 2449–2464. [Google Scholar] [CrossRef]
  38. Zhu, H.; Chen, H.; Zhou, Y.; Dong, X. Evaluation of the Subseasonal Forecast Skill of Surface Soil Moisture in the S2S Database. Atmos. Ocean. Sci. Lett. 2019, 12, 467–474. [Google Scholar] [CrossRef]
  39. Lee, C.-Y.; Camargo, S.J.; Vitart, F.; Sobel, A.H.; Camp, J.; Wang, S.; Tippett, M.K.; Yang, Q. Subseasonal Predictions of Tropical Cyclone Occurrence and ACE in the S2S Dataset. Weather. Forecast. 2020, 35, 921–938. [Google Scholar] [CrossRef]
  40. Robertson, A.W.; Vitart, F.; Camargo, S.J. Subseasonal to Seasonal Prediction of Weather to Climate with Application to Tropical Cyclones. JGR Atmos. 2020, 125, e2018JD029375. [Google Scholar] [CrossRef]
  41. White, C.J.; Franks, S.W.; McEvoy, D. Using Subseasonal-to-Seasonal (S2S) Extreme Rainfall Forecasts for Extended-Range Flood Prediction in Australia. Proc. IAHS 2015, 370, 229–234. [Google Scholar] [CrossRef]
  42. Domeisen, D.I.V.; White, C.J.; Afargan-Gerstman, H.; Muñoz, Á.G.; Janiga, M.A.; Vitart, F.; Wulff, C.O.; Antoine, S.; Ardilouze, C.; Batté, L.; et al. Advances in the Subseasonal Prediction of Extreme Events: Relevant Case Studies across the Globe. Bull. Am. Meteorol. Soc. 2022, 103, E1473–E1501. [Google Scholar] [CrossRef]
  43. Liang, X.; Vitart, F.; Wu, T. Evaluation of Probabilistic Forecasts of Extreme Cold Events in S2S Models. Water 2023, 15, 2795. [Google Scholar] [CrossRef]
  44. Rivoire, P.; Martius, O.; Naveau, P.; Tuel, A. Assessment of Subseasonal-to-Seasonal (S2S) Ensemble Extreme Precipitation Forecast Skill over Europe. Nat. Hazards Earth Syst. Sci. 2023, 23, 2857–2871. [Google Scholar] [CrossRef]
  45. Rao, J.; Garfinkel, C.I.; Chen, H.; White, I.P. The 2019 New Year Stratospheric Sudden Warming and Its Real-Time Predictions in Multiple S2S Models. JGR Atmos. 2019, 124, 11155–11174. [Google Scholar] [CrossRef]
  46. He, H.; Yao, S.; Huang, A.; Gong, K. Evaluation and Error Correction of the ECMWF Subseasonal Precipitation Forecast over Eastern China during Summer. Adv. Meteorol. 2020, 2020, 1920841. [Google Scholar] [CrossRef]
  47. Peng, Y.; Liu, X.; Su, J.; Liu, X.; Zhang, Y. Skill Improvement of the Yearly Updated Reforecasts in ECMWF S2S Prediction from 2016 to 2022. Atmos. Ocean. Sci. Lett. 2023, 16, 100357. [Google Scholar] [CrossRef]
  48. Wu, J.; Ren, H.-L.; Zhang, P.; Wang, Y.; Liu, Y.; Zhao, C.; Li, Q. The Dynamical-Statistical Subseasonal Prediction of Precipitation over China Based on the BCC New-Generation Coupled Model. Clim. Dyn. 2022, 59, 1213–1232. [Google Scholar] [CrossRef]
  49. Wu, J.; Gao, X.-J. A Gridded Daily Observation Dataset over China Region and Comparison with the Other Datasets. Chin. J. Geophys. 2013, 56, 1102–1111. (In Chinese) [Google Scholar]
  50. Qiu, D.; Wu, C.; Mu, X.; Zhao, G.; Gao, P. Changes in Extreme Precipitation in the Wei River Basin of China during 1957–2019 and Potential Driving Factors. Theor. Appl. Climatol. 2022, 149, 915–929. [Google Scholar] [CrossRef]
  51. Song, L.; Tian, Q.; Li, Z.; Lv, Y.M.; Gui, J.; Zhang, B.; Cui, Q. Changes in Characteristics of Climate Extremes from 1961 to 2017 in Qilian Mountain Area, Northwestern China. Environ. Earth Sci. 2022, 81, 177. [Google Scholar] [CrossRef]
  52. Wang, H.; Asefa, T.; Erkyihun, S. Interannual Variabilities of the Summer and Winter Extreme Daily Precipitation in the Southeastern United States. J. Hydrol. 2021, 603, 127013. [Google Scholar] [CrossRef]
Figure 1. Topographical features of YRB (shading denotes terrain height, unit: m). Black curve denotes the YRB region.
Atmosphere 16 00830 g001
Figure 2. TCC skills for daily precipitation rate anomaly in the YRB based on observations and lead: (a) 0 day, (b) 3 day, (c) 6 day, (d) 9 day, (e) 10 day, and (f) 15 day predictions by BCC-CPSv3-S2Sv2 in JJA. The green meshes represent the TCCs that are statistically significant at 0.05 significance level.
Atmosphere 16 00830 g002
Figure 3. (a) Observed climatological mean precipitation rate (unit: mm/day) in June. (bg) Differences in climatological mean precipitation rate (unit: mm/day) in June between BCC-CPSv3-S2Sv2 predictions in lead: (b) 0 day, (c) 3 day, (d) 6 day, (e) 9 day, (f) 12 day, and (g) 15 day and observation. (hn) Same as in (ag), but for July. (ou) Same as in (ag), but for August.
Atmosphere 16 00830 g003
Figure 4. (a) Observed standard deviation of precipitation rate (unit: mm/day) in June. (bg) Differences in standard deviation of precipitation rate (unit: mm/day) in June between BCC-CPSv3-S2Sv2 predictions in lead: (b) 0 day, (c) 3 day, (d) 6 day, (e) 9 day, (f) 12 day, and (g) 15 day and observation. (hn) Same as in (ag), but for July. (ou) Same as in (ag), but for August.
Atmosphere 16 00830 g004
Figure 5. (af) TCC skills for TP in June at lead (a) 1–3 day, (b) 4–6 day, (c) 7–9 day, (d) 10–12 day, (e) 13–15 day, and (f) 16–18 day predictions by BCC-CPSv3-S2Sv2. (gl) Same as in (af), but for July. (mr) Same as in (af), but for August. The green meshes represent the correlation coefficients that are statistically significant at a 0.05 significance level.
Atmosphere 16 00830 g005
Figure 6. (af) TCC skills for RD in June at lead (a) 1–3 day, (b) 4–6 day, (c) 7–9 day, (d) 10–12 day, (e) 13–15 day, and (f) 16–18 day predictions by BCC-CPSv3-S2Sv2. (gl) Same as in (af), but for July. (mr) Same as in (af), but for August. The green meshes represent the correlation coefficients that are statistically significant at a 0.05 significance level.
Atmosphere 16 00830 g006
Figure 7. (af) TCC skills for EP in June at lead (a) 1–3 day, (b) 4–6 day, (c) 7–9 day, (d) 10–12 day, (e) 13–15 day, and (f) 16–18 day predictions by BCC-CPSv3-S2Sv2. (gl) Same as in (af), but for July. (mr) Same as in (af), but for August. The green meshes represent the correlation coefficients that are statistically significant at a 0.05 significance level.
Atmosphere 16 00830 g007
Figure 8. (af) TCC skills for ERD in June at lead (a) 1–3 day, (b) 4–6 day, (c) 7–9 day, (d) 10–12 day, (e) 13–15 day, and (f) 16–18 day predictions by BCC-CPSv3-S2Sv2. (gl) Same as in (af), but for July. (mr) Same as in (af), but for August. The green meshes represent the correlation coefficients that are statistically significant at a 0.05 significance level.
Atmosphere 16 00830 g008
Figure 9. (ad) Interannual variations in regionally averaged (a) TP (unit: mm), (b) RD (unit: day), (c) EP (unit: mm), and (d) ERD (unit: day) in observation (black dot lines) and BCC-CPSv3-S2Sv2 predictions at lead 1–3 days (red lines), 4–6 days (dark orange lines), 7–9 days (yellow lines), 10–12 days (purple lines), 13–15 days (dark green lines), and 16–18 days (blue lines) from 2008 to 2022. TCC skills at corresponding leads are attached in each plot. The asterisks represent the TCCs that are statistically significant at a 0.05 significance level. (eh) Same as in (ad), but for July. (il) Same as in (ad), but for August.
Atmosphere 16 00830 g009
Table 1. Definitions of precipitation index in this study.
Index NameAbbreviationDefinitionUnit
Total precipitationTPAccumulation of precipitation mm
Rainy daysRDDays with precipitation ≥ 1 mmd
Extreme precipitationEPPrecipitation above the 90th percentilemm
Extreme rainy daysERDDays with precipitation ≥ the 90th percentiled
Disclaimer/Publisher’s Note: The statements, opinions and data contained in all publications are solely those of the individual author(s) and contributor(s) and not of MDPI and/or the editor(s). MDPI and/or the editor(s) disclaim responsibility for any injury to people or property resulting from any ideas, methods, instructions or products referred to in the content.

