1. Introduction
With global warming, the increase in extreme precipitation is one of its most influential consequences, and the monitoring and early warning of regional extreme precipitation is more difficult due to the natural variability and the shortcomings of related physical models [
1]. Extreme rainfall events usually refer to precipitation events that occur when the weather deviates significantly from the mean climate state, and the Fourth Assessment Report of the Intergovernmental Panel on Climate Change (IPCC) gives a clear definition of extreme weather events: an extreme large precipitation event is a weather event that occurs “with an occurrence probability below the 10th percentile or above the 90th percentile of the observational record’s probability density function, ” [
2].The type of extreme precipitation examined in this study primarily refers to extremely heavy precipitation events. Although the probability of occurrence is minimal, such precipitation phenomena are usually accompanied by natural disasters such as floods, landslides, mudslides, etc. [
3], which cause great negative impacts on normal human production and life.
In recent years, extreme weather has been occurring more frequently [
4], and extreme precipitation events have a significant impact on China’s socio-economic development and ecological environment due to their suddenness and hazardousness [
5]. For example, the “7·21” extreme precipitation event in Beijing in 2012 resulted in a 12 h rainfall accumulation of 460.0 mm, impacting more than 1.6 million individuals and leading to direct financial damages surpassing CNY 11 billion [
6]. In 2021, Henan Province experienced a rare extreme precipitation event. On July 20, the 24 h rainfall in Zhengzhou reached 552.5 mm, exceeding 80% of the city’s annual average precipitation. The torrential rain caused 302 deaths, and 50 people went missing. The spatial patterns of extreme rainfall in China have significant differences, with the eastern plains and coastal areas being the high-incidence areas [
7], while Zhejiang Province has a complex topography, dominated by mountains and hills and a dense river network, which is a frequent area of heavy rainfall disasters. According to the incomplete statistics of the 16th Zhejiang Meteorological Disaster Monitoring Weekly Report in 2019, only Typhoon 1909, “Lichima”, triggered direct economic losses totaling approximately CNY 24.22 billion in Zhejiang Province [
8]; on 18 June 2010, a landslide induced by short-term heavy rainfall in Longquan City of Zhejiang Province resulted in five deaths and one injury; and on 13 August 2004, in the northern mountainous area of Yueqing City in Wenzhou City, Zhejiang Province. The “Yunna” typhoon caused heavy precipitation which induced a large mudslide geological disaster, resulting in 39 deaths and eight missing people [
9]. Therefore, the applications of satellite rainfall products for monitoring and forecasting extreme precipitation events has become a key step for effective disaster risk reductions.
As a province at the forefront of China’s economic development and scientific and technological innovation, Zhejiang Province is pivotal to national economic success. In order to more accurately monitor extreme precipitation and achieve efficient early warnings, it is particularly important to further strengthen meteorological research in the region. Strengthening the monitoring of extreme precipitation in Zhejiang Province will not only help to improve the disaster prevention and control capability but also provide an effective guarantee for the regional economic development.
Currently, precipitation monitoring in Zhejiang Province mainly relies on station monitoring at ground meteorological stations, meteorological and hydrological stations and ground-based radar monitoring. Although ground-based radar can provide real-time precipitation data, its monitoring range is relatively limited and may be affected by obstructions by ground objects, resulting in a decrease in monitoring accuracy. Site monitoring, on the other hand, is widely used for precipitation monitoring due to its high accuracy, data reliability and ease of processing. However, there is also the problem of the uneven distribution of stations, especially in mountainous and hilly regions, where the observational data availability is constrained, limiting its spatial coverage. As Zhejiang Province is dominated by mountainous and hilly terrains, observations from the stations do not fully reflect the precipitation characteristics of the region, making it difficult to achieve the accurate monitoring of extreme precipitation events in Zhejiang Province. As the remote sensing technology rapidly developed, satellite data has become the main auxiliary source for precipitation monitoring, and the use of remote sensing technology for extreme precipitation monitoring is highly advantageous owing to its high spatiotemporal resolution, wide spatial coverage, near real-time, good continuity and easy accessibility [
10,
11,
12]. Xiao et al. [
13] assessed the accuracy of GPM satellite rainfall during typhoon-induced extreme precipitation. The results show that GPM IMERG is better at reproducing precipitation in small rainfall areas than in moderate precipitation areas, while it exhibits overestimations in reproducing heavy precipitation events. Tapiador et al. [
14] studied the IMERG product line and found that the precipitation values from the IMERG product are more suitable for hydrological studies than the results interpolated from ground measurements. This shows that satellite precipitation exhibits a varying retrieval performance and applicability in different terrain and climatic conditions, so it is extremely important to assess the satellite rainfall performance when conducting climate and hydrological studies.
In summary, satellite technology has a great application potential in the context of extreme weather. In monitoring extreme precipitation, satellites are able to provide precipitation information in remote areas that are difficult to be covered by ground meteorological stations, especially in mountainous areas, which has advantages that are incomparable to traditional observation means [
15]. In addition, the implementation of satellite data in hydrology is also extremely important, which provides flood predictions, water resource management and drought monitoring. It provides accurate initial data and dynamic monitoring for flood forecasting, drought monitoring and water resources management and can promote the integration of meteorological and hydrological fields [
16]. However, various types of satellite precipitation products may not be applicable to all precipitation situations or regions, so it is significant to pre-evaluate the monitoring capability of satellite rainfall under different conditions before addressing whether satellite precipitation products can be utilized to assist in the monitoring of precipitation in a particular region. In this study, Zhejiang Province, which is a high-incidence area of heavy rainfall in China, is selected as the study area, and the GPM IMERG-Late dataset, one of the most widely used satellite precipitation products in extreme precipitation early warning, is selected as the evaluation object to assess its monitoring of the extreme rainfall in Zhejiang Province from 2001 to 2020, to provide scientific guidance for extreme rainfall monitoring in Zhejiang Province and, at the same time, to provide safe and reliable protection for the life and property of the local people, as well as scientific data support for the arrangement of agricultural production.
Previous studies have established that satellite precipitation products like GPM IMERG exhibit variable accuracy [
13], while demonstrating a superior utility for hydrological applications compared to ground-based interpolations [
14]. Despite their advantages in spatiotemporal coverage, especially for mountainous regions [
10,
11,
12,
15], critical gaps remain in evaluating their performance for extreme precipitation in subtropical monsoon climates like Zhejiang Province, China. This study aims to address the key research gaps: (1) the lack of a comprehensive validation of IMERG-Late’s capability to monitor extreme rainfall in Zhejiang’s complex terrain, including mountains, hills and dense river networks; (2) the insufficient quantification of its ability to capture observed eastward-increasing precipitation trends; and (3) limited long-term (2001–2020) assessments for coastal East Asia and the need for actionable insights to improve disaster early warning systems. This study evaluates IMERG-L’s performance across precipitation intensities, with extreme events as a key focus due to their societal impact. By bridging these gaps, our work provides scientific support for operational extreme weather monitoring and risk mitigation in economically vital yet vulnerable monsoon regions. This paper is organized as follows:
Section 2 describes the study area and datasets,
Section 3 presents the methodology,
Section 4 details the results and
Section 5 provides the conclusions and discussion.
3. Methodology
In this study, seven indices characterizing extreme precipitation were selected for assessing the monitoring accuracy of the IMERG-Late product for extreme rainfall in Zhejiang Province, based on 7 of the 27 environmental change indices developed by the Expert Team on Climate Change Detection and Indices (ETCCDI) under the World Meteorological Organization (WMO) and the World Climate Research Programme (WCRP), which are based on daily rainfall [
27]. The specific interpretations of the seven indices are shown in
Table 1. While the intensity and frequency indices were calculated monthly using daily data and their means plotted, the duration index was calculated and plotted over the full periods from 2001 to 2020.
This study applies the multiple error assessment metrics for quantitative Meteosat products as employed by Ebert et al. [
28], specifically the correlation coefficient (CORR), mean absolute error (MAE), relative bias (RB) and root mean square error (RMSE). The value of the integrated correlation coefficient ranges from −1 to 1, reflecting the linear relationship between the satellite data and the ground observations—the larger the absolute value, the higher the correlation—and the significant correlation is when the absolute value is above 0.7. The mean absolute error can measure the overall level of the satellite data error. The relative bias denotes the degree of deviation of the satellite data relative to the ground station observation data, with the optimal value of 0. The RMSE reflects the relationship between the satellite data and the ground observations. The error reflects the dispersion between satellite precipitation data and the measured values of the stations, and the optimal value is 0. The detailed formulas for computing each statistical metrics are summarized below:
where n denotes the samples number,
is the satellite precipitation,
denotes the mean satellite precipitation,
represents the surface precipitation data and
is the mean surface precipitation data.
Based on the meteorological classification of precipitation levels, we utilized Probability of Detection (POD), Critical Success Index (CSI) and False Alarm Ratio (FAR) to assess its ability to monitor whether precipitation is occurring or not and the ability to monitor precipitation with different levels. Based on the definitions of the selected thresholds and indicators for the assessment of detection capability, the following formulae were selected as a reference for the calculations:
where POD characterizes the ability of satellite estimation to correctly capture extreme precipitation events; FAR characterizes the degree of misestimation of extreme precipitation events by satellite estimation; and CSI combines POD and FAR and characterizes the ability of satellite estimation to estimate truly extreme rain events. A represents the number of precipitation events accurately estimated by the satellite product, B represents the number of incorrectly estimated precipitation events and C represents the number omitted precipitation events. The values of POD, FAR and CSI are all in the range of [0, 1], and the ideal values for POD and CSI are 1.0, and for FAR it is 0.0.
4. Results
4.1. Comparison of Spatial Distribution Characteristics of Extreme Precipitation Indices
Figure 2 presents the spatial patterns of the longest continuously wet days (CWD) of the longest consecutive rain-free days in Zhejiang during the study period for both the observational and satellite data. The CWD can reflect the degree of the regional wetness to some extent.
Figure 2a reveals a predominant CWD range of 20–35 days across Zhejiang Province, covering 90% of the study area, with localized anomalies exceeding 35 days in southwestern highlands with a maximum of 42 days and dipping below 18 days in northern coastal zones with the minimum of below 14 days. The continuous rainfall in Zhejiang Province is mainly concentrated in the central as well as the southwestern regions, with the vast majority of CWD reaching more than 25 days, and the CWD of Wenzhou Wencheng in the south reaching 45 days.
IMERG-L reproduces the observed northeast-to-southwest CWD gradient yet systematically underestimates magnitudes by around 20–30%, with CWD ranges between 16 and 23 days, and the highest value of 23 days is distributed only in some southwestern as well as southern parts of the country. This difference may be caused by the deficiency in the precipitation detection capability of the satellite data. While satellite precipitation retrievals rely primarily on passive microwave (PMW) and infrared (IR) observations, these platforms face inherent challenges in resolving sub-pixel-scale rainfall intensity variations (especially for convective systems) and orographically modified precipitation [
20,
21,
29,
30,
31], leading to systematic discrepancies with ground-based measurements.
Figure 3 presents the spatial characteristics of the annual maximum daily precipitation RX1day in Zhejiang during the study period for both the observational and satellite data. The annual maximum daily precipitation RX1day can characterize regional short-term extreme precipitation and continuous heavy precipitation weather and is often used to assess the probability of regional extreme precipitation.
Figure 3a shows that the RX1day in Zhejiang Province is mostly concentrated in 120~180 mm, which indicates that Zhejiang Province is prone to extreme precipitation events caused by heavy rainfall, while the western and northern RX1days are relatively less, with 60 mm or less located in the region, and most of which are lower than 150 mm, and the lowest is 39 mm, and the maximum daily data is predominantly distributed in the coastal areas of north–central Zhejiang and the southern Zhejiang region.
Figure 3b illustrates that the spatial patterns of the RX1day index of the IMERG-L product differs greatly from the overall spatial distribution characteristics of the observed data, with the overall trend increasing from the west to east, and the overall values are mainly between 120 and 210 mm, but there is a longitudinal region in the middle with lower values, and the RX1day ranges between 120 and 150 mm, so that the satellite data has larger errors for the RX1day. The results indicate that GPM IMERG exhibits a limited capability in capturing annual extreme precipitation events across Zhejiang Province. The differences in the RX1day between heGPM IMRERG and the observations may stem from the differences in precipitation measurements between the satellite data and observed data. Satellite data are based on remote sensing techniques (e.g., microwave and infrared observations) and may be less capable of capturing small-scale precipitation events or heavy precipitation events, especially in areas with a complex topography or high variability in precipitation intensity [
20,
21,
29,
30,
31].
Figure 4 illustrates the spatial patterns of the annual maximum continuous five-day precipitation RX5day in Zhejiang during the study period for both observational and satellite data, and
Figure 4a shows that the RX5day in Zhejiang Province is mainly concentrated in the range of 250–300 mm, with only a small portion of the central and eastern regions having an RX5day higher than 300 mm. Moreover, most of the regions with an RX5day higher than 250 mm also show Zhejiang Province’s characteristic of being prone to heavy rainfall events.
Figure 4b shows that the spatial characteristics of the RX5day of IMERG-L products are less similar to those of the observations, especially in Zhoushan Islands, where the RX5day is above 350 mm, while the observed data show that it is below 300 mm, which is misreported. The distribution of the RX5day of the IMERG-L data illustrates the annual maximum five consecutive days of precipitation RX5day distributed in the east and west of Zhejiang, with some areas reaching 300~350 mm, which indicates that GPM IMERG exhibits a limited capability in capturing annual extreme precipitation events in Zhejiang Province. The overestimation may be due to the fact that the spatial resolution and algorithm of IMERG-L have a limited performance in the complex terrain and sea–land transition area, which cannot accurately capture the actual spatial change characteristics of precipitation, resulting in the discrepancy between its spatial distribution and that of the observations.
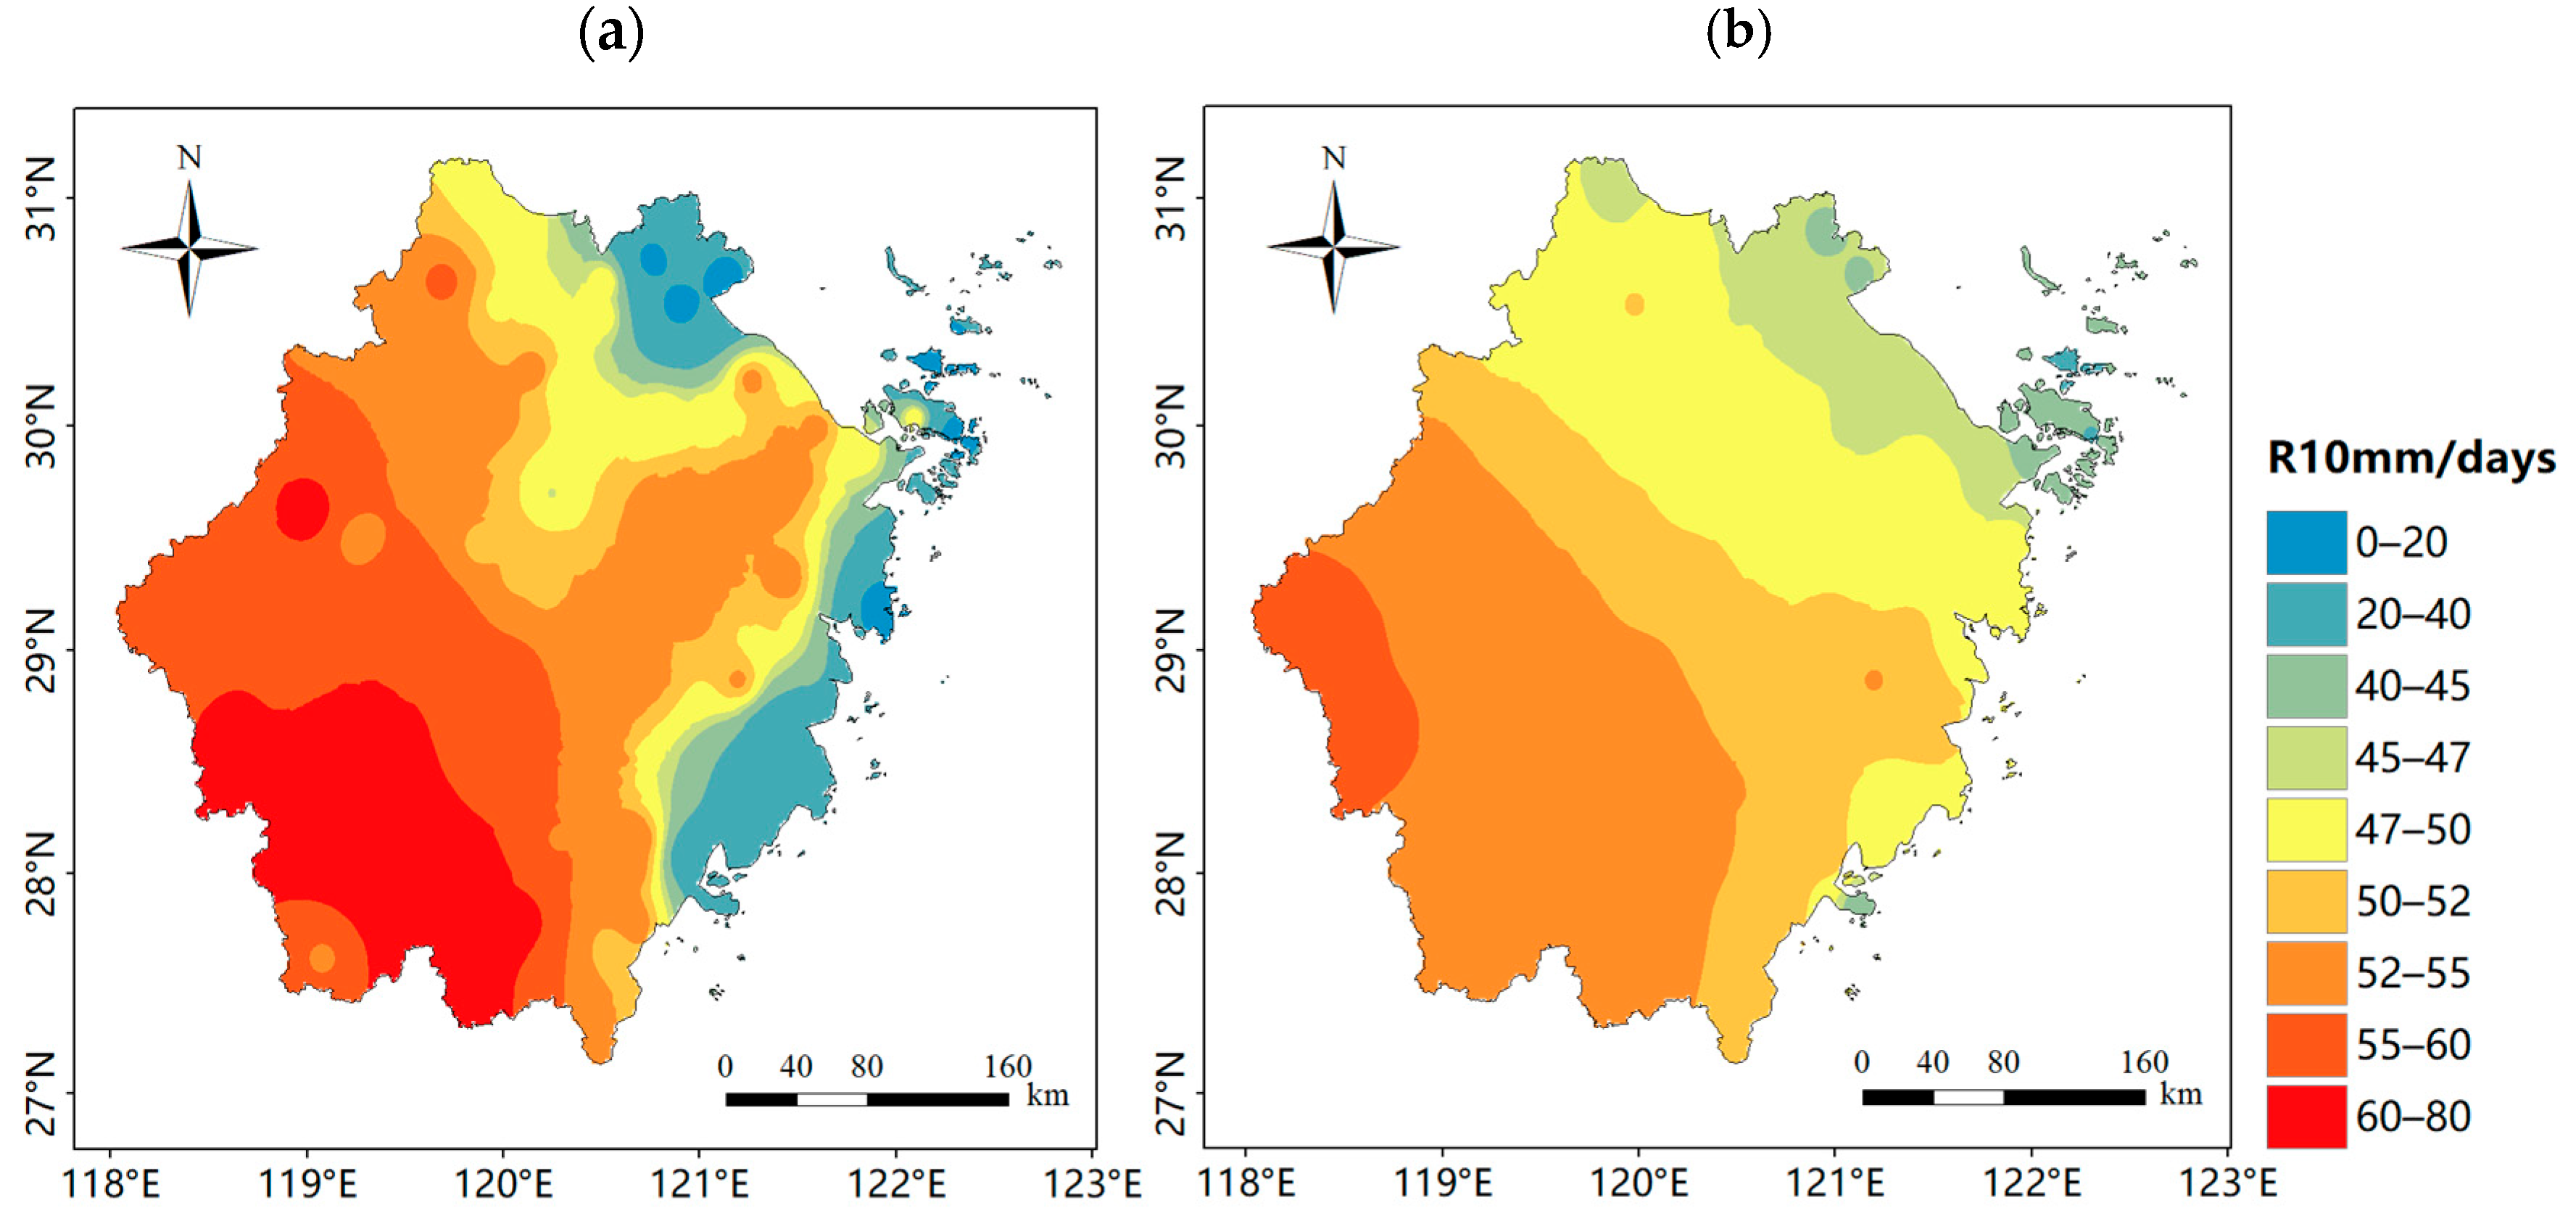
Figure 5 illustrates the spatial patterns of R10mm, the number of days with a daily rainfall greater than 10 mm, in Zhejiang during the study period for both the observations and satellite data, and the extreme precipitation frequency index can reflect the degree of the wetness or aridity of the climate in the region. According to
Figure 5a, annual days with precipitation over 10 mm (R10mm) in Zhejiang Province predominantly range between 47 and 80 days, exhibiting a distinct northeast-to-southwest increasing gradient. Notably, the southeastern coastal region exhibits comparably lower R10mm frequencies, predominantly ranging between 20 and 40 days annually, which contrasts sharply with inland mountainous areas in Lishui, Zhejiang Province, with the R10mm reaching 71 days.
The improved precipitation over 10 mm (R10mm) trend representation in IMERG-L stems from precipitation processes, which may be mainly associated with water vapor convergence, yet its underestimation reflects inherent limitations in detecting microphysics, which is a common challenge among current satellite algorithms (
Figure 5b). The systematic underestimation is particularly pronounced in southwestern Zhejiang, likely attributable to satellite retrieval uncertainties over complex terrains [
24,
25,
26,
27,
28]. The systematic R10mm overestimation in Jiaxing and adjacent coastal zones likely reflects inherent limitations in IMERG-L’s precipitation physics representation, particularly regarding the microphysical processes over urban clusters and sea-breeze convection parameterization. The R10mm frequencies (45–55 days) exhibit a significantly reduced spatial variability compared to observations, which may result in an attenuated representation of the regional moisture gradient.
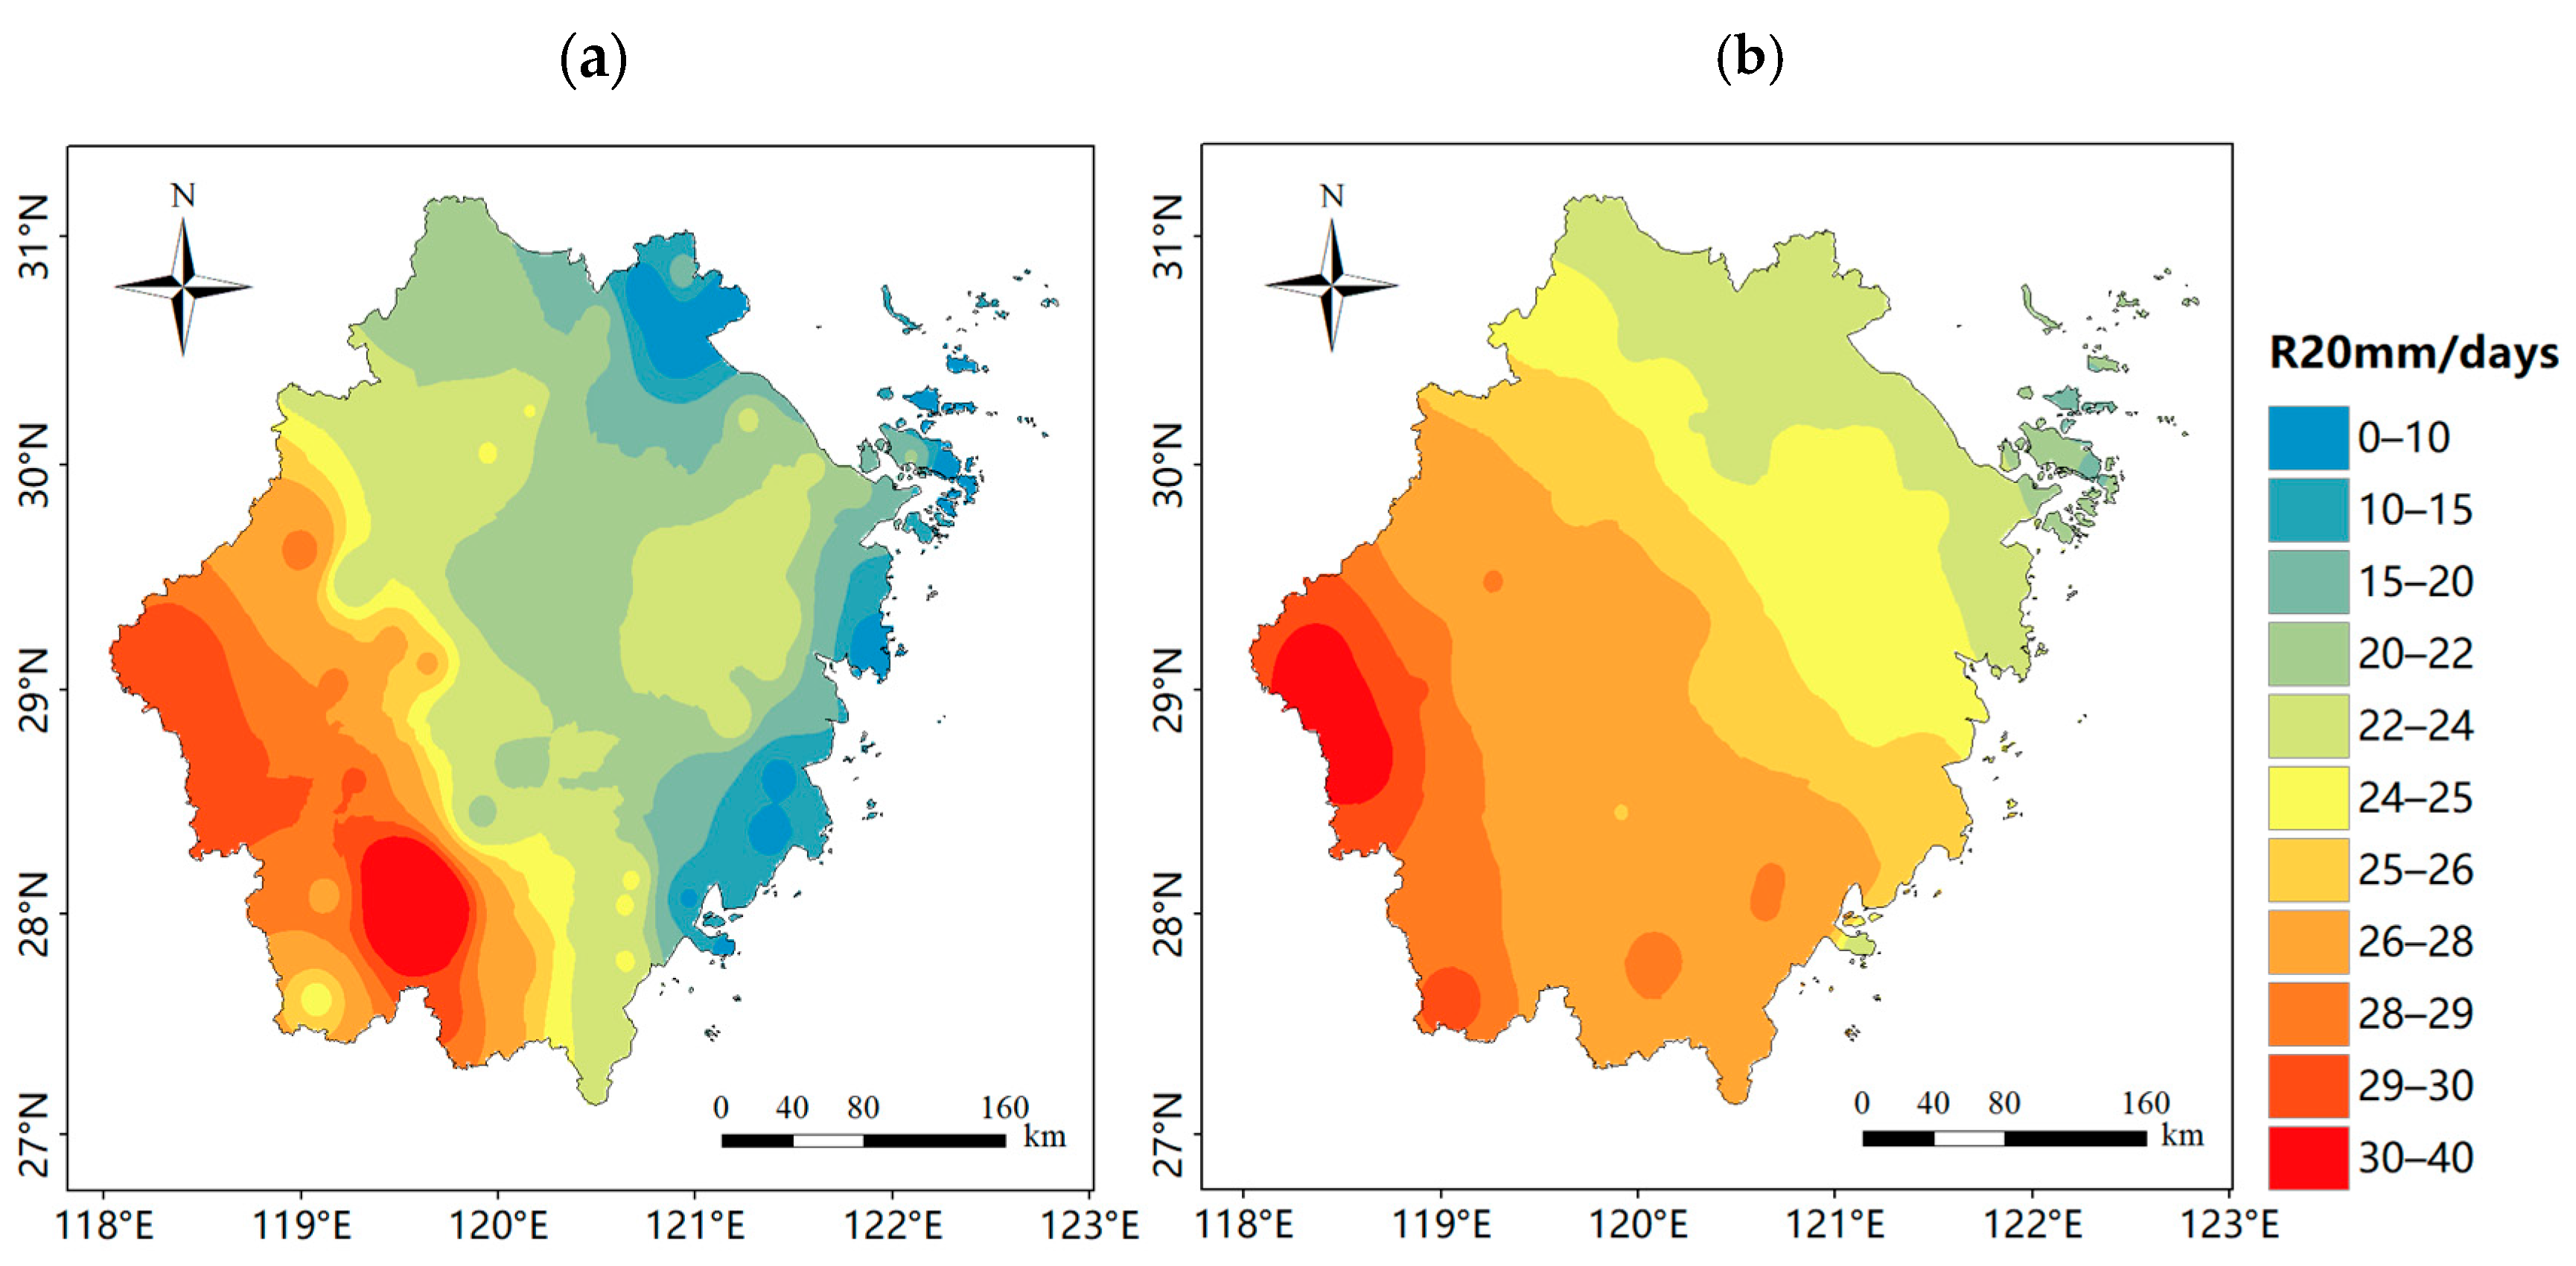
Figure 6 presents the spatial patterns of R20mm in Zhejiang during the study period, comparing observational data with satellite estimates. As illustrated in
Figure 6a, the R20mm values across Zhejiang predominantly range between 20 and 24 days, exhibiting a distinct northeast-to-southwest increasing gradient. The most pronounced precipitation frequency occurs in southwestern Zhejiang, where R20mm values exceed 26 days, reaching a maximum of 35 days. This spatial pattern clearly identifies southwestern Zhejiang as the region experiencing the most frequent daily precipitation events over 20 mm within the province.
The spatial distribution pattern of IMERG-L products generally aligns with observational data, showing values predominantly concentrated between 24 and 28 days. However, systematic biases are evident. On one hand, a significant underestimation occurs in Lishui and the surrounding mountainous regions, likely due to satellite limitations in detecting heavy precipitation events within complex terrains, particularly in southwestern Zhejiang’s orographic zones. On the other hand, a moderate overestimation appears in most other areas, potentially attributable to station density effects, fusion algorithm errors and resolution constraints in regions with more uniform precipitation [
20,
21,
29,
30,
31]. While IMERG-L successfully captures the broad spatial gradient, these findings reveal persistent challenges in accurately quantifying the extreme precipitation frequency, especially in topographically diverse regions.
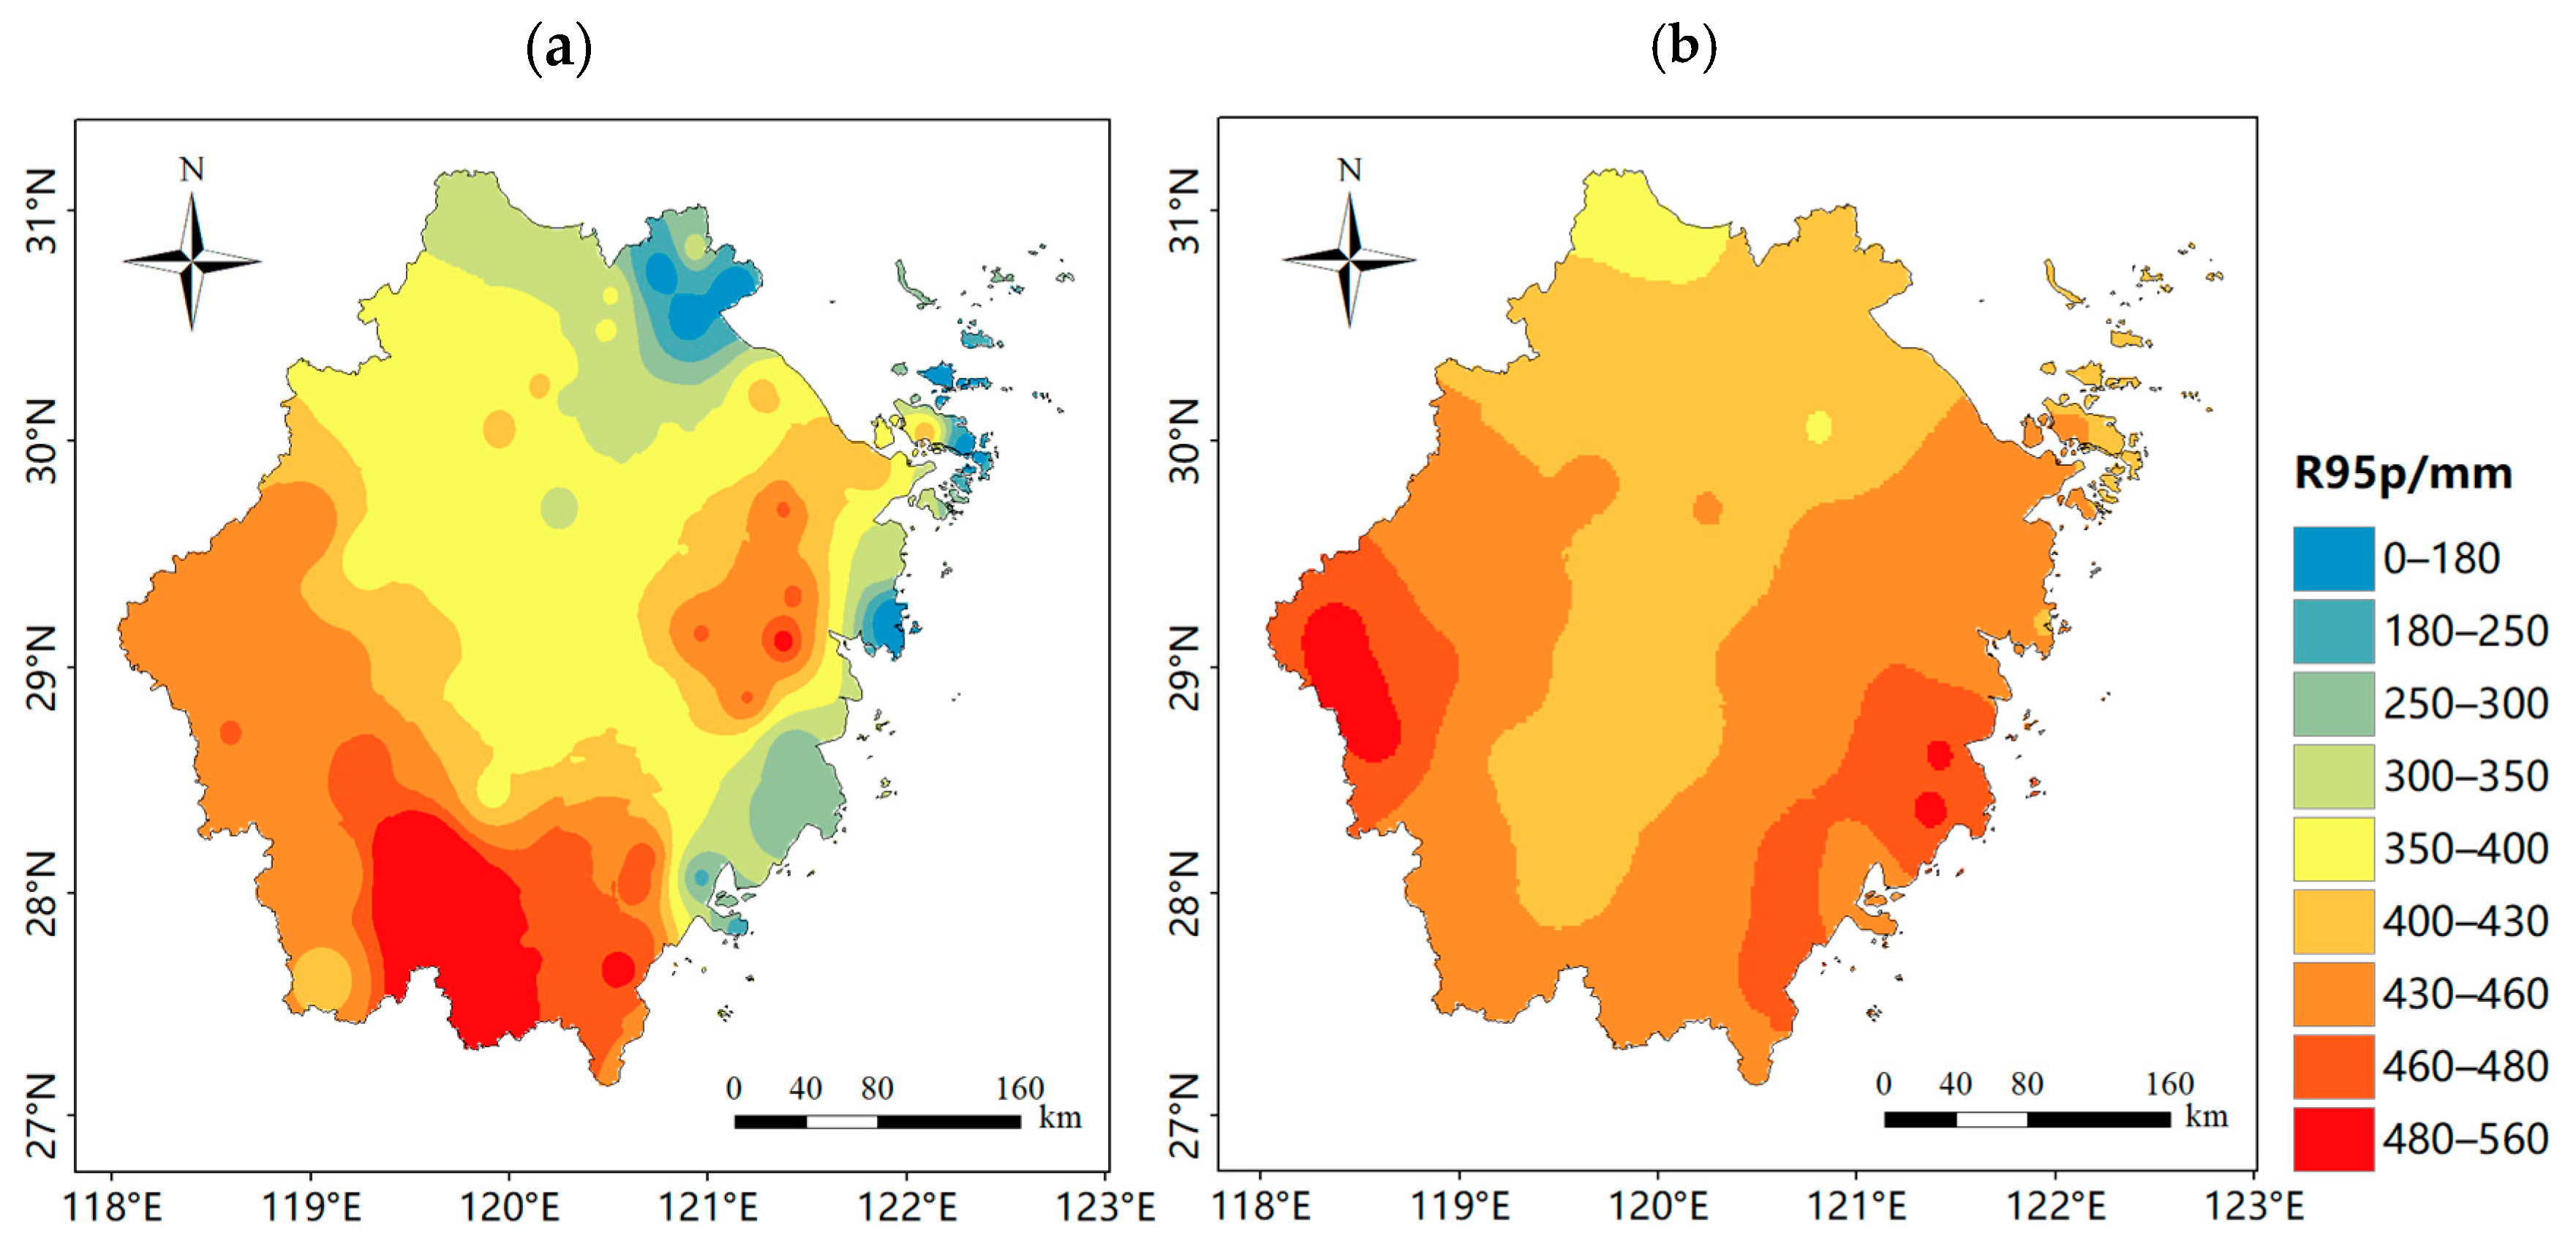
Figure 7 presents the spatial distribution of the annual R95p (the total rainfall from days exceeding the 95th percentile threshold during the reference period) across Zhejiang Province, comparing observational data with satellite estimates. As shown in
Figure 7a, the spatial pattern reveals a pronounced regional variability. The highest extreme precipitation accumulations (>400 mm) are concentrated in western and southern Zhejiang, corresponding to mountainous regions. Comparatively lower but still substantial values (>250 mm) characterize the northern plains and eastern coastal areas. This spatial distribution highlights Zhejiang Province’s overall susceptibility to significant extreme precipitation events, with particularly enhanced magnitudes in its western and southern areas where orographic effects likely amplify the precipitation intensity.
The IMERG-L product exhibits substantial discrepancies in the R95p spatial distribution compared to ground observations, demonstrating a systematic overestimation. The satellite-derived values predominantly exceed 400 mm, with only minimal areas ranges between 350 and 400 mm and a complete absence of values below 350 mm, indicating a significant positive bias relative to observations. Particularly noteworthy is the inversion phenomenon along the eastern coast. While observational data identify this as a low-value region, IMERG-L erroneously depicts it as a high-value zone. These discrepancies likely stem from the oversensitivity of the satellite algorithm to the precipitation reflectivity and microwave brightness temperature during heavy precipitation events. There are particular challenges in coastal zones where marine fog and complex cloud microphysics may confound precipitation retrievals. The pronounced overestimation suggests current satellite products may require a region-specific calibration for the extreme precipitation quantification in Zhejiang Province.
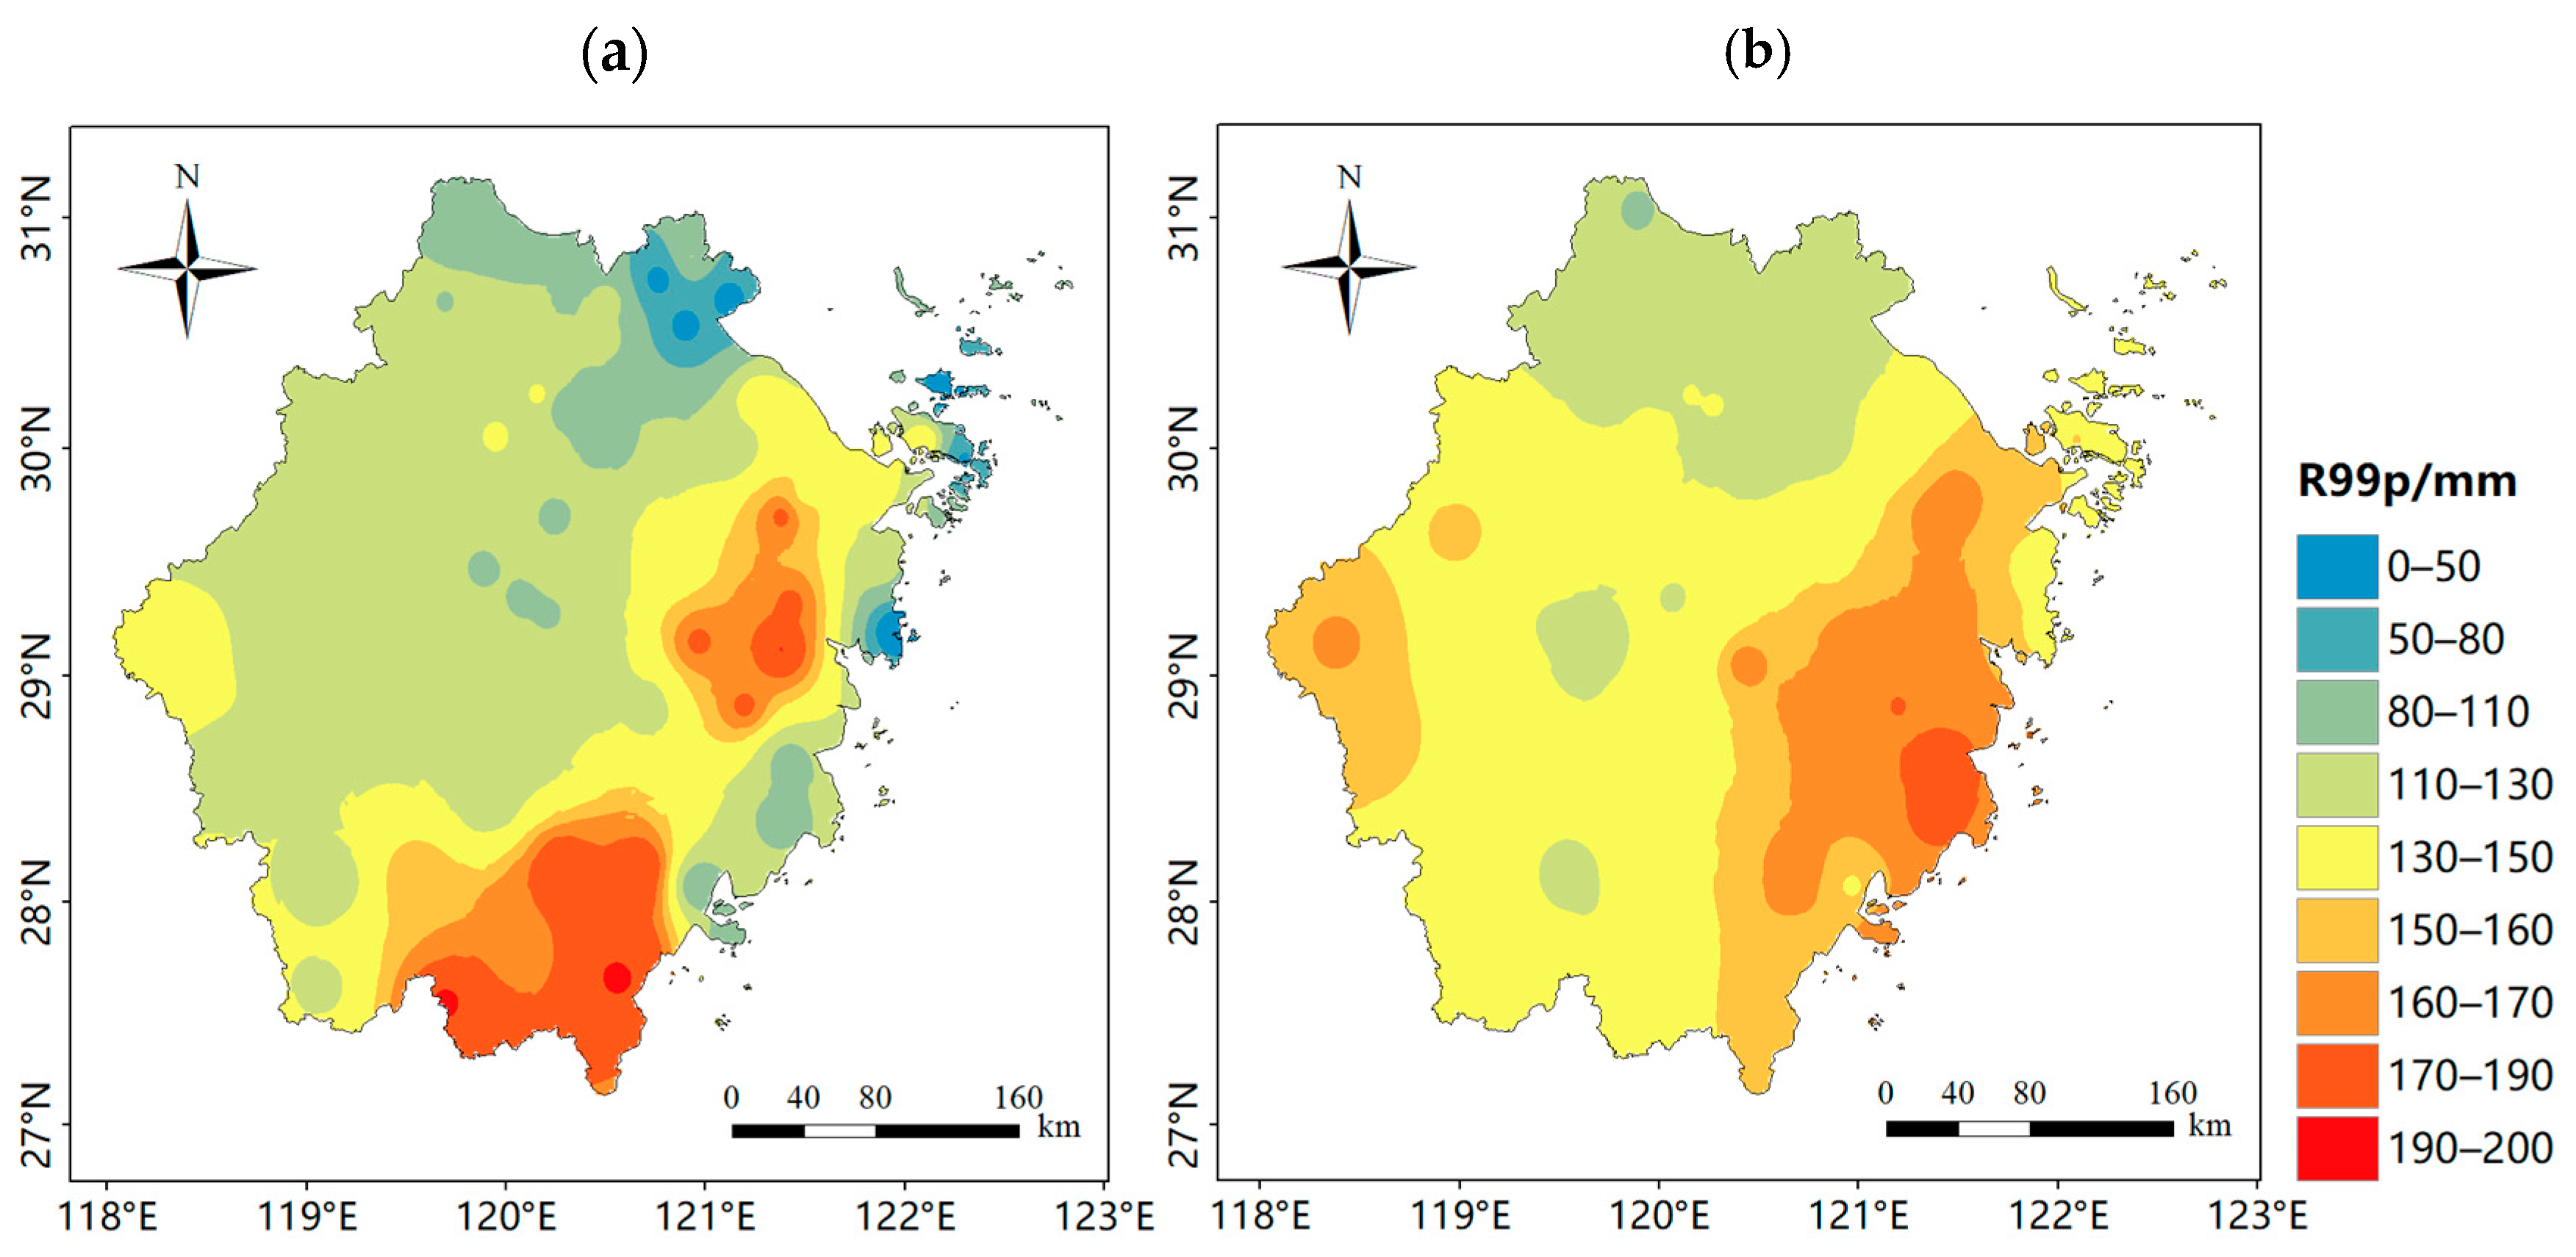
Figure 8 presents the spatial distribution of the annual R99p (the cumulative precipitation from days exceeding the 99th percentile threshold during the 1981–2010 reference period) across Zhejiang Province, comparing ground-based observations with satellite estimates. The observations reveal three distinct spatial characteristics of extreme precipitation (
Figure 8a). The southern mountainous regions and eastern inland areas exhibit the most intense precipitation extremes, with values predominantly exceeding 160 mm. The maximum value of 195 mm occurs in Pingyang County of Wenzhou City, reflecting orographic enhancement effects. Approximately 70% of the province records values between 110 and 130 mm, representing the typical range for extreme precipitation events. Areas with values below 110 mm are limited to isolated areas in northern Zhejiang, covering less than 5% of the total area. This spatial pattern demonstrates Zhejiang’s significant exposure to high-intensity precipitation extremes, particularly in its southern and eastern sectors where topographic and moisture convergence factors combine to produce the most severe events.
The IMERG-L product captures the general southeast-to-northwest decreasing trend of R99p extremes observed in ground measurements but exhibits significant discrepancies along the eastern coastal zone. While observational data show moderate coastal values of 80–130 mm, which are characteristic of marine-influenced precipitation regimes, IMERG-L systematically overestimates these extremes with values of 150–170 mm. This coastal overestimation likely stems from multiple factors. The algorithm’s heightened sensitivity to intense precipitation signatures leads to the false detection of extreme events. Retrieval artifacts are caused by the complex interplay of clouds, sea surface microwave emissions and the precipitation echo contamination in land–sea transition zones. There are inherent challenges in discriminating true precipitation signals from marine boundary layers. These systematic errors underscore the need for improved coastal precipitation retrieval approaches in satellite-based extreme rainfall monitoring.
4.2. Assessment of Quantitative Errors in Extreme Precipitation Indices
To assess the accuracy and consistency of satellite-derived extreme precipitation estimates against station observations, scatter plots of the precipitation indices at different stations during the study years were generated with a 1:1 reference line, along with statistical metrics (e.g., CORR, MAE, RMSE and RB), as illustrated in
Figure 9,
Figure 10 and
Figure 11 and summarized in
Table 2.
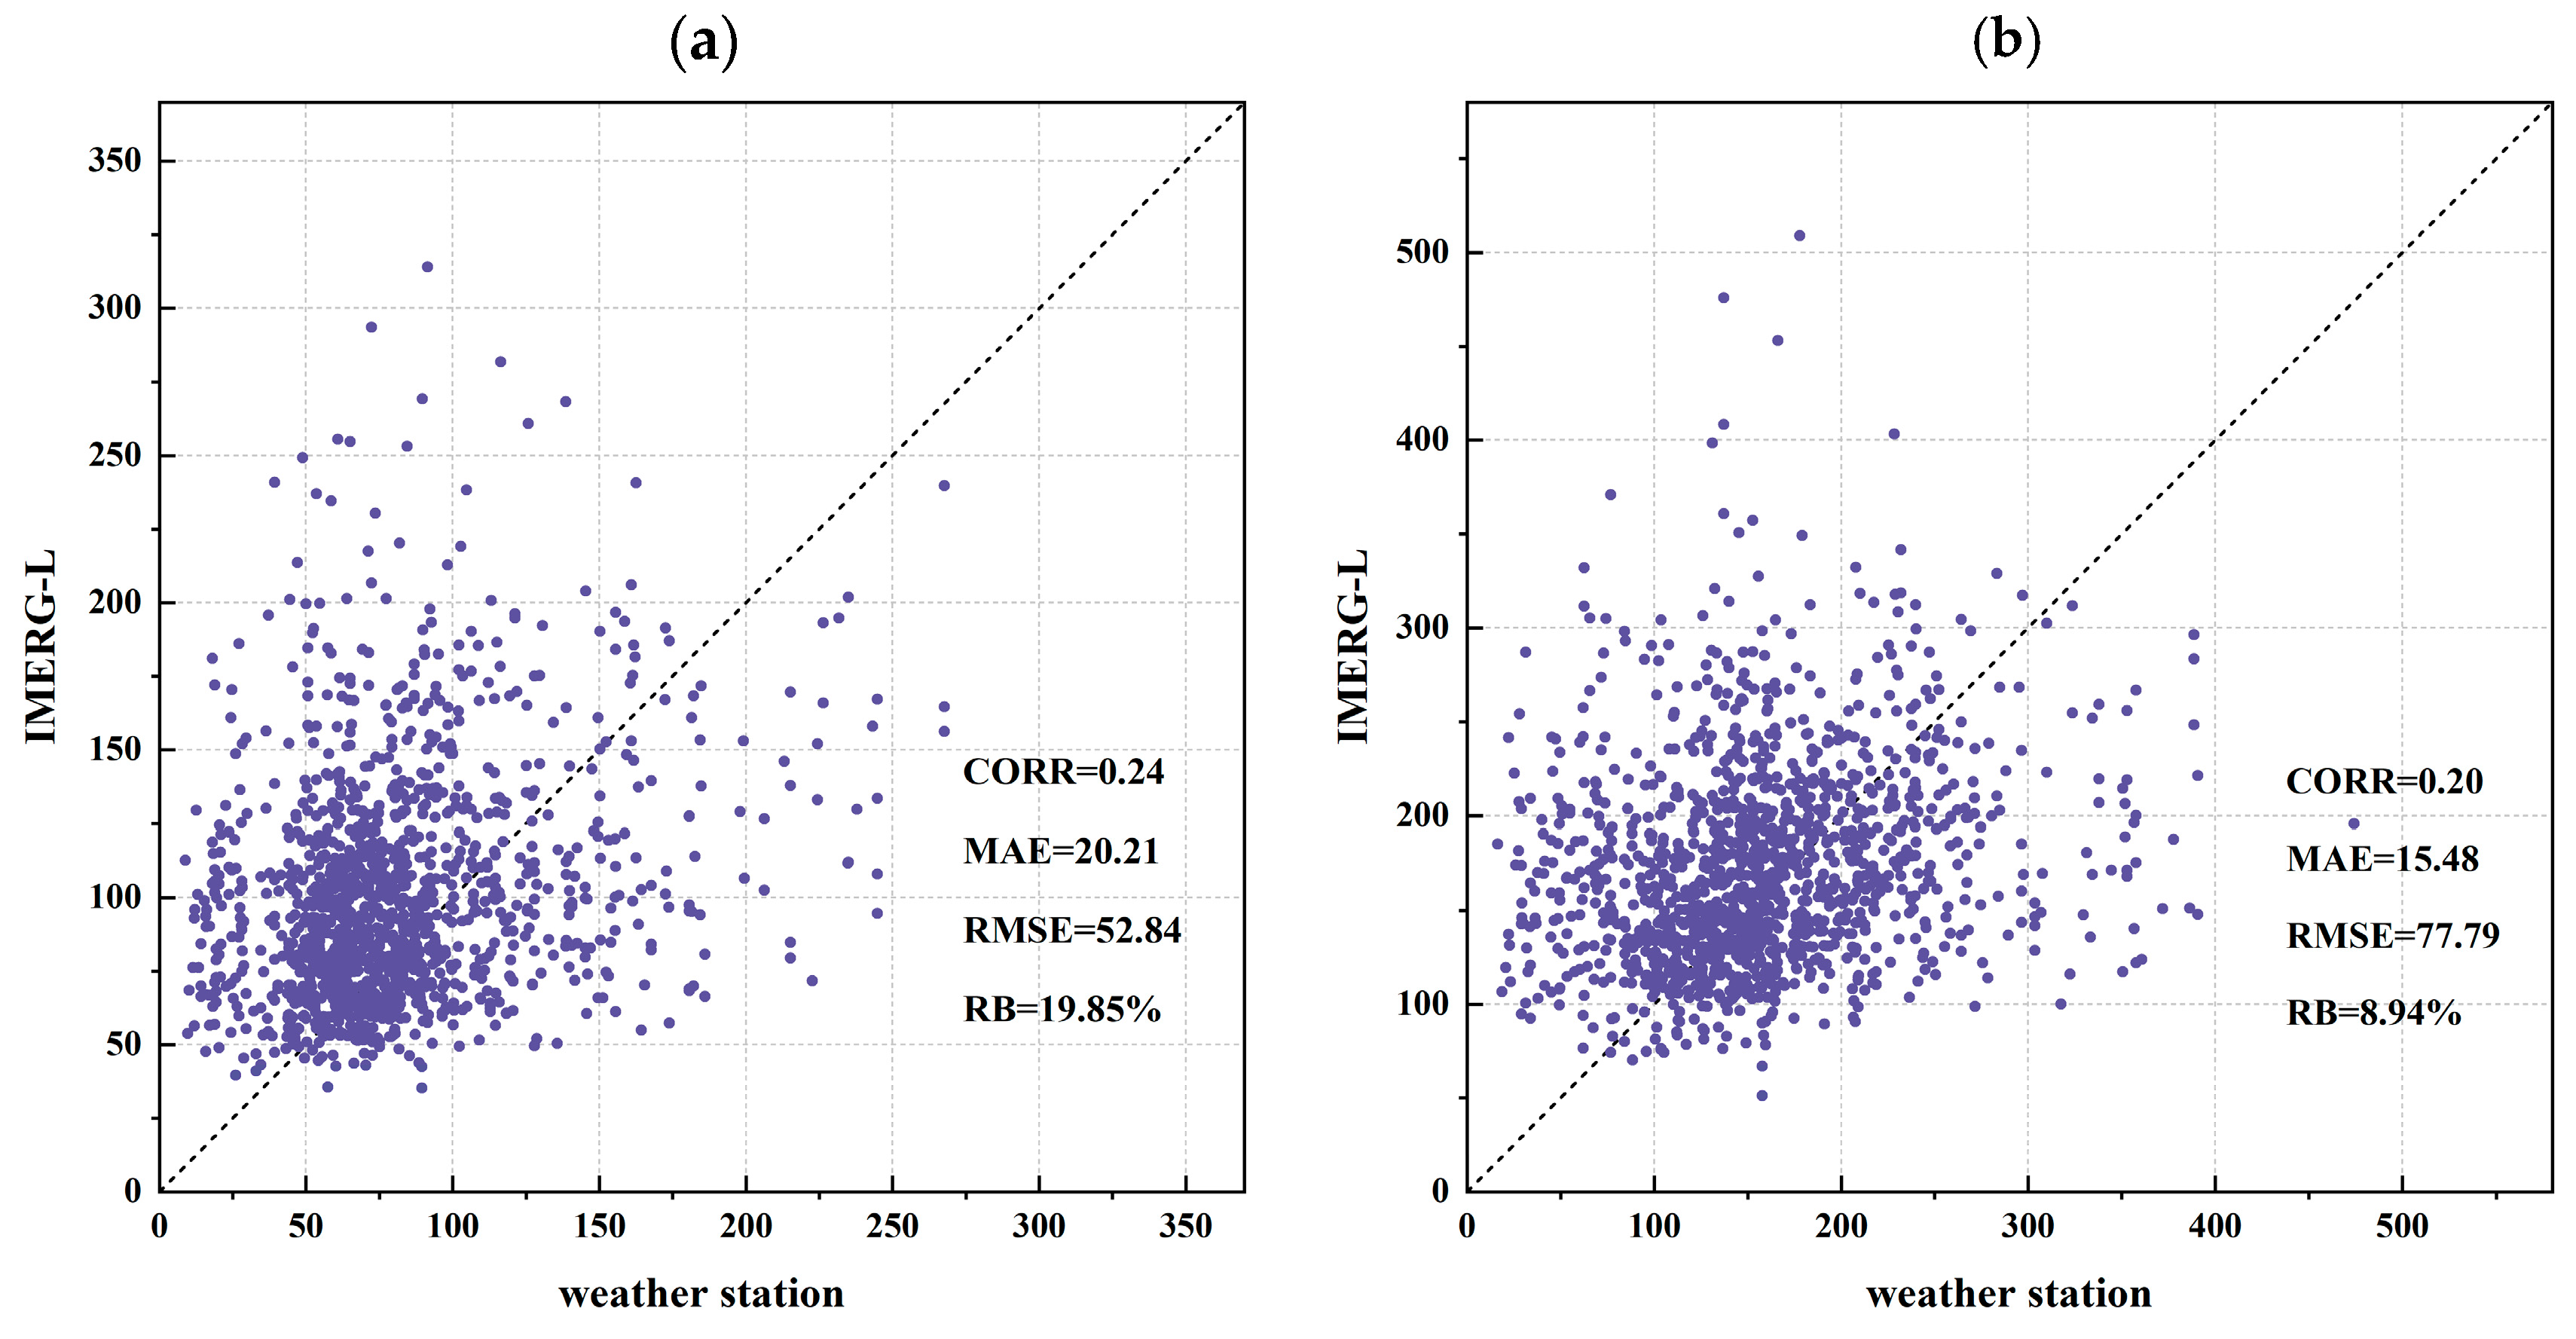
Figure 9 presents scatter plots comparing the satellite-derived and observed data for RX1day and RX5day extreme precipitation indices, revealing the weakest linear correlation among all indices examined, with notably low correlation coefficients of 0.24 for the RX1day and 0.20 for the RX5day. Despite this weak correlation, the satellite data demonstrate a reasonably good accuracy in terms of the mean absolute error (MAE), showing values of 20.21 mm for the RX1day and 15.48 mm for the RX5day, indicating that most estimated values remain within a reasonable range, reflecting a moderate level of systematic bias rather than a severe error. However, the root mean square error (RMSE) values are considerably higher at 52.84 mm and 77.79 mm for the RX1day and RX5day, respectively, indicating a significant variability in satellite estimates during extreme precipitation events. Additionally, the relative bias (RB) of 19.85% for the RX1day and 8.94% for the RX5day reveals a systematic overestimation by the satellite data, which is particularly pronounced for the daily extreme precipitation (RX1day), accompanied by a high false alarm rate.
The satellite and observed data exhibit distinct characteristics for the RX1day and RX5day. For the RX1day, which captures relatively short-term precipitation, the errors are larger due to the constraints of the satellite observation frequency, though the trend consistency remains relatively good. In contrast, the RX5day benefits from cumulative averaging effects, reducing single-day errors and yielding smaller overall errors, despite its slightly lower correlation. These differences highlight how the temporal scale and data characteristics influence the accuracy of satellite precipitation products. The analysis indicates that short-term precipitation estimates are more error-prone due to the limited observational frequency, whereas errors diminish at longer time scales.
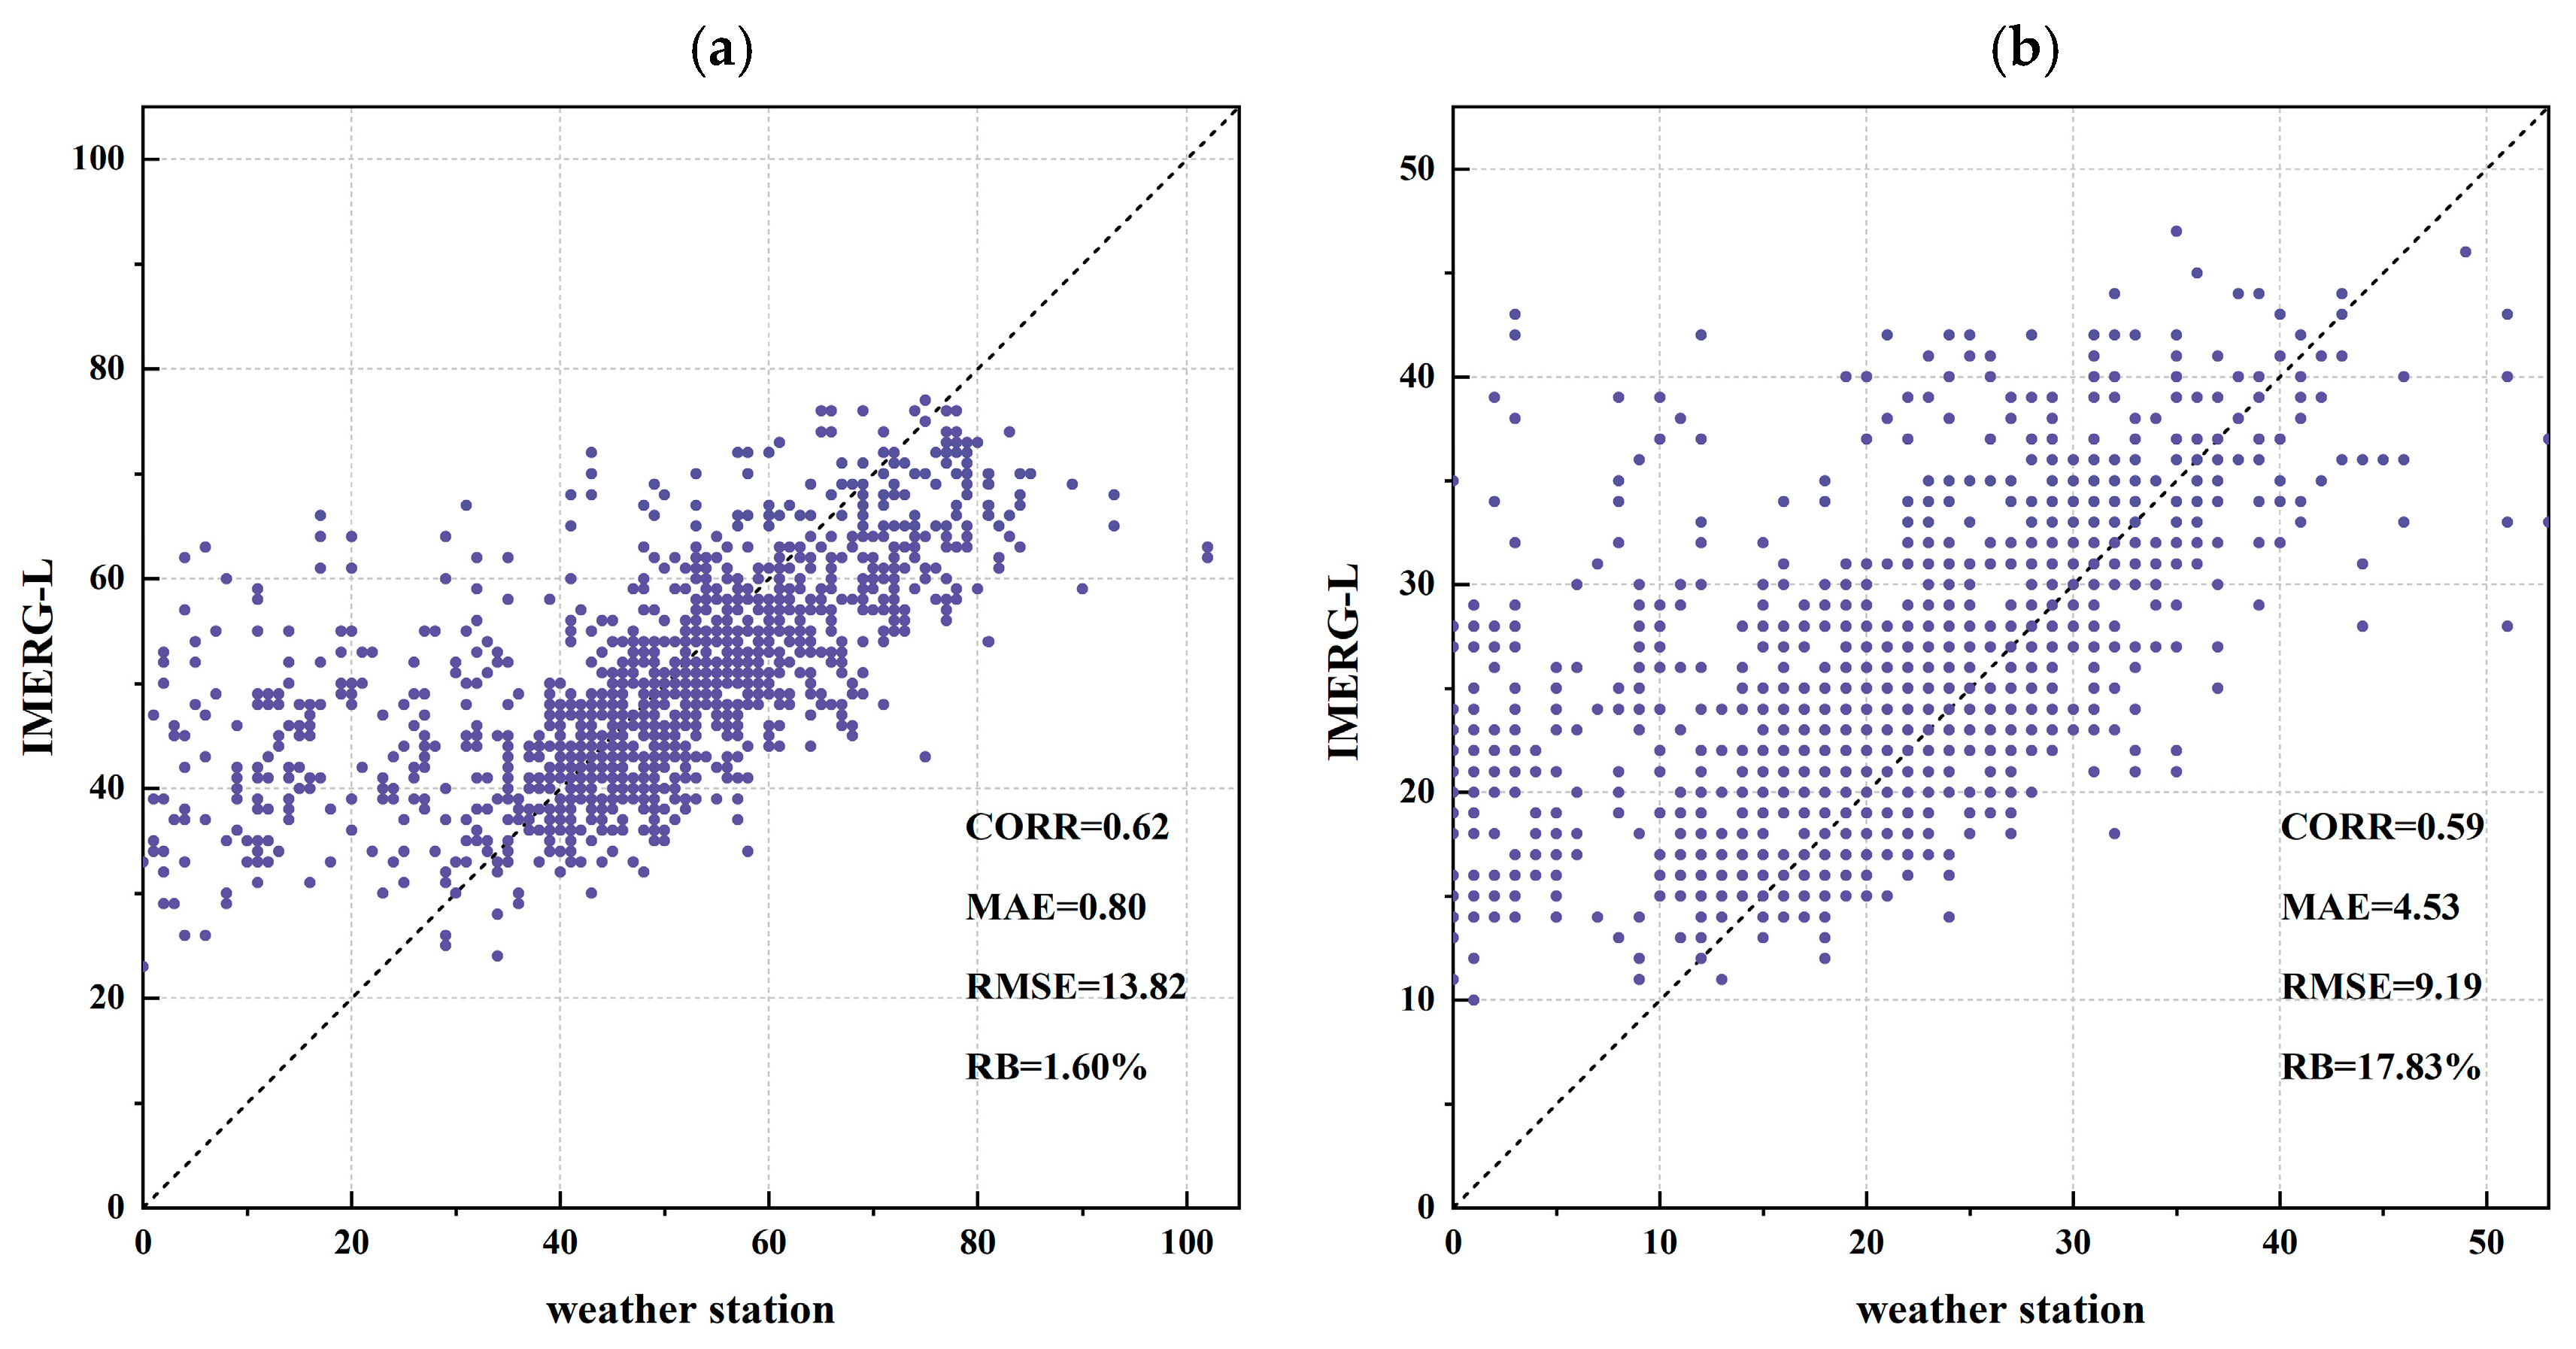
Figure 10 shows the scatter plots of R10mm and R20mm for the observations and satellite data. Combined with the scatter plots and their accuracy assessment indexes, the IMERG-L satellite data show a relatively high accuracy in monitoring the extreme precipitation frequency indicators of R10mm and R20mm in Zhejiang from 2001 to 2020, and the correlation coefficient between R10mm and the ground observations is 0.62 and 0.59 for R20mm, indicating that both of them have a strong linear correlation, which reflects that the satellite data can reproduce the spatial distribution trend of the rainfall frequency. The correlation coefficients of the R10mm and ground observation data are 0.62 and 0.59 for R20mm, indicating that both have a strong linear correlation, reflecting that the satellite data are able to reproduce the spatial distribution trend of the precipitation frequency. In terms of errors, the MAE of R10mm is 0.80, the RMSE is 13.82 and the RB is only 1.60%, indicating that the estimation error of the satellite data for R10mm is small, and the overall bias is extremely low. While the MAE of R20mm is 4.53 and the RMSE is 9.19, although there is no universally defined threshold for what constitutes a reasonable relative bias (RB) in existing studies, previous evaluations of satellite precipitation products by scholars such as Xiao, L.S. [
13] and Yin, R.Q. [
32] have reported RB values that mostly exceed 20%. In this context, although the RB of R20mm in this study is relatively high (17.83%), it still falls within an acceptable range, demonstrating the satellite’s reasonable capability in estimating a medium-to-high intensity precipitation frequency.
However, as clearly shown by the data point distribution in
Figure 10, IMERG still yields positive values for the R10mm and R20mm indices when the observed values are zero. This bias may stem from the IMERG algorithm’s excessive sensitivity to weak precipitation signals, which can lead to the misclassification of non-precipitation events.
Overall, IMERG-L performs better in capturing precipitation frequency indices (R10mm and R20mm) than intensity-based indices (RX1day and RX5day), demonstrating a stronger capability in monitoring the extreme precipitation frequency. This suggests that the satellite product provides more stable and reliable estimates for persistent, moderate-intensity precipitation events, aligning well with ground observations.
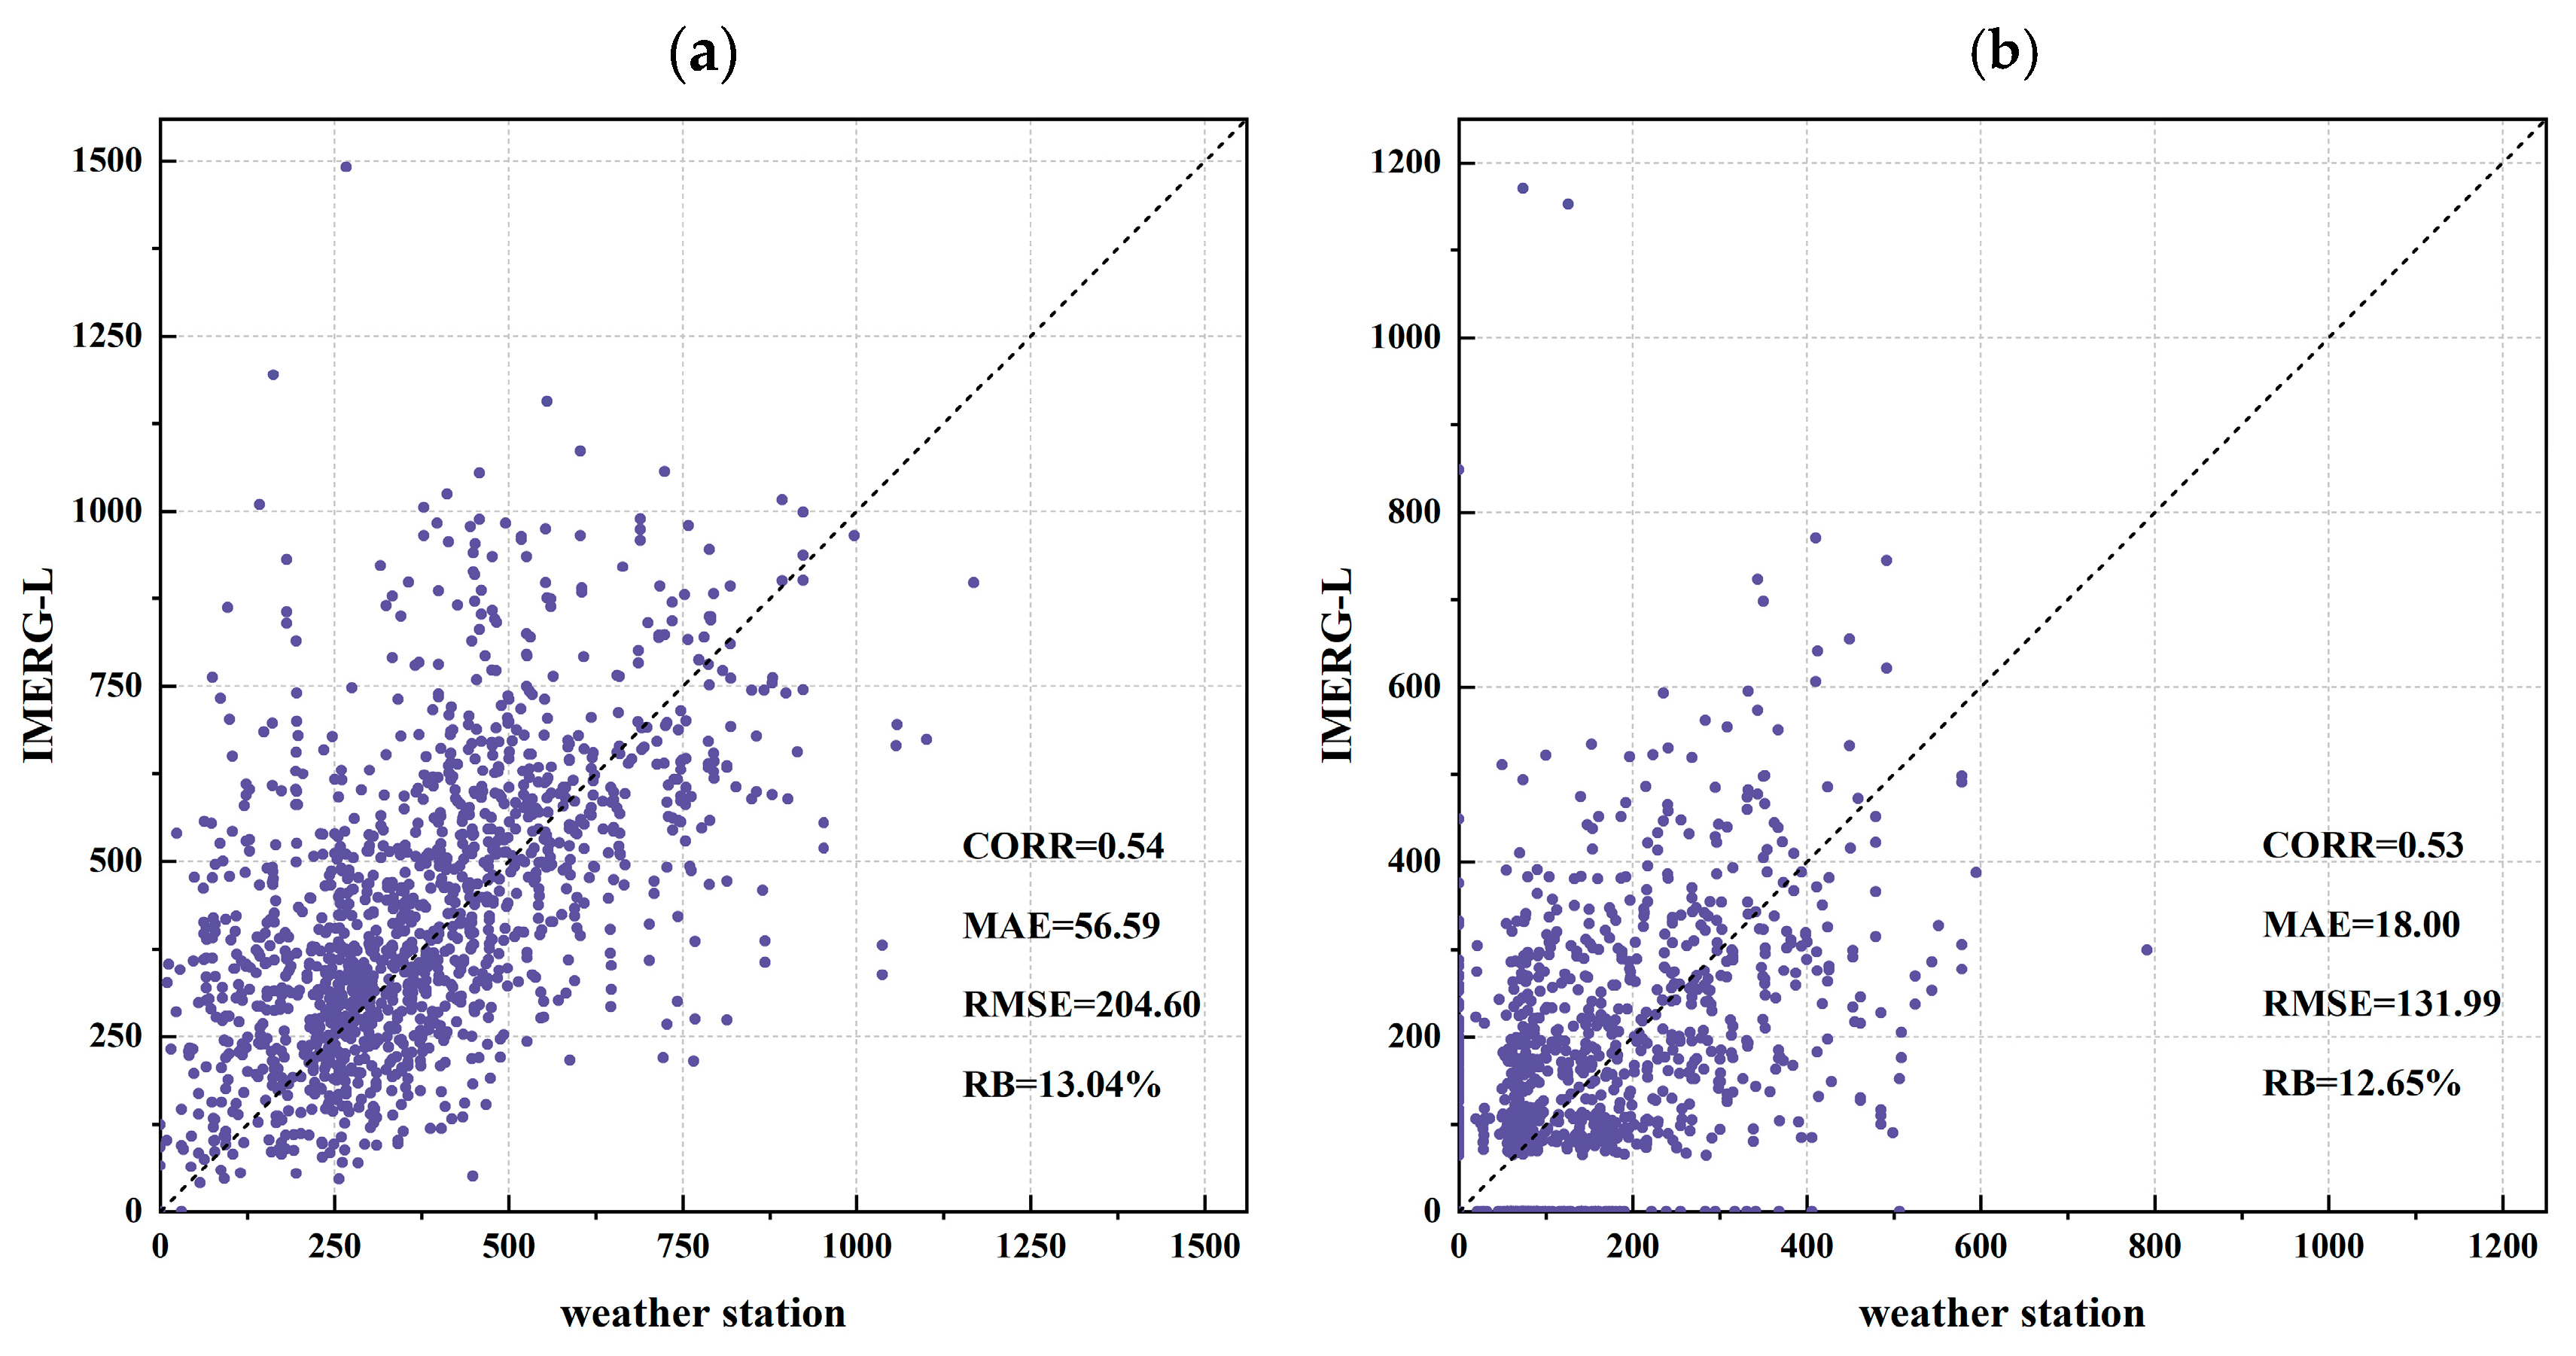
Figure 11 presents scatter plots comparing the observed and IMERG-L satellite data for the R95p and R99p extreme precipitation indices. The correlation coefficients of 0.54 for R95p and 0.53 for R99p indicate a moderate agreement in spatial trends, demonstrating IMERG-L’s basic capability for pattern identification. However, substantial errors are evident, with MAEs of 56.59 mm for R95p and 18.00 mm for R99p and notably high RMSEs of 204.60 mm and 131.99 mm, respectively, revealing significant dispersion and systematic biases. The positive RBs of 13.04% for R95p and 12.65% for R99p consistently indicate an overestimation. This is likely attributable to satellite detection challenges with localized, short-duration extreme events and the inherent limitations in extreme value retrieval. While IMERG-L provides useful spatial trend information, its quantitative estimates of precipitation extremes require caution due to these substantial biases.
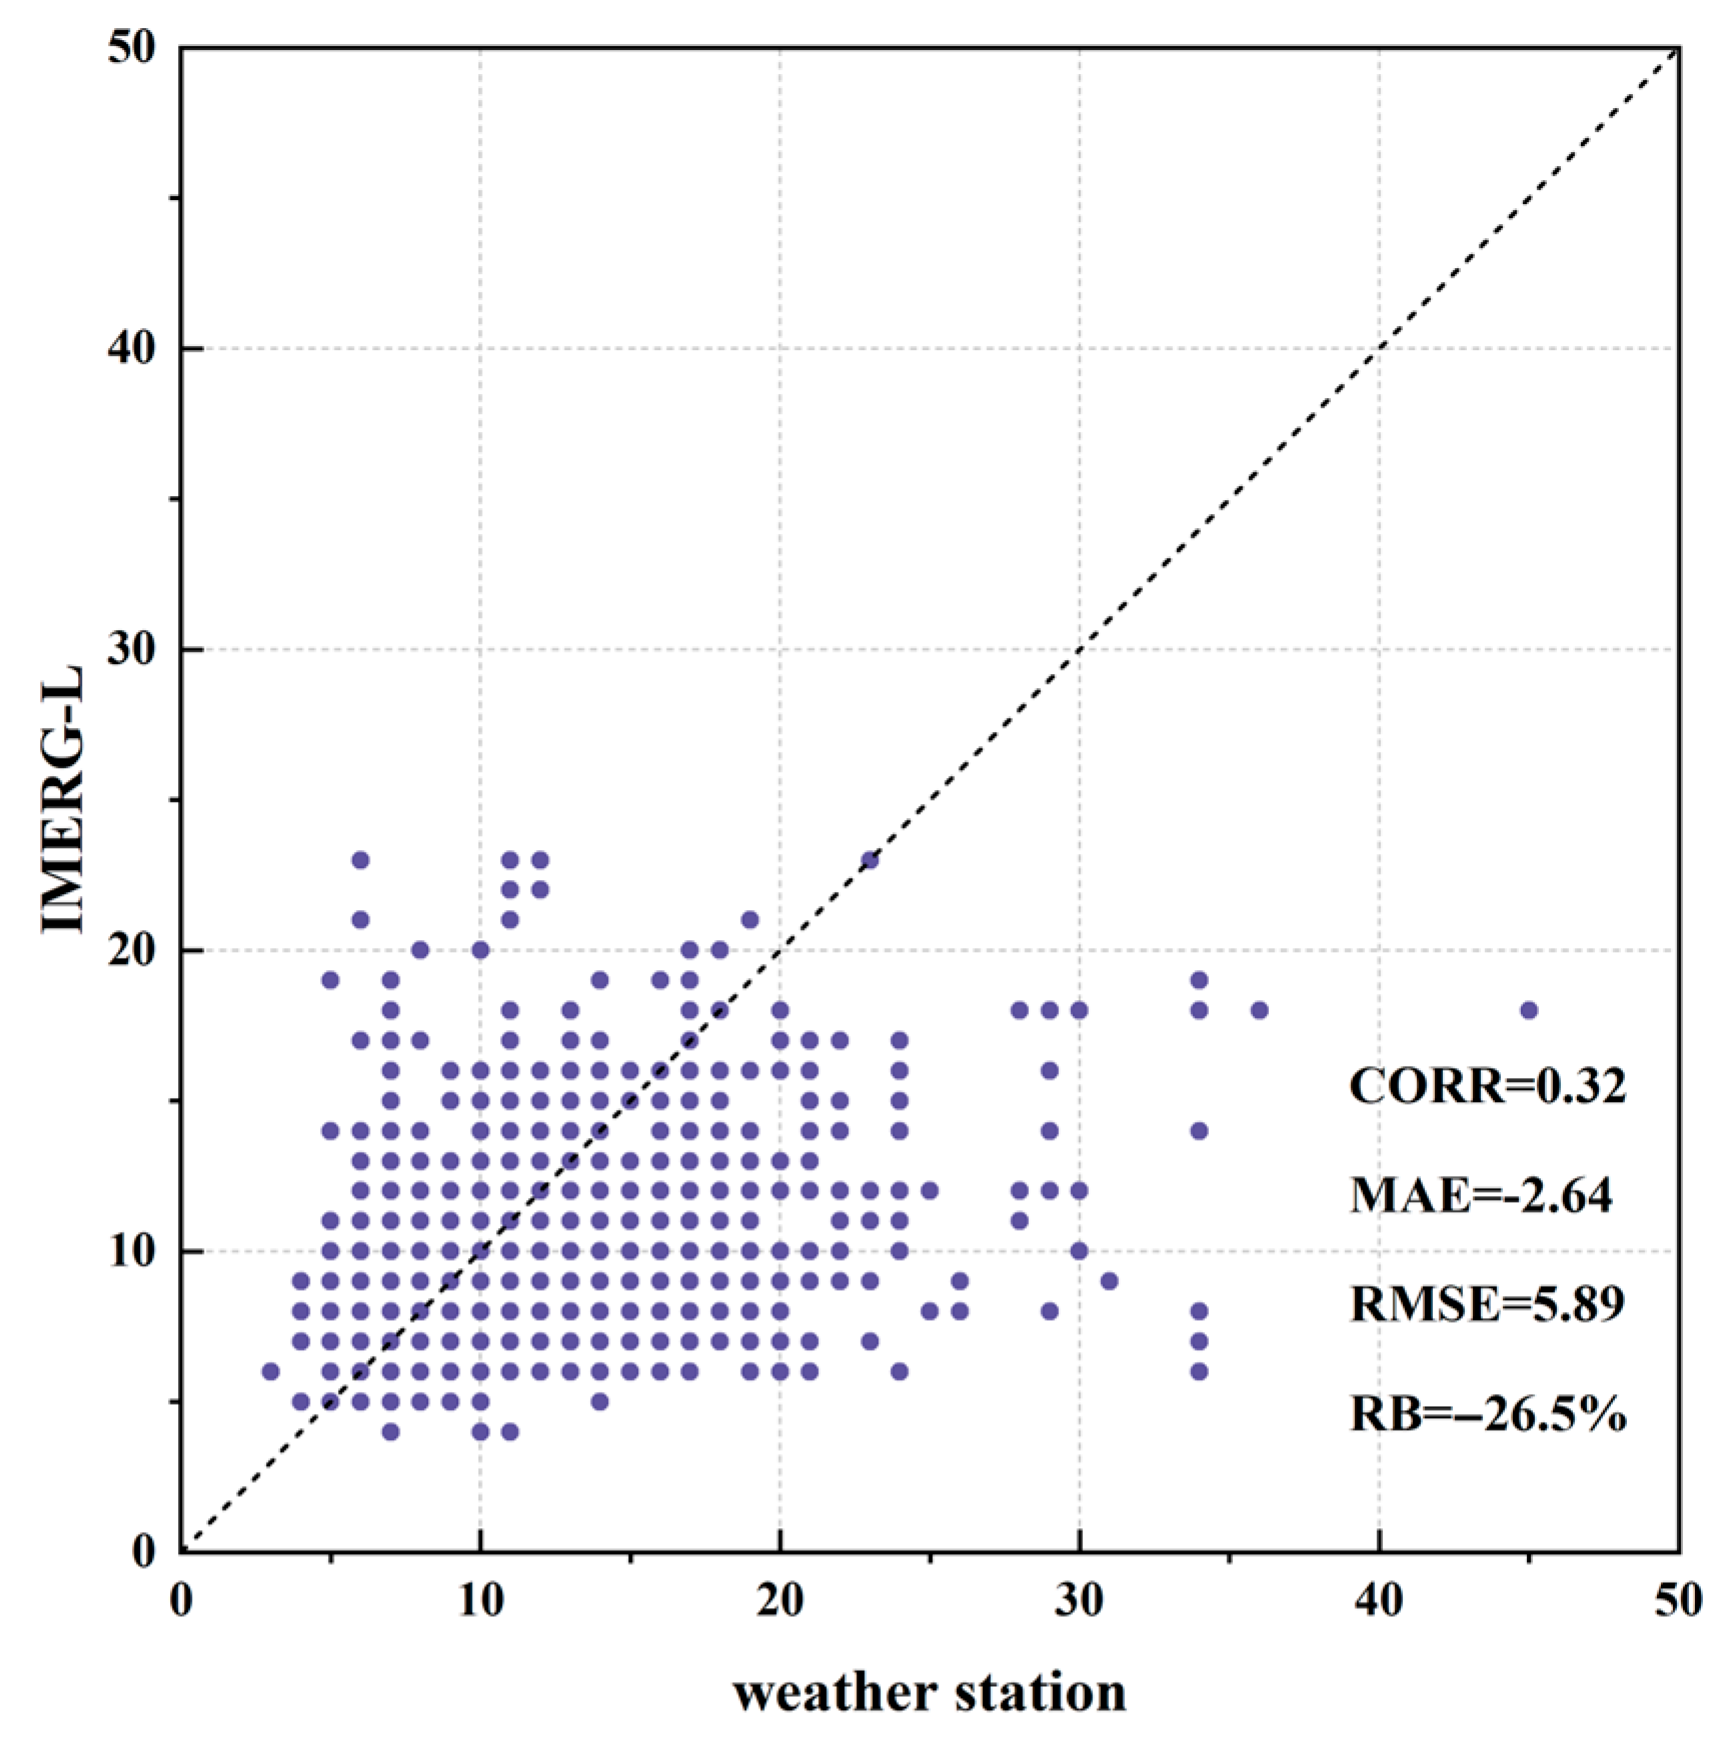
Figure 12 presents a scatter plot comparing the longest continuously wet days (CWD) between the observed and satellite-derived data. The scatter plot, along with the accompanying accuracy assessment metrics, reveals notable discrepancies in the performance of the satellite data relative to ground observations. Specifically, the low correlation coefficient (CORR = 0.32) indicates a weak linear agreement between the two datasets, suggesting that satellite products struggle to accurately reproduce the temporal distribution of the CWD observed on the ground. Furthermore, while the RMSE of 5.89 reflects a moderate overall bias and dispersion, the relatively small MAE (2.64) implies that errors are generally limited in most samples, with significant deviations concentrated in a few outliers. A more pronounced issue is the substantial negative relative bias (RB = −26.5%), which highlights a systematic underestimation of the CWD intensity by the satellite system. This bias may stem from the satellite’s reduced sensitivity in detecting weak or light precipitation events, particularly in regions with higher wet day frequencies, where cumulative errors tend to amplify.
Overall, IMERG-L still exhibits considerable uncertainties in monitoring CWD. While the errors are generally modest in most cases, a systematic underestimation bias persists across the dataset. More critically, the product struggles to accurately capture the continuous wetting processes observed in ground-based measurements. These limitations suggest that IMERG-L requires further refinement in its ability to identify precipitation coherence, particularly at small to medium spatial scales.
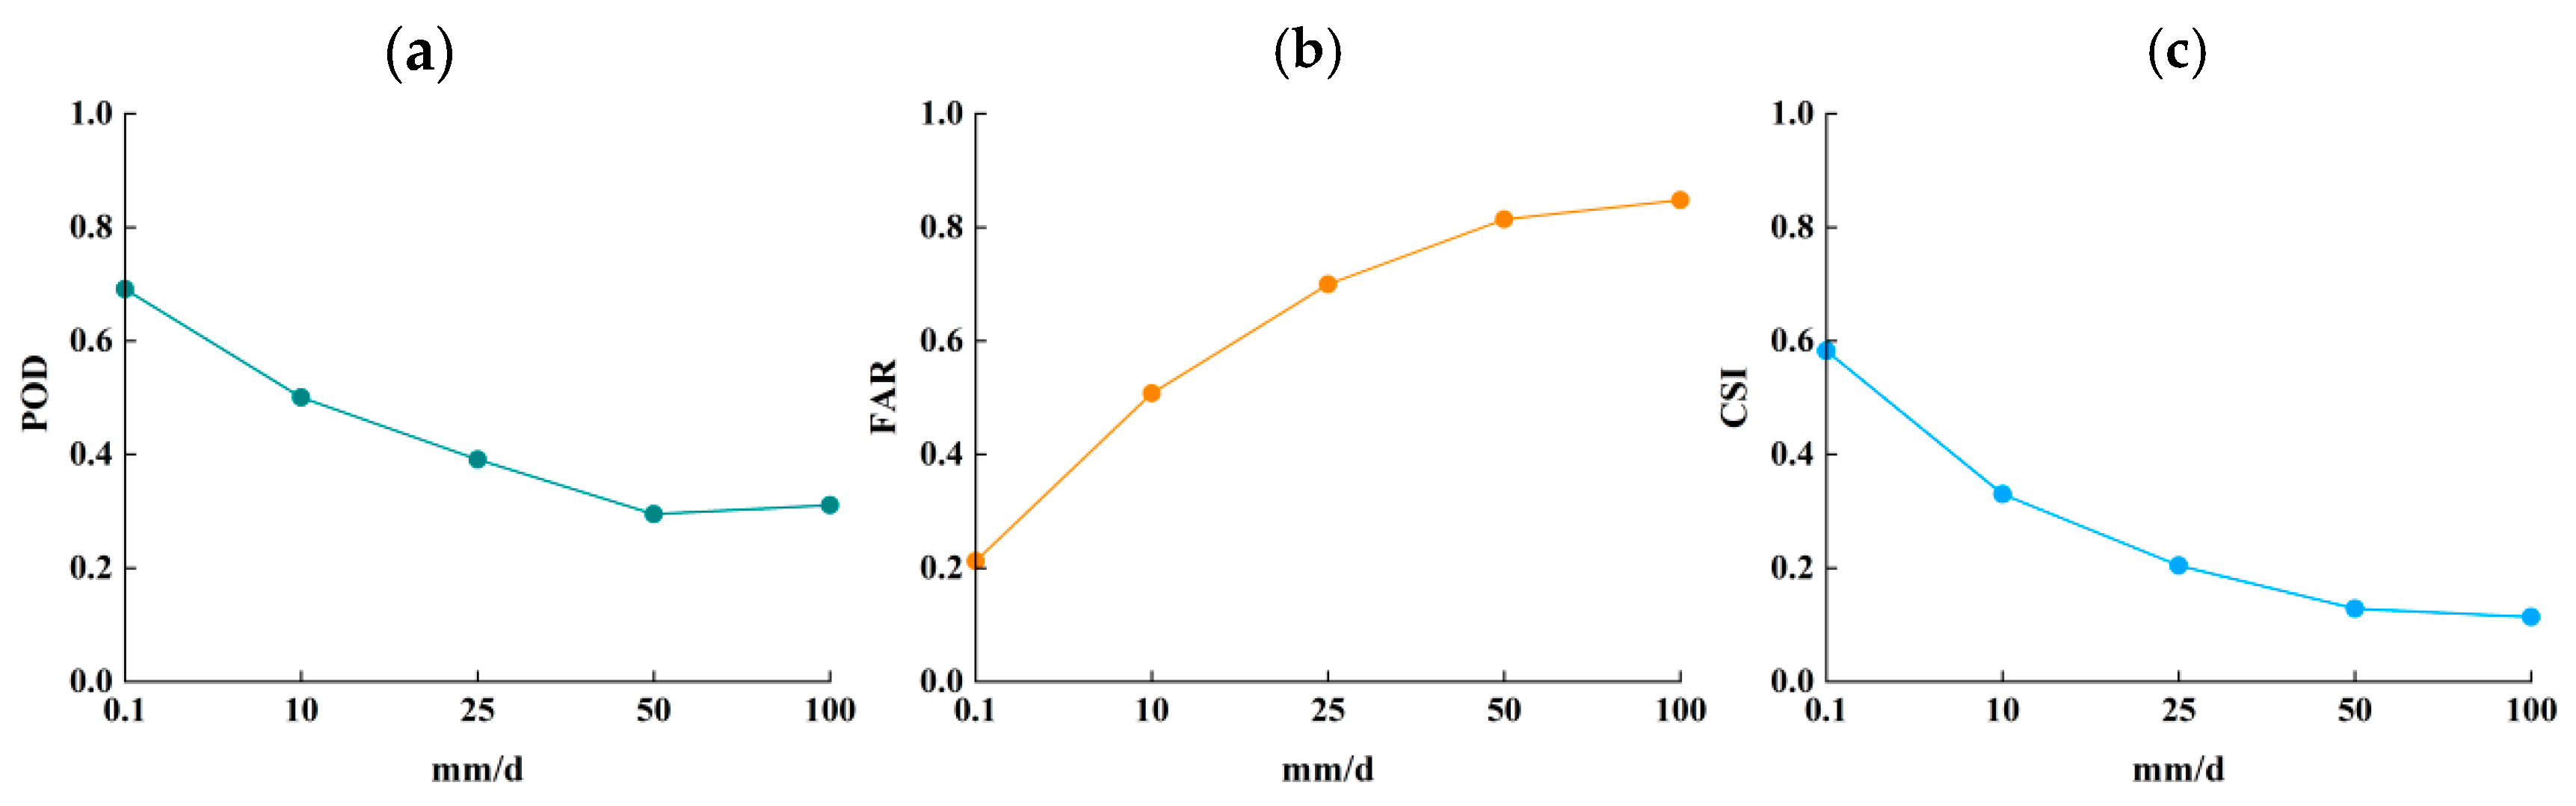
4.3. Graduated Precipitation Accuracy Assessment
Following the China Meteorological Administration (CMA) standards (National Standard GB/T 28592–2012;
http://data.cma.cn/en), 24 h rainfall can be classified as follows: 0.1–9.9 mm is considered light rain, 10–24.9 mm is considered moderate rain, 25–49.9 mm is considered heavy rain, 50–99.9 mm is considered heavy precipitation, 100–249.9 mm is considered heavy rain and ≥250 mm is considered exceptionally heavy rain [
33]. Based on this categorization, the key thresholds for surface rainfall were set at 0.1 mm, 10 mm, 25 mm, 50 mm and 100 mm. To comprehensively evaluate the detection performance of the IMERG-L satellite precipitation product across different rainfall intensities, the Probability of Detection (POD), Critical Success Index (CSI) and False Alarm Ratio (FAR) were calculated for each threshold using data from 1 January 2001 to 31 December 2020, and the results are shown in
Figure 13.
The POD (
Figure 13a), FAR (
Figure 13b) and CSI (
Figure 13c) of the IMERG-L satellite precipitation product under different daily precipitation threshold conditions are shown sequentially in
Figure 13. From
Figure 13a, IMERG-L has the highest detection rate of about 0.69 under light precipitation (0.1 mm/d), indicating that it is more capable of recognizing light rainfall events and can effectively capture most of the precipitation processes that actually occur. When the threshold value rises to 10 mm/d (medium rain criterion), the POD drops to about 0.50, indicating that there is already a tendency of greater under-reporting of moderate precipitation events. Furthermore, when the threshold value reaches 25 mm/d (heavy rainfall criterion) and 50 mm/d (heavy rainfall criterion), the POD decreases to about 0.39 and 0.30, respectively, which is a significant decrease, indicating that the satellite’s detection capability is obviously weakened in the face of heavier precipitation. Under extreme precipitation (100 mm/d), the POD is already as low as about 0.31, highlighting IMERG-L’s substantial limitations in detecting exceptionally heavy precipitation events, where missed detections become particularly severe.
Figure 13b illustrates a clear positive correlation between precipitation intensity thresholds and the False Alarm Ratio (FAR). At the light precipitation threshold (0.1 mm/day), the FAR remains relatively low (0.21), suggesting a good agreement between satellite estimates and ground observations for light rainfall events. However, as the threshold increases to moderate precipitation levels (10 mm/day), the FAR rises to 0.51, indicating significantly increased misreporting by the satellite product. This trend becomes more pronounced at higher intensity thresholds: the FAR reaches 0.70 for heavy rain (25 mm/day) and 0.81 for very heavy rain (50 mm/day). Under extreme precipitation conditions (100 mm/day), the FAR approaches 0.85, demonstrating that IMERG-L frequently produces false alarms during intense precipitation events. These results reveal systematic overestimation tendencies in satellite precipitation detection, particularly for moderate to extreme rainfall events.
Figure 13c presents the Critical Success Index (CSI), which integrates both the detection capability (POD) and false alarm rate (FAR) to provide a comprehensive assessment of IMERG-L’s precipitation detection performance. The CSI peaks at approximately 0.58 for light precipitation (0.1 mm/day), demonstrating a relatively strong overall detection accuracy for light rainfall events. However, the CSI exhibits a consistent declining trend with an increasing precipitation intensity: it decreases to 0.33 for moderate rain (10 mm/day), 0.20 for heavy rain (25 mm/day) and further drops to 0.13 for very heavy rain (50 mm/day). Under extreme precipitation conditions (100 mm/day), the CSI reaches its lowest value (~0.11), revealing substantial limitations in IMERG-L’s ability to reliably detect and characterize intense precipitation events.
In summary, IMERG-L demonstrates optimal reliability for detecting light precipitation events (<10 mm/day), as evidenced by favorable performance across all three evaluation metrics (POD, FAR and CSI). However, its detection capability progressively deteriorates with an increasing precipitation intensity. Notably, for heavy precipitation events exceeding 50 mm/day, the product exhibits significant limitations characterized by substantially reduced detection rates, markedly elevated False Alarm Ratios and a critically diminished overall detection accuracy. These findings highlight systematic challenges in IMERG-L’s ability to reliably monitor high-intensity precipitation events.
5. Discussion and Conclusions
This research assessed the GPM IMERG-Late (IMERG-L) satellite precipitation product in monitoring seven extreme precipitation indices across Zhejiang Province from 2001 to 2020, using CHM_PRE ground observations as reference data. The results demonstrate that while IMERG-L can generally capture spatiotemporal patterns of small to medium precipitation, it exhibits significant biases under heavy precipitation conditions and in complex terrain regions.
Problems related to extreme precipitation have been considered in the literature more than once and in various aspects, ranging from probabilistic approaches to AI methods. These studies comprehensively investigate extreme precipitation from multiple perspectives, including probabilistic modeling, climate change impacts, risk assessment and forecasting methods. Some of the studies developed statistical models, including negative binomial and generalized gamma mixtures, to characterize extreme precipitation distributions [
34,
35]. Some of the studies evaluated satellite products and the CMIP6 model performance in complex terrains [
20,
36] and analyzed the spatiotemporal trends in regions like China, Central Asia and the Himalayas, linking an increased intensity and frequency to SST anomalies and circulation patterns [
37,
38,
39,
40,
41]. Other studies improved predictions through landslide rainfall thresholds (Paper 3) and the NowcastNet neural network for short-term forecasting [
42]. While our study highlights gaps in the regional validation for the monsoon-dominated, topographically complex region of Zhejiang. Unlike prior studies focusing on single metrics or coarse scales, our work integrates seven precipitation indices and seven accuracy metrics to holistically assess IMERG-L’s performance across intensity, frequency and spatial dimensions.
Critically, our analysis reveals Zhejiang-specific limitations of IMERG-L, such as its failure to capture observed eastward-increasing trends in the RX1day and RX5day, a finding not reported in earlier studies. While prior works identified global overestimation biases [
39,
41], our 20-year high-resolution datasets from 2001 to 2020 uniquely expose spatial inhomogeneities in Zhejiang’s coastal–plain–mountain transitions. We further demonstrate that IMERG-L’s performance degrades sharply for heavy rainfall events, with the POD dropping significantly, which is a nuance absent in evaluations of other regions, though [
20] focus on the Himalayan region by comparing our results with benchmarks like GSMaP [
20] and CMIP6 models [
36], we underscore the need for algorithm refinements tailored to monsoonal extremes. These contributions complement but do not overlap with ML-based nowcasting [
42] or landslide thresholds [
43], as our framework targets long-term satellite product biases essential for climate modeling and risk assessment.
Notably, while IMERG-L reproduces the spatial pattern of the R10mm/R20mm frequency, it exhibits a systematic overestimation in events where ground stations record zero values. This indicates that the product may generate false-positive detections of precipitation days with intensities ≥10/20 mm, potentially stemming from sensor noise, retrieval algorithm limitations or unresolved spatial–temporal scales. Zhejiang lies in a typical mountain–coast transition zone and is significantly influenced by local circulation systems such as sea–land breezes and mountain–valley winds, maritime moisture transport and frequent typhoon activity, making it highly prone to short-duration, high-intensity extreme rainfall events. Compared with the above studies, our research is conducted under a more unique combination of topographic and climatic conditions.
Spatial distribution characteristics show that IMERG-L effectively reproduces spatial patterns of precipitation frequency indices (CWD, R10mm and R20mm), successfully capturing the northeast-to-southwest increasing gradient observed in the ground data. However, a systematic underestimation persists, particularly in southwestern mountainous areas, while a slight overestimation occurs along parts of the eastern coast. These discrepancies likely stem from limitations in the satellite-based precipitation retrieval over a complex topography. For precipitation intensity indices (RX1day and RX5day), IMERG-L shows a poorer performance, with notable spatial mismatches compared to ground observations. A significant overestimation occurs in the Zhoushan Islands region, suggesting particular challenges in typhoon-affected areas and regions with pronounced topographic relief. Because CHM_PRE has been rigorously validated and successfully applied [
23,
24,
25,
26], its high reliability lends additional weight to our conclusions: when IMERG-L deviates markedly from such a robust benchmark, those discrepancies are unlikely to arise from errors in the reference dataset itself. In other words, although CHM_PRE can relatively accurately capture extreme precipitation, IMERG-L still exhibits a consistent positive bias in high-intensity indices such as the RX1day and RX5day, confirming that the satellite product systematically overestimates heavy rainfall.
The quantitative accuracy assessment reveals distinct performance characteristics between precipitation frequency and intensity indices. For frequency-based indices, IMERG-L demonstrates a notably better performance, as evidenced by scatter plot analyses showing a substantial agreement with ground observations, with 0.62 for R10mmand and 0.59 for R20mm. These robust correlation coefficients indicate strong linear relationships and the effective representation of the spatial variability in the precipitation frequency across monitoring stations. Further supporting this finding, R10mm exhibits particularly low error metrics, with 0.80 for the MAE and 1.6% for the RB, confirming IMERG-L’s reliable detection capability for low-to-moderate intensity precipitation frequency events. In marked contrast, the product shows a significantly poorer performance for precipitation intensity indices. Both RX1day and RX5day display weak correlations (r < 0.40) with the observational data, accompanied by substantially larger RMSE values and a notable relative bias (RB). These results highlight persistent systematic errors in IMERG-L’s estimation of extreme precipitation magnitudes, particularly for high-intensity rainfall events. The pronounced discrepancy between frequency and intensity indices underscores fundamental challenges in the satellite-based quantification of extreme precipitation characteristics.
The results of the accuracy assessment under different precipitation intensity levels further verify the above conclusion. From the trends of the POD, FAR and CSI, it can be seen that IMERG-L has a strong detection ability for light rainfall (0.1 mm/d) and medium rainfall (10 mm/d), with a POD of 0.69 and 0.50, respectively, and the FAR is controlled within a reasonable range, while the CSI is maintained at about 0.58 and 0.33. However, as the precipitation threshold increases, the POD of IMERG-L decreases significantly to about 0.30, the FAR increases gradually to 0.85 and the CSI decreases to about 0.12, indicating that the false alarm rate of the satellite product increases, the omission rate rises and the detection accuracy decreases significantly in the case of heavy precipitation (≥50 mm/d) and extreme rainstorms (≥100 mm/d). This result corroborates with the conclusion of the high error and bias of the RX class index in the quantitative error analysis, demonstrating consistent patterns of an increasing under-detection, escalating false alarm rates and a deteriorating overall accuracy with precipitation intensity. The convergence of these findings from multiple evaluation approaches reinforces fundamental constraints in IMERG-L’s capacity to reliably monitor high-intensity precipitation events.
In summary, IMERG-L demonstrates considerable potential in monitoring different precipitation events in Zhejiang, especially in the spatial characterization and quantitative estimation of frequency-based precipitation indices, and can effectively reflect regional wetness conditions and precipitation trends and thus can serve as a reference data source for medium- and long-term climate monitoring and trend assessments, particularly in regions lacking ground-based observations. However, in the face of heavy precipitation events or complex terrain backgrounds, its estimation capability is still limited and suffers from an error amplification and systematic bias. While the differences in mountainous terrain can be explained by difficulties in averaging precipitation, the large range between the observations and satellite data on the coast may be attributable to the errors from the precipitation retrieval algorithm and satellite measurements. Because passive microwave sensors, while capable of penetrating cloud layers to detect precipitation structures, generally have a low spatial resolution (around 10–30 km), making it difficult to resolve small-scale convective systems or localized orographic rainfall. In coastal transition zones, the uncertainty of precipitation retrievals is further amplified by mixed signals from land and ocean surfaces. Microwave signals are highly sensitive to surface emissivity, and the emissivity differs significantly between the land and ocean. The ocean surface emits relatively uniform microwave radiation, whereas land surfaces—especially urban areas—exhibit a high variability, which often interferes with retrieval algorithms [
31], leading to a systematic overestimation of the precipitation in coastal regions. These issues collectively result in spatial biases and the misestimation of the precipitation intensity in the IMERG-L product.
Therefore, it is recommended that the IMERG-L data be corrected with ground observations, and by modeling the systematic errors between IMERG-L and observational data, the accuracy under extreme precipitation conditions can be improved. Alternatively, that multi-source fusion techniques can be used to improve its reliability and machine learning techniques and may be applied in the assessment of extreme weather events in practical climate research and hydrological modeling, by integrating satellite data with radar products, reanalysis datasets and automatic weather station observations through spatial interpolation or weighted averaging, thereby compensating for the limitations of single-source data in complex terrain or localized strong convection conditions.
It should be noted that this study only evaluated the precipitation monitoring capability of the GPM satellite IMERG-L product. To gain a more comprehensive understanding of the applicability of satellite precipitation products in extreme weather monitoring, future research could incorporate a wider range of satellite datasets for a comparative analysis. For example, the Climate Hazard Groups Infrared Precipitation with Stations (CHIRPS) is a gridded precipitation high-resolution (0.05°) product derived from satellite images and ground observations [
44]; this could help to enhance the robustness of the study and provide valuable information. By comparing the performance of different products in terms of the precipitation intensity, frequency and spatial detection capability, it would be possible to better identify the suitable application scenarios for each dataset, enhance the overall effectiveness of satellite data in meteorological early warnings and risk assessments and provide more accurate and reliable data support for operational forecasting.


