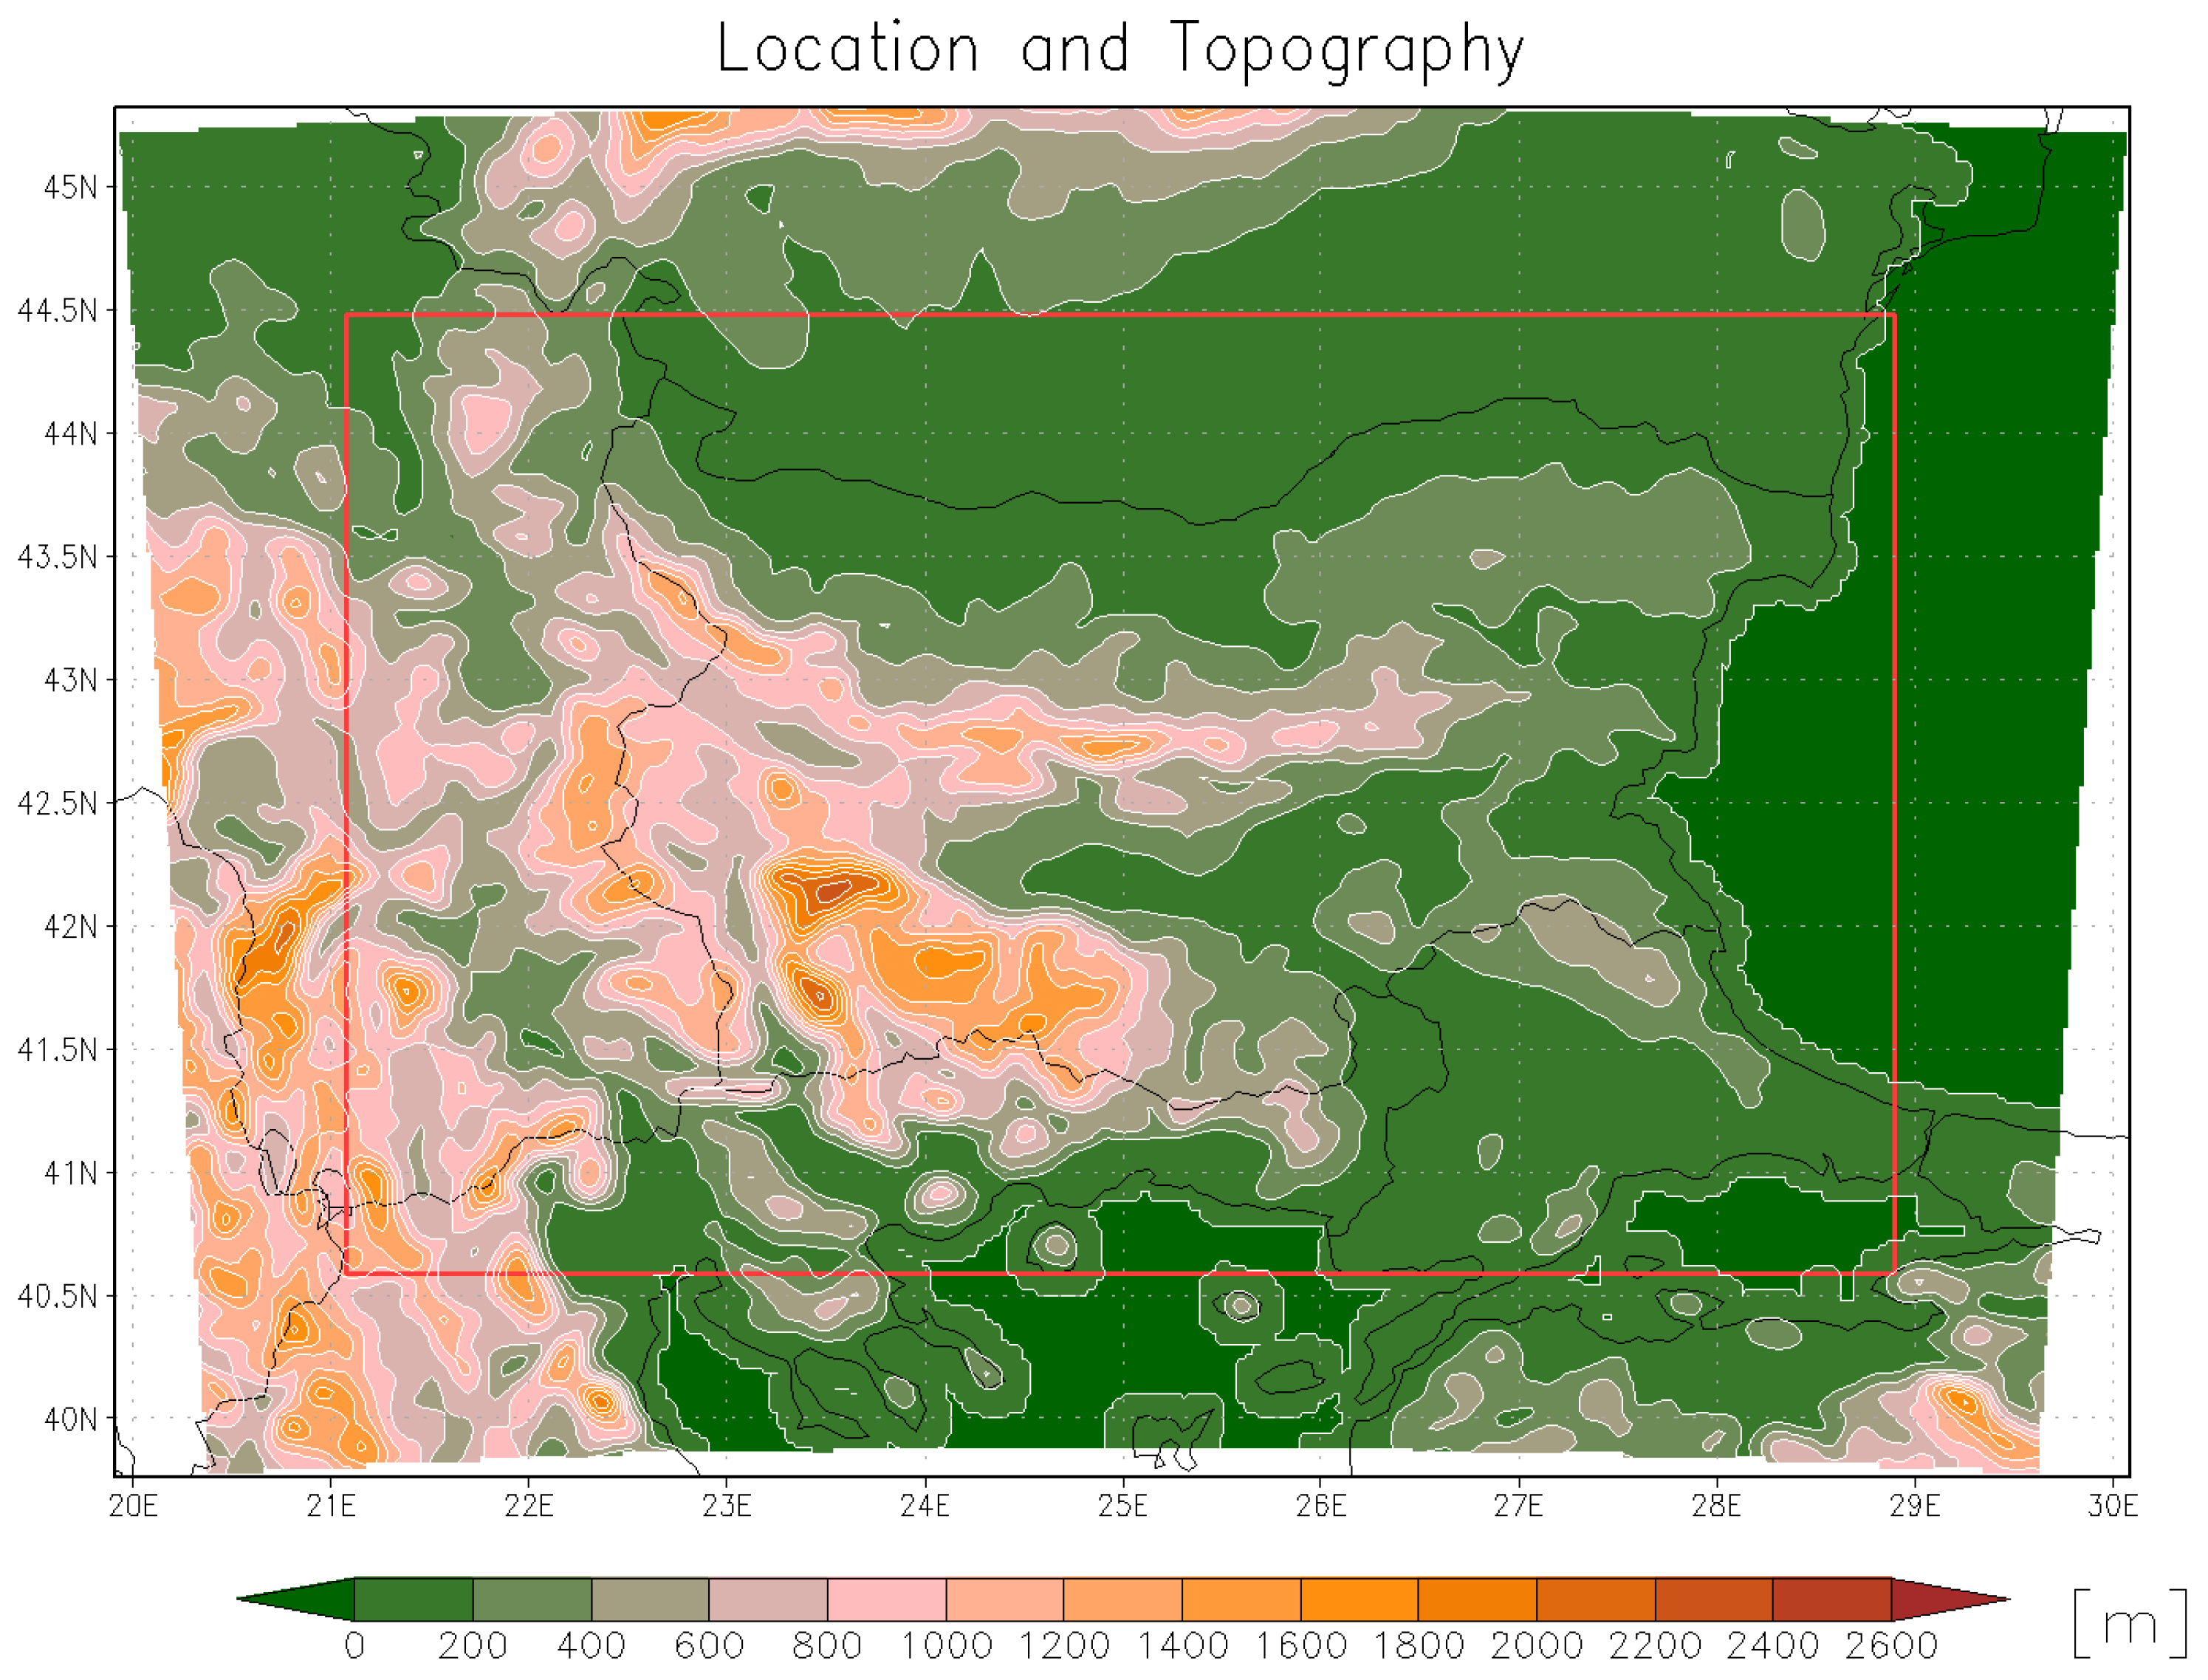
Figure 1.
Location and topography of the analysis region based on the high-resolution km scale simulation (3 km). The map displays terrain elevation (in meters above sea level) with 200 m contour intervals. The red bounding box indicates the location of the analysis region (Bulgaria and surrounding areas). Domain boundaries are 19.91° E–30.09° E; 39.76° N–45.32° N.
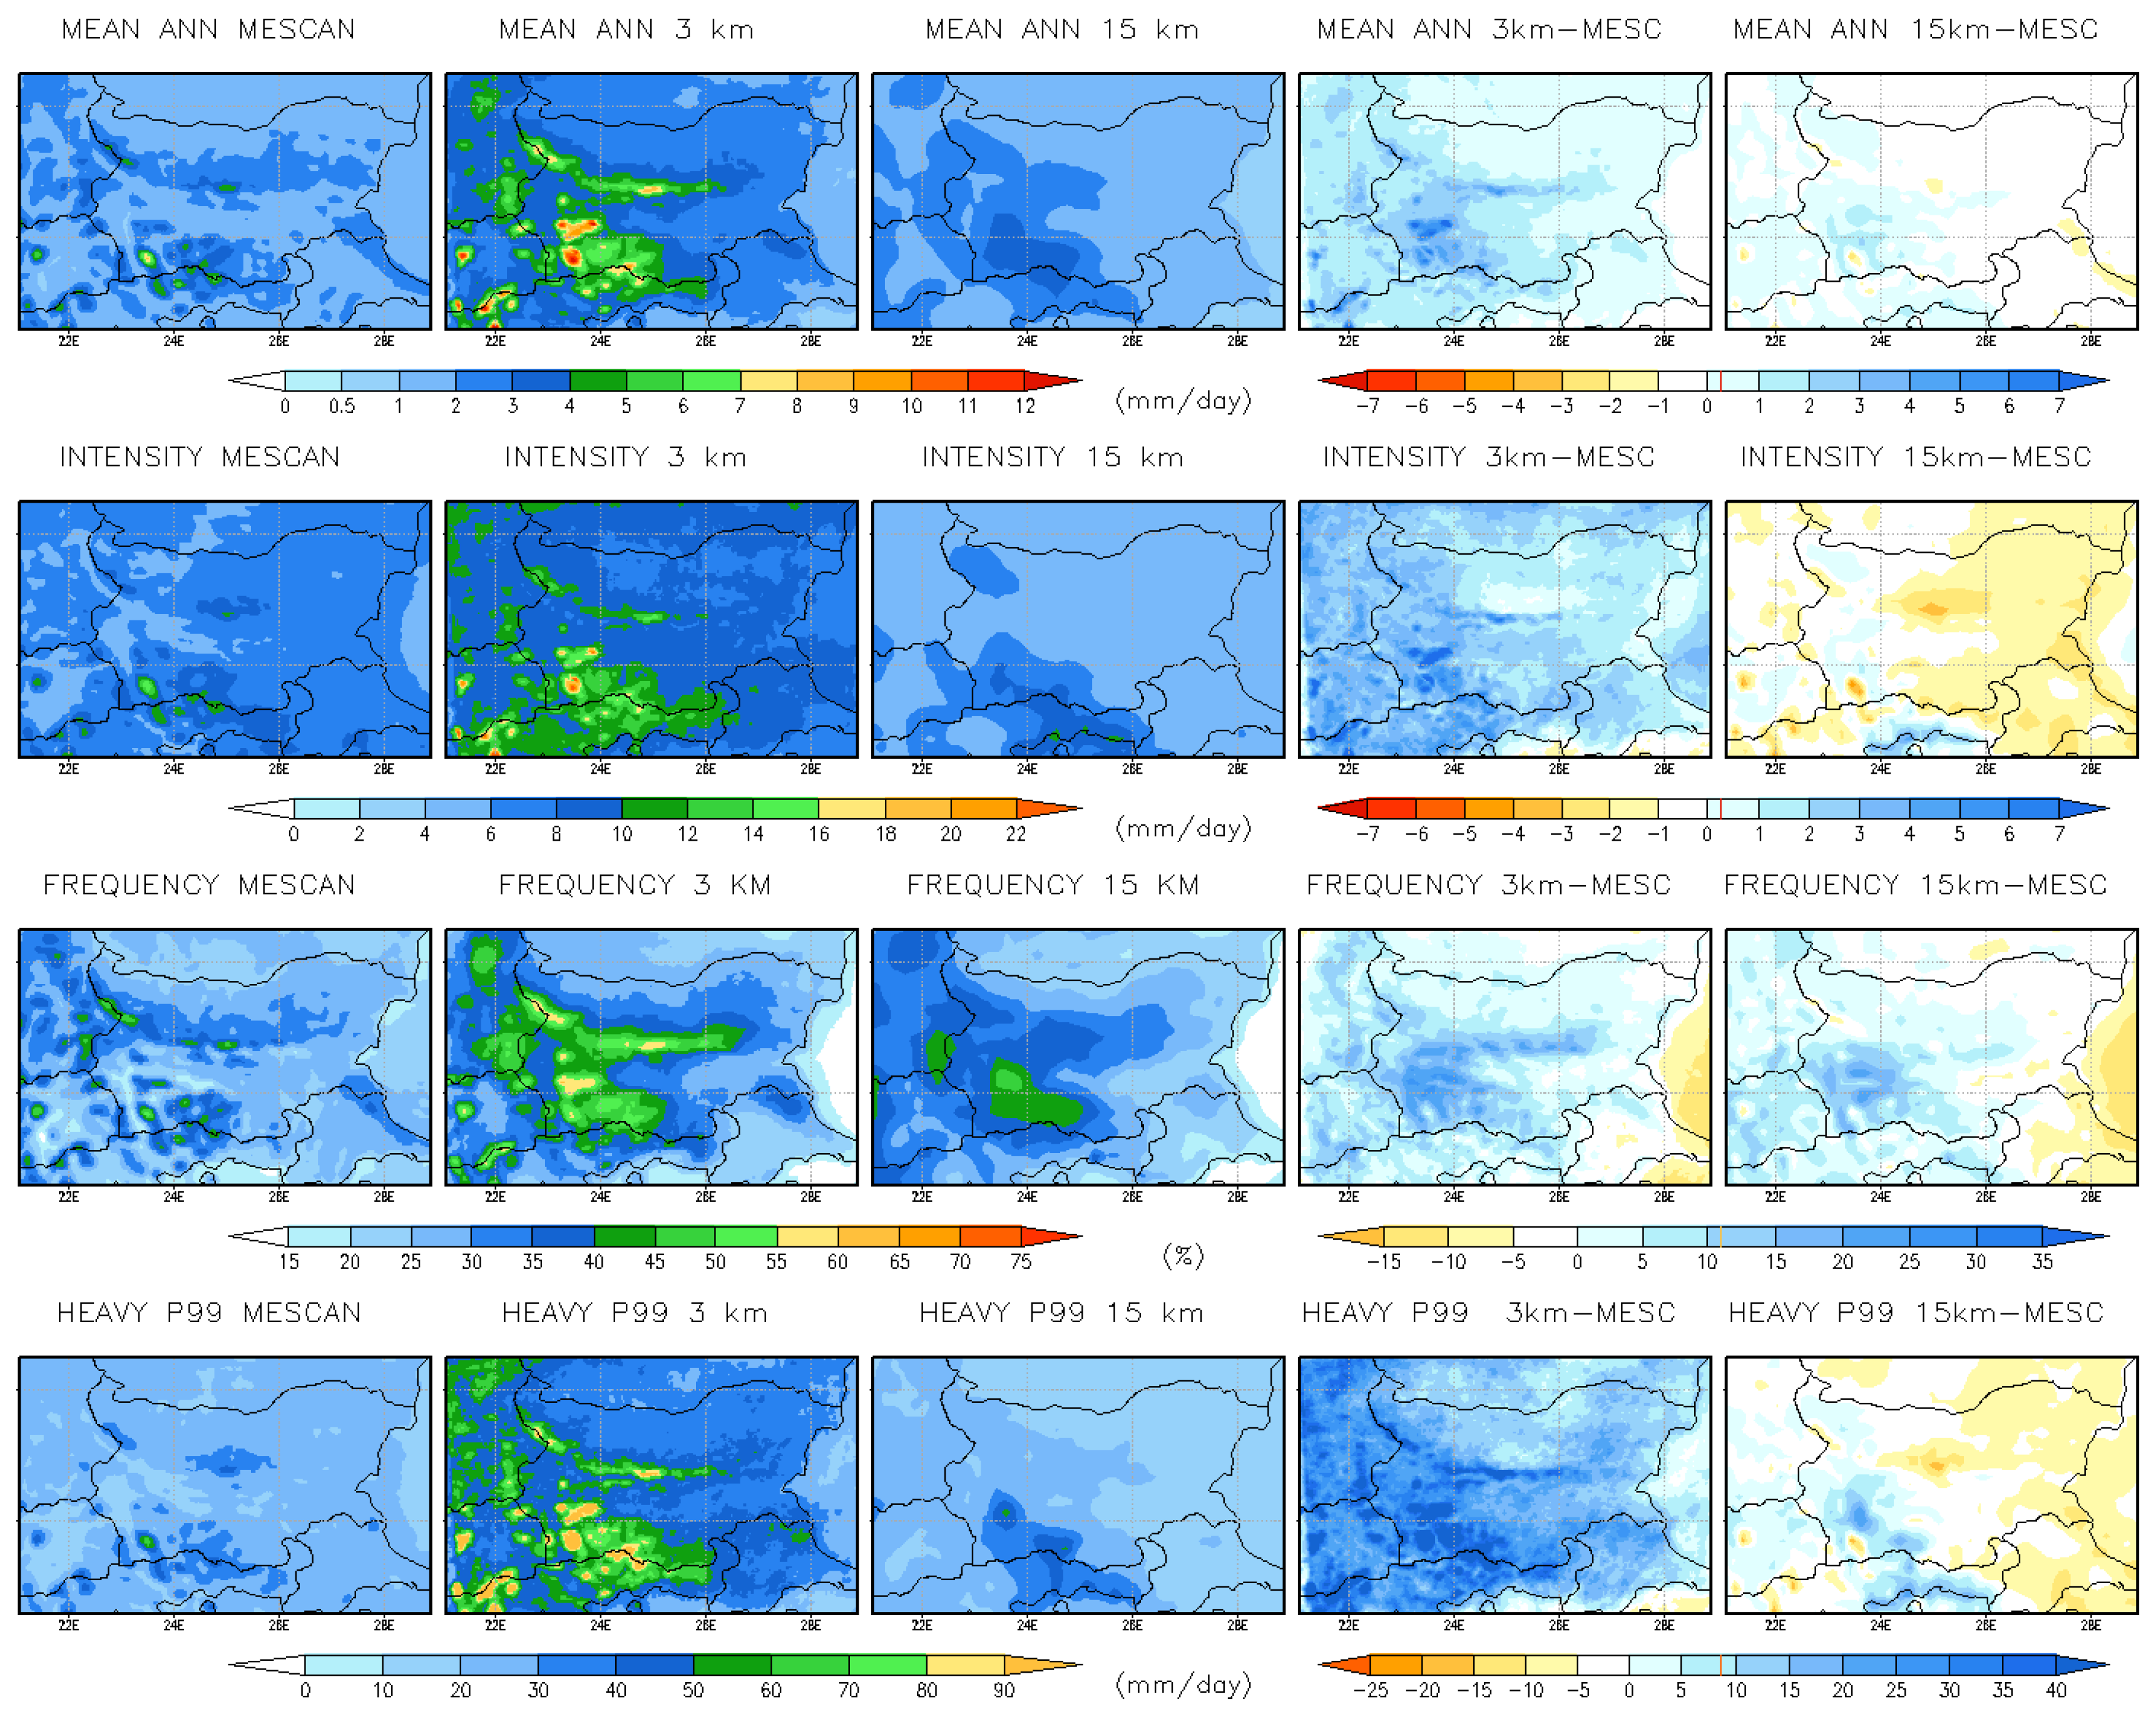
Figure 2.
Comparison of annual mean daily precipitation indices from MESCAN-SURFEX datasets and simulations (15 km RCM and 3 km CPRCM), along with mean biases for the historical period 1995–2004. Units: mm/d for all indices except frequency, which is expressed in %.
Figure 2.
Comparison of annual mean daily precipitation indices from MESCAN-SURFEX datasets and simulations (15 km RCM and 3 km CPRCM), along with mean biases for the historical period 1995–2004. Units: mm/d for all indices except frequency, which is expressed in %.
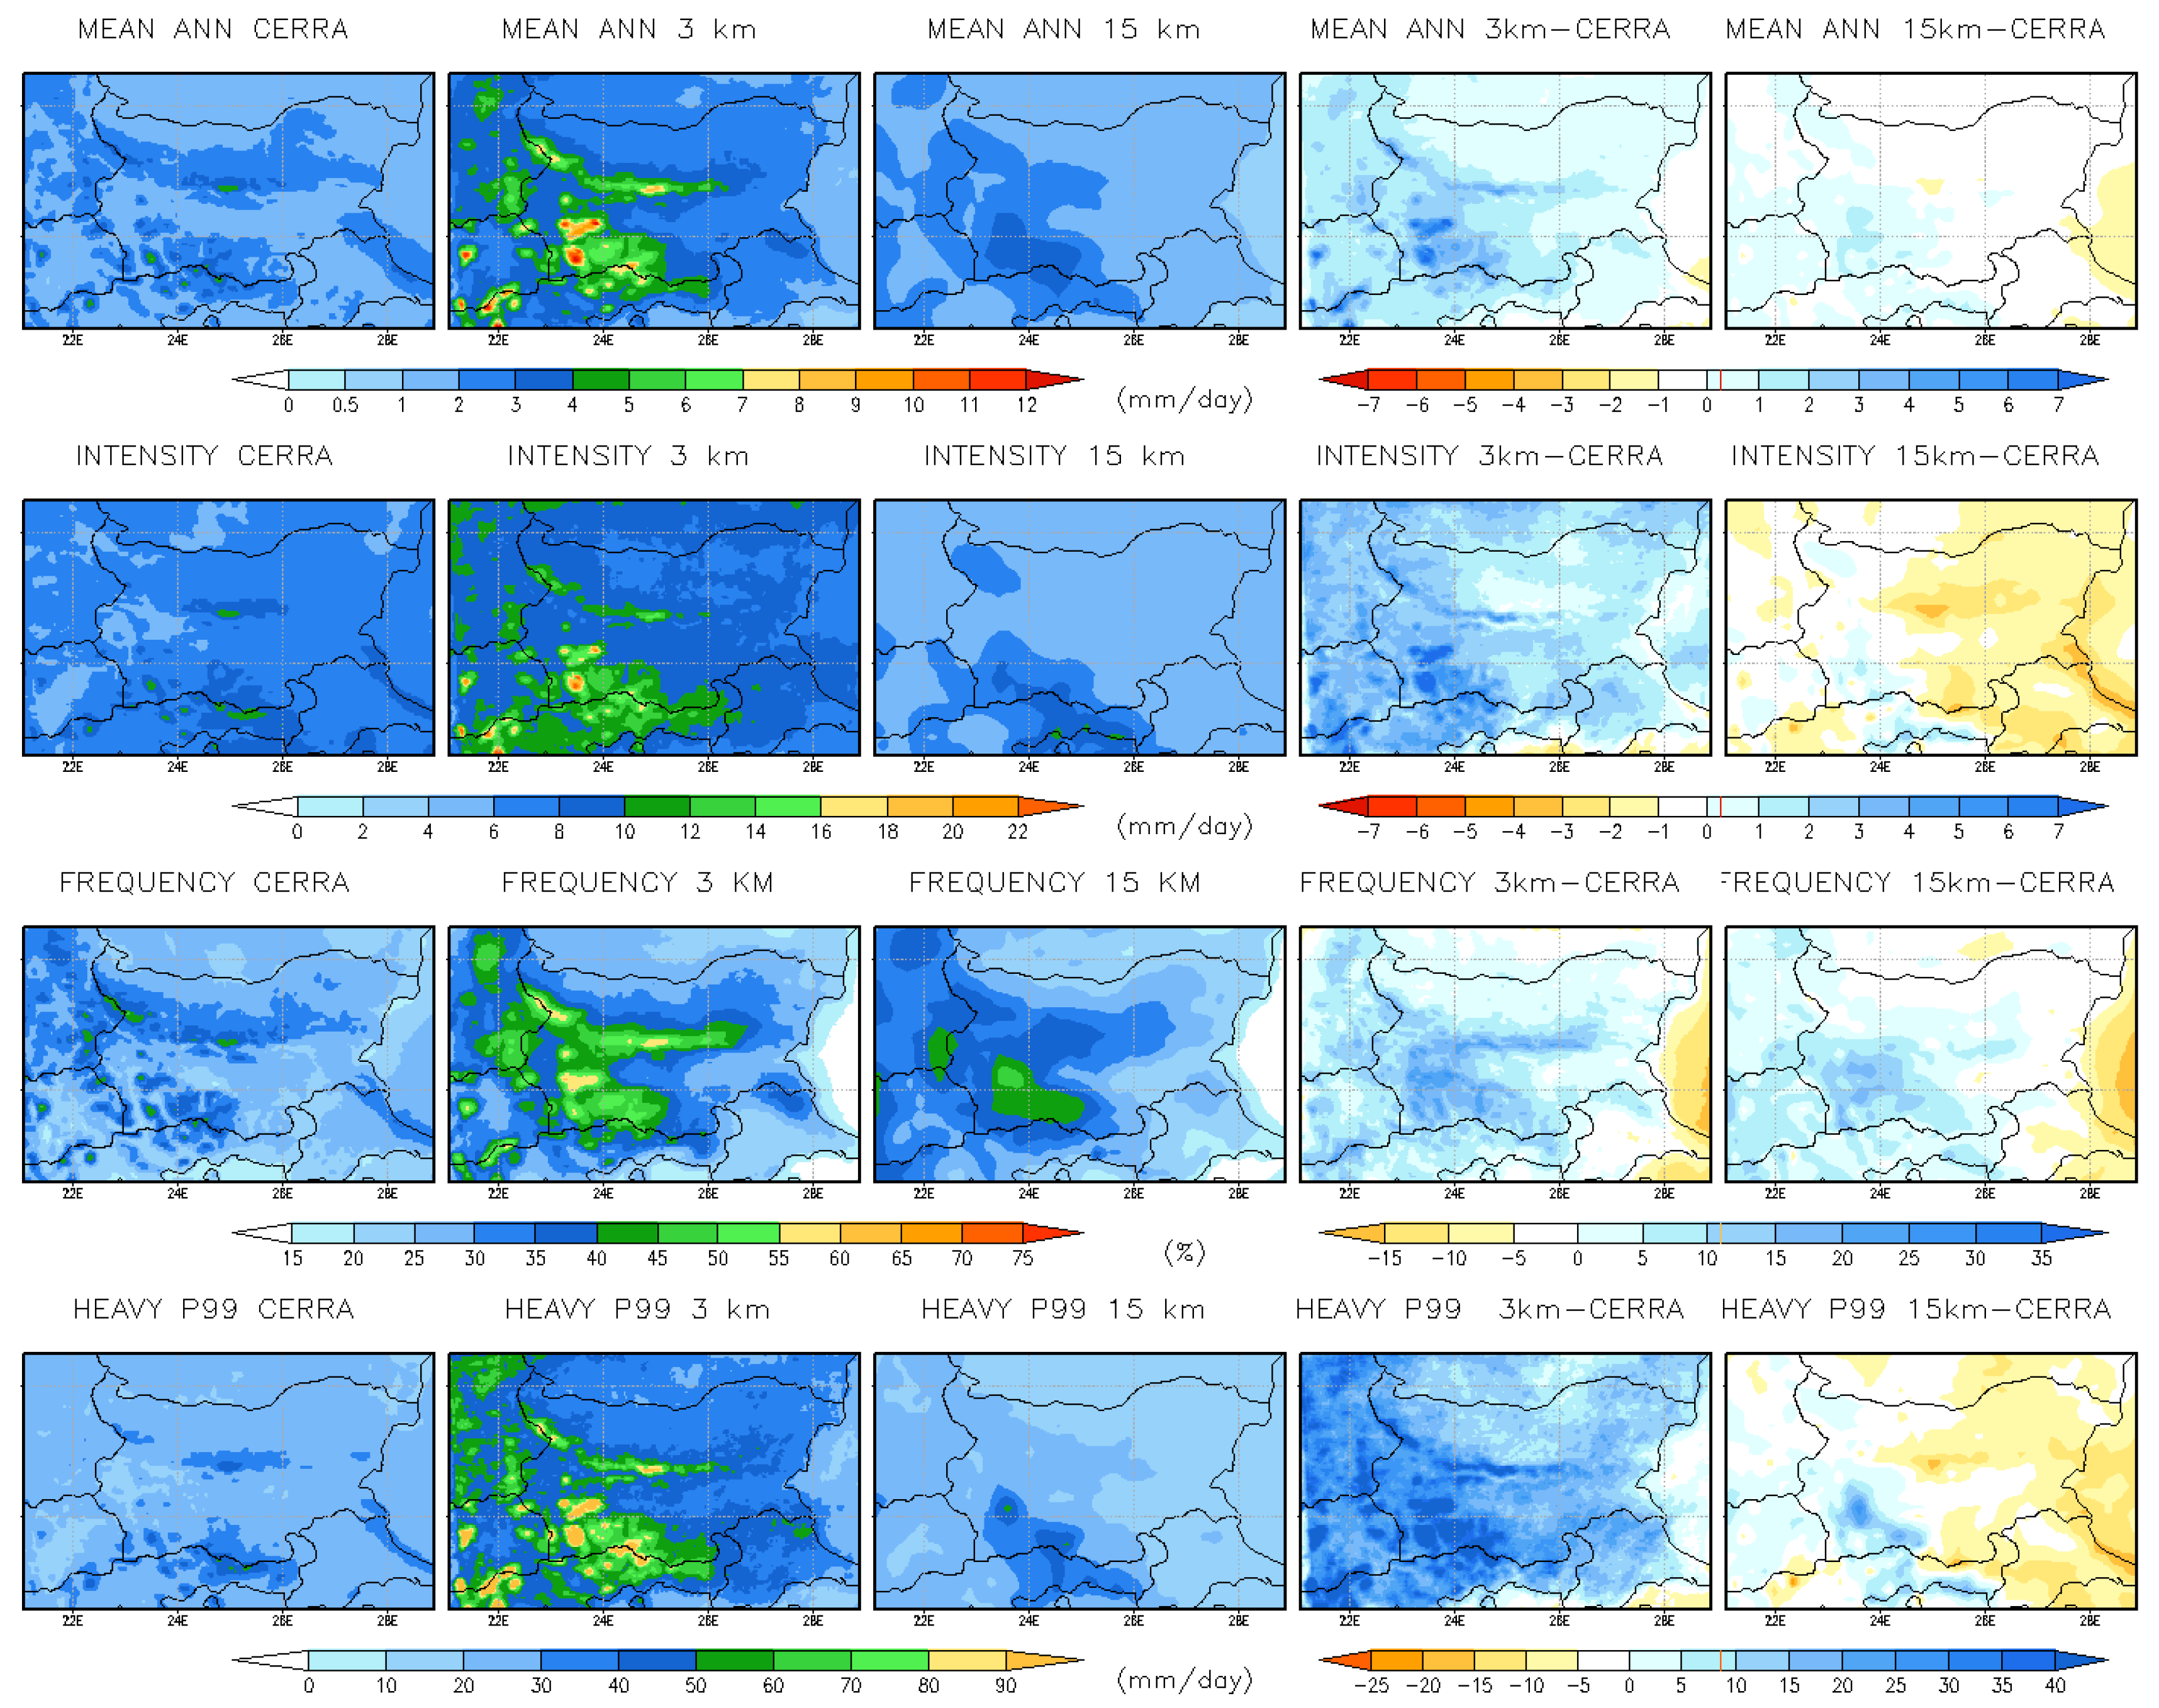
Figure 3.
Comparison of annual mean daily precipitation indices from CERRA datasets and simulations (15 km RCM and 3 km CPRCM), along with mean biases for the historical period 1995–2004. Units: mm/d for all indices except frequency, which is expressed in %.
Figure 3.
Comparison of annual mean daily precipitation indices from CERRA datasets and simulations (15 km RCM and 3 km CPRCM), along with mean biases for the historical period 1995–2004. Units: mm/d for all indices except frequency, which is expressed in %.
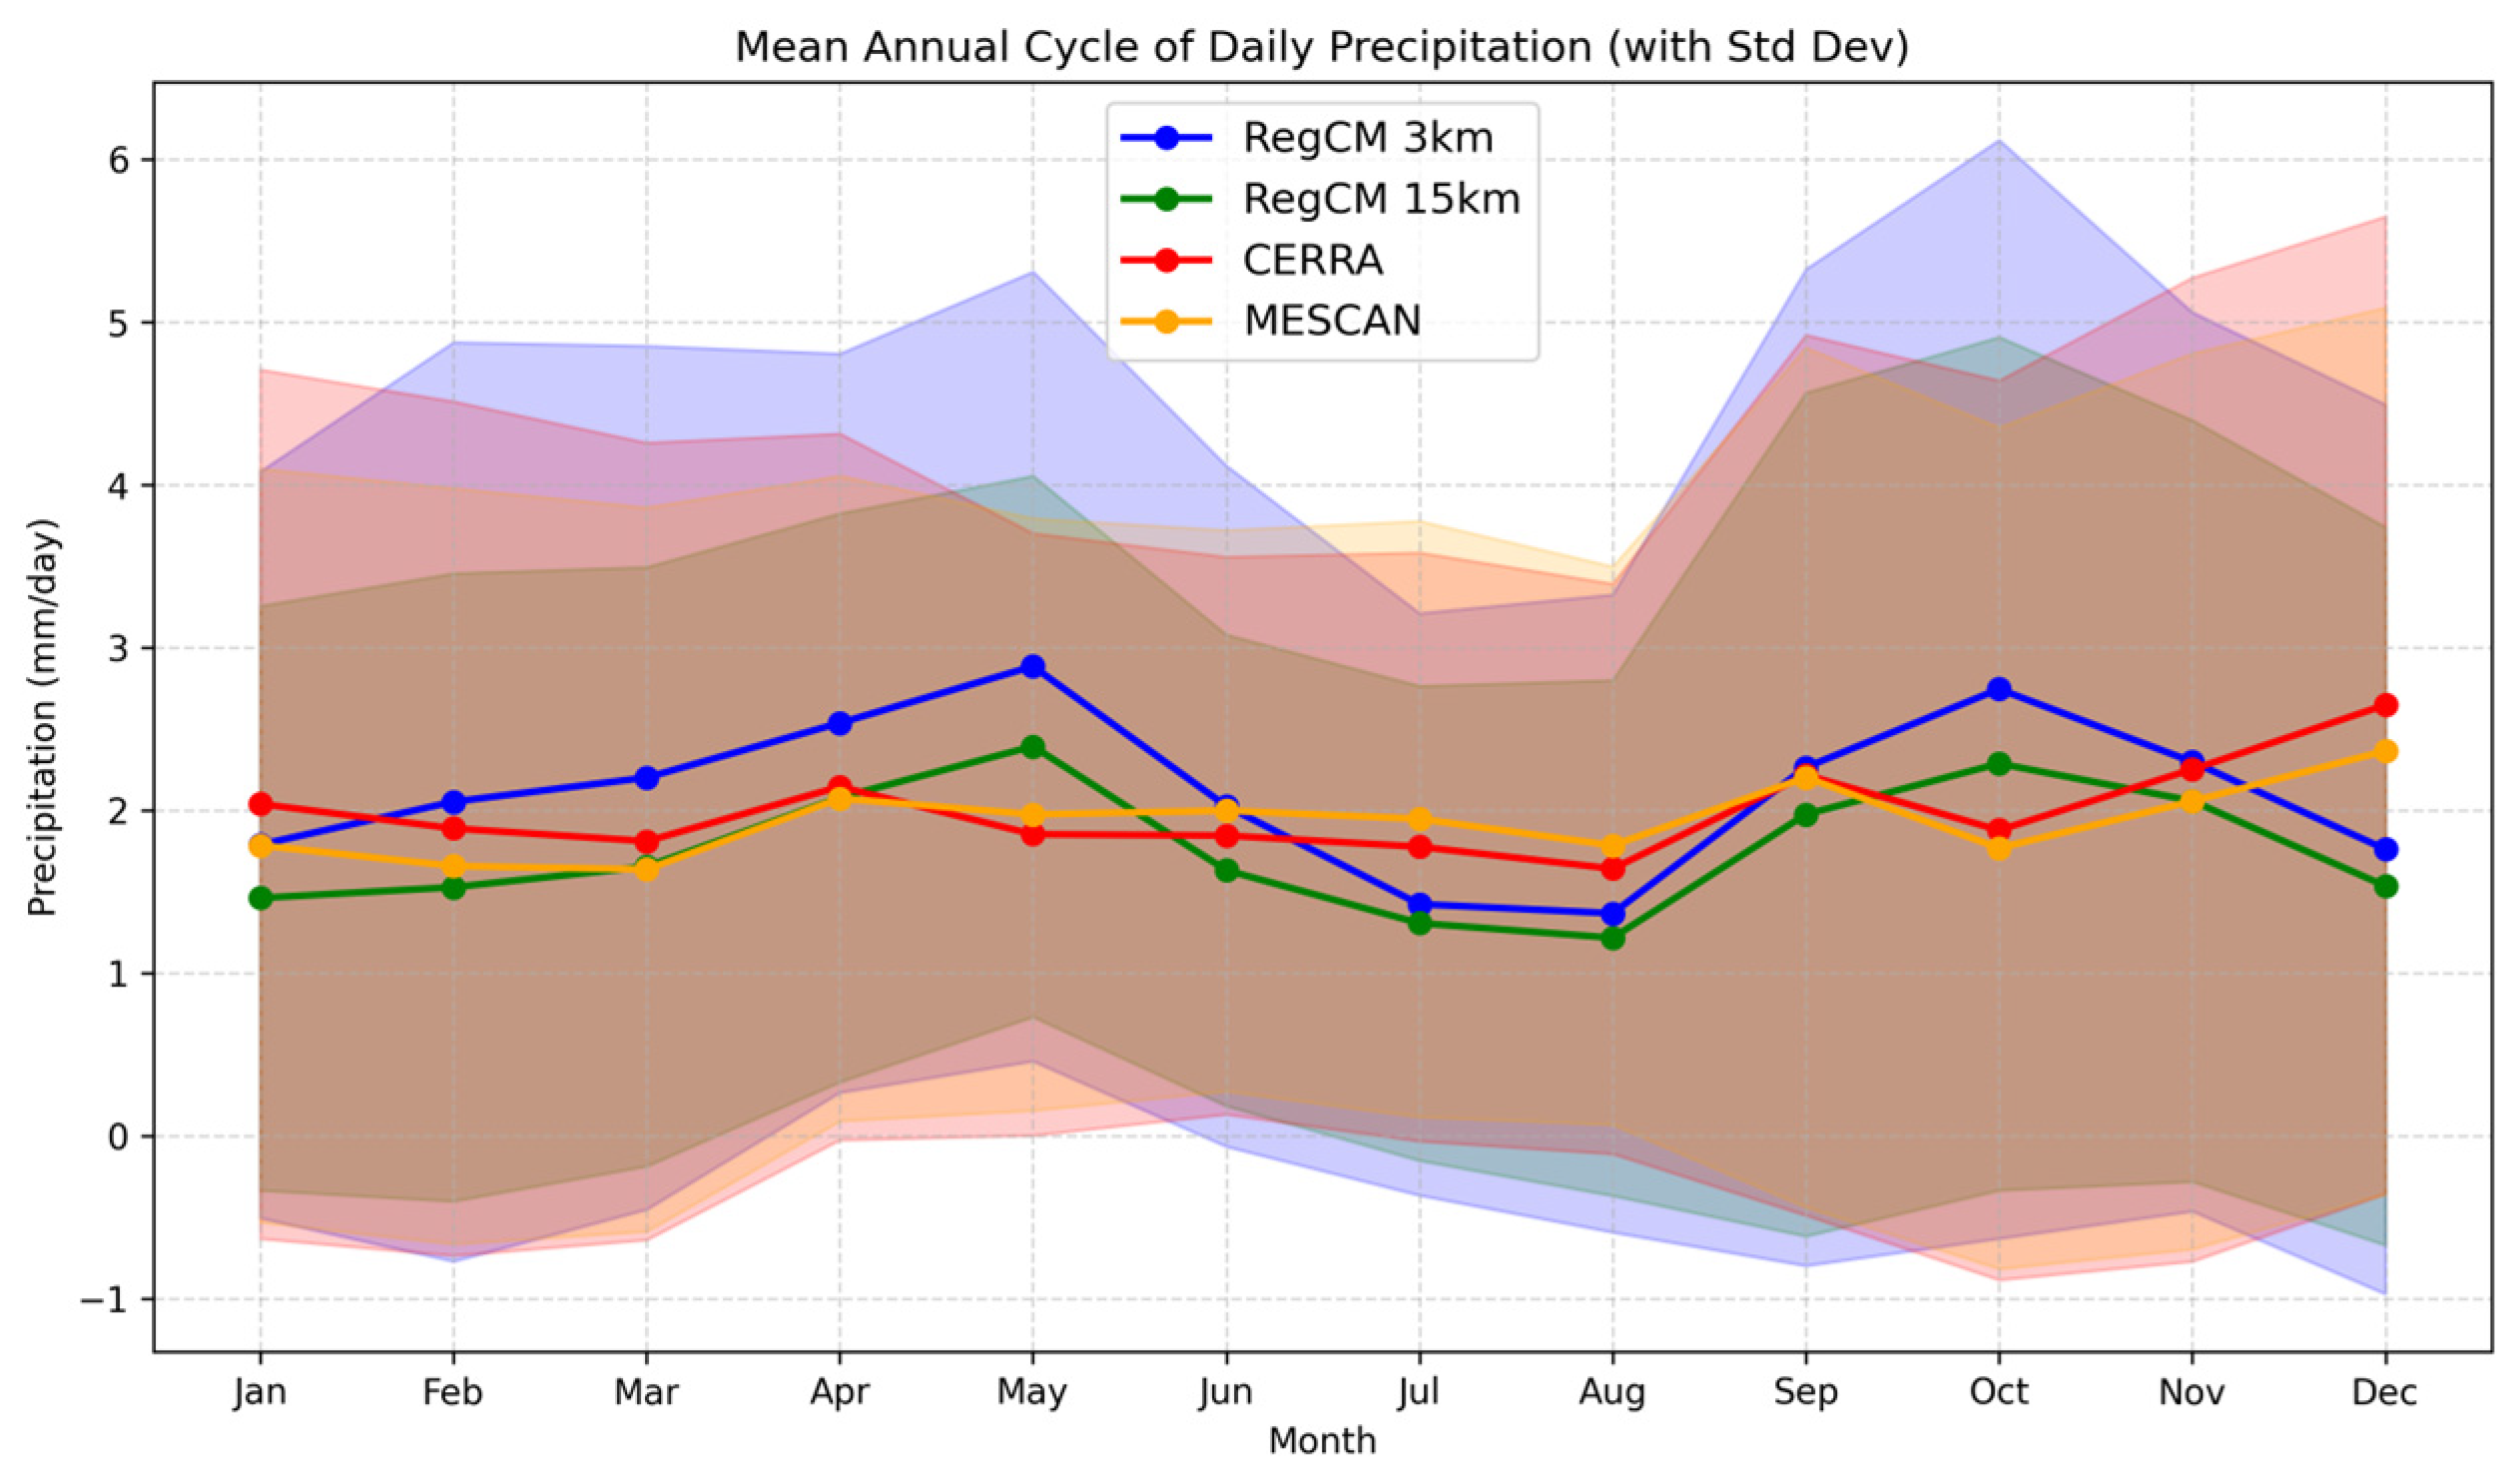
Figure 4.
Mean annual cycle of daily precipitation over Bulgaria for the period 1995–2004, with standard deviation shading (mean ± standard deviation). The comparison includes two model simulations—RegCM at 3 km (blue line) and 15 km (green line)—and two observational datasets—MESCAN (yellow line) and CERRA (red line).
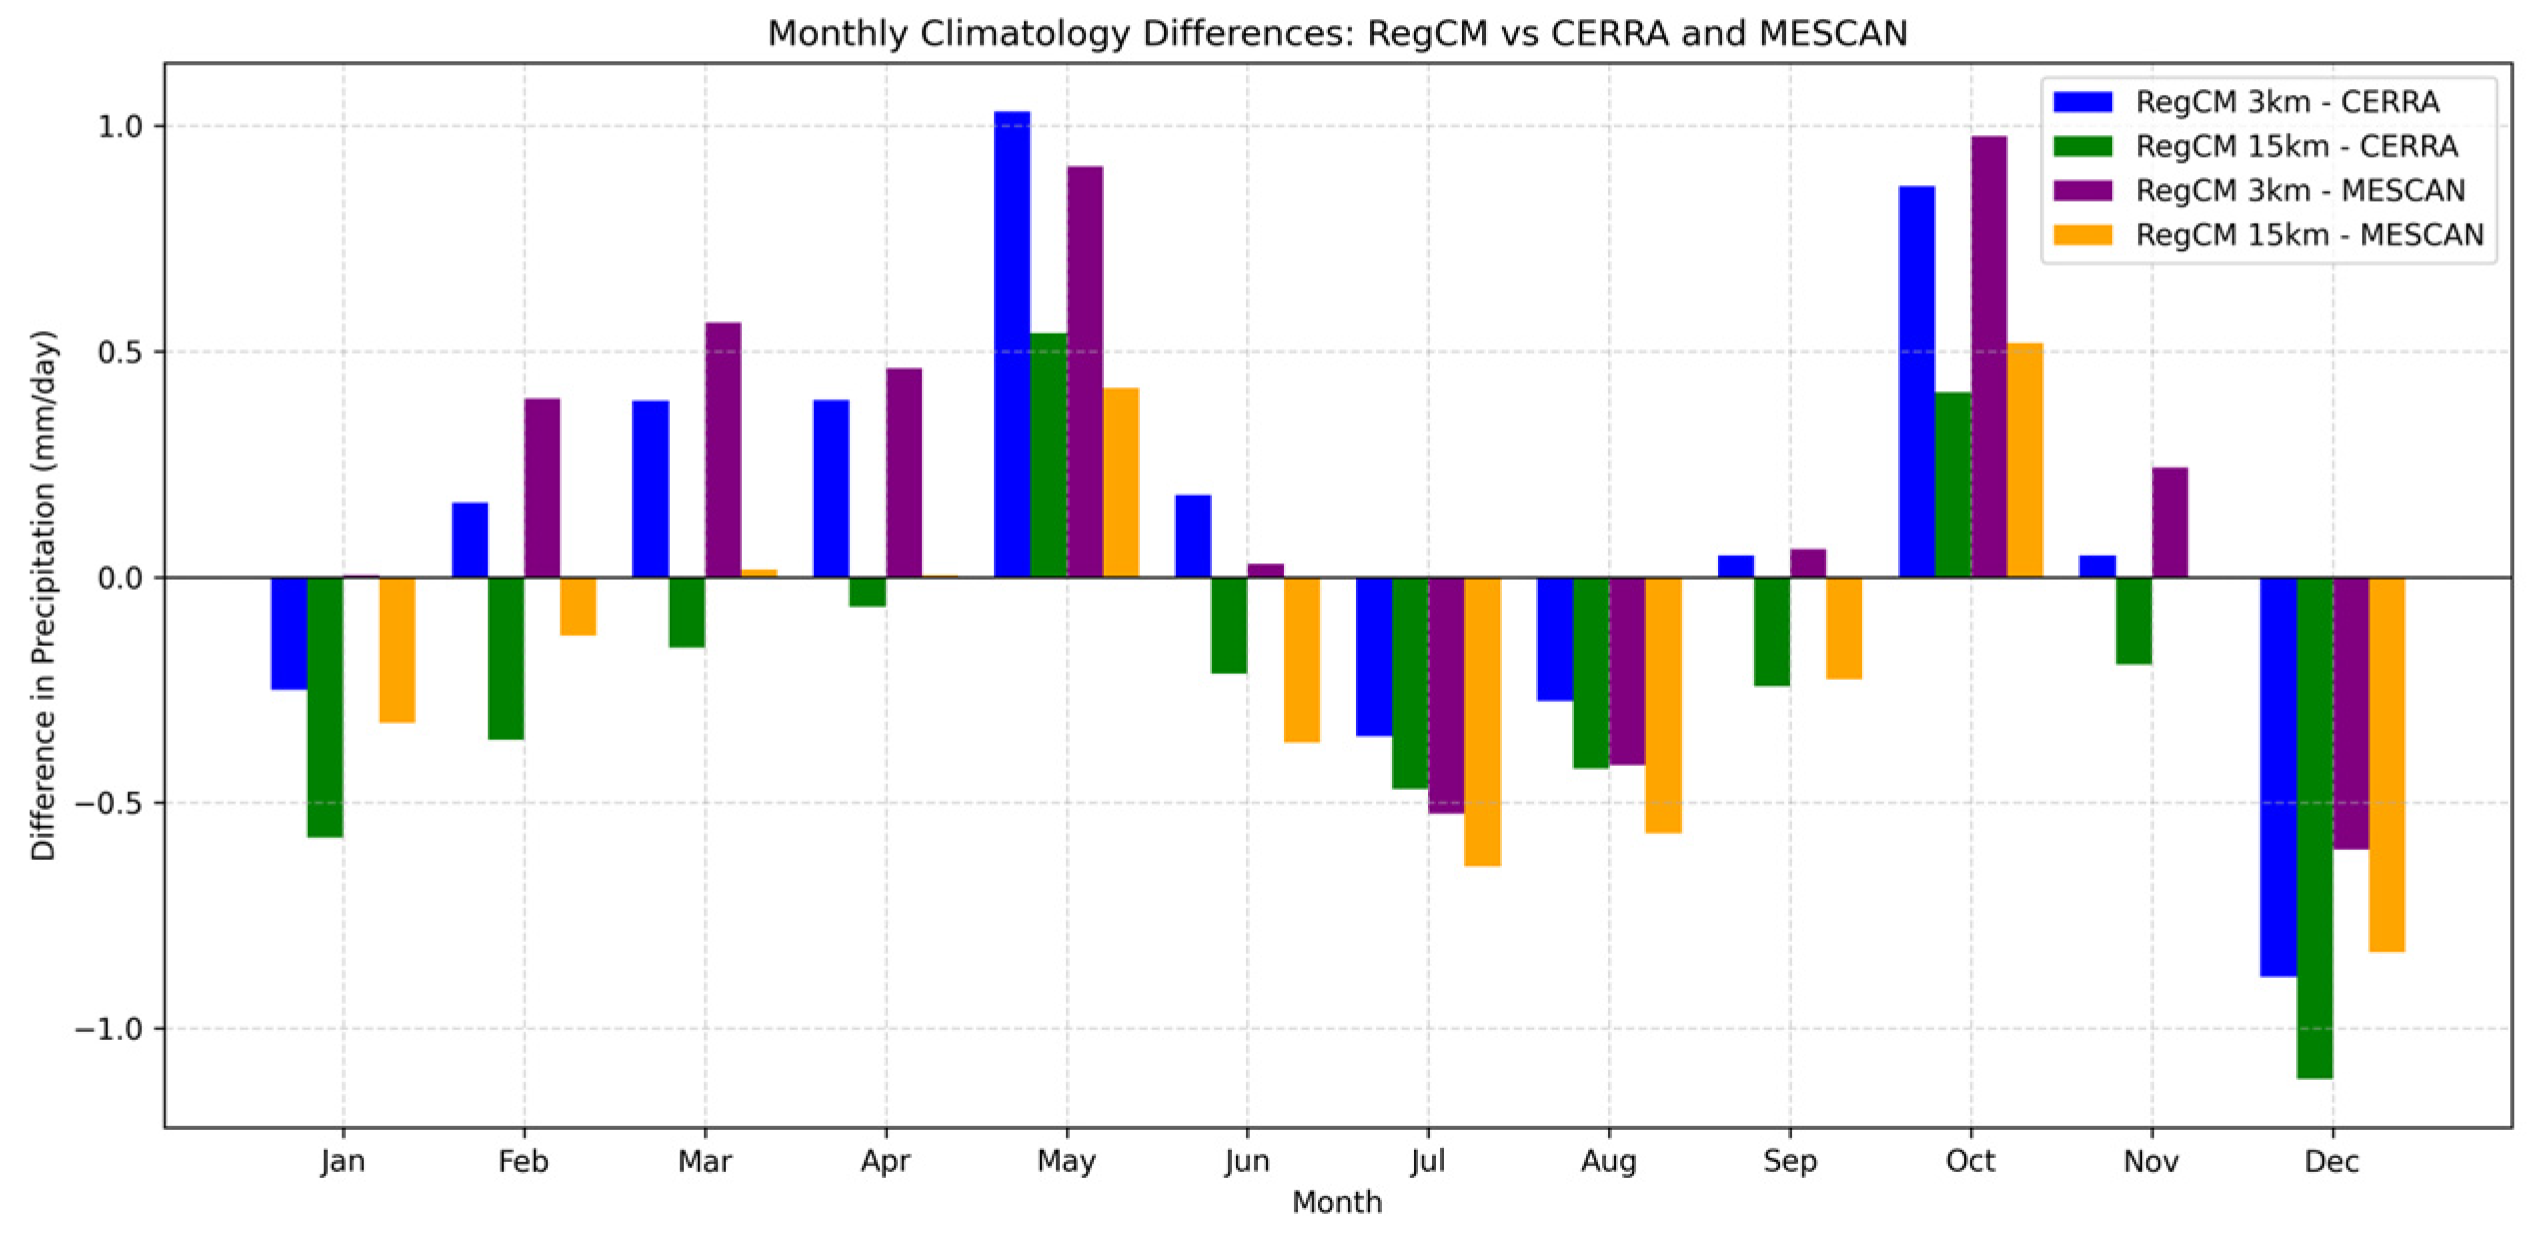
Figure 5.
Monthly precipitation differences between the two RegCM model simulations and two reference datasets (CERRA and MESCAN).
Figure 5.
Monthly precipitation differences between the two RegCM model simulations and two reference datasets (CERRA and MESCAN).
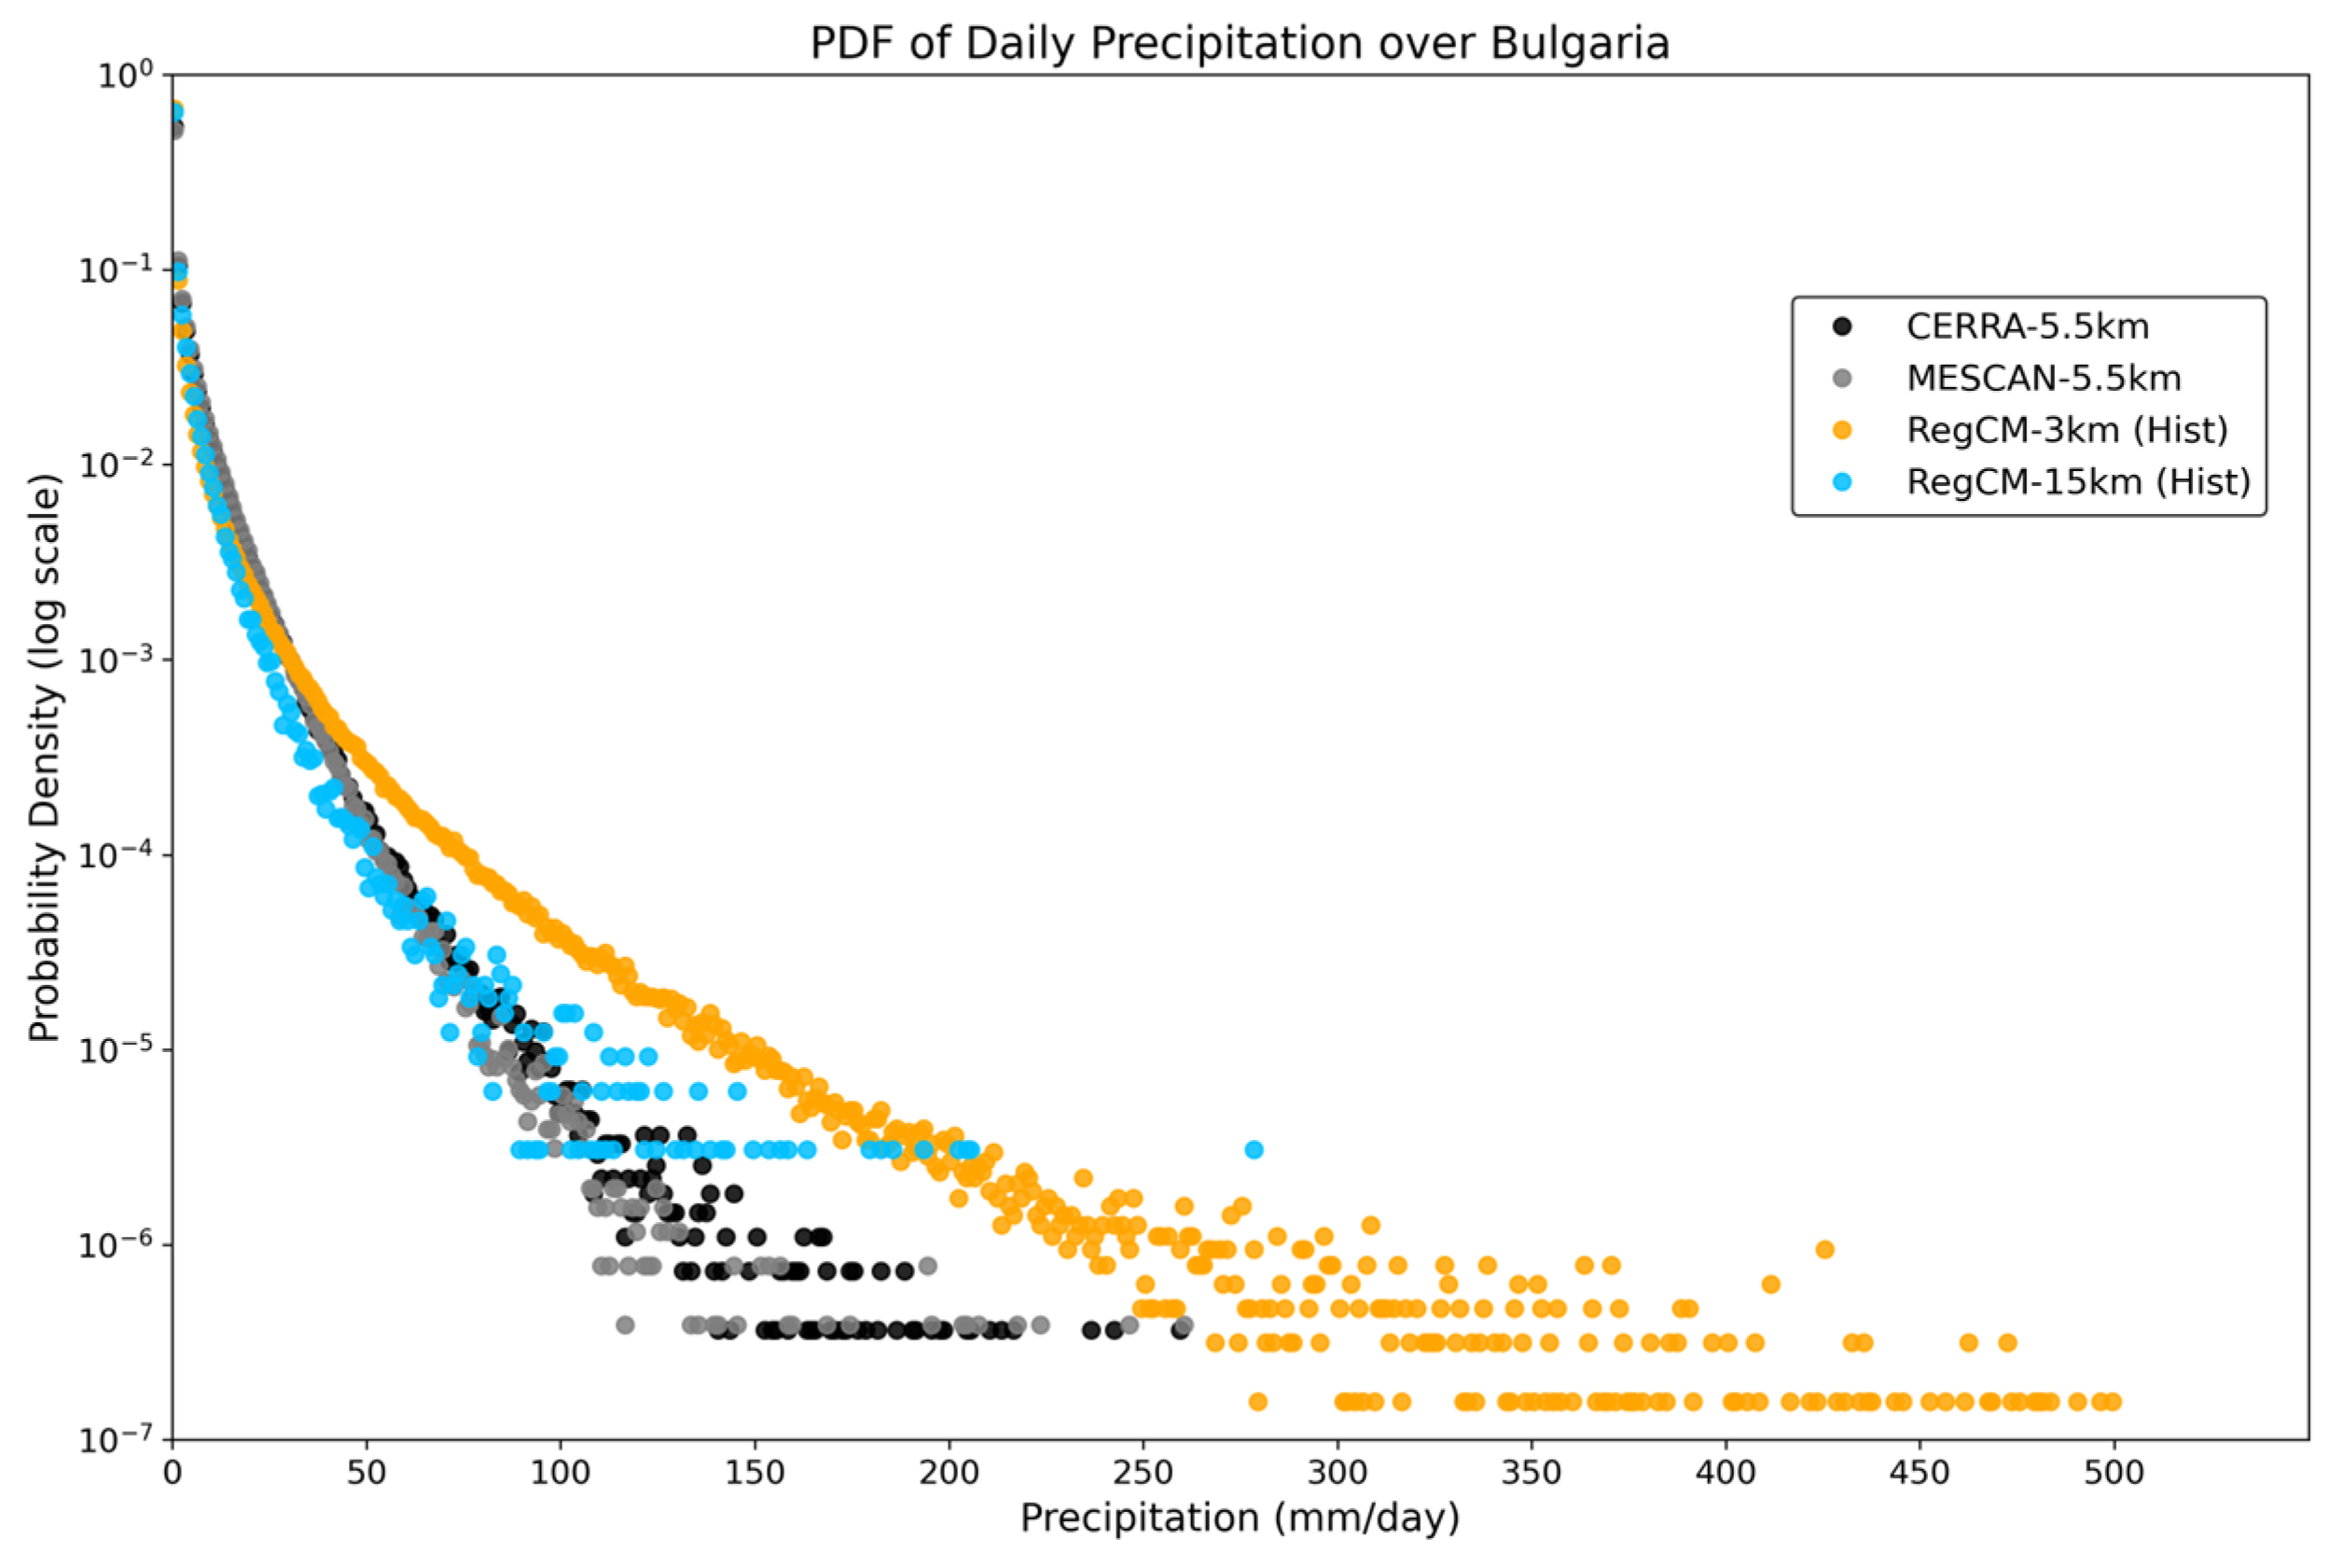
Figure 6.
Daily probability density functions (PDFs) from simulations (3 km and 15 km) and observations (CERRA, MESCAN). The datasets are in their original grid.
Figure 6.
Daily probability density functions (PDFs) from simulations (3 km and 15 km) and observations (CERRA, MESCAN). The datasets are in their original grid.
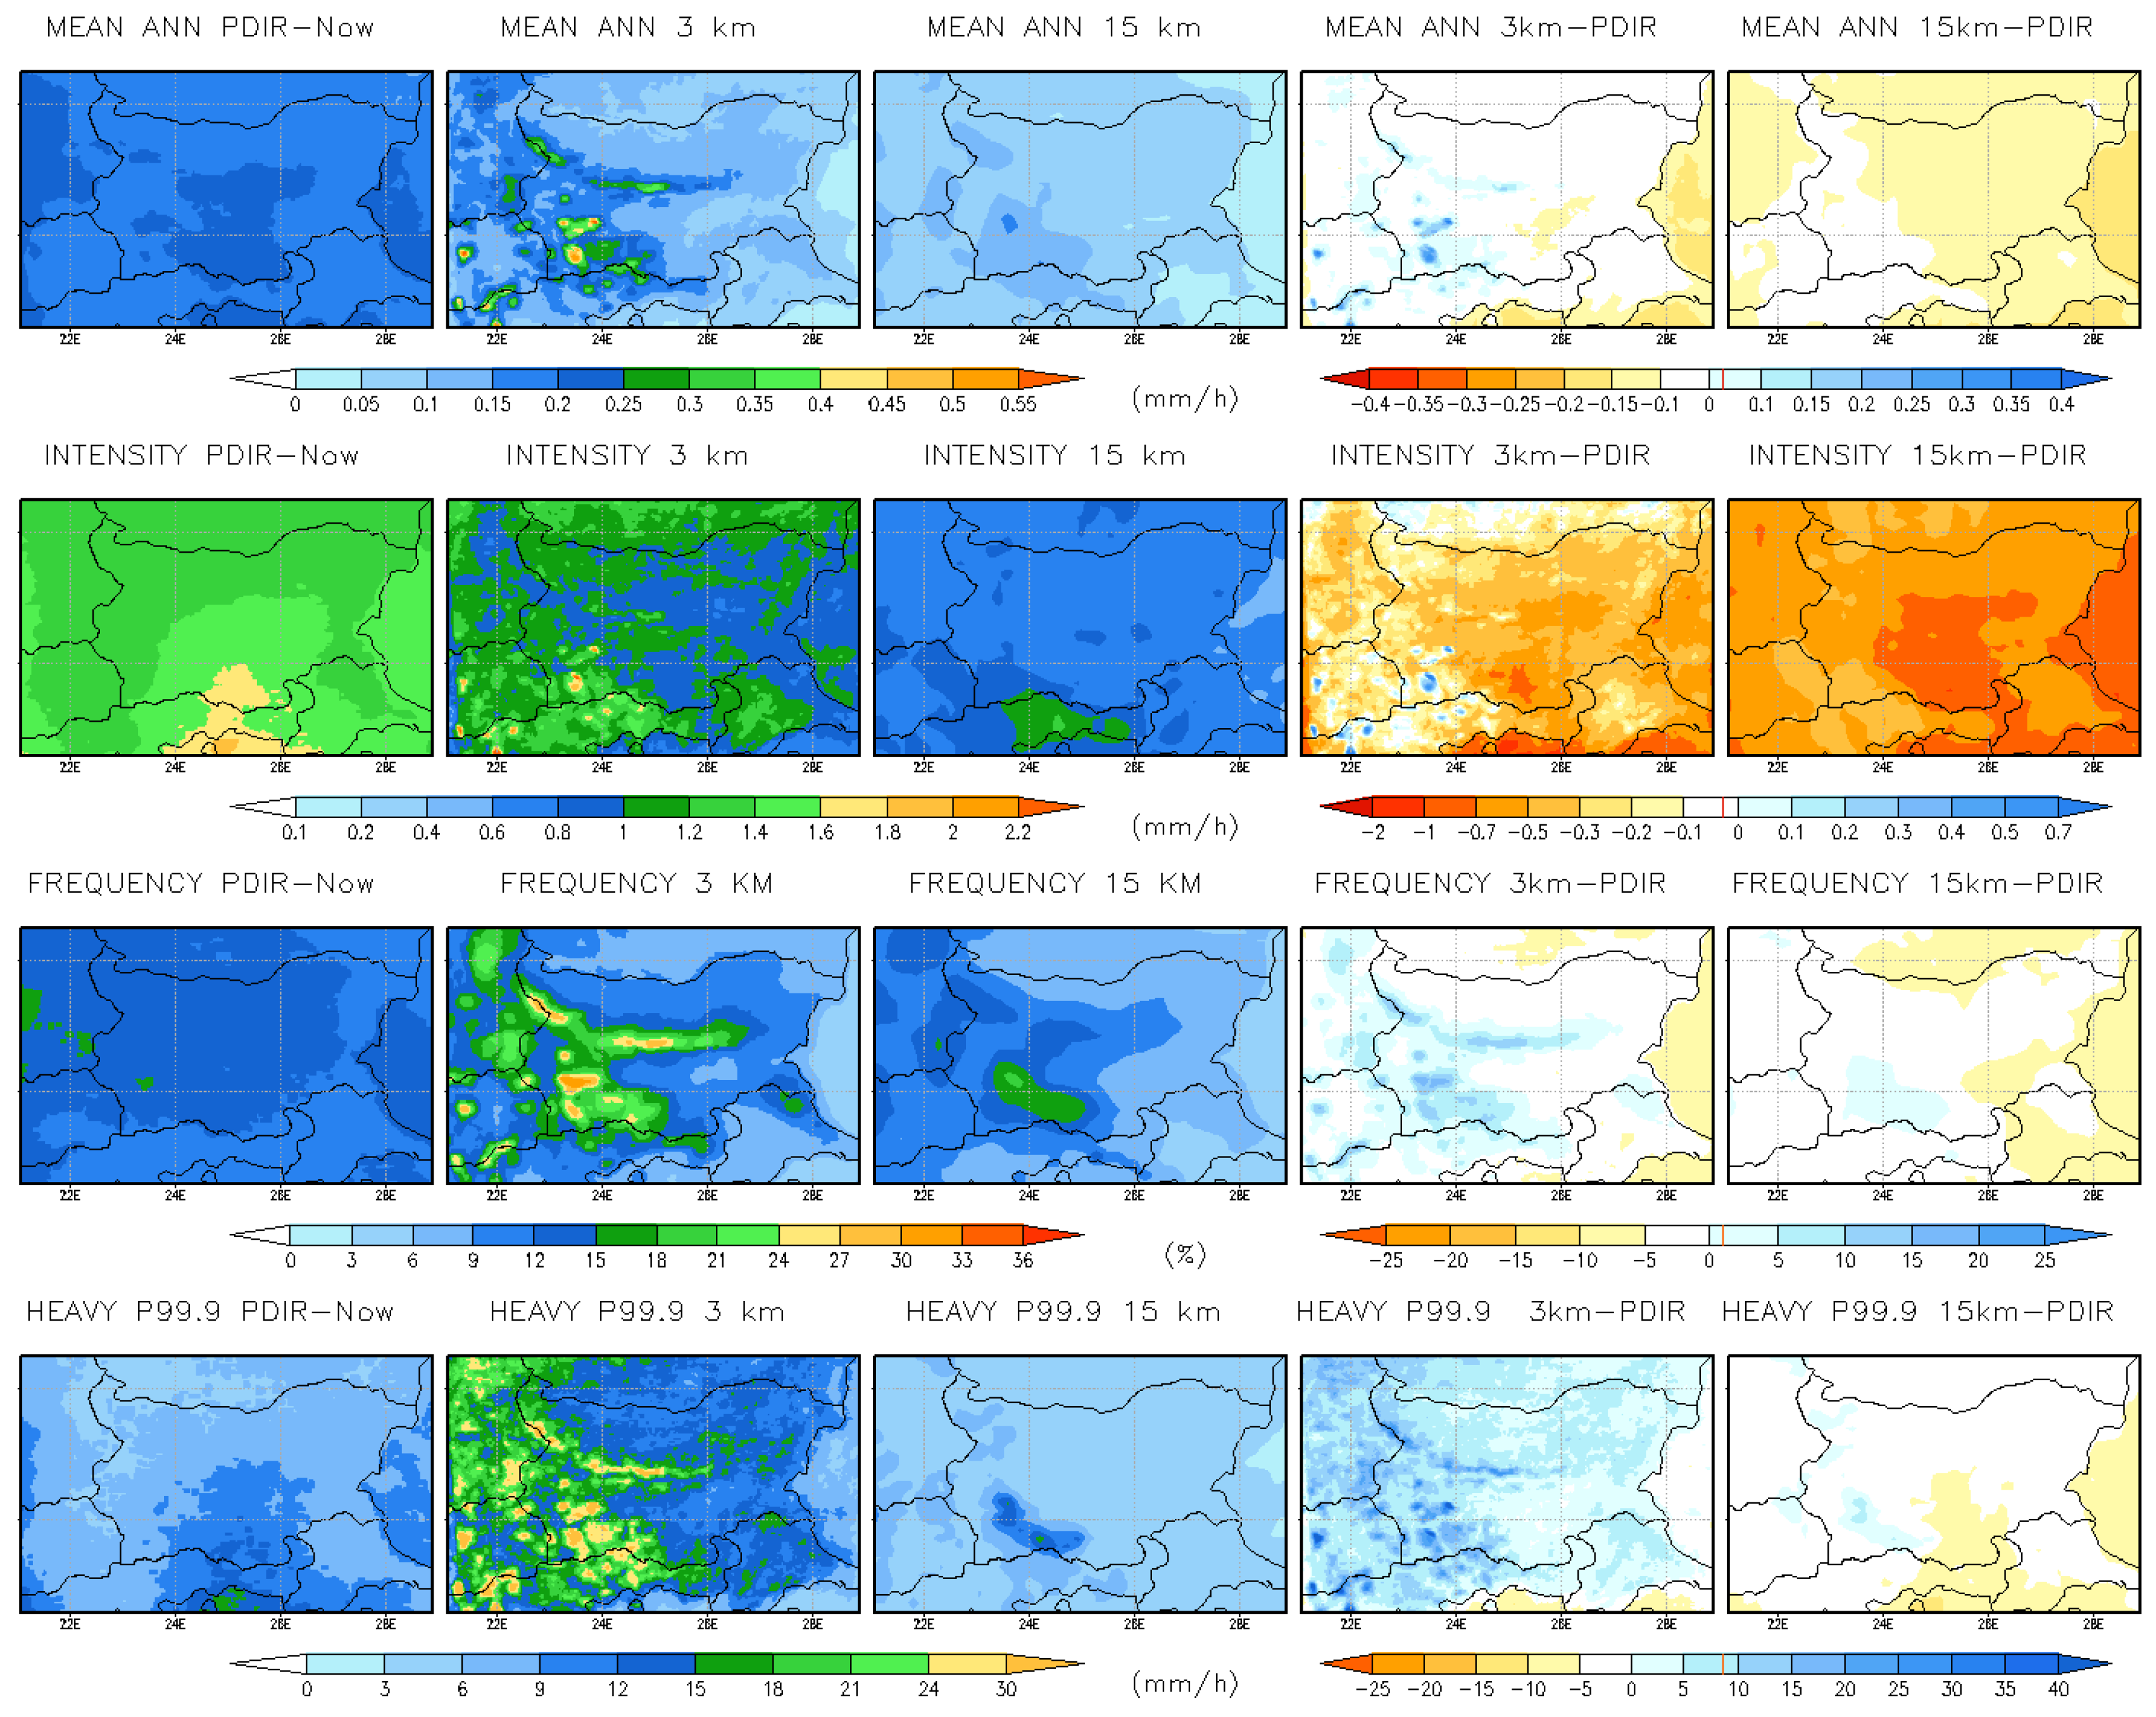
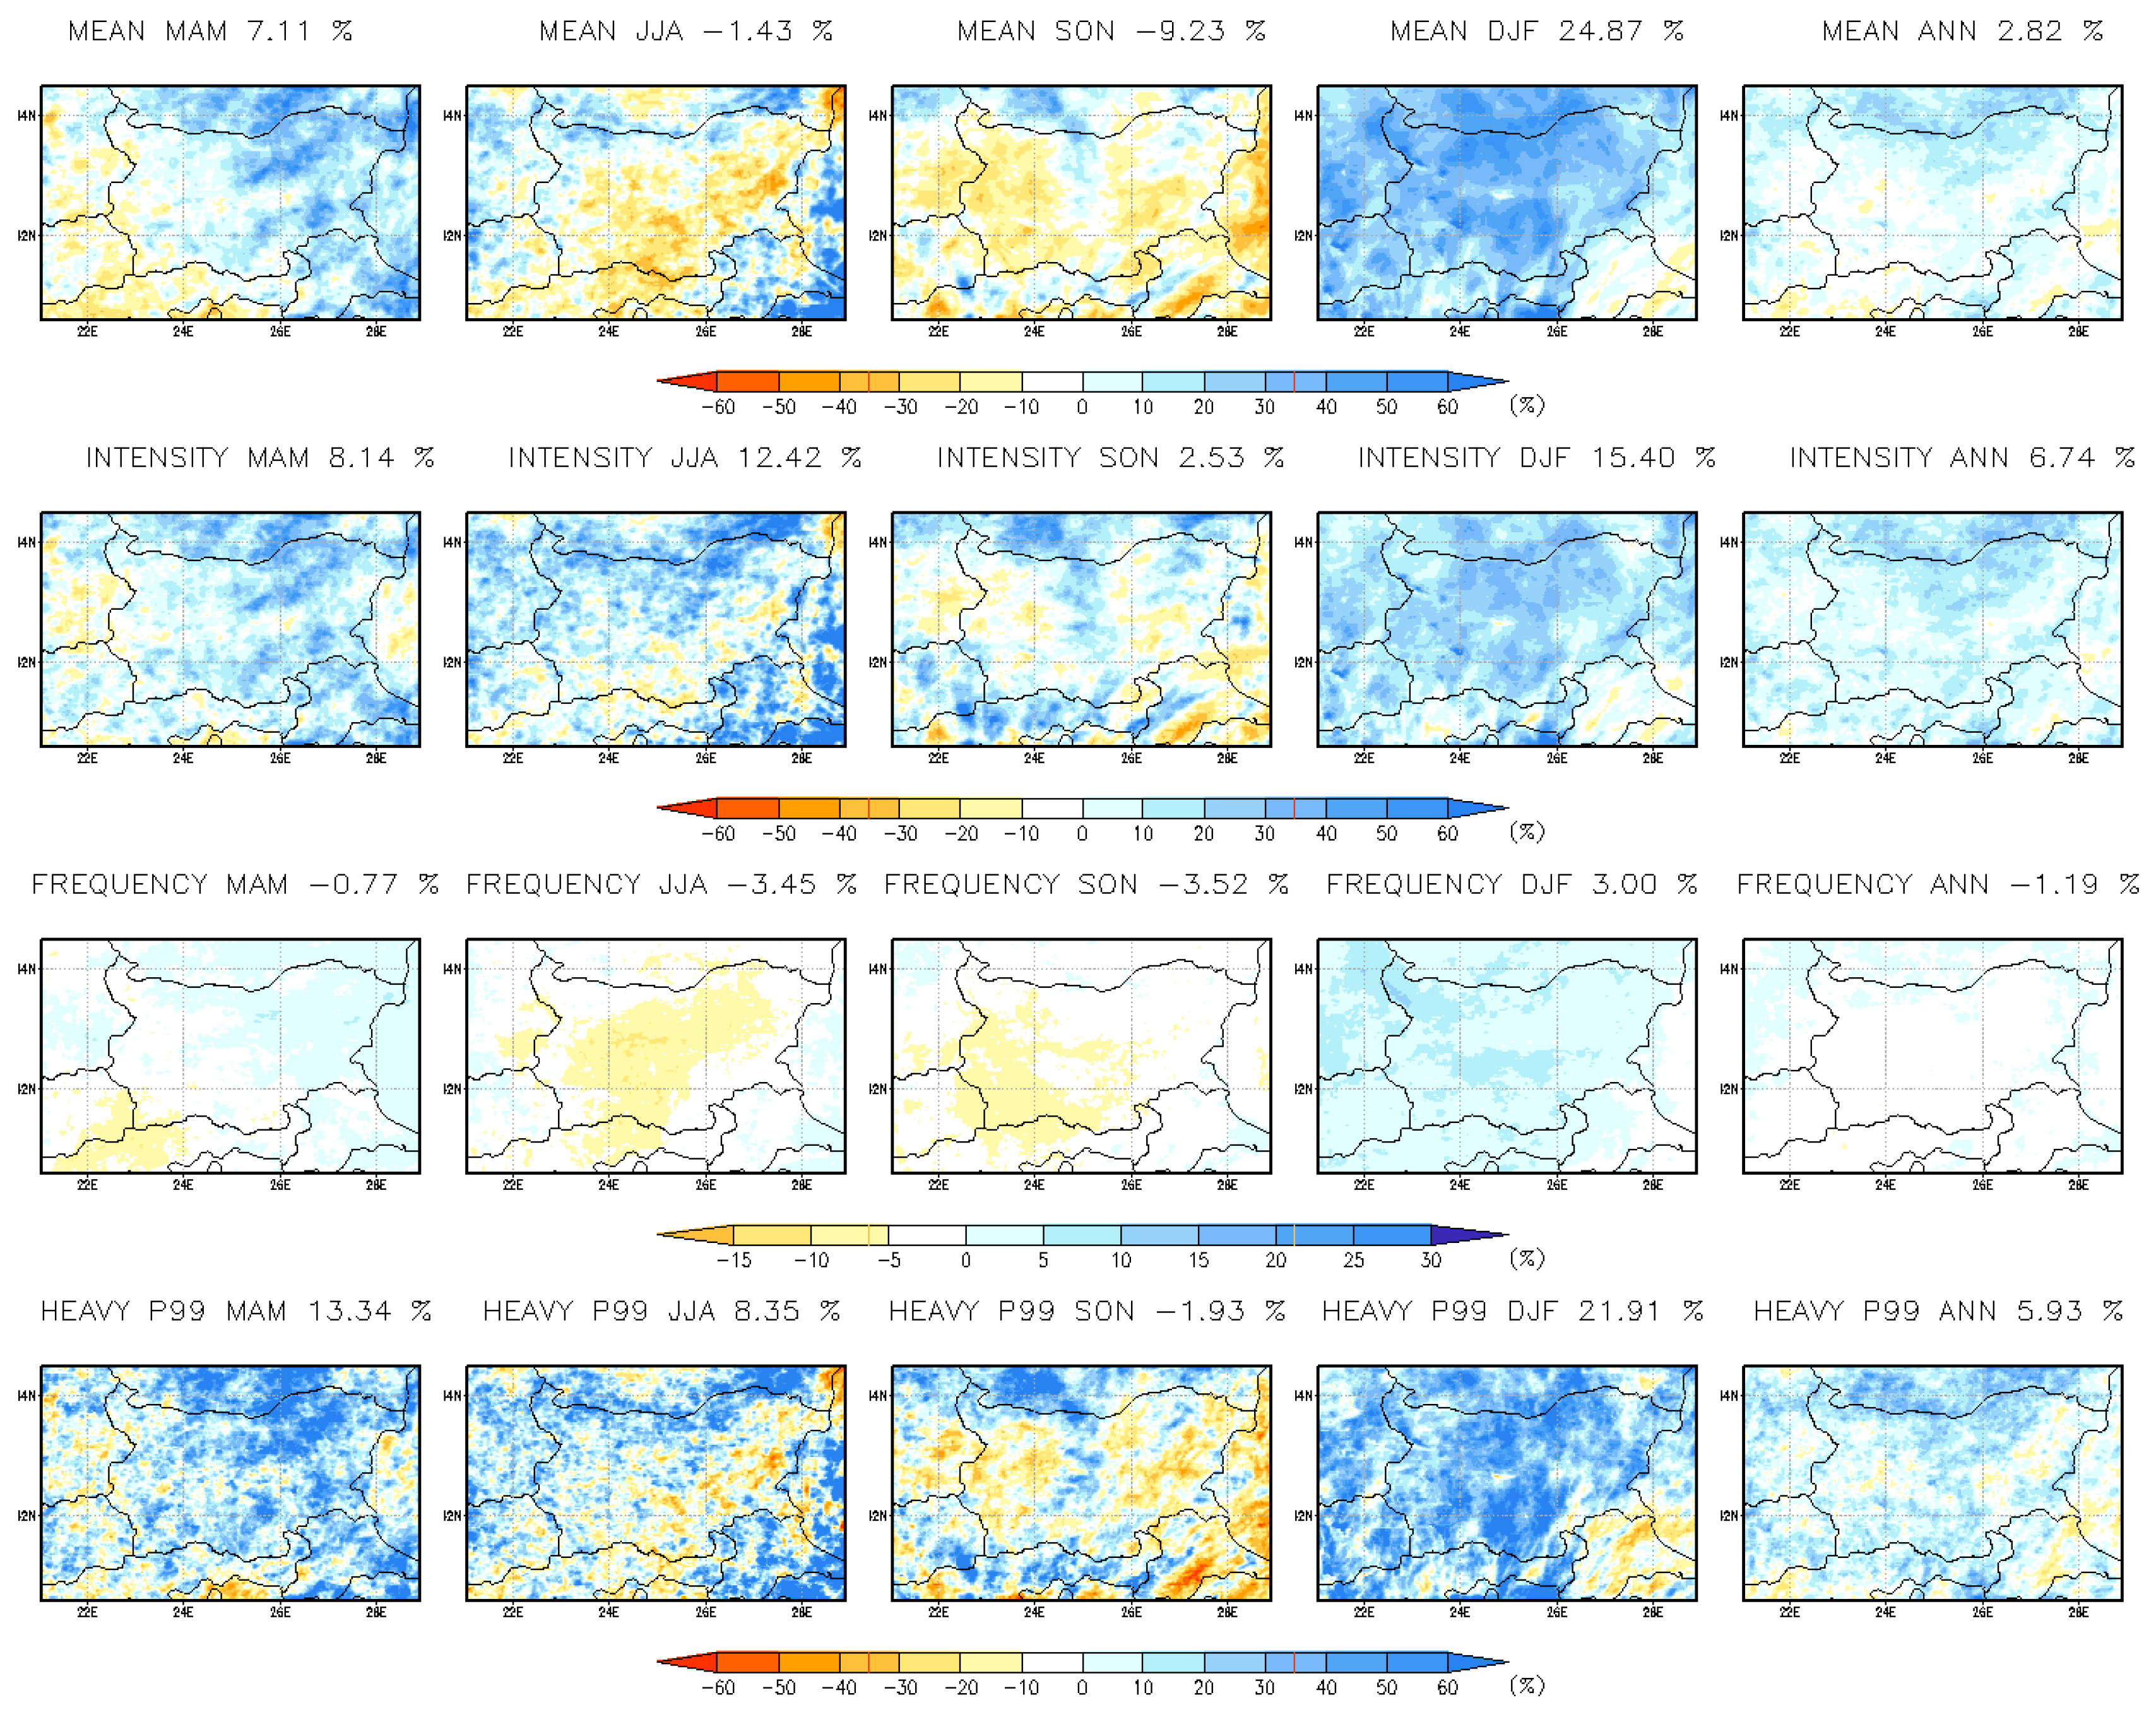
Figure 7.
Comparison of annual mean hourly precipitation indices from PDIR-Now datasets and simulations (15 km RCM and 3 km CPRCM), along with mean biases for the historical period 2001–2004. Units: mm/hour for all indices except frequency, which is expressed in %.
Figure 7.
Comparison of annual mean hourly precipitation indices from PDIR-Now datasets and simulations (15 km RCM and 3 km CPRCM), along with mean biases for the historical period 2001–2004. Units: mm/hour for all indices except frequency, which is expressed in %.
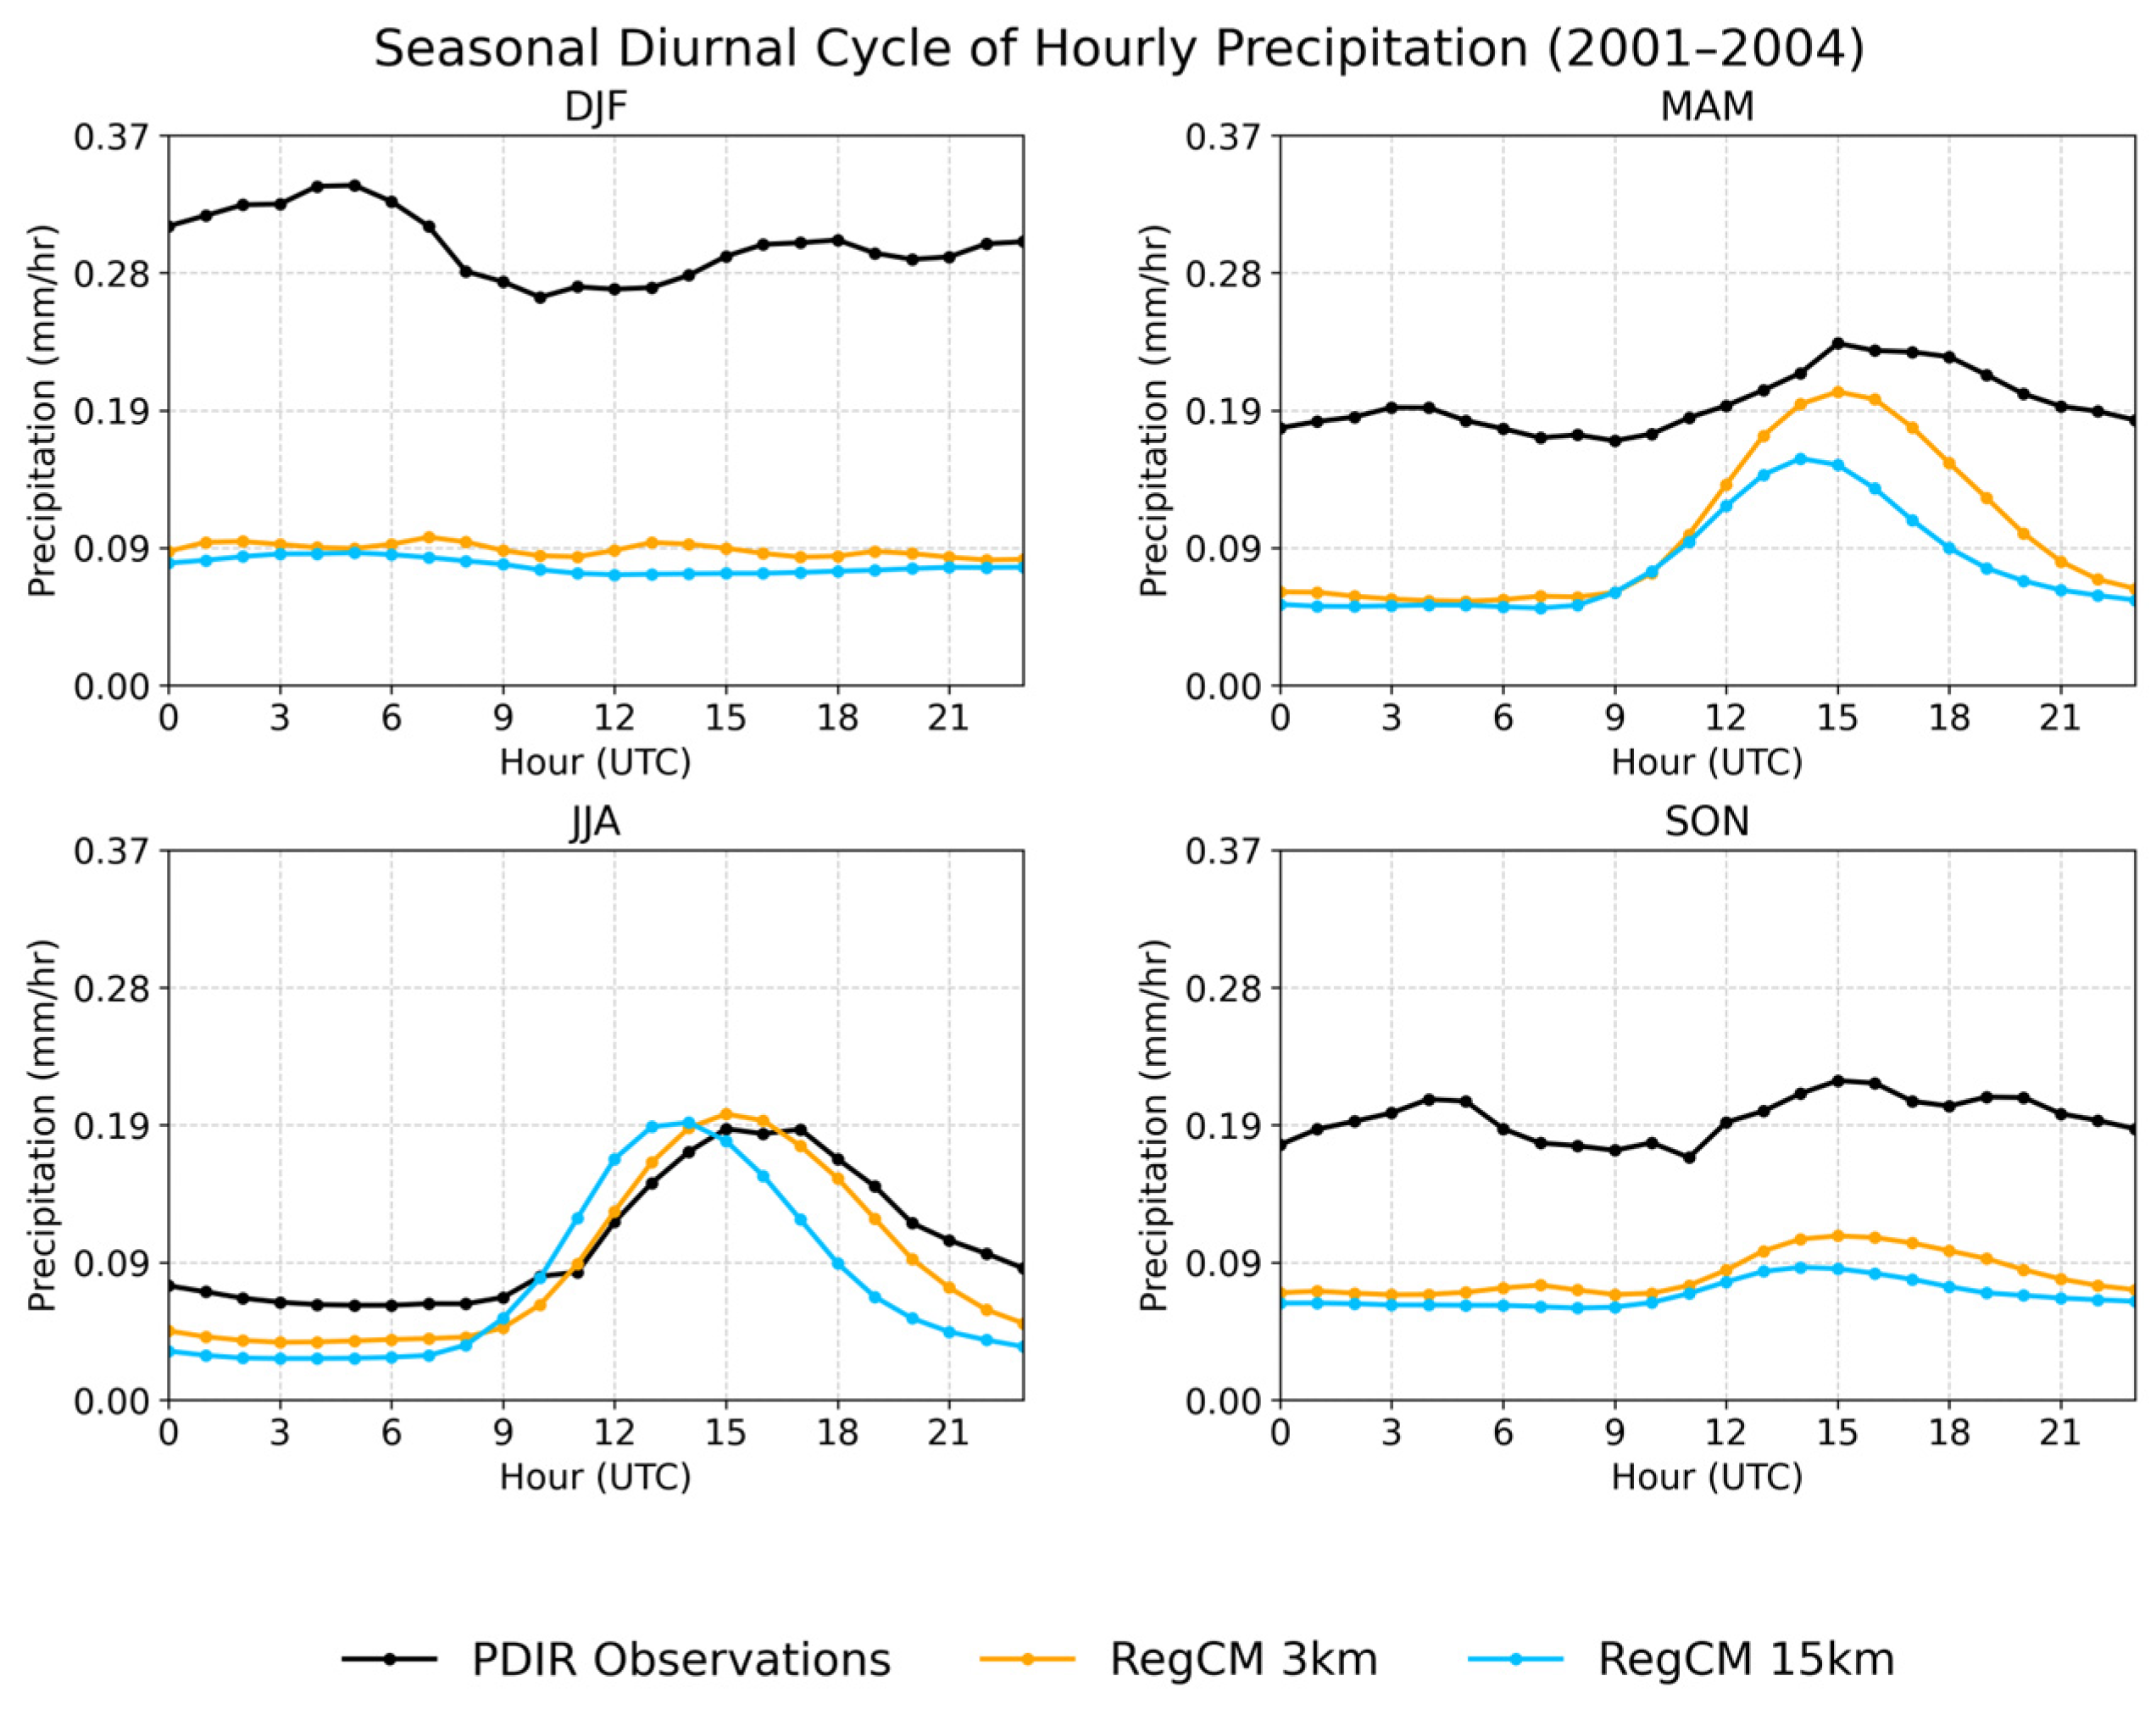
Figure 8.
2001–2004 seasonal diurnal cycle of hourly precipitation.
Figure 8.
2001–2004 seasonal diurnal cycle of hourly precipitation.
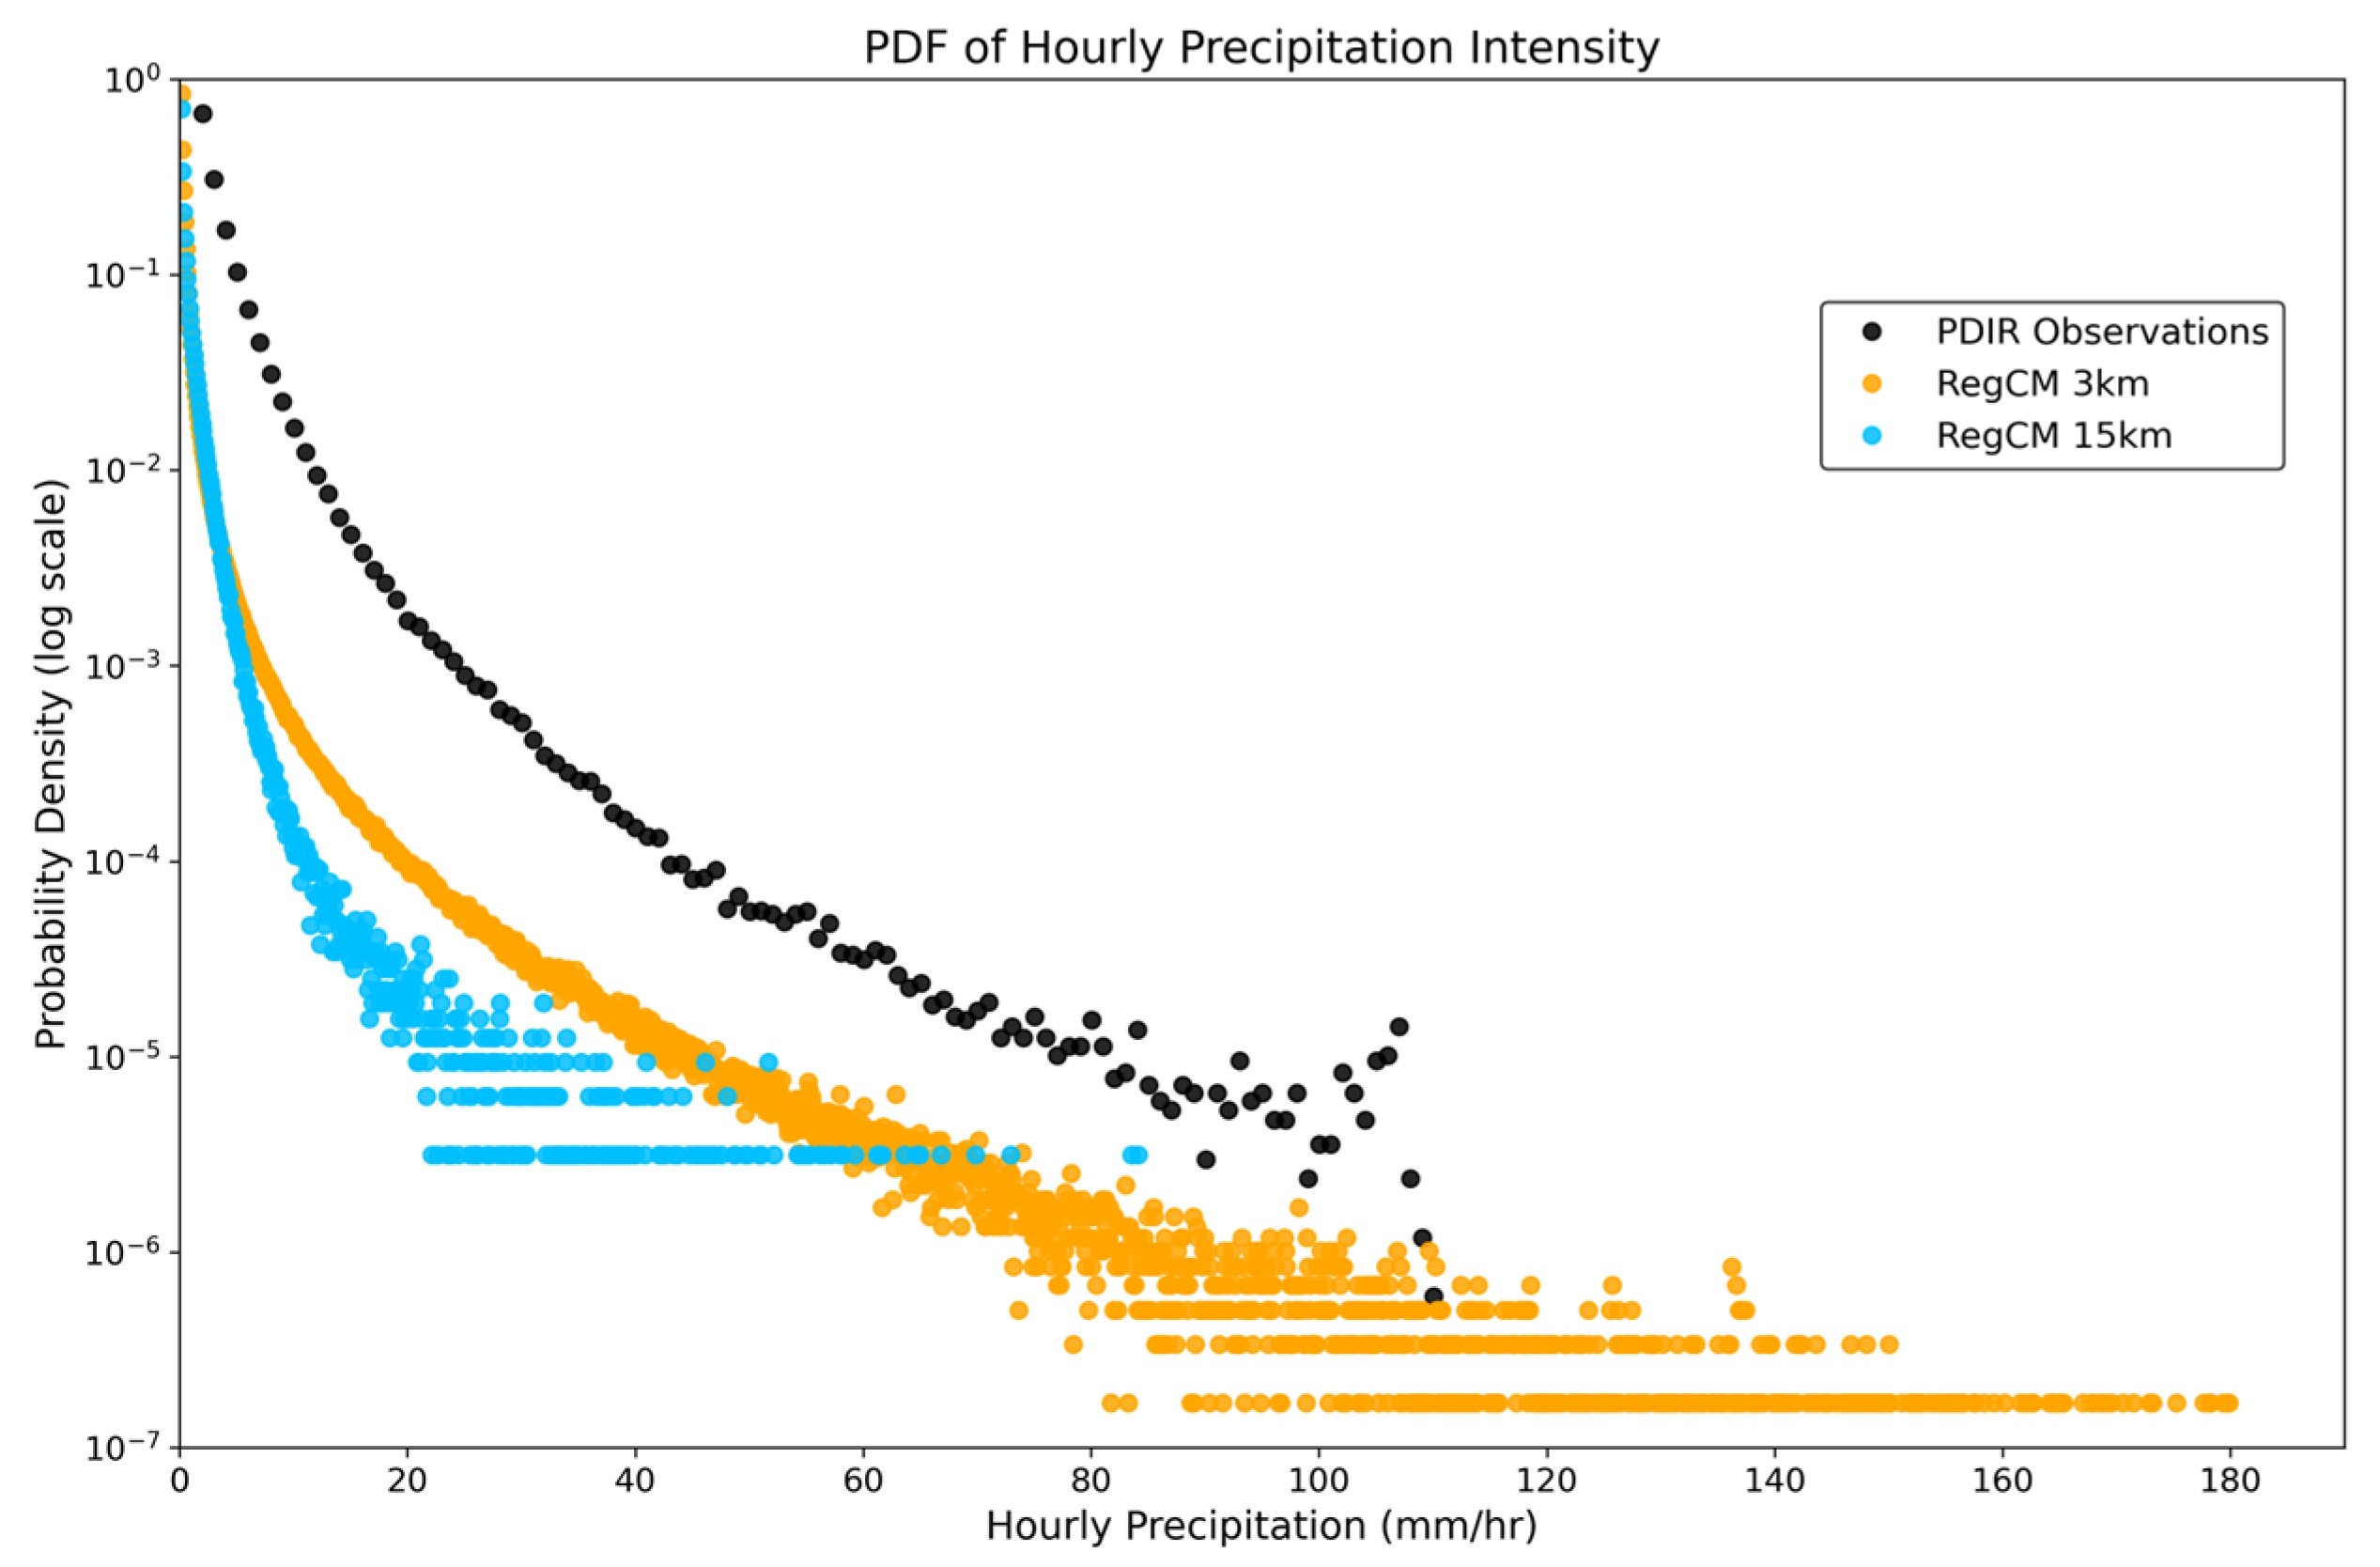
Figure 9.
Hourly probability density functions (PDFs) from simulations (CPRCM and RCM, in yellow and blue color, respectively) and observation (black dots).
Figure 9.
Hourly probability density functions (PDFs) from simulations (CPRCM and RCM, in yellow and blue color, respectively) and observation (black dots).
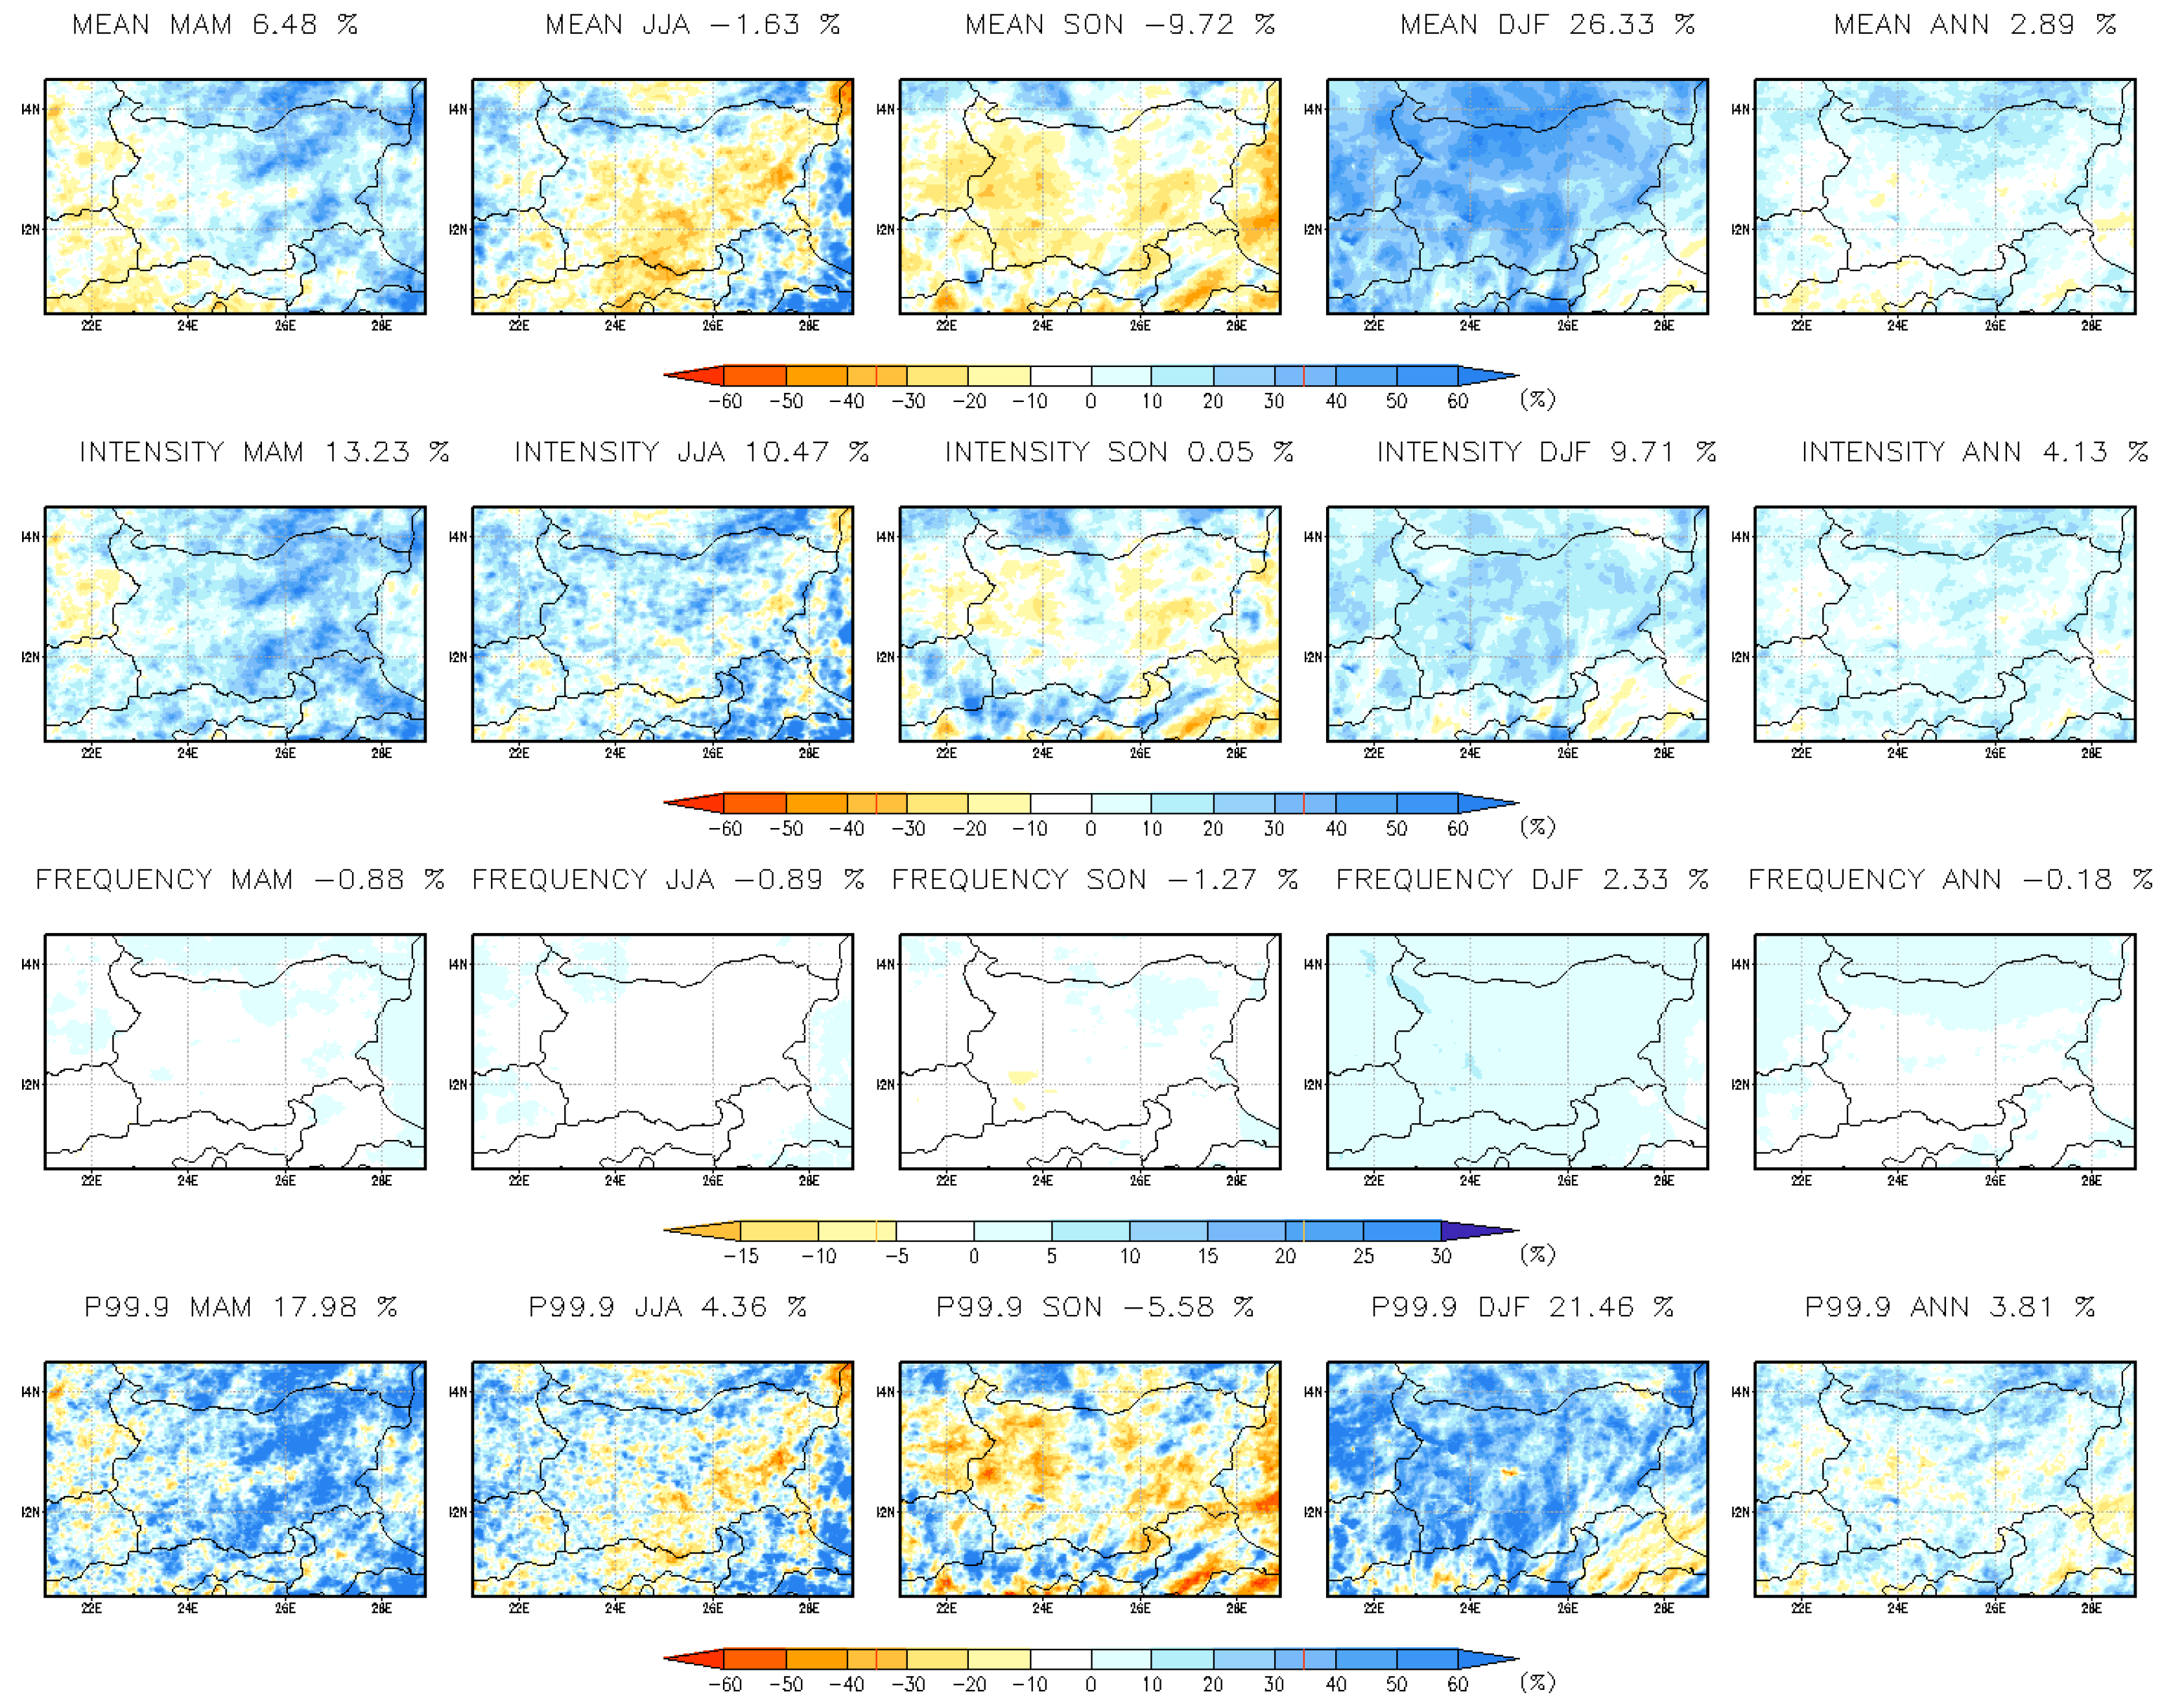
Figure 10.
Annual and seasonal changes (%) in daily precipitation indices at 3 km resolution for the near-future period 2041–2050 vs. 1995–2004.
Figure 10.
Annual and seasonal changes (%) in daily precipitation indices at 3 km resolution for the near-future period 2041–2050 vs. 1995–2004.
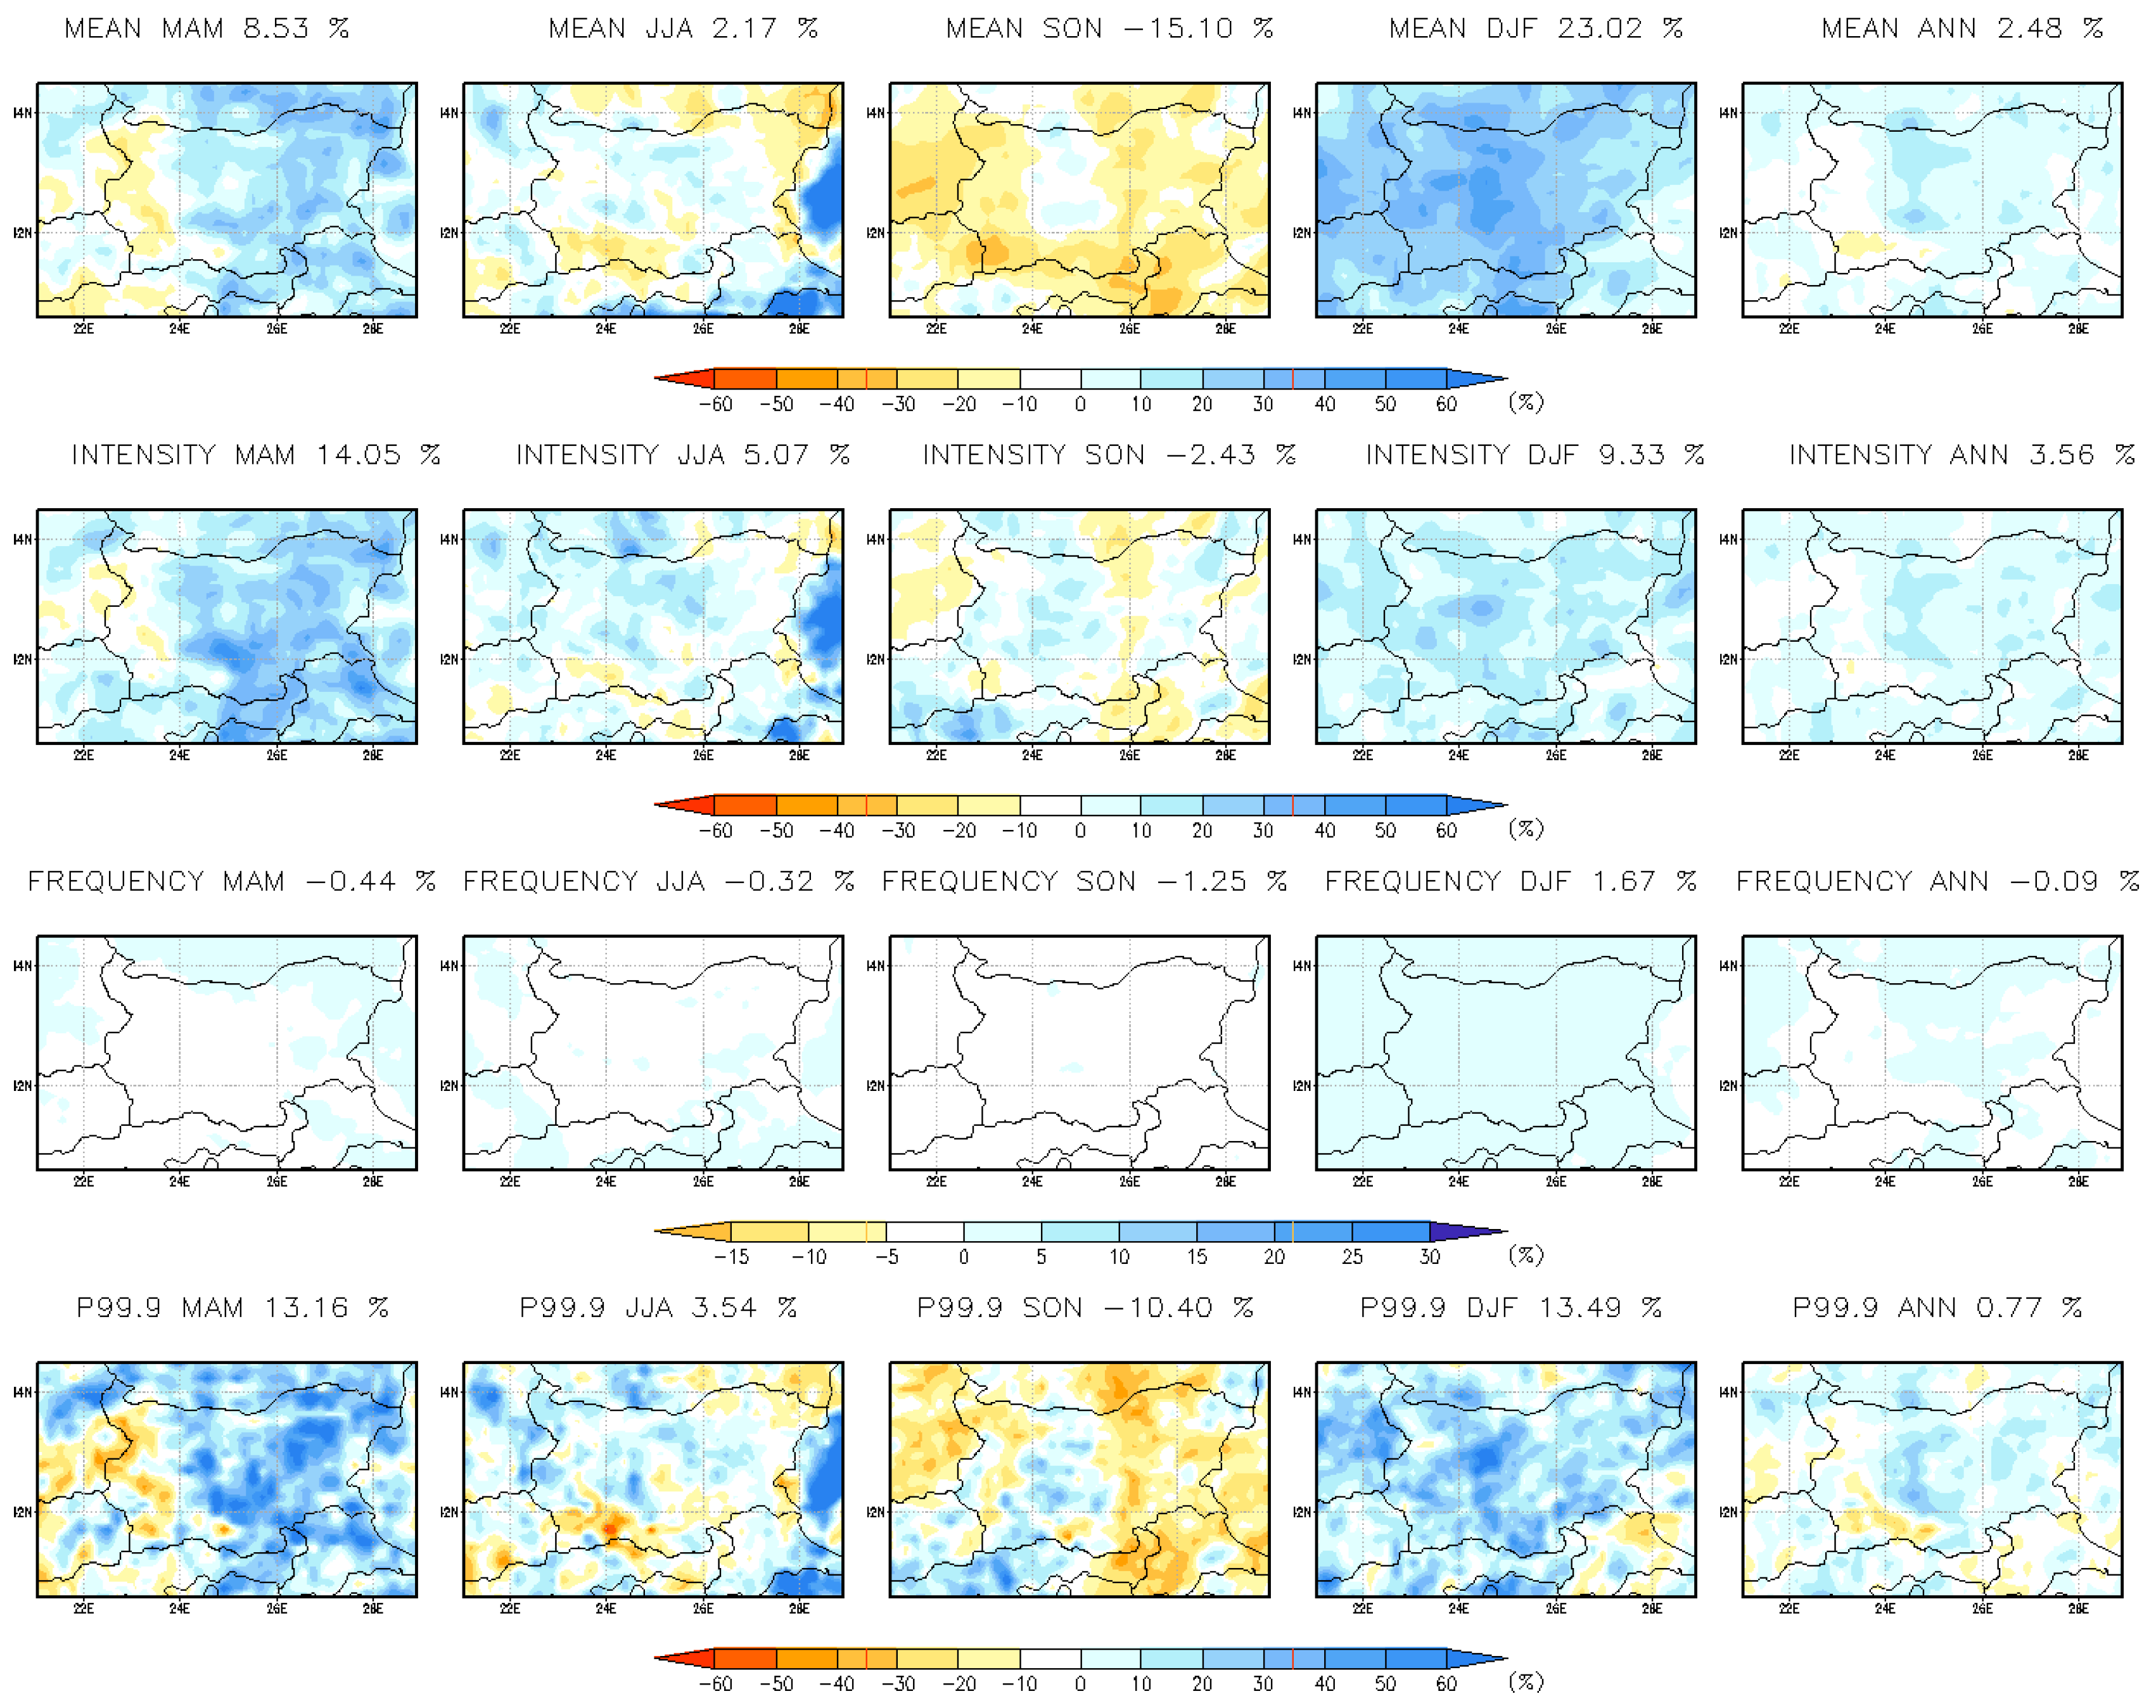
Figure 11.
Annual and seasonal changes (%) in daily precipitation indices at 15 km resolution for the near-future period 2041–2050 vs. 1995–2004.
Figure 11.
Annual and seasonal changes (%) in daily precipitation indices at 15 km resolution for the near-future period 2041–2050 vs. 1995–2004.
Figure 12.
Annual and seasonal changes (%) in daily precipitation indices from GCM simulation for the near-future period 2041–2050 Vs. 1995–2004.
Figure 12.
Annual and seasonal changes (%) in daily precipitation indices from GCM simulation for the near-future period 2041–2050 Vs. 1995–2004.
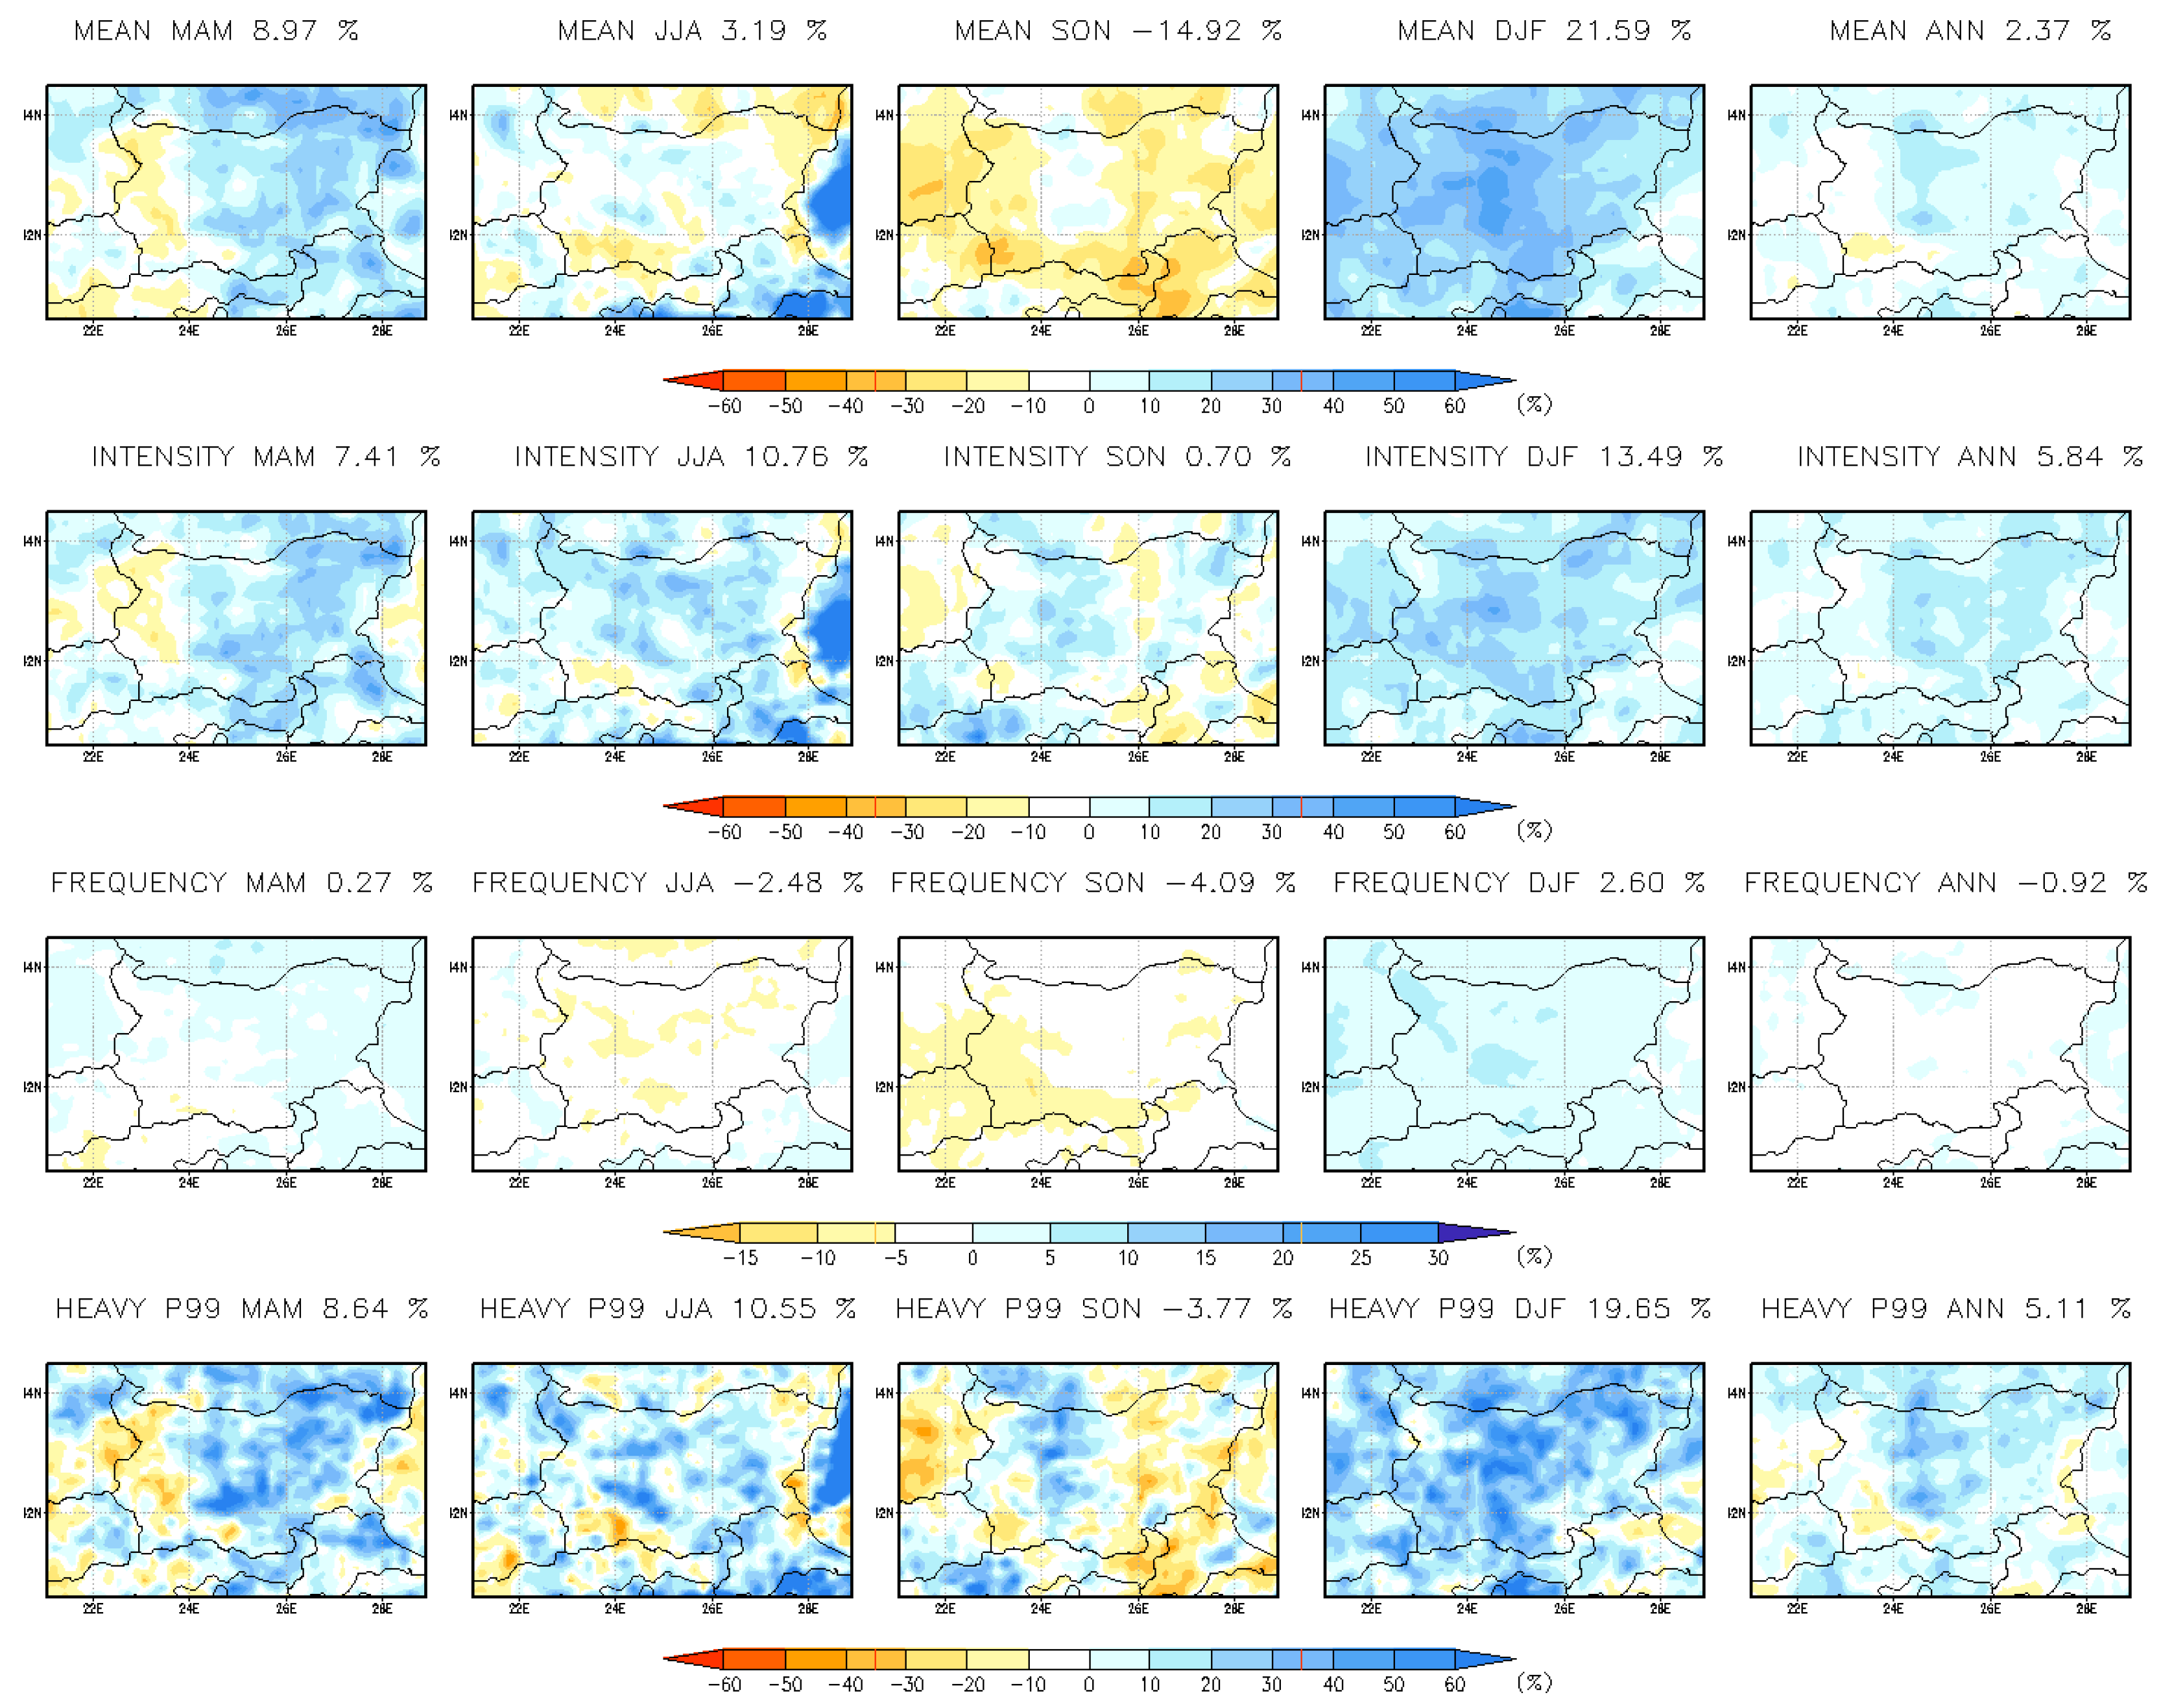
Figure 13.
Seasonal and annual mean change (%) in hourly precipitation indices at 3 km resolution for the near-future period 2041–2050.
Figure 13.
Seasonal and annual mean change (%) in hourly precipitation indices at 3 km resolution for the near-future period 2041–2050.
Figure 14.
Seasonal and annual mean change (%) in hourly precipitation indices at 15 km resolution for the near-future period 2041–2050.
Figure 14.
Seasonal and annual mean change (%) in hourly precipitation indices at 15 km resolution for the near-future period 2041–2050.
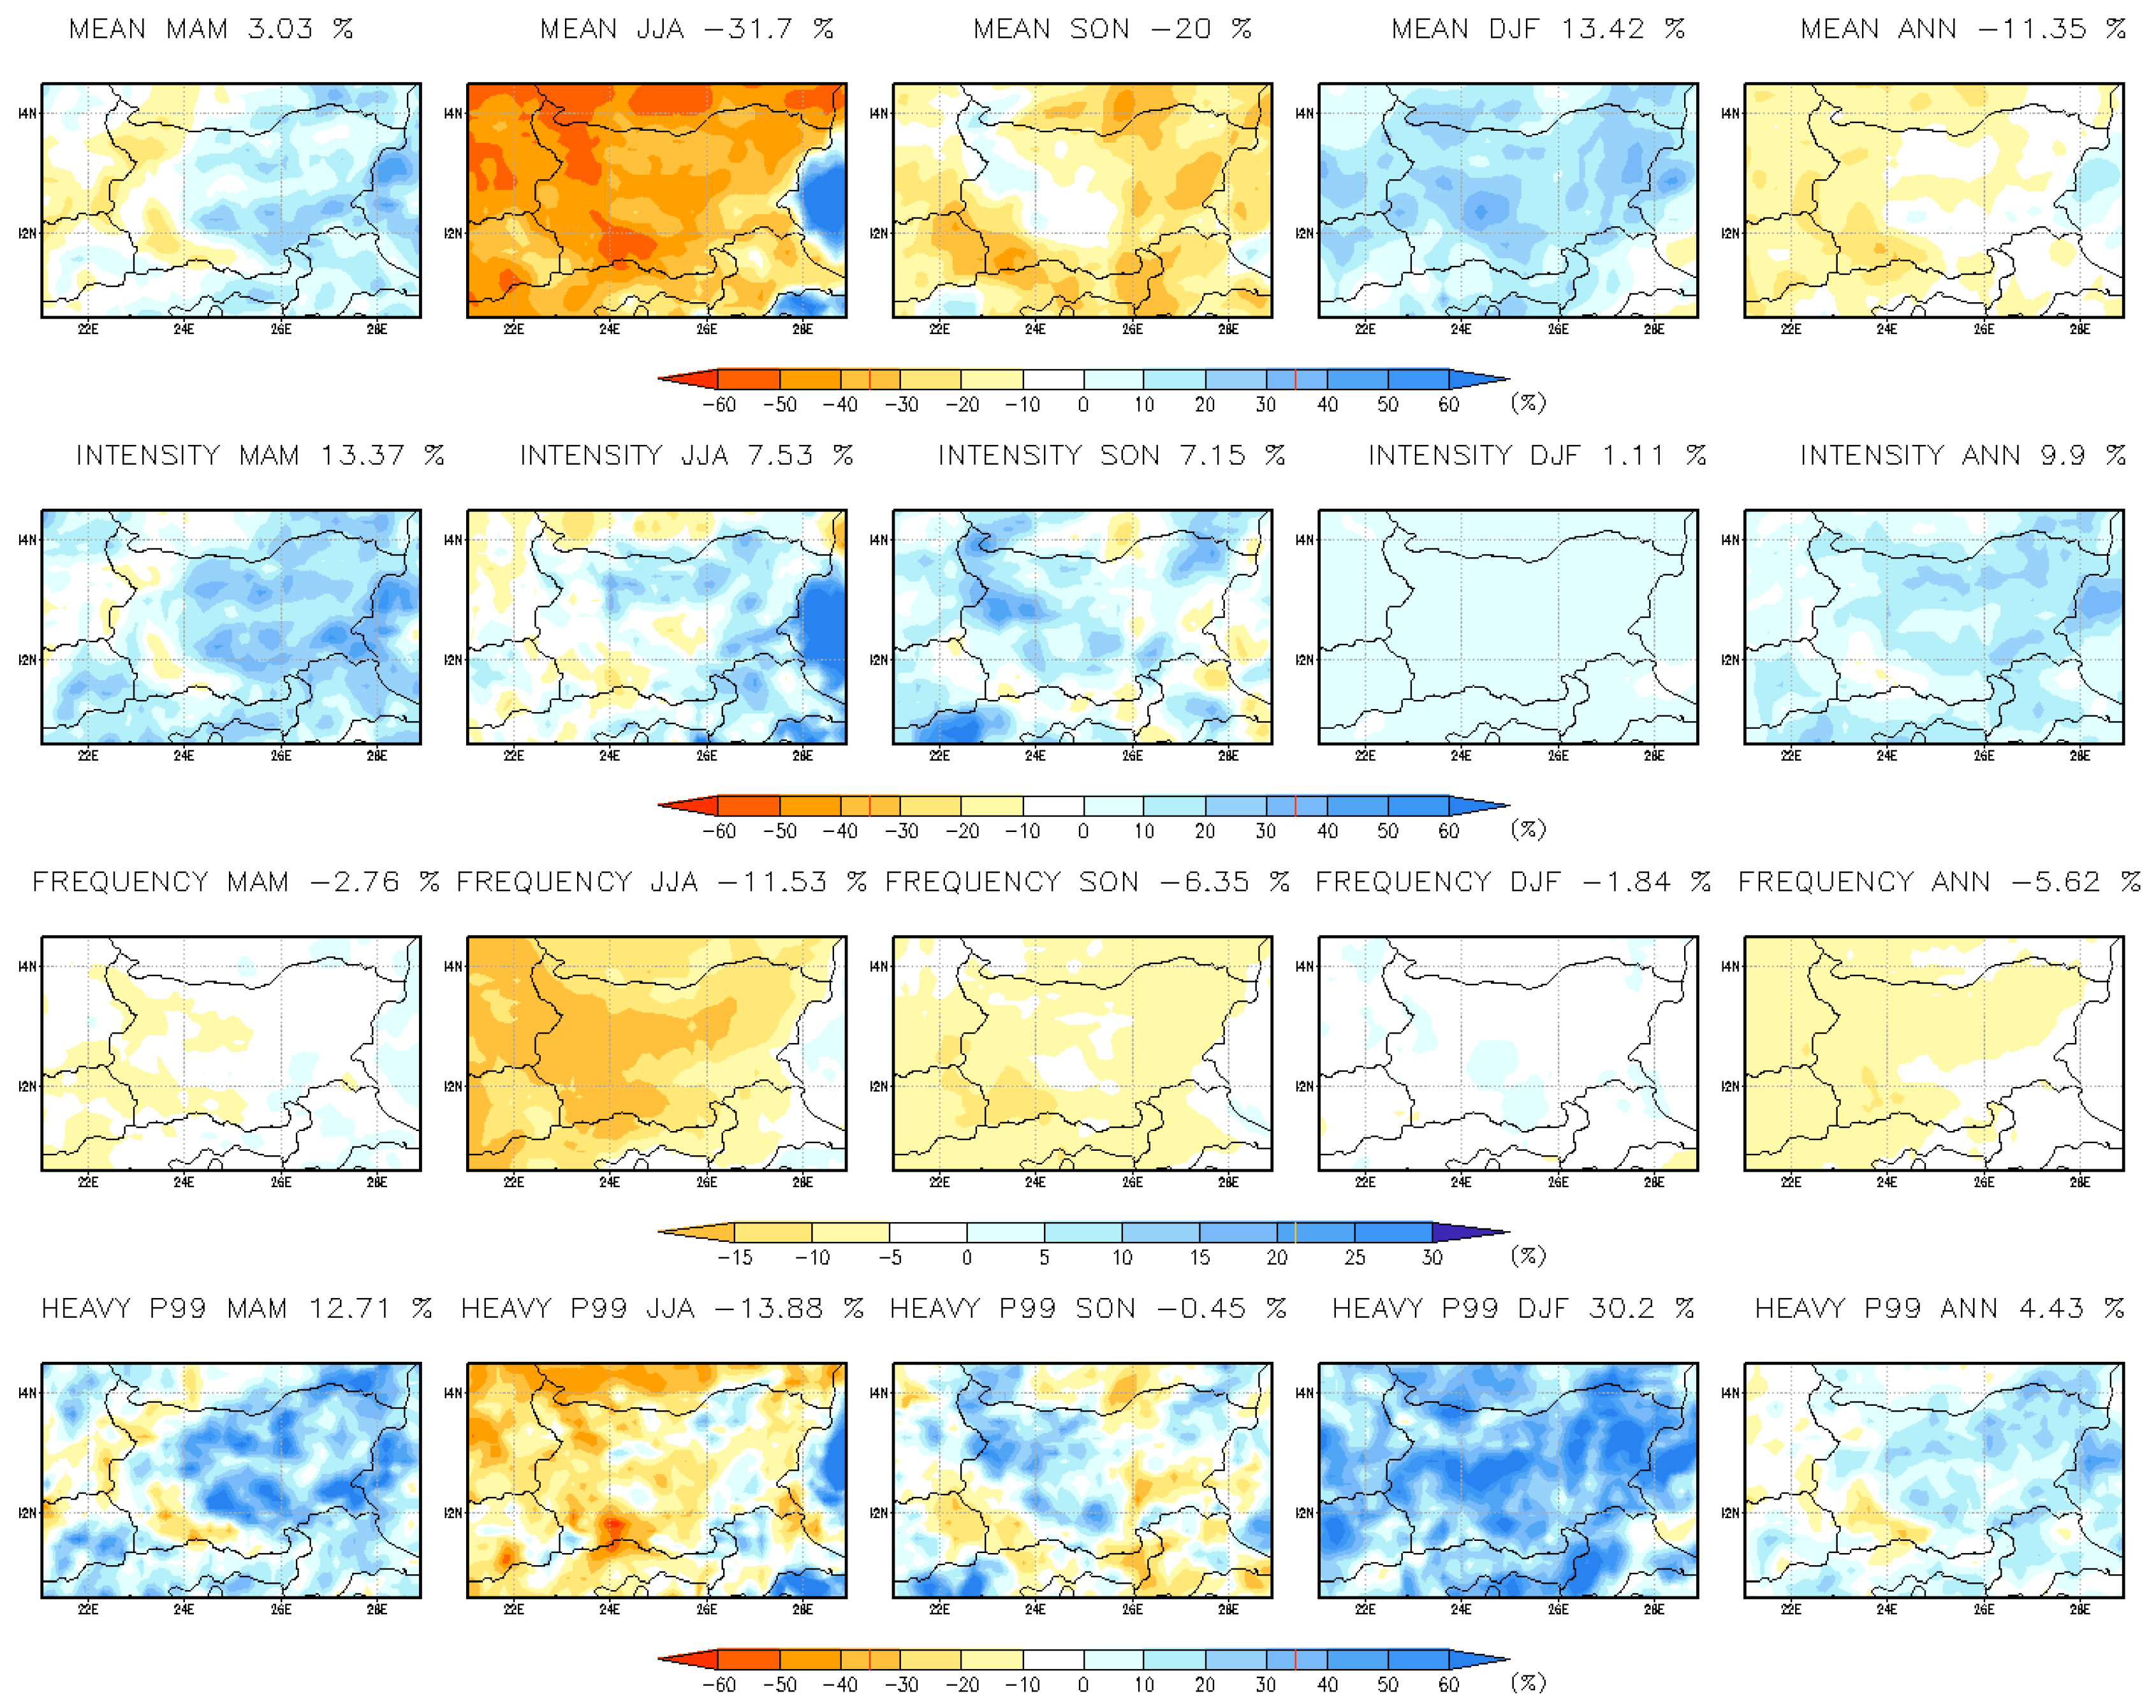
Figure 15.
Seasonal and annual mean change (%) in daily precipitation indices at 3 km resolution for the far-future period 2090–2099.
Figure 15.
Seasonal and annual mean change (%) in daily precipitation indices at 3 km resolution for the far-future period 2090–2099.
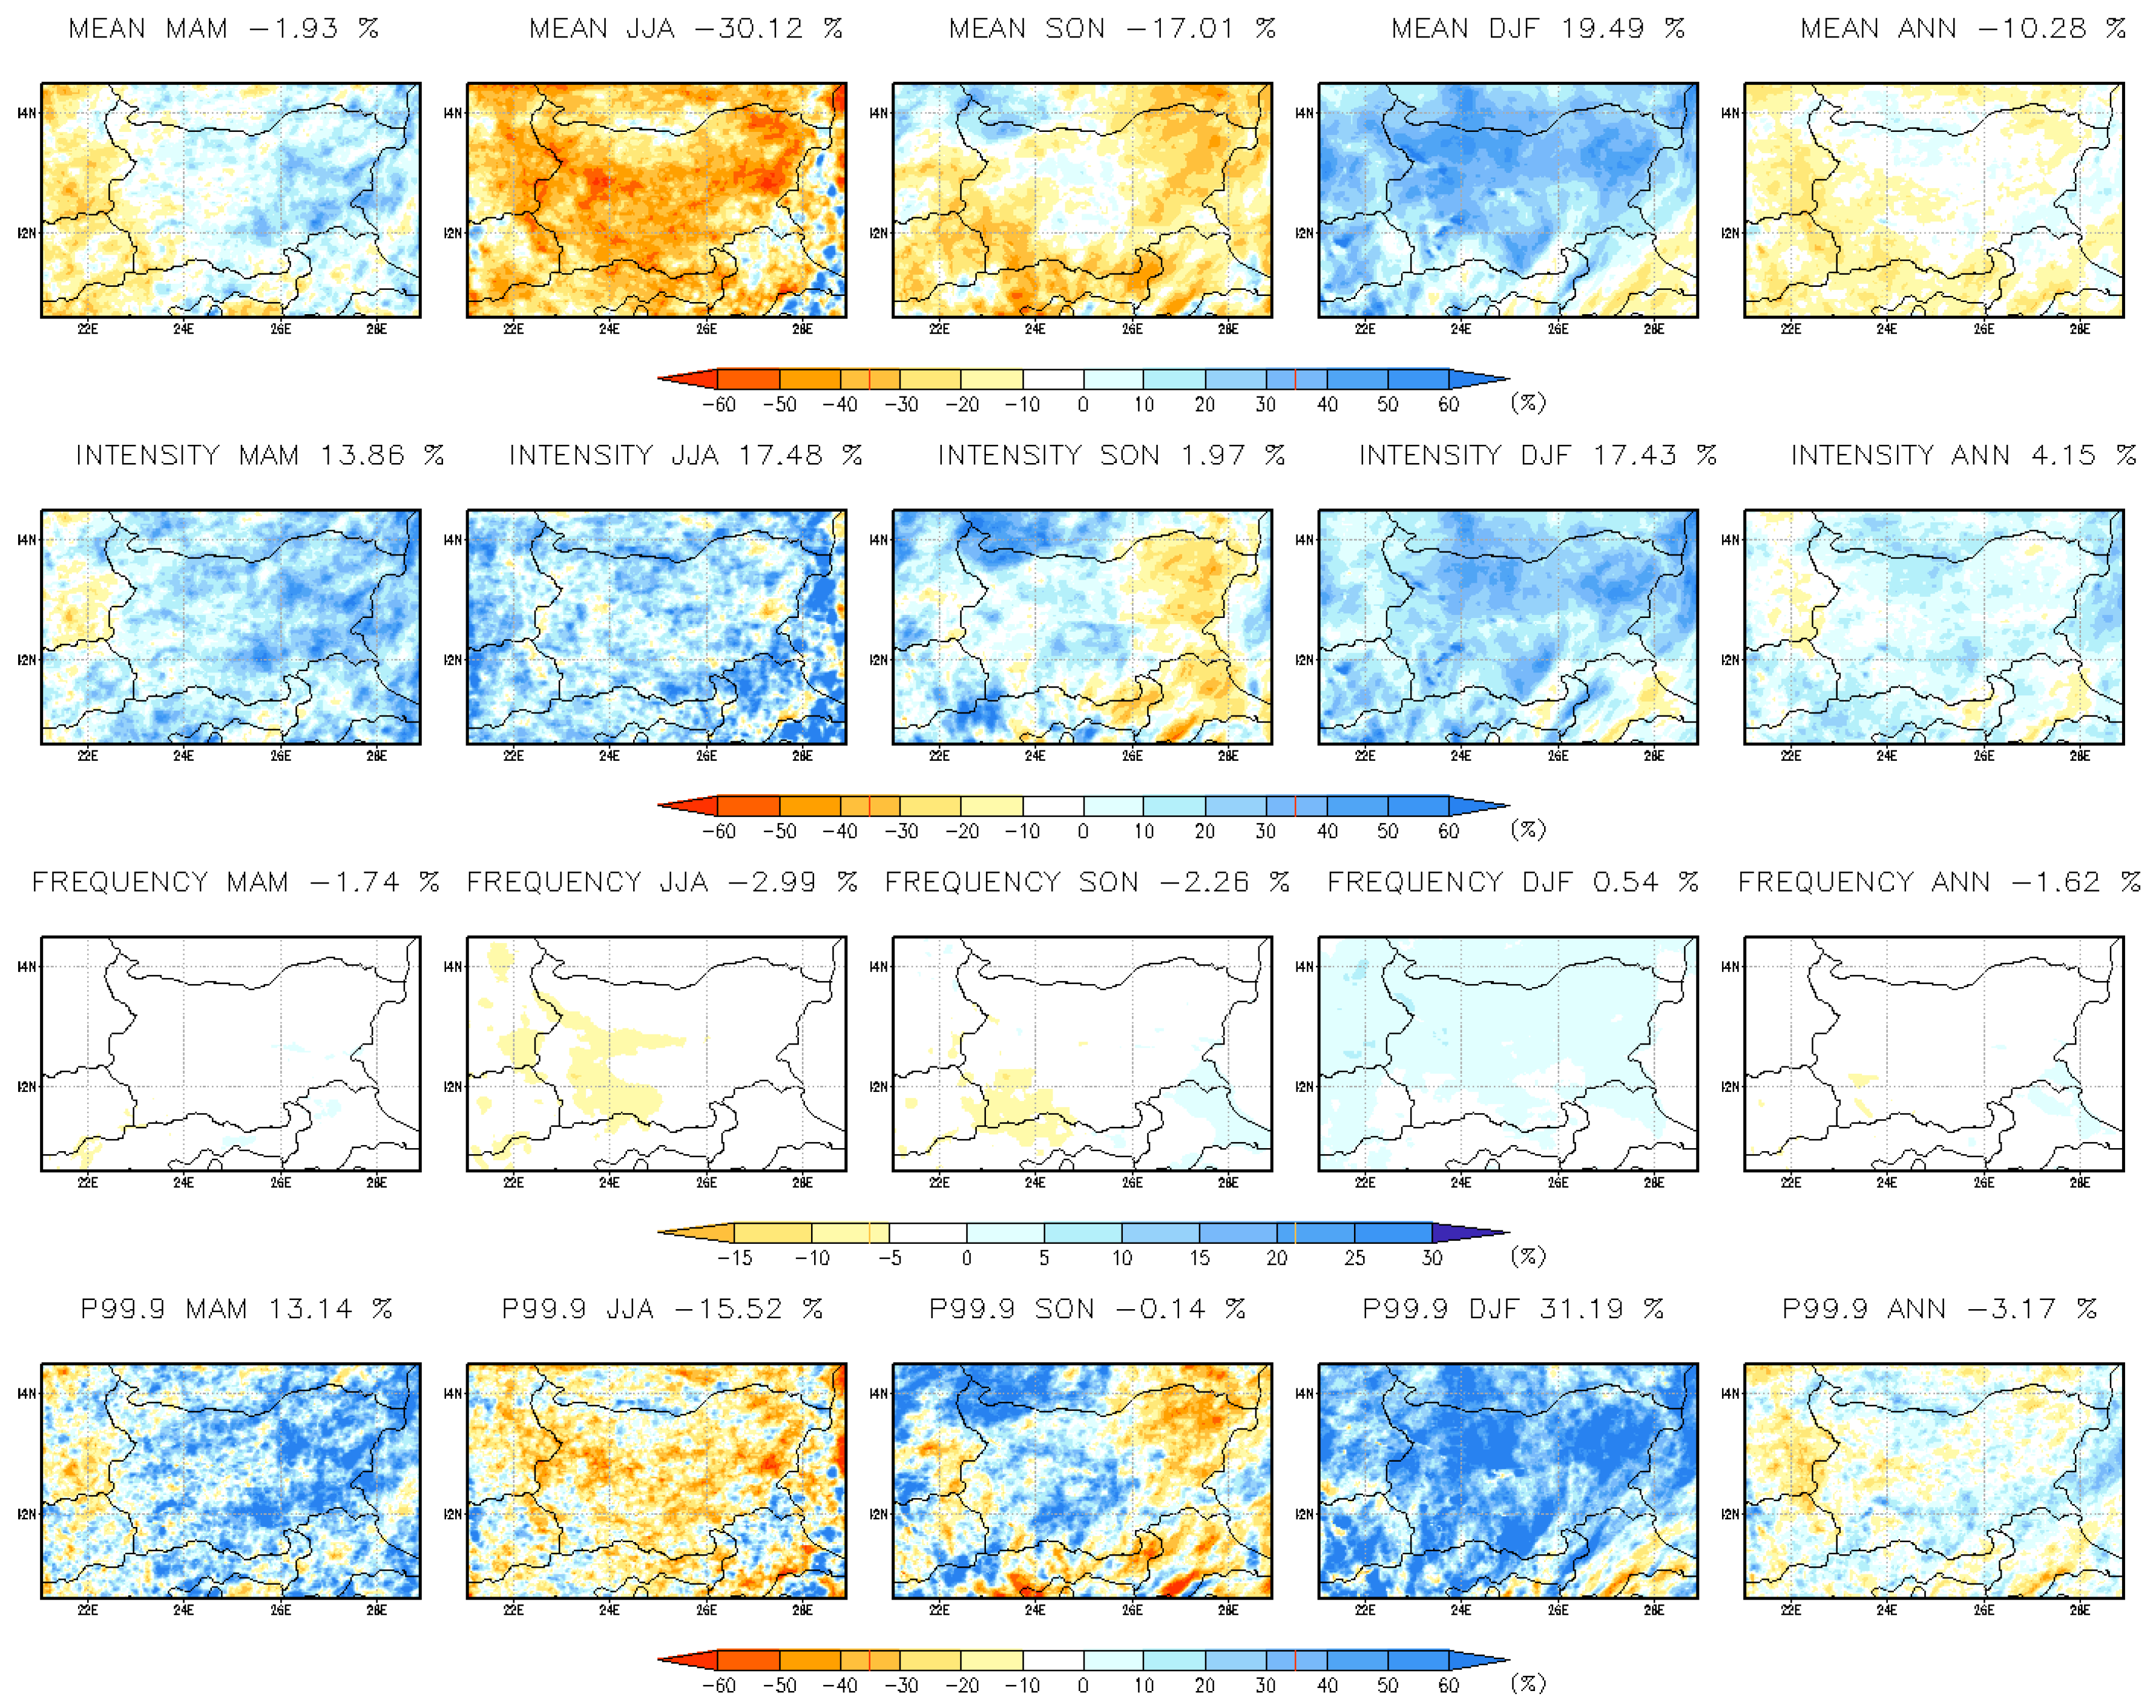
Figure 16.
Seasonal and annual mean change (%) in daily precipitation indices at 15 km resolution for the far-future period 2090–2099.
Figure 16.
Seasonal and annual mean change (%) in daily precipitation indices at 15 km resolution for the far-future period 2090–2099.
Figure 17.
Daily probability density functions (PDFs) of precipitation for the historical period (1995–2004, shown by blue and orange lines) and future periods (2041–2050 and 2090–2099).
Figure 17.
Daily probability density functions (PDFs) of precipitation for the historical period (1995–2004, shown by blue and orange lines) and future periods (2041–2050 and 2090–2099).
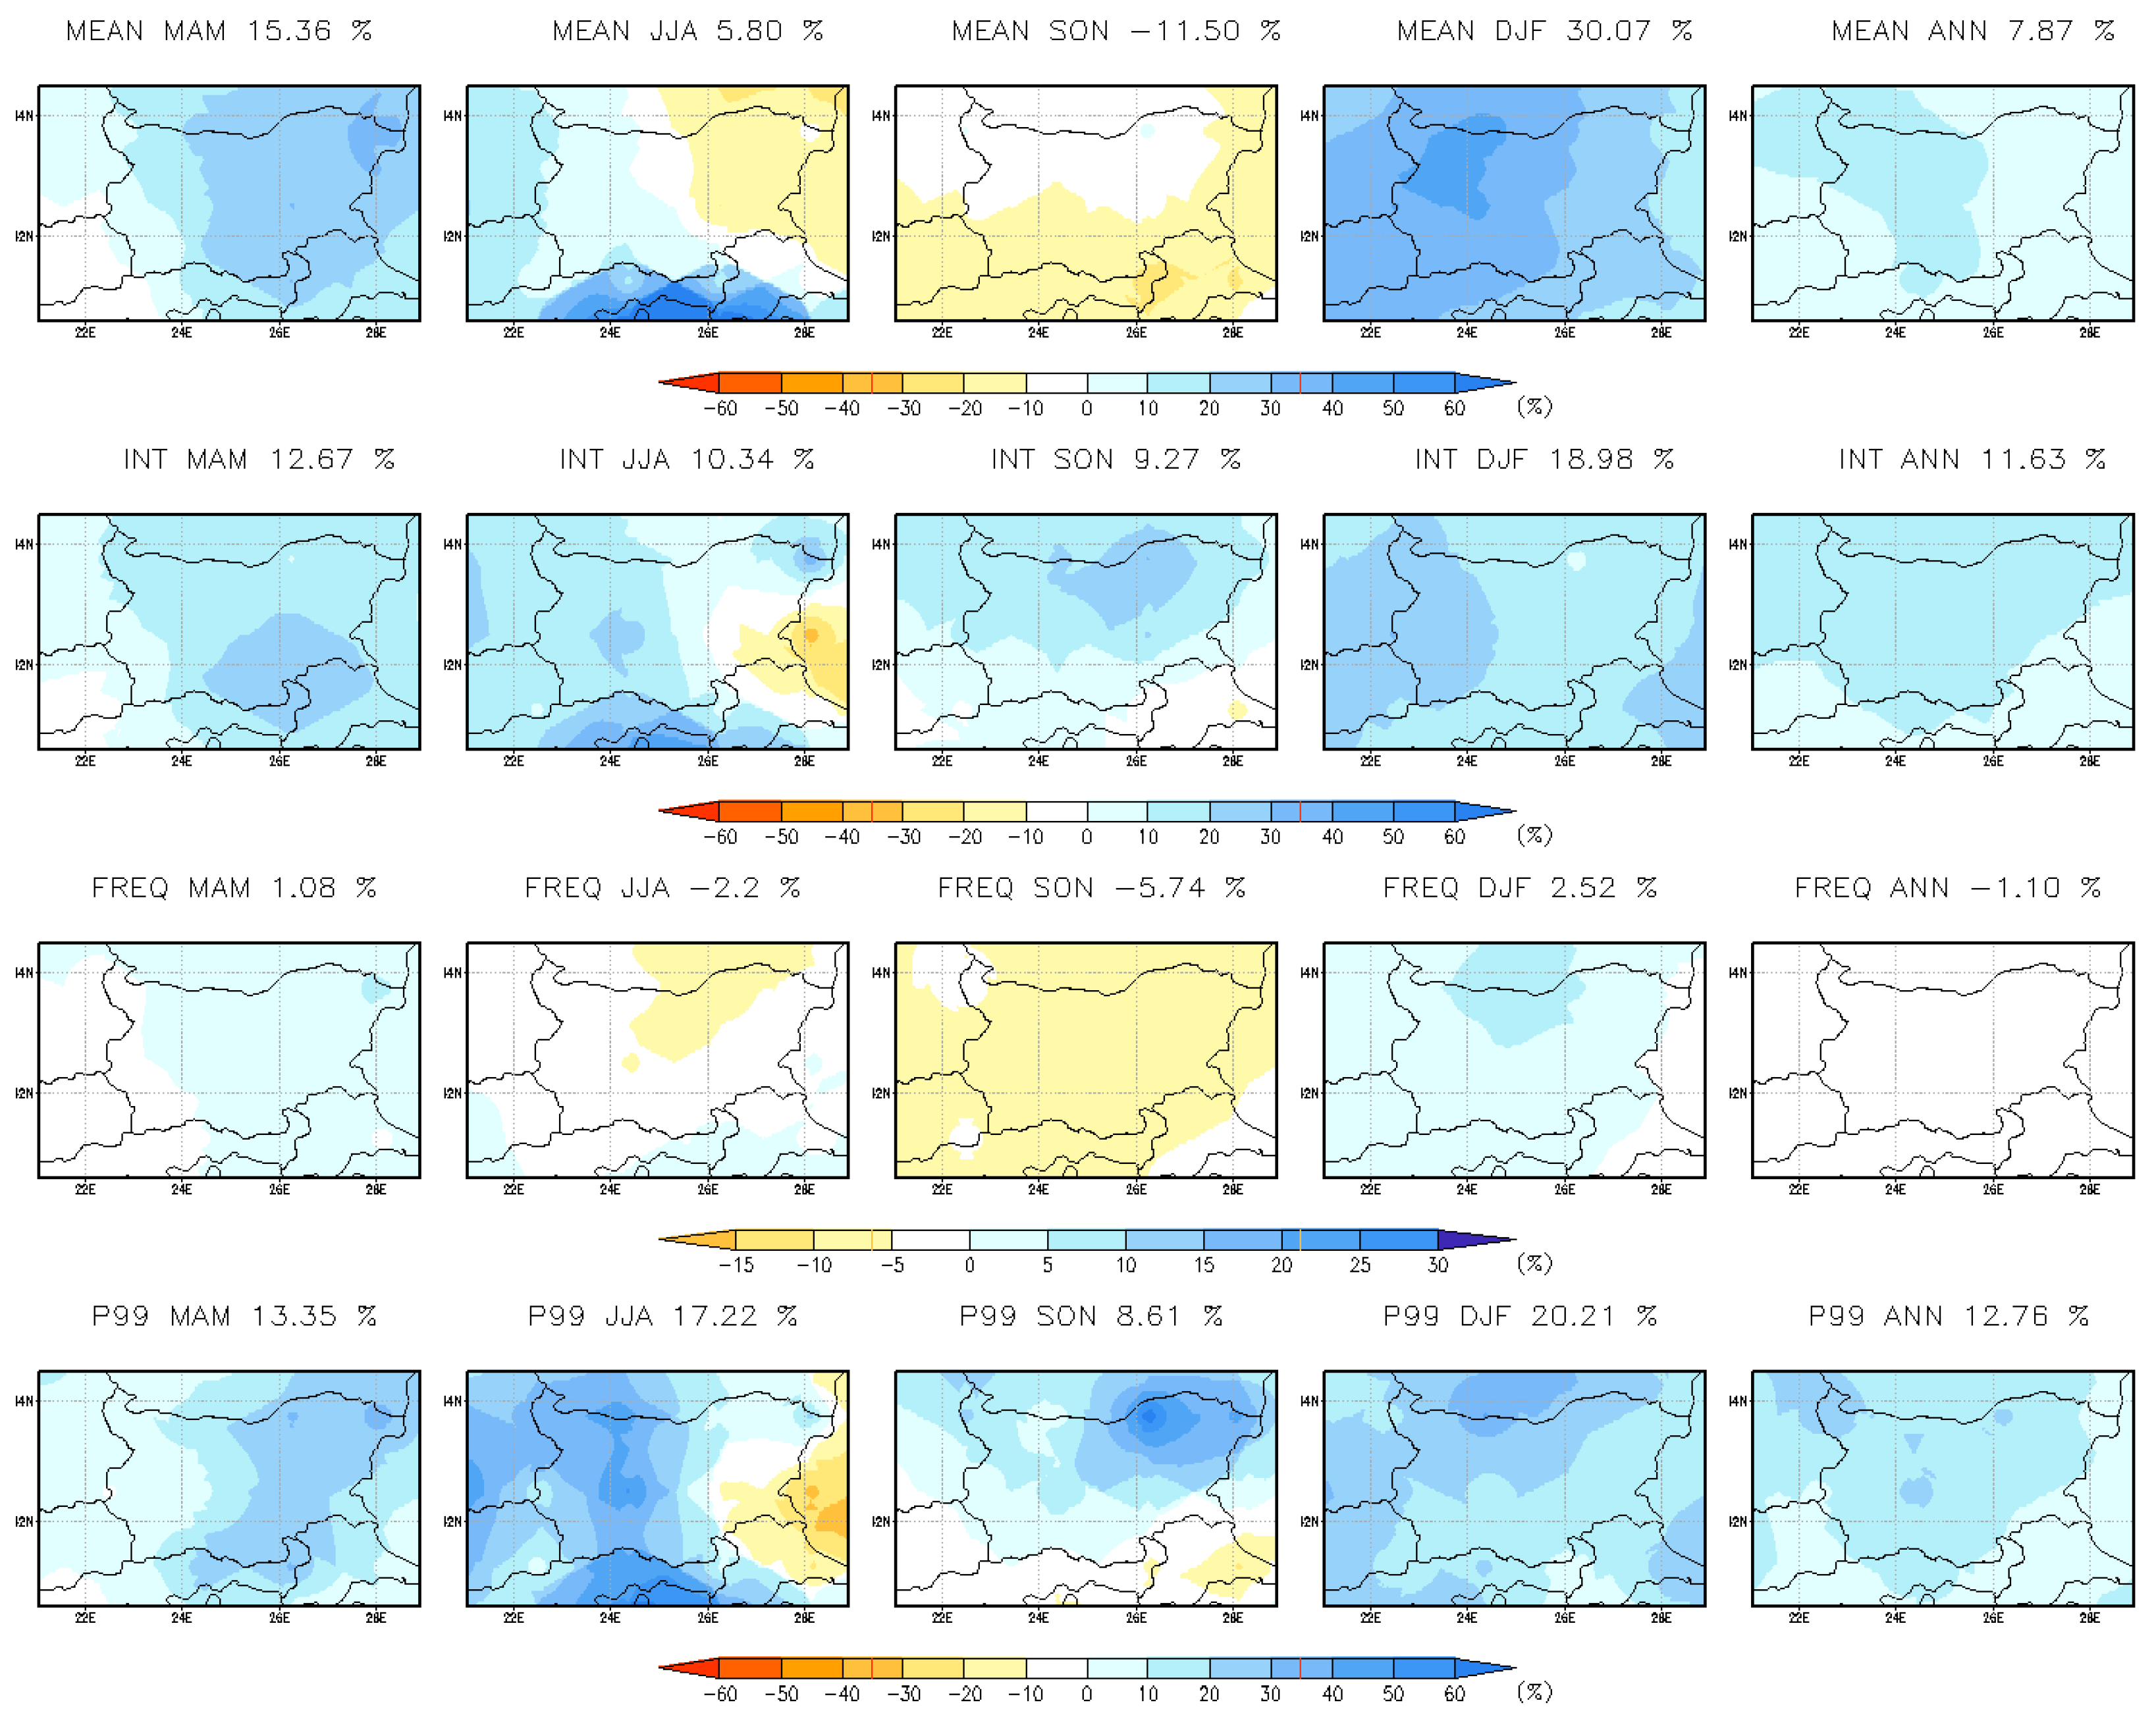
Figure 18.
Seasonal and annual mean change (%) in hourly precipitation indices at 3 km resolution for the far-future period 2090–2099.
Figure 18.
Seasonal and annual mean change (%) in hourly precipitation indices at 3 km resolution for the far-future period 2090–2099.
Figure 19.
Seasonal and annual mean change (%) in hourly precipitation indices at 15 km resolution for the far-future period 2090–2099.
Figure 19.
Seasonal and annual mean change (%) in hourly precipitation indices at 15 km resolution for the far-future period 2090–2099.
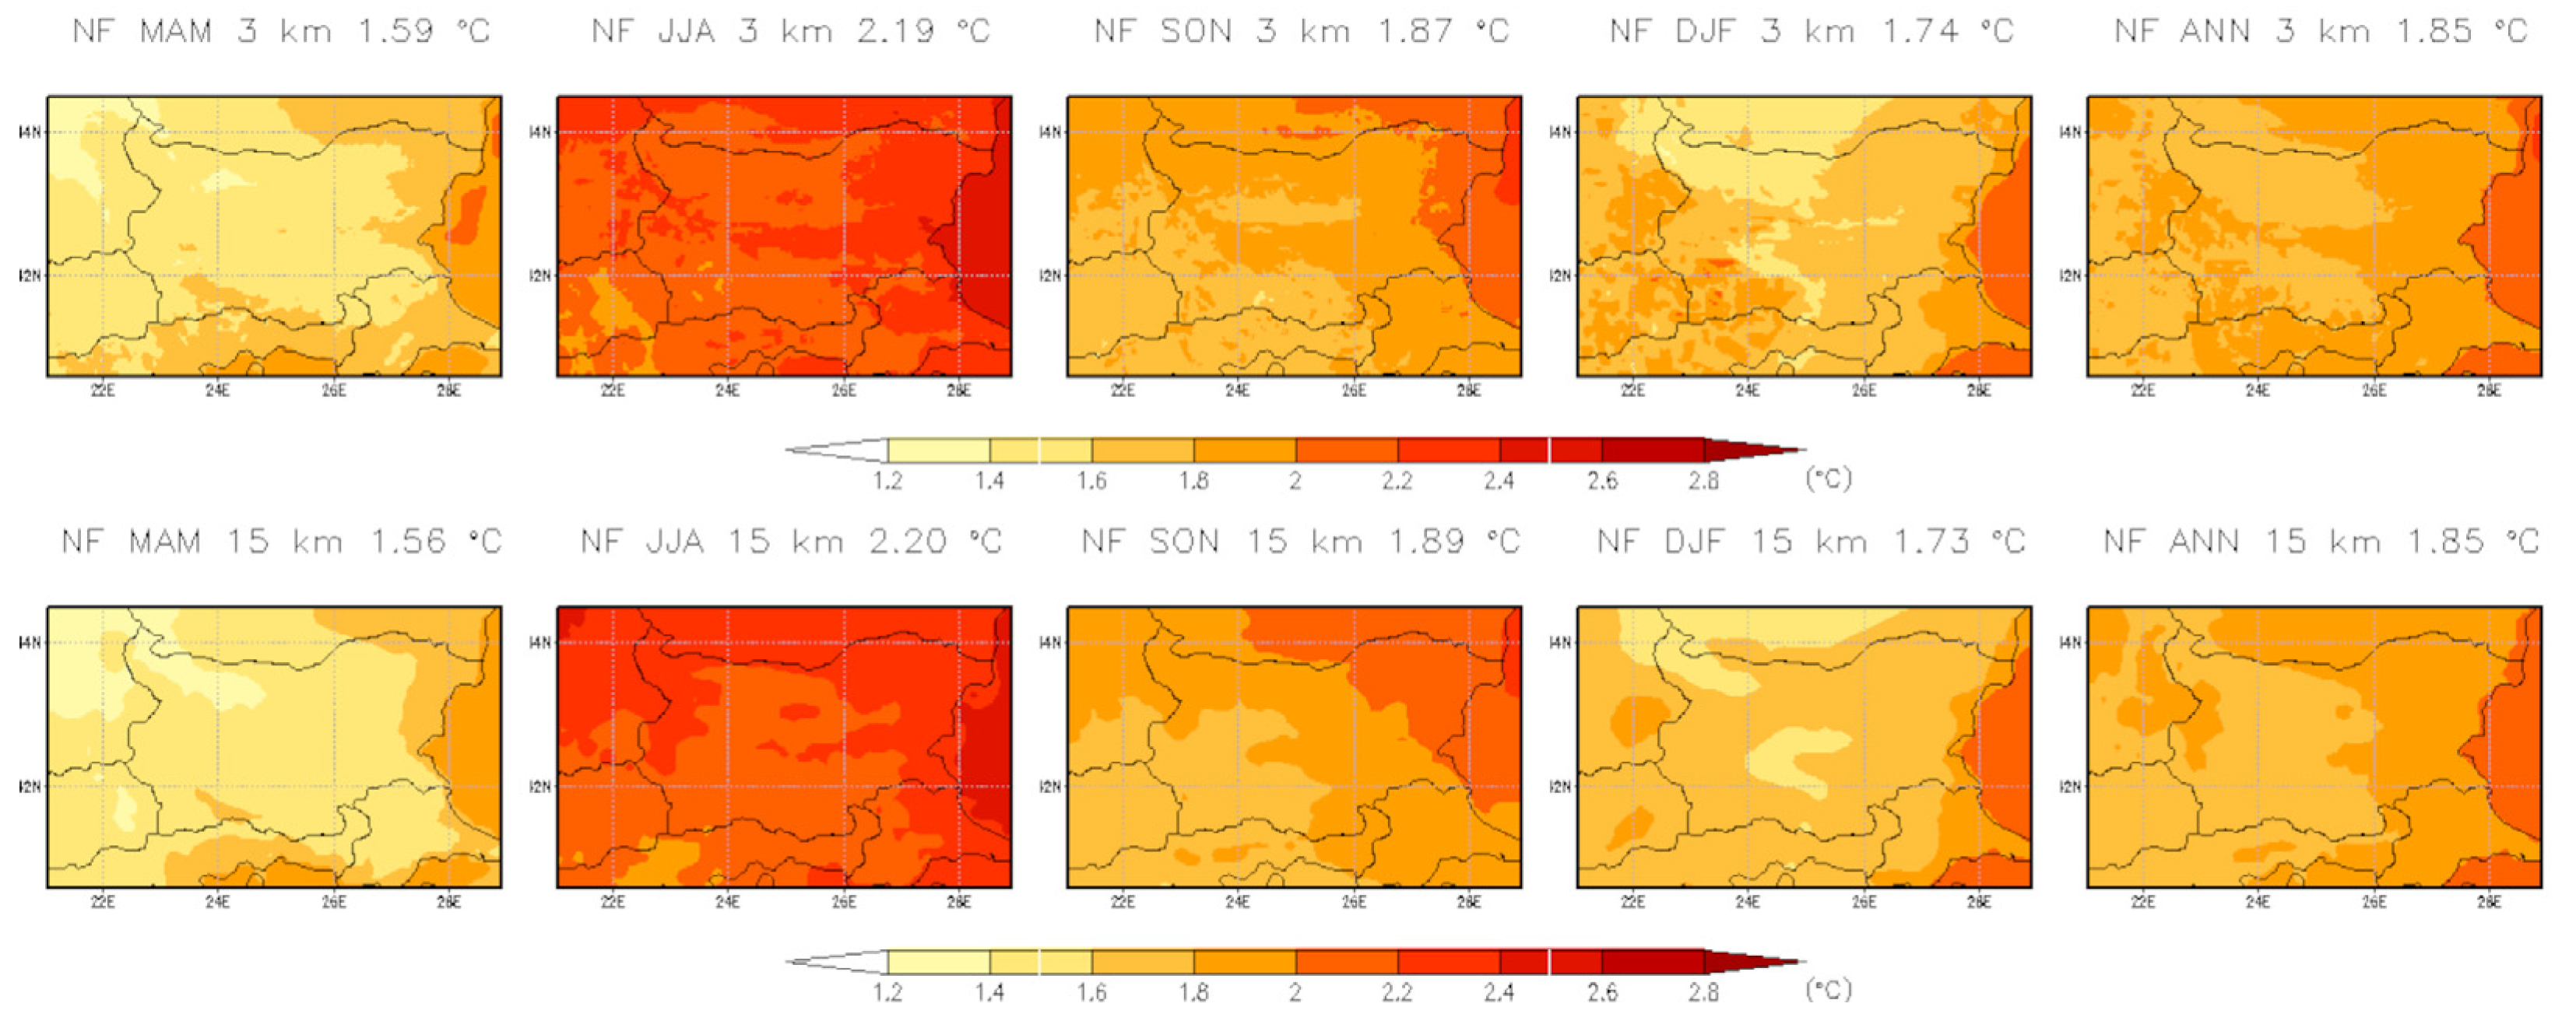
Figure 20.
Seasonal and annual mean 2 m temperature change for the period 2041–2050 with 3 km CPRCM and 15 km RCM. Units are in °C.
Figure 20.
Seasonal and annual mean 2 m temperature change for the period 2041–2050 with 3 km CPRCM and 15 km RCM. Units are in °C.
Figure 21.
Seasonal and annual mean 2 m temperature change for the period 2090–2099 with 3 km CPRCM and 15 km RCM. Units are in °C.
Figure 21.
Seasonal and annual mean 2 m temperature change for the period 2090–2099 with 3 km CPRCM and 15 km RCM. Units are in °C.
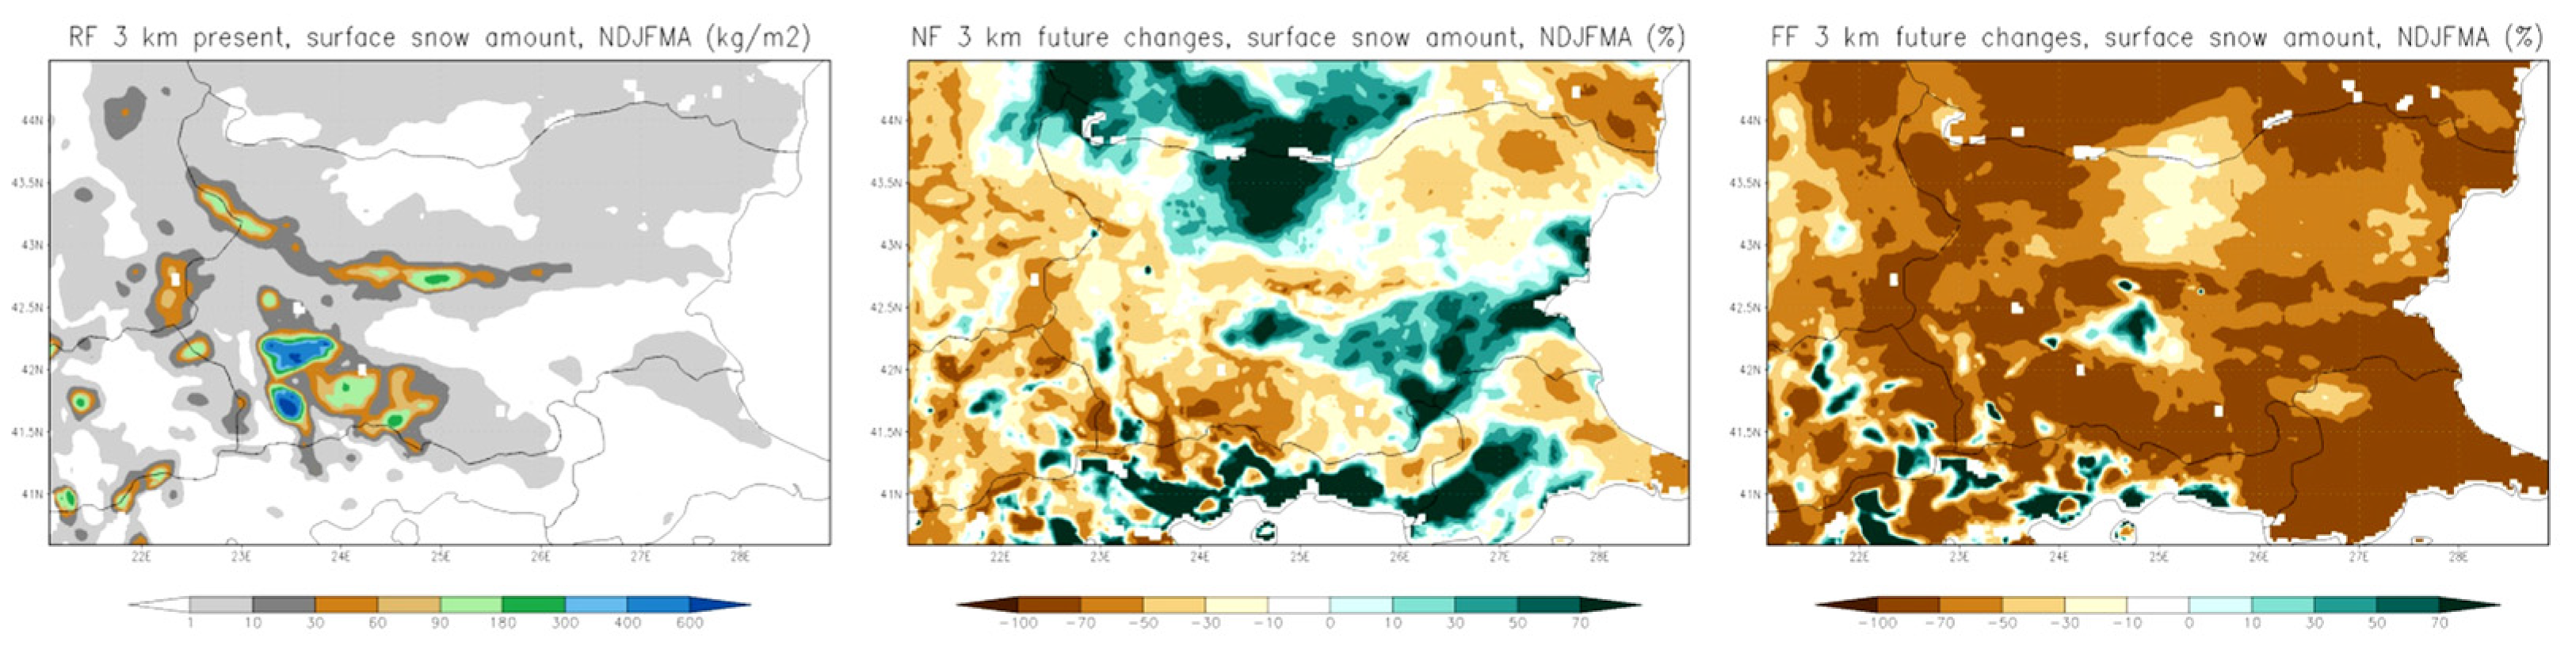
Figure 22.
Annual mean historical surface snow amount (kg/m2) and projected changes (%) for the near-future 2041–2050 and far-future 2090–2099 periods. Considering months NDJFMA (November–December–January–February–March–April).
Figure 22.
Annual mean historical surface snow amount (kg/m2) and projected changes (%) for the near-future 2041–2050 and far-future 2090–2099 periods. Considering months NDJFMA (November–December–January–February–March–April).
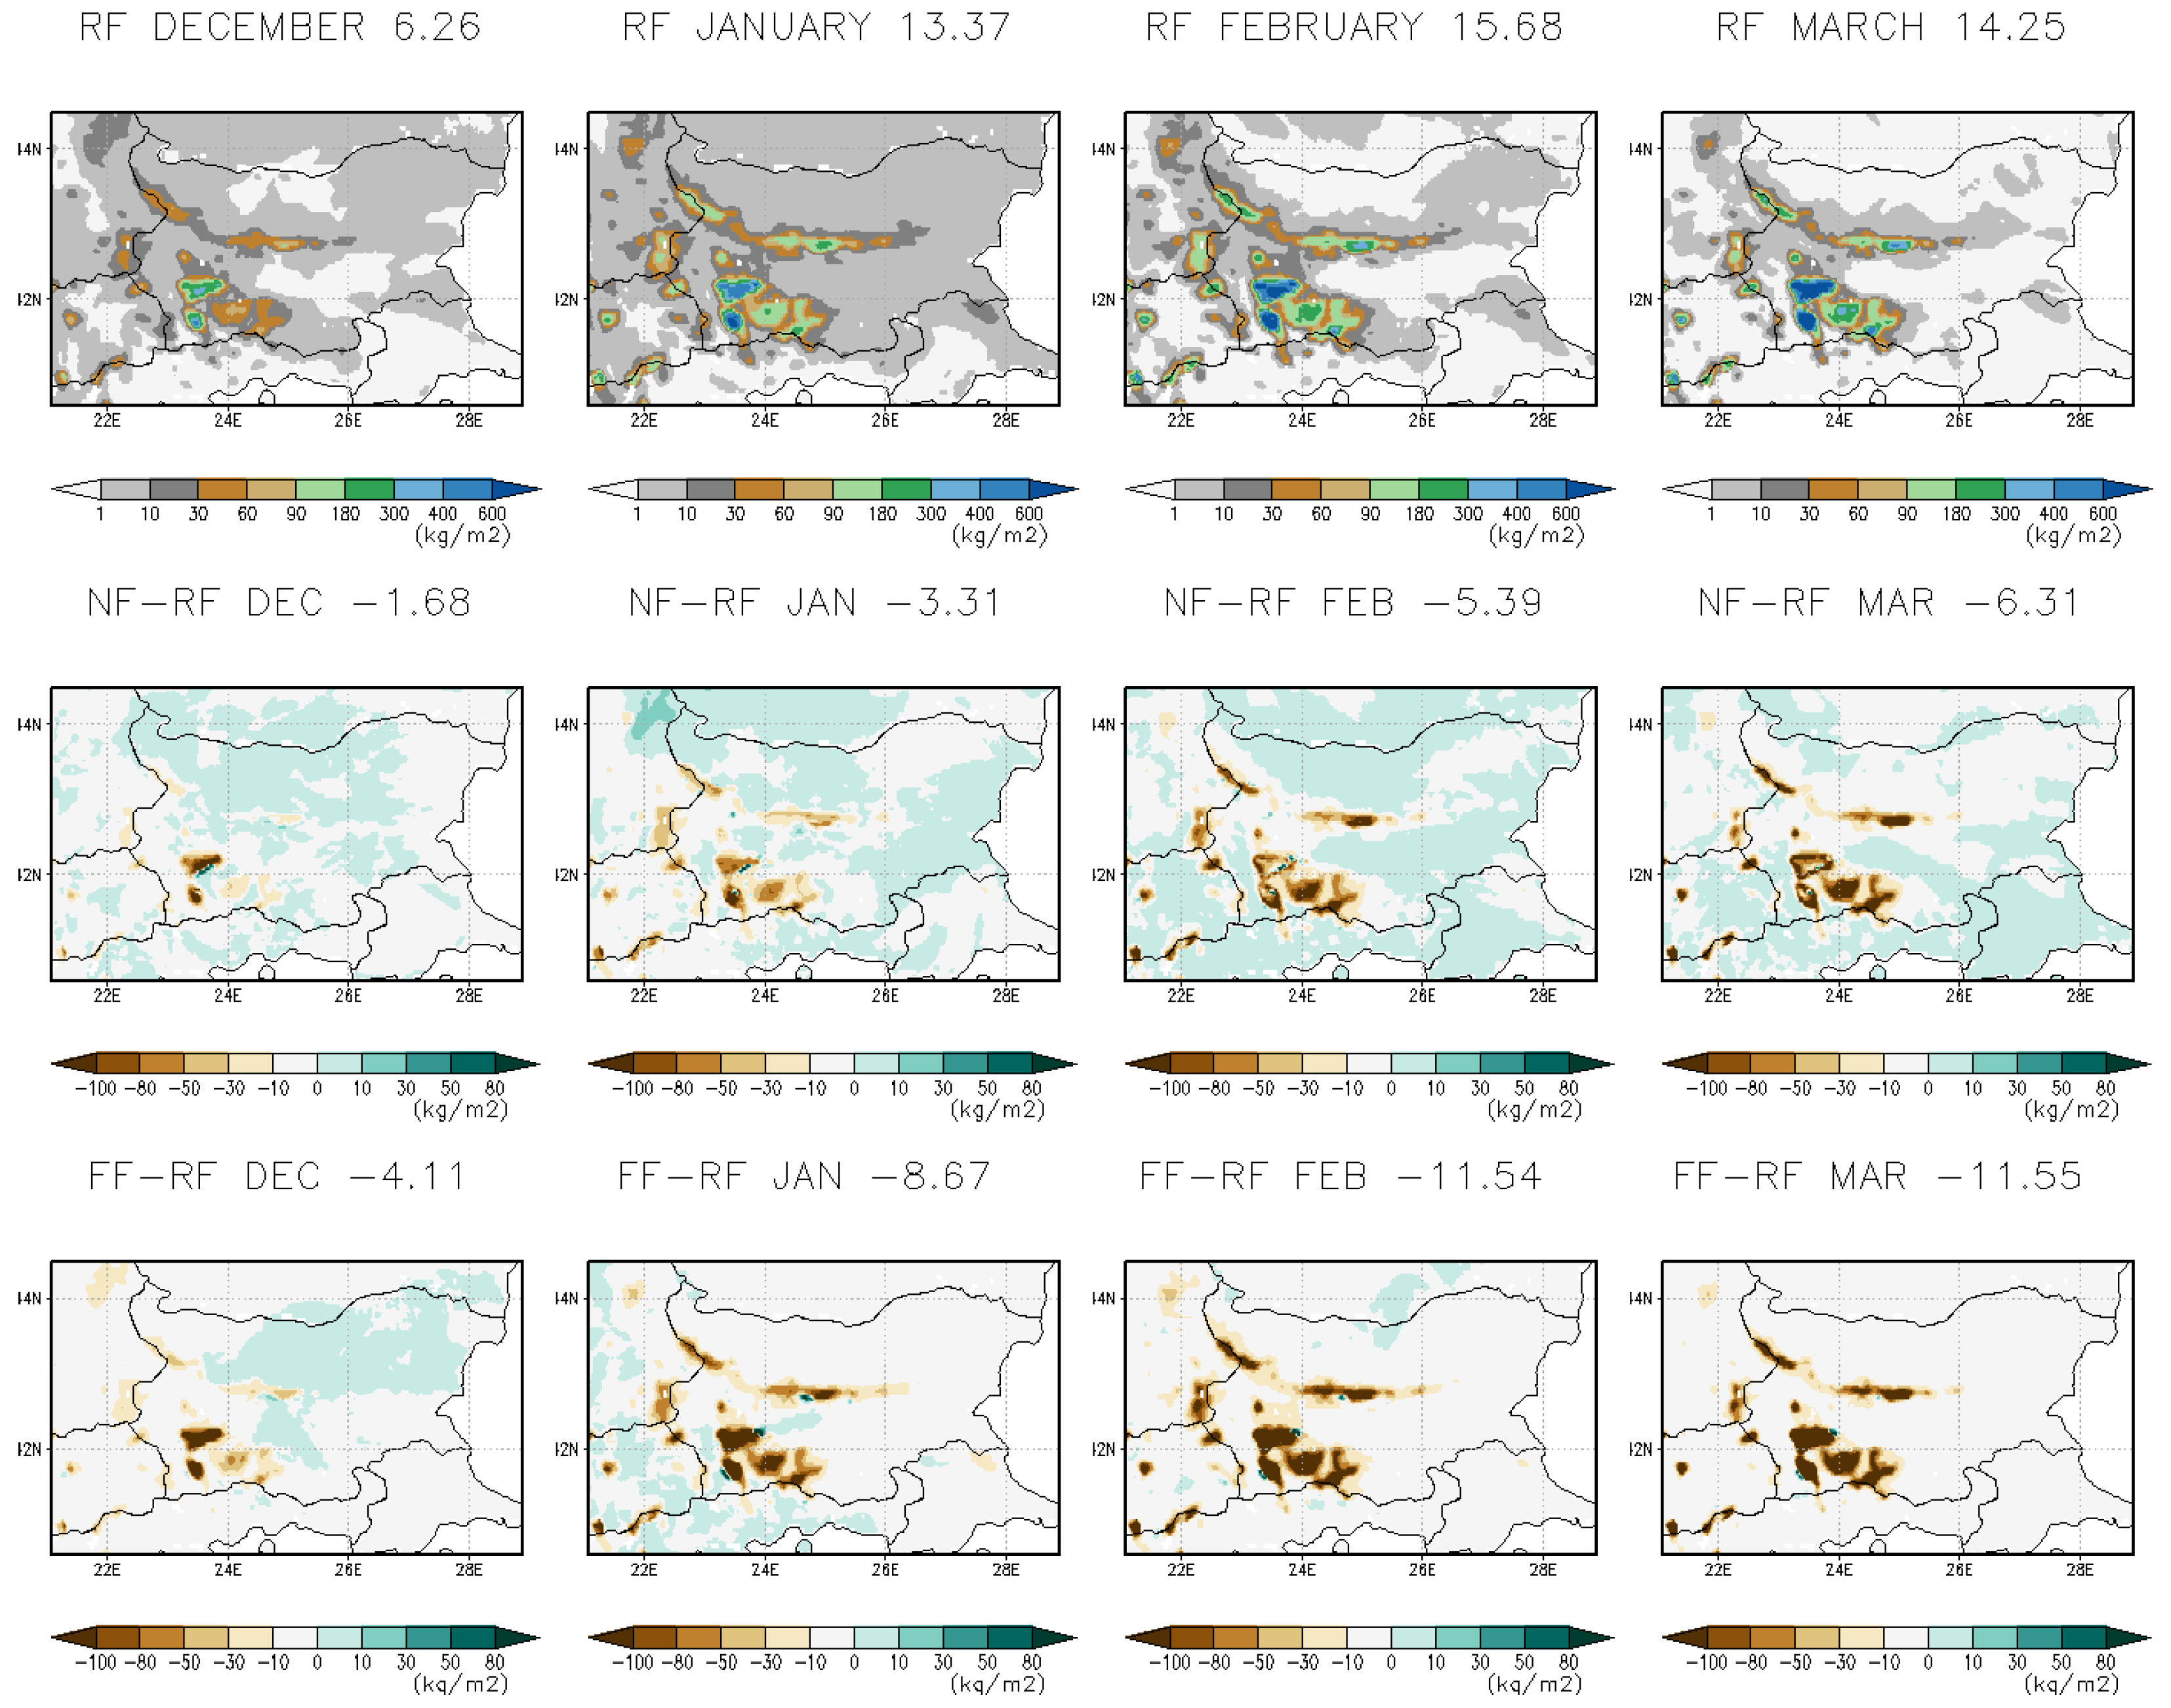
Figure 23.
Monthly mean surface snow amount for the historical period (first row) and projected changes for near-future 2041–2050 (second row) and far-future 2090–2099 (third row) in December, January, February, and March. Units are in kg/m2.
Figure 23.
Monthly mean surface snow amount for the historical period (first row) and projected changes for near-future 2041–2050 (second row) and far-future 2090–2099 (third row) in December, January, February, and March. Units are in kg/m2.
Table 1.
Statistical indices used in this study.
Table 1.
Statistical indices used in this study.
| Abbreviation | Definition | Units |
|---|
| Mean | Mean precipitation | [mm/d]; [mm/hour]; [%] |
| Frequency | Wet day/hour frequency | [%] |
| Intensity | Wet day/hour intensity | [mm/d]; [mm/hour]; [%] |
| 99th Percentile | Heavy precipitation (all-day percentile) | [mm/d]; [%] |
| 99.9th Percentile | Heavy precipitation (all-hour percentile) | [mm/hour]; [%] |
Table 2.
Annual mean daily precipitation indices, including means (MESCAN-SURFEX, 3 km CPRCM, 15 km RCM) and biases, area-averaged over Bulgaria (21.08° E–28.9° E; 40.59° N–44.48° N), for the historical period 1995–2004. Units: mm/d for all indices except frequency, which is expressed in %.
Table 2.
Annual mean daily precipitation indices, including means (MESCAN-SURFEX, 3 km CPRCM, 15 km RCM) and biases, area-averaged over Bulgaria (21.08° E–28.9° E; 40.59° N–44.48° N), for the historical period 1995–2004. Units: mm/d for all indices except frequency, which is expressed in %.
| | MESCAN-SURFEX | 3 km CPRCM | 15 km RCM | CPRCM-MESCAN | RCM-MESCAN |
|---|
| Mean precipitation | 1.93 | 3.04 | 1.73 | +1.11 | −0.20 |
| Intensity | 6.77 | 9.07 | 5.75 | +2.30 | −1.02 |
| Frequency | 27.21 | 31.37 | 27.94 | +4.17 | +0.79 |
| Heavy pre. (p99) | 23.42 | 42.73 | 20.88 | +19.31 | −2.54 |
Table 3.
Annual mean daily precipitation indices, including means (CERRA, 3 km CPRCM, 15 km RCM) and biases, area-averaged over Bulgaria, for the historical period 1995–2004. Units: mm/d for all indices except frequency, which is expressed in %.
Table 3.
Annual mean daily precipitation indices, including means (CERRA, 3 km CPRCM, 15 km RCM) and biases, area-averaged over Bulgaria, for the historical period 1995–2004. Units: mm/d for all indices except frequency, which is expressed in %.
| | CERRA | 3 km CPRCM | 15 km RCM | CPRCM-CERRA | RCM-CERRA |
|---|
| Mean precipitation | 1.97 | 3.04 | 1.73 | +1.07 | −0.24 |
| Intensity | 6.91 | 9.07 | 5.75 | +2.16 | −1.16 |
| Frequency | 27.51 | 31.37 | 27.95 | +3.87 | +0.48 |
| Heavy pre. (p99) | 24.56 | 42.73 | 20.88 | +18.17 | −3.67 |
Table 4.
Annual mean hourly precipitation indices, including means (PDIR-Now, 3 km CPRCM, 15 km RCM) and biases, area-averaged over Bulgaria for the historical period 2001–2004. Units: mm/hour for all indices except frequency, which is expressed in %.
Table 4.
Annual mean hourly precipitation indices, including means (PDIR-Now, 3 km CPRCM, 15 km RCM) and biases, area-averaged over Bulgaria for the historical period 2001–2004. Units: mm/hour for all indices except frequency, which is expressed in %.
| | PDIR-Now | 3 km CPRCM | 15 km RCM | CPRCM-PDIR-Now | RCM-PDIR-Now |
|---|
| Mean precipitation | 0.19 | 0.13 | 0.07 | −0.06 | −0.12 |
| Intensity | 1.4 | 1.04 | 0.76 | −0.36 | −0.64 |
| Frequency | 12.86 | 11.85 | 9.07 | −1 | −3.78 |
| Heavy pre. (p99) | 8.33 | 14.12 | 5.14 | +5.79 | −3.20 |
Table 5.
Percentage changes (%) in the analyzed indices for the two simulations (3 km CPRCM and 15 km RCM) for spring (MAM), summer (JJA), autumn (SON), winter (DJF), and annual (ANN) means, area-averaged for Bulgaria (21.08° E–28.9° E; 40.59° N–44.48° N). Comparisons are made for near-future (NF, 2041–2050) and far-future (FF, 2090–2099) periods relative to reference period (RF, 1995–2004).
| | MAM | JJA | SON | DJF | ANN |
|---|
| | 3 km | 15 km | 3 km | 15 km | 3 km | 15 km | 3 km | 15 km | 3 km | 15 km |
| | NF | FF | NF | FF | NF | FF | NF | FF | NF | FF | NF | FF | NF | FF | NF | FF | NF | FF | NF | FF |
| hourly | | | | | | | | | | | | | | | | | | | | |
| mean | 6.48 | −1.93 | 8.53 | 2.60 | −1.63 | −30.12 | 2.17 | −31.92 | −9.72 | −17.01 | −15.10 | −19.78 | 26.33 | 19.49 | 23.02 | 13.96 | 2.89 | −10.3 | 2.48 | −11.26 |
| int | 13.23 | 13.86 | 14.05 | 18.11 | 10.47 | 17.48 | 5.07 | 9.76 | 0.05 | 1.97 | −2.43 | 5.20 | 9.71 | 17.43 | 9.33 | 18.44 | 4.13 | 4.15 | 3.56 | 6.77 |
| freq | −0.88 | −1.74 | −0.44 | −1.21 | −0.89 | −2.99 | −0.32 | −2.68 | −1.27 | −2.26 | −1.25 | −2.14 | 2.33 | 0.54 | 1.67 | −0.19 | −0.18 | −1.62 | −0.09 | −1.56 |
| p99.9 | 17.98 | 13.14 | 13.16 | 8.71 | 4.36 | −15.52 | 3.54 | −4.88 | −5.58 | −0.14 | −10.40 | −0.86 | 21.46 | 31.19 | 13.49 | 25.66 | 3.81 | −3.17 | 0.77 | 2.52 |
| daily | | | | | | | | | | | | | | | | | | | | |
| mean | 7.11 | −1.99 | 8.97 | 3.03 | −1.43 | −29.44 | 3.19 | −31.7 | −9.23 | −17.35 | −14.92 | −20.00 | 24.87 | 19.42 | 21.59 | 13.42 | 2.82 | −10.34 | 2.37 | −11.35 |
| int | 8.14 | 11.12 | 7.41 | 13.37 | 12.42 | 13.34 | 10.76 | 7.53 | 2.53 | 3.94 | 0.70 | 7.15 | 15.40 | 22.64 | 13.49 | 1.11 | 6.74 | 7.56 | 5.84 | 9.90 |
| freq | −0.77 | −4.22 | 0.27 | −2.76 | −3.45 | −10.17 | −2.48 | −11.53 | −3.52 | −6.10 | −4.09 | −6.35 | 3.00 | −0.45 | 2.60 | −1.84 | −1.19 | −5.25 | −0.92 | −5.62 |
| p99 | 13.34 | 10.84 | 8.64 | 12.71 | 8.35 | −11.22 | 10.55 | −13.88 | −1.93 | −2.55 | −3.77 | −0.45 | 21.91 | 35.30 | 19.65 | 30.2 | 5.93 | 0.73 | 5.11 | 4.43 |
Table 6.
Two-meter temperature change (°C) from the 15 km RCM and 3 km CPRCM for both future periods. Units are in °C.
Table 6.
Two-meter temperature change (°C) from the 15 km RCM and 3 km CPRCM for both future periods. Units are in °C.
| | MAM | JJA | SON | DJF | ANN |
|---|
| | 3 km | 15 km | 3 km | 15 km | 3 km | 15 km | 3 km | 15 km | 3 km | 15 km |
| | NF | FF | NF | FF | NF | FF | NF | FF | NF | FF | NF | FF | NF | FF | NF | FF | NF | FF | NF | FF |
| Temp | 1.59 | 4.25 | 1.56 | 4.22 | 2.19 | 5.79 | 2.20 | 5.92 | 1.87 | 4.27 | 1.89 | 4.29 | 1.74 | 3.40 | 1.73 | 3.35 | 1.85 | 4.43 | 1.85 | 4.45 |
Table 7.
Monthly mean surface snow amount for the historical period (1995–2004) and future periods (2041–2050 and 2090–2099). Units: kg/m2.
Table 7.
Monthly mean surface snow amount for the historical period (1995–2004) and future periods (2041–2050 and 2090–2099). Units: kg/m2.
| 3 km | December | January | February | March |
|---|
| | RF | NF | FF | RF | NF | FF | RF | NF | FF | RF | NF | FF |
| Snow | 6.26 | 4.57 | 2.15 | 13.37 | 10.06 | 4.70 | 15.68 | 10.28 | 4.14 | 14.25 | 7.94 | 2.70 |


