Abstract
Electret filter media are electrostatically charged during the manufacturing process to activate effective electrical separation mechanisms. In order to investigate the influence of humidity on these mechanisms, the electric field, and filtration efficiency, a Direct Numerical Simulation (DNS) study of the aerosol deposition within wetted fibrous nonwoven filter media used in masks was carried out. Initial experimental investigations determined key properties of the filter material, including porosity, fiber diameter, and surface charge density. Using Micro-Computed Tomography (µCT), preferred locations for droplet deposition within the filter were identified. Additional experiments quantified the amount of water absorbed by the filter medium and assessed its impact on the existing electric field. Numerical simulations examined various models with differing porosity and fiber diameter, incorporating different levels of water content to analyze the changes in the electric field, flow velocity, and resulting filtration efficiency. The results provide valuable insights into the significant effects of fiber change on filtration performance, demonstrating the electret filter’s ability to partially compensate for the negative impacts of water.
1. Introduction
Nowadays, nonwoven filters are widely used to reduce emissions and improve indoor air quality. The significance of nonwoven filters for the separation of infectious aerosol particles as part of infection control has also been brought to light by the COVID-19 pandemic. The use of nonwoven filters in face masks, ventilation systems, mobile air purifiers, and cabin air filters in the automotive sector is omnipresent. In the filtration process, a gas flow containing particles is passed through the fibrous structure of the nonwovens, resulting in a separation of particles by impaction, interception, and diffusion. The efficiency of these mechanical separation mechanisms is dependent upon the particle size; as a result, filter media typically exhibit a separation minimum for particles in the range of approximately 0.3 μm (the most penetrating particle size) [1].
This separation minimum can be reduced by utilizing electret filter media, which provide additional electrostatic separation mechanisms. Electret filters offer the possibility of improving the filtration efficiency of a nonwoven filter without simultaneously increasing the pressure drop. The pressure drop is a decisive factor in the filter selection, as it should remain as low as possible during operation to minimize operating costs. In electret media, the fibers of the filter are specifically electrically charged during the manufacturing process in order to supplement the mechanical separation mechanisms with electrostatic mechanisms such as the Coulomb effect, dielectrophoresis, and the mirror charge effect [2,3,4,5].
The Coulomb effect, which is most effective for particle sizes below 100 nm [6], is created due to the opposing polarities of particle and fiber charges. This results in an attractive force, causing the particles to hit the fiber surface and become deposited. Dielectrophoresis refers to the polarization of particles by an inhomogeneous electric field around the individual fibers, leading to the formation of electric dipoles with opposing charges forming within the particles. The alignment of the particles in the electric field, which is caused by the dipole moment, leads to their attraction to the surface of fibers with subsequent deposition. Particle size significantly influences dielectrophoresis, particularly for particles with a size range between 100 and 300 nm [5]. Additionally, charged particles can induce mirror charges in uncharged fiber surfaces, generating an electric field that facilitates particle deposition, although this effect is usually neglected [7].
With increasing operating time, the electrostatic charge of the fibers diminishes, leading to a significant decrease in filtration efficiency [8]. This phenomenon may be attributed to various factors, such as exposure to deposited aerosol particles [4,9,10,11,12], increased humidity or a combination of increased humidity and temperature [13,14,15]. Additionally, exposure to organic solvents can further impact filtration performance [16,17,18].
Particle-filtering half masks (Filtering Face Piece—FFP) consist of electrically charged nonwoven filter media. Their retention capacity determines classification into FFP1, FFP2, and FFP3 classes, according to the standards DIN EN 143:2017-08 [19] and DIN EN 149:2009-08 [20]. The filtration efficiency increases with the classification number. The primary function of the FFP masks is to prevent aerosol-based infections as well as dust. When an infected person coughs, sneezes, talks, or breathes, pathogens residing in the respiratory tract are released into the surrounding air via respiratory fluid droplets [21,22,23,24]. Penetration tests conducted on water and respiratory liquid, which predominantly consists of water, yielded comparable results [25,26]. Numerous studies have measured the droplets’ size when breathing, speaking, coughing or sneezing, with reported values varying significantly [27]. In general, the respiratory droplets can be roughly classified within the size range between 0.1 μm and 500 μm. It is commonly known that respiratory droplets can spread viruses [28,29,30].
The microorganisms posing the highest risk of infection typically range in size from 20 to 300 nm, although viruses can also aerosolize and spread as larger aggregates [31,32]. Consequently, particle-filtering half masks made of nonwoven electret materials can be used to separate infectious droplets and viruses from the air [33]. Thus, wearing a mask has been shown to dramatically decrease the transmission of aerosolized viruses [34,35]. The degree of tightness between the edge of the half mask and the wearer’s face determines whether the particle retention or protective effect occurs. During use, wearers are exposed to a variety of airborne particles and droplets differing in size and composition. Additionally, environmental factors such as temperature and relative humidity may cause dynamic changes to the aforementioned properties, for example, due to evaporation.
When the masks are worn for extended periods of time, the nearly 100% relative humidity of exhaled air can result in the formation of droplets on their inter surface. As the duration of mask wearing increases, the temperature and humidity between the mask and the wearer’s face also rise [36]. Additionally, an increase in mask weight has been observed, suggesting that water is either absorbed or separated from exhaled air [25,36,37].
Several studies have demonstrated that the filtration efficiency decreases with an increase in relative humidity [38,39]. In most cases, this reduction is attributed to the weakening or neutralization of electrostatic precipitation effects [38,40]. However, the obtained moisture content remains relatively low, as previous tests primarily focused on the effects of breathing and did not account for additional droplets expelled during speaking, coughing, or sneezing. Therefore, the interaction (wetting) between the additional water-based droplets and the half masks’ hydrophobic nonwoven fabrics should also be considered.
Our preliminary experimental study [41] already demonstrated the influence of moisture on the filtration efficiency and pressure drop of the electret filter media. Other works have also shown that after exposure to water droplets, the pressure drop across the filter medium increased in comparison with its dry state [42] or increased the relative humidity [43]. This study investigates the impact of moisture in the form of separated water on the electret filter media. A key question concerns the distribution of separated water on filter fibers or within the nonwoven structure, as this information is essential for accurate simulations. Additionally, the extent to which the existing electric field within the filter medium is weakened or shielded is investigated using Direct Numerical Simulation (DNS). To perform these simulations, the software DNSlab® (Direct Numerical Simulation laboratory, Version 2024, IT for Engineering (it4e) GmbH, Kaiserslautern, Germany) is used. This in-house software utilizes a computational fluid dynamics (CFD) code specifically developed for the fully resolved calculation of the flow within microstructures and the filtration efficiency of filter media, considering the influence of electric fields [12,44,45]. In this study, the Euler–Lagrange approach with the Finite Differences Method (FDM) is applied to describe the multiphase flow dynamics.
2. Materials and Methods
This chapter outlines the experimental investigations that form the basis of the simulations. These include an analysis of the properties of the investigated electret filter media, μCT imaging of the microstructure, and the relationship between moisture content and surface potential.
2.1. Electret Filter Media
Sample sections from three different FFP2 masks (A, B, and C) were examined as electret filter media composed of polypropylene (PP). Each mask consists of three different layers: inner, middle, and outer. In addition to variations in mask shape, the basic properties of the filter media, such as thickness, porosity, and fiber diameter, also differ. The mean values with standard deviations of these properties were determined in our previous work [41] and are summarized in Table 1.

Table 1.
Characteristic properties of the electret filter media [41].
2.2. Micro-Computed Tomography (μCT) Images
It is assumed that liquid deposition within the filter media occurs through two primary mechanisms. The liquid can either be accumulated primarily around the fibers in the form of droplets, which can partially coalesce into a liquid film, or it can be retained at the contact points between fibers. The challenge here is that water is not visible in the µCT, and in the dried state, it is not possible to observe where the water was originally accumulated. The deposition of droplets in filters was successfully recorded in other work for oil using µCT [46,47,48]. To overcome this limitation, a contrast agent was introduced, which remains visible in µCT images after drying. A small section (approx. 5 mm × 5 mm) was prepared from the middle layer of filter A and subjected to µCT imaging. A droplet with a diameter of approx. 2 mm, which contained a contrast agent in the form of a potassium iodide solution (Lugol’s Liquor, PanReac AppliChem, Prod. Code: 257041, AppliChem GmbH, Darmstadt, Germany), was applied to the sample’s center using a dosing pipette and permeated within a few minutes. After a sufficient drying period of 24 h at room temperature (approx. 20 °C), the sample was tomographed again. Figure 1 shows a comparison of the fiber structure before and after application of the contrast agent droplet.
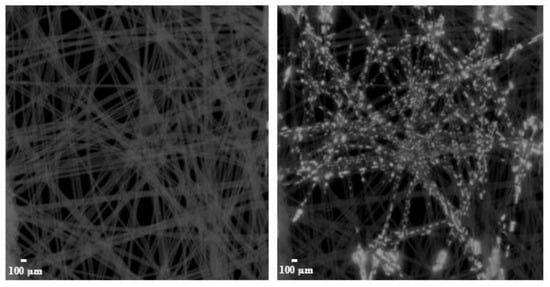
Figure 1.
µCT images of a section from the middle layer of filter A, shown before (left) and after (right) the application of a contrast agent droplet.
For better visualization, Figure 2 presents a 3D image of the sample section with the contrast agent (yellow), created from the µCT image shown in Figure 1.
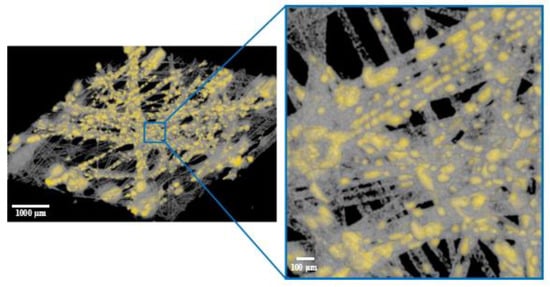
Figure 2.
3D image of the contrast agent (yellow) distribution in a sample section of the middle layer of filter A.
Based on these images, it can be inferred that the liquid primarily accumulated between fibers or at their contact points. Rather than forming a continuous liquid film around the fibers, only partial wetting occurred.
As the main component of Lugol’s Liquor is 85% water (density: 1112 kg/m3), its properties should closely resemble those of water. In the contents of the experimental investigations, the wettability of the used liquid to the filter material is an important property. In order to investigate this characteristic, the contact angles of Lugol’s Liquor and water with the filter material were measured. Single droplets (0.1–1 µL) were carefully deposited on the filter material using an Eppendorf pipette, and high-resolution images were captured for analysis. Figure 3 shows the comparison of contact angles for the middle layer of filter A.
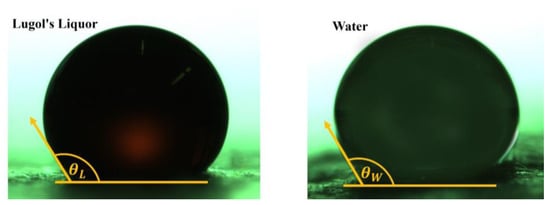
Figure 3.
Contact angle between single droplets of Lugol’s Liquor and water on the middle layer of filter A.
As shown in Figure 3, the contact angles between the Lugol’s Liquor (left) and water (right) on the filter material are comparable. The evaluation of the images of 10 droplets each results in the contact angles of = 123.4° (±4.2°) for Lugol’s Liquor and of = 124.7° (±6.5°) for water. The contact angle between water and polypropylene (PP) is in the range between 88° and 114° [49]; however, this value applies to solid bulk material surfaces of PP rather than a porous fiber structure. Since no literature values exist for the contact angle of Lugol’s Liquor, it can be inferred that both liquids exhibit similar wetting behavior.
2.3. Water Content and Surface Potential of the Filter Medium
To quantify the amount of water separated with the filter medium, the gravimetric water content was determined, which is calculated as a ratio of the water mass to the moist mass of the sample as follows:
where is the dry mass of the filter medium. The experiments showed that the filters A, B, and C exhibit similar behavior regarding mass increase due to water absorption and corresponding changes in surface potential. The results of these measurements are described representatively for individual layers (inner, middle, and outer) of filter A. The examined mask sample with a diameter of approx. 76 mm represents the area around the mouth, i.e., the region most likely to become moist during breathing, coughing, or speaking.
To simulate varying levels of humidity exposure, the samples were sprayed with water using a spray bottle, creating three distinct humidification conditions: humidification I (H-I), humidification II (H-II), and humidification III (H-III). As the humidification level increased from H-I to H-III, the amount of water retained, and thus the gravimetric water content, also increased. Figure 4 shows the different humidification cases for the middle layer of filter A, where the water was colored blue to enhance the visibility of its distribution on the surface. The “dry” case corresponds to a new filter that has not been humidified.

Figure 4.
Humidification levels (dry, H-I, H-II, and H-III) for the middle layer of filter A.
Due to the hydrophobic surface of the filter material, smaller droplets tend to coalesce, sometimes forming larger droplets on the surface (see Figure 4, H-III) before penetrating the material over time. Table 2 shows the gravimetric water content of the inner, middle, and outer layers across different humidification levels.

Table 2.
Gravimetric water content for different humidification levels for the layers of filter A.
The individual layers differ in their basis weight and fiber diameter distribution (see Table 1). However, the water content per humidification level is comparable. The average water content across the three layers is 19.31% (±2.57%) for H-I, 37.97% (±3.53%) for H-II, and 56.74% (±1.57%) for H-III.
The attenuation of the electric field due to the presence of water within the filter medium was first estimated experimentally. To assess this effect, the surface potential (SP), which is a measure of the electric field strength, was measured across the inner, middle, and outer layers using a surface voltmeter (Alphalab Inc., Salt Lake City, UT, USA). For this purpose, the same round sample sections with a diameter of 76 mm were measured.
The test rig used for the experimental investigations is shown in Figure 5. The sample was placed on a grounded metal plate, the five marked measuring points were scanned using the probe head of the surface voltmeter, and the potential was measured. The distance between the probe head and the electret media (sample section of the filters) was set to 1 inch (2.54 cm), in accordance with the manufacturer’s recommendations (AlphaLab Inc., Salt Lake City, UT, USA).
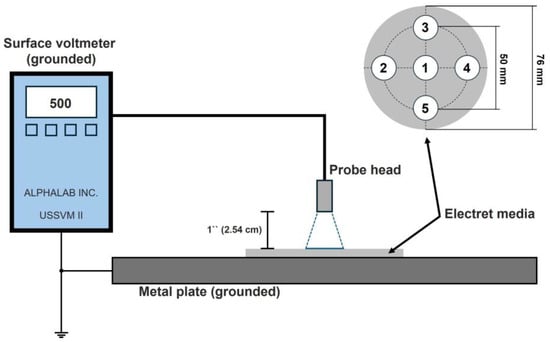
Figure 5.
Test rig for the measurement of the surface potential of the electret filter media.
Table 3 illustrates the variability in surface potential by presenting measurements obtained from 10 different samples (inner layer—type A), denoted as S1–S10. Each sample was measured on the interior side (surface facing the mouth/face) according to the scheme outlined in Figure 4. To ensure consistency, the potential was determined at five distinct measurement points in each case.

Table 3.
Surface potential for 10 different samples of the inner layer—filter A.
The comparison of mean values and standard deviations in Table 3 shows that the surface potential can be distributed very differently both within a sample and between different samples. The measured value of the surface potential of nonwovens fluctuates significantly due to their inhomogeneous structure. Additionally, the filter fibers may carry positive and/or negative charge, interacting with one another and influencing the overall potential of the filter surface [50,51]. Moreover, the measured surface potential is strongly dependent on the distance between the probe head and the filter surface [52].
Table 4 shows the mean value and standard deviation of the surface potential (SP) for the different humidification levels of sample S1 (see Table 3). Similar to the comparison of surface potential measurements across 10 samples, the results indicate substantial variability, including that there is a large variance between the measurement points, which results in a high standard deviation. As the water content increases from H-I to H-III, a corresponding decrease in the surface potential is observed.

Table 4.
Surface potential—mean and standard deviation for the different layers of a filter A at different humidification levels.
Table 5 compares the results from Table 2 and Table 4, examining the relationship between water content and the percentage decrease in surface potential (DSP). The reduction in surface potential is expressed relative to the values of new and dry samples across different experimental conditions.

Table 5.
Comparison between the decrease in surface potential (DSP) and the water content for the three layers of filter A at different humidification levels.
A clearly comparable trend can be seen between the different layers and the respective drop in the surface potential, as well as the increase in water content. With an increase in water content to 16–21%, the surface potential decreases by about 45–60%. At higher water content levels of approximately 55–57%, the surface potential drops significantly by approx. 92–95%.
Experimental investigations have demonstrated that the surface potential decreases with increasing water content. To account for this effect in the simulation, an attenuation factor can be applied reducing the electric field strength at locations where water accumulates on the fibers. Measurement revealed a surface potential attenuation in the range between 45% (H-I, inner layer) and 95% (H-III, inner layer). Section 3.2 deals with the calculation of the electric field and the selection of the attenuation factor. It should be noted that surface potential measurements serve only as an approximation of the attenuation caused by water. Due to the irregular structure of the nonwoven material, the results exhibit a high standard deviation. Nevertheless, the measurements provide sufficient data to estimate the reduction in the electric field strength, as the measured surface potential is proportional to both surface charge density and electric field strength (see Equation (5), Section 3.2).
Finally, it was necessary to check whether the attenuation of the surface potential by water is reversible or irreversible. For this purpose, three samples from each filter layer were measured again and then immersed in water, ensuring that the structure became fully saturated. The measurements were conducted both in the wet state and after a 72-h drying period. The results in Table 6 show the mean values of the measured surface potential, along with standard deviation (see measurement scheme and evaluation of Table 3 and Table 4) for one representative sample from each layer under the three experimental conditions.

Table 6.
Mean surface potential and standard deviation for different layers of filter A in new, wet, and dried conditions.
The decrease in surface potential between the new and the wet sample is between 98.13% and 99.23% for the different layers. After drying for 72 h, the surface potential from the beginning (new condition) nearly returns to its initial value. The deviation observed is 2.5% for the inner layer, 15.5% for the middle layer, and for the outer layer, the original value is fully restored. Despite the large standard deviation, the results suggest a reversible process, indicating that the surface potential recovers to its initial state after drying.
3. Direct Numerical Simulation (DNS)
This chapter describes the numerical simulation model implemented using DNSlab software. It covers the setup for the particle deposition calculations, detailing the simulation parameters, as well as providing a comprehensive explanation of the 3D model generation, including the fibrous structures, electric charge distribution on the fibers, the calculation of the gas flow and particle movement through the structure, as well as their possible deposition on the fibers.
3.1. 3D Model Generation
The 3D microstructure of the filter media was generated within the simulation using a mathematical algorithm developed in a previous work [5,53]. Cylindrical fibers with a specified diameter distribution were randomly generated within a closed volume perpendicular to the flow direction until the required porosity was achieved.
Three different models were created, each representing a small section of an electret nonwoven layer located in the mouth area (parts of the mask most susceptible to moisture exposure). Model 1 corresponds to the outer layer of filter C (fiber diameter: 3 µm, porosity: 0.921), Model 2 represents the inner layer of filter A (fiber diameter: approx. 6 µm, porosity: 0.876), and Model 3 describes the middle layer of filter B (fiber diameter: approx. 19 µm, porosity: 0.882). The different individual layers were selected to vary both the fiber size and the porosity in the models. Since multiple parameters were varied in the simulation (e.g., water content, surface charge density, etc.), the model sizes were chosen to be relatively small.
The respective model size, porosity, fiber diameter, and surface charge density are summarized in Table 7. The main difference between the models lies in the size range of the fiber diameters. The voxel size was chosen based to the fiber size to ensure that each fiber was represented by at least 4–5 voxels.

Table 7.
Parameters of the models.
The experimentally determined surface potentials correspond to the entire surface of the sample, including individual fibers and air voids due to the high porosity of the material. However, in the simulations, the specified value of the surface charge density refers only to individual fibers. Based on preliminary studies and the literature [51,54,55], the values of 10, 25, and 50 µC/m2 were assumed to be realistic for the fibers.
Preliminary studies [5,51] indicated that assuming an equal distribution (50% positive and 50% negative) of charge within the fibers is in good agreement with experimental investigations. Therefore, the upstream side of the created fiber models was defined as positively charged, while the downstream side was designated as negatively charged.
Figure 6 illustrates Model 1 (left), Model 2 (middle), and Model 3 (right) with their properties from Table 7. The green represents the positively charged upstream fiber surfaces, while red denotes the negatively charged downstream surfaces.

Figure 6.
Model 1 (left), Model 2 (middle), and Model 3 (right) with positively (green) and negatively (red) charged fibers.
The water content at contact points of fibers was varied for the three different cases: WCP I–III (WCP: Water in Contact Points). Table 8 presents the gravimetric water content and the percentage of pore-filling by water (the volume of water was related to the free pore volume in the dry fiber structure) for Models 1, 2, and 3. In these models, the volume fraction of the fibers remains constant, while an increase in water content results in a corresponding decrease of the air volume fraction. The generation of the water quantity depends on the fiber geometry of the model and, in particular, the number of fiber crossings or contact points present.

Table 8.
Gravimetric water content and percentage of pore filling for models 1, 2, and 3.
Compared to Table 2, the generated water quantities align well with experimental observations, with the water content ranging between approximately 16% and 58%. The percentage of pore filling was kept approximately the same for the various degrees of humidification.
3.2. Computation of Gas Flow, Electric Field, and Particle Movement
The gas flow through the fibrous structure of the generated 3D model is calculated by directly numerically solving the stationary Navier–Stokes Equations (2) and (3) using the Finite Differences Method. The discretization of these partial differential equations is then performed on the voxel grid of the 3D model, where the corresponding nodes are defined as the voxel centers [56].
Figure 7 shows the computed creeping flow field for a single fiber with a diameter of 10 µm at an inflow velocity of 0.01 m/s, corresponding to a Reynold number of 0.07. The local flow direction is indicated by the white arrows. At the fiber surface, the velocity is zero according to the no-slip boundary condition in Equation (4). Consequently, the flow velocity decreases on both the upstream and downstream sides of the fiber due to the flow dynamics around it.
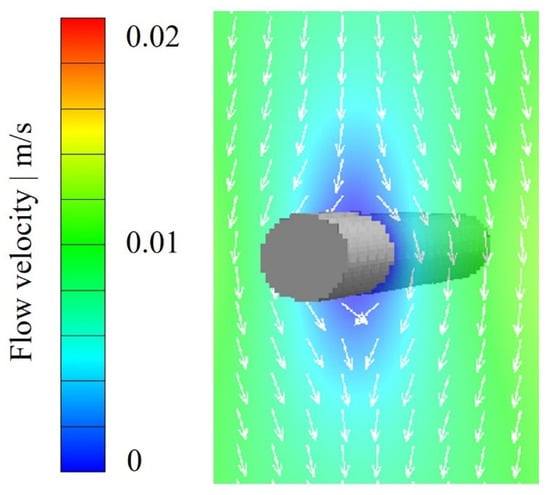
Figure 7.
Calculated flow field for a single fiber with a diameter of 10 µm (voxel length: 1 µm) at an inflow velocity of 0.01 m/s.
By explicitly integrating the surface charges, the electric field within the pore volume surrounding the fibers with the surface charge density is calculated [57]:
where is the spatial position in the void domain, the surface integration variable and the permittivity of the vacuum. The electric field was calculated up to a distance of approximately 1.5 times the fiber diameter into the pore volume [51]. The strength of the electric field, therefore, decreases as the distance from the fiber surface into the pore volume increases. Figure 8 shows the calculated electric field of a single fiber (diameter: 10 µm, voxel length 1 µm) with a surface charge density of 25 µC/m2.
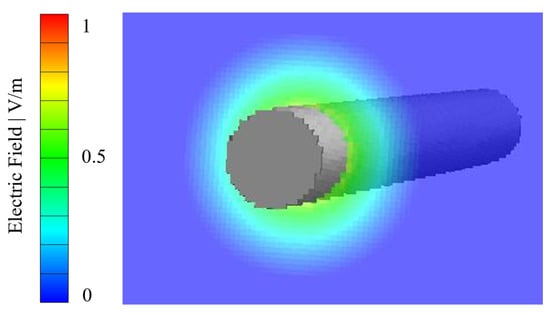
Figure 8.
Calculated electric field of a single fiber with a diameter of 10 µm (voxel length: 1 µm) for a surface charge density of 25 µC/m2.
Equation (5), used for calculating the electric field, contains the permittivity in the denominator and refers to the interaction between charges in a vacuum, where no interfering matter exists, resulting in maximum interaction strength. However, when a medium is introduced between two charges, the charge carriers within the medium shift due to polarization effects, generating an opposing electric field. This induced field weakens the original field of the charges.
To consider the presence of a medium in the calculation of the electrical field in Equation (5), the permittivity of the respective medium must replace . The extent to which the permittivity of different media differs from the permittivity in a vacuum can be expressed by the relative permittivity :
In a vacuum = 1, for example, a value of = 2 means that the electric field is reduced by half. Air has a value of = 1.00059 and is therefore almost as permeable as a vacuum. Water has a high attenuation effect due to the polarized bonds, and is also dependent on other factors such as temperature. can therefore change its value depending on the temperature for water: = 73, at T = 40 °C; = 81, at T = 20 °C; = 84, at T = 10 °C; = 88, at T = 0 °C, and = 16 in the frozen state [58,59].
Experimental results presented in Section 2.3 demonstrate that the surface potential decreases as the amount of water accumulated within the filter structure increases. The measured surface potential is in turn proportional to the surface charge density, which is used to calculate the electric field strength (see Equation (5)). The attenuation of the surface potential was estimated to be between 45 and 95%, depending on the water content (see Table 5). The increased permittivity of water compared to air was considered in the simulations by attenuating the electric field by 85% at the locations where water accumulated. At an average water temperature of between 8 °C and 12 °C, this comfortable value fits well with the permittivity of water ( = 84, at T = 10 °C). This assumption also corresponds well with the experimental studies on the attenuation of the surface potential, see Table 5.
The Euler–Lagrange method is applied to calculate the particle movement through the pore volume, considering forces acting from the gas flow, the electric field, and the diffusive motion [44]:
where is the time step and represents the particle velocity, with as the particle position at the timestep . At the timestep , the particle velocity becomes , and the particle position changes to .
The computation considers the acceleration caused by the dielectrophoretic and the Coulomb forces in Equations (10) and (11). The particle fluid friction coefficient γ in Equation (9) accounts for the drag force on the particles caused by the gas flow, which is described by Stokes’ law with the Cunningham correction Cu [4,6].
where is the particle charge, and is the relative dielectric constant of the particle. The particle charge was calculated using the bipolar equilibrium charge state described by Wiedensohler’s approximation [60]. If the particles are not pre-conditioned, they are in an undefined and highly charged state. Therefore, prior to experimental investigations, such as measuring the filter efficiency, particles are pre-conditioned to establish a bipolar charge equilibrium [51].
To evaluate the filtration efficiency of the fibrous structure, a simulation was conducted tracking the movement of 100,000 particles with diameters , uniformly distributed from 0.01 to 1 μm. Since sodium chloride (NaCl) is a common test aerosol for air filters, its characteristics were used in the particle simulations. In the upstream volume, the particle initial positions were generated randomly. A particle was considered deposited when its computed trajectory reached the fiber surface. The filtration efficiency was then determined by computing the ratio of deposited particles to the total number of particles introduced into the system. Table 9 provides a summary of the simulation parameters.

Table 9.
Simulation parameters.
4. Results
This chapter presents the results of numerical simulations, which employed mathematically generated fibrous structure models to compute particle deposition. These models incorporate variations in fiber diameter, charge distribution, and water content to examine how the water affects the current electric field and filtration efficiency. The models and their parameters have already been described in Section 3.1 in Table 7.
To ensure a fully developed flow profile, the models were extended to include upstream and downstream flow regions. Figure 9 shows Model 1, expanded by these flow areas, along with the simulated particle separation. The particles are depicted in orange. The figure sequentially demonstrates the generation of the 100,000 particles in the size range of 10 to 1000 nm (left), their separation process during flow (middle), and the resulting separation of the particles (right). The particles were homogeneously distributed over the cross-section of the inlet with an initial velocity of 0.01 m/s, which corresponds to the gas velocity. The interaction between particles was excluded. The positively charged side of the filter medium (green) was selected as the upstream side (see Figure 9).
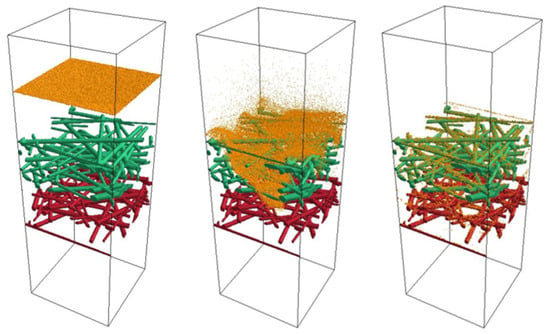
Figure 9.
Simulation of the deposition of 100,000 particles in the size range of 10 to 1000 nm in the filter medium of Model 1 (green—positively charged, red—negatively charged) at a flow velocity of 0.01 m/s.
Figure 10 shows the filtration efficiency as a function of the surface charge density of the fibers for Model 1, compared to the uncharged case (absence of an electric field). The results for Models 2 and 3 are presented separately in Table 10.
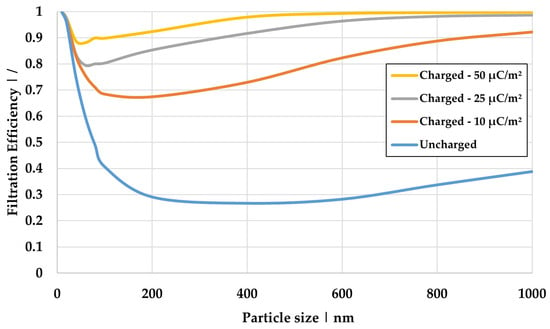
Figure 10.
Influence of the surface charge density of the dry fibers on the filtration efficiency simulated for Model 1 at a flow velocity of 0.01 m/s.

Table 10.
Filtration efficiency of Models 1, 2, and 3 for the particle size range from 10 to 1000 nm.
The uncharged case exhibits the lowest filtration efficiency, with the MPPS at 400 nm. The filtration efficiency increases with increasing surface charge density, which can be attributed to the additional electrostatic separation mechanisms, such as dielectrophoresis, the Coulomb effect, and the mirror charge effect. These mechanisms become more effective as the surface charge density rises. This leads to a shift in the MPPS, improving efficiency in this area.
Figure 11 shows the increasing water content in the contact points between the fibers (blue) for Model 1, ranging from 8.88% to 55.98%. The water deposition at fiber contact points is based on the distribution of water observed in CT images (see Figure 3).
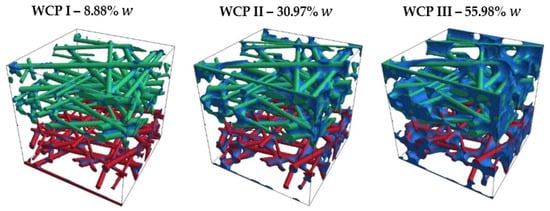
Figure 11.
Variation in water content at the fiber contact points in Model 1.
Figure 12 shows a comparison of the electric field between the three wet cases (WCP I, II, and III), demonstrating the impact of differing water content at fiber contact points. The sectional view corresponds to the center of the model.
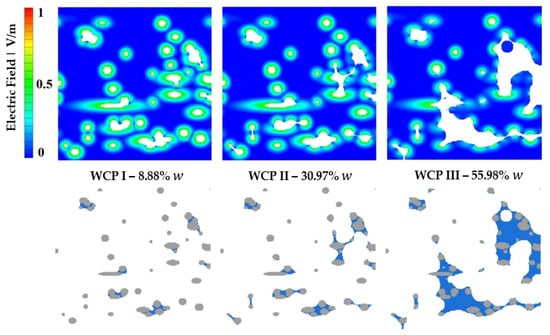
Figure 12.
Electric fields in Model 1 at varying water content levels.
In the illustration of the electric field, both the fibers and water are depicted in white. The electric field is present across the entire fiber surface, gradually weakening with increasing distance from the fiber surface until it reaches zero (dark blue). In the open pores between the fibers, where only air is present, no electric field is observed. On the fiber surface that is wetted by water, the electric field is reduced by 85%; see Section 2.3. As the amount of water increases from left to right, the electric field continues to decrease, resulting in a reduction of areas where the electric field could exert a stronger influence (green).
Figure 13 presents the calculated filtration efficiency for the charged (dry case), uncharged (absence of an electric field), and the three scenarios, where water is present at fiber contact points. The data correspond to a surface charge density of 25 µC/m2 and cover the particle size range of 10 to 1000 nm.
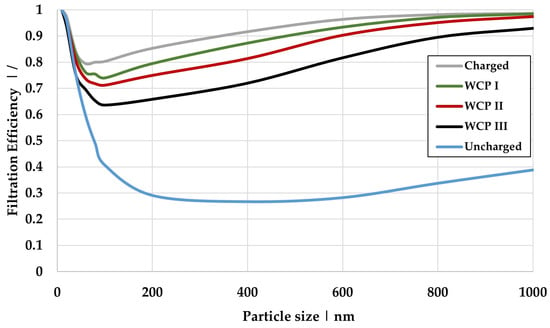
Figure 13.
Comparison of the filtration efficiency of Model 1 under different conditions: dry and charged at 25 µC/m2, uncharged, as well as varying water content (WCP I, II, and III) at 25 µC/m2.
The dry charged case shows the highest filtration efficiency, as expected. In this scenario, the electric field acts at full strength without attenuation, thereby enabling maximum electrostatic precipitation effects. Conversely, the uncharged case (also without water) represents a state in which the filter material has been fully discharged or neutralized. This renders electrostatic separation mechanisms ineffective, yielding the lowest level of separation efficiency. As water content in the contact points increases, from WCP I to WCP III, the filtration efficiency decreases for all particle sizes. This reduction is primarily due to the weakened electric field, which diminishes electrostatic precipitation mechanisms. Experimental investigations (see Table 3, Table 4 and Table 5) confirm this trend, along with calculations of electric field strength as a function of permittivity (see Equation (6)). The presence of water (higher permittivity) reduces the amount of air (lower permittivity) between the fibers, resulting in a weakening of the existing electric field.
Additionally, increased flow velocity leads to a reduced residence time of the particles, lowering the probability of separation and consequently reducing overall filter efficiency.
Table 10 provides an overview of the overall filtration efficiency across the full particle size range for Models 1, 2, and 3 in both charged and uncharged cases (without water), as well as for three degrees of humidification (WCP I, II, III) and varying surface charge density (SCD—10, 25 and 50 µC/m2).
The filtration efficiency results show a similar trend for the three different models (with different fiber sizes and porosities). The water content and pore filling (see Table 8) in the three different cases (WCPI, WCPII, and WCPIII) are of similar magnitude, as well as the weakening of the efficiency (see Table 10).
However, for higher surface charge densities, efficiency remains initially elevated and, despite attenuation due to water, still surpasses that of lower surface charge densities. The results also demonstrate that increasing the fiber charge (surface charge density) can compensate for or offset the negative effect of water on filtration efficiency. For example, for Model 1, the efficiency at 25 µC/m2 in the charged case is 90.03% without water, whereas at 50 µC/m2 in the case with water (WCP II), the filtration efficiency remains high at 90.96%.
Finally, the increased flow velocity within the fiber structure is illustrated in Figure 14, which compares the flow field around the dry fibers and the separated water. The white arrows indicate the direction of flow, moving from top to bottom through the filter structure.
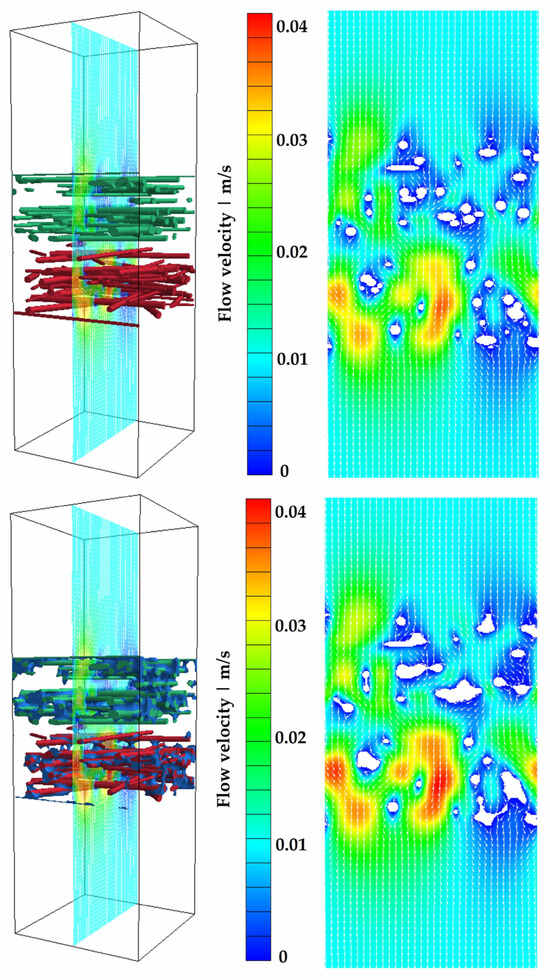
Figure 14.
Flow field for Model 1 at an inflow velocity of 0.01 m/s and at a surface charge density of 25 µC/m2. Top: dry case; bottom: WCP II (30.97% water content).
The free pore space becomes smaller due to the accumulated water volume, causing an increase in velocity within the fiber structure, as well as an increase in pressure drop, for the same inflow velocity. The water content for this case is 30.7% (see Table 8), which significantly exceeds the fiber volume fraction, given the high filter media porosity of 92.1% (see Table 7). Figure 15 shows the correlation between the increase in pressure drop (related to the pressure drop of the dry filter medium) and the pore filling by water (see Table 8) for the three models.
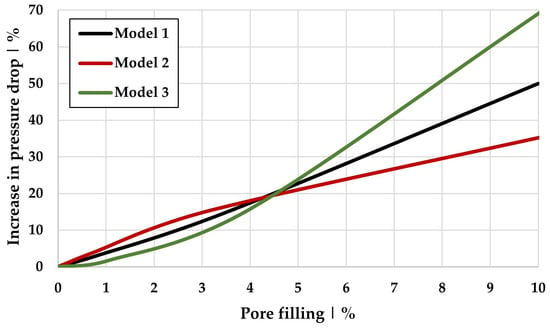
Figure 15.
Increase in pressure drop and pore filling for Models 1, 2, and 3 at a constant inflow velocity of 0.01 m/s.
Higher water content leads to greater pressure drop, further amplifying the increase in flow velocity. The extent to which the pressure drop increases depends not only on the pore filling but also on the size or size distribution of the fibers in the filter medium. Consequently, the reduction in the filter efficiency observed in simulations can be explained by both the weakened electric field and the increased flow velocity, both of which reduce particle residence time within the filter.
5. Conclusions
In this study, the impact of water content on the efficiency of electret filter media was investigated using Direct Numerical Simulation, complemented by experimental analysis of surface electrical potential. Three models (Models 1, 2, and 3) are intended to represent a small section of the filter material (different layers) in the mouth area of the FFP2 mask. This region is most susceptible to moisture accumulation due to breathing, speaking, and coughing while wearing the mask. Micro-Computed Tomography (µCT) imaging was employed to estimate the distribution of the liquid (water) within the fiber structure of the filter medium, and additional experimental investigations quantified the water contents. The imaging results showed that the liquid primarily accumulates in the contact points or at contact between fibers. In the performed simulations, only the case of deposition in the contact points was investigated. To facilitate analysis, a comparative investigation was conducted between dry and pre-saturated conditions. The deposition behavior of liquid droplets—comprising their impact on fiber surfaces and subsequent spatial distribution—was not modeled in this study. Instead, an ongoing research project aims to examine the effects of adsorption and wetting characteristics of various liquids and solvents on electret filter materials. Particular attention is also given to the temporal evolution of electric field attenuation as droplet accumulation progresses. Future simulations should explore the effects of deposition on fiber surfaces as well as the combined influence of both deposition mechanisms.
The attenuation of the electric field was estimated for the simulations by means of preliminary experimental investigations as a function of the water content and the permittivity of water. Measuring the surface charge density is experimentally challenging due to the non-homogeneous distribution of charge on the surface. Experimental measurements have nevertheless shown that the increase in water content results in a decrease in surface potential. Moreover, the measured surface potential captures the charge density of the entire structure including both fibers and air within the pores. To ensure realistic simulation conditions, surface charge simulation parameters were adjusted to 10, 25, and 50 µC/m2 based on prior studies and literature references concerning the surface charge density of polypropylene.
The simulation results reveal two significant effects. First, the deposition of water changes the pore volume, which in turn affects the pressure drop and flow velocity through the sample section. The increased flow velocity reduces the residence time of particles within the filter, thereby decreasing the probability of their separation. The second effect is the weakening of the electric field in the areas where water is present. Due to the increased permittivity of water compared to air, the strength of the electric field between the fibers decreases, which reduces the electrostatic deposition mechanisms (dielectrophoresis, Coulomb force, and mirror charge effect). As water content increases (WCP I, II, III), the filtration efficiency decreases—an effect that remains consistent across all three models (1, 2, and 3) irrespective of fiber size, porosity, or surface charge density. The accumulated water therefore significantly affects the investigated nonwoven layers. However, its negative impact can be compensated or even offset by increasing the surface charge density of the filter medium. For Model 1, the filtration efficiency for the dry case at a surface charge density of 25 µC/m2 is 90.03%. By doubling the surface charge density to 50 µC/m2, an efficiency of 90.96% is achieved despite the presence of water (for the WCP II case).
Author Contributions
Conceptualization, D.S.; methodology, D.S.; software, D.S.; validation, D.S.; formal analysis, D.S.; investigation, D.S.; resources, D.S.; data curation, D.S.; writing—original draft preparation, D.S.; writing—review and editing, D.S. and S.A.; visualization, D.S.; supervision, S.A.; project administration, D.S.; funding acquisition, S.A. All authors have read and agreed to the published version of the manuscript.
Funding
This research was funded by the Federal Ministry of Economic Affairs and Climate Action (BMWK) on the basis of a decision by the German Bundestag within the IGF project (22382 BG).
Institutional Review Board Statement
Not applicable.
Informed Consent Statement
Not applicable.
Data Availability Statement
The data presented in this study are available on request from the corresponding author. The data are not publicly available due to privacy.
Acknowledgments
The used simulation software DNSlab® (Direct Numerical Simulation laboratory) was provided by IT for Engineering (it4e) GmbH (Kaiserslautern, Germany).
Conflicts of Interest
The authors declare no conflicts of interest. The funders had no role in the design of the study; in the collection, analyses, or interpretation of data; in the writing of the manuscript; or in the decision to publish the results.
References
- Baron, P.A.; Kulkarni, P.; Willeke, K. (Eds.) Aerosol Measurement: Principles, Techniques, and Applications, 3rd ed.; Wiley: Hoboken, NJ, USA, 2011. [Google Scholar] [CrossRef]
- Hinds, W.C. Aerosol Technology; Wiley & Sons: New York, NY, USA, 1982. [Google Scholar]
- Baumgartner, H.P.; Löffler, F. The collection performance of electret filters in the particle size range 10 nm–10 μm. J. Aerosol Sci. 1986, 17, 438–445. [Google Scholar] [CrossRef]
- Wang, C.S. Electrostatic forces in fibrous filters—A review. Powder Technol. 2001, 118, 166–170. [Google Scholar] [CrossRef]
- Kerner, M.; Schmidt, K.; Hellmann, A.; Schumacher, S.; Pitz, M.; Asbach, C.; Ripperger, S.; Antonyuk, S. Numerical and experimental study of submicron aerosol deposition in electret microfiber nonwovens. J. Aerosol Sci. 2018, 122, 32–44. [Google Scholar] [CrossRef]
- Brown, R.C. Air Filtration: An Integrated Approach to the Theory and Applications of Fibrous Filters, 1st ed.; Pergamon Press: Oxford, UK, 1993; ISBN 9780080412740. [Google Scholar]
- Sanchez, A.; Hubbard, J.; Dellinger, J.; Servantes, B.L. Experimental Study of electrostatic aerosol filtration at moderate filter face velocities. Aerosol Sci. Technol. 2013, 47, 606–615. [Google Scholar] [CrossRef]
- Thakur, R.; Da, D.; Das, A. Electret Air Filters. Sep. Purif. Rev. 2013, 42, 87–129. [Google Scholar] [CrossRef]
- Tegge, G. Löffler, F.: Staubabscheiden. (Aus der Lehrbuchreihe Chemieingenieurwesen/Verfahrenstechnik). Georg Thieme Verlag, Stuttgart–New York 1988. ISBN 3-13-712201-5, 354 Seiten, mit 244 Abb. und 34 Tab. Kartoniert DM 84,–. Starch/Stärke 1989, 41, 122. [Google Scholar] [CrossRef]
- Ji, J.H.; Bae, G.N.; Kang, S.H.; Hwang, J. Effect of particle loading on the collection performance of an electret cabin air filter for submicron aerosols. J. Aerosol Sci. 2003, 34, 1493–1504. [Google Scholar] [CrossRef]
- Schumacher, S.; Jasti, R.; Asbach, C. Einfluss von Entladungsmethode und Aerosolmaterial auf die Abscheideeffizienz von Elektretfiltern. Gefahrstoffe-Reinhalt. Der Luft 2018, 78, 316–322. [Google Scholar]
- Kerner, M.; Schmidt, K.; Schumacher, S.; Asbach, C.; Antonyuk, S. Ageing of electret filter media due to deposition of submicron particles—Experimental and numerical investigations. Sep. Purif. Technol. 2020, 251, 117299. [Google Scholar] [CrossRef]
- Turnhout, J.V.; Hoeneveld, W.J.; Adamse, J.-W.C.; Rossen, L.M.V. Electret Filters for High-Efficiency and High-Flow Air Cleaning. IEEE Trans. Ind. Appl. 1981, IA-17, 240–248. [Google Scholar] [CrossRef]
- Brown, R.C. Electrically Charged Air Filters. KONA Powder Part. J. 1991, 9, 174–186. [Google Scholar] [CrossRef]
- Motyl, E.; Łowkis, B. Effect of air humidity on charge decay and lifetime of PP electret nonwovens. Fibres Text. East. Eur. 2006, 14, 39–42. [Google Scholar]
- Lee, M.; Otani, Y.; Namiki, N.; Emi, H. Prediction of Collection Efficiency of High-performance Electret Filters. J. Chem. Eng. Jpn. 2002, 35, 57–62. [Google Scholar] [CrossRef]
- Kim, J.; Hinestroza, J.; Jasper, W.; Barker, R. Effect of solvent exposure on the filtration performance of electrically charged polypropylene filter media. Text. Res. J. 2009, 79, 343–350. [Google Scholar] [CrossRef]
- Choi, H.-J.; Park, E.-S.; Kim, J.-U.; Kim, J.-U.; Lee, M.-H. Experimental study on charge dacy of electret filter due to organic solvant exposure. Aerosol Sci. Technol. 2015, 49, 977–983. [Google Scholar] [CrossRef]
- DIN EN 143:2017-08; Atemschutzgeräte-Partikelfilter-Anforderungen, Prüfung, Kennzeichnung; Deutsche und Englische Fassung EN 143:2017. Beuth Verlag GmbH: Berlin, Germany, 2017.
- DIN EN 149:2009-08; Atemschutzgeräte-Filtrierende Halbmasken zum Schutz gegen Partikeln-Anforderungen, Prüfung, Kennzeichnung; Deutsche Fassung EN_149:2001+A1:2009. Beuth Verlag GmbH: Berlin, Germany, 2009.
- Bourouiba, L. The Fluid Dynamics of Disease Transmission. Annu. Rev. Fluid Mech. 2021, 53, 473–508. [Google Scholar] [CrossRef]
- Papineni, R.S.; Rosenthal, F.S. The size distribution of droplets in the exhaled breath of healthy human subjects. J. Aerosol Med. 1997, 10, 105–116. [Google Scholar] [CrossRef]
- Johnson, G.R.; Morawska, L. The mechanism of breath aerosol formation. J. Aerosol Med. Pulm. Drug Deliv. 2009, 22, 229–237. [Google Scholar] [CrossRef]
- Malashenko, A.; Tsuda, A.; Haber, S. Propagation and breakup of liquid menisci and aerosol generation in small airways. J. Aerosol Med. Pulm. Drug Deliv. 2009, 22, 341–353. [Google Scholar] [CrossRef]
- Bagchi, S.; Basu, S.; Chaudhuri, S.; Saha, A. Penetration and secondary atomization of droplets impacted on wet facemasks. Phys. Rev. Fluids 2021, 6, 110510. [Google Scholar] [CrossRef]
- Sharma, S.; Pinto, R.; Saha, A.; Chaudhuri, S.; Basu, S. On secondary atomization and blockage of surrogate cough droplets in single-and multilayer face masks. Sci. Adv. 2021, 7, eabf0452. [Google Scholar] [CrossRef] [PubMed]
- Han, Z.Y.; Weng, W.G.; Huang, Q.Y. Characterizations of particle size distribution of the droplets exhaled by sneeze. J. R. Soc. Interface 2013, 10, 20130560. [Google Scholar] [CrossRef]
- Luckey, T.D. Introduction to intestinal microecology. Am. J. Clin. Nutr. 1972, 25, 1292–1294. [Google Scholar] [CrossRef] [PubMed]
- Wei, J.; Li, Y. Airborne spread of infectious agents in the indoor environment. Am. J. Infect. Control 2016, 44, S102–S108. [Google Scholar] [CrossRef]
- Morawska, L.; Cao, J. Airborne transmission of SARS-CoV-2: The world should face the reality. Environ. Int. 2020, 139, 105730. [Google Scholar] [CrossRef]
- Balazy, A.; Toivola, M.; Adhikari, A.; Sivasubramani, S.; Reponen, T.; Grinsphun, S. Do N95 respirators provide 95% protection level against airborne viruses, and how adequate are surgical masks? Am. J. Infect. Control. 2006, 34, 51–57. [Google Scholar] [CrossRef]
- Ahlert, B.; Hemke, G.; Hillemann, L.; Mueller, K.; Ripperger, S.; Stintz, M.; Voigt, T. Rückhaltevermögen von Atemschutzfiltern Gegenüber Biologischen Arbeitsstoffen—BGN/DrM-Zusammenfassung. 2008. Available online: https://www.fsa.de/fileadmin/user_upload/forschung/gefahrstoffe_und_mikrobiologie/zusammenfassung_filtermasken.pdf (accessed on 9 January 2025).
- Asadi, S.; Cappa, C.D.; Barreda, S.; Wexler, A.S.; Bouvier, N.M.; Ristenpart, W.D. Efficacy of masks and face coverings in controlling outward aerosol particle emission from expiratory activities. Sci. Rep. 2020, 10, 15665. [Google Scholar] [CrossRef] [PubMed]
- Lee, L.Y.K.; Lam, E.P.W.; Chan, C.K.; Chan, S.Y.; Chiu, M.K.; Chong, W.H.; Chu, K.W.; Hon, M.S.; Kwan, L.K.; Tsang, K.L.; et al. Practice and technique of using face mask amongst adults in the community: A cross-sectional descriptive study. BMC Public Health 2020, 20, 948. [Google Scholar] [CrossRef]
- Leffler, C.T.; Ing, E.; Lykins, J.D.; Hogan, M.C.; McKeown, C.A.; Grzybowski, A. As-sociation of Country-wide Coronavirus Mortality with Demographics, Testing, Lockdowns, and Public Wearing of Masks. Am. J. Trop. 2020, 103, 2400. [Google Scholar] [CrossRef]
- Roberge, R.J.; Kim, J.-H.; Benson, S.M. Absence of consequential changes in physiological, thermal and subjective responses from wearing a surgical mask. Respir. Phyiology Neurobiol. 2012, 181, 29–35. [Google Scholar] [CrossRef]
- Roberge, R.J.; Bayer, E.; Powell, J.B.; Coca, A.; Roberge, M.R.; Benson, S.M. Effect of Exhaled Moisture on Breathing Resistance of N95 Filtering Facepiece Respirators. Ann. Occup. Hyg. 2010, 54, 671–677. [Google Scholar] [CrossRef]
- Mahdavi, A.; Haghighat, F.; Bahloul, A.; Brochot, C.; Ostiguy, C. Particle Loading Time and Humidity Effects on the Efficiency of an N95 Filtering Facepiece Respirator Model under Constant and Inhalation Cyclic Flows. Ann. Occup. Hyg. 2015, 59, 629–640. [Google Scholar] [CrossRef]
- Zhang, T.; Fu, Z.; Zhou, H. Experimental Study of the Effect of Humidity on Air Filter Material Performance. Energies 2023, 16, 3626. [Google Scholar] [CrossRef]
- Otani, Y.; Emi, H.; Mori, J. Initial Collection Efficiency of Electret Filter and Its Durability for Solid and Liquid Particles. KONA Powder Part. J. 1993, 11, 207–214. [Google Scholar] [CrossRef]
- Stoll, D.; Antonyuk, S. Influence of Humidity on FFP Masks with Electret Filter Media Under Real-Life Wearing Conditions. Atmosphere 2025, 16, 62. [Google Scholar] [CrossRef]
- Kaminski, M.; Jakub, M.G.; Sobiech, P.; Kozikowski, P.; Jankowski, T. Pressure Drop Dynamics during Filtration of Mixture Aerosol Containing Water, Oil, and Soot Particles on Nonwoven Filters. Polymers 2023, 15, 1787. [Google Scholar] [CrossRef]
- Schwarz, A.D.; König, L.; Meyer, J.; Dittler, A. Impact of water droplet and humidity interaction with soluble particles on the operational performance of surface filters in gas cleaning applications. J. Aerosol Sci. 2020, 142, 105523. [Google Scholar] [CrossRef]
- Schmidt, K. Dreidimensionale Modellierung von Filtermedien und Simulation der Partikelabscheidung auf der Mikroskala. Ph.D. Thesis, University of Kaiserslautern, Kaiserslautern, Germany, 2011. [Google Scholar]
- Kerner, M.; Schmidt, K.; Schumacher, S.; Asbach, C.; Antonyuk, S. Electret Filters—From the Influence of Discharging Methods to Optimization Potential. Atmosphere 2021, 12, 65. [Google Scholar] [CrossRef]
- Ueda, M.; Fukasawa, T.; Ishigami, T.; Fukui, K. Effect of Surface Wettability on Droplet Coalescence and Pressure Drop in a Fibrous Filter: Direct Numerical Simulation Coordinated with X-ray Computed Tomography Images. Ind. Eng. Chem. Res. 2021, 60, 4168–4179. [Google Scholar] [CrossRef]
- Straube, C.; Meyer, J.; Dittler, A. Identification of Deposited Oil Structures on Thin Porous Oil Mist Filter Media Applying µ-CT Imaging Technique. Separations 2021, 8, 193. [Google Scholar] [CrossRef]
- Straube, C.; Meyer, J.; Dittler, A. Investigation of the local oil distribution on oleophilic mist filters applying X-ray micro-computed tomography. Sep. Purif. Technol. 2023, 311, 123279. [Google Scholar] [CrossRef]
- Wang, X.; Chen, L.; Bonaccurso, E. Comparison of spontaneous wetting and drop impact dynamics of aqueous surfactant solutions on hydrophobic polypropylene surfaces: Scaling of the contact radius. Colloid Polym. Sci. 2014, 293, 257–265. [Google Scholar] [CrossRef]
- Tabti, B.; Dascalescu, L.; Plopeanu, M.; Antoniu, A.; Mekideche, M. Factors that influence the corona charging of fibrous dielectric materials. J. Electrost. 2009, 67, 193–197. [Google Scholar] [CrossRef]
- Kerner, M. Abscheidung Submikroner Aerosolpartikeln in Elektrostatisch Ausgerüsteten Vliesstoffen—Experimentelle und Numerische Untersuchungen; Dissertation, Schriftreihe des Lehrstuhls für Mechanische Verfahrenstechnik der TU Kaiserslautern; Technische Universität Kaiserslautern: Kaiserslautern, Germany, 2022; Volume 27, ISBN 978-3-95974-172-9. [Google Scholar]
- Plopeanu, M.C.; Dascalescu, L.; Yahiaoui, B.; Antoniu, A.; Hulea, M.; Notingher, P.V. Repartition of Electric Potential at the Surface of Nonwoven Fabrics for Air Filtration. IEEE Trans. Indutry Appl. 2012, 48, 851–856. [Google Scholar] [CrossRef]
- Puderbach, V.; Schmidt, K.; Antonyuk, S. A Coupled CFD-DEM Model for Resolved Simulation of Filter Cake Formation During Solid-Liquid Separation. Processes 2021, 9, 826. [Google Scholar] [CrossRef]
- Tang, M.; Thompson, D.; Chang, D.-Q.; Chen, S.-C.; Pui, D.Y.H. Filtration efficiency and loading characteristics of PM2.5 through commercial electret filter media. Sep. Purif. Technol. 2018, 195, 101–109. [Google Scholar] [CrossRef]
- Nifuku, M.; Zhou, Y.; Kisiel, A.; Kobayashi, T.; Katoh, H. Charging characteristics for electret filter materials. J. Electrost. 2001, 51–52, 200–205. [Google Scholar] [CrossRef]
- Chorin, A.J. A numerical method for solving incompressible viscous flow problems. J. Comput. Phys. 1967, 2, 12–26. [Google Scholar] [CrossRef]
- Stratton, J.A. A Classic Reissue—Electromagnetic Theory; IEEE Press: Piscataway, NJ, USA; McGraw-Hill: New York, NY, USA, 1941; ISBN 13 978-0-470-13153-4. [Google Scholar]
- Metaxas, A.C.; Meredith, R.J. Industrial Microwave Heating; IEE Power Engineering Series; Peter Peregrinus: London, UK, 1983; Volume 4, ISBN 0-906048-89-3. [Google Scholar]
- Wiedensohler, A. An approximation of the bipolar charge distribution for particles in the submicron size range. J. Aerosol Sci. 1988, 19, 387–389. [Google Scholar] [CrossRef]
- Von Hippel, A. Dielectric Materials and Applications, 2nd ed.; Technology Press: Boston, MA, USA, 1954; Artech House: Boston, MA, USA, 1995; ISBN 0-89006-805-4. [Google Scholar]
Disclaimer/Publisher’s Note: The statements, opinions and data contained in all publications are solely those of the individual author(s) and contributor(s) and not of MDPI and/or the editor(s). MDPI and/or the editor(s) disclaim responsibility for any injury to people or property resulting from any ideas, methods, instructions or products referred to in the content. |
© 2025 by the authors. Licensee MDPI, Basel, Switzerland. This article is an open access article distributed under the terms and conditions of the Creative Commons Attribution (CC BY) license (https://creativecommons.org/licenses/by/4.0/).