Article

Remediation Effects of Potamogeton crispus on Nitrogen-Loaded Water Bodies and Its Greenhouse Gas Emission Mechanisms

by
Xiaoyi Li
1,
Xiaoxiu Lun
1,*,
Jianzhi Niu
2,
Lumin Zhang
1,
Bo Wu
1 and
Xinyue Wang
1
1
School of Environmental Science and Engineering, Beijing Forestry University, 35 Qinghua East Road, Haidian District, Beijing 100083, China
2
State Key Laboratory of Efficient Production of Forest Resources, Beijing Forestry University, Beijing 100083, China
*
Author to whom correspondence should be addressed.
Atmosphere 2025, 16(7), 803; https://doi.org/10.3390/atmos16070803
Submission received: 16 May 2025 / Revised: 18 June 2025 / Accepted: 27 June 2025 / Published: 1 July 2025
(This article belongs to the Special Issue Interactions of Urban Greenings and Air Pollution)

Abstract

Potamogeton crispus (P. crispus), with strong nitrogen uptake capacity, plays an important ecological role during winter and early spring when most aquatic plants are inactive. Its presence can also influence microbial denitrification in sediments by regulating oxygen levels and organic carbon availability. In this study, an indoor hydroponic simulation system was used to systematically evaluate the effects of P. crispus under different nitrogen-loading conditions on nitrogen removal from water, changes in sediment carbon and nitrogen fractions, microbial community structure, and greenhouse gas fluxes. The results showed that P. crispus effectively removed TN, NH4+-N, NO3-N, and NO2-N, maintaining strong denitrification capacity even under high-nitrogen loading. Under all nitrogen conditions, TN removal exceeded 80%, while NH4+-N and NO3-N removal efficiencies surpassed 90%, with effective suppression of NO2-N accumulation. Rhizosphere-mediated regulation by P. crispus enhanced the transformation and stabilization of DOC and NO3-N in sediments, while also mitigating nitrogen-induced disturbances to carbon–nitrogen balance. The plant also exhibited strong CO2 uptake capacity, low CH4 emissions with a slight increase under higher nitrogen loading, and N2O fluxes that were significantly affected by nitrogen levels—showing negative values under low nitrogen and sharp increases under high-nitrogen conditions. Correlation analyses indicated that CO2 and N2O emissions were mainly regulated by microbial taxa involved in carbon and nitrogen transformation, while CH4 emissions were primarily driven by methanogenic archaea and showed weaker correlations with environmental factors. These findings highlight the importance of water restoration during low-temperature seasons and provide a theoretical basis for integrated wetland management strategies aimed at coordinated pollution reduction and carbon mitigation.

1. Introduction

Wetlands are often referred to as the “kidneys of the Earth” and serve as vital transitional zones between terrestrial and aquatic ecosystems. They play irreplaceable ecological roles in water purification, carbon sequestration, biodiversity conservation, and climate regulation. Although wetlands occupy only approximately 6–9% of the Earth’s terrestrial surface [1], they store around 20–30% of global carbon [2,3], with a per-unit-area carbon sequestration capacity far exceeding that of forest and grassland ecosystems [4,5]. Consequently, wetlands are considered a key nature-based solution in global carbon neutrality strategies. However, wetlands are also significant sources of greenhouse gas (GHG) emissions, particularly methane (CH4) and nitrous oxide (N2O). The global warming potential (GWP) of CH4 is estimated to be 28–34 times that of CO2 [6], while N2O has a GWP of 265–298 times [7], which can partially offset the carbon sink benefits of wetlands.
Wetland plants are critical biological drivers in coordinating water purification and carbon–nitrogen cycling. As the principal agents of wetland self-purification, they effectively remove pollutants from the water through mechanisms such as physical filtration, biological uptake, and rhizosphere-mediated microbial regulation [8]. In addition, through photosynthesis, wetland plants assimilate CO2 and synthesize organic matter, thereby promoting carbon fixation within plant tissues and sediments and enhancing the wetland’s carbon sink capacity [9].
The Baiyangdian wetland, the largest freshwater lake wetland in North China, serves as an important ecological barrier and regulatory system in the region. However, in recent years, Baiyangdian has been subjected to increasing nitrogen pollution pressure. Tributaries such as the Fu River discharge substantial quantities of pollutants into the lake, intensifying nitrogen loading [10,11]. Combined with a reduction in water inflow, this has led to further degradation of water quality [12,13]. Monitoring data from the past three decades show that the water quality in Baiyangdian has frequently fluctuated between Class IV and inferior Class V, according to the Environmental Quality Standards for Surface Water of China (GB 3838-2002) [14], indicating a continuous decline in the wetland’s self-purification capacity. Due to eutrophication and anthropogenic disturbances, the overall structure of submerged plant communities in Baiyangdian has been severely disrupted. However, cold-season species with strong ecological adaptability, such as P. crispus, have continued to maintain dominance during winter and spring [15,16]. Against this backdrop, restoring wetland vegetation and enhancing both water purification and carbon sequestration functions have become critical tasks for the ecological recovery and sustainable development of Baiyangdian.
Among native species, P. crispus is the dominant submerged macrophyte during the cold season in Baiyangdian. It exhibits several ecological advantages, including a long growth period, strong cold tolerance, and high nutrient uptake capacity, making it particularly suitable for water remediation during the winter and spring when most aquatic plants are inactive. Studies have shown that P. crispus can significantly reduce total nitrogen (TN) concentrations in the water, improve transparency, and enhance water quality [12,17,18].
Although the nitrogen removal capacity of P. crispus has been confirmed in numerous studies, most have focused on simplified water quality conditions or relatively short experimental durations, with limited attention to its nutrient removal mechanisms, carbon–nitrogen interactions, and greenhouse gas emissions. In particular, the synergistic effects of P. crispus in simultaneously reducing pollution and mitigating carbon emissions have not been fully quantified. To fill this gap, this study selects P. crispus, the dominant cold-season species in Baiyangdian, and constructs a controlled hydroponic simulation system. The experiment is conducted during its active growing season (February to April) to evaluate its effects on nitrogen removal, sediment physicochemical characteristics, greenhouse gas emissions, and microbial community structure, as well as sediment physicochemical properties. Our goal is to provide scientific evidence supporting the seasonal role of P. crispus in early-stage ecological restoration. While P. crispus is not a year-round solution, it contributes significantly to a multi-species, seasonally integrated framework that enhances the long-term sustainability of wetland remediation.

2. Materials and Methods

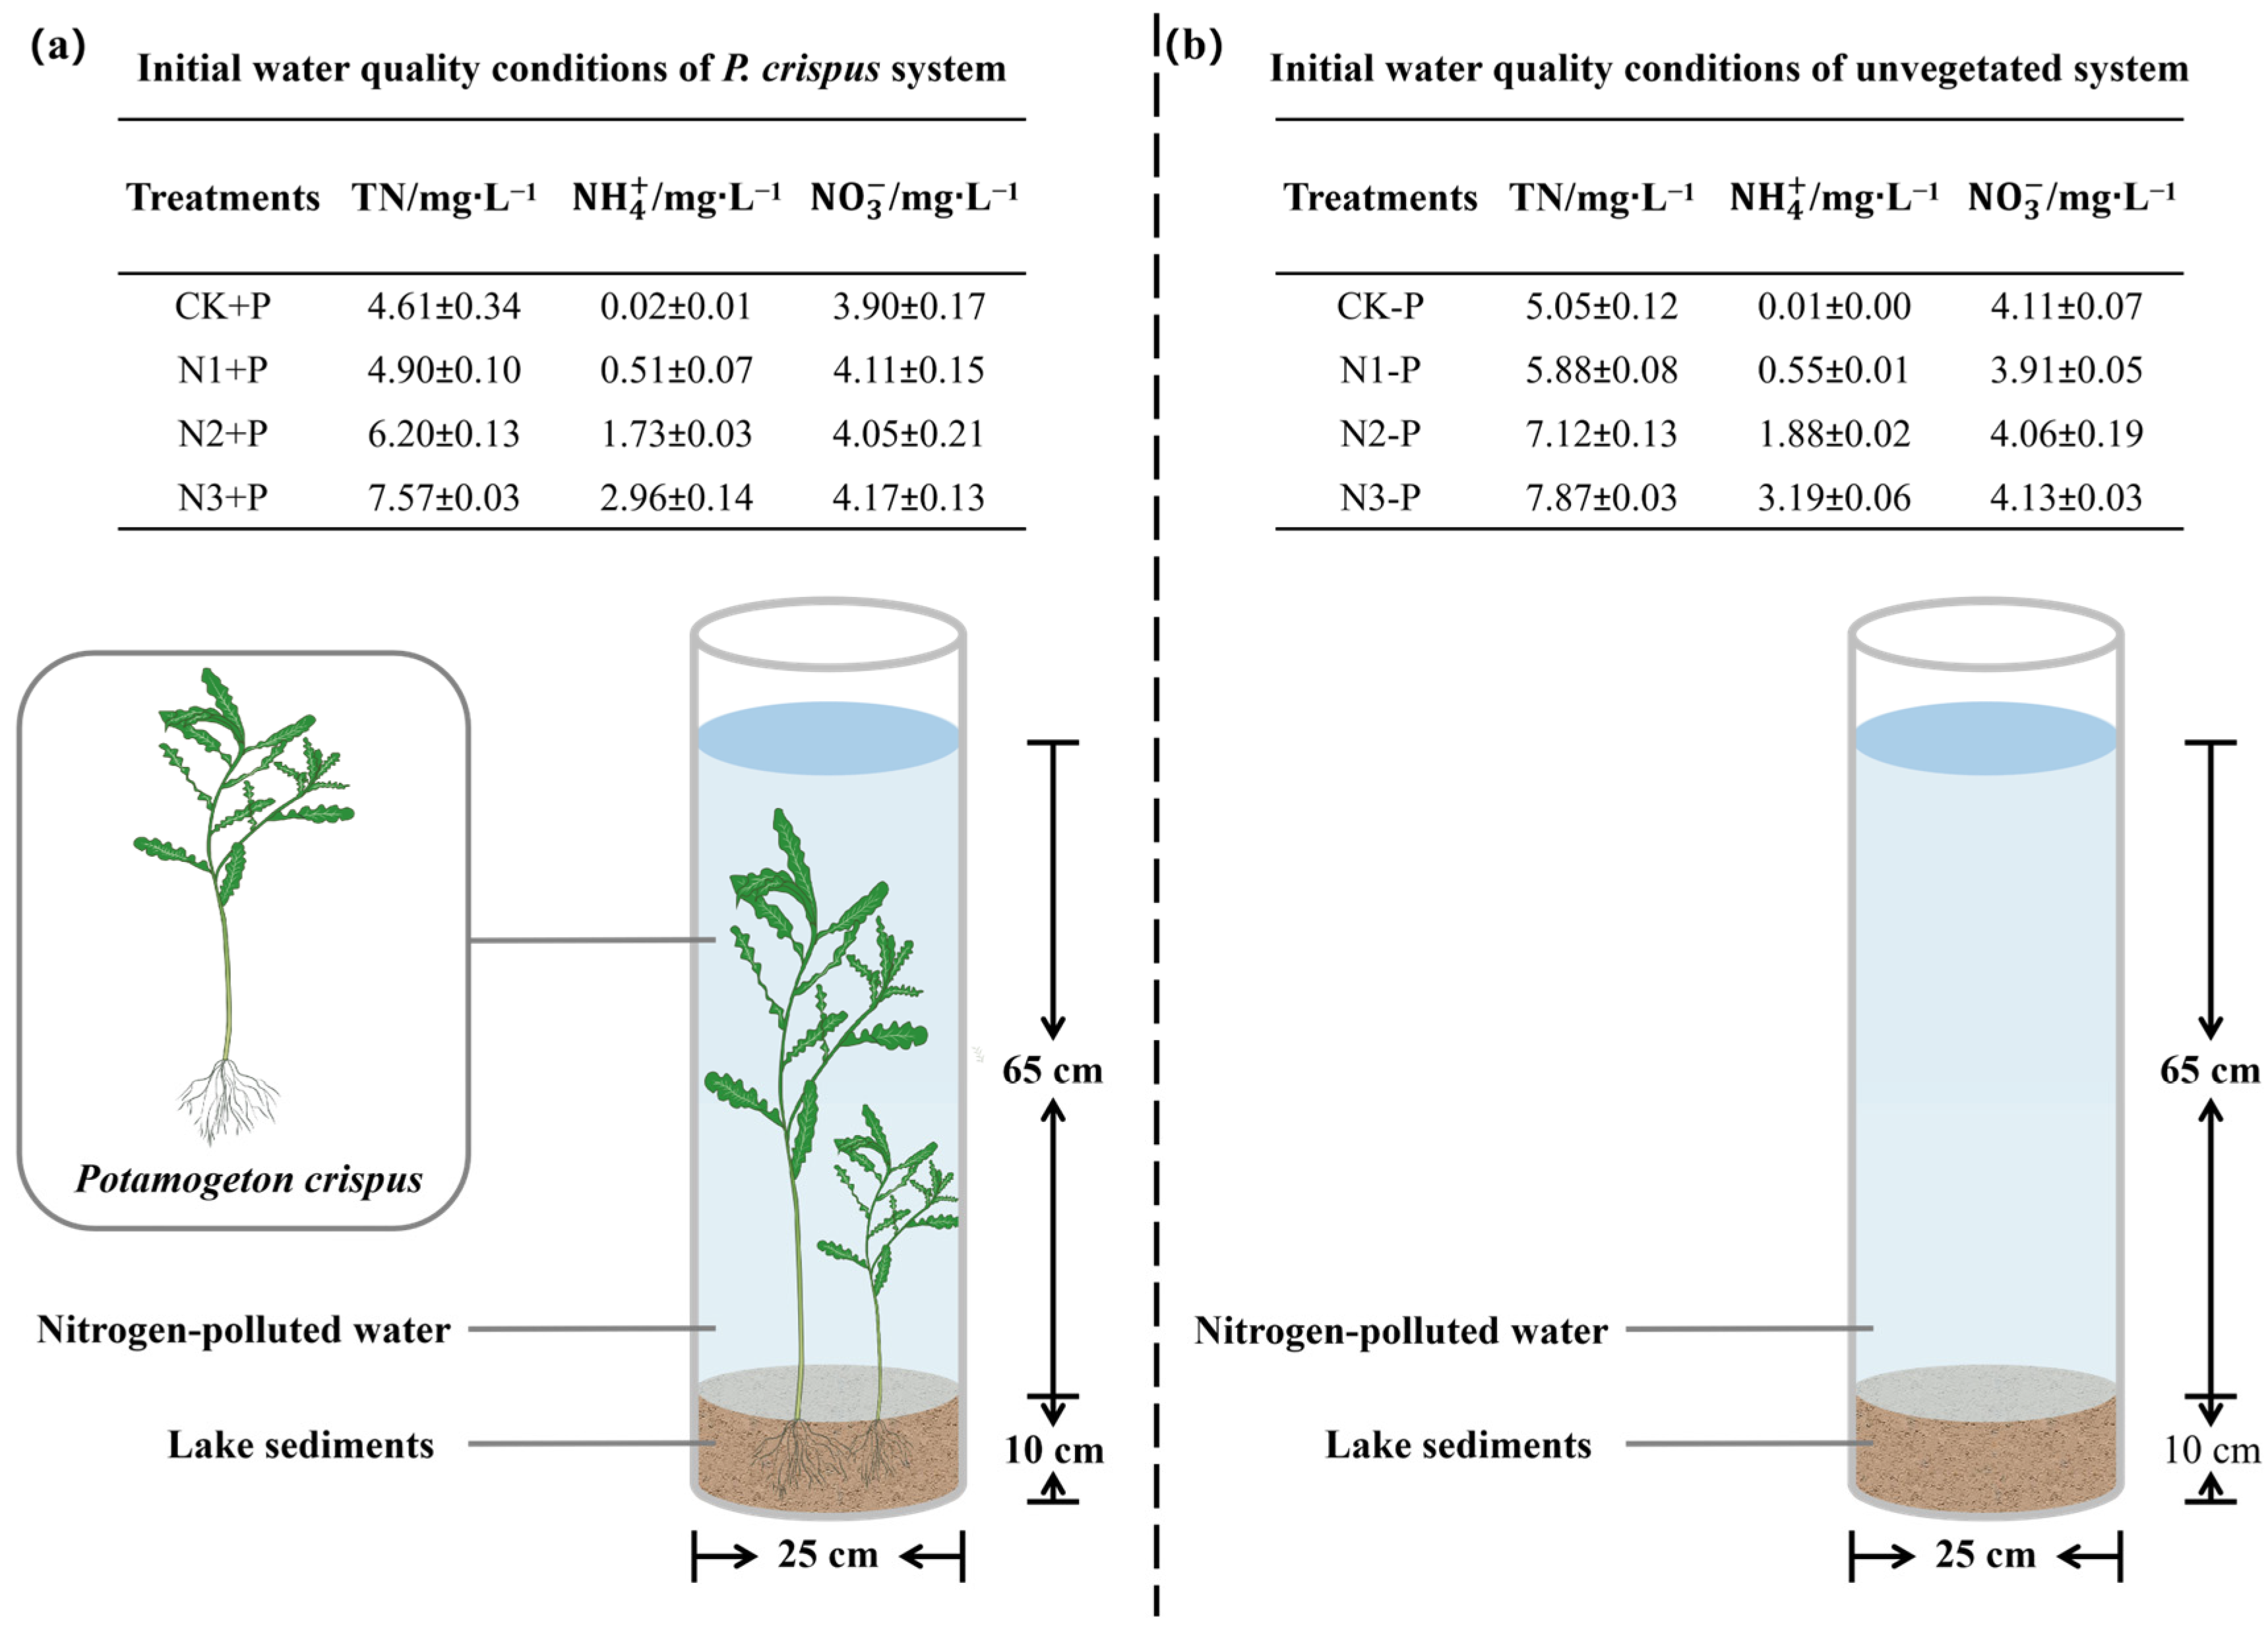
2.1. Expermental Site and Expermental Design

The experiment took place from February to April 2024 in a three-hectare greenhouse at Beijing Forestry University. The experimental plant, P. crispus, a cold-season, submerged macrophyte, came from Baiyangdian Lake in North China. After acclimating in a nutrient solution for one week, we selected mature plants with uniform morphological traits and healthy growth status. We rinsed them with deionized water, trimmed them to a uniform height of 35 cm, and blotted off excess surface water before using them as planting materials.
To simulate four nitrogen pollution gradients based on different eutrophication levels in Baiyangdian Lake, we adjusted the ammonium nitrogen (NH4+-N) input in the planting system, corresponding to four treatments: CK (Control group), N1 (Low nitrogen group), N2 (Moderate nitrogen group), and N3 (High nitrogen group). The experiment included two systems: P. crispus system (Figure 1a) and unvegetated system (Figure 1b). Each experimental unit consisted of a cylindrical polycarbonate tank (25 cm in diameter and 1 m in height). The tanks were arranged in two north–south rows to ensure uniform light exposure. We collected sediment from the Nanjiaozhuang national monitoring site in Baiyangdian Lake (Table 1). After removing large solid debris, such as stones and plastics, we homogenized the sediment through thorough mixing and evenly distributed it into each planting unit. To minimize water loss due to evaporation, distilled water was added every five days to maintain a stable water level.

2.2. Sampling and Test

Gas samples and water samples of each microscopic system were collected in turn during 9:00–12:00 at 1, 4, 8, 12, 17, 21, 25, 30, 34, 40, 50, and 66 days. Notably, the experiment was intentionally limited to 66 days to align with the plant’s peak performance period and to avoid confounding effects of plant senescence and decomposition, which are known to release nutrients. During each sampling procedure, gas samples were collected following the principle of a closed static chamber. The dissolved oxygen (DO) concentration in water was then measured using a portable multiparameter water quality analyzer (Multi 3630 IDS, WTW, Weilheim, Germany) at a depth of approximately 10 cm below the water surface and near the center of the reactor. Subsequently, water samples were collected in 250 mL polyethylene bottles. All samples were analyzed within 24 h. Gas samples were examined for CO2, CH4, and N2O using an Agilent 7890A gas chromatograph, while water samples were analyzed with a Lianhua multiparameter water quality analyzer (LH-3BA, Lianhua Technology, Co., Ltd., Beijing, China). The water quality parameters measured included TN, NH4+-N, nitrate nitrogen (NO3-N), and nitrite nitrogen (NO2-N).
The emission flux of greenhouse gases refers to the quantity of greenhouse gases released per unit area per unit time. The greenhouse gas emission flux is calculated using the following equation:
F = M V × H × 273 T + 273 × c t ,
where F is the greenhouse gas emission flux (mg·m−2·h−1), M is the molecular weight of the greenhouse gas (g·mol−1), V is the molar volume of the greenhouse gas under standard conditions (L·mol−1), c t represents the rate of change in greenhouse gas concentration (mg·L−1·h−1), T is the temperature inside the static chamber (°C), and H is the effective height of the static chamber (m).
At the end of the plant hydroponic cycle, soil samples were collected using a plum-blossom sampling method from a depth of 0–10 cm. Immediately after collection, samples were placed in sterile plastic bags, stored with ice packs, and transported to the laboratory. One portion of the sediment sample was stored at 4 °C and air-dried for fundamental physicochemical property analysis. The remaining portion was stored at −80 °C in an ultra-low-temperature freezer for 16S rRNA sequencing.

2.3. Data Analysis

In this study, data were statistically analyzed using Excel 2021 and IBM SPSS Statistics 2022. Results are presented as mean ± standard error deviation. One-way analysis of variance (ANOVA) was performed using the least significant difference (LSD) method, with significance defined at p < 0.05. Bar charts and line graphs were generated using Origin 2025. Microbial community composition and diversity, as well as network analyses of correlations between environmental factors and bacterial or archaeal communities, were visualized using packages implemented in R Studio 2024.04.1+748.

3. Results and Discussion

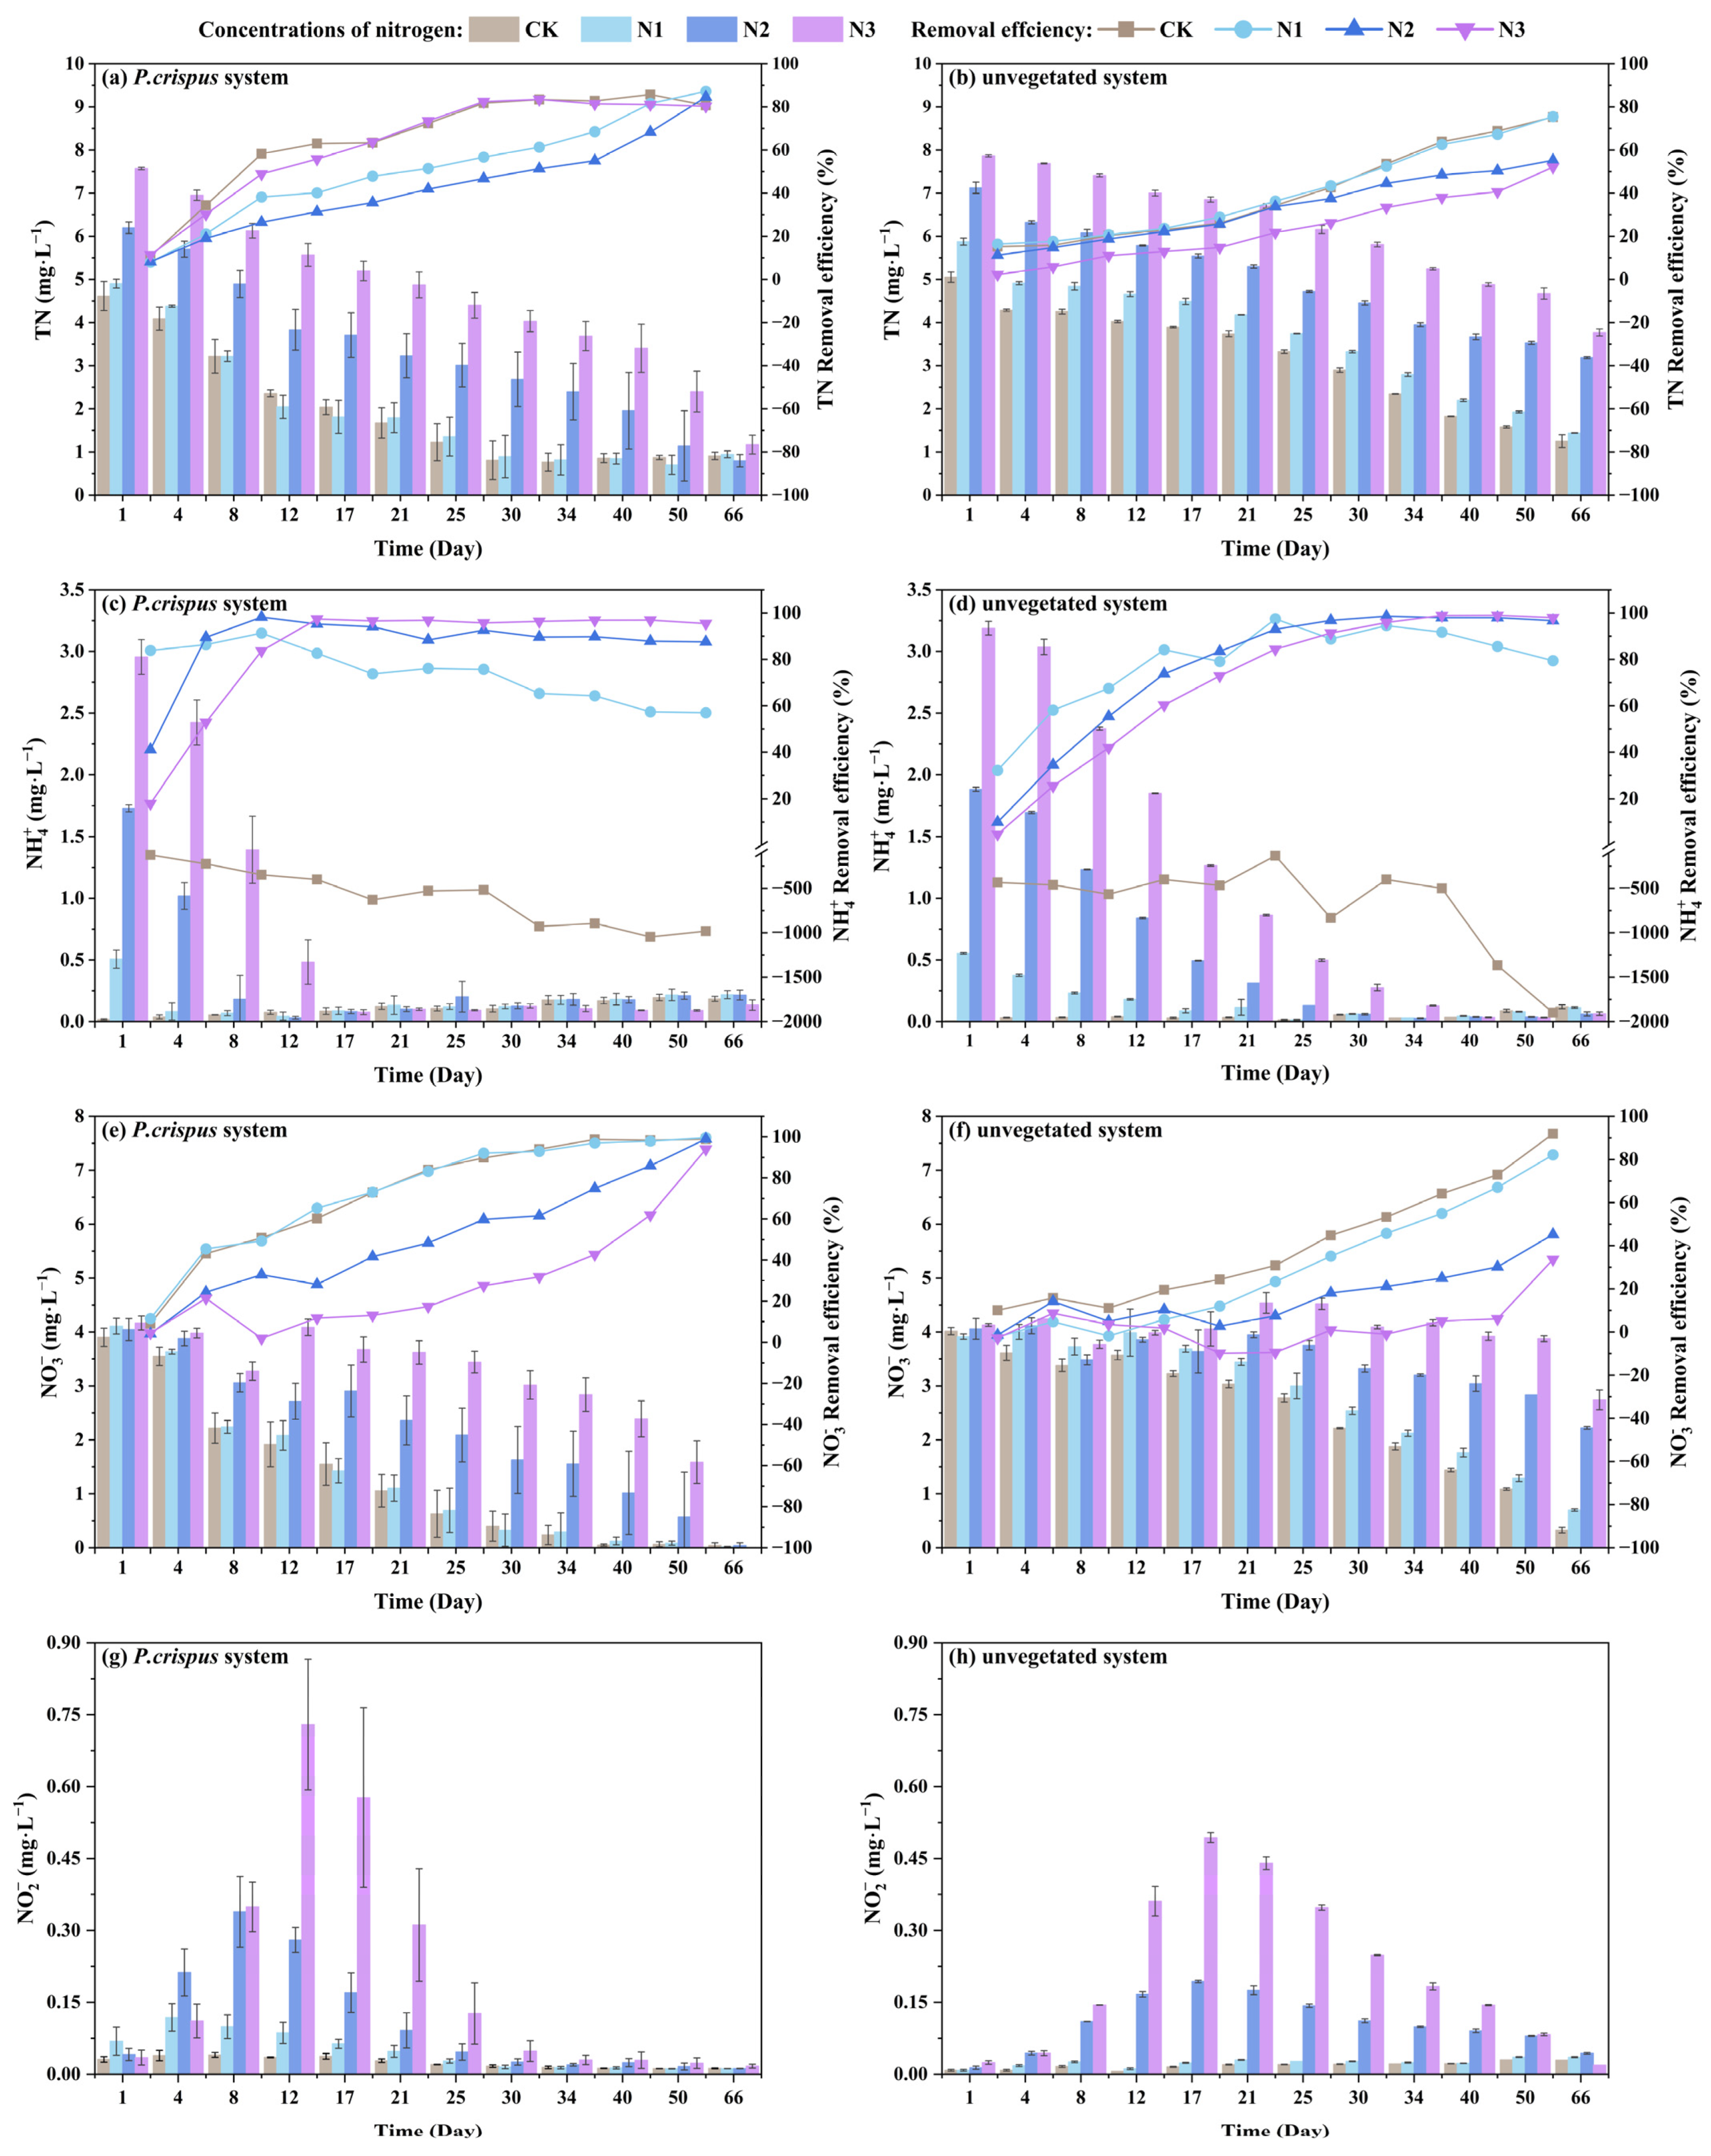
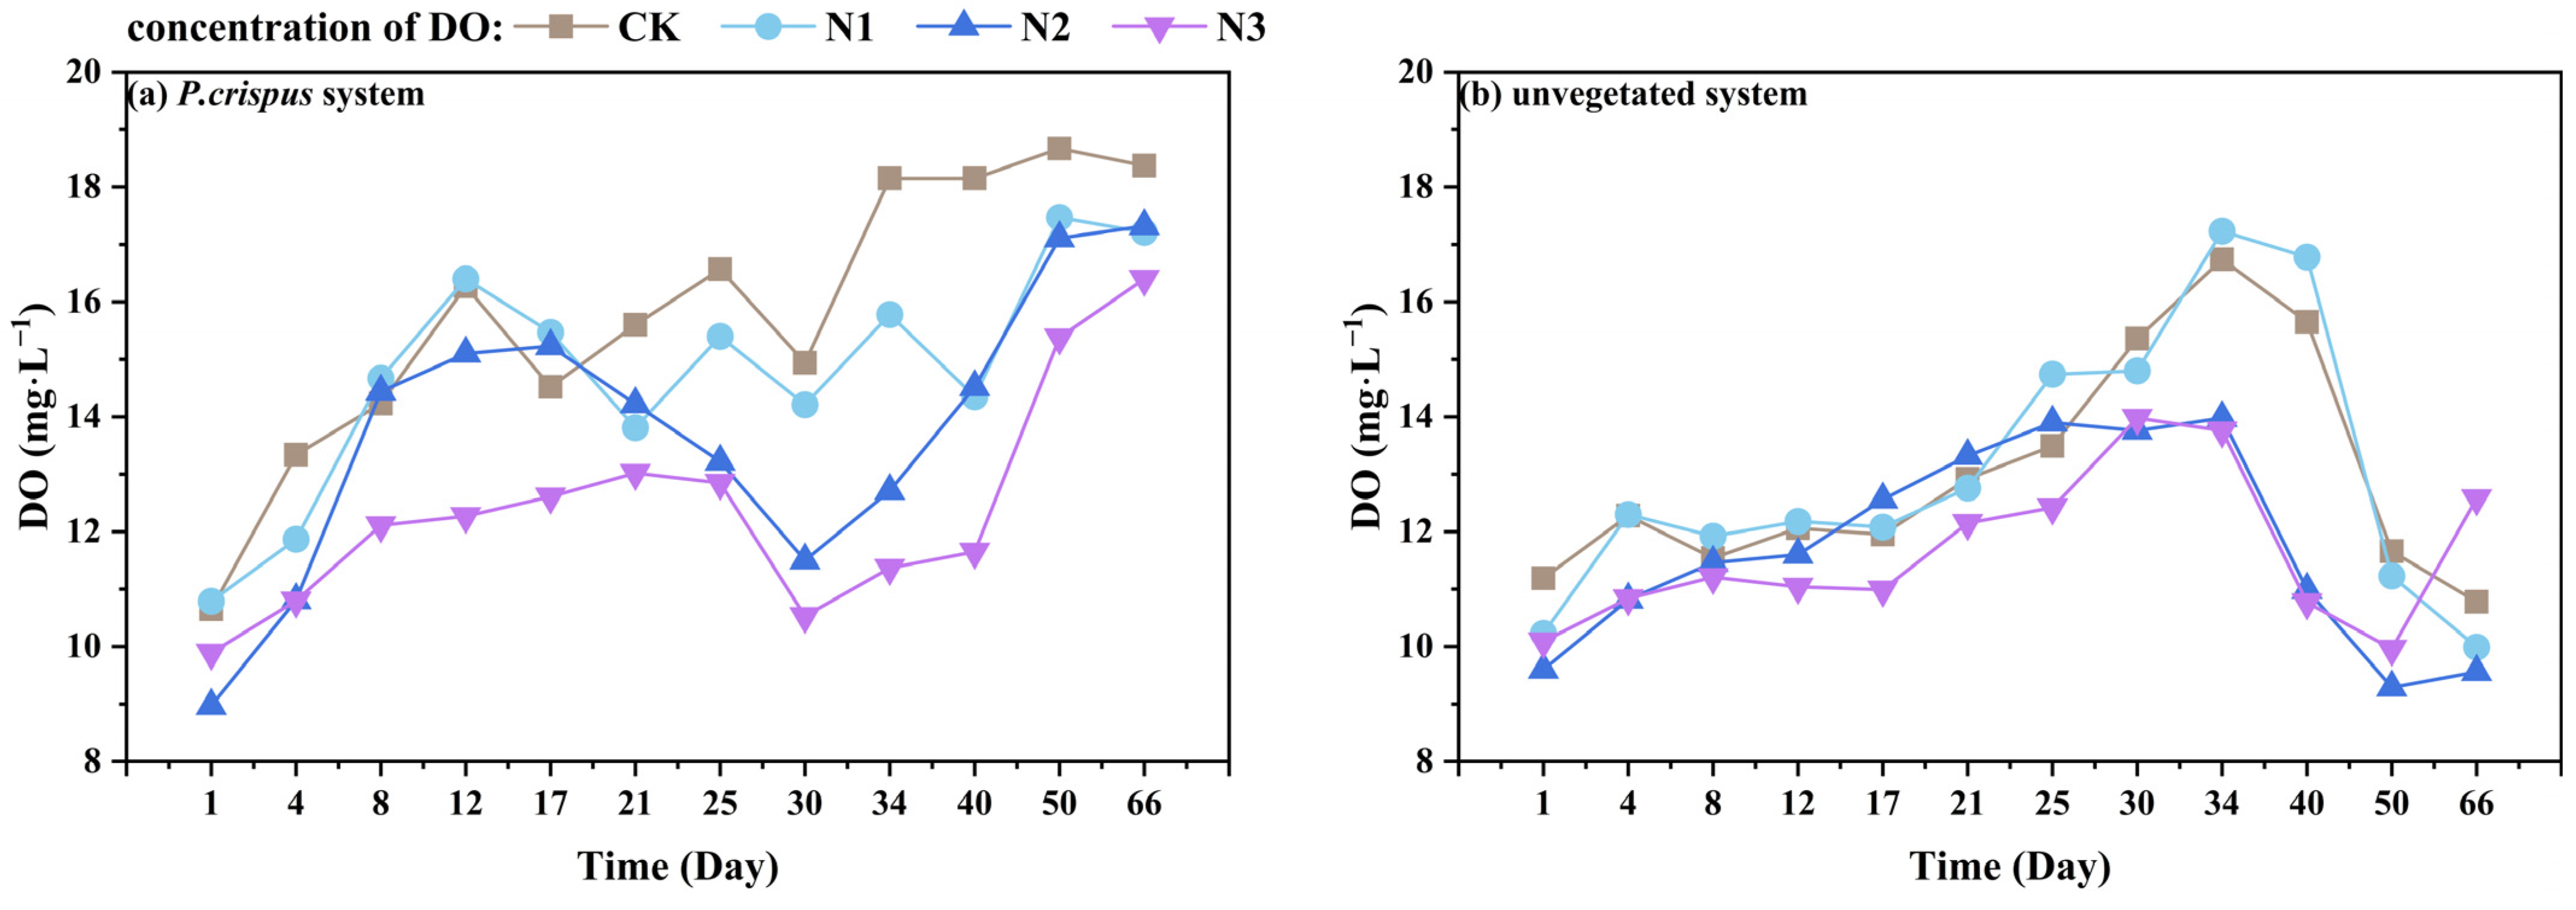
3.1. The Nitrogen Removal Efficiency of P. crispus in Water Body

Under different nitrogen-loading conditions, the TN concentrations in both the P. crispus system and the unvegetated system showed a decreasing trend over the course of the experiment (Figure 2). Overall, the TN removal efficiency of the P. crispus system was significantly higher than that of the unvegetated system. By the end of the experiment, the TN removal rates of all treatment groups exceeded 80%, demonstrating the strong nitrogen removal capacity of P. crispus. At the end of the experiment, the TN removal rates for the CK+P, N1+P, N2+P, and N3+P groups in the P. crispus system were 80.29%, 80.72%, 87.15%, and 84.52%, respectively. In comparison, the corresponding rates for the unvegetated CK–P, N1–P, N2–P, and N3–P groups were only 75.25%, 75.47%, 55.24%, and 52.07%. These results indicate that the presence of P. crispus enhanced TN removal rates under varying nitrogen loads by 5.04, 5.25, 31.91, and 32.45 percentage points, corresponding to relative increases of 6.70%, 6.96%, 57.78%, and 62.33%, respectively. Notably, the improvement was particularly pronounced under high-nitrogen loading (N2 and N3 treatments), indicating that P. crispus exhibited superior nitrogen removal capacity under high-nitrogen conditions.
Under different nitrogen-loading conditions, both the P. crispus system and the unvegetated system demonstrated effective removal of NH4+-N (Figure 2). In the P. crispus system, the N2+P and N3+P groups reached their maximum removal rates as early as day 12, achieving 98.21% and 97.39%, respectively. In contrast, the corresponding unvegetated groups, N2–P and N3–P, reached their peak removal rates on days 34 and 50, with values of 98.60% and 99.00%, respectively. These results indicate that the presence of P. crispus significantly accelerated the removal process of NH4+-N from the water bodies.
The P. crispus system demonstrated superior NO3-N removal efficiency and was capable of achieving high removal rates within a shorter time period (Figure 2). Under conditions of low NH4+-N availability, P. crispus has been reported to exhibit a preferential uptake of NO3-N [17]. Consequently, under low-nitrogen loading, NO3-N concentrations in the P. crispus system decreased markedly between days 30 and 34, with removal rates reaching 98.88% and 99.58%, respectively. Compared to the unvegetated system, these removal rates were 6.98 and 17.44 percentage points higher, corresponding to relative increases of 7.60% and 21.23%. These results suggest that P. crispus can significantly enhance NO3-N removal efficiency even under low-nitrogen-loading conditions.
The concentration of NO2-N in the water exhibited a dynamic pattern characterized by an initial increase followed by a subsequent decrease. Compared to the unvegetated system, the P. crispus system showed a higher peak accumulation of NO2-N. However, the duration of this peak was shorter, and the degradation rate was faster. Notably, under high-nitrogen-loading conditions, the NO2-N concentration in the unvegetated system remained elevated at the end of the experiment. These findings suggest that the nitrogen transformation rate in the unvegetated system may be relatively lower.
The presence of P. crispus and varying nitrogen-loading conditions had significant effects on nitrogen removal in water body, potentially related to dissolved oxygen (DO) dynamics. DO levels remained relatively high throughout the experiment (Figure 3), particularly in the P. crispus system, where plant photosynthesis enhanced oxygen availability. The elevated DO may have stimulated the metabolic activity of ammonia-oxidizing bacteria (AOB), facilitating the conversion of NH4+-N to NO2-N and leading to a transient accumulation of NO2-N. However, the presence of NO2-N under high DO levels suggests that DO alone may not fully explain nitrite dynamics. Other factors, such as the abundance and activity of nitrite-oxidizing bacteria (NOB), temperature, pH, and substrate concentrations, likely influenced the rate of NO2-N oxidation to NO3-N. As the experiment progressed, rising DO levels may have improved conditions for NOB growth, accelerating the conversion of NO2-N to NO3-N and resulting in a subsequent decline in NO2-N concentrations.
Moreover, P. crispus may have directly absorbed nitrogen, reducing the accumulation of NO3-N and lowering the potential for reverse reduction from NO3-N to NO2-N. These synergistic effects—plant uptake, enhanced DO levels, and microbial activity—contributed to more effective nitrification and nitrogen removal in the vegetated system. In contrast, the unvegetated system showed relatively lower DO levels, which may have suppressed microbial activity, slowed the NO2-N to NO3-N conversion, and delayed NO2-N degradation, especially under high nitrogen loading conditions.
In summary, the P. crispus system enhanced the efficiency of both stages of nitrification by increasing DO levels and further regulated nitrogen removal through plant uptake. Collectively, these processes significantly optimized the dynamic behavior of NO2-N, contributing to more efficient and stable nitrogen removal.

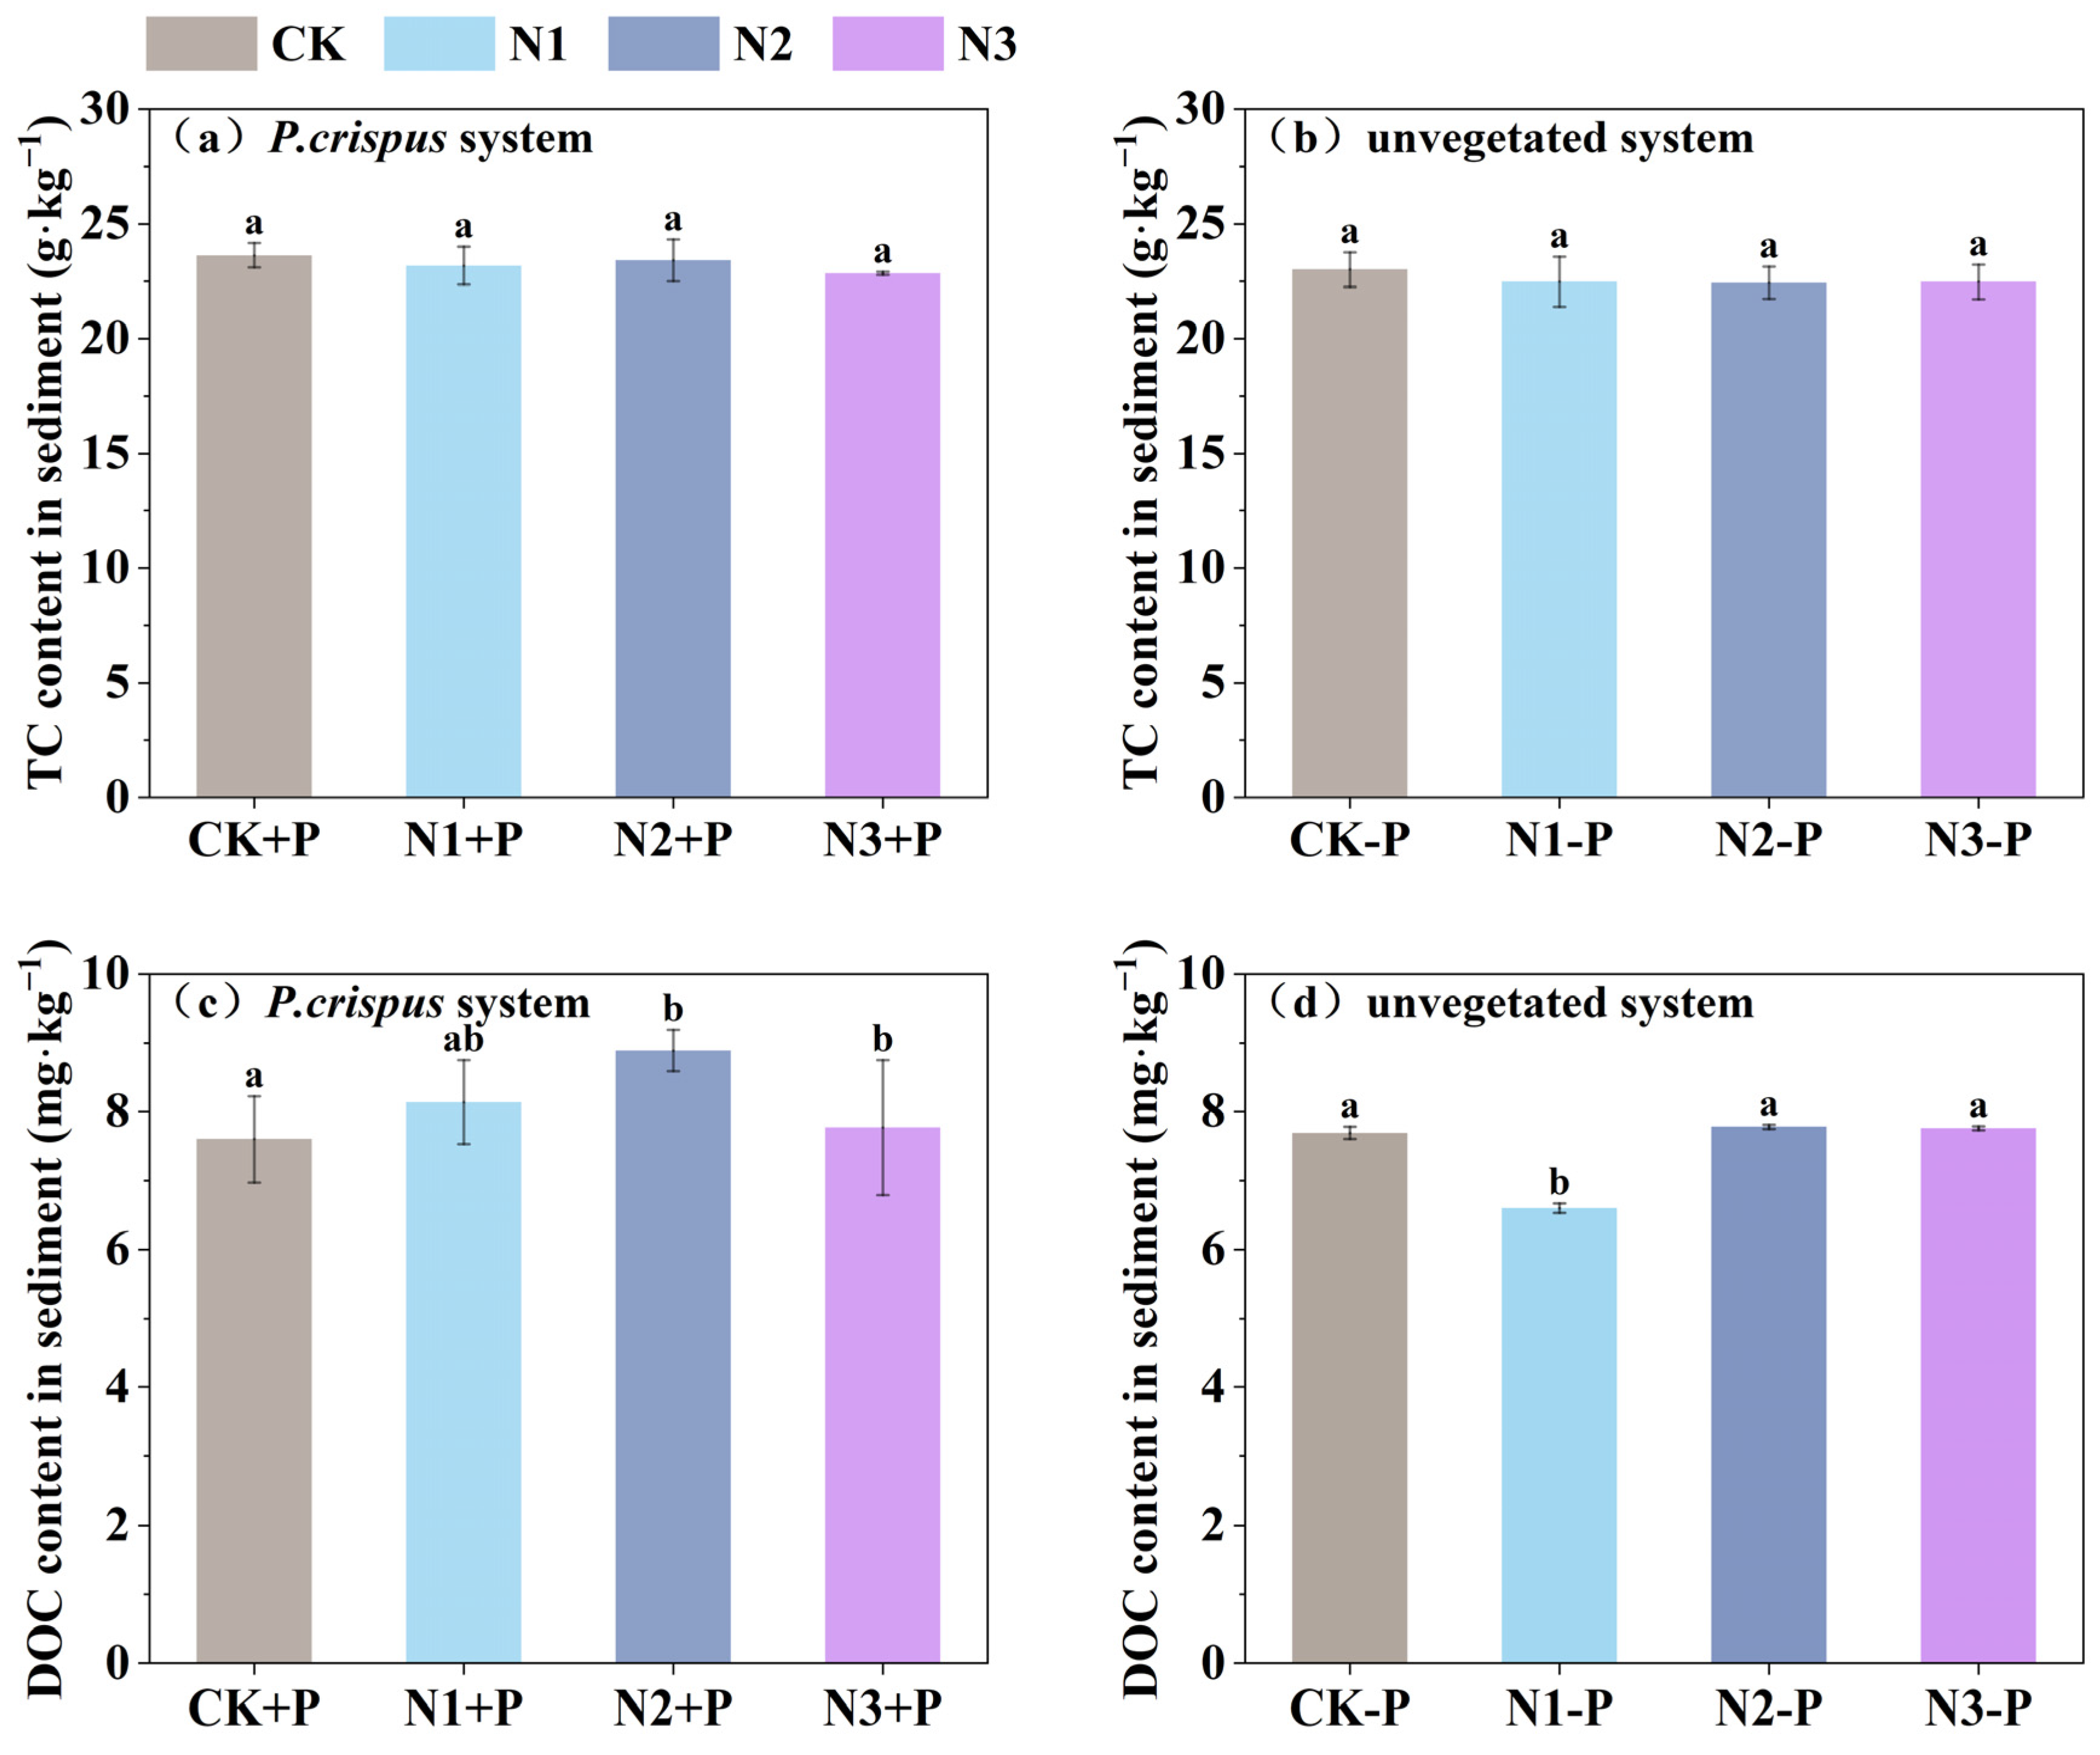
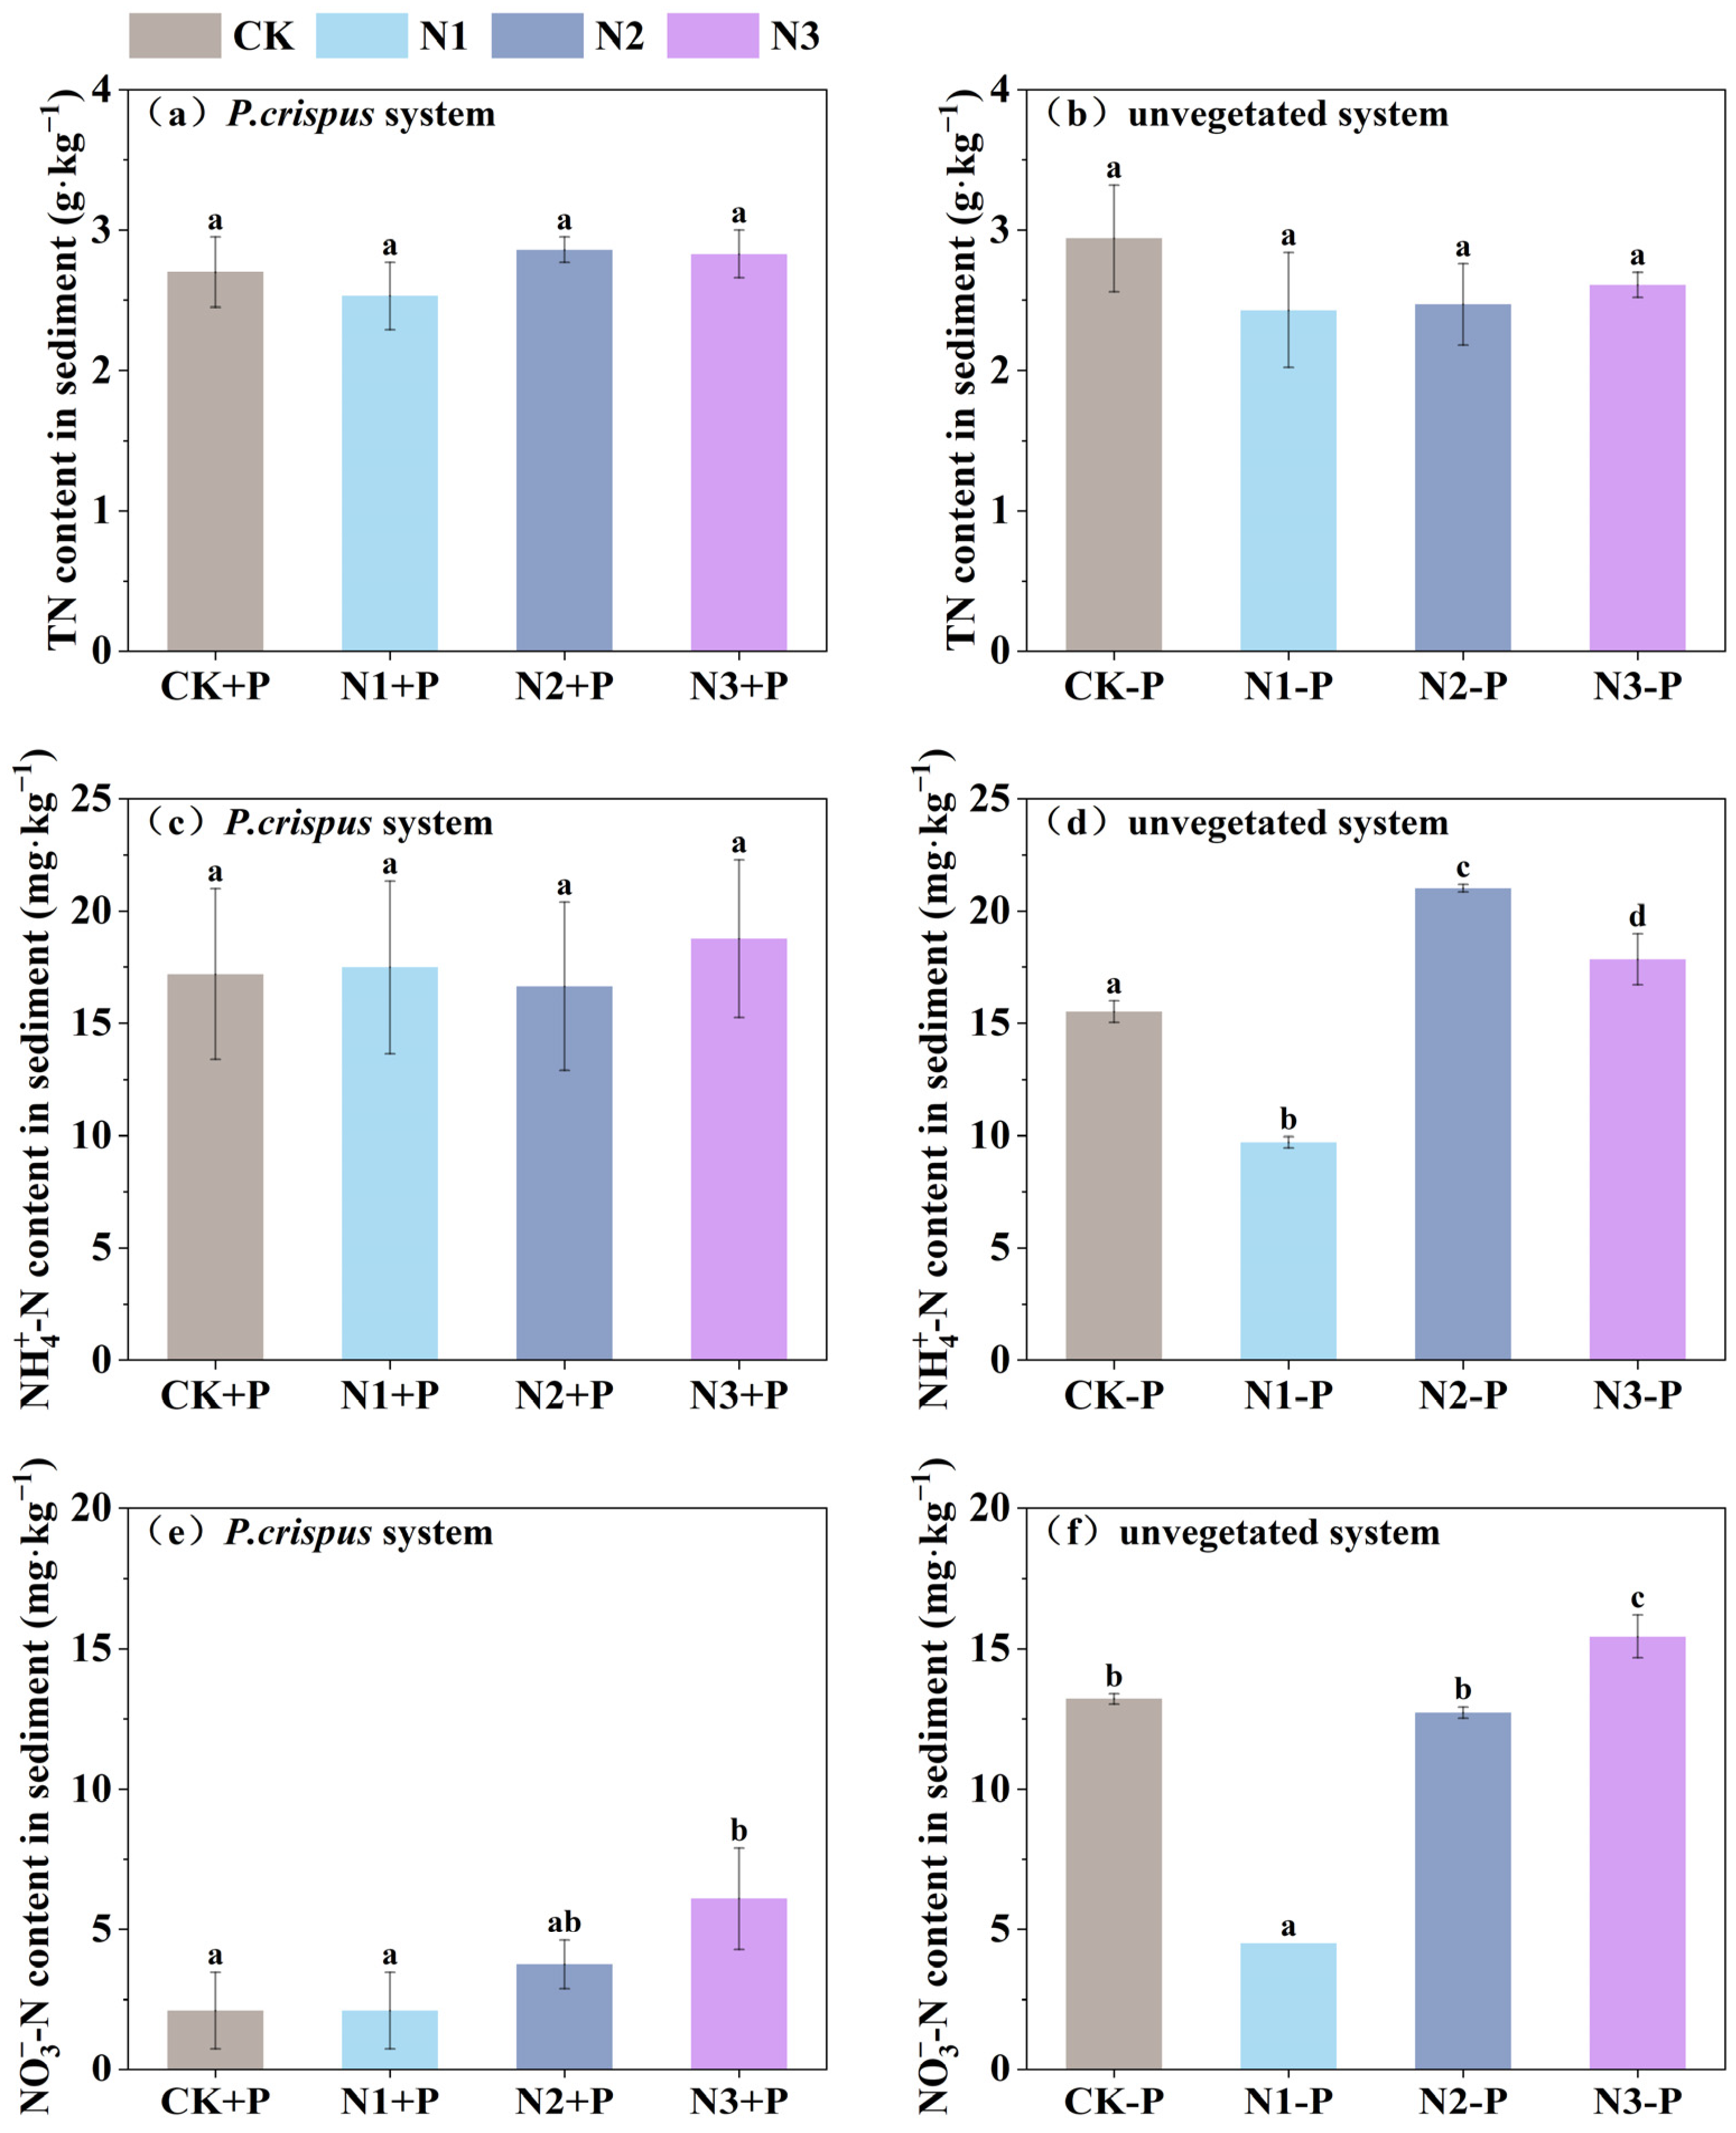
3.2. Variation Characteristics of Carbon and Nitrogen Fractions in Sediments

The primary differences in sediment carbon fractions among treatment groups were observed in DOC content (p < 0.05), while TC content showed no significant variation (Figure 4). Nevertheless, the overall TC content in the P. crispus system was slightly higher than that in the unvegetated system. This may be attributed to the input of root exudates and plant residues, which promoted the accumulation of organic matter and enhanced the sediment carbon storage capacity. Moreover, DOC content was significantly higher in the P. crispus system than in the unvegetated system, indicating that root activity increased the proportion of bioavailable carbon fractions in the sediment. Under different nitrogen-loading conditions, the DOC content in the sediment exhibited significant variation (p < 0.05). With increasing nitrogen input, both TC and DOC concentrations showed a clear decreasing trend, indicating that high-nitrogen loading may lead to carbon loss from the sediment. This decline in carbon content may be attributed to enhanced microbial mineralization of organic matter and accelerated consumption of DOC as an electron donor during denitrification.
The TN content in the sediment of the P. crispus system was consistently higher than that of the unvegetated system (Figure 5), suggesting that P. crispus may contribute to nitrogen retention by directly absorbing nitrogen species (e.g., NO3-N and NH4+-N) and by creating rhizosphere conditions that support microbial nitrogen transformation processes, such as nitrification and denitrification. In the P. crispus system, sediment TN content increased with rising nitrogen loading, whereas in the unvegetated system, TN content showed a decreasing trend under high-nitrogen conditions. This discrepancy may be attributed to the absence of rhizosphere regulation in the unvegetated system, where nitrogen transformation is primarily driven by microbial activity. Enhanced microbial activity under high-nitrogen input could accelerate the mineralization of organic nitrogen, leading to the release of inorganic nitrogen (e.g., NH4+-N) [19,20]. In the absence of sufficient plant uptake, the released NH4+-N may be subject to nitrification, followed by denitrification, or may diffuse into the overlying water. These pathways can ultimately contribute to the reduction of TN content in the sediment. Moreover, under high-nitrogen loading (N2 and N3 treatments), sediment NH4+-N content was relatively higher in the unvegetated system compared to the P. crispus system, further supporting the active role of P. crispus in nitrogen uptake and transformation. Under varying nitrogen-loading conditions, NH4+-N content in the P. crispus system showed no significant differences, while in the unvegetated system, significant variation was observed (p < 0.05). This may be due to differing levels of microbial mineralization under different nitrogen inputs. The rhizospheric regulatory effect of P. crispus may buffer the fluctuations in microbial activity under high-nitrogen loads, helping to maintain relatively stable NH4+-N levels.
NO3-N content in the P. crispus system was generally low. This could be attributed to two key factors: first, the roots of P. crispus are capable of directly absorbing NO3-N; second, while root oxygen release generally leads to microoxic conditions that support nitrification, spatial heterogeneity within the rhizosphere—such as deeper sediment zones or microsites within biofilms—may allow localized anoxic environments to develop, which in turn support the activity of denitrifying bacteria, facilitating the reduction of NO3-N to N2O or N2 and thereby limiting its accumulation in the sediment [21]. Furthermore, sediment NO3-N content varied significantly under different nitrogen-loading conditions (p < 0.05). In the P. crispus system, sediment NO3-N content increased under high-nitrogen loading compared to the low-nitrogen treatments. This may be due to the inhibitory effect of high NH4+-N concentrations in the water body on root NO3-N uptake, as well as potential disruption of the continuity of the denitrification process, leading to NO3-N accumulation and increased N2O emissions. In contrast, the unvegetated system exhibited markedly higher NO3-N content in the sediment, likely due to the lack of plant-mediated nitrogen uptake. In this case, the excess NO3-N in the water may have been transferred to the sediment through gravitational settling or diffusion, resulting in its accumulation.

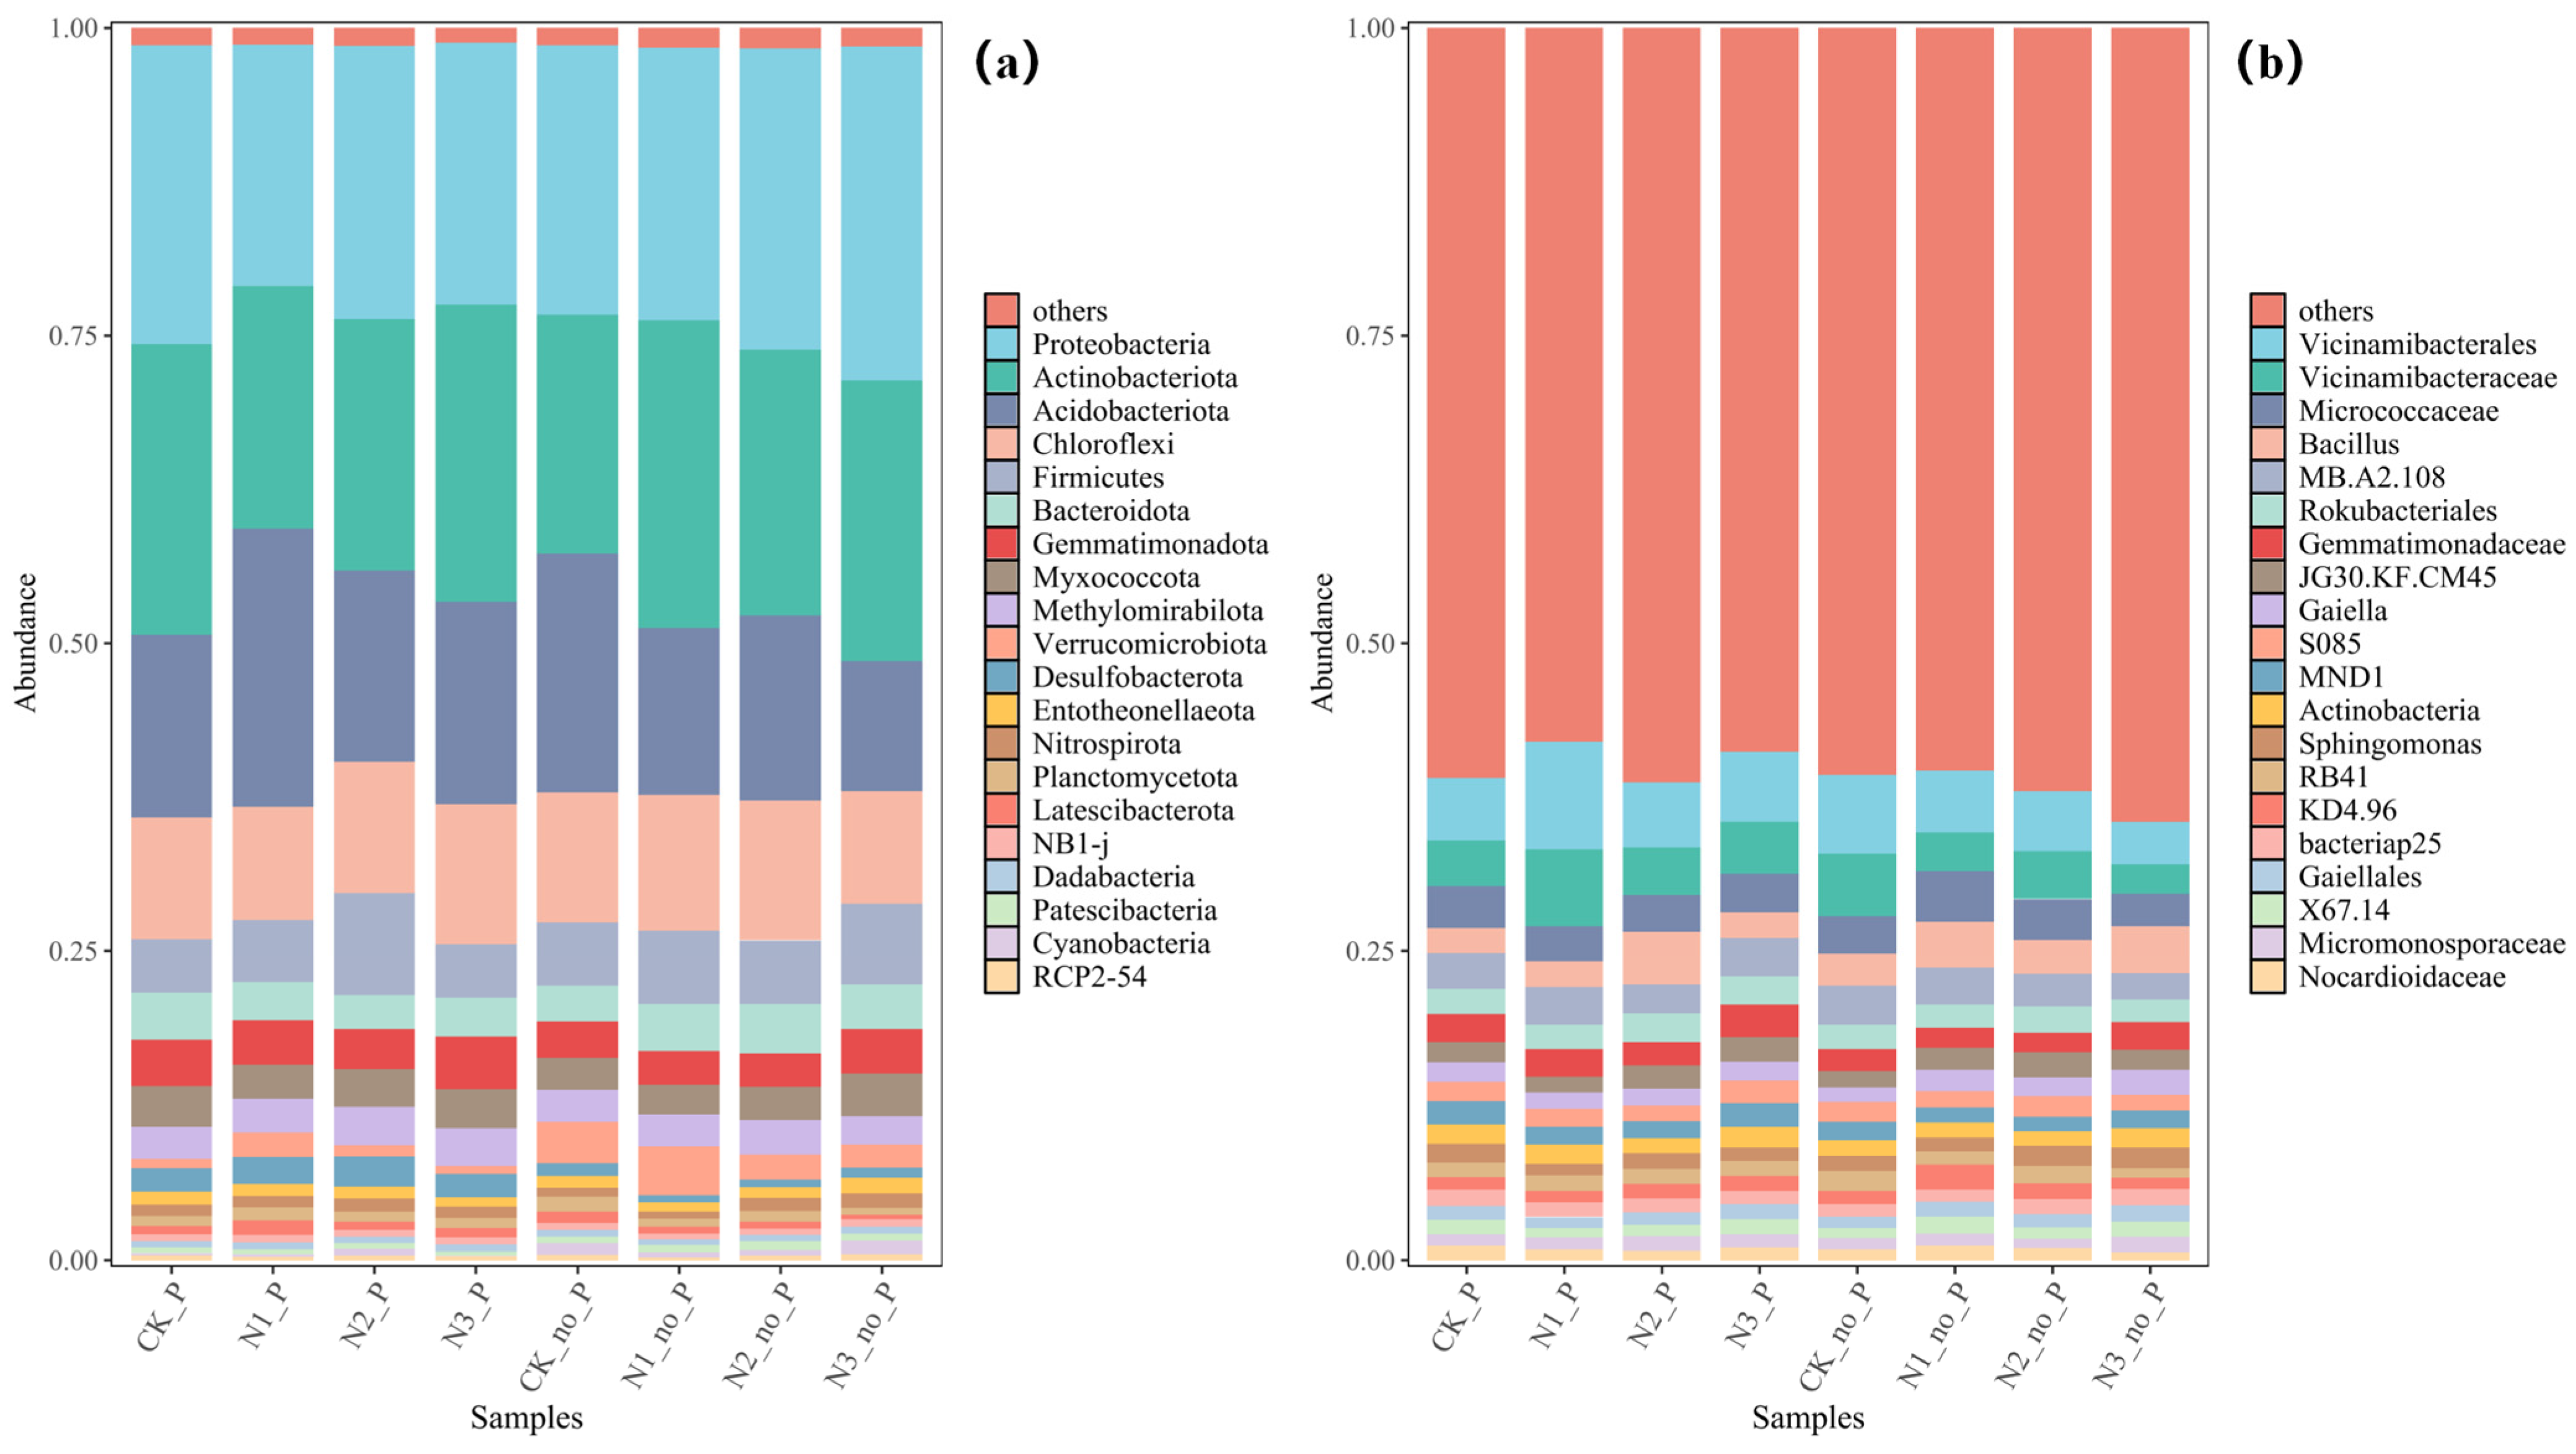
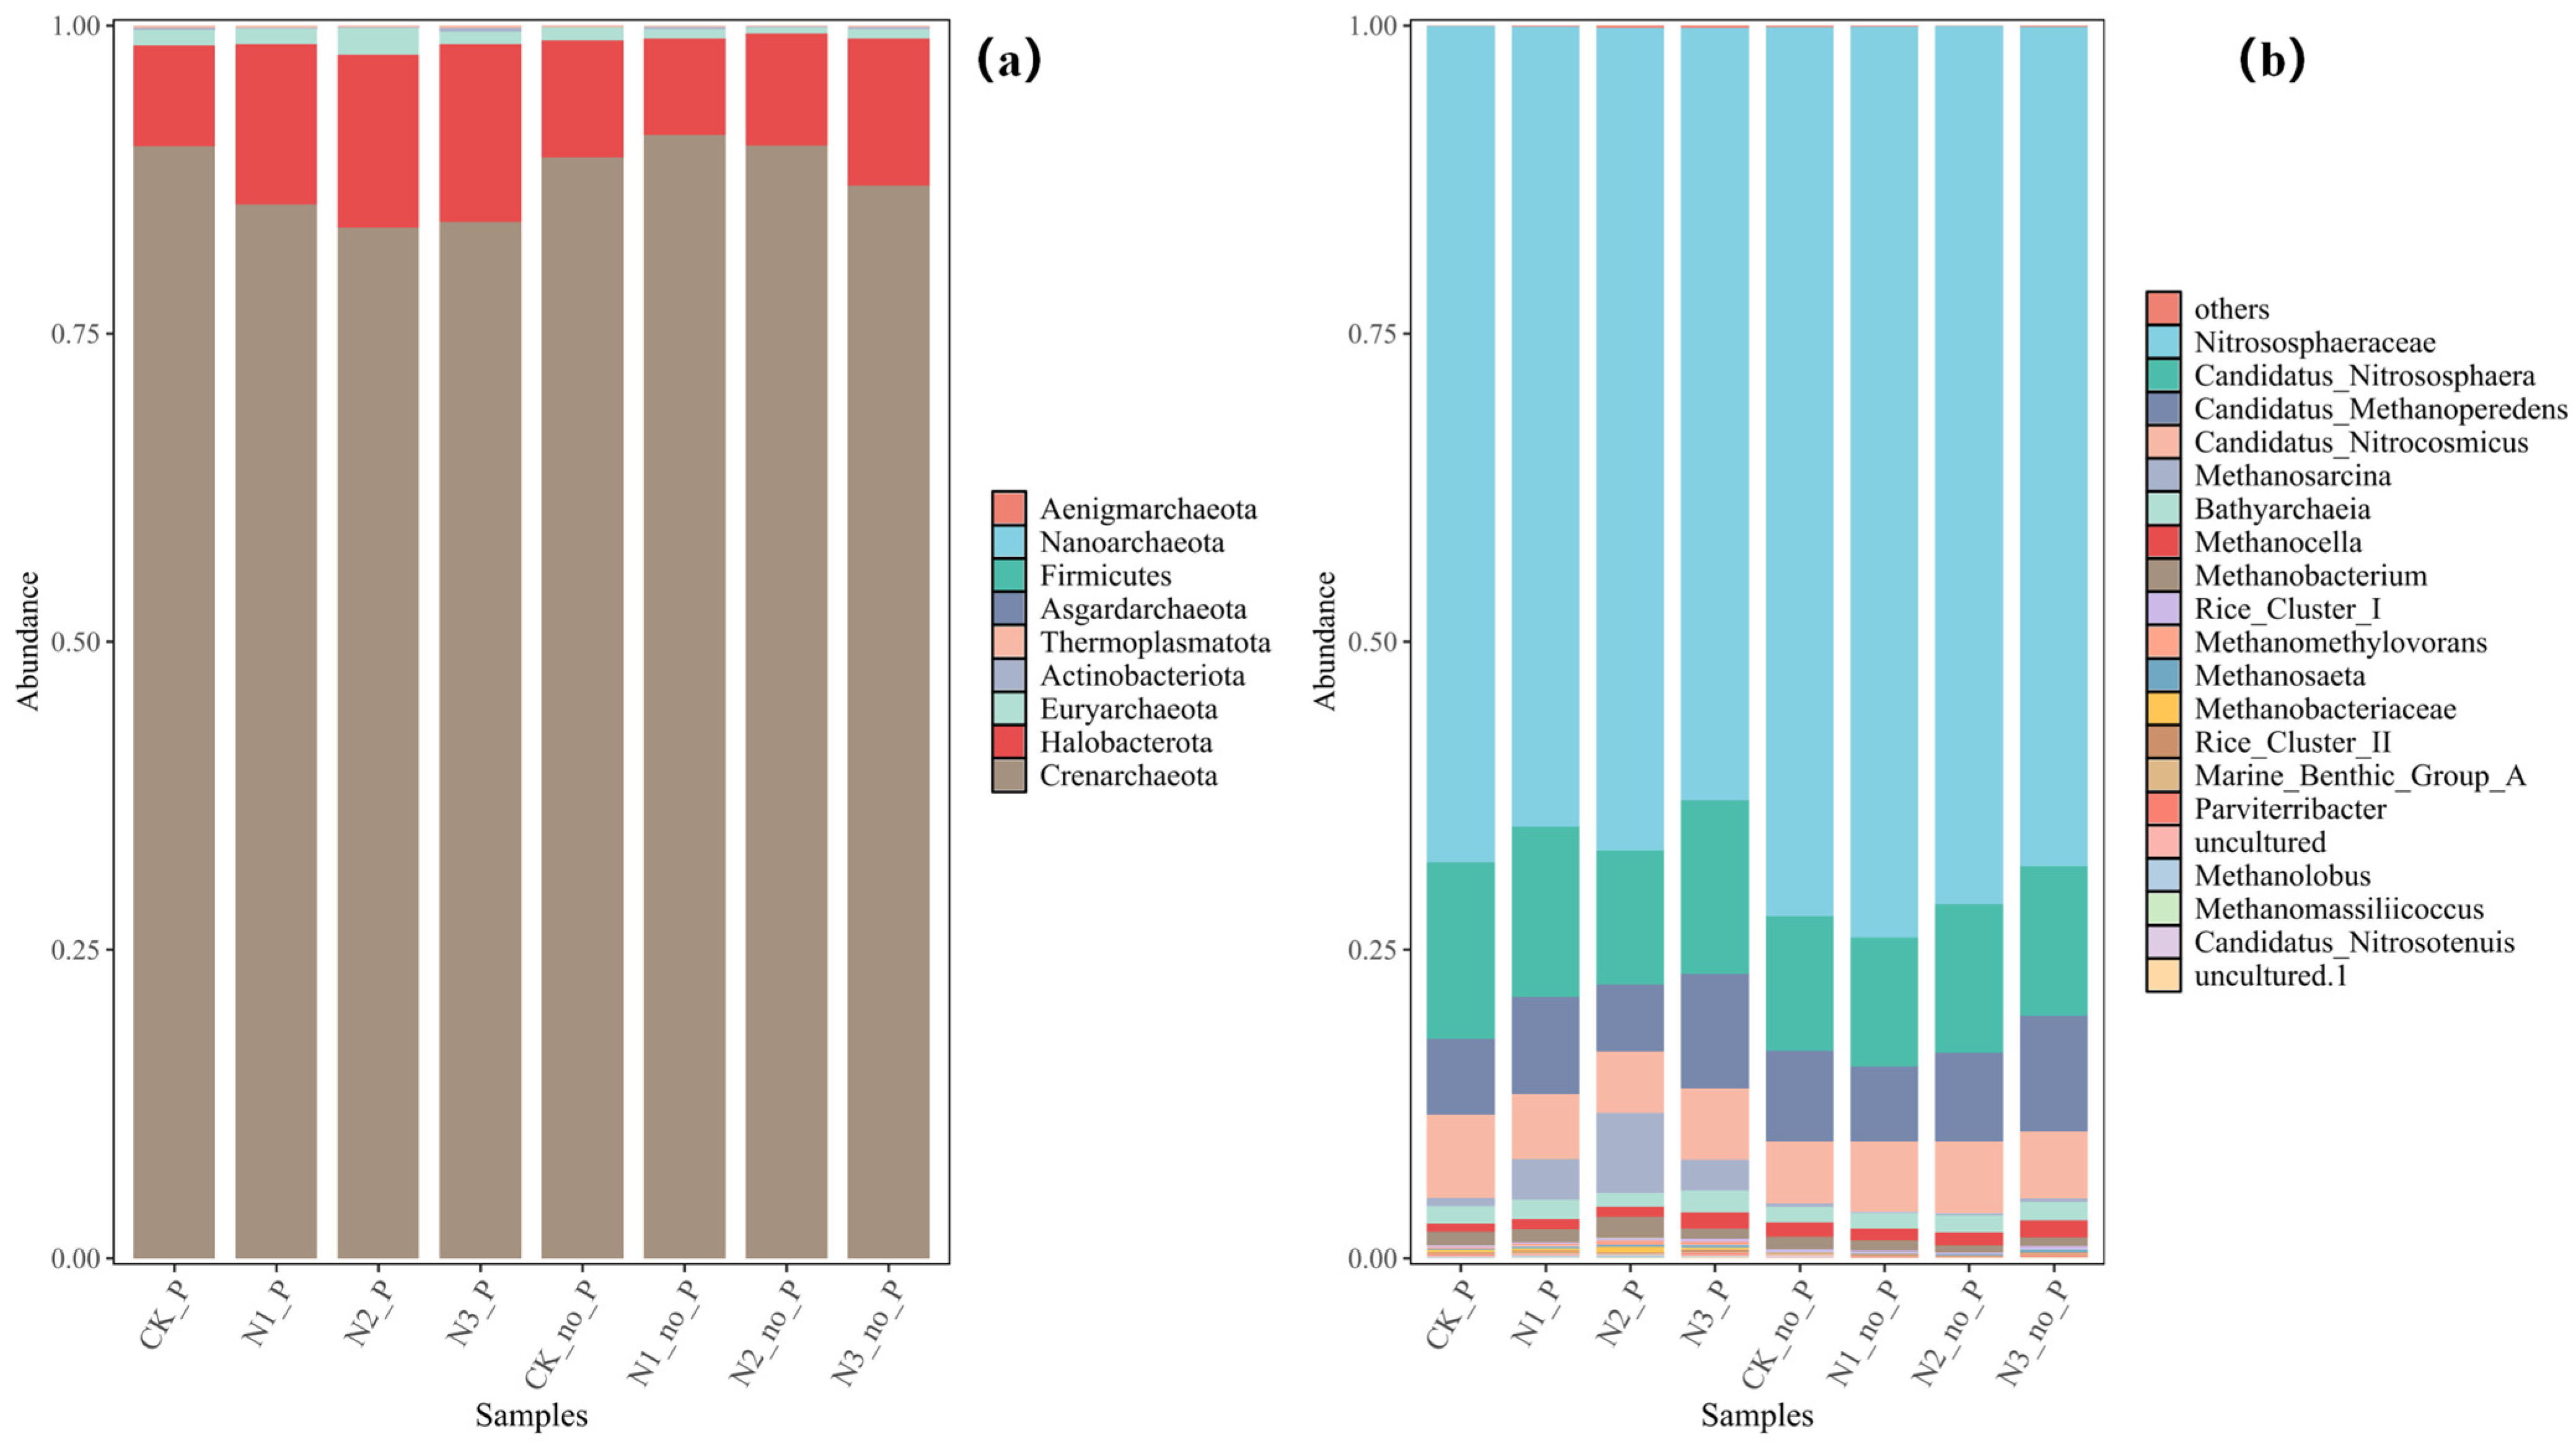
3.3. Responses of Microbial Community Structure to P. crispus and Nitrogen Loading

Bacterial community composition was analyzed across all treatment groups at the phylum level, and the top ten dominant phyla with relative abundances greater than 2% were identified (Figure 6a). These included Proteobacteria, Actinobacteriota, Acidobacteriota, Chloroflexi, Firmicutes, Gemmatimonadota, Bacteroidota, Myxococcota, Methylomirabilota, and Desulfobacterota. These dominant phyla are widely involved in key ecological processes, such as organic matter degradation, carbon and nitrogen transformation, and energy metabolism. Among them, Proteobacteria was the most abundant core group and is considered one of the most critical phyla for carbon and nitrogen degradation and removal. Under different nitrogen-loading conditions, the combined relative abundance of these dominant phyla in the P. crispus system ranged from 89.03% to 91.10%, compared to 86.61% to 88.84% in the unvegetated system, indicating that the presence of P. crispus promoted the enrichment of dominant bacterial taxa to some extent.
At the genus level (Figure 6b), the five dominant bacterial taxa with relative abundances greater than 2% were identified, including Vicinamibacterales, Vicinamibacteraceae, Micrococcaceae, Bacillus, MB.A2.108, Rokubacteriales, and Gemmatimonadaceae. The analysis indicated that the presence of P. crispus promoted the enrichment of Vicinamibacterales and Vicinamibacteraceae. However, the relative abundances of these two genera declined with increasing nitrogen loading. In contrast, the remaining five taxa showed no clear trends across treatments, and no distinct responses to either P. crispus presence or nitrogen loading were observed.
Three dominant archaeal phyla with relative abundances greater than 1% were identified: Crenarchaeota, Halobacterota, and Euryarchaeota (Figure 7a). Among them, Crenarchaeota was the most dominant archaeal group, with relative abundances ranging from 83.57% to 90.16% in the P. crispus system and from 86.95% to 91.10% in the unvegetated system. Except for the CK group, the relative abundance of Crenarchaeota in the P. crispus system was lower than in the unvegetated system under all nitrogen-loading treatments. Specifically, the N1+P, N2+P, and N3+P groups showed decreases of 6.21, 7.38, and 3.39 percentage points, respectively. These results suggest that the presence of P. crispus may have inhibited the enrichment of Crenarchaeota to some extent. Additionally, the abundance of Crenarchaeota in both systems declined with increasing nitrogen loading. Halobacterota was the second most abundant archaeal phylum, with relative abundances ranging from 8.19% to 14.42% in the P. crispus system, which were generally higher than those in the unvegetated system (7.80% to 11.96%). Moreover, its abundance increased with nitrogen loading, indicating a certain degree of adaptation to high-nitrogen conditions. Euryarchaeota exhibited relatively low abundance in both systems, ranging from 1.00% to 2.20% in the P. crispus system and from 0.50% to 1.04% in the unvegetated system. However, under all nitrogen-loading treatments, Euryarchaeota consistently showed higher relative abundance in the P. crispus system. Specifically, the relative abundances in the CK+P, N1+P, N2+P, and N3+P groups increased by 20.19, 58.97, 340.00, and 33.33 percentage points, respectively, compared to their unvegetated counterparts. Nevertheless, a declining trend in Euryarchaeota abundance was observed with increasing nitrogen loading.
At the archaeal genus level (Figure 7b), eight dominant genera with relative abundances greater than 1% were identified, including Nitrososphaeraceae, Candidatus Nitrososphaera, Candidatus Methanoperedens, Candidatus Nitrocosmicus, Methanosarcina, Bathyarchaeia, Methanocella, and Methanobacterium. Nitrososphaeraceae, Candidatus Nitrososphaera, and Candidatus Nitrocosmicus are typical ammonia-oxidizing archaea (AOA) and formed the core of the archaeal community, with relatively high abundance across all treatment groups. With increasing nitrogen loading, the combined relative abundance of these three AOA groups decreased from 88.52% to 82.06% in the P. crispus system and from 89.71% to 85.22% in the unvegetated system, showing a declining trend. Additionally, the total abundance of AOA was consistently slightly lower in the P. crispus system than in the unvegetated system. These results suggest that both the presence of P. crispus and elevated nitrogen loading may exert inhibitory effects on the proliferation of ammonia-oxidizing archaea. The relative abundance of Candidatus Methanoperedens ranged from 5.40% to 9.26% in the P. crispus system and from 6.07% to 9.38% in the unvegetated system. In the unvegetated system, its abundance increased notably with higher nitrogen loading, whereas no clear pattern was observed in the P. crispus system. Methanosarcina, Methanocella, and Methanobacterium, all methanogenic archaea, exhibited relative abundances ranging from 2.40% to 9.04% in the P. crispus system, showing an increasing trend with nitrogen loading. In contrast, their abundance in the unvegetated system was lower, ranging from 1.74% to 2.28%, and showed no clear trend with nitrogen input. The relative abundance of Bathyarchaeia decreased with increasing nitrogen loading in the P. crispus system, whereas an opposite trend was observed in the unvegetated system, where its abundance increased with nitrogen enrichment.

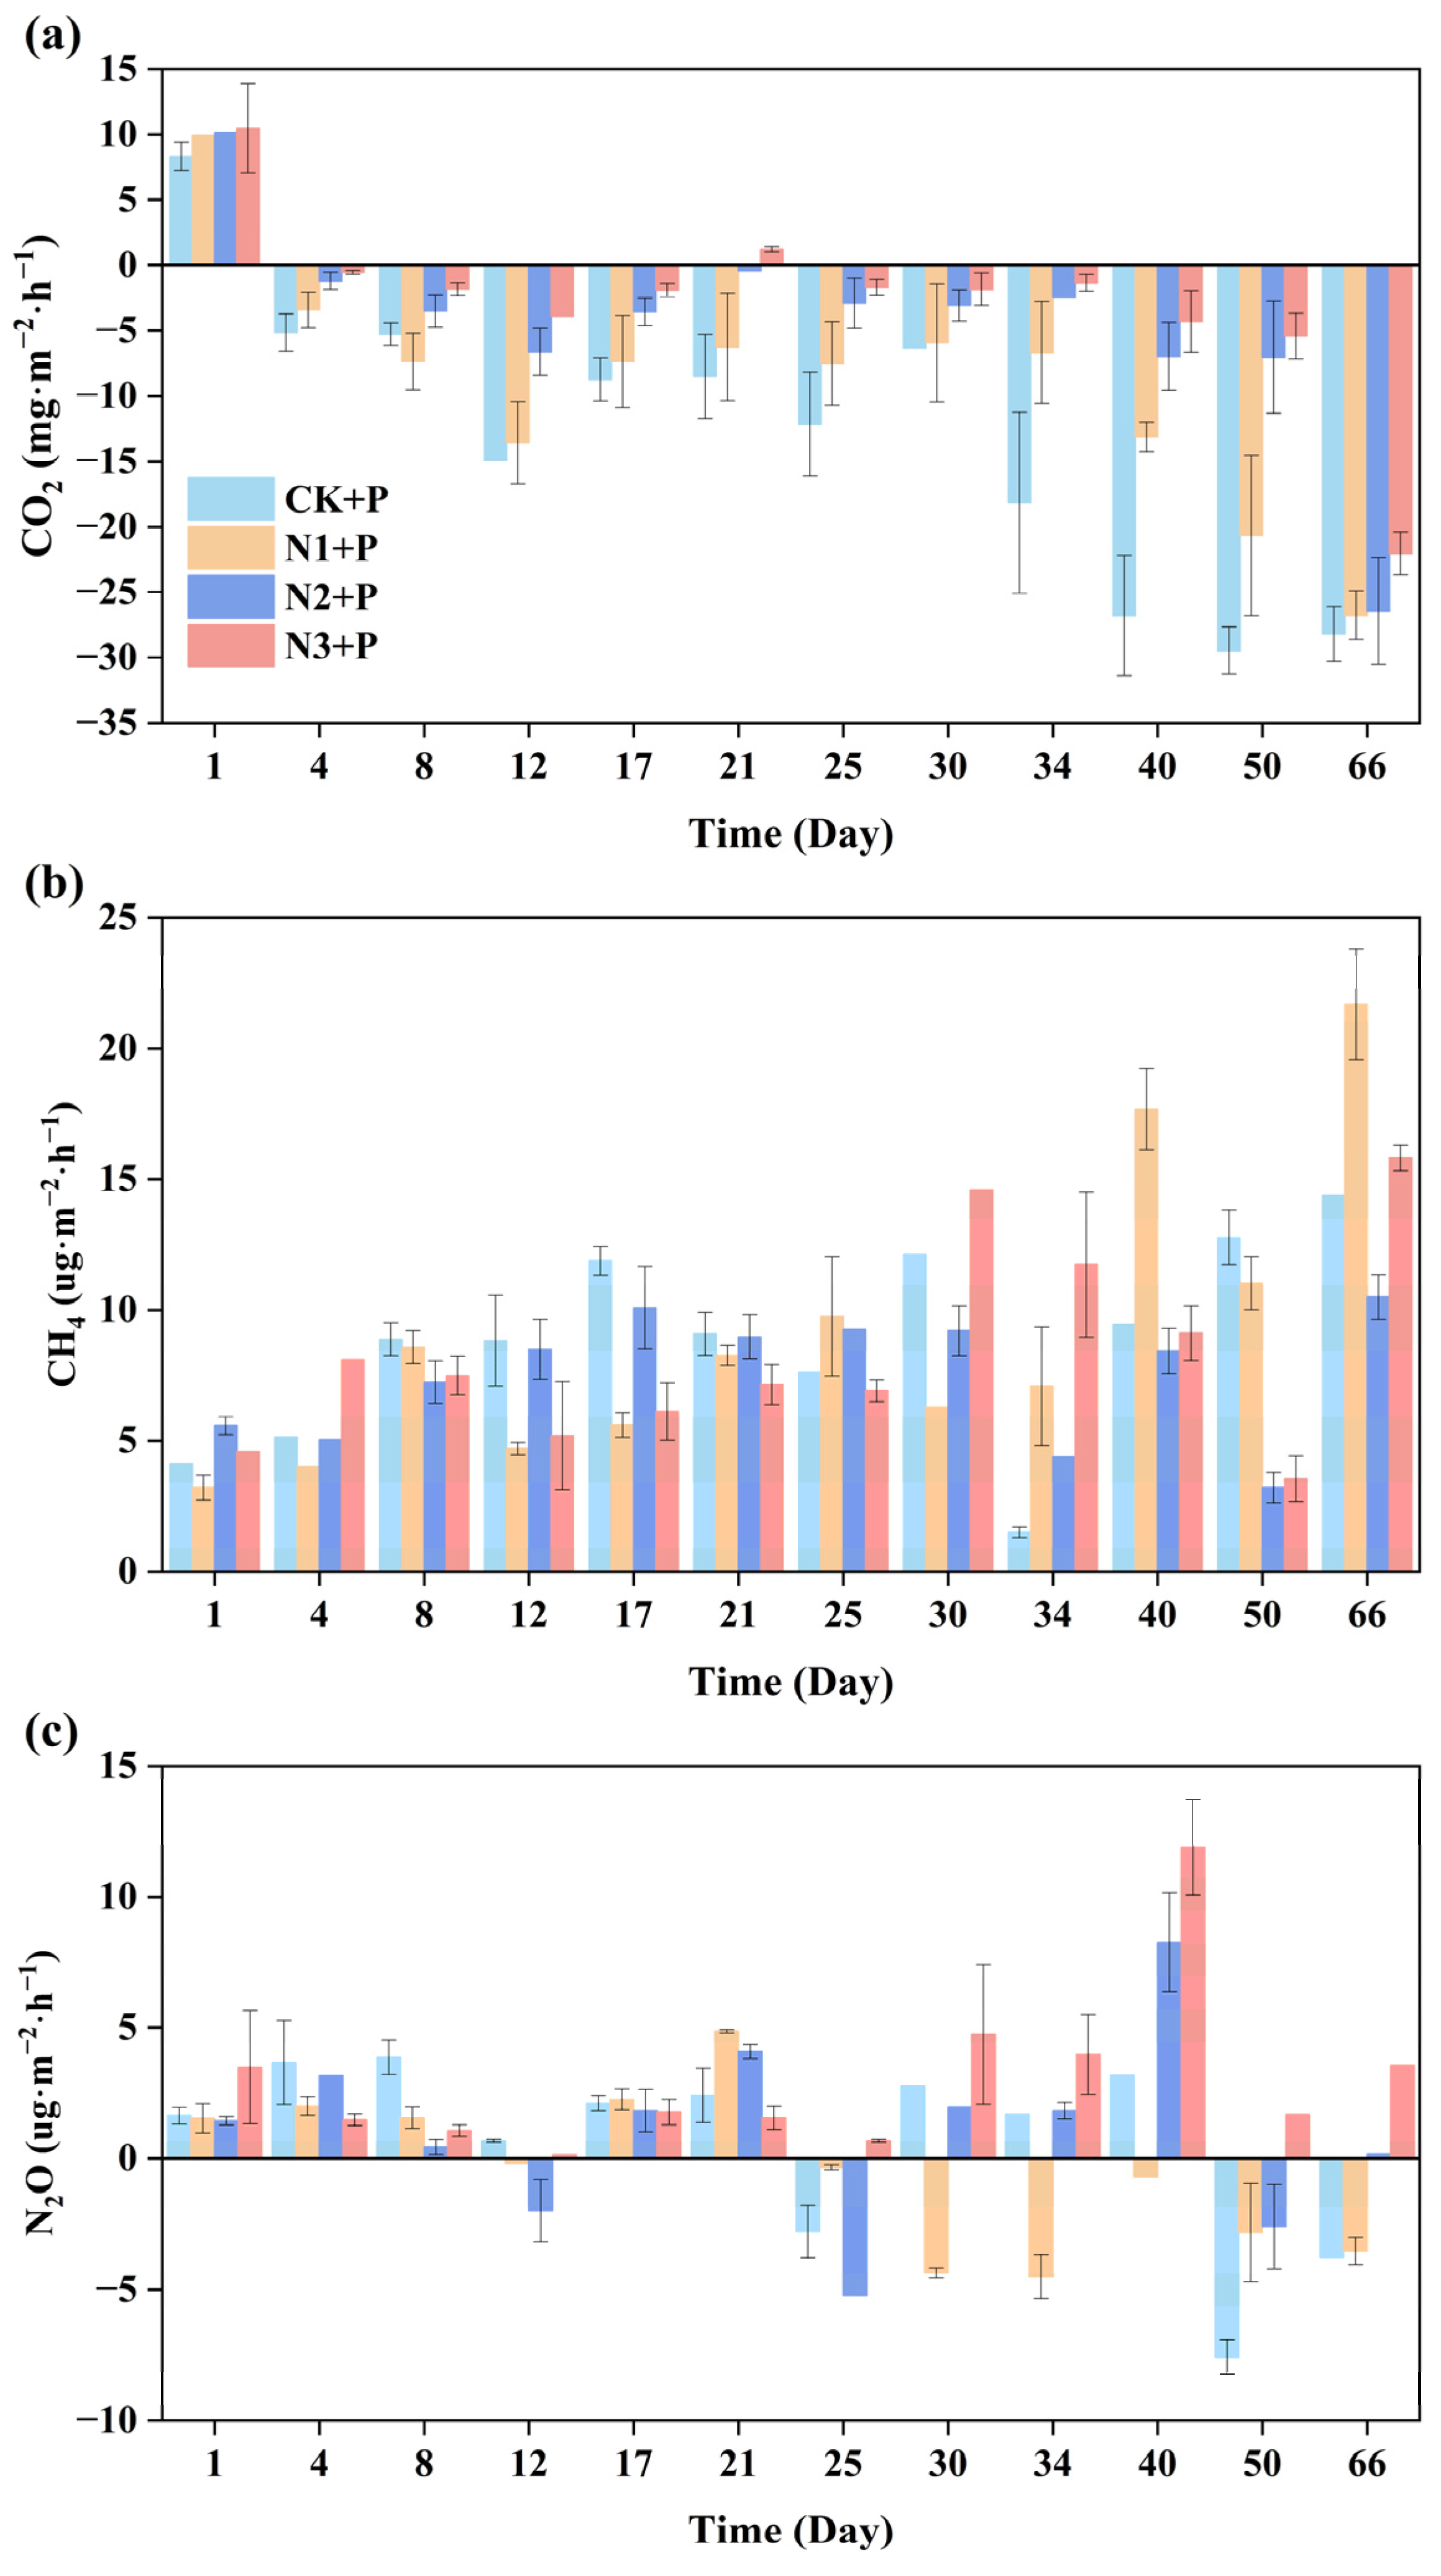
3.4. Greenhouse Gas Exchange Fluxes of P. crispus System Under Different Nitrogen-Loading Conditions

3.4.1. CO2 Exchange Fluxes

The variation in CO2 flux was primarily regulated by the combined effects of plant photosynthesis and respiration. During the initial phase of the experiment, P. crispus was likely in an environmental acclimation period, during which respiration dominated, resulting in a net emission of CO2 (Figure 8a). On day 1, the CO2 emission rates in the P. crispus system ranged from 8.31 to 10.47 mg∙m−2∙h−1, indicating that the system functioned as a carbon source at this stage, with the plants not yet exhibiting effective carbon fixation capacity. As the experiment progressed, P. crispus gradually adapted to the environment and entered a rapid growth phase, during which photosynthetic activity increased, and CO2 uptake improved. Consequently, the system transitioned from a carbon source to a carbon sink. By day 66, all treatment groups had reached their peak levels of CO2 uptake, with CO2 fluxes of −28.20, −26.76, −26.43, and −22.05 mg∙m−2∙h−1 in the CK+P, N1+P, N2+P, and N3+P groups, respectively.
The average CO2 fluxes under different nitrogen-loading conditions in the P. crispus system were −12.66 (CK+P), −8.87 (N1+P), −4.75 (N2+P), and −2.86 (N3+P) mg∙m−2∙h−1, showing a decreasing trend in CO2 uptake with increasing nitrogen load. This suggests that higher nitrogen levels may suppress the CO2 absorption capacity of the P. crispus system. Previous studies have indicated that elevated nitrogen concentrations can stimulate the overgrowth of phytoplankton or microbial communities, intensifying competition with plants for light and nutrients, thereby reducing its photosynthetic efficiency [22]. This trend was also reflected in the observed decline in DO levels under high-nitrogen-loading conditions.
Moreover, it should be noted that elevated nitrogen availability may also enhance denitrification processes in the sediment, during which organic carbon is oxidized, contributing additional CO2 emissions. Therefore, while the P. crispus system demonstrated a strong capacity for CO2 uptake overall, this function was substantially weakened under high-nitrogen conditions due to the combined effects of physiological inhibition and increased microbial carbon oxidation. Overall, the P. crispus system demonstrated a strong capacity for CO2 uptake. However, this ability was significantly reduced under high-nitrogen loading.

3.4.2. CH4 Exchange Fluxes

CH4 production primarily results from the metabolic activity of methanogenic microorganisms in anaerobic sediment conditions. However, actual CH4 emissions are frequently influenced by various environmental factors, often exhibiting dynamic fluctuations. CH4 emissions showed an increasing trend as the experiment progressed, but overall levels remained relatively low, with considerable variability observed among different treatment groups (Figure 8b). This instability in CH4 emissions may be attributed to the dynamic balance between methanogenesis and methane oxidation. Specifically, CH4 production relies on the activity of methanogenic archaea under strictly anaerobic conditions in the sediment, while CH4 oxidation is facilitated by methane-oxidizing bacteria that function in microoxic environments [23,24]. The interplay between these two processes directly affects the net CH4 flux. Nonetheless, nitrogen loading exerted a noticeable influence on CH4 emissions in the P. crispus system. The average CH4 fluxes in the CK+P, N1+P, N2+P, and N3+P groups were 8.64, 8.77, 8.83, and 10.64 μg·m−2·h−1, respectively, indicating that high-nitrogen conditions may enhance CH4 emissions. This may be attributed to the fact that high-nitrogen loading likely increased the input of plant-derived organic matter, while the measured DOC content in the sediment remained relatively low. This suggests that the available dissolved organic carbon was rapidly consumed by anaerobic microorganisms, particularly through methanogenic processes. This interpretation is consistent with the observed pattern of lower DOC levels and elevated CH4 emissions in the high-nitrogen treatments.

3.4.3. N2O Exchange Fluxes

N2O emissions are jointly regulated by the coupled processes of nitrification and denitrification [25]. N2O fluxes occasionally exhibited negative values under low-nitrogen loading, while remaining consistently positive under high-nitrogen loading (Figure 8c), indicating that nitrogen input levels exerted a considerable influence on N2O emissions. Specifically, the average N2O fluxes in the CK+P, N1+P, N2+P, and N3+P groups were 0.44, −0.46, 1.08, and 2.91 μg·m−2·h−1, respectively. Under low-nitrogen loading, the concentration of NH4+-N in the water was relatively low, and the active uptake of NO3-N by P. crispus may have limited the availability of nitrogen substrates for both nitrification and denitrification, thereby reducing N2O production. In some periods, negative fluxes were observed, suggesting the potential for net N2O uptake by the P. crispus system. This phenomenon may be attributed to enhanced microbial reduction of N2O to N2 in the rhizosphere, stimulated by improved oxygen and carbon conditions created by the plant roots, rather than direct assimilation of N2O by the plant itself. In contrast, under high-nitrogen loading, the abundant nitrogen supply provided sufficient substrates for nitrification, promoting the rapid conversion of NH4+-N to NO3-N, accompanied by increased N2O generation and release. As the reactions progressed, N2O emission levels gradually increased over time. Overall, N2O emissions in the P. crispus system were effectively suppressed under low-nitrogen conditions, while high-nitrogen loading significantly enhanced N2O production and release. These findings indicate that nitrogen loading is a key environmental factor driving N2O emissions in wetland systems.

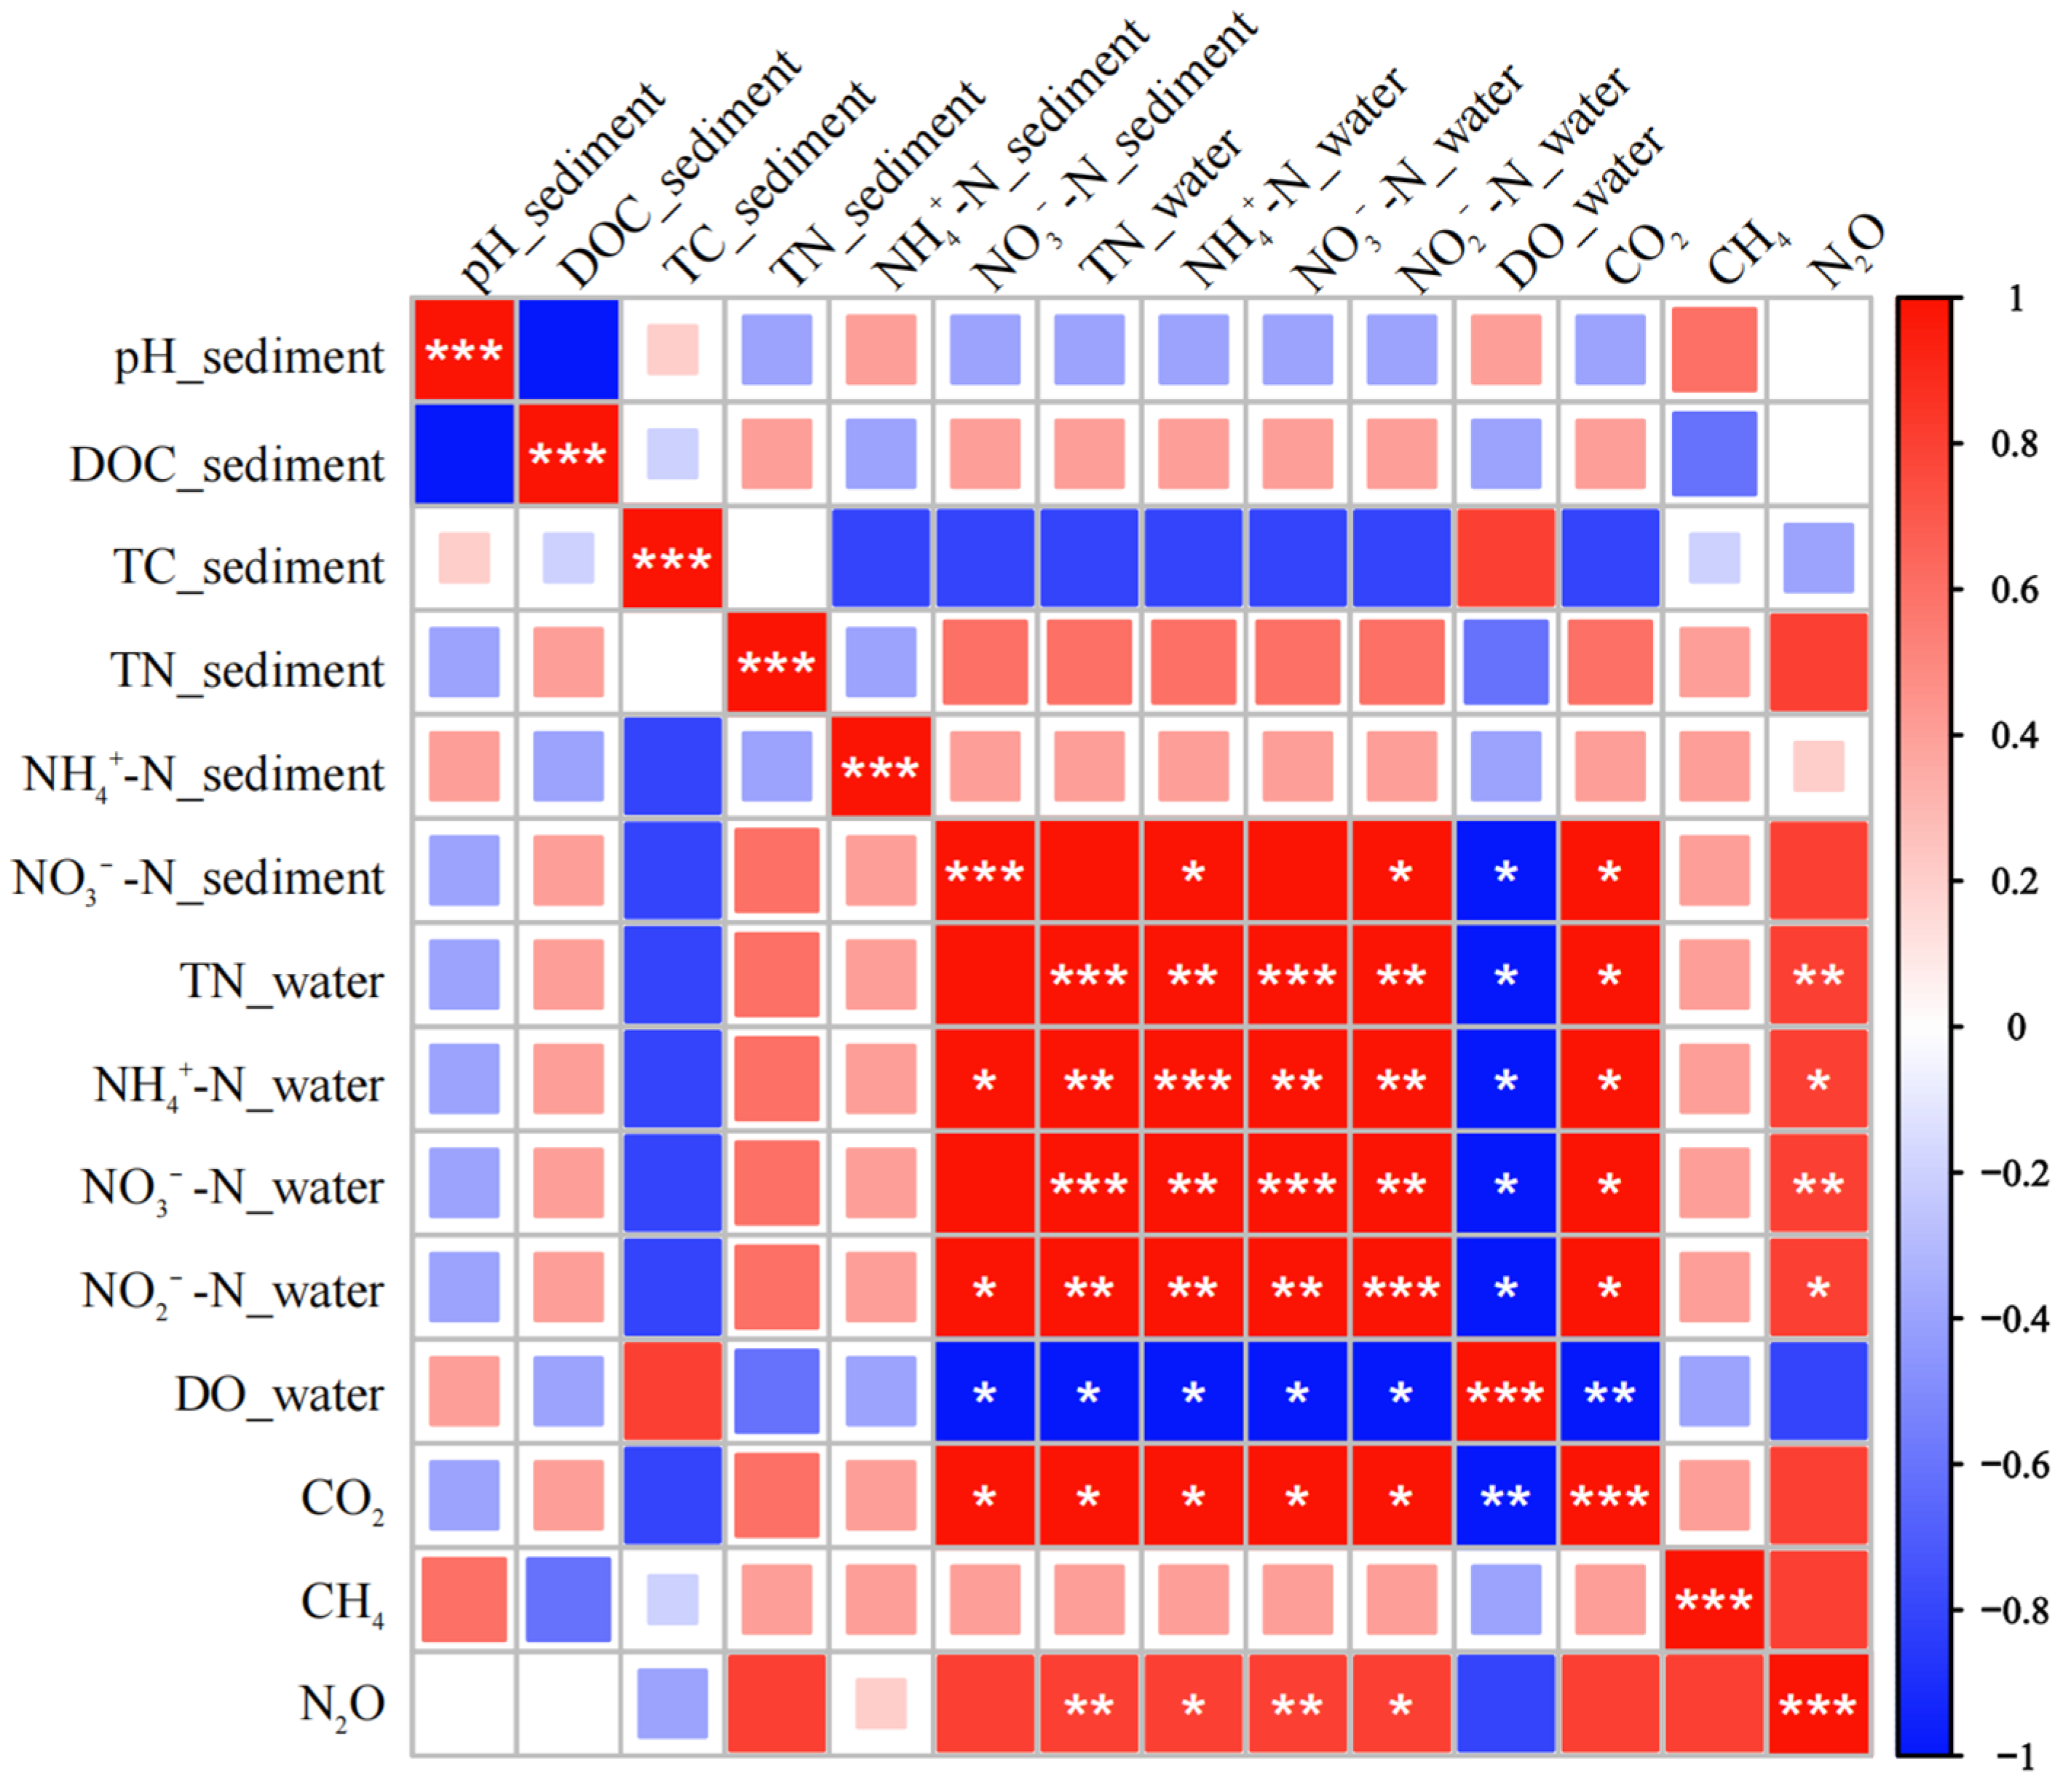
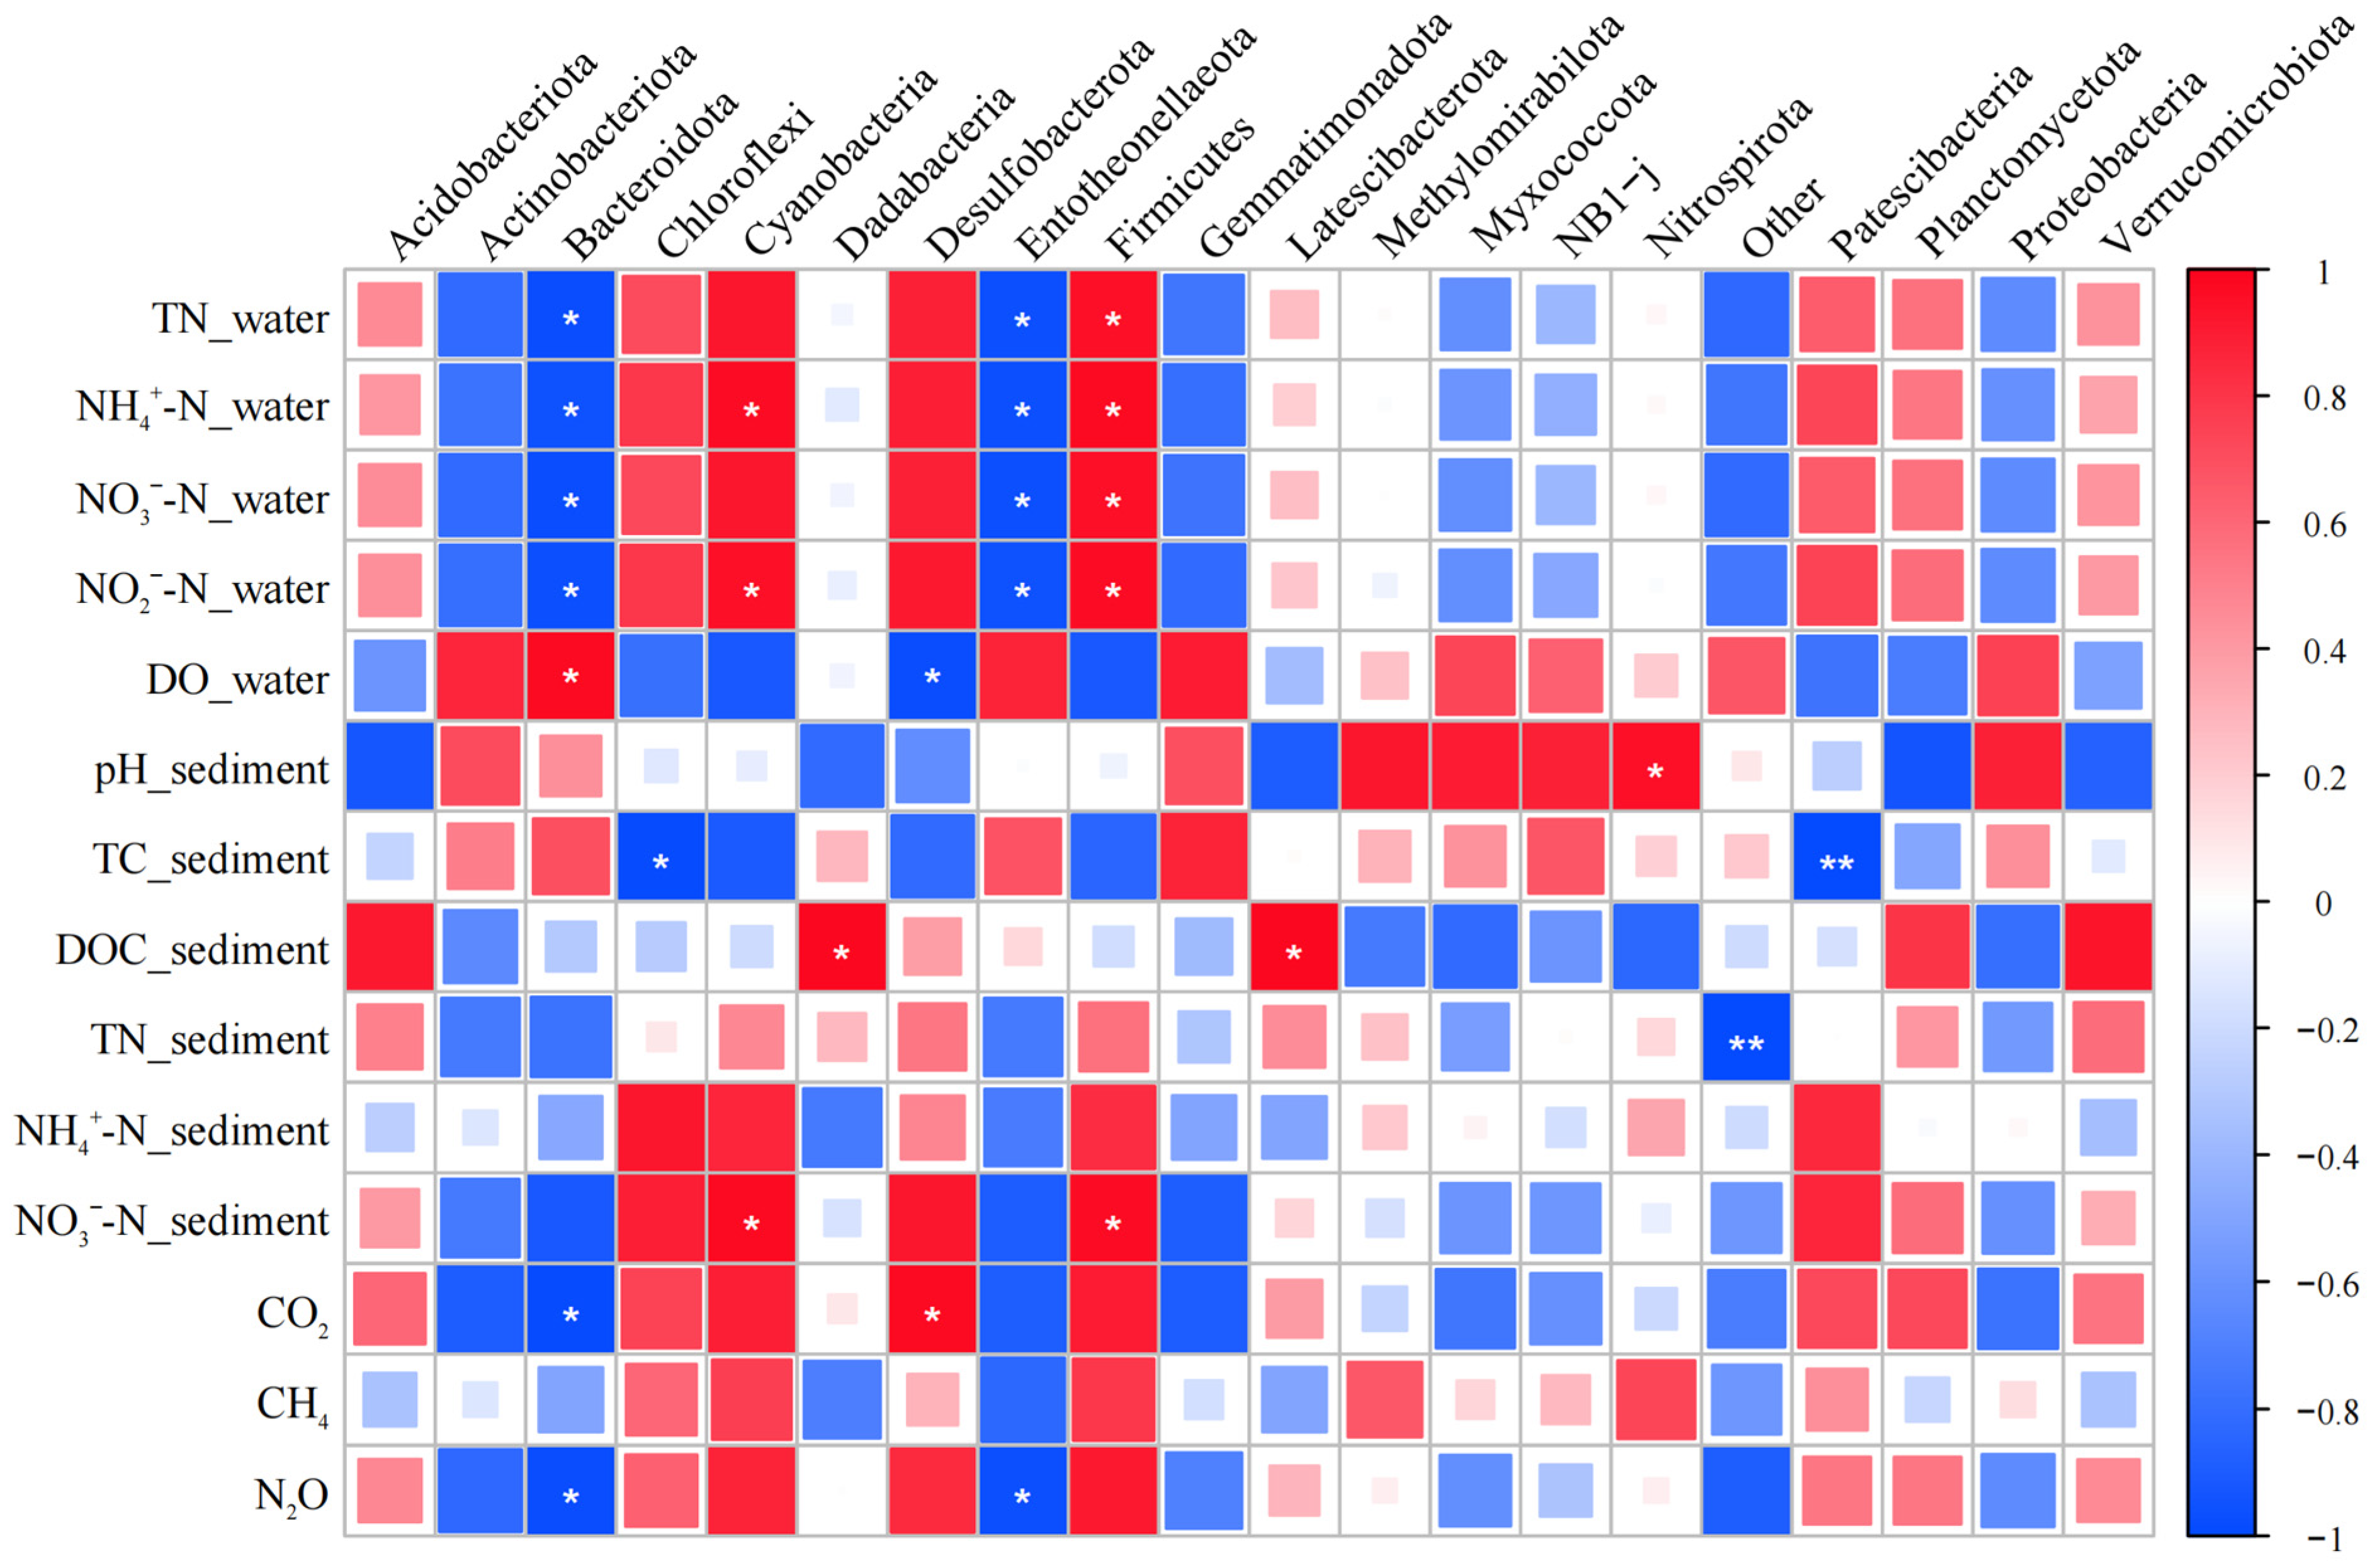
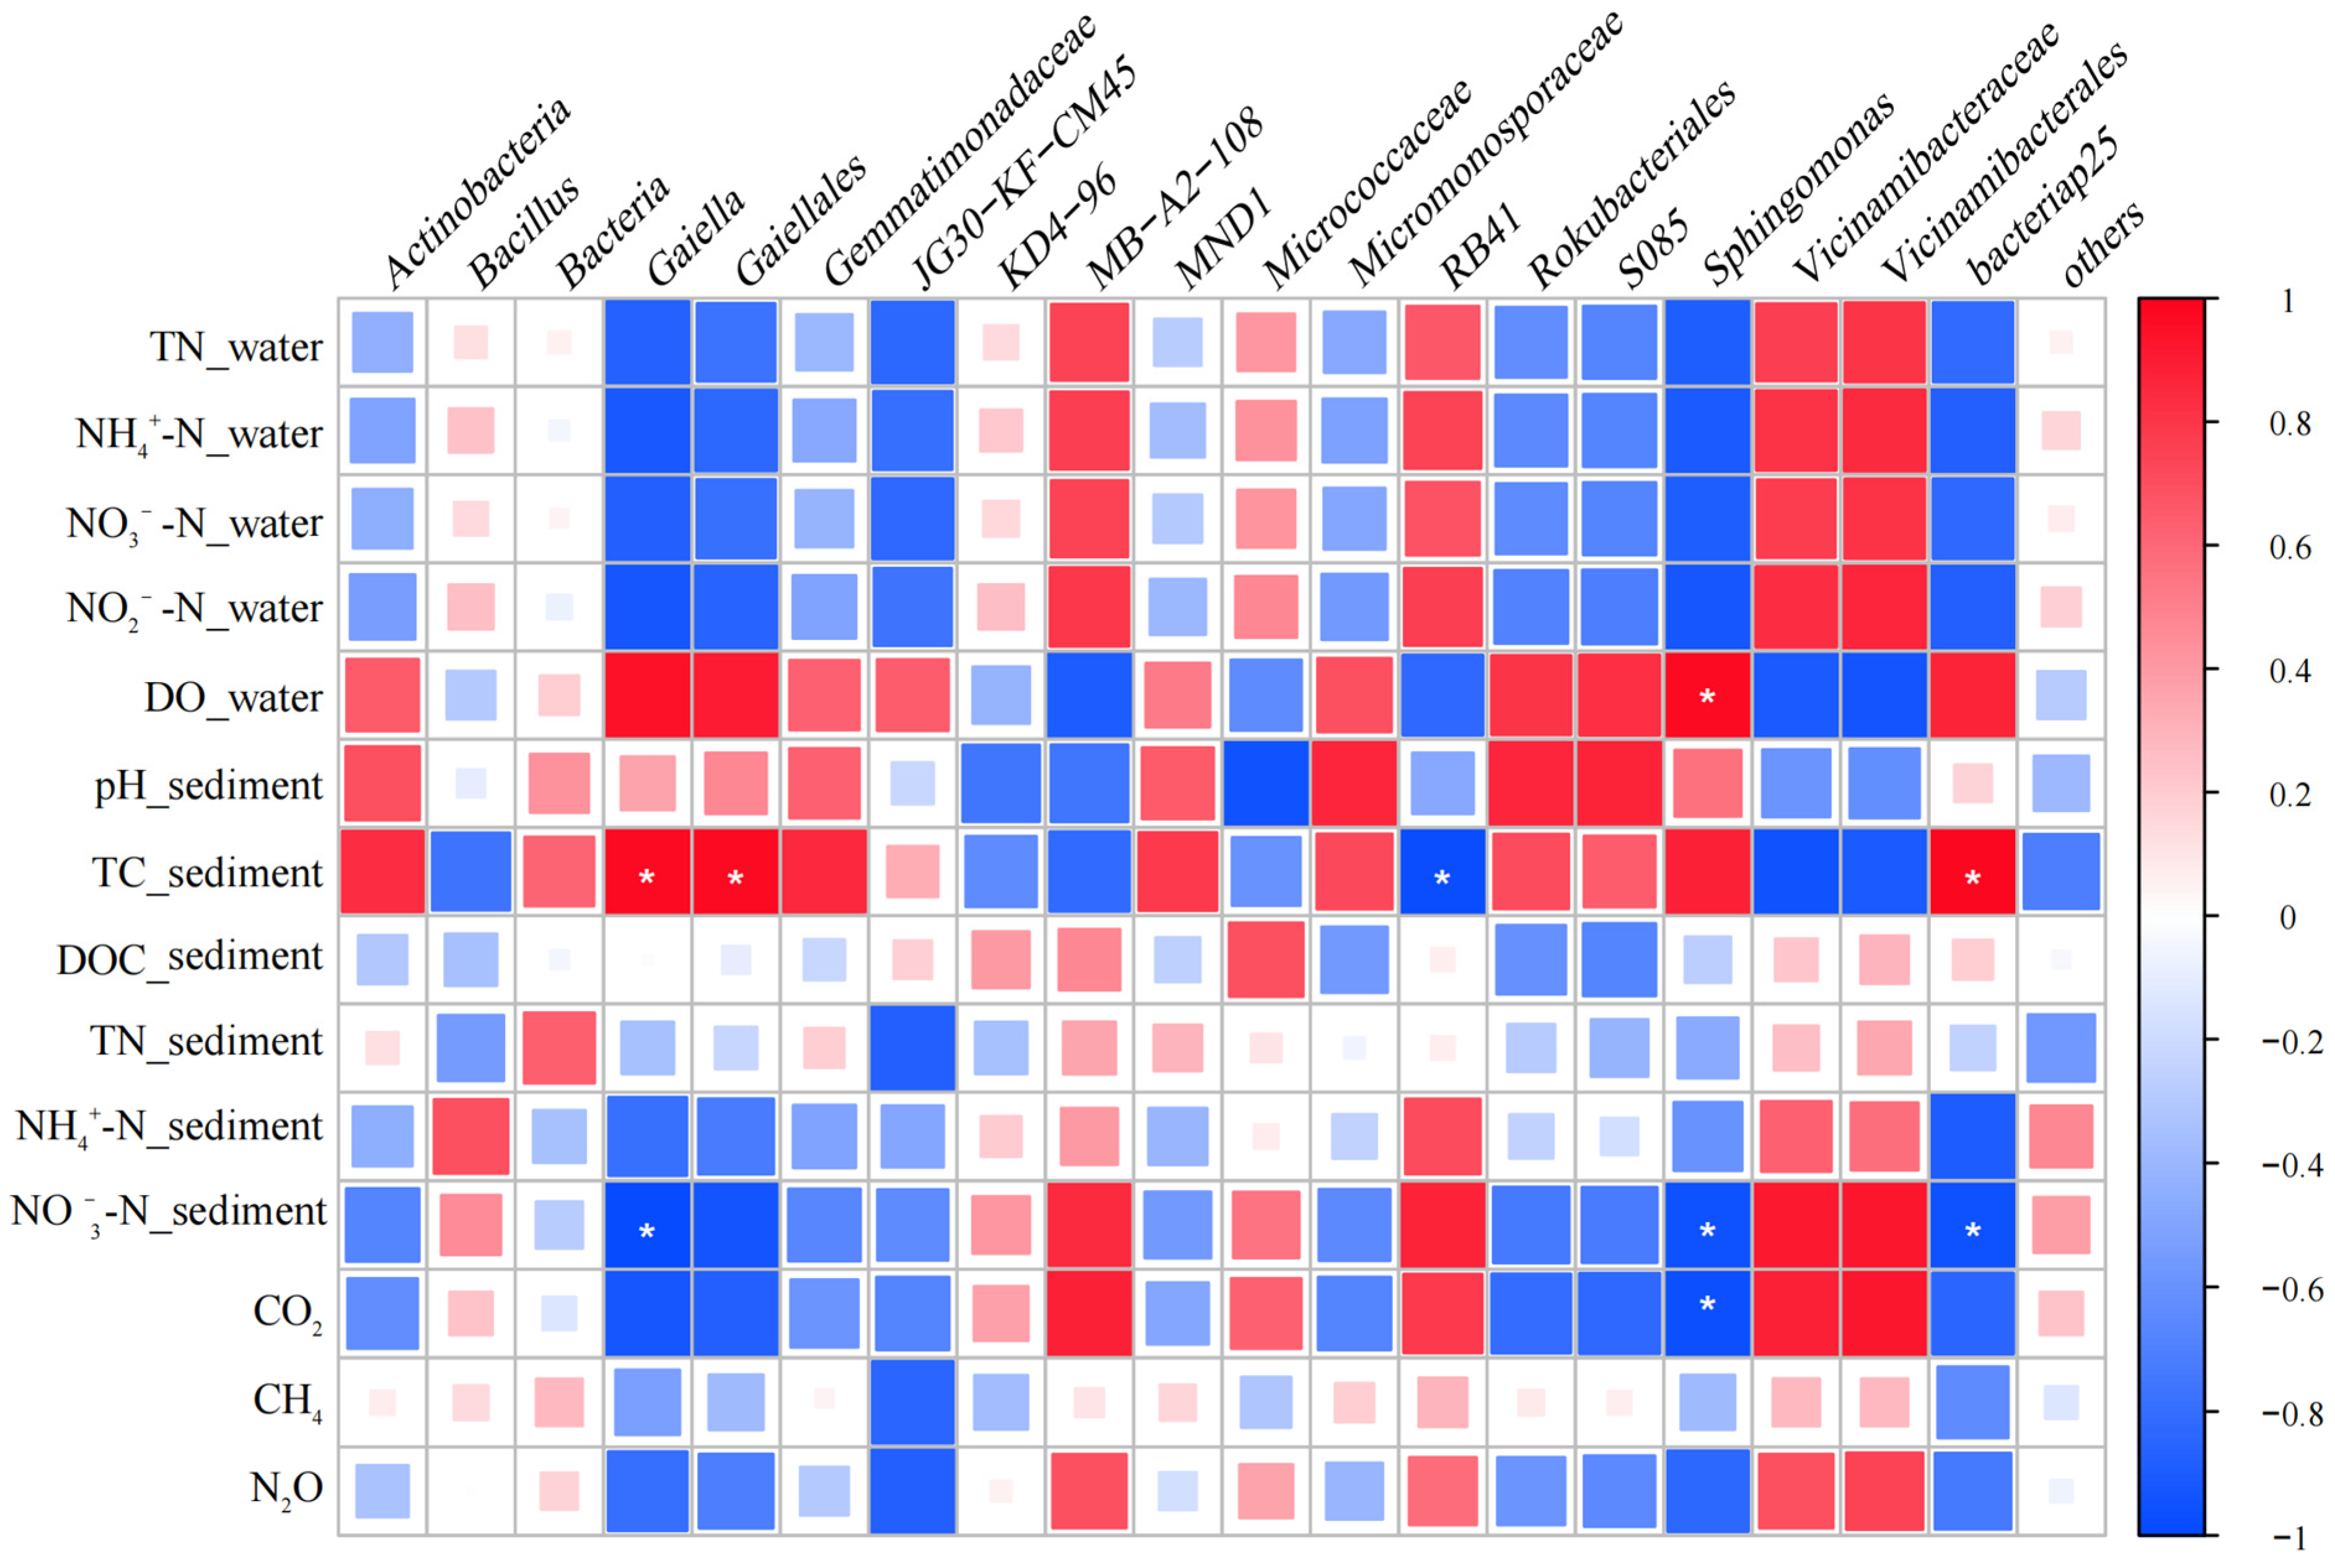
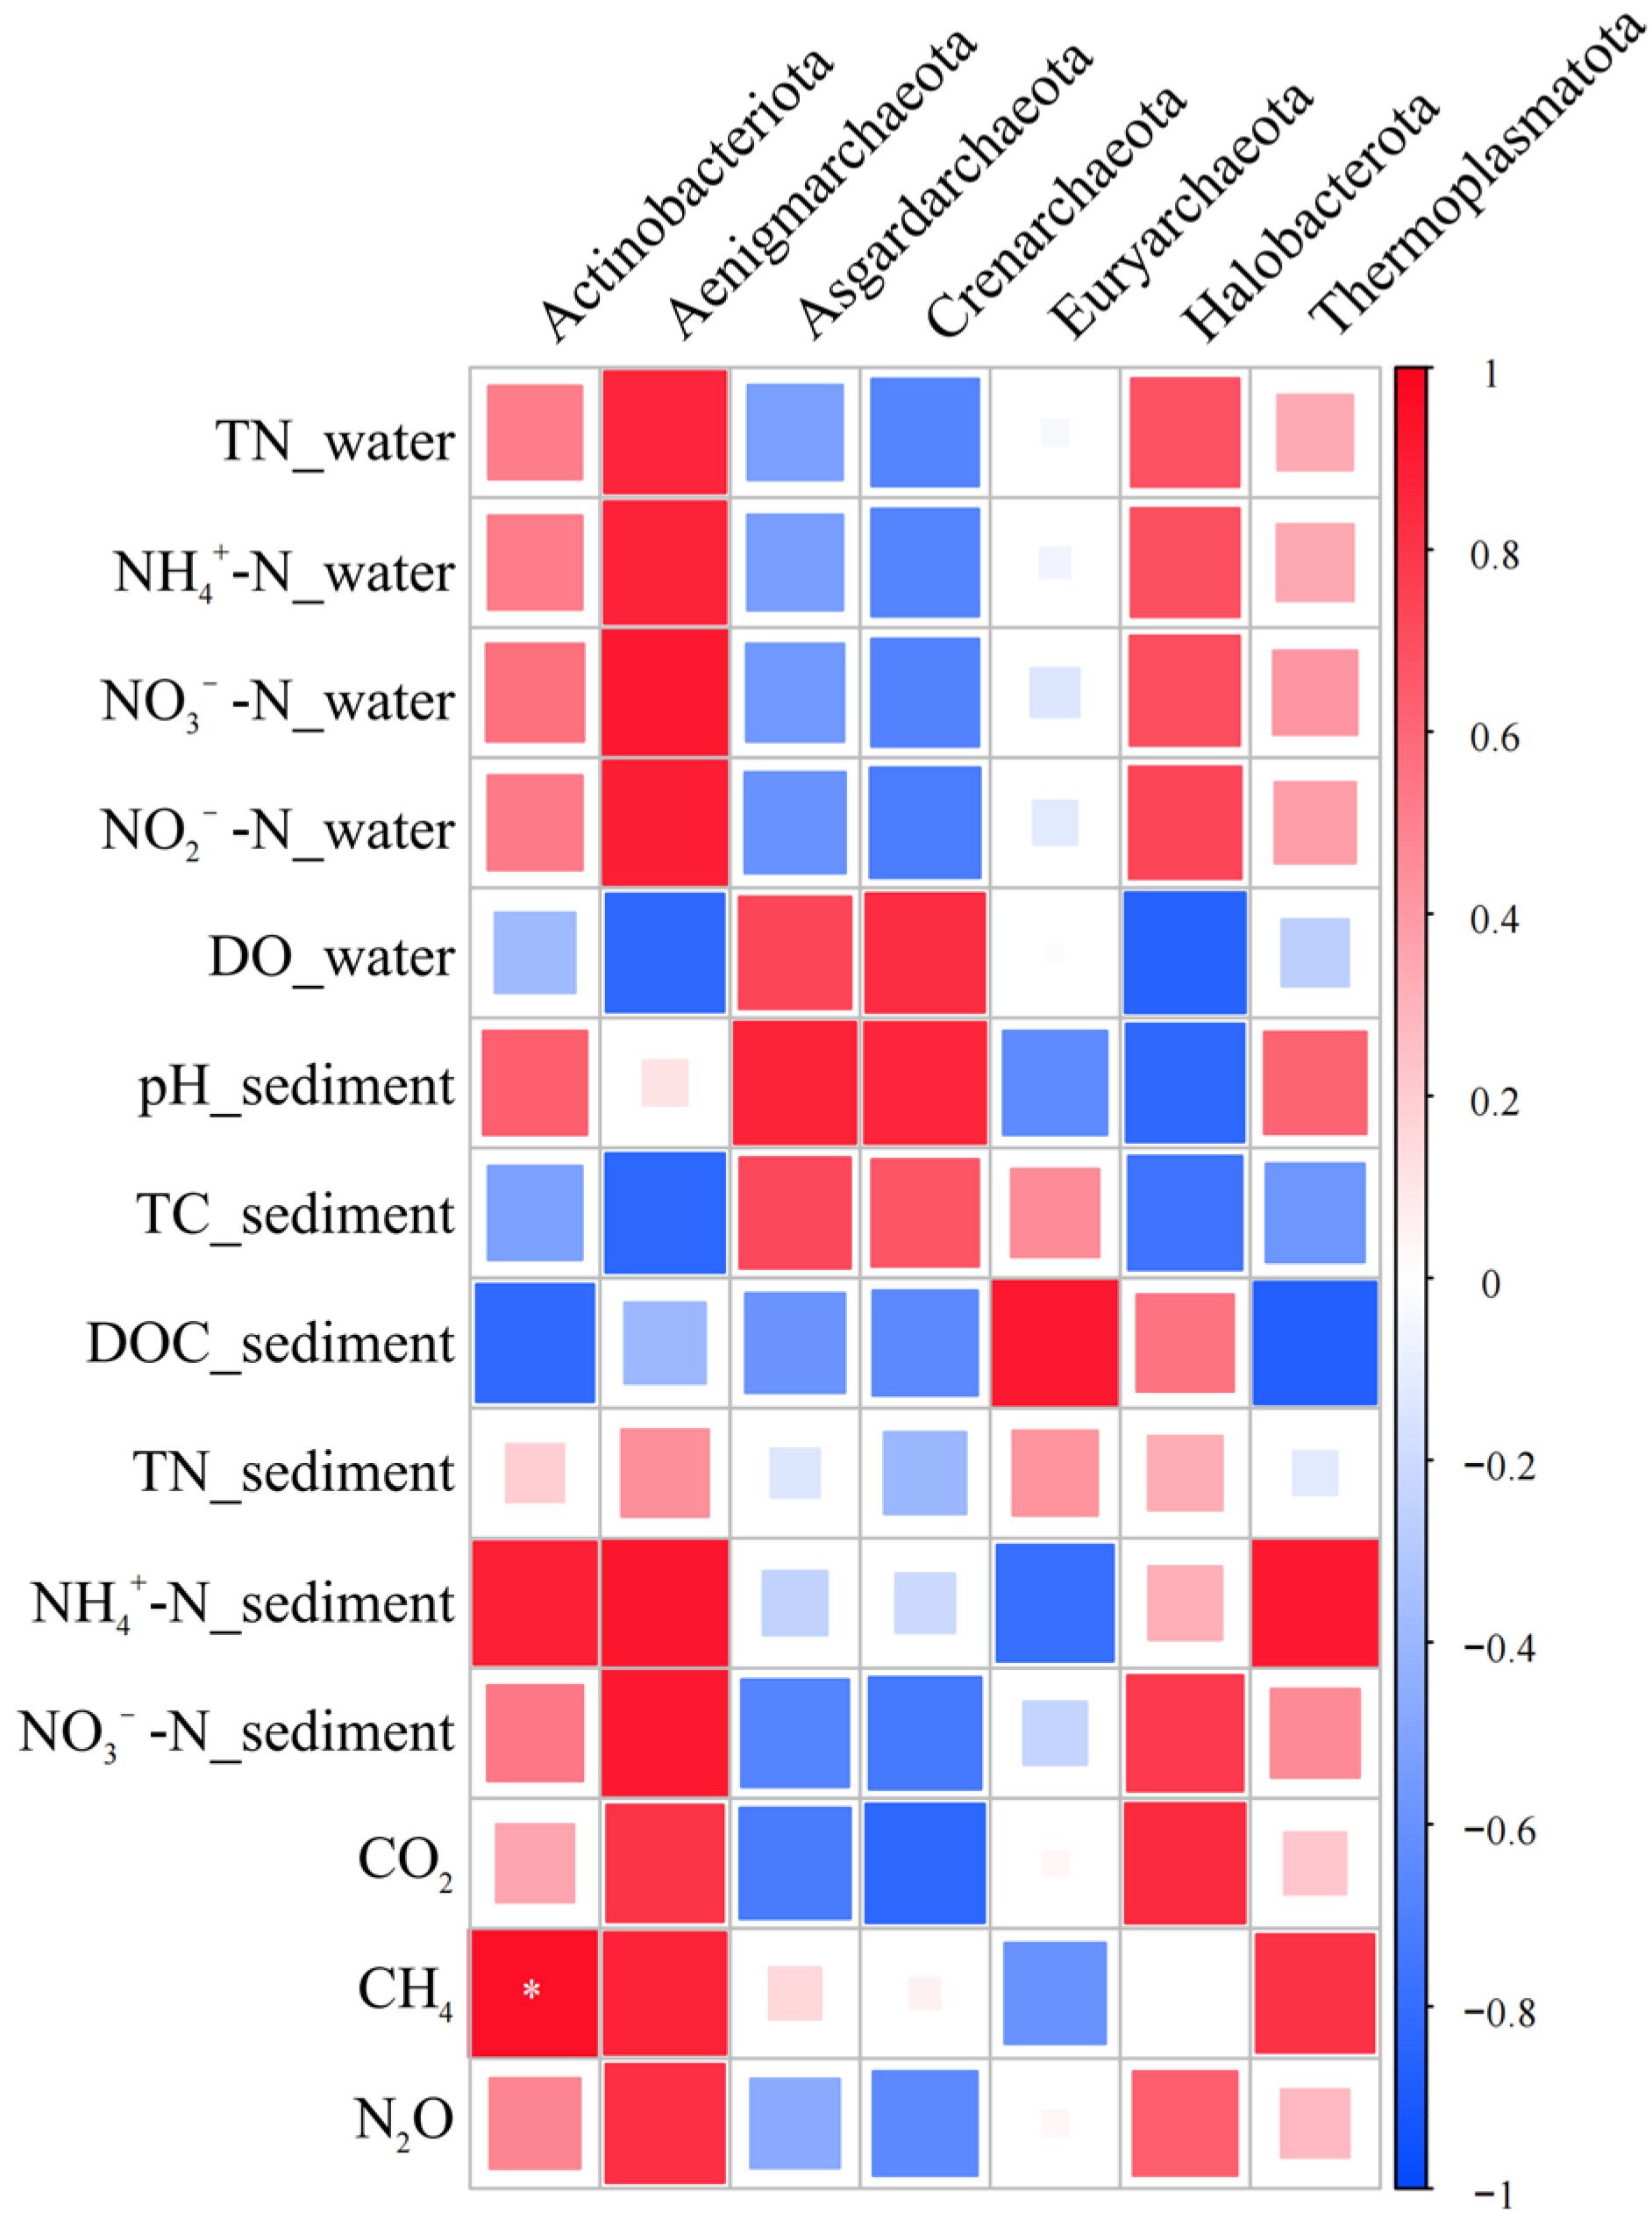
3.5. Effects of Environmental Factors and Microbial Communities on Greenhouse Gas Fluxes in P. crispus System

By analyzing the correlations between physicochemical parameters of water and sediment and greenhouse gas fluxes in the P. crispus system (Figure 9), the results revealed that CO2 flux was significantly positively correlated with NO3-N content in sediment, and TN, NH4+-N, NO3-N, and NO2-N concentrations in water, while showing a significant negative correlation with the DO concentration in water. These findings suggest that high-nitrogen loading may suppress the photosynthetic activity of P. crispus while enhancing respiratory processes. Excess nitrogen could inhibit submerged macrophyte photosynthesis through physiological stress or competition with algae, thereby reducing carbon fixation [22]. Simultaneously, the increased nitrogen availability may stimulate the respiration of sediment-associated microbial communities. This enhanced respiration accelerates the decomposition of organic matter, ultimately promoting CO2 emissions [19,20]. In addition, N2O flux was also significantly positively correlated with TN, NH4+-N, NO3N, and NO2-N concentrations in water. Numerous studies have shown that high-nitrogen inputs enhance N2O emissions by promoting nitrification and denitrification processes under fluctuating redox conditions [25,26,27]. In contrast, CH4 flux showed no significant correlation with any physicochemical parameters in either the water or sediment. This may be due to the fact that CH4 production and release are primarily governed by anaerobic microzones in deeper sediments, which are less affected by bulk water chemistry or short-term environmental changes.
The correlations among environmental factors, greenhouse gas fluxes, and microbial communities were further analyzed. At the bacterial phylum level (Figure 10), CO2 flux was significantly positively correlated with Desulfobacterota, and significantly negatively correlated with Bacteroidota. N2O flux showed significant negative correlations with both Bacteroidota and Entotheonellaeota. No significant correlations were observed between CH4 flux and bacterial phyla. At the bacterial genus level (Figure 11), CO2 flux was significantly negatively correlated with Sphingomonas. No significant correlations were found between CH4 or N2O fluxes and bacterial genera.
Further analysis of the relationships between dominant bacterial taxa and environmental factors revealed that Desulfobacterota was significantly negatively correlated with the DO concentration in water. This phylum prefers low-oxygen or anaerobic conditions and may contribute to CO2 release through its involvement in anaerobic decomposition of organic matter. Bacteroidota was significantly positively correlated with the DO concentration in water, but showed significant negative correlations with TN, NH4+-N, NO3-N, and NO2-N concentrations in water. This suggests that the activity of Bacteroidota may be inhibited under high-nitrogen conditions, thereby reducing its capacity for efficient carbon utilization, which could potentially lead to increased CO2 emissions. Entotheonellaeota also showed significant negative correlations with TN, NH4+-N, NO3-N, and NO2-N concentrations in water. Sphingomonas was significantly positively correlated with the DO concentration in water but negatively correlated with NO3-N in sediment. Both taxa are involved in carbon and nitrogen cycling processes. However, correlation analysis indicated that their abundances may be suppressed under high-nitrogen conditions.
At the archaeal phylum level (Figure 12), CH4 flux was significantly positively correlated with Actinobacteriota, while no significant correlations were observed between CO2 or N2O fluxes and archaeal phyla. At the archaeal genus level (Figure 13), CO2 flux was significantly positively correlated with Methanosaeta and Rice_Cluster_I. CH4 flux showed a significant positive correlation with Methanocellaceae, while N2O flux was significantly positively correlated with Rice_Cluster_I.
Further analysis of the correlations between dominant archaeal taxa and environmental factors revealed that Methanosaeta was significantly positively correlated with NO3-N and water NO2-N concentrations in sediment but negatively correlated with the DO concentration in water. Rice_Cluster_I showed significant positive correlations with TN, NH4+-N, NO3-N, and NO2-N concentrations in water. Both Methanosaeta and Rice_Cluster_I are anaerobic methanogens, although they differ in metabolic pathways: Methanosaeta converts acetate directly into CH4 and CO2, whereas Rice_Cluster_I utilizes H2 and CO2 for methanogenesis. In this study, high-nitrogen loading may have accelerated organic matter mineralization, increasing the availability of H2 and CO2 for Rice_Cluster_I. However, due to the already elevated nitrogen concentrations, other microbial groups might have competed for electron acceptors, thereby inhibiting Rice_Cluster_I activity. In contrast, Methanosaeta has a high affinity for acetate and may not be suppressed by high NO₃-N concentrations, potentially leading to more CO2 accumulation.
It is worth noting that although Methanocellaceae and Actinobacteriota were significantly correlated with CH4 flux, they did not exhibit strong correlations with environmental factors. This suggests that CH4 emissions are likely governed more by the metabolic balance between methanogenic and methanotrophic archaea and their community structure, rather than by any single environmental factor.
In summary, this study identified several key microbial taxa that were significantly associated with greenhouse gas fluxes. These included bacterial groups, such as Desulfobacterota, Bacteroidota, Entotheonellaeota, and Sphingomonas, as well as archaeal groups, including Actinobacteriota, Methanosaeta, Rice_Cluster, and Methanosarcina. These microbial groups played important ecological roles in carbon and nitrogen transformation processes—such as denitrification and methanogenesis—and significantly influenced the emission intensities of CO2, CH4, and N2O.

4. Conclusions

By constructing an indoor hydroponic simulation system, this study investigated the remediation performance of P. crispus under different nitrogen-loading conditions, and the following conclusions were drawn:
  • P. crispus effectively removed NH4+-N, NO3-N, and NO2-N, and maintained a high denitrification capacity even under high-nitrogen loading. Under all nitrogen-loading conditions, TN removal rates exceeded 80%, while the removal efficiencies of NH4+-N and NO3-N both exceeded 90%, with effective suppression of NO2-N accumulation.
  • Through root exudation and rhizosphere regulation, P. crispus contributed to the accumulation and transformation of carbon and nitrogen fractions in sediments, particularly promoting DOC enrichment and NO3-N removal. However, high-nitrogen loading may disrupt microbial processes or weaken plant uptake capacity, thereby affecting sedimentary carbon–nitrogen balance.
  • The dominant bacterial phyla were mainly Proteobacteria, Actinobacteriota, and Acidobacteriota, whose enrichment was promoted by the presence of P. crispus. In archaeal communities, Crenarchaeota was the predominant phylum, and its relative abundance was reduced by both P. crispus and increased nitrogen loading.
  • The P. crispus system functioned overall as a carbon sink, demonstrating strong CO2 uptake capacity, although this carbon sink function weakened with increasing nitrogen load. CH4 emissions remained low but showed a slight increase under higher nitrogen loading. N2O flux was significantly influenced by nitrogen input, with negative fluxes observed under low-nitrogen conditions and substantial increases under high-nitrogen loading.
  • Correlation analyses between greenhouse gas fluxes, environmental factors, and microbial communities in the P. crispus system identified several key microbial groups closely associated with CO2, CH4, and N2O emissions. These included bacterial taxa, such as Desulfobacterota, Bacteroidota, Entotheonellaeota, and Sphingomonas, and archaeal groups, including Actinobacteriota, Methanosaeta, Rice Cluster I, and Methanosarcina. The results indicated that CO2 and N2O fluxes were primarily regulated by microbial groups involved in carbon and nitrogen transformation, whereas CH4 emissions were mainly driven by methanogenic archaea and showed weaker direct correlations with environmental factors.

Supplementary Materials

The following supporting information can be downloaded at: https://www.mdpi.com/article/10.3390/atmos16070803/s1, Table S1: Changes in water temperature over time during the experimental period.

Author Contributions

Investigation, B.W., L.Z. and X.W.; Writing—original draft, X.L. (Xiaoyi Li); Writing—review & editing, X.L. (Xiaoxiu Lun); Supervision, J.N. All authors have read and agreed to the published version of the manuscript.

Funding

This research was funded by the National Key Research and Development Program of China, grant number [2024YFF1306304]. And The APC was supported by non-institutional funding.

Institutional Review Board Statement

Not applicable.

Informed Consent Statement

Not applicable.

Data Availability Statement

The original contributions presented in this study are included in the article/Supplementary Materials. Further inquiries can be directed to the corresponding author.

Acknowledgments

This study was supported by the National Key Research and Development Program of China (No. 2024YFF1306304) and the 5.5 Engineering Research and Innovation Team Project of Beijing Forestry University (BLRC2023B04).

Conflicts of Interest

The authors declare no conflict of interest.

References

  1. Deng, Y.; Jiang, W.; Wu, Z.; Peng, K.; Ling, Z.; Li, Z.; Wang, X. Assessing and Characterizing Carbon Storage in Wetlands of the Guangdong-Hong Kong-Macau Greater Bay Area, China, During 1995–2020. IEEE J. Sel. Top. Appl. Earth Obs. Remote Sens. 2022, 15, 610–630. [Google Scholar] [CrossRef]
  2. Lal, R. Carbon Sequestration. Philos. Trans. R. Soc. B Biol. Sci. 2008, 363, 815–830. [Google Scholar] [CrossRef]
  3. Roulet, N.T. Peatlands, Carbon Storage, Greenhouse Gases, and the Kyoto Protocol: Prospects and Significance for Canada. Wetlands 2000, 20, 605–615. [Google Scholar] [CrossRef]
  4. Fang, J.; Yu, G.; Liu, L.; Hu, S.; Chapin, F.S., III. Climate Change, Human Impacts, and Carbon Sequestration in China. Proc. Natl. Acad. Sci. USA 2018, 115, 4015–4020. [Google Scholar] [CrossRef]
  5. Harris, N.L.; Gibbs, D.A.; Baccini, A.; Birdsey, R.A.; de Bruin, S.; Farina, M.; Fatoyinbo, L.; Hansen, M.C.; Herold, M.; Houghton, R.A.; et al. Global Maps of Twenty-First Century Forest Carbon Fluxes. Nat. Clim. Change 2021, 11, 234–240. [Google Scholar] [CrossRef]
  6. IPCC. 2019 General Guidance and Reporting. In Refinement to the 2006 IPCC Guidelines for National Greenhouse Gas Inventories; Intergovernmental Panel on Climate Change: Geneva, Switzerland, 2019; Volume 1, Available online: https://www.ipcc.ch/ (accessed on 28 April 2025).
  7. Goodbred, S.L., Jr. Morphodynamic feedbacks in tidal estuaries under sea-level rise. Nat. Clim. Change 2019, 9, 907–910. [Google Scholar] [CrossRef]
  8. Cai, Y.; Liang, J.; Zhang, P.; Wang, Q.; Wu, Y.; Ding, Y.; Wang, H.; Fu, C.; Sun, J. Review on strategies of close-to-natural wetland restoration and a brief case plan for a typical wetland in northern China. Chemosphere 2021, 285, 131534. [Google Scholar] [CrossRef]
  9. Chmura, G.L.; Anisfeld, S.C.; Cahoon, D.R.; Lynch, J.C. Global carbon sequestration in tidal, saline wetland soils. Glob. Biogeochem. Cycles 2003, 17, 1111. [Google Scholar] [CrossRef]
  10. Duan, M.; Xu, W.; Yuan, F.; Meng, X.; Zhang, S.; Zhang, J. Analysis on the trend and nutritional status of water environment quality in Baiyangdian Lake in recent 5 years. Environ. Chem. 2022, 41, 1988–2000. [Google Scholar] [CrossRef]
  11. Zhao, Q.; Wang, J.; Wei, H.; Li, J.; Zhang, Y. Variation characteristics of nitrogen, phosphorus and heavy metals in waters from Baiyangdian Lake and the influencing factors. J. Water Resour. Water Eng. 2020, 31, 103–108. [Google Scholar] [CrossRef]
  12. Zhou, Y.; Zhou, X.; Han, R.; Xu, X.; Wang, G.; Liu, X.; Bi, F.; Feng, D. Reproduction capacity of Potamogeton crispus fragments and its role in water purification and algae inhibition in eutrophic lakes. Sci. Total Environ. 2017, 580, 1421–1428. [Google Scholar] [CrossRef] [PubMed]
  13. Nie, M.; Li, Z. Biological processes and influencing factors of nitrite accumulation in aquatic systems: A review. J. Ecol. Rural. Environ. 2023, 39, 518–526. [Google Scholar]
  14. GB 3838-2002; Environmental Quality Standards for Surface Water. Ministry of Environmental Protection of China & General Administration of Quality Supervision, Inspection and Quarantine of China, China Environmental Science Press: Beijing, China, 2002.
  15. Liu, X.; Shi, B.; Meng, J.; Zhou, Y.; Ke, X.; Wang, T. Spatio-temporal variations in the characteristics of water eutrophication and sediment pollution in Baiyangdian Lake. Environ. Sci. 2020, 41, 2127–2136. [Google Scholar] [CrossRef]
  16. Ren, W.; Tian, Z.; Hu, X.; Liu, X.; Ning, G.; Wang, X.; Xie, J. Biomass of Potamogeton crispus and Dynamic Change of Water Quality on Different Growth Periods in Baiyangdian Lake. J. Agric. Univ. Hebei 2011, 34, 21–28. [Google Scholar]
  17. Jin, S.; Li, Y.; Ni, C.; Wang, B. Uptake by Potamogeton crispus of nitrogen and phosphorus from water and some affecting factors. Acta Ecol. Sin. 1994, 14, 169–173. [Google Scholar]
  18. Wang, H.; Li, X.; Liu, J.; Ao, H.; Liu, B. Study on the water purification performance of Potamogeton crispus in different habitats in winter. Environ. Pollut. Control 2012, 34, 40–44. [Google Scholar] [CrossRef]
  19. Luo, L.; Yu, J.; Zhu, L.; Gikas, P.; He, Y.; Xiao, Y.; Deng, S.; Zhang, Y.; Zhang, S.; Zhou, W.; et al. Nitrogen addition may promote soil organic carbon storage and CO2 emission but reduce dissolved organic carbon in Zoige peatland. J. Environ. Manag. 2022, 324, 116376. [Google Scholar] [CrossRef]
  20. Tao, B.; Liu, C.; Zhang, B.; Dong, J. Effects of inorganic and organic nitrogen additions on CO2 emissions in the coastal wetlands of the Yellow River Delta, China. Atmos. Environ. 2018, 185, 159–167. [Google Scholar] [CrossRef]
  21. Zhuang, S.; Ding, J.; Lin, W.; Zheng, Q.; Kou, X.; Li, Q.; Xu, C.; Mao, L.; Pan, Y.; Gao, Y.; et al. Effect of nitrogen loading on microbial nitrogen cycling and greenhouse gas emissions in paddy soil. Soil Biol. Biochem. 2024, 185, 108010. [Google Scholar] [CrossRef]
  22. Tubay, J.M.; Ito, H.; Uehara, T.; Kakishima, S.; Morita, S.; Togashi, T.; Tainaka, K.-I.; Niraula, M.P.; Casareto, B.E.; Suzuki, Y.; et al. The paradox of enrichment in phytoplankton by induced competitive interactions. Sci. Rep. 2013, 3, 2835. [Google Scholar] [CrossRef]
  23. Niu, C.; He, Z.X.; Ge, Y.; Chang, J.; Lu, Z.M. Effect of plant species richness on methane fluxes and associated microbial processes in wetland microcosms. Ecol. Eng. 2015, 84, 250–259. [Google Scholar] [CrossRef]
  24. Wang, Y.H.; Yang, H.; Ye, C.; Chen, X.; Xie, B.; Huang, C.C.; Zhang, J.X.; Xu, M.N. Effects of plant species on soil microbial processes and CH4 emission from constructed wetlands. Environ. Pollut. 2013, 174, 273–278. [Google Scholar] [CrossRef] [PubMed]
  25. García-Lledó, A.; Vilar-Sanz, A.; Trias, R.; Hallin, S.; Bañeras, L. Genetic potential for N2O emissions from the sediment of a free water surface constructed wetland. Water Res. 2011, 45, 5621–5632. [Google Scholar] [CrossRef] [PubMed]
  26. Moseman-Valtierra, S.; Gonzalez, R.; Kroeger, K.D.; Tang, J.; Chao, W.C.; Crusius, J.; Bratton, J.; Green, A.; Shelton, J. Short-term nitrogen additions can shift a coastal wetland from a sink to a source of N2O. Atmos. Environ. 2011, 45, 4390–4397. [Google Scholar] [CrossRef]
  27. Feng, Y.; Song, Y.; Zhu, M.; Li, M.; Gong, C.; Luo, S.; Mei, W.; Feng, H.; Tan, W.; Song, C. Microbes drive more carbon dioxide and nitrous oxide emissions from wetland under long-term nitrogen enrichment. Water Res. 2025, 272, 122942. [Google Scholar] [CrossRef]
Figure 1. Schematic diagram of the experimental design (a) P. crispus system: Treatment group with P. crispus planted in sediment. (b) Unvegetated system: Control group with sediment but without P. crispus. (Note: all nitrogen forms (e.g., TN, NH4+, NO3, and NO2) are reported as compound concentrations in mg∙L−1).
Atmosphere 16 00803 g001
Figure 2. Changes in TN, NH4+-N, NO3-N, and NO2-N concentrations under four different nitrogen pollution gradients (a,b) TN concentration and removal efficiency in P. crispus system and unvegetated system, respectively. (c,d) NH4+-N concentration and removal efficiency in P. crispus system and unvegetated system. (e,f) NO3-N concentration and removal efficiency in P. crispus system and unvegetated system.(g,h) NO2-N concentration in P. crispus system and unvegetated system.
Atmosphere 16 00803 g002
Figure 3. Changes in DO under four different nitrogen pollution gradients in water body.
Atmosphere 16 00803 g003
Figure 4. Carbon composition characteristics of sediment under different nitrogen-loading conditions (a,b) TC content in sediment in P. crispus system and unvegetated system. (c,d) DOC content in sediment in P. crispus system and unvegetated system (Note: different lowercase letters above the bars indicate significant differences between treatments based on one-way ANOVA followed by post-hoc tests (p < 0.05)).
Atmosphere 16 00803 g004
Figure 5. Nitrogen composition characteristics of sediment under different nitrogen-loading conditions (a,b) TN content in sediment in P. crispus system and unvegetated system. (c,d) NH4+-N content in sediment in P. crispus system and unvegetated system (e,f) NO3-N content in sediment in P. crispus system and unvegetated system (Note: different lowercase letters above the bars indicate significant differences between treatments based on one-way ANOVA followed by post-hoc tests (p < 0.05)).
Atmosphere 16 00803 g005
Figure 6. The composition analysis of bacterial communities at the phylum (a) and genus (b) levels.
Atmosphere 16 00803 g006
Figure 7. The composition analysis of archaeal communities at the phylum (a) and genus (b) levels.
Atmosphere 16 00803 g007
Figure 8. The variation of CO2, CH4, and N2O exchange fluxes in P. crispus system (a) The variation of CO2 exchange flux (b) The variation of CH4 exchange flux (c) The variation of N2O exchange flux.
Atmosphere 16 00803 g008
Figure 9. Correlation analysis of environmental factors and greenhouse gas fluxes (* p < 0.05; ** p < 0.01; *** p < 0.001).
Atmosphere 16 00803 g009
Figure 10. Correlation analysis of environmental factors, greenhouse gas fluxes, and bacterial phylum (* p < 0.05; ** p < 0.01).
Atmosphere 16 00803 g010
Figure 11. Correlation analysis of environmental factors, greenhouse gas fluxes, and bacterial genus (* p < 0.05).
Atmosphere 16 00803 g011
Figure 12. Correlation analysis of environmental factors, greenhouse gas fluxes, and archaea level (* p < 0.05).
Atmosphere 16 00803 g012
Figure 13. Correlation analysis of environmental factors, greenhouse gas fluxes, and archaeal genus level (* p < 0.05; ** p < 0.01).
Atmosphere 16 00803 g013
Table 1. Initial sediment condition.
IndicesSOCTCTN
Content13.65 ± 0.82 g∙kg−126.90 ± 8.18 g∙kg−12.64 ± 0.73 g∙kg−1
Disclaimer/Publisher’s Note: The statements, opinions and data contained in all publications are solely those of the individual author(s) and contributor(s) and not of MDPI and/or the editor(s). MDPI and/or the editor(s) disclaim responsibility for any injury to people or property resulting from any ideas, methods, instructions or products referred to in the content.

