Article

Spatial Variability and Time Stability of Throughfall in a Moso Bamboo (Phyllostachys edulis) Forest in Jinyun Mountain, China

1
College of Resources and Environment, Qingdao Agricultural University, Qingdao 266109, China
2
Jinyun Forest Ecosystem Research Station, School of Soil and Water Conservation, Beijing Forestry University, Beijing 100083, China
*
Author to whom correspondence should be addressed.
Atmosphere 2025, 16(7), 787; https://doi.org/10.3390/atmos16070787 (registering DOI)
Submission received: 26 May 2025 / Revised: 17 June 2025 / Accepted: 24 June 2025 / Published: 27 June 2025
(This article belongs to the Section Meteorology)

Abstract

Moso bamboo (Phyllostachys pubescens) is one of the most common species of bamboo in East Asia, and plays a crucial role in regulating hydrological and biogeochemical processes in forest ecosystems. However, throughfall variability and its time stability in Moso bamboo forests remain unclear. Here, we investigated the spatial variability and temporal stability of throughfall in a Moso bamboo forest in China, and the effects of rainfall characteristics and leaf area index (LAI) on the variability of throughfall, and tree locations on the temporal stability of throughfall were systematically evaluated. The results show that throughfall occupied 74.3% of rainfall in the forest. The coefficient of variation of throughfall (throughfall CV) for rainfall events and throughfall collectors were 18.1% and 19.5%, respectively, and the spatial autocorrelation of the throughfall CV was not significant according to the global Moran’s I. Throughfall CV had a significantly negative correlation with rainfall amount and rainfall intensity, whereas it increased with the increase in LAI. The temporal stability plot indicated that the extreme wet and dry persistence were highly stable. We also found that normalized throughfall increased with the increase in distance from the nearest tree trunk. Our findings are expected to assist in the accurate assessment of throughfall and soil water within bamboo forests.

1. Introduction

Gross rainfall partitions into throughfall, stemflow, and interception loss as it passes through the forest canopy [1,2,3]. Commonly, throughfall is the largest portion of rainfall reaching the forest floor as free throughfall (without interception by the canopy), splash throughfall, and canopy drip throughfall, and usually constitutes 60–90% of gross rainfall [4]. As the actual amount of water that reaches the forest floor, the spatial distribution of throughfall influences soil infiltration and erosion, soil moisture distribution, sub-surface runoff, and flood generation [5,6,7], and to some extent, it also affects the input of nutrient elements in the soil [8,9,10]. Therefore, we should pay greater attention to its spatiotemporal distribution.
Many field monitoring studies have indicated that the spatial variability of throughfall is affected by many factors, including meteorological conditions (e.g., rainfall amount, rainfall intensity, wind speed, air temperature and evaporation), and canopy structure (e.g., tree species, canopy thickness, and LAI). Among these, meteorological conditions have a more direct effect on the amount of throughfall and its spatiotemporal distribution. Throughfall variability reduced with the increase in rainfall amount [11,12]. Zhang et al. [13] found that throughfall variability was affected mainly by rainfall intensity, wind speed, and air temperature. Meanwhile, numerous studies have explored the relationship between the canopy structure factor and throughfall, but up to now, there are different opinions regarding how the spatial distribution of throughfall varies. For example, Sheng et al. [12] showed that throughfall variability increased with the increase in LAI, but Dietz et al. [14] and Teale et al. [15] reported that LAI had no significant relationship with rainfall distribution patterns. Another factor, the distance from the tree trunk, has often been used to estimate the spatial variability of throughfall, and several studies have found that throughfall increases with the increasing distance from the trunk [12,16]. Li et al. [17] and Shi et al. [18] found that there was a positive correlation between the distance from the trunk and throughfall, and the minimum throughfall appeared at 2–3 m and 1–2 m from the trunk, respectively. However, this is not a uniform effect; numerous studies have reported that throughfall variability is not related to the distance from the tree trunk [19,20,21]. Additionally, Keim et al. [22] concluded that the relationship between throughfall and the distance from the tree trunk depended on the species and age of the tree. Obviously, differences in tree species, leaf phenology, and even leaf shapes can lead to throughfall spatial heterogeneity, and the relationship between the spatial variability of throughfall and canopy structure remains unclear.
Temporal variations in throughfall may also serve as a significant controlling factor for watershed hydrology and biogeochemistry [23]. However, compared to the throughfall variability, current research has received insufficient attention regarding its temporal stability. Some studies have revealed that the spatial pattern of throughfall under the canopy demonstrates considerable temporal stability across various rainfall events [22,24,25]. Meanwhile, Germer et al. [26] and Sun et al. [21] have also revealed that the spatial pattern of canopy throughfall exhibits significant temporal variability during the observation period. Additionally, the temporal stability of throughfall is similarly affected by both the timing of observations. For instance, Zimmermann et al. [9] discovered that the temporal stability of throughfall in tropical deciduous forests diminished after one year. Therefore, it is urgently necessary to carry out long-term throughfall observations to adequately capture the dynamics of canopy structure changes.
Bamboo forest is an important forest type in tropical and subtropical areas [27], and plays an important role in maintaining ecological balance, controlling soil erosion, conserving water sources, as well as reducing carbon emissions and global carbon balance [28]. Moso bamboo (Phyllostachys pubescens) is one of the most common species of bamboo in East Asia [29]. Because of its ecological value, economic value, and cultural landscape value, it is widely distributed in southern mountainous regions, and accounts for about 60% of the total area of bamboo forests in China. According to studies conducted in different forest types, the spatial distribution of throughfall is essential for a wide range of ecohydrological problems [30,31]. Nevertheless, understanding the distribution patterns of throughfall in a Moso bamboo forest has not been adequately characterized to date. Therefore, in this paper, we investigate the spatiotemporal patterns of throughfall in a Moso bamboo forest. The objectives of the study are (1) to quantify the spatial variability of throughfall (both at individual rainfall event and individual collectors); (2) to investigate the effects of rainfall characteristics and canopy structure on the variability of throughfall; and (3) to examine the temporal stability of spatial throughfall patterns, and to relate spatial throughfall patterns to tree locations.

2. Materials and Methods
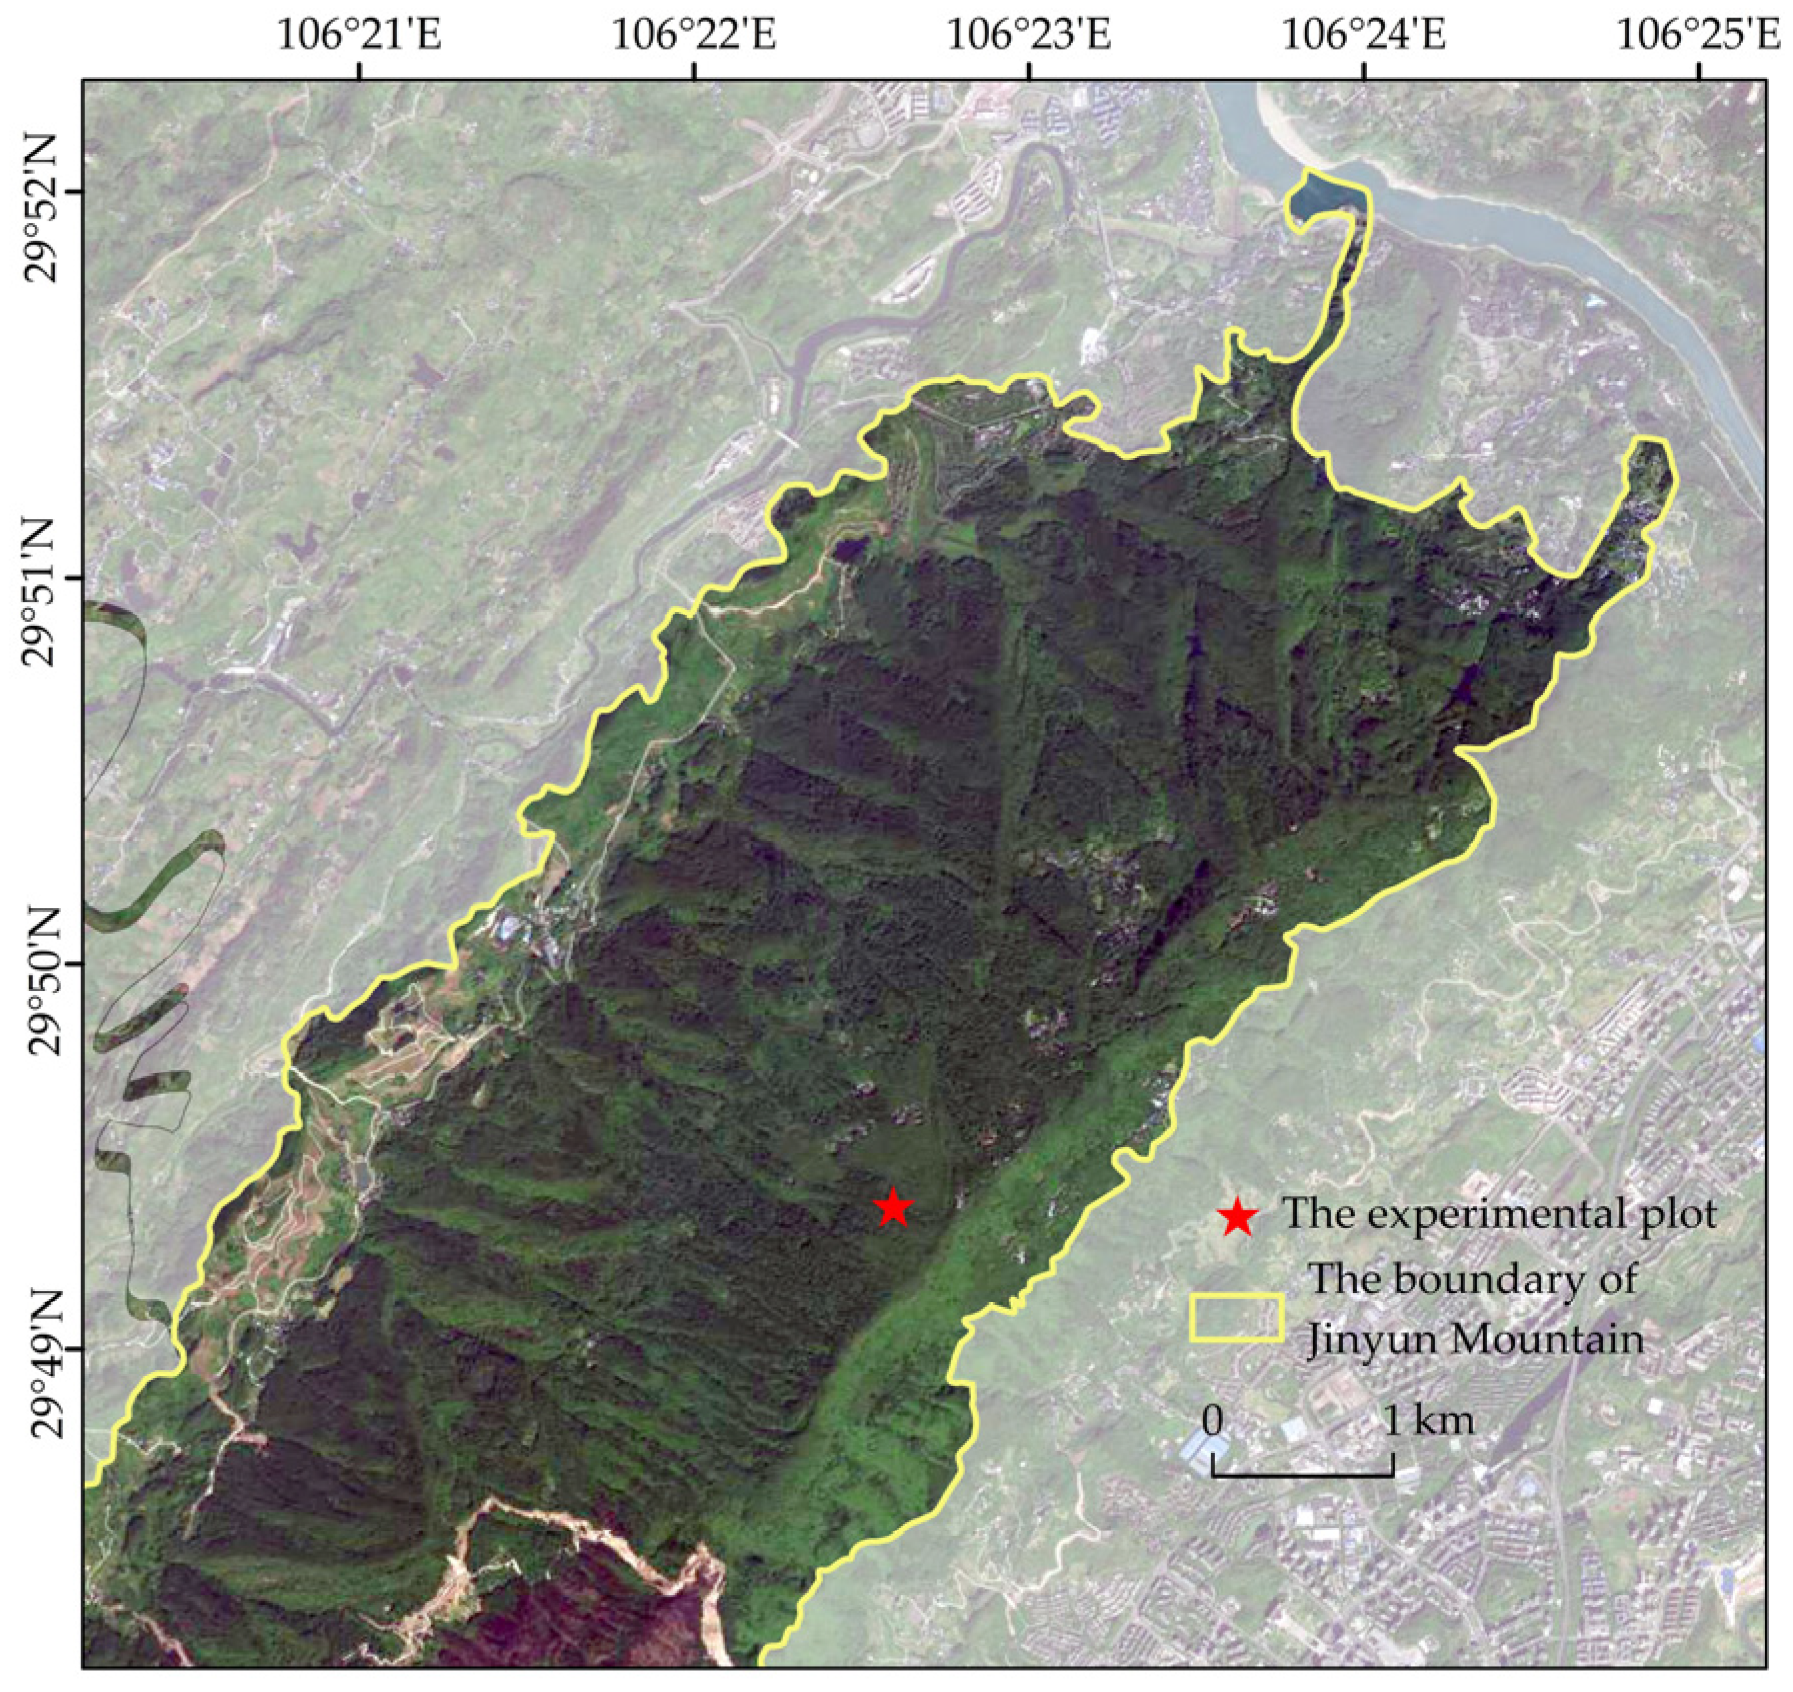
2.1. Study Site

The study site is located in Jinyun Mountain National Nature Reserve (106°17′ to 106°24′ E, 29°41′ to 29°52′ N), Chongqing city, China (Figure 1). The area has a humid subtropical monsoon climate. The mean annual precipitation is about 1360 mm, with 70% of rain occurring from April to October. The average annual relative air humidity is 87%, and the mean annual temperature is 14.8 °C.
The region spans a gradient of forest diversity and complexity. Moso bamboo (Phyllostachys edulis) is widely distributed across the study area and covers an area of 466.67 km2, accounting for 8.2% of the total forest area in the region. The research was carried out within a Moso bamboo stand plot (30 × 30 m). The dominant tree species were Phyllostachys edulis, and a few Symplocos setchuensis Brand. The typical shrub species include Symplocos setchuensis Brand, Fieus tikoua, and Illicium lanceolatum. The basic information of the experimental plot is shown in Table 1.

2.2. Rainfall and Throughfall Measurement

Rainfall above the canopy was measured at 10 min intervals using a tipping bucket rain gauge, which was set up on an automatic meteorological station in the Jinyun Forest Ecosystem Research Station. The station is located in an open area 200 m away from the experimental plot. Individual events were separated by at least 4 h without rainfall. Rainfall intensity was calculated as the ratio of the total amount of rainfall for a given event to the duration.
To measure throughfall, we placed 50 of the same type of automatic tipping bucket rain gauges (RG3-M, Onse, Cape Cod, MA, USA) with a 20 cm diameter, 100 cm height, and a resolution of 0.2 mm per tip within the experimental plot. In consideration of the homogeneity of canopy cover, according to the research method of Zimmermann et al. [31], the experimental plot was divided into 25 small quadrates by 6 × 6 m, and 2 rain gauges were randomly arranged in each quadrate (Figure 2). Similarly, the rain gauges were set up 100 cm above the forest floor for avoiding ground splash and understory effects.

2.3. Stand Structure Index Measurement

LAI was measured and calculated in order to characterize the canopy structure. The values of LAI above each monitoring point (throughfall collector) were measured using an LAI-2200 Plant Canopy Analyzer (Li-Cor Inc., Lincoln, NE, USA) during the cloudy days in the middle of every month from April to October 2023. Due to the small changes in LAI during the observation period, the average LAI of each month was used to reflect the canopy structure characteristics at each throughfall monitoring point.
In addition, to investigate possible deterministic effects of tree locations on the throughfall amount, we measured the distance from each collector to the stem of the nearest trunk.

2.4. Statistical Analysis

2.4.1. Spatial Variability of Throughfall Analysis

We calculated separately the variation coefficient of throughfall at individual rainfall event (throughfall CVR) and the variation coefficient of throughfall of at individual throughfall collector (throughfall CVP).
The formula for calculating throughfall CVR is as follows:
C V R i = σ i μ i × 100 %
σ i = j = 1 n ( X i j μ i ) 2 n
μ i = j = 1 n X i j n
where CVRi is the coefficient of variation of the throughfall among all throughfall collectors during the i-th rainfall event; σi is the standard deviation of the throughfall of all throughfall collectors in the i-th rainfall event; μi is the average throughfall of all throughfall collectors in the i-th rainfall event; Xij is the throughfall of the j-th throughfall collector ring the i-th rainfall event; and n is the number of throughfall collectors during the observation period (n = 50, in this study).
The formula for calculating throughfall CVP is as follows:
C V P i = σ j μ j × 100 %
σ j = i = 1 m ( X i j μ j ) 2 m
μ j = i = 1 m X i j m
where CVPi is the coefficient of variation of the throughfall of all rainfall events at the j-th throughfall collector during the observation period; σj is the standard deviation of the throughfall of all rainfall events at the j-th throughfall collector; μj is the average throughfall of all rainfall events at the j-th throughfall collector; Xij is the throughfall of the j-th throughfall collector during the i-th rainfall event; m is the number of rainfall events during the observation period (m = 66, in this study).
In addition, the one-way ANOVA test was used to compare the statistical difference between the throughfall percentage across rainfall classes (i.e., 0–10 mm, 10–25 mm, 25–50 mm, and >50 mm).
A spatial autocorrelation method was employed to measure the spatial autocorrelation of throughfall CVP values in 50 throughfall collectors. The global Moran’s I, calculated using Equation (7), describes the overall spatial correlation and differences in the variation coefficient of throughfall across 50 throughfall collectors, as follows:
I = n i = 1 n j = 1 n w i j ( x i x ) ( x j x ) ( i = 1 n j = 1 n w i j ) i = 1 n ( x i x )
where n is the total number of monitoring points (i.e., 50); xi and xj are the throughfall CVP values of the throughfall collectors i and j (ij), respectively; and wij is a spatial weight matrix of collectors i and j; the inverse distance method was used to generate the spatial weight matrix between throughfall collectors (i.e., the closer the distance, the higher the possibility of mutual influence). The value of global Moran’s I ranges from −1 to 1, where positive values indicate positive correlations and negative values indicate negative correlations. The larger absolute value of the global Moran’s I indicates a higher degree of spatial correlation and more obvious spatial association and aggregation characteristics. Conversely, the spatial correlation was weaker, and the spatial distribution was more random [31].

2.4.2. Temporal Stability of Throughfall Analysis

The normalized throughfall and temporal stability plot were used to describe the temporal persistence of the throughfall amount. According to Kiem et al. [22], we quantified the normalized throughfall, T ~ i, for each throughfall collectoras follows:
T ˜ i = T i T ¯ S T
where T ~ i is the normalized value of the throughfall at the i-th throughfall collector of a certain rainfall event; Ti is the throughfall at the i-th throughfall collector in that rainfall event, mm; T ¯   and ST are the average and standard deviation of the throughfall at all throughfall collectorss in that rainfall event, respectively.
According to the method of [12,13,22,32], we ranked the mean normalized throughfall T ~ i at individual throughfall collectors from minimum to maximum and plotted the time stability plot, and the 95% confidence interval was used as the limit criteria of persistence. In the time stability plot, four kinds of collectors with different temporal persistence could be derived: (1) “extreme wet persistence” referred to collectors in the upper quartiles without any overlap between their 95% confidence intervals and the 0 value line; (2) “extreme dry persistence” represent collectors in the lower quartiles without any overlap between their 95% confidence intervals and the 0 value line; (3) “general persistence “were collectors in the interquartile range and their 95% confidence intervals did not include the 0 value line; (4) “unstable persistence” were collectors with 95% confidence intervals including the 0 value line.

3. Results

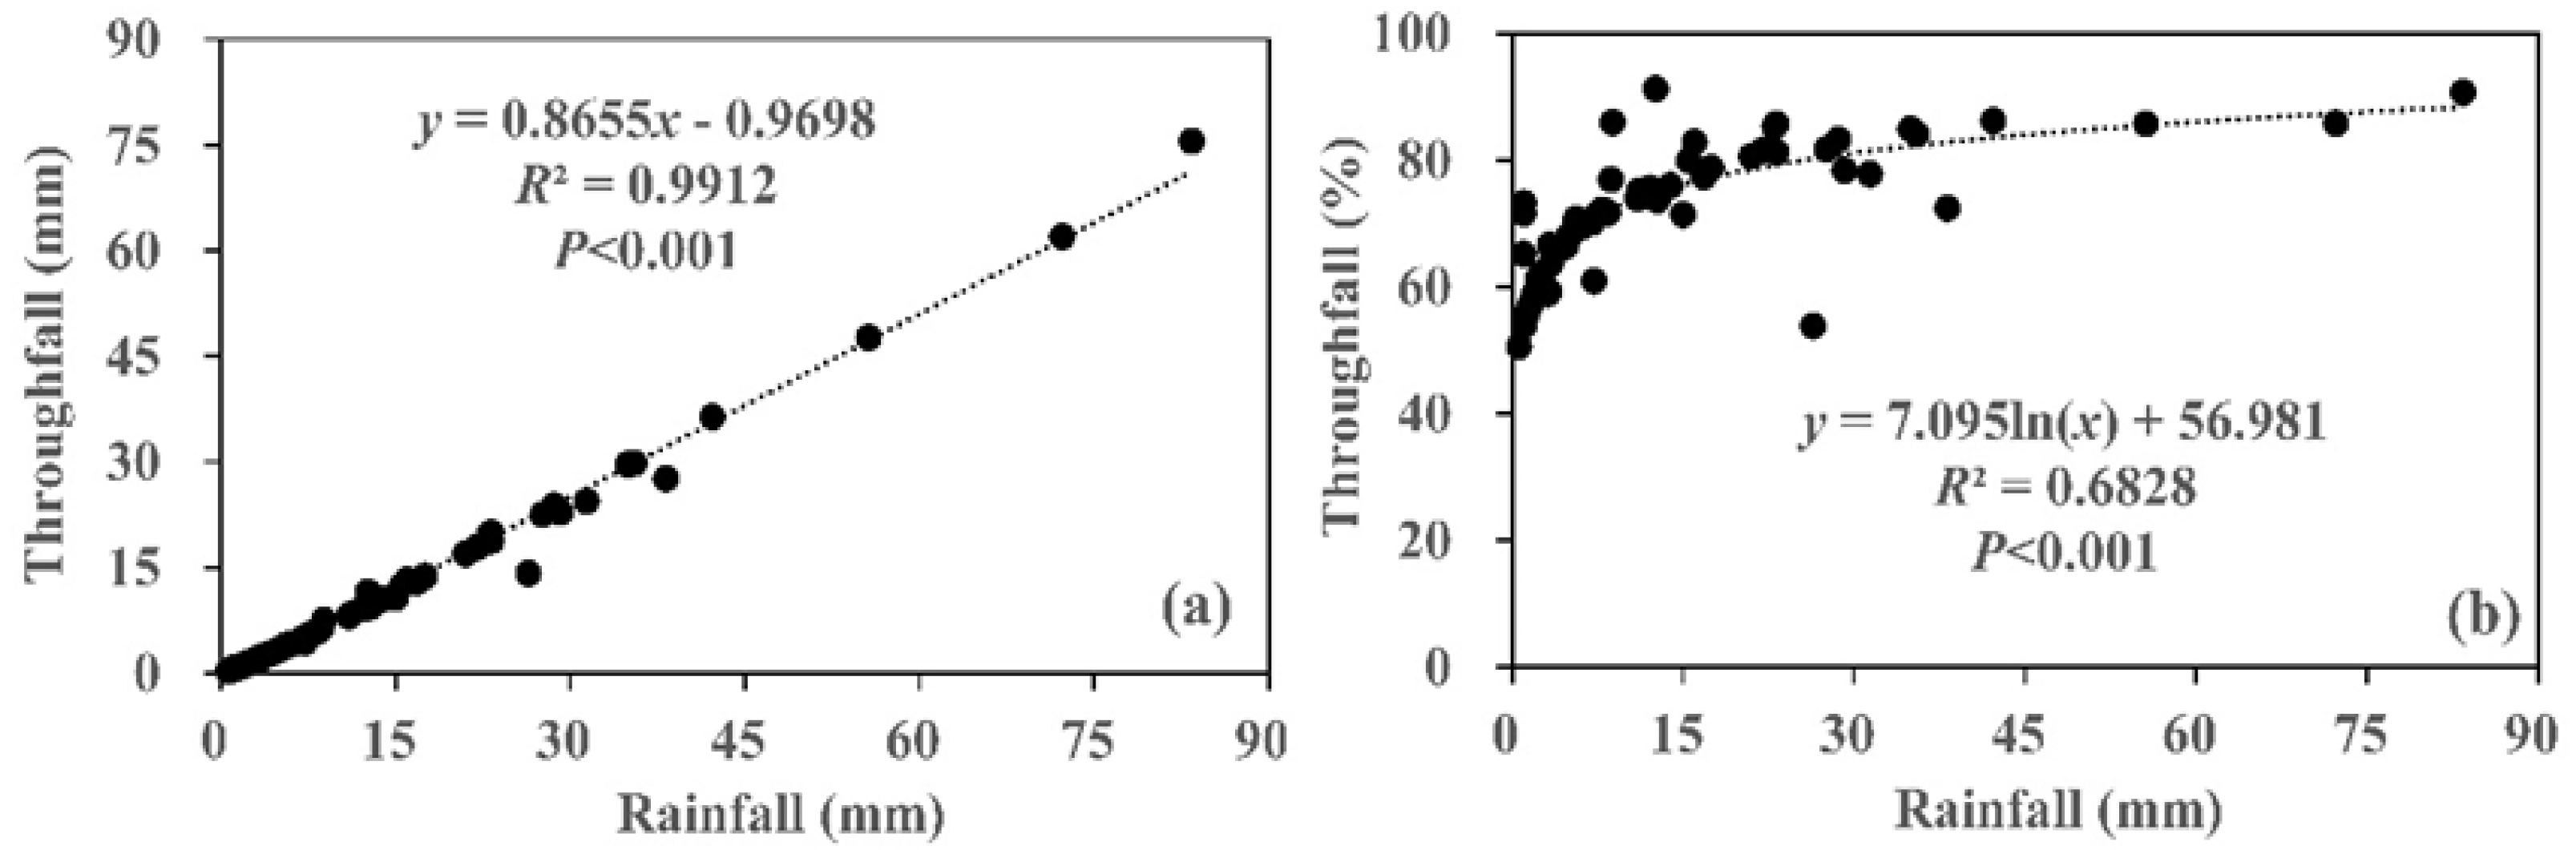
3.1. Characteristics of Rainfall and Throughfall During the Experimental Periods

We collected 66 rainfall events in the study region from April to October 2023. The total rainfall was 910.7 mm. The average rainfall was 13.8 mm/day, with the following distribution of rainfall amount (Figure 3a): 0–10 mm, 57.6% of the rainfall events and 15.2% of the total rainfall amounts; 10–25 mm, 24.2%, 29.3%; 25–50 mm, 13.6%, 32.3%; >50 mm, 4.6%, 23.2%. The rainfall intensity varied between 0.2 and 27.8 mm·h−1, with an average of 3.2 mm·h−1. The distribution of rainfall intensity is shown in Figure 3b: 0–1 mm·h−1, 39.4% of the rainfall events and 25.8% of the total rainfall amounts; 1–2 mm·h−1, 25.8%, 20.5%; 2–4 mm·h−1, 16.7%, 24.0%; > 4 mm·h−1, 18.2%, 29.8%.
The average throughfall ranged from 0.3 mm to 75.6 mm, with an average of 11.0 ± 14.4 mm (mean ± SD). The average throughfall accounted from 50.6% to 91.3% of each rainfall, with an average of 74.3% ± 10.6% (mean ± SD). Moreover, significant differences (p < 0.05) were observed in throughfall percentage across rainfall classes (Figure 4). Rainfall within 10 mm had a significantly lower throughfall percentage than the other rainfall classes.
There was a statistically significant linear relationship between the average throughfall from all 50 collectors and rainfall amount (Figure 5a). Statistical analysis revealed that throughfall was zero when rainfall was no more than 1.12 mm, indicating that the canopy storage capacity at saturation was 1.12 mm. Meanwhile, a significant logarithmic correlation exists among the average throughfall percentage and rainfall amount (Figure 5b). Throughfall percentage increased with the increasing rainfall, and gradually stabilized at larger rainfall event (about 25 mm).

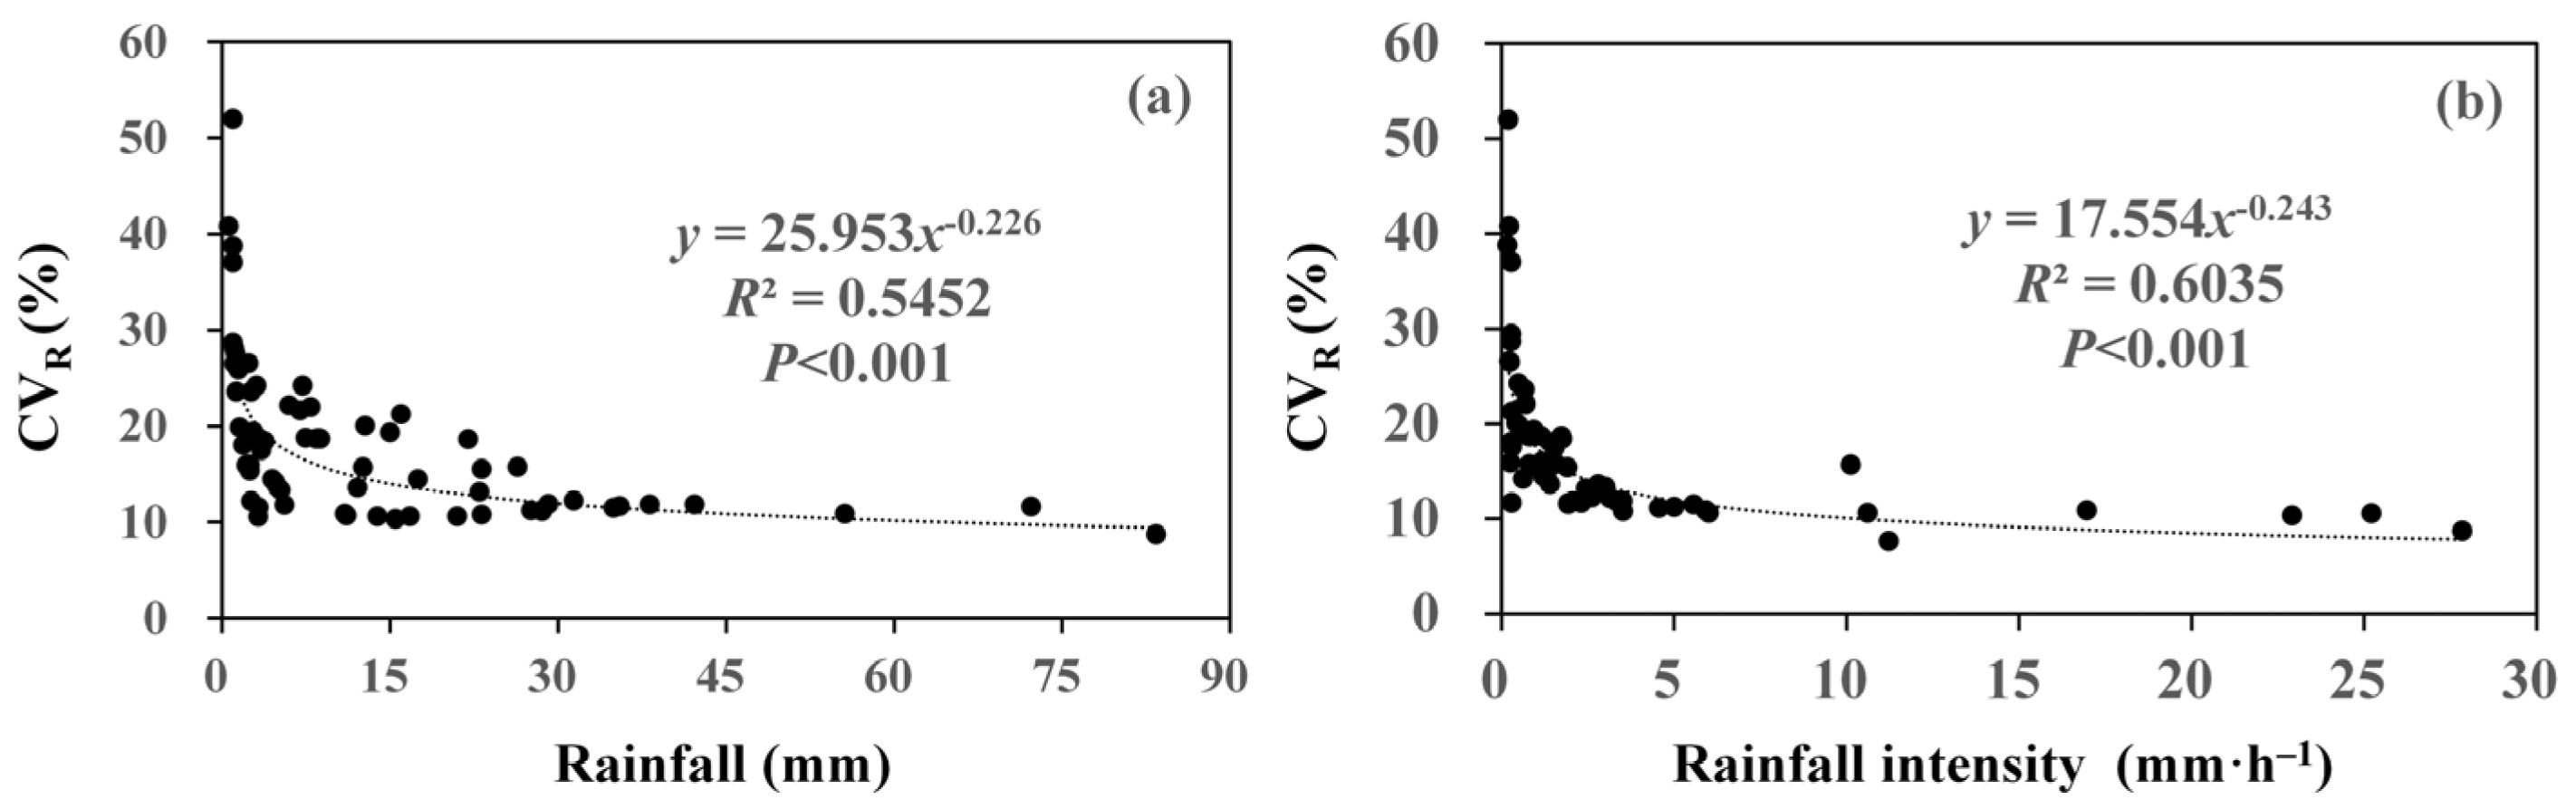
3.2. Spatial Variability of Throughfall in Relationship to Rainfall Characteristics

The variation coefficient of throughfall at individual rainfall events (throughfall CVR) derived from all 50 collectors, ranged from 8.8% to 52.0%, with an average of 18.1% ± 8.2% (mean ± SD). Throughfall CVR showed a large variability when rainfall was less than 5 mm. We further analyzed the effect of rainfall characteristics on the spatial variability of throughfall, and found that there was a significant power functional relationship between throughfall CVR and rainfall amount. The throughfall CVR first sharply decreased with the increasing gross rainfall, and gradually stabilized at larger rainfall event (Figure 6a). Similarly, the rainfall intensity had a power functional relationship with the spatial variability of throughfall, and the throughfall CVR first sharply decreased with the increasing rainfall intensity, and gradually stabilized at heavy rainfall intensity (Figure 6b).

3.3. Spatial Variability of Throughfall in Relationship to Canopy Cover

The variation coefficient of throughfall for 66 rainfall events at each individual collector (throughfall CVP) is shown in Figure 7. During the observation period, the throughfall CVP value of 50 throughfall collectors ranged from 9.5% to 35.3%, and the average value is 19.5% ± 6.8% (mean ± SD). During the study period, the value of global Moran’s I of throughfall CVP was 0.05 and p = 0.58, indicating that the spatial autocorrelation of the throughfall CVP was not significant, and the spatial distribution of variation coefficient of throughfall in the experimental plot was random.
We found that the spatial distribution of throughfall CVP was generally consistent with the distribution of the trees (Figure 2), that is, the throughfall CVP is relatively higher in dense bamboo forest areas compared to sparse bamboo forest areas, where it is comparatively lower. To verify this point, we analyzed the relationship between LAI and throughfall CVP at each collector. The result indicated that LAI had a significant positive correlation with throughfall CVP, and throughfall variation increased with the increasing LAI (Figure 8).

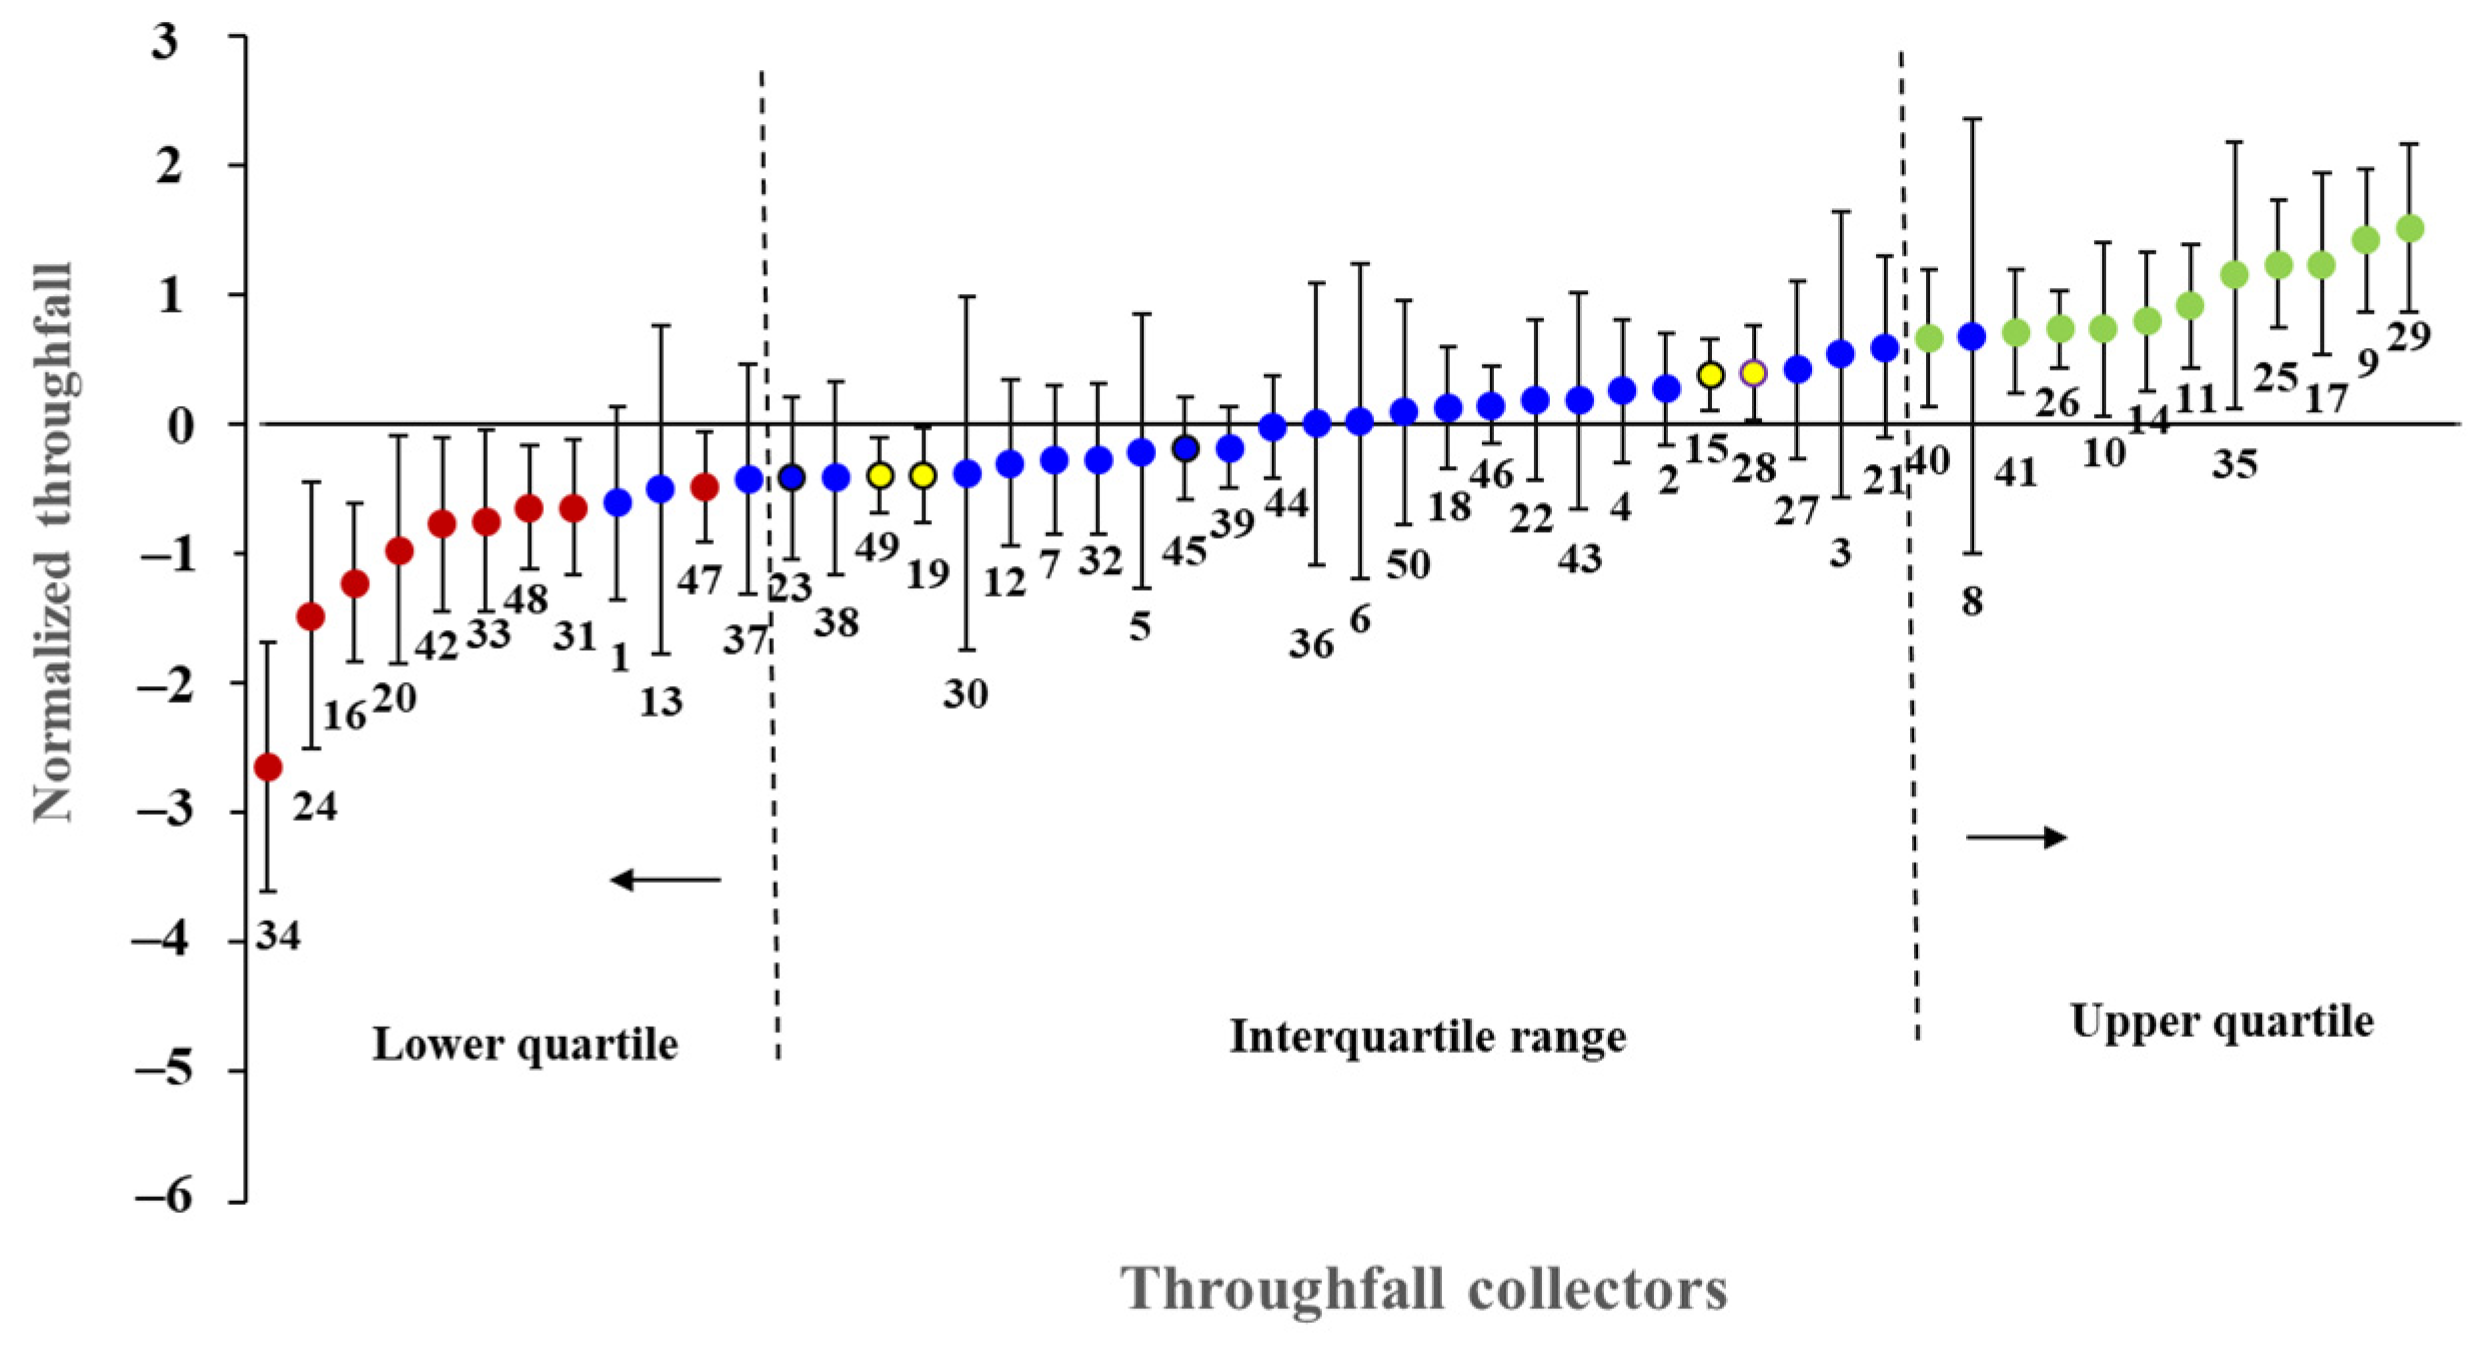
3.4. Characteristics of the Temporal Stability of Throughfall

The time stability plot indicated that the spatial distribution of throughfall was stable during the experimental periods. As described in the method section, four kinds of temporal persistence are shown in Figure 9. Eleven throughfall collectors in the upper quartile showed extreme wet persistence (e.g., collectors 40, 41, 26, 10, 14, 11, 35, 25, 17, 9, and 29), while nine collectors located at the lower quartile showed extreme dry persistence (e.g., collectors 34, 24, 16, 20, 42, 33, 48, 31, and 47). These monitoring points would create extreme wet or extreme dry conditions on the forest floor. Only four collectors showed general persistence (e.g., collectors 49, 19, 15, and 28), indicating that these collectors can be persistently wetter or drier than the mean, but not extremes. The remaining throughfall collectors showed unstable persistence.

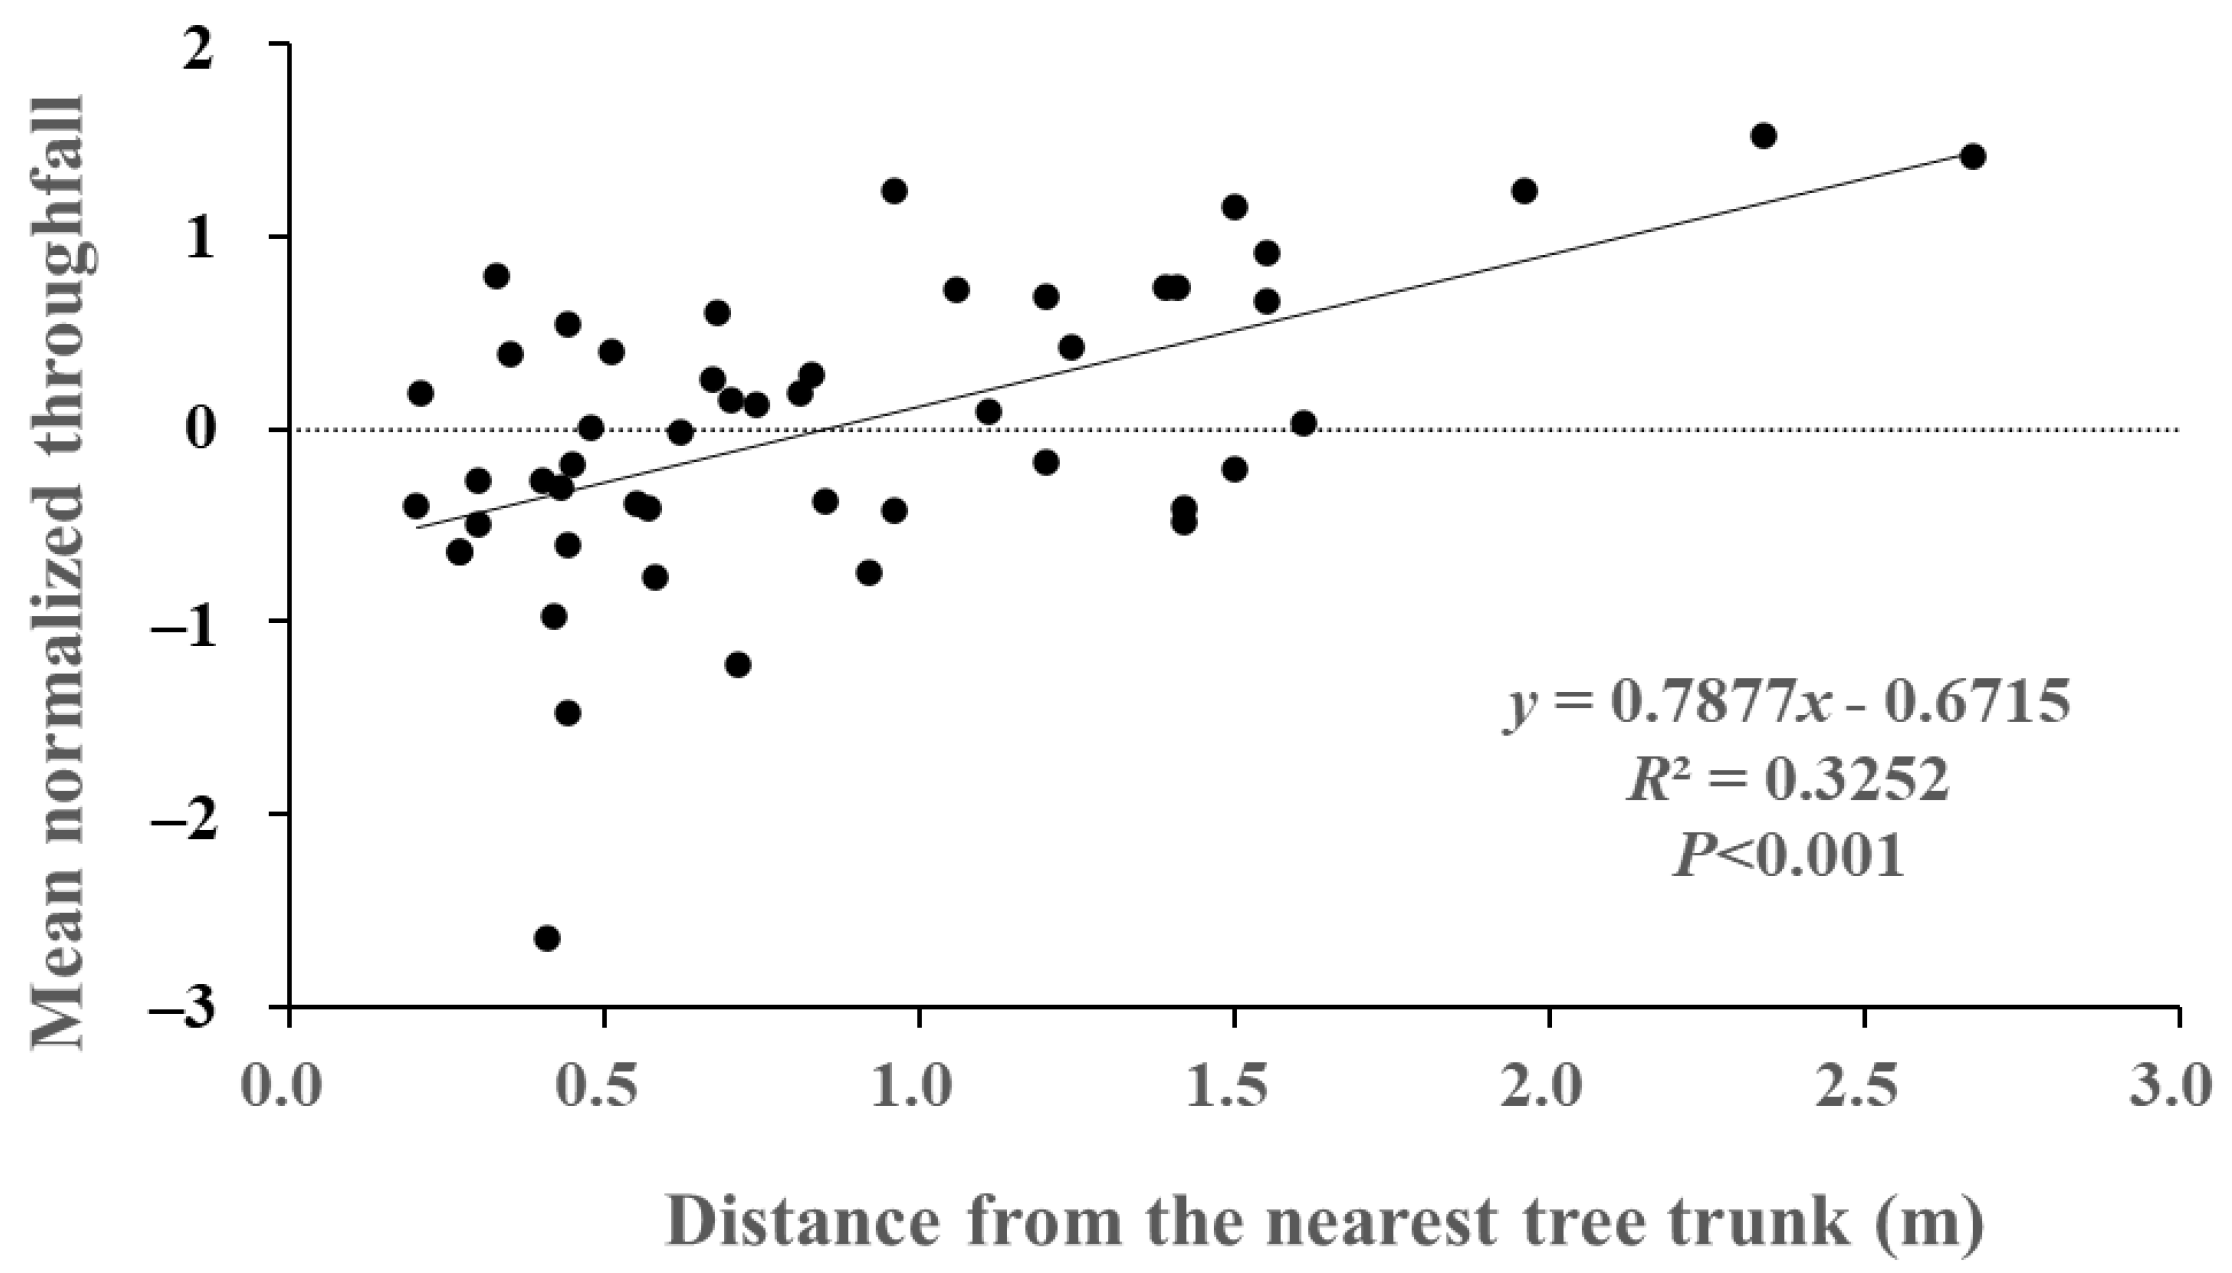
3.5. Spatial Variability of Throughfall in Relationship to the Distance from the Nearest Trunk

The relationship between the mean normalized throughfall (   T ~ i) and distance from the nearest trunk was investigated (Figure 10). There was a significant positive correlation in the Moso bamboo forest (p < 0.001). Additionally, the observations indicated a zone of obviously lower throughfall ( T ~ i < 0) within 0.5 m of trees in the stand, while higher throughfall ( T ~ i > 0) increased when the distance from the nearest trunk was more than 1.0 m. In consideration of the temporal persistence and position of throughfall collectors (Figure 2 and Figure 9), the dry persistent collectors were mostly adjacent to the tree stems (e.g., collectors 34, 24, 20, 42, 48, and 31). Meanwhile, the wet persistent collectors were far from the tree stems (e.g., collectors 10, 11, 35, 25, 17, 9, and 29).

4. Discussion

4.1. Characteristics of Throughfall Amount and Its Spatial Variability

Throughfall is the actual amount of water that reaches the forest floor; therefore, many scholars pay great attention to its amount and spatial distribution [33]. In this study, the average throughfall was 74.3% of gross rainfall, which was equivalent to the throughfall of 77.6% for Phyllostachys edulis forest reported by Huang et al. [34] in Jiangsu Province, China. However, it was lower than the amounts already reported in the same region, such as 87.2% reported by Zhao et al. [35], while higher than the throughfall of 58.7% reported in another place, such as in Nanjing Province reported by Du et al. [36]. This is because the throughfall is affected by many factors, such as rainfall characteristics, weather conditions, tree density, canopy structure, and even the amount and location of throughfall collectors [11]. In the research of [35], only 20 rain gauges were used to estimate the throughfall of Phyllostachys edulis forest, with possibly insufficient consideration of the dense area of the canopy, while 50 throughfall collectors were used to fully consider the different positions of the canopy in our study, thus resulting in lower throughfall percentage in the same region. In addition, the lower throughfall percentage in our study may also be attributed to the small rainfall events during the experimental periods. For relatively small events, most of the rainfall is first intercepted by the canopy, and leads to lower throughfall percentage (Figure 6). In this study, small rainfall events (e.g., 0–10 mm) accounted for 57.6% of the rainfall events (Figure 3), resulting in different throughfall percentages of Phyllostachys edulis forests in the same region.
The mean throughfall CVR and CVP of Phyllostachys edulis forest in this study were 18.1% and 19.5%, respectively, which was similar to the throughfall CV of 16.9% for Heveabrasiliensis reported by Liu et al. [37] in Xishuangbanna, China. Siegert et al. [38] also found that the throughfall CV of a temperate deciduous forest ranged from 15.9% to 20.1%. Meanwhile, this result was lower than that reported in most studies, such as 34.5~38.4% for Larix gmelinii in Great Kingan Mountain, Northeastern China [12], 35.5% for Pinus tabulaeformis in the Loess Plateau, China [19], and 30.8% for fagusorentalis in Iran [39]. The lower throughfall CV in this study may be attributed to the large rainfall amounts in this study region. When the rainfall amount is small, the spatial variability of throughfall within the forest canopy increases significantly; however, when the rainfall amount is large, throughfall tends to exhibit a relatively consistent spatial distribution pattern (Figure 6). The above-mentioned research sites are located in arid or semi-arid areas with smaller rainfall amounts. Wang et al. [33] also found that the spatial coefficient of variation of throughfall in arid areas was greater than that in humid areas. Furthermore, the leaves of Moso bamboo are characterized by their thinness, small size, and a waxy layer on the surface, which lead to a relatively short retention period for rainfall, and facilitate the occurrence of throughfall, thereby causing lower throughfall variation. Additionally, stand density, age, the arrangement of trees, as well as meteorological conditions have strong influences on throughfall variability [39], making it difficult to directly compare our result to the previously published work.

4.2. Controls of Spatial Throughfall Variability

As the water source for throughfall, rainfall characteristics have the most direct impact on the spatial distribution of throughfall [33]. In this study, throughfall CV has a significant power functional relationship with rainfall amount (Figure 6a). Similar results have been observed in other throughfall variability studies [11,13,40]. For relatively smaller events, rainfall is relatively intercepted by the canopy, resulting in a higher degree of spatial throughfall variability than larger rainfall events in which the water storage capacity of the canopy was satisfied [41]. Some studies also have shown that throughfall CV had a significant correlation with rainfall intensity [12,39,42]. Similarly, we found that there was a significant negative correlation in this study, and throughfall variability decreased with the increase in rainfall intensity (Figure 6b). A possible explanation for this phenomenon is that when rainfall intensity is relatively high, the water interception affected by tree trunks and branches decreases. At this time, throughfall is composed solely of splash throughfall and canopy drip throughfall, thus reducing the throughfall variability [43].
Compared to the greater variability of meteorological factors in the rainfall process, forest canopy characteristics have the relative stability, thereby possessing more theoretical advantages for estimating the spatial pattern of throughfall [33]. Throughfall CV increased with the increasing LAI in our study (Figure 8), which is in agreement with observations reported for other forests [12,19]. This is because the higher LAI will not only increase the accumulation of interception on the tree trunks and branches, but also increase the dripping points from them. Throughfall collectors around these trunks and branches received more splash throughfall and canopy drip throughfall, while collectors in the canopy gap area received only free throughfall; this difference would lead to greater throughfall variation. However, this result is not universal with some researchers [14,15,42]. Dietz et al. [14] found that LAI alone was not significantly correlated with throughfall. Teale et al. [15] also demonstrated that throughfall was highly spatially heterogeneous due to multiple compounding effects, not only one stand structure factor.
In this study, the mean normalized throughfall increased linearly with the increasing distance from the nearest tree trunk for all throughfall collectors (Figure 10). Our result was supported by some studies [12,16,17,18]. Interestingly, some studies showed that the relationships between throughfall and the distance from the nearest tree trunk were only significant for the extreme wet persistent collectors [16,43,44]. Comparatively, other studies have shown no such relationship [19,20,21]. The inconsistency in the aforementioned viewpoints can be attributed to the complex influences of the canopy structure on throughfall variability. The distance from the nearest trunk as an influencing parameter is insufficient to comprehensively reflect the characteristics of the forest canopy, such as canopy volume and thickness, degree of overlap with surrounding canopies, LAI, leaf biomass, etc. [12]. Furthermore, the relationships between throughfall and the distance from the nearest tree trunk were affected by meteorological characteristics [45,46].

4.3. Temporal Stability of Throughfall

The temporal persistence of throughfall spatial patterns was found in the Moso bamboo forest as it has been reported in other forests [8,22,25]. Based on the observations (Figure 2 and Figure 9), the extreme wet and relatively wet persistent collectors were likely to be located underneath the canopy periphery or beneath gaps, and the extreme dry and relatively dry persistent collectors occurred mostly in the inner the forest canopy. Our results are consistent with the findings from other studies [12,16,22]. A possible explanation for this phenomenon is that more branches and twigs above the dry collectors affected the rainfall distribution, which may have been attributable to the enhanced water interception and stemflow. Meanwhile, the wet collectors may have been just below the drop tips or under the canopy gaps, receiving more drip throughfall or free throughfall.
It should be noted that throughfall collectors with general persistence were extremely rare, and half of the throughfall collectors showed unstable persistence in our study, although some collectors can also be located beneath canopy gaps or inner the canopy. This indicates that the forest canopy is not the only deterministic factor controlling the persistence of throughfall variability, and meteorological factors such as rainfall may strongly affect the temporal stability of throughfall. Before the forest canopy is saturated, most of the rainfall is utilized for moistening the canopy; during this period, throughfall is influenced by both canopy structure and rainfall characteristics, resulting in poor temporal stability [33]. Rodriguer et al. [47] have also reported that rainfall within 10 mm was more feasible to preserve the specific spatial pattern of throughfall compared to scenarios where rainfall exceeds 10 mm. Additionally, wind speed and temperature were the major influencing factors to throughfall variability. Throughfall CV increased with the increase in wind speed [16]. This phenomenon can primarily be attributed to the more inclined angle of rainfall and stronger swing induced by strong wind, which are likely to decrease water condensation and enhance the splashing of rainwater on the windward side of the canopy, thus causing large differences in rainfall delivery between the windward and leeward sides [13,44]. The effects of temperature on the throughfall variability were complex. The higher temperature will increase the potential evaporation, causing the canopy to be unsaturated. During this period, the influence of canopy structure on throughfall variability becomes more pronounced, thereby leading to an increase in throughfall CV [48]. However, the lower temperature could enhance the surface tension and hydrophobicity of leaves, facilitating the formation of larger throughfall raindrops, and resulting in greater spatial variability in throughfall [16]. Furthermore, Zimmermann et al. [9] discovered that the temporal stability of throughfall in tropical deciduous forests diminished after one year. Most current studies focus on the rainy season or within an annual timeframe, and thus fail to adequately capture the dynamic changes in canopy structure. Consequently, there is an urgent need for long-term observations of throughfall to effectively study the temporal stability.

5. Conclusions

In this study, we used 50 collectors to analyze the spatial variability and temporal stability of throughfall in a Moso bamboo forest. Specifically, we evaluated the effects of rainfall characteristics and LAI on the variability of throughfall, and tree locations on the temporal stability of throughfall. The results show that throughfall occupied 74.3% of rainfall in the forest, and significant differences were observed in throughfall percentage across rainfall classes (p < 0.05). The throughfall CVR ranged from 8.8% to 52.0%, and had a negative power functional relationship with rainfall amount and rainfall intensity (p < 0.001). The throughfall CVP ranged from 9.5% to 35.3%, and the value of global Moran’s I indicated that the spatial autocorrelation of the throughfall CVP was not significant (p > 0.05). The throughfall CV increased with the increasing LAI (p < 0.001). We also found that the mean normalized throughfall increased linearly with the increasing distance from the nearest tree trunk (p < 0.001). The temporal stability analysis indicated that the extreme wet persistence and extreme dry persistence were highly temporally stable. However, half of the throughfall collectors showed unstable persistence in our study, indicating that the forest canopy is not the only deterministic factor controlling the persistence of throughfall variability, and meteorological factors such as rainfall, wind speed, and temperature may also strongly affect the temporal stability of throughfall. The long-term observations spanning several years are needed to gain a deeper understanding of the temporal and spatial distribution patterns of throughfall in Moso bamboo forests.

Author Contributions

Conceptualization, C.L. and Y.W.; methodology, C.L.; software, C.L. and K.J.; validation, C.L., Y.W. and Q.Z.; formal analysis, C.L. and Y.H.; investigation, C.L., P.Q. and X.Z.; resources, C.L. and Y.W.; data curation, C.L.; writing—original draft preparation, C.L., K.J. and P.Q.; writing—review and editing, C.L., K.J. and P.Q.; visualization, C.L.; supervision, C.L.; project administration, C.L. and Y.W.; funding acquisition, C.L. All authors have read and agreed to the published version of the manuscript.

Funding

This research was funded by project “Improvement of Gash Model Calculation Process Based on the Coupling Relationship between Stand Structure Parameters and Canopy Parameters” supported by Shandong Provincial Natural Science Foundation (ZR2020QD114), and High-level Talent Research Fund of Qingdao Agricultural University (663/1120105).

Institutional Review Board Statement

Not applicable.

Informed Consent Statement

Not applicable.

Data Availability Statement

The data will be made available on request.

Conflicts of Interest

The authors declare no conflicts of interest.

References

  1. Dunkerley, D. Measuring interception loss and canopy storage in dryland vegetation: A briefer view and evaluation of available research strategies. Hydrol. Process 2000, 14, 669–678. [Google Scholar] [CrossRef]
  2. Llorens, P.; Domingo, F. Rainfall partitioning by vegetation under Mediterranean conditions. A review of studies in Europe. J. Hydrol. 2007, 335, 37–54. [Google Scholar] [CrossRef]
  3. Zhang, Y.F.; Wang, X.P.; Hu, R.; Pan, Y.X.; Paradeloc, M. Rainfall partitioning into throughfall, stemflow and interception loss by two xerophytic shrubs within a rain-fed re-vegetated desert ecosystem, northwestern China. J. Hydrol. 2015, 527, 1084–1095. [Google Scholar] [CrossRef]
  4. Hu, S.-S.; Yu, J.; Kun, H.; Jin, M. Impacts of Chinese Pine (Pinus Tabulae formis) plantations on rainfall redistribution processes: A case study for the mountainous area of North China. Acta Ecol. Sin. 2010, 30, 1751–1757. [Google Scholar]
  5. Janeau, J.L.; Grellier, S.; Podwojewski, P. Influence of rainfall interception by endemic plants versus short cycle crops on water infiltration in high altitude ecosystems of Ecuador. Hydrol. Res. 2015, 46, 1008–1018. [Google Scholar] [CrossRef]
  6. Roth, B.E.; Slatton, K.C.; Cohen, M.J. On the potential for high-resolution lidar to improve rainfall interception estimates in forest ecosystems. Front. Ecol. Environ. 2007, 5, 421–428. [Google Scholar] [CrossRef]
  7. Tsiko, C.T.; Makurira, H.; Gerrits, A.J.; Savenije, H.G. Measuring forest floor and canopy interception in a savannah ecosystem. Phys. Chem. Earth 2012, 47–48, 122–127. [Google Scholar] [CrossRef]
  8. Staelens, J.; De Schrijver, A.; Verheyen, K.; Verhoest, N.E. Spatial variability and temporal stability of throughfall water under a dominant beech ((Fagus sylvatica L.)) tree in relationship to canopy cover. J. Hydrol. 2006, 330, 651–662. [Google Scholar] [CrossRef]
  9. Zimmermann, A.; Zimmermann, B.; Elsenbeer, H. Rainfall redistribution in a tropical forest: Spatial and temporal patterns. Water Resour. Res. 2009, 45, W11413. [Google Scholar] [CrossRef]
  10. Zimmermann, A.; Zimmermann, B. Requirements for throughfall monitoring: The roles of temporal scale and canopy complexity. Agric. For. Meteorol. 2014, 189–190, 125–139. [Google Scholar] [CrossRef]
  11. Shen, H.T.; Wang, X.X.; Jiang, Y.; You, W. Spatial variations of throughfall through secondary succession of evergreen broad-leaved forests in eastern China. Hydrol. Process. 2012, 26, 1739–1747. [Google Scholar]
  12. Sheng, H.; Cai, T. Spatial Variability of Throughfall in a Larch (Larix gmelinii) Forest in Great Kingan Mountain, Northeastern China. Forests 2021, 12, 393. [Google Scholar] [CrossRef]
  13. Zhang, H.X.; Wu, H.W.; Li, J.; He, B.; Liu, J.F.; Wang, N.; Duan, W.L.; Liao, A.M. Spatial-temporal variability of throughfall in a subtropical deciduous forest from the hilly regions of eastern China. J. Mt. Sci. 2019, 16, 1788–1801. [Google Scholar] [CrossRef]
  14. Dietz, J.; Hölscher, D.; Leuschner, C.; Hendrayanto. Rainfall partitioning in relation to forest structure in differently managed montane forest stands in central sulawesi, indonesia. For. Ecol. Manag. 2006, 237, 170–178. [Google Scholar] [CrossRef]
  15. Teale, N.G.; Mahan, H.; Bleakney, S.; Berger, A.; Shibley, N.; Frauenfeld, O.W.; Quiring, S.M.; Rapp, A.D.; Roark, E.B.; Washington-Allen, R. Impacts of Vegetation and Precipitation on Throughfall Heterogeneity in a Tropical Pre-Montane Transitional Cloud Forest. Biotropica 2014, 46, 667–676. [Google Scholar] [CrossRef]
  16. Zhang, Y.F.; Wang, X.P.; Hu, R. Throughfall and its spatial variability beneath xerophytic shrub canopies within water-limited arid desert ecosystems. J. Hydrol. 2016, 539, 406–416. [Google Scholar] [CrossRef]
  17. Li, Z.X.; Zheng, H.; Ouyang, Z.Y.; Wang, X.; Liu, X.; Su, Y. The spatial distribution characteristics of throughfall under Abies faxoniana forest in the Wolong Nature Reserve. Acta Ecol. Sin. 2004, 24, 1015–1021. [Google Scholar]
  18. Shi, Z.J.; Wang, Y.H.; Xiong, W.; Yu, P.T. The spatial heterogeneity of throughfall under the Larix principis-rupprechtii single tree’ s canopy. Acta Ecol. Sin. 2006, 26, 2877–2886. [Google Scholar]
  19. Fang, S.M.; Zhao, C.Y.; Jian, S.Q. Spatial variability of throughfall in a Pinus tabulaeformis plantation forest in Loess Plateau, China. Scand. J. For. Res. 2016, 31, 467–476. [Google Scholar] [CrossRef]
  20. Kowalska, A.; Boczon’, A.; Hildebrand, R.; Polkowska, Ż. Spatial variability of throughfall in a stand of scots pine (pinus sylvestris L.) with deciduous admixture as influenced by canopy cover and stem distance. J. Hydrol. 2016, 538, 231–242. [Google Scholar] [CrossRef]
  21. Sun, X.; Onda, Y.; Chiara, S.; Kato, H.; Gomi, T. The effect of strip thinning on spatial and temporal variability of throughfall in a Japanese cypress plantation. Hydrol. Process. 2015, 29, 5058–5070. [Google Scholar] [CrossRef]
  22. Keim, R.F.; Skaugset, A.E.; Weiler, M. Temporal persistence of spatial patterns in throughfall. J. Hydrol. 2005, 314, 263–274. [Google Scholar] [CrossRef]
  23. Zirlewagen, D.; von Wilpert, K. Modeling water and ion fluxes in a highly structured, mixed-species stand. For. Ecol. Manag. 2001, 143, 27–37. [Google Scholar] [CrossRef]
  24. Dezhban, A.; Attarod, P.; Amiri, G.Z.; Pypker, T.G.; Nanko, K. Spatial and temporal variability of throughfall under a natural Fagusorientalis stand in the Hyrcanian forests, north of Iran. J. Agric. Sci. Technol. 2019, 21, 1843–1858. [Google Scholar]
  25. Wullaert, H.; Pohlert, T.; Boy, J.; Valarezo, C.; Wilcke, W. Spatial throughfall heterogeneity in a montane rain forest in Ecuador: Extent, temporal stability and drivers. J. Hydrol. 2009, 377, 71–79. [Google Scholar] [CrossRef]
  26. Germer, S.; Elsenbeer, H.; Moraes, J.M. Throughfall and temporal trends of rainfall redistribution in an open tropical rainforest, south-western Amazonia. Hydrol. Earth Syst. Sci. 2006, 10, 383–393. [Google Scholar] [CrossRef]
  27. Zhou, B.; Fu, M.; Xie, J.; Yang, X.; Li, Z. Ecological functions of bamboo forest: Research and Application. J. For. Res. 2005, 16, 143–147. [Google Scholar]
  28. Gao, G.L.; Du, H.Q.; Han, N.; Xu, X. Mapping of Moso Bamboo Forest Using Object-Based Approach Based on the Optimal Features. Sci. Silvae Sin. 2016, 52, 77–85. [Google Scholar]
  29. Chen, X.; Zhang, X.; Zhang, Y.; Booth, T.; He, X. Changes of carbon stocks in bamboo stands in China during 100 years. For. Ecol. Manag. 2009, 258, 1489–1496. [Google Scholar] [CrossRef]
  30. Zimmermann, A.; Wilcke, W.; Elsenbeer, H. Spatial and temporal patterns of throughfall quantity and quality in a tropical montane forest in ecuador. J. Hydrol. 2007, 343, 80–96. [Google Scholar] [CrossRef]
  31. Li, H.; Hou, E.K.; Deng, J.w. Spatio-temporal differentiation characteristic and evolution process of meteorological drought in Northwest China from 1960 to 2018. Front. Earth Sci. 2022, 10, 857953. [Google Scholar] [CrossRef]
  32. Zimmermann, A.; Germer, S.; Neill, C.; Krusche, A.V.; Elsenbeer, H. Spatio-temporal patterns of throughfall and solute deposition in an open tropical rain forest. J. Hydrol. 2008, 360, 87–102. [Google Scholar] [CrossRef]
  33. Wand, Q.; Yuan, C.; Zhang, Y.F.; Hu, Y.T.; Wang, Y.; Guo, L.; Liu, Q.; Cai, Z.Y. Global quantification of the spatial variability and temporal stability of throughfall. Chin. J. Appl. Ecol. 2024, 35, 1543–1552. [Google Scholar]
  34. Huang, J.; Zhang, J.Y.; Zhang, J.C.; Hu, H. Eco-hydrological Effects of Secondary Bamboo Forest (Phyllost achys edulis) Canopy and Its Influence Factors in North Subtropics. Bull. Soil Water Conserv. 2009, 29, 23–27. [Google Scholar]
  35. Zhao, Y.Y.; Wang, Y.Y.; Wang, Y.Q.; Liu, N.; Liu, M.; Wu, Y.; Chen, L. Simulation of Canopy Rainfall Interception of the Phyllostachys edulis Forest with the Revised Gash Model in the Jinyun Mountains of Chongqing. Sci. Silvae Sin. 2011, 47, 15–20. [Google Scholar]
  36. Du, Y.; Zhang, J.Y.; Zhou, Y. Hydrological Characteristics of the Canopy of Phyllostachy edulis Forest in Hilly Arears of Southern Jiangsu Province. Res. Soil Water Conserv. 2020, 27, 308–314. [Google Scholar]
  37. Liu, J.Q.; Liu, W.J.; Li, W.X.; Jiang, X.; Wu, J. Effects of rainfall on the spatial distribution of the throughfall kinetic energy on a small scale in a rubber plantation. Hydrol. Sci. J. 2018, 63, 1078–1090. [Google Scholar] [CrossRef]
  38. Siegert, C.M.; Levia, D.F.; Hudson, S.A.; Dowtin, A.L.; Zhang, F.; Mitchell, M.J. Small-scale topographic variability influences tree species distribution and canopy throughfall partitioning in a temperate deciduous forest. For. Ecol. Manag. 2016, 359, 109–117. [Google Scholar] [CrossRef]
  39. Levia, D.F.; Frost, E.E. Variability of throughfall volume and solute inputs in wooded ecosytems. Progress. Phys. Geogr. 2006, 30, 605–632. [Google Scholar] [CrossRef]
  40. Su, L.; Xie, Z.Q.; Xu, W.T.; Zhao, C. Variability of throughfall quantity in a mixed evergreen-deciduous broadleaved forest in central China. J. Hydrol. Hydromech. 2019, 67, 225–231. [Google Scholar] [CrossRef]
  41. Carlyle-Moses, D.E.; Laureano, J.F.; Price, A. Throughfall and throughfall spatial variability in Madrean oak forest communities of northeastern Mexico. J. Hydrol. 2004, 297, 124–135. [Google Scholar] [CrossRef]
  42. Liu, J.Q.; Liu, W.J.; Li, W.X.; Zeng, H. How does a rubber plantation affect the spatial variability and temporal stability of throughfall? Hydrol. Res. 2019, 50, 60–74. [Google Scholar] [CrossRef]
  43. Carlyle-Moses, D.E.; Lishman, C.E. Temporal persistence of throughfall heterogeneity below and between the canopies of juvenile lodgepole pine (Pinus contorta). Hydrol. Process. 2015, 29, 4051–4067. [Google Scholar] [CrossRef]
  44. Fan, J.; Oestergaard, K.T.; Guyot, A.; Jensen, D.G.; Lockington, D.A. Spatial variability of throughfall and stemflow in an exotic pine plantation of subtropical coastal Australia. Hydrol. Process. 2015, 29, 793–804. [Google Scholar] [CrossRef]
  45. Hsueh, Y.; Allen, S.T.; Keim, R.F. Fine-scale spatial variability of throughfall amount and isotopic composition under a hardwood forest canopy. Hydrol. Process. 2016, 30, 1796–1803. [Google Scholar] [CrossRef]
  46. Levia, D.F.; Keim, R.F.; Carlyle-Moses, D.E.; Frost, E.E. Throughfall and stemflow in wooded ecosystems. In Forest Hydrology and Biogeochemistry; Springer: Dordrecht, The Netherlands, 2011; pp. 425–443. [Google Scholar]
  47. Rodriguer, A.F.; Terra, M.S.; Mantovani, V.A.; Cordeiro, N.G.; Ribeiro, J.P.; Guo, L.; Nehren, U.; Mello, J.M.; Mello, C.R. Throughfall spatial variability in a neotropical forest: Have we correctly accounted for time stability? J. Hydrol. 2022, 608, 127632. [Google Scholar] [CrossRef]
  48. Nanko, K.; Watanabe, A.; Hotta, N.; Suzuki, M. Physical interpretation of the difference in drop size distributions of leaf drips among tree species. Agric. For. Meteorol. 2013, 169, 74–84. [Google Scholar] [CrossRef]
Figure 1. Locations of the study area.
Atmosphere 16 00787 g001
Figure 2. Map of the experimental plot showing the locations of trees and rain gauge collectors.
Atmosphere 16 00787 g002
Figure 3. Frequency distributions of the amount (a) and intensity (b) of rainfall during the experimental periods.
Atmosphere 16 00787 g003
Figure 4. Mean and standard deviation percentage of throughfall across rainfall classes. Bars with the same letters are not significantly different according to the one-way ANOVA test at p < 0.05.
Atmosphere 16 00787 g004
Figure 5. The relationships between the average throughfall amount (a), throughfall percentage (b), and rainfall amount.
Atmosphere 16 00787 g005
Figure 6. The relationships between throughfall CVR and rainfall amount (a) and rainfall intensity (b).
Atmosphere 16 00787 g006
Figure 7. Contour map of the spatial distribution of variation coefficient of throughfall at individual throughfall collectors.
Atmosphere 16 00787 g007
Figure 8. The linear relationship between LAI and throughfall CVP.
Atmosphere 16 00787 g008
Figure 9. Time stability plot of normalized throughfall for the Moso bamboo stand. The upper and lower error whiskers represent the 95% confidence interval. Red solid circles: extreme dry persistent collectors; green solid circles: extreme wet persistent collectors; yellow solid circles: general persistent collectors; blue solid circles: unstable persistence collectors. The numbers in the plot are the throughfall collectors in Figure 2.
Atmosphere 16 00787 g009
Figure 10. Relationship between the mean normalized throughfall and distance from the nearest stem for all throughfall collectors.
Atmosphere 16 00787 g010
Table 1. Basic information of the observation of the Moso bamboo plot (values = mean ± SD).
Age of Trees (Year)Stand Density
(n·ha−1)
DBH 1 (cm)Height (m)LAI (m2·m−2)
25480010.14 ± 1.62 14.4 ± 1.755.25 ± 1.12
1 DBH: diameter at breast height.
Disclaimer/Publisher’s Note: The statements, opinions and data contained in all publications are solely those of the individual author(s) and contributor(s) and not of MDPI and/or the editor(s). MDPI and/or the editor(s) disclaim responsibility for any injury to people or property resulting from any ideas, methods, instructions or products referred to in the content.

