1. Introduction
Air pollution is an extremely critical factor for human health [
1,
2]. It degrades the quality of the environment and the quality of life of people. According to the State of Global Air Report, 8.1 million people worldwide died prematurely due to air pollution in 2021, making it the second-leading risk factor for premature mortality [
3]. However, substantial global disparities in exposure to particulate matter (PM) exist. In recent years, an estimated 135 million deaths have been attributed to PM exposure, with developing countries disproportionately affected. Particularly high PM concentrations and associated mortality rates have been observed in Arab nations such as Kuwait and the United Arab Emirates, in addition to South Asian countries including Bangladesh, India, and Nepal, as well as several African nations. These regions face an acute public health burden due to sustained exposure to elevated PM levels [
4]. Urban areas bear the brunt of this crisis. Rapid urbanization and global industrialization have significantly amplified emissions of pollutants like particulate matter (PM), volatile organic compounds (VOCs), carbon dioxide (CO
2), nitrogen oxides (NO
x), sulfur dioxide (SO
2), and ozone (O
3). These pollutants exacerbate respiratory and cardiovascular diseases, reduce life expectancy, and strain healthcare systems worldwide.
The health effects of PM, as well as other mentioned air pollutants, depend on the concentration, duration of exposure, and individual constitution [
5,
6,
7]. Air pollutants primarily enter the body through the respiratory tract and thus initially pose a health risk to the lungs. They also represent the greatest attributable risk to the cardiovascular system. Numerous epidemiological studies worldwide have shown that pollutant exposure can cause not only local effects in the lungs but also systemic effects on the cardiovascular system [
8,
9,
10,
11]. In addition to other serious health effects—such as decreased oxygen saturation, asthma, and related respiratory conditions—it is particularly concerning that children and individuals with pre-existing health conditions exhibit heightened vulnerability to the adverse effects of air pollutants [
12]. It can be stated that the issue of air and air pollution is of immense importance for all humans, animals, and ecosystems, which are also affected by air pollutants. We must urgently gain control over global emissions, with special attention given to air pollutants and other harmful substances [
13].
Efforts should be made to reduce emissions and, consequently, ambient concentrations of pollutants—especially under the circumstance of their health effects and the daily mortality rates that correlate with PM concentrations [
14,
15]. Although there are no thresholds below which no health effects from PM are to be expected [
16], the World Health Organization (WHO) published new recommendations for lower thresholds in 2021 [
17]. Adhering even to the revised WHO air quality guidelines [
18] could save countless lives each year [
19].
It is clear from the above that significant efforts must be made to create a healthy environment for humans, animals, and nature. Given that individuals spend approximately 80–90% of their time indoors, ensuring high indoor air quality is essential—particularly in environments where people remain for extended durations, such as residential buildings, workplaces, and educational institutions. High PM concentrations have frequently been observed in work-related indoor spaces [
20,
21]. Elevated levels of PM have also been detected in locations where particularly sensitive individuals reside, such as in residences, schools, nursing homes, and similar settings [
22,
23,
24,
25,
26,
27,
28]. In some cases, indoor concentrations can even exceed outdoor levels [
29].
The Research Unit of Ecological Building Technologies at the Technical University of Vienna, in collaboration with the Technical University of Brno, is conducting a cooperative project focused on the regulation of indoor humidity through an innovative, combined indoor greening system. By integrating specially developed clay composites with a green wall, the aim is to maintain relative humidity consistently within the optimal range of 40–60%. Specially engineered clay mixtures and a green wall system incorporating custom-formulated substrates were developed.
In the subsequent phase outlined in this study, preselected plant species—chosen based on their transpiration characteristics—are being evaluated for their effectiveness in reducing PM2.5 concentrations. To assess the potential of various indoor plants for PM reduction, laboratory experiments are being conducted. To ensure low air velocities and stable humidity levels during the experiments, as typical for indoor environment, a new experimental setup was developed and evaluated for its applicability. In addition to the preselected plant species Epipremnum aureum, Chlorophytum comosum and Nephrolepis exaltata, Maranta leuconeura is being investigated for the first time with regard to its PM2.5 binding capacity.
The results serve to identify the most suitable plant species based on their PM2.5 binding capacity. Furthermore, the results obtained using the new experimental setup are to be compared with previous findings and experimental configurations. This article presents the approach and the findings of this research activity.
1.1. PM Reduction Through Indoor Greening
Concerning indoor air quality and the removal of air pollutants, mechanical ventilation systems are generally more effective. Systems that are planned and integrated from the outset in new building designs are practical, effective, and well-suited to managing high pollutant concentrations. Especially in close proximity to emission-rich areas, such as heavily trafficked roads, opening the window can lead to an increase in indoor pollutant concentrations [
30]. Consequently, measures to improve indoor air quality may be implemented inside. In contrast to engineered systems, indoor greening can be more effective in older buildings [
31]. It has been repeatedly confirmed that plants can temporarily or permanently adsorb or absorb PM as well as other air pollutants, thus contributing to a reduction in airborne PM concentrations [
32,
33,
34]. The studies cited summarize a large body of research demonstrating the effectiveness of plants in reducing air pollutants such as PM and others. However, a few studies report opposing results, showing that passive removal may lead to no or only insignificant reductions [
35]. A general distinction can be made between in situ and laboratory studies. Depending on the research question, each approach offers specific advantages. Laboratory studies allow for the targeted elimination of certain influencing factors, as well as the controlled variation and testing of specific parameters. In studies on plant-based PM reduction, laboratory experiments tend to show significant results more often [
33]. Since there are no standardized procedures for investigating the reduction in PM using plants, the methodologies used vary accordingly.
There is a significant difference between passive and active PM removal. Active removal systems suck air through a filter medium, similar to an air filter. In these cases, air is either sucked or blown through the green wall (plants and substrate). This method can achieve “single pass removal efficiencies” for PM of 40% or more [
36,
37]. In contrast, passive removal generally results in comparatively lower reduction rates, depending on the method and the plant species being studied. The following section describes comparable studies, which investigate the PM reduction potential of indoor plants in laboratory experiments, similar to the method presented in this paper.
An experimental study investigated the behavior of PM concentrations when polluted air was passed through a greenhouse environment. For this purpose, outdoor air was lead through an array of 1000 plants of 100 different species before being led into the interior of the building. The experiment showed reduction rates of 0.2–0.36 for PM
2.5 and 0.24–0.39 for PM
10, also depending on the airspeed. Slow airspeeds, such as 0.5 m/s, were found to be advantageous [
38].
Cao et al. (2019) [
39] investigated the deposition rates of PM
2.5 in a controlled chamber. To simulate PM pollution, conventional cigarette smoke was used as a source, generating an initial concentration of 200–300 μg/m
3. To ensure uniform distribution a fan was employed in the sealed chamber, which measured 0.4 × 0.3 × 0.5 m. Six different plant species used for indoor greening were compared. It was found that
Epipremnum aureum achieved the highest increase in the rate of particle reduction [
39].
Panyametheekul et al. [
40] compared the PM reduction efficiency of various plant species, including artificial plants. By burning an incense stick, PM was introduced into an 8 m
3 chamber, which equipped with a fan. The PM loss rates ranged from 0.05 to 0.08 h
−1. A correlation between leaf surface area and reduction rates was also observed. Furthermore, stereo microscopy revealed that particles tended to accumulate more on the main and secondary veins of the leaves, and less on the flatter areas. The artificial plants used in the study showed similar reduction rates to those of natural plants.
In a comprehensive study, Jeong et al. (2020) [
41] compared 18 different indoor plant species. The introduced PM, composed of sintered loess soil, was dispersed in a 0.9 × 0.86 × 1.3 m chamber using an air gun, until an initial concentration of 300 μg/m
3 was reached. Instead of using a fan, changes in sedimentation were observed depending on the plant species. The concentration was measured every two hours and expressed as PM reduction per unit leaf area. The results showed that the amount of PM accumulated on the leaves varied between 3.3 and 286.2 μg/m
2. The plant species with the highest PM reduction were Pachira aquatica and Dieffenbachia amoena.
Budaniya and Rai (2022) [
35] investigated various plant species suitable for both indoor and outdoor environments. For this purpose, the deposition velocity was measured in a chamber under controlled conditions. Outdoor air, pre-filtered using a HEPA filter, was enriched with particulate matter by burning an incense stick. Three fans circulated the air within the chamber to ensure uniform distribution. The particle sizes ranged from 0.25 to 0.5 μm in diameter and were considered small compared to those targeted by conventional air purifiers. The determined deposition velocity ranged from 1 to 37 cm/h.
1.2. Influencing Parameters on PM Reduction by Plants
The referenced studies offer a valuable foundation for comparative analysis. However, direct comparisons are often challenging due to variations in the used methodologies. The effects of greening on PM reduction are presented in various forms and units. The removal of PM from the air is reported as sedimentation velocity in m/s [
35,
40], as a reduction in airborne concentration in μg/m
3 [
39,
41,
42], or as an accumulation rate in μg/m
2 [
43]. In most of the presented studies, fans are used to circulate the air. While the type of equipment is commonly documented, the rotational speed of the fans is often not reported [
39,
44,
45]. However, as demonstrated in previous studies, airflow velocity significantly influences the deposition of particulate matter (PM) on plant surfaces [
42,
46]. Furthermore, precise reporting of the leaf surface area—along with a description of the plant’s growth form or the leaf area index (LAI)—is essential for reproducibility and accurate interpretation of results [
35,
44]. Comparing plants with drastically different leaf areas [
39] may lead to misleading conclusions, although it has been concluded that a bigger leaf area does not necessarily result in higher PM reduction efficiency [
41]. Relative humidity is another crucial factor. While it is sometimes measured, data are frequently missing. Since humidity correlates with deposition rate [
47,
48], such information is essential, but sometimes missing. Several studies have demonstrated a positive correlation between humidity and the ability to capture airborne pollutants. In humid environments, deposition velocities increase because particles absorb moisture, grow in size, and thus settle more quickly [
48]. This is particularly relevant in small artificial chambers, where humidity levels can rise rapidly to values that would be considered problematic from a building physics perspective. If no humidity control measures are implemented, the relative humidity within the test chamber can approach 100% [
49], as was also observed during preliminary trials in the presented study. In addition to humidity and temperature, light intensity also plays a role, as these parameters influence the photosynthetic activity of plants. Consequently, reporting on these conditions is necessary to ensure reproducibility [
39]. The opening of stomata, which allows gas exchange, also affects the plant’s potential to absorb or bind to airborne pollutants [
50].
On a larger scale, factors such as plant arrangement, plant size, and the prevailing air movement play a significant role. In addition to the parameters influencing PM deposition mentioned above, various morphological, structural, and especially anatomical characteristics of leaves are fundamentally influential [
51]. The ability to remove PM from the air can be explained by a number of differences, particularly structural features that influence efficiency. These include the presence of a wax layer, leaf size and shape, stomatal density, microstructure and surface roughness [
52,
53,
54,
55,
56,
57,
58,
59,
60].
Of note is the positive correlation between the presence and density of trichomes and grooves [
54,
61,
62,
63,
64,
65]. In addition to their ability to bind PM, trichomes also play a beneficial role in preventing resuspension of particles [
66]. This is explained by the increased surface area provided by the trichomes [
67]. Once particles are deposited, they are less likely to be dislodged by air movement when trichomes are present on the leaf surface. Similar to trichomes, leaves generally exhibit a hydrophobic surface due to their wax layers. However, this protective layer can be degraded by exposure to UV radiation, weather conditions, and other environmental factors, leading to a reduction in surface hydrophobicity [
62,
68]. Therefore, it can be concluded that, on the one hand, laboratory experiments using plants that are not exposed to environmental conditions in the same way as outdoor plants may yield different PM deposition rates. On the other hand, the deposition behavior of outdoor plants may change over time. The extent of this effect and which plant species are most affected could be the focus of future research. The fact that the wax layer can be a decisive factor for particulate matter accumulation is demonstrated by findings from Popek et al., who showed that up to 40% of PM can be retained within the wax layer [
69].
1.3. Plants of Interest
The plant species were selected because they demonstrated advantageous transpiration rates in preliminary trials conducted as part of the aforementioned research project. The following four plant species were used: Chlorophytum comosum, Nephrolepis exaltata, Epipremnum aureum, and Maranta leuconeura. For the first three species, results from various studies exist both in real environments and under laboratory conditions. However, it is important to note that the experimental designs vary significantly across these studies, which hinders direct comparability.
The study revealed that the amount of PM absorbed by
Chlorophytum comosum depends on its usage and is thus related to the surrounding PM concentration [
70]. Due to its high particle uptake capacity, this plant can also serve as a bioindicator of environmental pollution [
71]. Furthermore,
Chlorophytum comosum has the ability to reduce volatile organic compounds (VOCs) [
72] and polycyclic aromatic hydrocarbons (PAHs) [
73] in indoor environments. For these reasons, the species is also suitable for use in actively managed botanical biofilters [
74]. In some of the presented studies examining PM
2.5 deposition rates in an artificial chamber,
Chlorophytum comosum showed comparatively high reduction rates compared to other plant species. The deposition capacity can be attributed to the microstructure of its leaf surface, which features a relief-like pattern of indentations and texture [
34,
39].
Epipremnum aureum is among the most frequently studied plant species in relation to indoor air quality [
33]. With regard to particulate matter reduction,
Epipremnum aureum demonstrated a moderate reduction rate compared to other species, based on a PM
2.5 deposition of 119.59 μg/m
2 after two hours [
41]. Cao et al. even referred to
Epipremnum aureum as the optimal choice for indoor greening with respect to PM reduction, following a comparative study of different plants in an artificial chamber. In this setup, PM was introduced in the form of cigarette smoke, the air was homogenized using a fan and PM concentrations were measured over time [
39]. A similar conclusion was drawn by Yadav and Sing (2021), who also identified
Epipremnum aureum as the most effective species for PM reduction among the tested plants. In a relatively large sized chamber, this plant exhibited the highest reduction rates [
44].
Nephrolepis exaltata has been tested in fewer studies [
33]. In a laboratory experiment that measured the amount of particulate matter sedimentation on the surface of different plant species,
Nephrolepis exaltata demonstrated low efficiency, with a deposited amount of PM
2.5 of only 50 μg/m
2 after two hours. In contrast, Dieffenbachia amoena showed the highest deposited amount of 188.95 μg/m
2, highlighting significant differences in the PM retention capacities of the studied species [
41].
To the best of the authors’ knowledge, no studies to date have investigated the PM reduction capabilities of
Maranta leuconeura. The leaf surface of
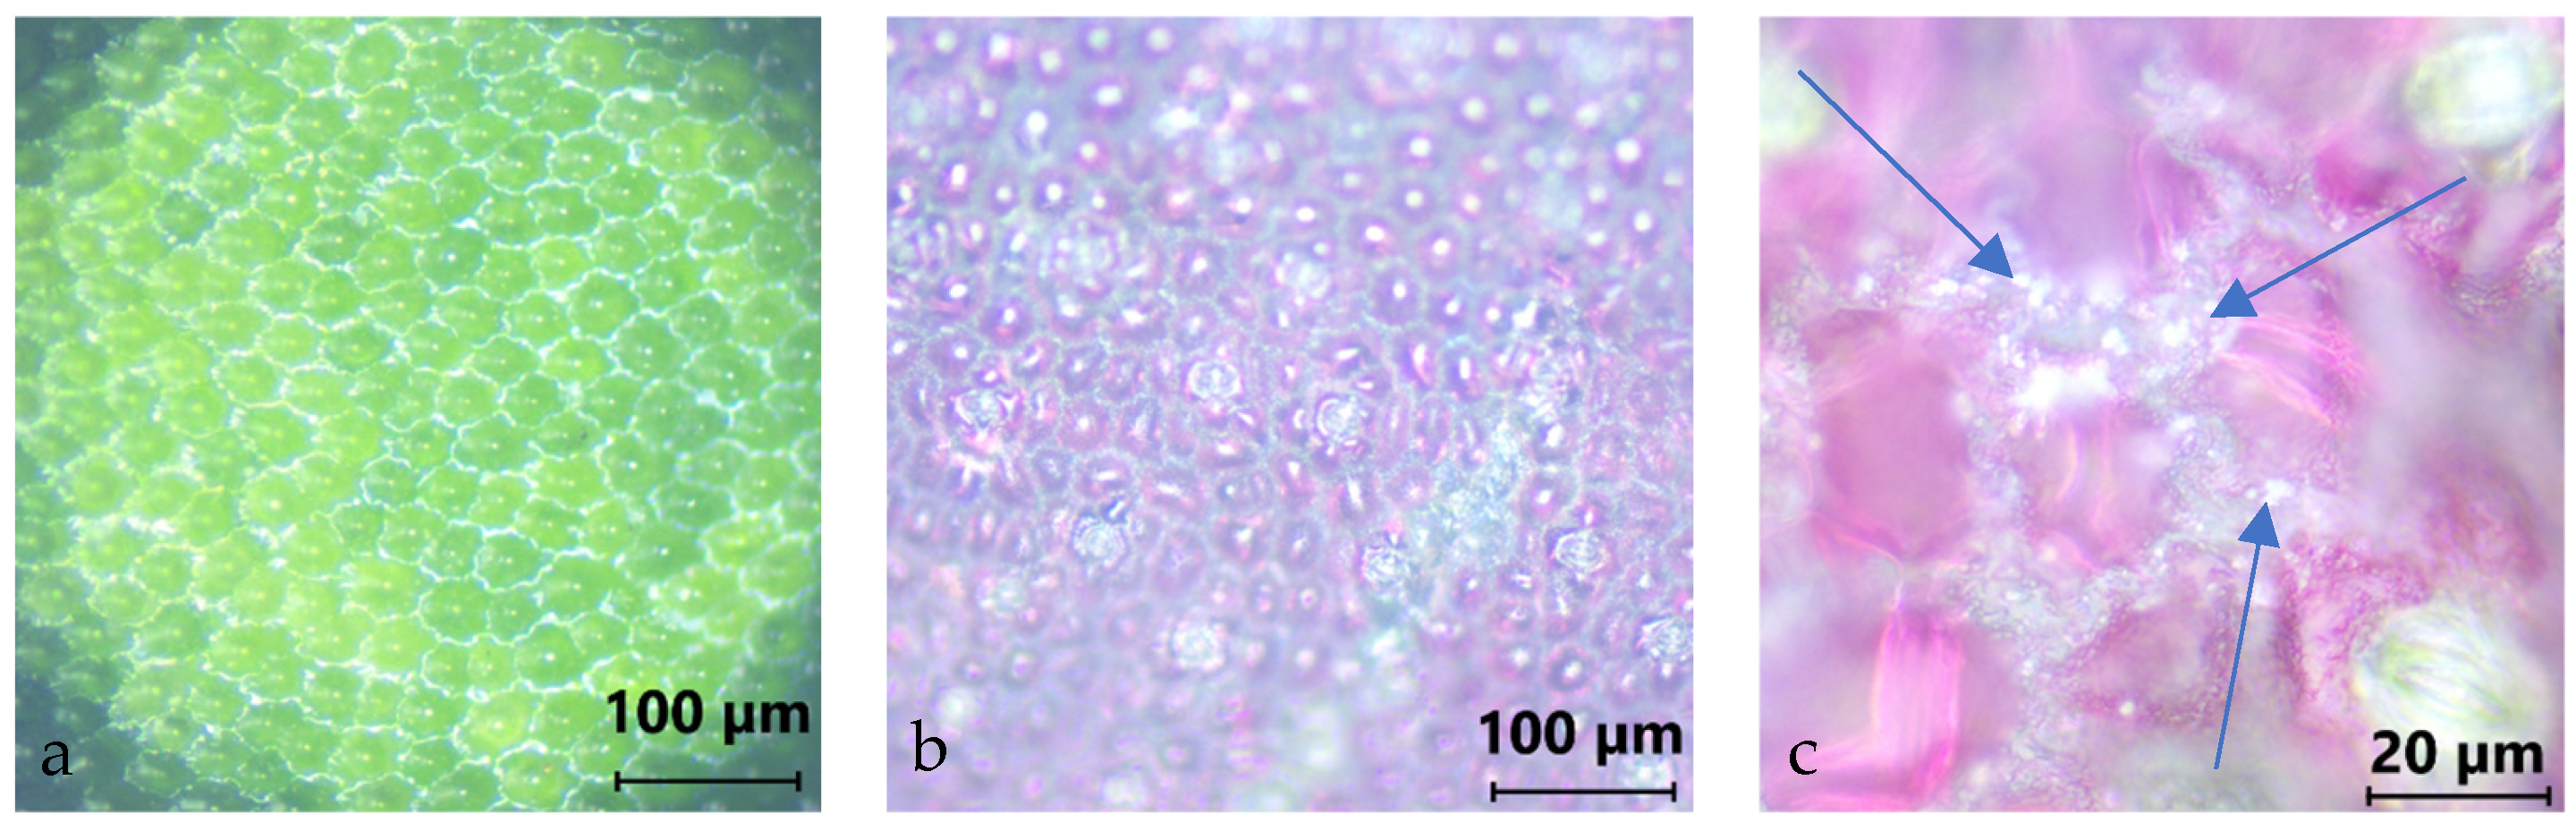
Maranta leuconeura exhibits a complex structural organization, characterized by distinct light and dark green regions. The dark green areas on the adaxial surface are composed of hemispherical epidermal cells covered by overlapping wax plates, whereas the light green regions feature convex cells with fine wax granules, as illustrated in
Figure 1. Such wax-like surface structures have been reported in the literature to enhance PM retention [
56,
60,
75]. The leaves are ovate in shape, measuring approximately 10–15 cm in length and 5–9 cm in width, and are marked by red venation interspersed between the green zones.
The following three images were taken with Optika B-383MET by OPTIKA S.r.l., based in Ponteranica, Italy. Images were processed with the program Liteview, showing microscopic photographs of Maranta leuconeura. The left image was taken at 10× magnification and shows the surface of a leaf. It was captured in the dark green area of the leaf and reveals the hemispherical epithelial cells. The central image was also taken at 10× magnification but shows the abaxial side of the leaf. Since the abaxial side is reddish, the image appears in a pinkish color. Individual epithelial cells can be seen, interspersed with stomata. The right image also shows the abaxial side of the leaf, but at 50× magnification. In the grooves between the cells, individual foreign particles or impurities are visible. The particles are in the order of a few micrometers in size. Notably, the particles are exclusively deposited within the grooves.
2. Materials and Methods
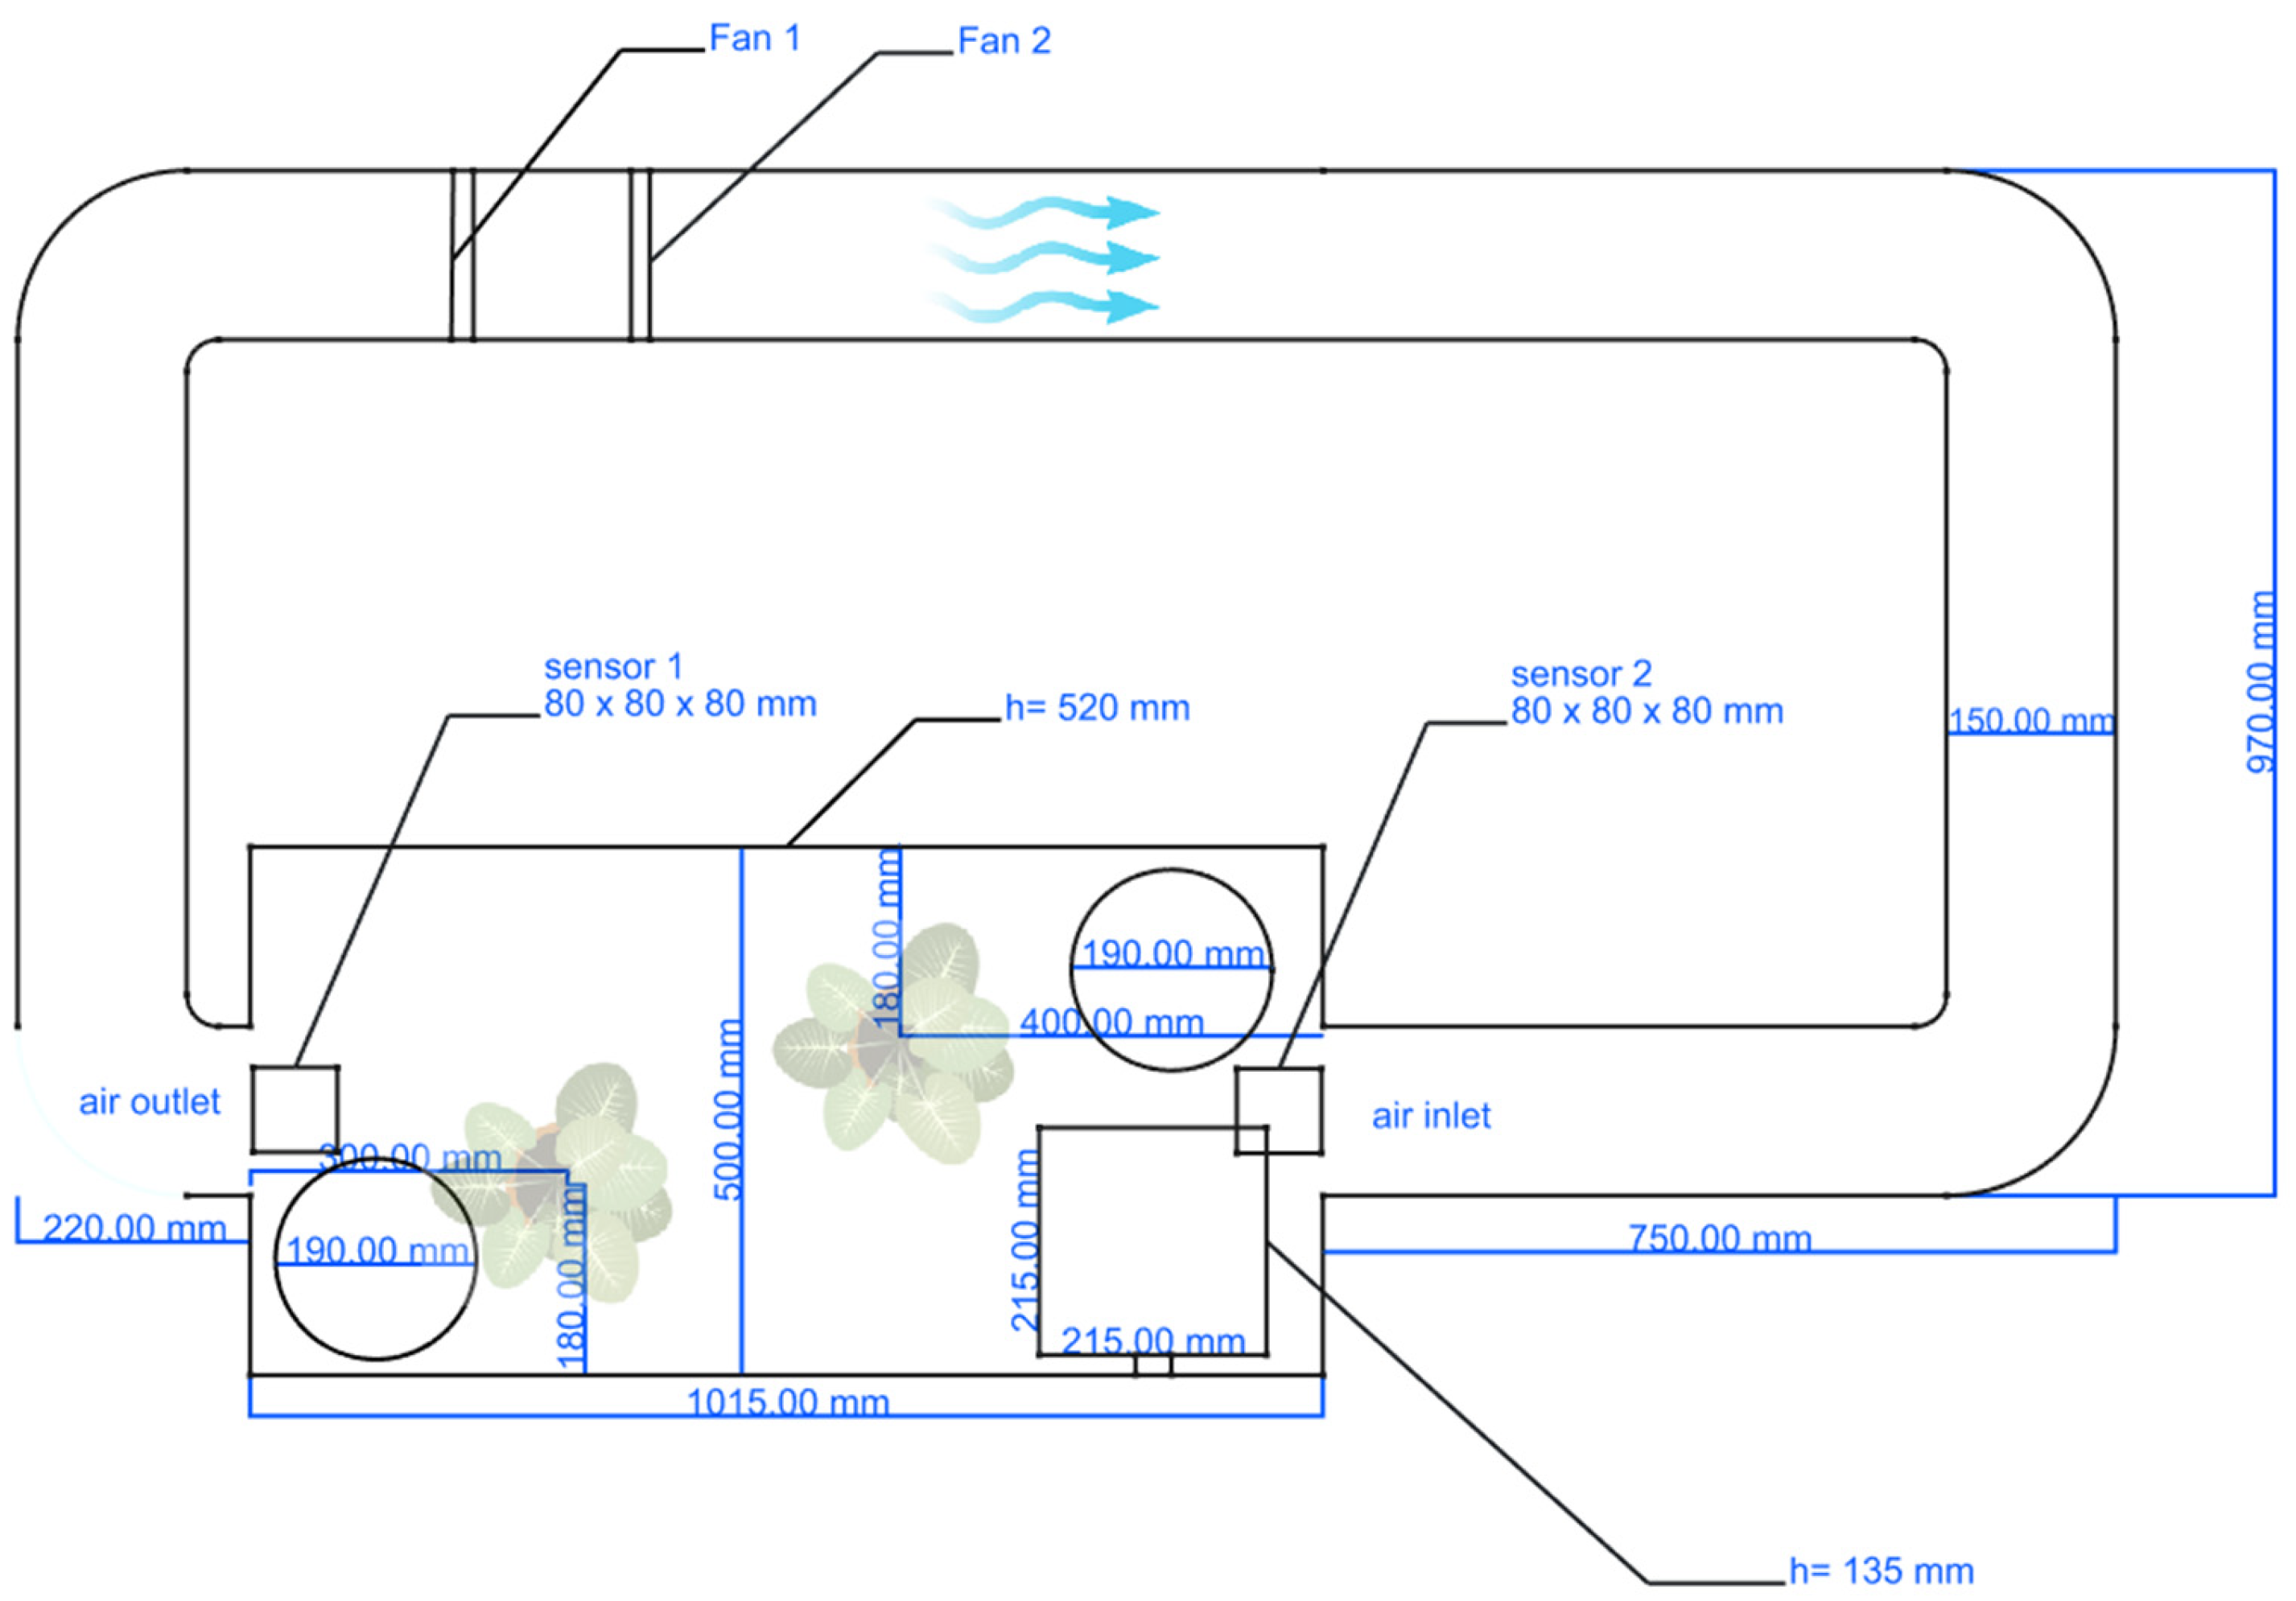
The experiment was conducted in a custom-built test chamber, as shown in
Figure 2. It consisted of an acrylic glass box (hereafter referred to as Box 1) with a wall thickness of 4 mm and a removable lid. This box featured a 15 cm air inlet on one side and an air outlet of the same diameter on the opposite side. Both openings were connected by a PVC pipe with a diameter of 15 cm. The inlet and outlet were centrally positioned on the two narrower sides of the box. Two 140 mm fans from Noctua NF-A14 by Noctua Gmbh in Vienna, Austria were installed within the PVC pipe. Fan 1 generated the airflow during the experiment and was adjusted according to the predefined air velocity. Fan 2 was set to 3000 rpm and supplied fresh air after the test run was completed. An anemometer was used to measure and regulate the airflow velocity. A major advantage of this setup lies in its ability to precisely control airspeed. All joints of the test chamber were sealed using either silicone or adhesive tape. The lid was sealed with foam. Two test plants were placed inside the chamber, which has external dimensions of 1015 × 500 × 520 mm. The total volume of the setup is 0.34 m
3.
An additional small box made of acrylic glass (hereafter referred to as Box 2) was positioned in one corner of Box 1 and used for smoke generation. It served as a chamber for the PM insertion and was equipped with a hinged lid and a mechanism that allowed Box 2 to be opened from the outside while Box 1 remained closed. Furthermore, Box 2 was connected to the outside air via a 6 mm hole, which could also be closed. This opening was used to introduce the PM2.5 into the system.
Preliminary tests showed that due to plant transpiration, the humidity inside the chamber rose to levels of 90% relative humidity (RH) or higher. To maintain the humidity within a desired range of 40–70% RH, two Petri dishes with a diameter of 19 cm were placed inside the chamber. Each container was filled with 150 g of granulated calcium chloride manufactured by Höfer Chemie GmbH, in Kleinblittersdorf, Germany, a strong hygroscopic substance that can liquefy moisture from the air through deliquescence. This measure was intended to keep the relative humidity within the target range.
As can be seen in
Figure 2, Sensor 2 was placed above the air inlet and Sensor 1 above the air outlet inside the acrylic glass box. The measurement interval was 0.7 min.
The AirGradient Open Air model O-1PST, manufactured by AirGradient Ltd. in Mae Rim, Thailand, is equipped with the Plantower PMS5003T manufactured by Plantower Technology in Nanchang, China, particulate matter sensor. This sensor operates based on the principle of laser light scattering and measures particle concentrations. Additionally, the PMS5003T module incorporates an ENS210 sensor manufactured by ScioSense B.V in Eindhoven, The Netherlands, which monitors temperature and relative humidity.
According to the manufacturer, the measurement accuracy is ±10% for PM2.5 concentrations in the range of 100–500 μg/m3 and ±10 μg/m3 for concentrations between 0 and 100 μg/m3, ±0.2 °C for temperature, and ±3.5% RH for relative humidity.
The sensors are calibrated by Plantower Technology at their factory. Furthermore, they are tested prior to delivery by AirGradient Ltd., Mae Rim, Thailand. The reference measurement results for Sensor 1 show a value of 10.16 μg/m3 at a reference concentration of 10.12 μg/m3, resulting in a delta of 0.04 μg/m3, which corresponds to a percentage deviation of 0.4%. Sensor 2 recorded a value of 9.62 μg/m3 at the same reference concentration of 10.12 μg/m3, yielding a delta of 0.49 μg/m3 and a percentage deviation of 4.8%. At a reference value of 62.56% relative humidity, Sensor 1 exhibited a deviation of 0.04%, while Sensor 2 showed a deviation of –0.94%, respectively.
The results of the factory-internal control measurements are illustrated in
Table 1 below. In addition to the particulate matter (PM) measurement data, values for temperature and relative humidity are also presented.
The production or introduction of PM into indoor environments can have various sources [
76]. Indoor PM is often generated by temporary combustion processes such as cooking [
77,
78], wood burning for heating [
79], candles [
80], conventional cigarettes [
81], electronic cigarettes [
82], and similar sources. Among others [
35,
36,
37,
40,
44], incense sticks were used to generate PM in this study. The product used was from Pajoma brand, manufactured by Ingo Steyer GmbH & Co. KG in Hemmoor, Germany.
Due to the reason that the test setup is intended to simulate an indoor environment and that plants are typically used for indoor greening, the selection of the airflow velocity was based on the DIN EN 16798-1 standard. This standard specifies that, for local thermal comfort, the indoor air velocity in Category 3 under summer conditions should not exceed 0.34 m/s. In accordance with this guideline, the fan was adjusted to achieve an average air velocity of 0.3 m/s inside the chamber. The actual airflow velocity was set and monitored using an anemometer from the brand Testo, model 0635 1032. The setup was placed indoors. Intensity of artificial light and indirect sunlight measured between 1400 and 1800 Lux throughout the test runs, quantified by using a PCE-CRM 40 Luxmeter manufactured by PCE Instruments GmbH in Oberndorf am Neckar, Germany.
The advantage of this custom-designed and specially constructed chamber lies in the ability to precisely control the airflow velocity. In test chambers that are cube- or cuboid-shaped and equipped with a fan, the airflow is typically undirected and turbulent. In contrast, the chamber used in this study features a recirculating airflow system, as previously described. This design ensures that the air moves in a directed manner, perpendicular to the plant’s growth direction, passing through both the chamber and the plant itself. Even though this setup does not perfectly replicate real-life conditions, it closely approximates the airflow in indoor environments equipped with plants or green walls.
2.1. Leaf Area
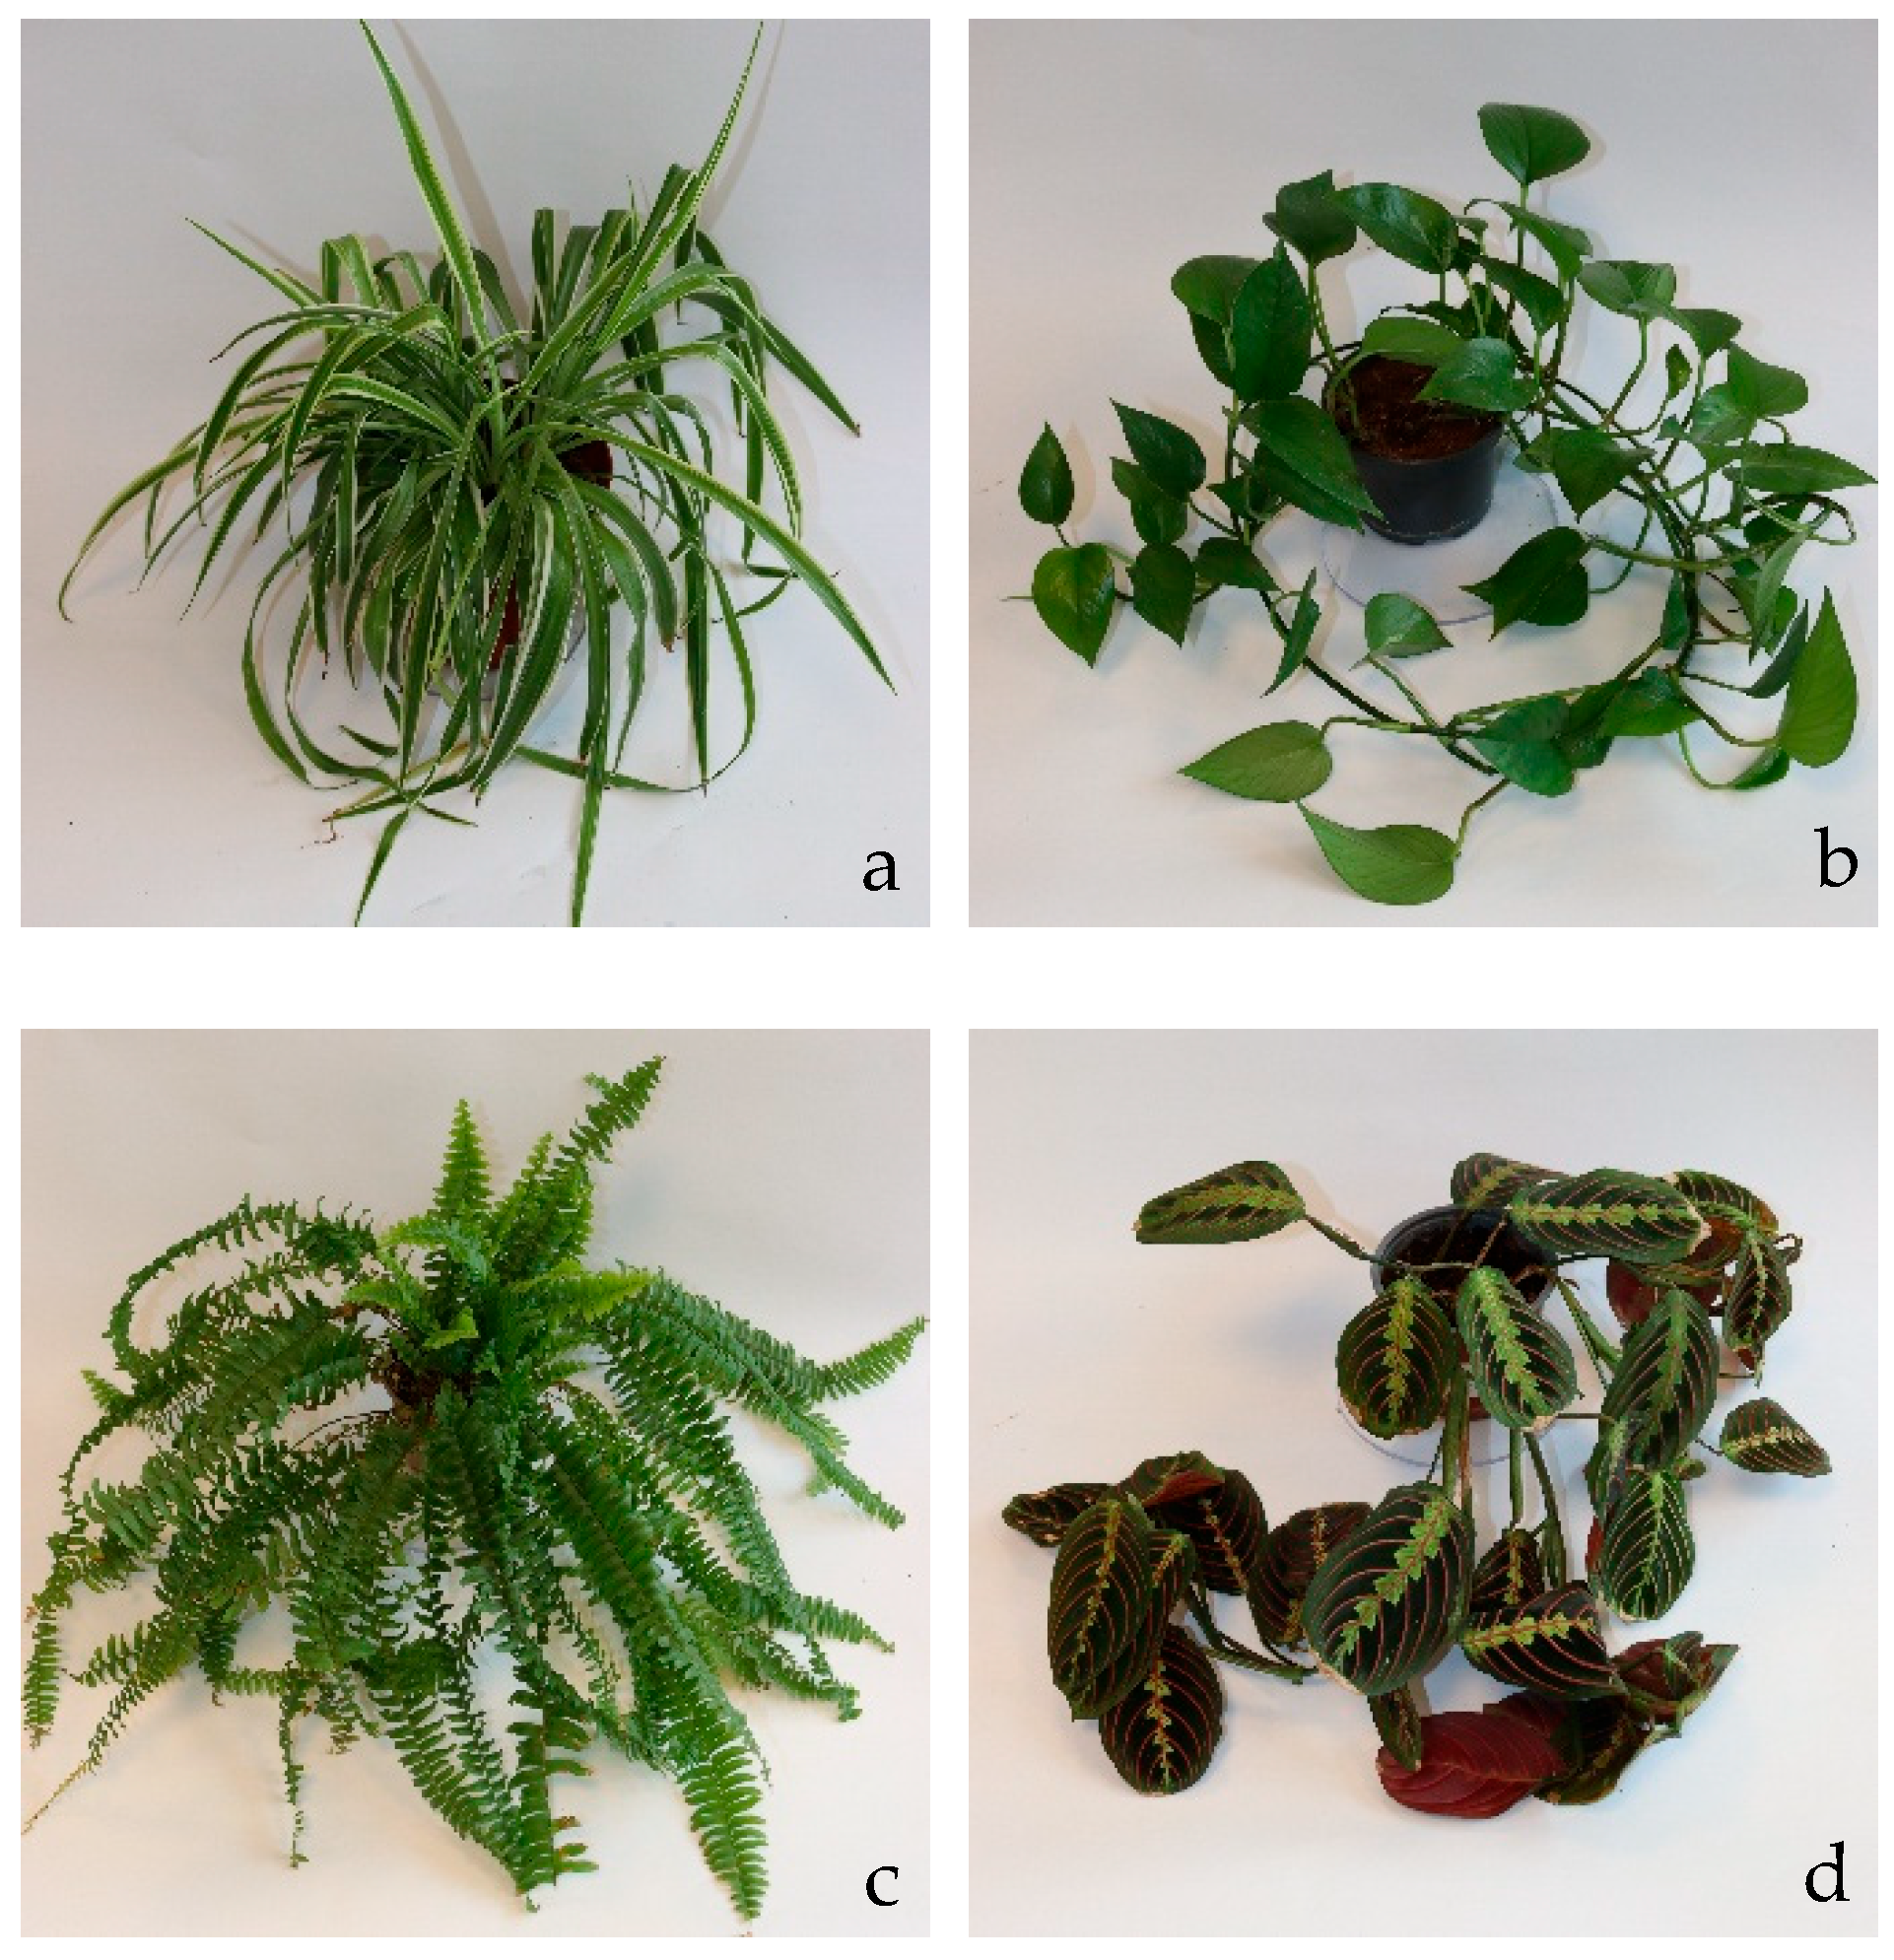
The investigated plants are shown in
Figure 3. The four species
Chlorophytum comosum,
Epipremnum aureum,
Nephrolepis exaltata, and
Maranta leuconeura are displayed from left to right. Each plant is shown in a pot with substrate.
The leaf areas of Epipremnum aureum, Nephrolepis exaltata, and Maranta leuconeura were determined using the smartphone application LeafByte version 1.4.0. Each and every individual leaf was photographed against a white background with reference markers with a defined distance. The apps then automatically calculated the area using image processing algorithms.
For Chlorophytum comosum, 20 individual leaves were removed from the plant and scanned using the aforementioned application. Based on the measured leaf area of these 20 leaves and the total number of leaves counted on the plant, the total leaf area was calculated. This procedure differed from those used for other species due to the specific growth habit and spatial arrangement of the leaves.
2.2. Procedure
At the beginning of the trial, the PM chamber was wiped down and thoroughly cleaned. The plants were prepared in the same way prior to each test repetition. The plants were watered equally two days before the start of the first measurement. Subsequently, the experiments were conducted with one run per day, without providing the plants with additional water. This procedure was consistent across all experimental runs.
The leaf surfaces of the plants to be measured were thoroughly sprayed and cleaned with water using a spray bottle. The plants were subsequently placed in a low-particulate environment, with PM2.5 concentrations ranging from 0 to 5 μg/m3, for approximately 1 to 1.5 h until the leaves were dry. The environmental conditions were controlled using a technical ventilation system. Throughout the experiments, the temperature was consistently maintained between 18 and 21 °C, with relative humidity ranging from 35% to 58%.
Meanwhile, the acrylic glass box was thoroughly ventilated in the same environment with low PM
2.5 values. The controlled indoor air quality was achieved through a technical air filtration system comprising a combination of two filters. The first filter was classified as an M5 air filter, capable of removing at least 80% of the coarse particulate matter. The second filter was an ePM1 filter, corresponding to class F7, designed to remove at least 60% of PM1 particles. Both filters were manufactured by MANN + HUMMEL and are certified in accordance with ISO 16890 [
83].
The glass containers were each filled with 150 g of calcium chloride and placed inside the box. Once the plant’s leaves had completely dried, the plant was placed in the box. Box 1 and Box 2 were then sealed. A waiting period of 15 min followed to allow the particulate matter concentration inside Box 1 to stabilize.
An incense stick was ignited to introduce particulate matter. After the initial dense smoke dissipated, the stick was held through a 6 mm opening in Box 2 for 15 s. Following this exposure period, the stick was removed and Box 2 was sealed externally. Subsequently, the lid of Box 2 was opened from the outside, releasing the accumulated smoke into the main chamber in a single burst. The PM2.5 concentration in Box 1 was then measured, and the trial was considered valid only if it reached the target range of 320–350 μg/m3. Five test runs were performed for each plant species. A reference curve was established using the same procedure, with the only difference being that the pot contained substrate of equal moisture content but no plant. This control setup accounts for PM deposition on non-biological surfaces, such as the inner walls of the pipe and chamber. It was also repeated five times and serves to isolate and quantify PM deposition attributable solely to the above-ground parts of the plant.
2.3. Data Management and Statistical Analysis
The raw data were saved as a CSV file and analyzed using a Python (version 3.12.7) script. For each measurement, the data from both sensors were used and processed as recommended by AirGradient. The manufacturer AirGradient recommends algorithmic processing of the data to improve the accuracy of the results. The U.S. Environmental Protection Agency (EPA) has developed a correction algorithm to enhance the accuracy of PM
2.
5 measurements obtained from PurpleAir sensors manufactured by PurpleAir inc. in Salt Lake City, Australia, which utilize the same PMS5003 particulate matter sensors. This algorithm specifically accounts for the influence of humidity on the measurements. After correction, the agreement with the reference data improves significantly—the coefficient of determination (R
2) remains high, while both the Root Mean Square Error (RMSE) and the normalized RMSE (nRMSE) decrease substantially [
84]. The algorithm for PM
2.5 as well as for temperature and relative humidity can be found under
https://www.airgradient.com/documentation/calibration-algorithms/, accessed on 15 April 2025. The following formulas were applied to the raw data for PM
2.5.
Algorithm (AGraw stands for the raw data) for PM
2.5:
| AGraw < 30: | PM2.5 = [0.524 × AGraw] − [0.0862 × RHraw] + 5.75 | (1) |
| 30 ≤ AGraw < 50: | PM2.5 = [0.786 × (AGraw/20 − 3/2) + 0.524 × (1 − (AGraw/20 − 3/2))] × AGraw − [0.0862 × RHraw] + 5.75 | (2) |
| 50 ≤ AGraw < 210: | PM2.5 = [0.786 × AGraw] − [0.0862 × RHraw] + 5.75 | (3) |
| 210 ≤ AGraw < 260: | PM2.5 = [0.69 × (AGraw/50 − 21/5) + 0.786 × (1 − (AGraw/50 − 21/5))] × AGraw − [0.0862 × RHraw × (1 − (AGraw/50 − 21/5))] + [2.966 × (AGraw/50 –21/5)] + [5.75 × (1 − (AGraw/50 − 21/5))] + [8.84 × (10−4) × AGraw2 × (AGraw/50 − 21/5)] | (4) |
| 260 ≤ AGraw: | PM2.5 = 2.966 + [0.69 × AGraw] + [8.84 × 10⁻⁴ × AGraw2] | (5) |
The stored times in the format [“Local Date/Time”] were converted into hours since the start. As the sensors transmitted data to the manufacturer’s server via an internet connection, intermittent data gaps occurred due to transmission failures. Gaps shorter than 5 min were closed by linear interpolation of time and PM2.5 values. Gaps longer than 5 min were considered invalid, resulting in the entire run being deemed invalid. PM2.5 values above 300 µg/m3 and below 5 µg/m3 were also discarded.
The cleaned data from both sensors were averaged to obtain a function of time and PM2.5 value for each experimental run. Sensor 1 and Sensor 2 were compared, and no significant difference in PM concentration was observed between them. To ensure reliable results, five measurements were taken per plant and subsequently averaged.
To determine the statistical significance of the results, the mean values were analyzed using an independent t-test and analysis of variance (ANOVA). The statistical analysis was performed using Python.
3. Results
The results of the leaf area measurements are presented in
Table 2. As can be seen, the determined leaf areas are of the same order of magnitude. The two plants of the same species are also comparable in size. Despite the plants exhibiting a similar overall habitus, differences in the total leaf area can be observed. While
Epipremnum aureum showed the smallest total leaf area of 0.2325 m
2,
Nepholepis exaltata showed the biggest total leaf area of 0.6716 m
2 due to its numerous fine leaves.
Chlorophytum comosum and
Maranta leuconeura had a total leaf area of 0.3871 m
2 and 0.3318 m
2 respectively.
Table 3 presents the t- and
p-values derived from the independent t-tests and ANOVA. As all
p-values were less than 0.05, the null hypothesis was rejected, indicating statistically significant differences among the results.
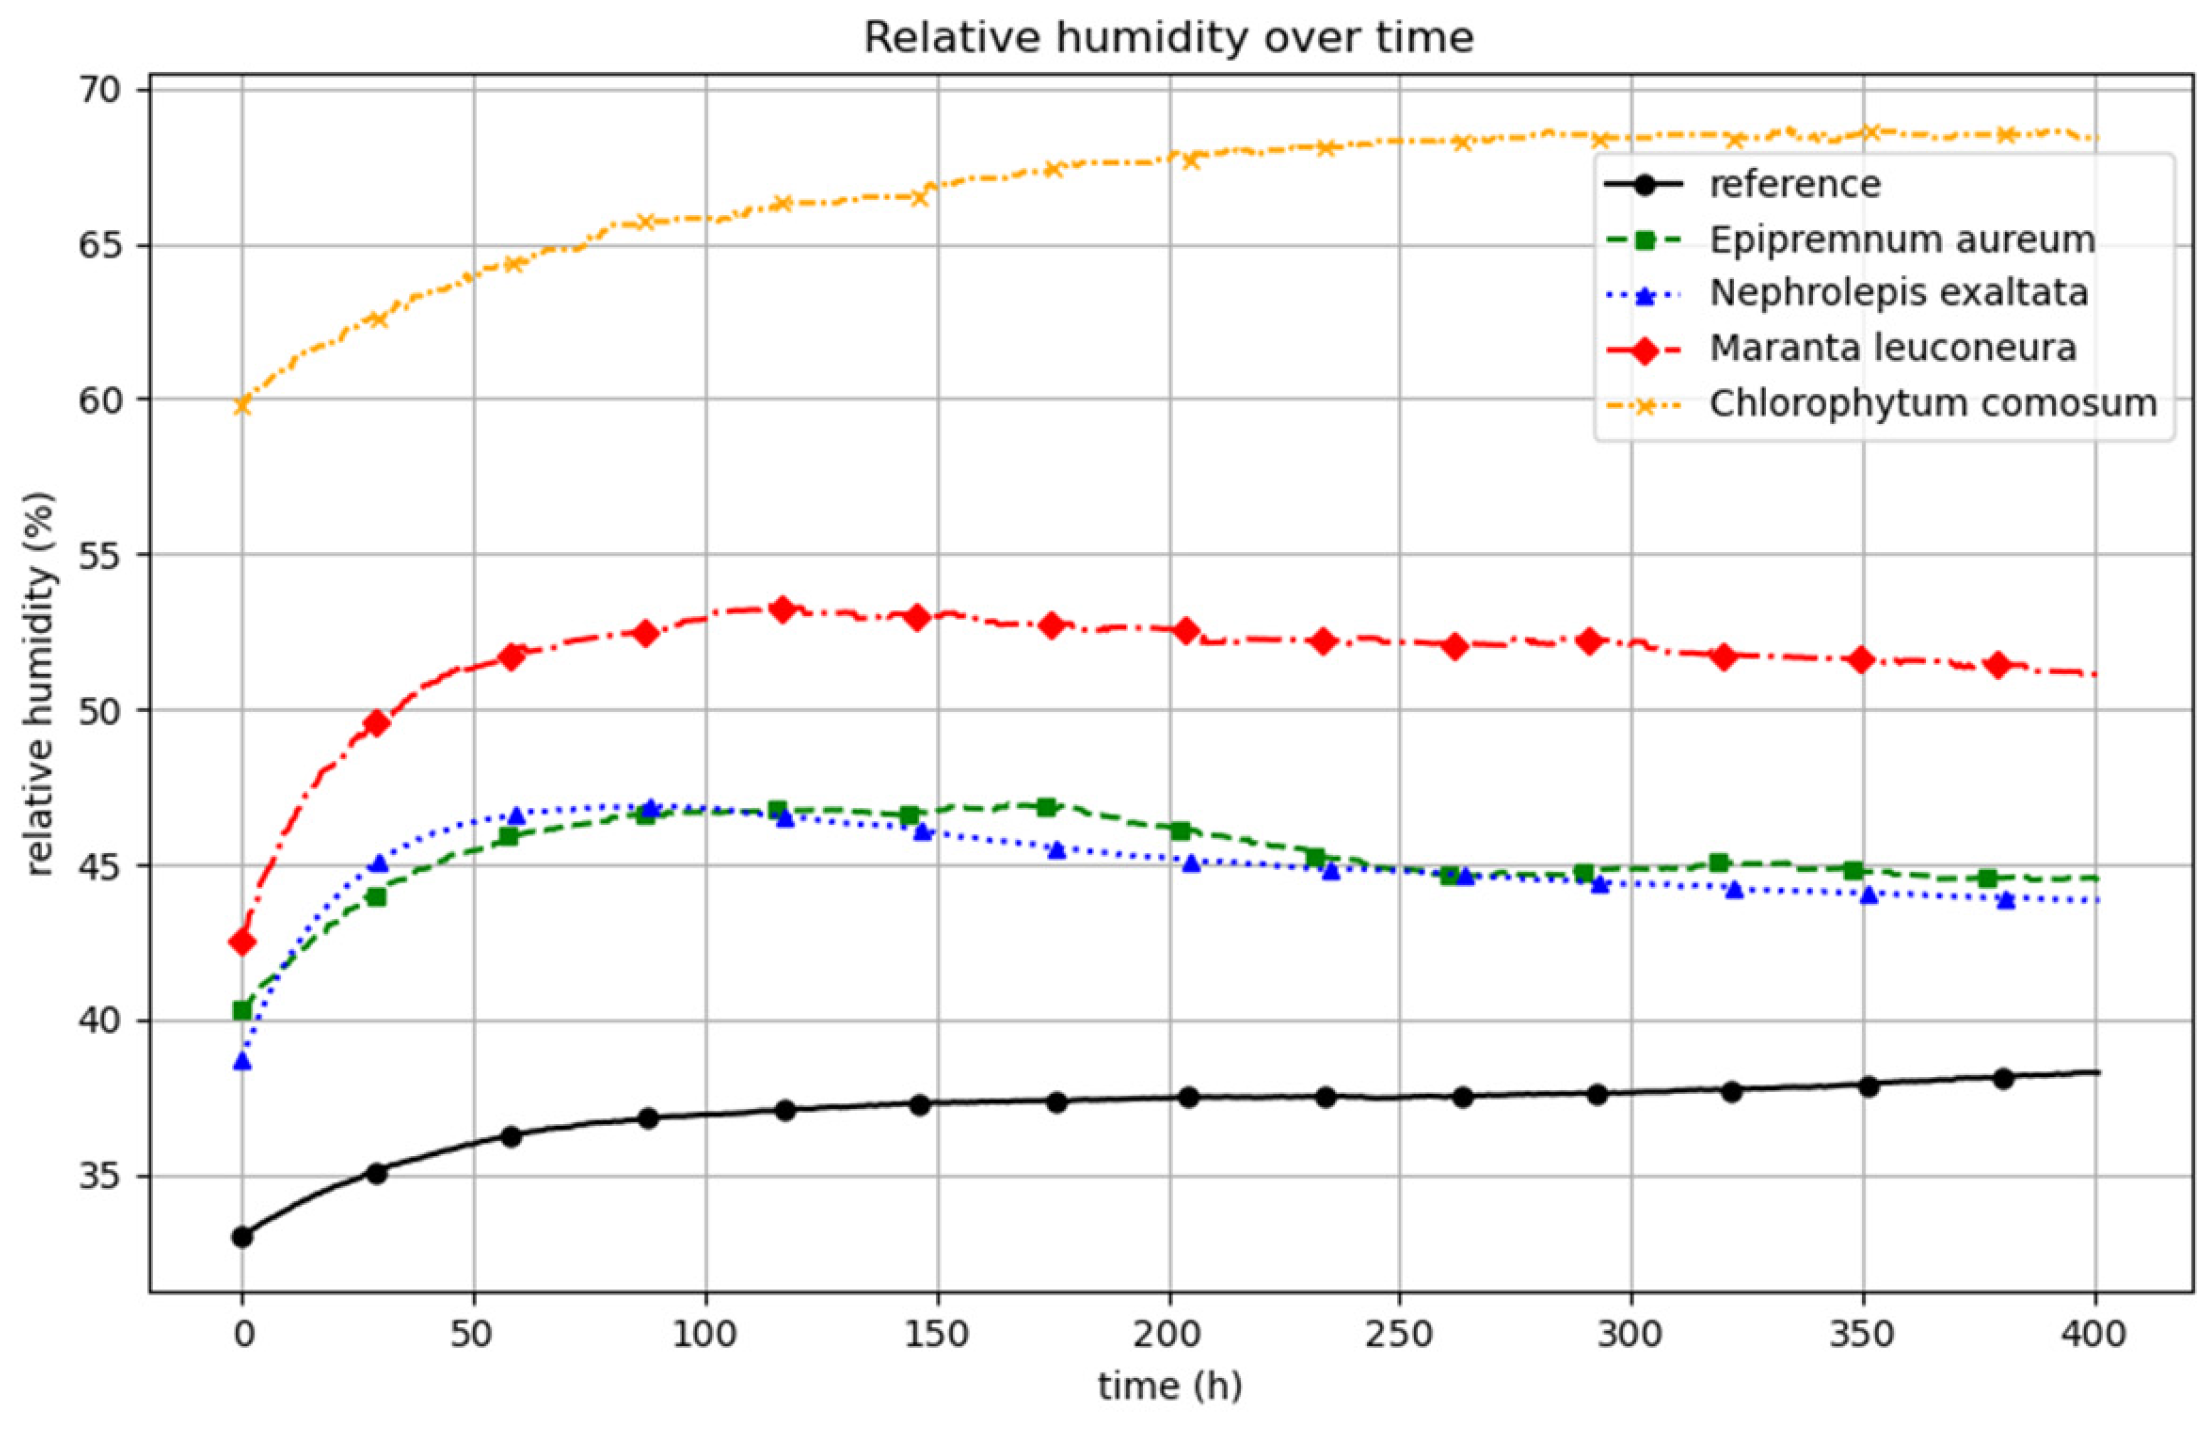
The progression of relative humidity over the course of the experiment is being illustrated in
Figure 4. The figure shows the average of five experimental replicates for each variant. It is evident that relative humidity increases following the introduction of the plants or the start of the measurement.
The trials with Chlorophytum comosum led to the highest humidity levels, followed by Maranta leuconeura. Nephrolepis exaltata and Epipremnum aureum show a similar pattern for relative humidity.
The increase in humidity observed in the reference setup was noticeably lower, which is consistent with the absence of a plant, although the pot containing substrate was present in the chamber. The average relative humidity over the test runs was 37.07%, 45.37%, 66.77%, 45.07% and 51.75% for the reference, Epipremnum aureum, Chlorophytum comosum, Nephrolepis exaltata and Maranta leuconeura, respectively. The application of calcium chloride effectively maintained relative humidity at the desired level between 40 and 70%. In contrast, preliminary trials conducted without the use of hygroscopic salt showed a substantial increase in relative humidity, reaching levels between 90% and 100%.
The change in relative humidity from the start of the measurement to the point of maximum humidity is referred to as ΔRHmax, which accounted for the following:
- -
Reference: 5.26%.
- -
Epipremnum aureum: 6.63%.
- -
Nephrolepis exaltata: 8.18%.
- -
Maranta leuconeura: 10.84%.
- -
Chlorophytum comosum: 8.90%.
- -
Nephrolepis exaltata (without salt): 10.95%.
At the start of the experiment, the increase in relative humidity was the lowest in the reference setup. In the reference condition, only the pot containing the moistened substrate was present. In contrast, the setups including plants exhibited a higher ΔRH_max. In these cases, the rise in relative humidity is not only due to evaporation from the substrate but also results from transpiration by the plant leaves.
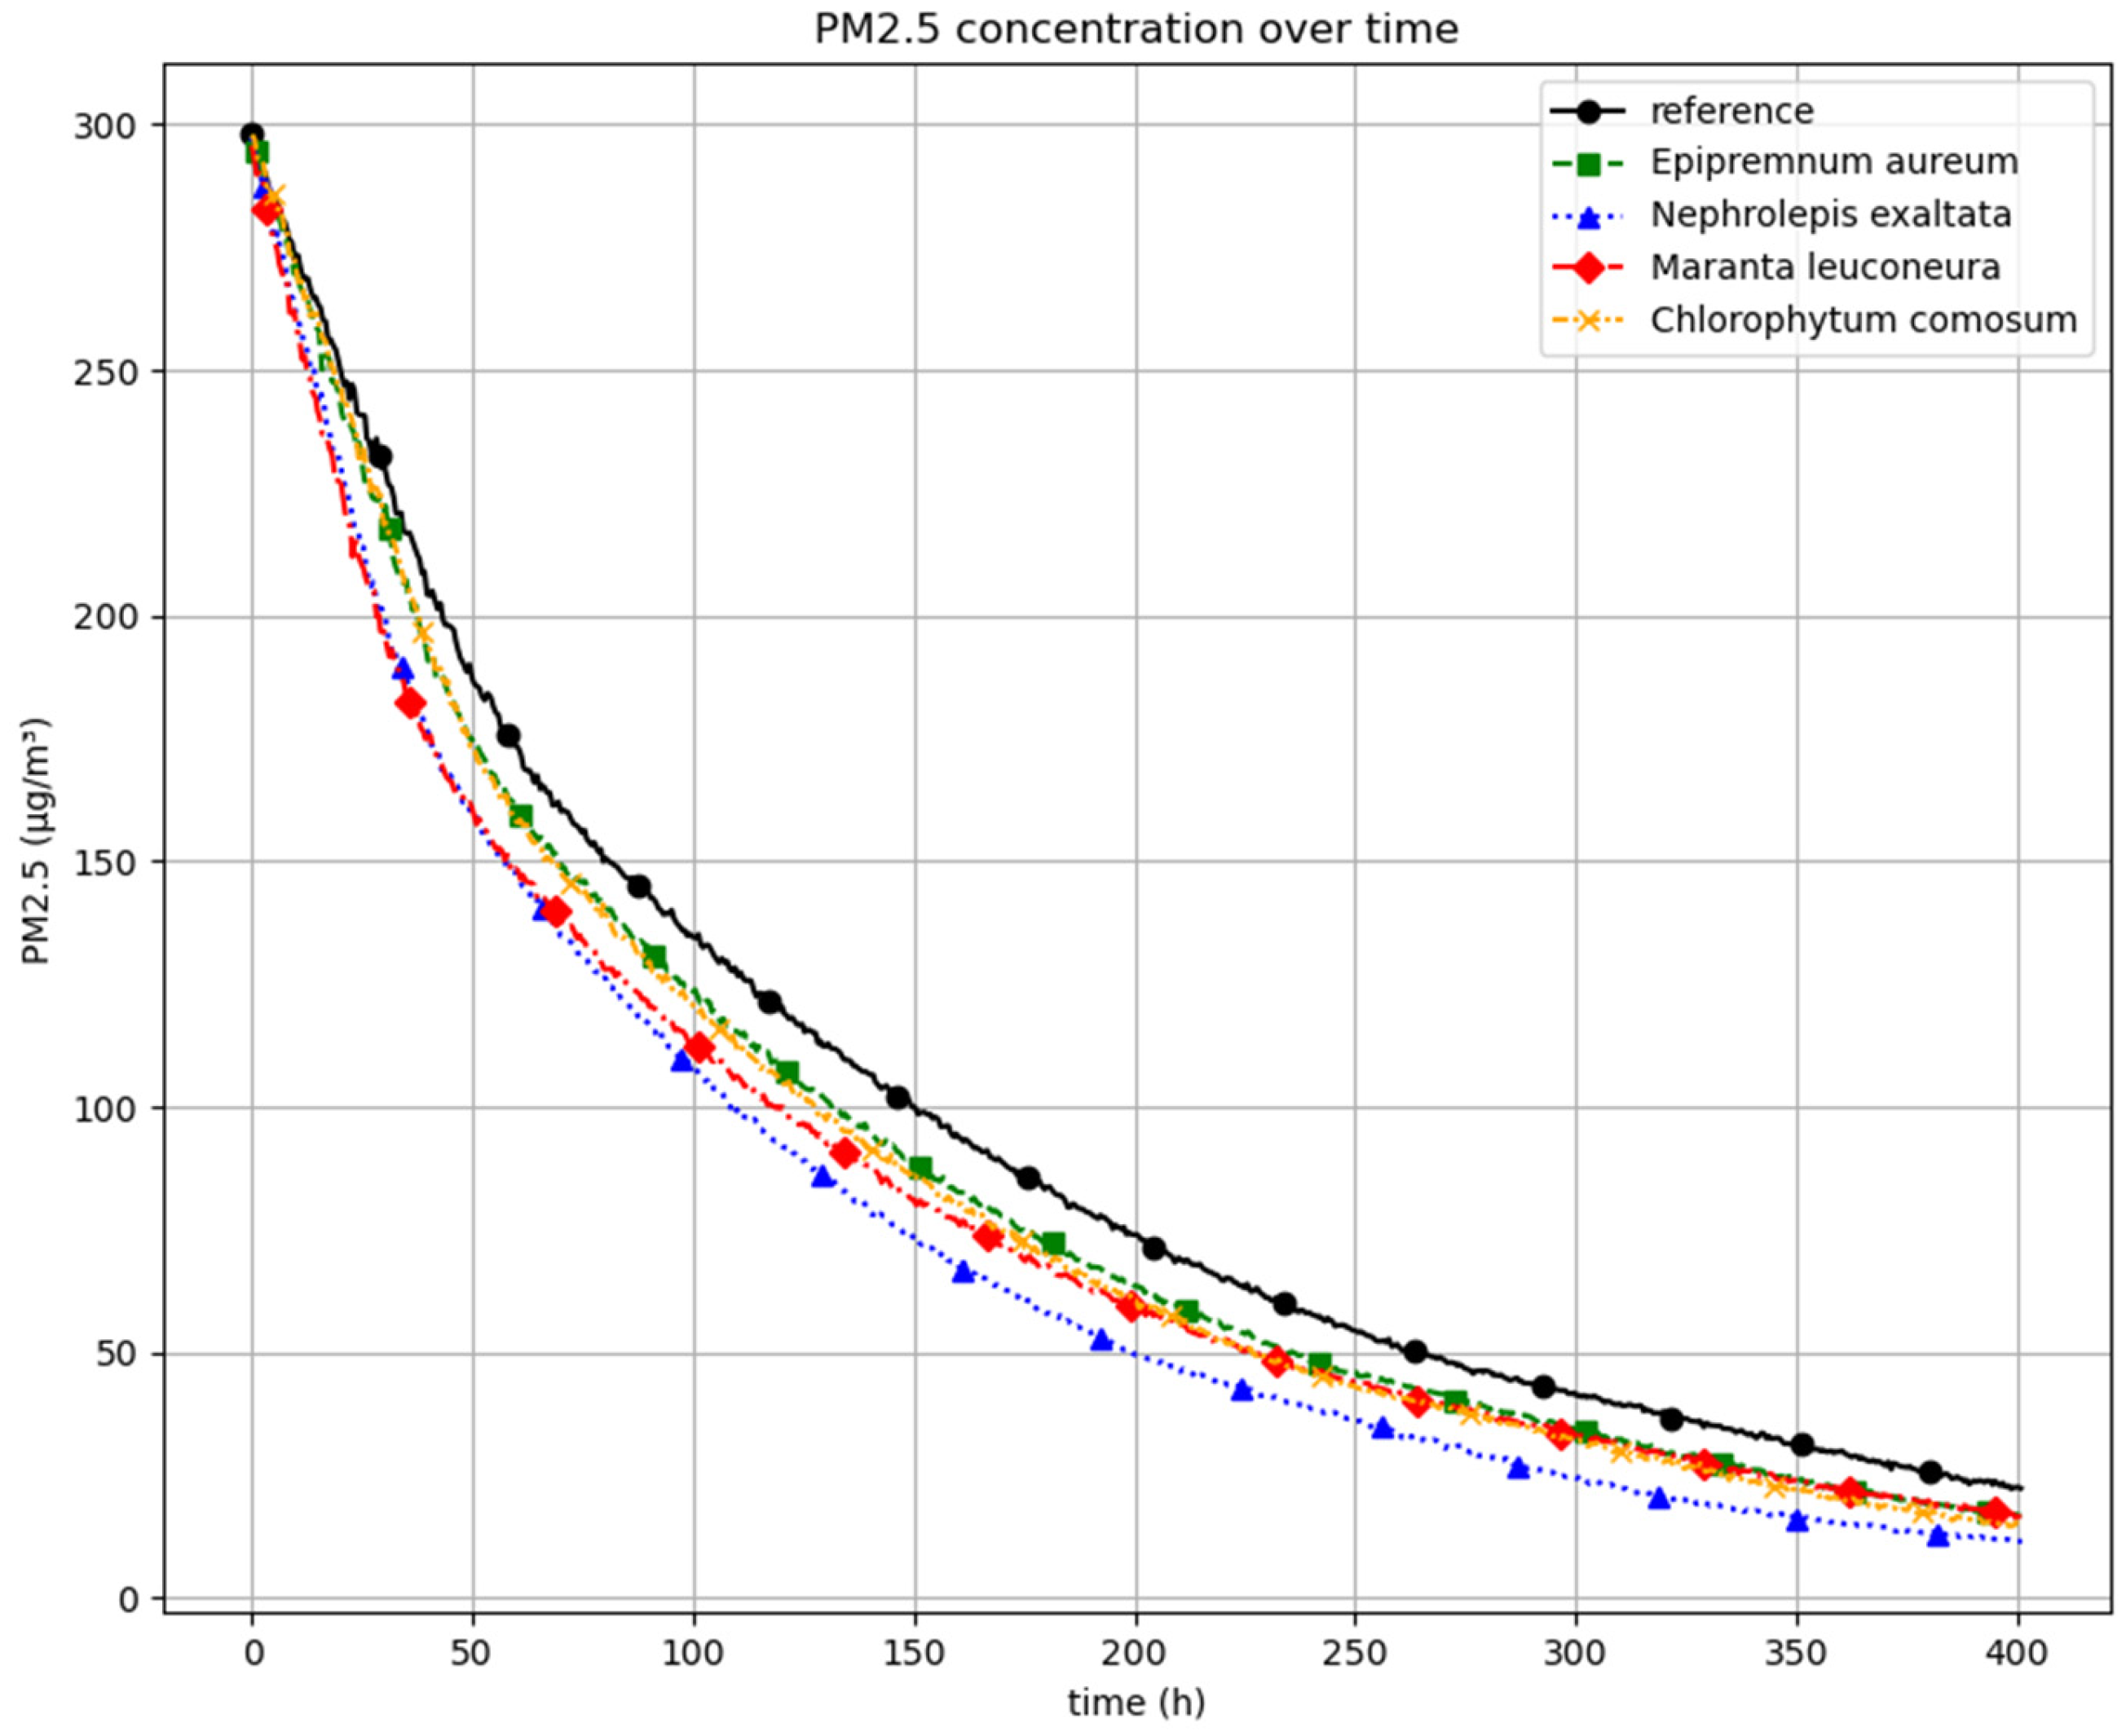
Figure 5 illustrates the results of the experimental series investigating the reduction in PM as a function of plant species. The graph depicts PM concentrations over time. Initial concentrations ranged between 320 and 350 μg/m
3. To enable a direct comparison of the reduction dynamics, all curves were shifted to a common starting point of 300 μg/m
3. The included reference curve represents the decrease in PM concentration in the absence of plants, influenced by deposition on interior surfaces, structural elements, and potential leakages. The differing slopes of the concentration curves suggest that higher PM levels generally lead to more rapid particle deposition. During the observed exponential decline in PM concentrations, the curves corresponding to the plant treatments exhibit a steeper reduction compared to the reference, indicating an enhanced removal effect attributable to the presence of the plants. A distinct deviation from the reference becomes apparent within the first few minutes. Among the tested species,
Nephrolepis exaltata demonstrated the highest efficiency in reducing PM concentrations.
Maranta leuconeura showed a comparable performance during the initial phase (up to approximately 60 min), after which its reduction efficiency appeared to decline.
Epipremnum aureum and
Chlorophytum comosum exhibited nearly identical reduction profiles throughout the duration of the experiment. In summary, all investigated plant species contributed to an accelerated decrease in airborne PM concentrations compared to the control condition, highlighting their potential for passive indoor air purification.
To enhance clarity and facilitate a structured presentation,
Table 4 illustrates the concentrations of PM including standard deviation after one, two, and four hours. A difference in PM concentrations between trials conducted with and without plants was observed, which can be attributed to the presence of the plants. The PM concentration values represent the mean of five experimental replicates at each time point. The most pronounced reduction was observed with
Nephrolepis exaltata, where concentrations decreased from an initial 300 μg/m
3 to 38.36 μg/m
3 after four hours.
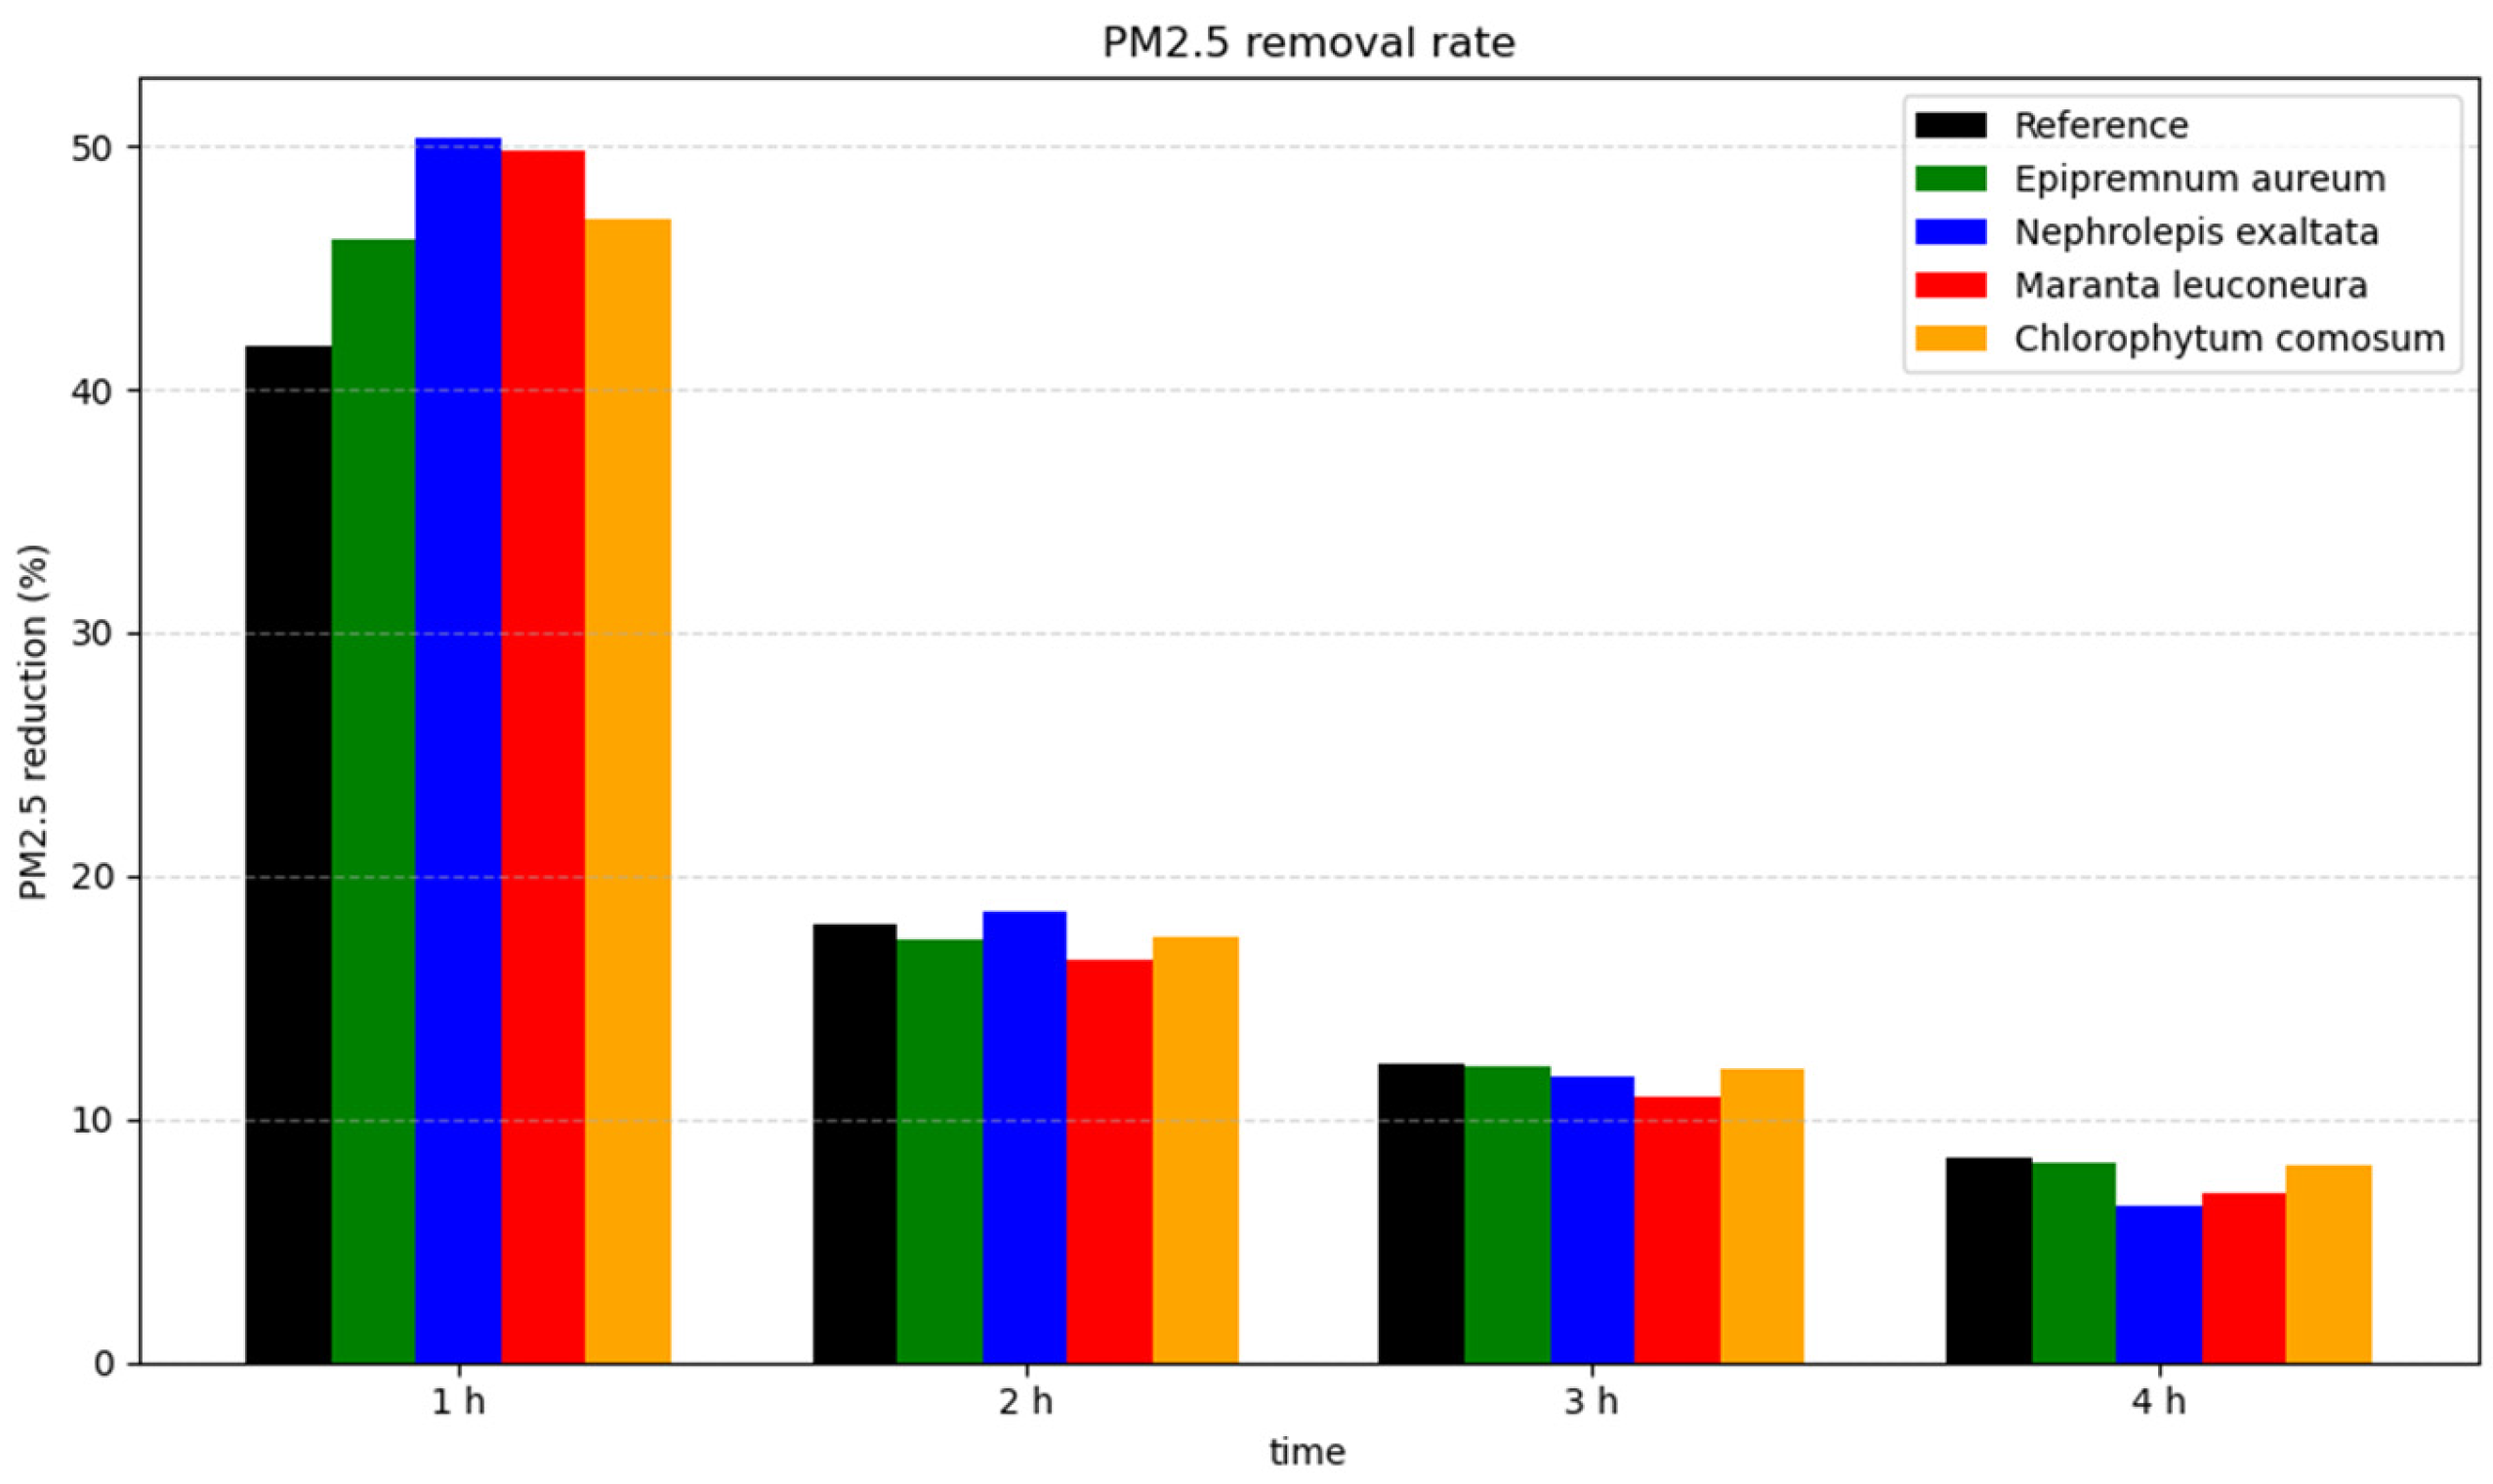
Figure 6 illustrates the time-resolved PM reduction rates after one, two, three and four hours. It is evident that the highest reduction rates occur during the first hour, when the initial particle concentrations are at their peak. After one hour, the reduction rate for
Nephrolepis exaltata reached 50.28%, whereas the reference showed a reduction rate of 41.81%. After the first hour, the reduction rates for
Maranta leuconeura,
Chlorophytum comosum, and
Epipremnum aureum were 49.77%, 46.95%, and 46.12%, respectively.
After the first hour, the reduction rates declined rapidly. This trend is also visible in
Figure 5. After two hours,
Nephrolepis exaltata continued to exhibit the highest reduction rate, while the reference condition showed the second-highest rate. Since the rate of reduction appears to be directly proportional to the particulate concentration, this explains why the reference, despite initially showing a slower reduction, achieved a comparatively faster reduction rate later on.
After four hours at relatively low PM concentrations, the reduction rates for all plants, as well as for the reference, were quite similar and ranged between 6.41% and 8.40%.
4. Discussion
With regard to the observed PM2.5 reduction resulting from the presence of the investigated plant species, Nephrolepis exaltata showed to be the most efficient, followed by Maranta leuconeura. Epipremnum aureum and Chlorophytum comosum showed very similar reduction efficiencies.
In previous studies,
Epipremnum aureum has been classified with varying levels of effectiveness. For instance, Jeong et al. (2020) [
41] describes its performance as moderate, whereas Cao et al. (2019) [
39] classify it as highly effective and specifically suitable for PM reduction.
Chlorophytum comosum has also been characterized as highly effective in certain studies [
74]. In the present study,
Chlorophytum comosum showed similar reductions rates as
Epipremnum aureum.
Nephrolepis exaltata possesses a total leaf area of approximately 0.67 m
2, which is roughly twice as big as that of the other species. However, the impact of leaf area on PM reduction is not solely determined by its absolute number. While a bigger total leaf area can be beneficial, it is only effective if the leaves do not cover each other [
41].
A comparison with other studies is more challenging in the case of
Nephrolepis exaltata, as there is relatively limited data available for this species [
33]. While it demonstrated relatively low PM retention on leaf surfaces in sedimentation-based experiments—indicating limited efficiency compared to other species—it exhibited the highest reduction rate in the present experimental setup. It should be noted that
Nephrolepis exaltata had the biggest total leaf area among the tested species, with 0.67 m
2 for both plants combined. However, the high PM reduction observed may also be attributed to the plant’s specific morphology. Due to its fine, evenly distributed leaves and overall porous structure,
Nephrolepis exaltata appears highly permeable to airflow, even though the plant occupies a similar volume as the other species. The large number of small, uniformly distributed leaves reduces the mean free path of airborne particles moving through the plant canopy. As a result, the probability of particle–leaf surface contact increases, enhancing the likelihood of deposition through impaction mechanisms.
Owing to the absence of available literature on the PM
2.5 reduction capacity of
Maranta leuconeura, the present study reports these findings for the first time. During the first hour of the experiment,
Maranta leuconeura exhibited the same efficiency as
Nephrolepis exaltata. However, after the initial hour, the reduction rate decreased, eventually aligning with that of
Epipremnum aureum and
Chlorophytum comosum. Thus, the PM reduction capacity of
Maranta leuconeura can be positioned between
Nephrolepis exaltata and
Epipremnum aureum or
Chlorophytum comosum. Interestingly, the PM reduction performance of
Maranta leuconeura appears to depend differently on the prevailing PM concentration compared to the other tested species: it shows relatively high efficiency under elevated PM levels, whereas its performance decreases at lower concentrations. Surface structure also plays an important role in the performance of
Maranta leuconeura, as illustrated in
Figure 1. Visible PM particles are deposited within the grooves located between the spherical epidermal cells of the plant. The surface texture, characterized by these hemispherical cells, may thus contribute positively to its particle retention capacity.
The observed PM
2.5 concentrations in this experimental series exhibit an exponential decay pattern. The rate of reduction is greater at higher particle concentrations and progressively decreases as the concentration declines. Comparable exponential trends have been documented in similar studies [
35,
41], both conducted in sealed test chambers—one with and one without integrated ventilation—focusing on reduction in PM
2.5 and PM
0.25–0.5, respectively.
Other investigations employing similar experimental designs [
39,
40] reported a linear relationship between PM
2.5 concentration and time. These discrepancies may be attributed to variations in air circulation intensity, the type of particulate matter utilized, plant size, or specific characteristics of the artificial test chambers.
Compared to similar studies, a notable difference was observed in the relative humidity levels maintained within the chamber during the experiments. None of the referenced studies implemented any measures to control or reduce humidity. However, relative humidity has been shown to significantly influence the behavior of fine particulate matter [
47,
48]. Therefore, it is recommended that future studies incorporate appropriate humidity control strategies—or, at the very least, account for humidity effects in data interpretation. The use of calcium chloride as a desiccant proved to be a practical and effective method for humidity regulation. Since aerosols tend to grow with increasing humidity and the reduction rate increases accordingly [
47,
48], it is conceivable that previous studies which did not implement humidity-reducing measures may have overestimated the reduction potential or reduction rate.
In the study by Cao et al. (2019) [
39], the initial PM
2.5 concentration was approximately 300 μg/m
3, and the chamber size was comparable to that of the present study. However, air circulation within the chamber was actively maintained by an internal fan. The PM
2.5 concentrations—generated using cigarette smoke—measured for
Epipremnum aureum were approximately 220 μg/m
3 after one hour and around 170 μg/m
3 after two hours. In the present study, PM
2.5 concentrations for the same plant species were 161.05 μg/m
3 after one hour and 107.87 μg/m
3 after two hours. Although the absolute concentration levels differ between the two experiments, both show a similar reduction of approximately 50 μg/m
3 between hour one and hour two. The observed difference in the initial rate of PM
2.5 reduction is likely attributable to the continuous, circulating air movement facilitated by the integrated fan in the recirculating air system.
In the study by Cao et al. (2019) [
39],
Epipremnum aureum exhibited reduction rates of approximately 26%, 17%, and 15% after 1, 2, and 3 h, respectively. For
Chlorophytum comosum, the corresponding values were approximately 26%, 21%, and 10%.
Cumulatively, the total reduction after 3 h amounted to approximately 56% for Epipremnum aureum and 57% for Chlorophytum comosum. In comparison, the reduction rates observed in the present study for Epipremnum aureum were approximately 46.12%, 17.36%, and 12.12% after 1, 2, and 3 h, respectively. For Chlorophytum comosum, the corresponding values were 46.95%, 17.51%, and 12.04%.
Cumulatively, this results in total reductions of 75.60% for Epipremnum aureum and 76.50% for Chlorophytum comosum after 3 h.
The present study demonstrates a significantly higher reduction rate. A notable difference when comparing the results lies in the reduction dynamics and the mathematical description of the concentration curves. While the concentration curves presented by Cao et al. (2019) [
39] exhibit a negative linear trend, the concentration curve observed in the current study clearly follows a negative exponential trend over the observation period. Although a comparable methodological approach was chosen, methodological differences led to markedly divergent results—despite the fact that both studies addressed the same research question concerning the efficiency of PM
2.5 reduction.
Differences in total leaf area would, of course, influence the results—primarily affecting the rate of reduction—but would not be expected to fundamentally change the shape of the curve, which should still exhibit a similar pattern (e.g., a negative exponential trend). It is unlikely that the difference in the type of PM used is responsible for the observed discrepancy. The most plausible explanation lies in the differing methodologies regarding air movement. Cao et al. (2019) [
39] used a fan (with no specified rotation speed) in their experimental setup. This would result in differences in air circulation and air velocity, which have been identified as relevant factors influencing particle deposition and uptake. Humidity levels also differed between the two studies. While the relative humidity reported by Cao et al. remained between 75% and 80% after 3 h for both plant species, the relative humidity in the present study was significantly lower at the same time point.
5. Conclusions
The experimental chamber proved to be practical and effective as expected. It allowed for easy cleaning, precise adjustment of airflow velocity, and sufficiently accurate injection and control of the initial particulate matter concentrations. The reliable performance and high measurement accuracy of the setup are reflected in the low variability of the mean values, as indicated by the small standard deviations presented in
Table 3 and
Table 4.
As previously mentioned, the chosen experimental approach differs from other test setups and offers certain advantages. Nevertheless, it is essential that researchers in the future agree on a unified approach or adopt a standardized testing methodology. For instance, further consideration is needed regarding how to more accurately characterize the leaf surface beyond its absolute area. It would be advantageous to define an active leaf area—that is, the portion of the foliage that is actually and effectively involved in the reduction in pollutant concentrations. In this context, not only the active leaf area but also the plant’s overall habitus should be taken into account.
By implementing standardized testing, it would enable or simplify the comparison of the obtained results across different studies. Certain critical parameters should always be reported—regardless of the experimental design—yet are sometimes omitted. Likewise, agreement on a standardized measurement method would be beneficial. Current variations in methodology, including the inconsistent use of measurement units, hinder comparability and limit the broader applicability of results. There is, however, general consensus that further research is necessary. In addition to investigating particulate matter retention, future studies should also address resuspension processes—that is, the re-aerosolization of previously deposited particles.
The four different plant species were successfully compared with regard to their PM reduction effectiveness using the developed test chamber. Key influencing parameters such as humidity and air velocity were precisely controlled. The chamber, equipped with adjustable fans, could also be used in future experiments to investigate the effects of varying air velocities—such as their influence on resuspension—by implementing appropriate programming.
In a follow-up study, it would be interesting and fundamentally important to investigate how the tested plants, with their previously determined reduction rates, perform under real-life conditions. Given the influence of various parameters—such as air movement, leaf area-to-room volume ratio, particulate matter concentration, and other environmental factors—it is conceivable that PM reduction rates may be lower in a real-world setting compared to controlled laboratory conditions.
This study aimed to investigate the PM reduction potential of different plant species. Research with a focus on indoor air quality and its improvement is fundamentally important and highly relevant. The findings of this study can be explicitly used to inform and optimize indoor plant selection and planning. Moreover, the results provide a valuable foundation for further research. For instance, the design of test chambers can be improved to enhance the quality of future studies. In addition, the data generated may serve as a basis for investigations conducted under real-life environmental conditions.
Significant differences in PM2.5 reduction rates were observed and agree with expected results or comparable results from other studies. Although Nephrolepis exaltata showed the highest efficiency in PM2.5 reduction and thus stands out as a promising candidate for indoor greening, the authors recommend the use of a diverse mix of plant species—both indoors and outdoors. This approach not only enhances biodiversity but also increases ecological resilience.


