Abstract
Regional increases in atmospheric O3 are phytotoxic not only to major crops but also to root vegetables such as radish, and their effects can be further modulated by nitrogen (N) addition. To assess how cherry radish responds to elevated O3 (eO3) under N addition and to compare the dose–response relationships, we established six open-top chambers with two O3 levels and two N treatments in Beijing, China, to examine gas exchange, growth, and biomass throughout the growing period. The results showed that: 1. eO3 had a “priming effect” on photosynthesis rates (Pn) at the beginning of the experiment. N addition alleviated the O3-induced Pn reduction at the end of the experiment by 6.76% but did not significantly influence the O3-dose response to Pn; 2. stomatal conductance (gs) did not have a dose response to all treatments while evaporation rates (E) showed strong negative regression with AOT40; 3. N addition reduced the hypocotyl biomass (−47.70%), leaf biomass (−32.22%), and the whole plant biomass reduction caused by O3 (−38.47%) at the end of the experiment, but N addition did not significantly influence O3-dose response to biomass. In conclusion, N addition can alleviate O3-induced reductions in Pn and biomass via non-stomatal mechanisms, but it is ineffective in altering long-term O3 dose–response relationships. Soil N addition offers a short-term strategy to mitigate O3 impacts on short-lived root vegetables such as cherry radish but does not influence key functional traits over the long term. This study highlights the potential of N addition to alleviate acute oxidative stress, while underscoring its limitations in mitigating the effects of prolonged O3 exposure in root vegetables.
1. Introduction
Tropospheric ozone (O3) is a major phototoxic air pollutant that poses significant threats to crop production and food quality security [1]. Elevated O3 (eO3) generally induces oxidative stress in plants, leading to reduced photosynthetic efficiency, cellular damage, and overall declines in growth and yield [2,3]. Globally, O3 exposure has increased at 89% of monitoring stations (+0.8% per year), with summertime O3 concentrations rising in 74% of cities worldwide [4]. In China, O3 levels are still high in major urban areas due to persistent emissions of its primary precursors, volatile organic compounds and nitrogen oxides, which are recognized as the main summertime air pollutants [5]. Elevated O3 poses a serious risk to food security by accelerating crop senescence, inhibiting photosynthesis, and reducing biomass accumulation and carbon allocation to roots, ultimately causing yield losses [6]. For example, Zhao et al. (2020) [7] estimated that surface O3 exposure across China during 2015–2018 led to annual production losses of 65–124 million metric tons of key crops, equating to economic damages of 24–45 billion US dollars. However, most O3 impact studies have focused on staple crops such as soybean [8], wheat, rice [9,10], and leafy vegetables [11,12], with relatively few investigations on root vegetables [13,14].
Simultaneously, high levels of nitrogen (N) deposition, both wet and dry, are increasingly observed across various terrestrial ecosystems worldwide, including in China [15]. N addition can partially mitigate O3-induced damage by enhancing photosynthetic capacity, improving chlorophyll content and stomatal conductance, and promoting leaf and overall biomass growth. When N fertilizers applied in crop fields coincide with high atmospheric N deposition and O3 pollution, N addition may improve plant tolerance to O3 stress [16] by increasing nutrient availability, stimulating growth, and enhancing photosynthetic efficiency. This can help compensate for O3-induced declines in photosynthesis by supporting carbon assimilation and cellular repair mechanisms [17,18]. Indeed, N addition increases the availability of essential nutrients that promote gas exchange, growth, and biomass accumulation, thereby counteracting some of the harmful effects of O3 [3]. However, N addition can also be detrimental to plants independently of N load [19] and is not universally effective against O3 stress. For instance, N supply has failed to mitigate O3 damage in certain tree species such as poplars [20] and beech [21], and in some cases, soil N supply even exacerbated O3-induced reductions in photosynthetic traits, such as in soybean [3]. Thus, studies on major crops and trees have reported mixed outcomes from combined eO3 and N addition treatments, including compensatory effects [17], no interactions [20,21], and adverse responses [3].
The effects of eO3 on crop growth and yield are typically assessed by cumulative exposure above a threshold concentration over time. The AOT40 index (accumulated exposure over a threshold of 40 ppb O3) is widely used in Europe for such assessments [22]. Nitrogen addition may alleviate eO3-induced reductions in net photosynthesis (Pn) through mechanisms including modification of stomatal conductance (gs). Enhanced gs observed under N addition can facilitate increased CO2 uptake to partially offset photosynthetic decline, although this response is complex, species-specific, and influenced by environmental conditions. Elevated O3 usually reduces root biomass allocation in some plants [2,23], but how N addition interacts with eO3 to influence growth and biomass dose–response in root vegetables remains poorly understood.
Cherry radish is a widely consumed vegetable, valued for its refreshing taste and nutritional benefits. In China, radish cultivation covers approximately 1.2 million hectares, with annual production exceeding 40 million tonnes [24]. Some cherry radish cultivars have been reported as sensitive to eO3 [13]. However, it remains unclear whether N addition can influence cherry radish yield under eO3 exposure and how stomatal conductance responds to combined O3 and N treatments throughout the growing season.
In this study, we grew a native cherry radish variety (Raphanus sativus L. var. radculus pers. “Red Star”) in Changping, Beijing, China. By quantifying the relationships between gas exchange, growth, yield, and AOT40, we aimed to clarify how N addition modulates O3 dose effects on photosynthesis, biomass allocation, and yield. This research provides insights into the resilience mechanisms of root vegetables under multifactorial atmospheric stressors. Our hypotheses are: (1) N addition will modify O3-induced leaf photosynthesis decline by increasing stomata conductance. (2) The combined effects of eO3 and N addition on cherry radish biomass allocation and yield depend on organ-specific sensitivity, particularly reducing more underground biomass allocation under eO3 but potentially alleviated by N addition. (3) The O3 dose-response relationship (quantified by AOT40) for cherry radish yield is modulated by N addition, potentially shifting the threshold or slope of O3-induced yield decline. Understanding the combined impacts of elevated O3 and N addition on photosynthesis and biomass allocation is essential to unravel plant responses under simultaneous environmental stresses. The findings from this study can contribute valuable data to refine O3 dose–response coefficients and improve regional air pollution impact modeling using the AOT40 index.
2. Materials and Methods
2.1. Experimental Site and Plant Material
The experimental site was in the Changping district, a suburb of Beijing, China (40°12′ N, 116°80′ E). Beijing has a typical temperate and monsoonal climate with four distinct seasons. The annual mean precipitation of the experimental site was 550.3 mm, and the mean air temperature was 11.8 °C [23]. The soil in the experimental site is generally characterized as moist with moderate fertility and therefore provided the required conditions to promote the growth of radishes. A local autumn cherish radish (Raphanus sativus L. var.radculus pers “Red Star”) variety was selected, and the uniform 216 seeds were planted evenly into 36 pots on 5 September carefully. This radish variety has a growing period of 30–45 days, is characterized by highly productive, drought-resistant, and low-temperature resistance, and is relatively common in autumn plantings in Beijing. The seedlings per pot were thinned to 4 and then moved to the ambient chambers to be accustomed to the environment until 15 September (around 7 days after germination). All pots were watered as needed.
2.2. Experimental Design and Samplings
Due to the increasing O3 concentrations in Beijing [5] and the regional N addition situation [25], two O3 treatments (ambient air and ambient air + 70 ppb O3) and two N addition treatments (ambient air and ambient air +100 kg N ha−1 yr−1) were designed: Ambient air (AA), ambient air +70 ppb O3 (AAO), AA + 100 kg N ha−1 yr−1, and AAO + 100 kg N ha−1 yr−1. The amount of 100 kg N ha−1 year−1 (around 0.03 g N m−2 d−1) is based on regional agricultural practices for leafy vegetables and short-cycle crops including atmospheric N addition. This rate falls within the commonly applied range (typically 80–150 kg N ha−1 yr−1) used by local farmers aiming to achieve optimal yield under intensive production systems. The two O3 concentrations were randomly assigned to 6 open-top chambers (OTCs) with three chambers as replications. N addition treatment was achieved by applying N fertilizer (NH4NO3). N fertilizer was dissolved in water after conversion and applied once per day to each pot with N addition treatment, and the control was applied with an equal amount of fresh water. O3 exposure started on 15th September and ended on 10th October. O3 was applied through fumigation from 8:30 to 17:30 (9 h) each day. The average ambient air (AA) O3 concentration in the experimental sites was 36.1 ppb, ranging from 22.4 ppb to 62.8 ppb throughout the day during the experimental periods. The average O3 concentration of AA + 70 was 119.7 ppb, indicating that the O3 control could meet the target requirements. The pots with the same treatments were interchanged to different positions in each chamber or different chambers with the same treatments every other day.
2.3. Open-Top Chambers (OTCs)
The OTCs were made of an aluminum alloy frame covered with transparent plastic film with a 10 mm thickness (90% transparency). More details of OTC design, operation, O3 concentration control, and distribution control have been described before [23]. O3 concentrations were evenly distributed, both vertically and horizontally, within the OTCs. The Model 49i O3 analyzer (Thermo Scientific, Waltham, MA, USA) was calibrated every month with a Model 49i-PS O3 analyzer (Thermo Scientific, MA, USA).
2.4. Measurements
Six fully expanded upper green leaves from three pots of each treatment were selected for leaf gas exchange. Leaf gas exchange was measured using a portable Li-Cor 6400 photosynthesis system with a standard leaf chamber (Li-Cor Inc., Lincoln, NE, USA). All gas exchange measurements were conducted on sunny days from 9:00–11:00 am.
Leaf number was counted every 7 days after O3 fumigation started. Plants (separated as aboveground-hypocotyl and underground-leaf) were harvested every 7 days during the experiment to determine biomass by drying up at 70 °C to a constant weight. From each plant, 24 leaf discs were also dried for 48 h at 70 °C to constant weight, and then LMA was calculated as dry mass per area.
The cumulative O3 exposure was described as AOT40 [22], which was calculated by accumulated hourly mean O3 concentrations over 40 ppb during the O3 fumigation period.
2.5. Statistical Analyses
The effects of O3 on all parameters were examined by two-way ANOVA. Post-hoc comparisons were conducted using the Duncan test. Prior to analysis, all data were checked for normality (Kolmogorov–Smirnov test) and homogeneity of variance (Levene’s test). If the data were not normally distributed and/or their variance was not homogeneous, non-parametric tests were used. Results were considered significant when p ≤ 0.05. The linear correlations between parameters and exposure dose AOT40 were further analyzed, and the differences in linear relationships were compared in regression coefficients (i.e., the strength of response to AOT40) between treatments. If the 95% confidence intervals of the regression coefficients differ between treatments, it can be assumed that there are differences in response to O3 exposure. All analyses were performed using the SPSS statistics software (Version 17.0, SPSS Inc., Chicago, IL, USA).
3. Results
3.1. Gas Exchange
The results indicated that elevated O3 (eO3) treatment increased the leaf net photosynthetic rate (Pn) by 6.85% on day 7 and decreased it by 17.23% and 41.85% on days 14 and 21, respectively, as compared to the control AA. N addition significantly increased leaf Pn from day 14 onwards, contributing to 15.14% and 10.18% of the Pn on days 14 and 21, respectively. A significant interaction between eO3 and N addition on Pn was found on day 21, and the interaction showed that N addition alleviated the O3-induced Pn reduction (−6.76%) (Figure 1). eO3 significantly reduced leaf stomatal conductance (gs) only on day 14, with a 7.10% reduction in leaf gs compared to the control AA (Figure 1).
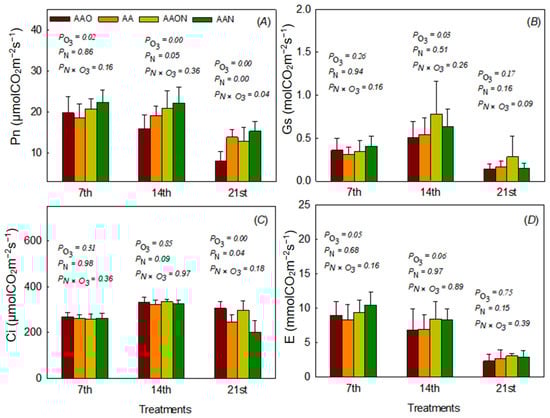
Figure 1.
The effects of elevated O3 and N addition on net photosynthesis rates (Pn, (A)), stomatal conductance (gs, (B)), intercellular CO2 concentration (Ci, (C)), and evaporation rates (E, (D)) of Raphanus sativus L. during the growing period. The bars represent Mean ± SD; the differences were considered significant when p < 0.05. PO3 means elevated O3 effects; PN means N addition effects; PN×O3 means the interaction between eO3 and N addition treatments.
Intercellular carbon dioxide concentration (Ci) responded to eO3 and N addition on day 21 at the end of the growth period, which showed that eO3 increased Ci (+24.24%) while N addition decreased Ci values (−17.70%) (Figure 1). E was only affected by eO3 on day 7 at the beginning of the experiment, which showed a 7.52% increase (Figure 1). The relative changes of Pn, Gs, Ci, and E to AA treatments can also be seen in Supplementary Materials.
3.2. Leaf Number and Leaf Mass per Area (LMA)
Leaf number was significantly reduced by eO3 treatments. The leaf number decreased by 7.85%, 25%, and 28.68% on days 7, 14, and 21, respectively, as compared to control AA. On the contrary, N addition significantly increased leaf number at the end of the growing period (day 21) by 19.38% as compared to control AA. No significant interaction effect on leaf number was found between eO3 and N addition treatments (Figure 2).
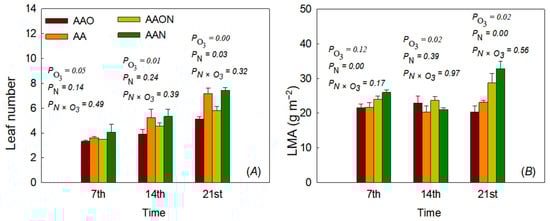
Figure 2.
The effects of elevated O3 and N addition on leaf number (A) and leaf mass per area (LMA) (B) of Raphanus sativus L. during the growing period. The bars represent Mean ± SD; the differences were considered significant when p < 0.05. PO3 means elevated O3 effects; PN means N addition effects; PN×O3 means the interaction between eO3 and N addition treatments.
Leaf LMA was significantly affected by eO3 on days 14 and 21, but the effects were different. On day 14, eO3 increased leaf LMA by 12.68%, while on day 21, eO3 decreased leaf LMA by 11.90%. However, N addition significantly increased leaf LMA compared to control on both days 7 and 14, increasing LMA by 20.02% on day 7 and 3.63% on day 14 as compared to the control AA. No significant interaction effect on LMA was found between eO3 and N addition treatments (Figure 2).
3.3. Biomass
The results showed that eO3 treatment significantly reduced the hypocotyl biomass from the 7th to the 21st day, and eO3 significantly decreased hypocotyl by 39.48%, 57.79%, and 49.19% in the 7th, 14th and 21st day, respectively. N addition did influence the 7th and the 21st hypocotyl biomass by 60.66 and 27.3%, respectively. eO3 and N addition showed interactions on the 7th and 21st day, which showed that N addition modified O3-induced hypocotyl biomass reduction (−35.92% and −47.70%).
eO3 significantly reduced the leaf biomass by 14.07%, 22.99%, and 45.98% from days 7, 14 to 21 as compared to control AA, respectively. On the other hand, N addition significantly increased the leaf biomass on days 14 to 21 by 54.33% and 52.04%, respectively, as compared to control AA. eO3 and N addition showed interactions on the 21st day (−32.22%), which showed that N addition modified O3-induced leaf biomass reduction.
For the whole biomass, the results showed that O3 significantly reduced the biomass from days 7th, 14 to 21 by 32.56%, 39.8 and 47.27%. N addition did affect the whole biomass on the 7th and 21st day, by 64.62 and 42.06%. On the 21st day, the interaction showed N addition modified the O3-induced whole biomass reduction by −38.47% (Figure 3).
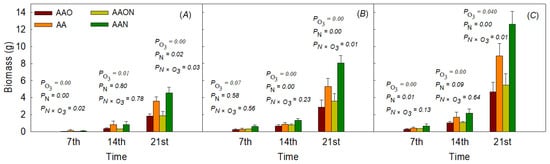
Figure 3.
The effects of elevated O3 and N addition on hypocotyl biomass (A), leaf biomass (B), and whole plant biomass (C) of Raphanus sativus L. during the growing period. The bars represent Mean ± SD; the differences were considered significant when p < 0.05. PO3 means elevated O3 effects; PN means N addition effects; PN×O3 means the interaction between eO3 and N addition treatments.
3.4. Dose–Response Relationships
3.4.1. Gas Exchange and AOT40 Value
The results indicated a significant negative linear regression relationship between Pn and AOT40 of AAON and AAO treatments during the growing period. The regression equations of AAO treatments and AAON treatments were YAAO = −0.518X + 23.879 (p < 0.05, R2 = 0.736) and YAAON = −0.451X + 25.952 (p < 0.05, R2 = 0.619), respectively (Figure 4).
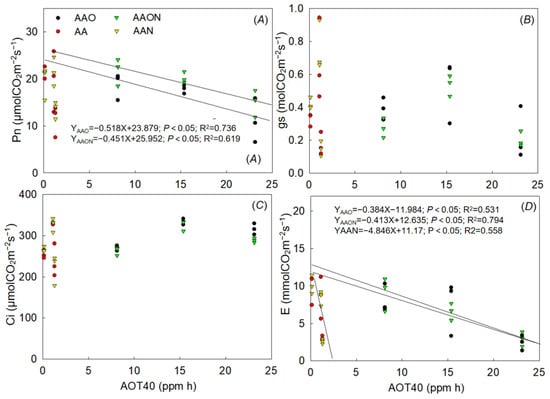
Figure 4.
The dose–response relationships between AOT40 value and Pn (A), gs (B), Ci (C), and E (D) of all treatments during the growing period of Raphanus sativus L. The black line means a significant linear regression relationship, where p < 0.05.
Additionally, E under AAO, AAON, and AAN treatments all showed significant linear regression with AOT40 as YAAO = −0.384X − 11.984 (p < 0.05, R2 = 0.531), YAAON = −0.413X + 12.635 (p < 0.05, R2 = 0.794), and YAAN = −4.846X + 11.17 (p < 0.05, R2 = 0.558). Gas and Ci were not linearly correlated with AOT40 in this experiment (Figure 4).
By analyzing and comparing effect differences with the linear regression coefficient and confidence intervals of the linear regression between AOT40 and leaf Pn, AOT40 and E during the experiment, we found that there was no difference between the linear effects of AAON and AAO treatments on the cumulative effects of Pn and AOT40 over time. It means that N addition did not change the negative linear effect relationship between AOT40 and Pn (Figure 5).
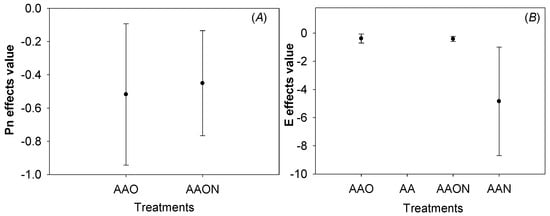
Figure 5.
The significance comparison of O3 dose–response effect value of Pn (A) and E (B) under different treatments of Raphanus sativus L. The effects values are represented as linear regression coefficient ± confidence interval. The colorful pot of the figure represents the linear regression coefficient, and the error bar means confidence interval. The effects of the two treatments were considered different when the pot and error bars did not overlap with each other.
In addition, E was not significantly different from the linear effect of AOT40 between AAO and AAON, but there was no overlap between AAN and AAO, AAN and AAON, suggesting that there was a significant difference between the linear O3 dose (AOT40) response effects of AAO and AAN, AAON and AAN, respectively (Figure 5).
3.4.2. Leaf Number and LMA
During the overall 21 days of the growing period (including nutritional and reproductive growth), the results showed that there was a significant linear regression between the number of leaves and AOT40 of all four treatments, with the regression equation being: YAAO = 0.119X + 2.263 (p < 0.05, R2 = 0.95); YAA = 2.568X − 3.160 (p < 0.05, R2 = 0.76); YAANO = 0.152X + 2.251 (p = 0.05, R2 = 0.952); and YAAN = 2.361X + 3.611 (p < 0.05, R2 = 0.686). However, LMA and AOT40 only showed one significant linear regression under AAON, with the regression equation being: YAAON = 0.313X + 20.597 (p < 0.05, R2 = 0.51) (Figure 6).
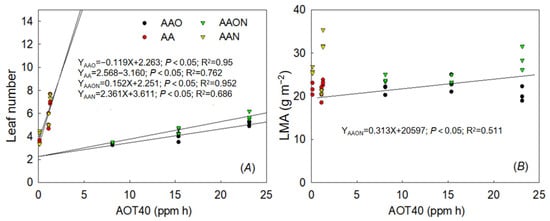
Figure 6.
The dose–response relationships between AOT40 value and leaf number (A) and LMA (B) of all treatments during the growing period of Raphanus sativus L. The black line means a significant linear regression relationship when p < 0.05.
Analyzing and comparing effect differences with the linear regression coefficient and 95% confidence intervals of the existing linear regression between AOT40 and leaf number during the experiment revealed no statistically significant difference between the AAO and AAON, AA and AAN treatments regarding the linear effects of leaf number and AOT40. However, a significant difference was observed between the AAON and AA, as well as the AAO and AA treatments, respectively. Similarly, a significant difference was also observed between the AAN and AAO, as well as the AA, AAN and AAON treatments, respectively (Figure 7).
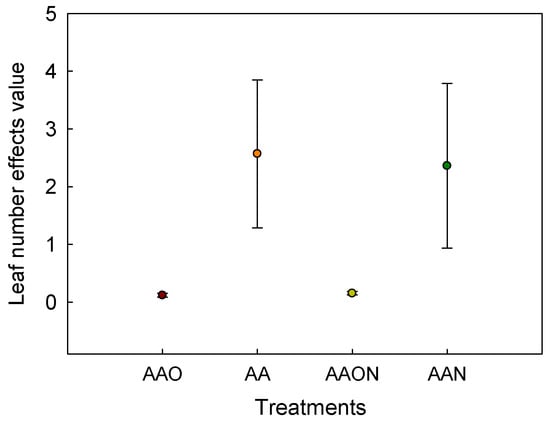
Figure 7.
The significance comparison of O3 dose–response effect value of leaf number under different treatments of Raphanus sativus L. The effects values are represented as linear regression coefficient±confidence interval. The colorful pot of the figure represents the linear regression coefficient, and the error bar means confidence interval. The effects of the two treatments were considered different when the pot and error bars did not overlap with each other.
The results showed linear regressions between hypocotyl, leaf, and whole plant biomass and AOT40 during the growing periods (Figure 8). Leaf biomass of AAN treatment and AOT40 were not linear with AOT40 significantly.
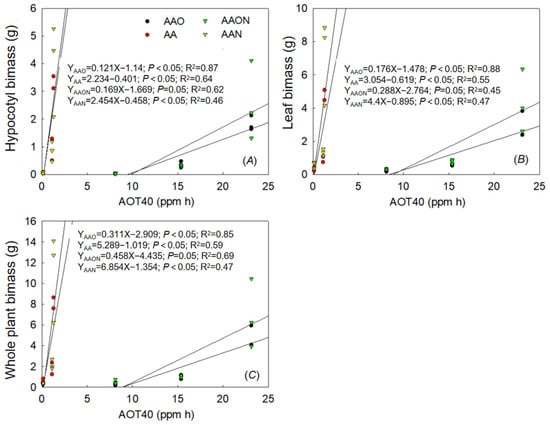
Figure 8.
The dose–response relationships between AOT40 value and hypocotyl biomass (A), leaf biomass (B), and whole plant biomass (C) of all treatments during the growing period of Raphanus sativus L. The black line means a significant linear regression relationship when p < 0.05.
Analyzing and comparing effect differences with the linear regression coefficient and 95% confidence intervals of the existing linear regression between AOT40 and biomass during the experiment revealed significant differences between hypocotyl biomass of AAO and AA, AAON and AA, while the differences between AAO, AAON, and AAN were not different. Leaf biomass of AA showed significant differences with AAO and AAON, while AAON and AAO showed no differences. The whole plant biomass with AOT40 was consistent with hypocotyl biomass (Figure 9).
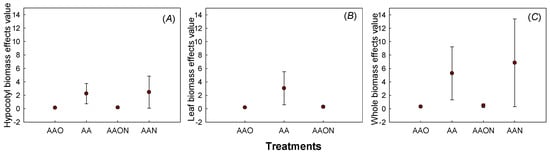
Figure 9.
The significant comparison of O3 dose–response effect value of hypocotyl biomass (A), leaf biomass (B), and whole plant biomass (C) under different treatments of Raphanus sativus L. The effects values are represented as linear regression coefficient±confidence interval. The colorful pot of the figure represents the linear regression coefficient, and the error bar means confidence interval. The effects of the two treatments were considered different when the pot and error bars did not overlap with each other.
4. Discussion
eO3 can cause oxidative damage, leading to reduced carbon assimilation and impaired photosynthetic capacity [2,12,17]. However, the Pn results indicate a complex response of cherry radish to eO3, characterized by an initial increase followed by a sustained decline (Figure 1). The transient rise in Pn on the 7th day may reflect a “priming effect”, in which moderate oxidative stress temporarily enhances antioxidant activity and photosynthetic performance [26,27]. By contrast, prolonged eO3 exposure beyond 7 days resulted in cumulative oxidative damage that impaired the photosynthetic machinery [23].
N addition had a positive impact on the leaf Pn of cherry radish, particularly after 14 days of treatment. This suggests that the plants may have initially experienced N limitation, which was alleviated by the added N, thereby enhancing their photosynthetic capacity (Figure 1). The effect of N addition was especially notable on day 21, where it not only continued to support Pn but also counteracted the detrimental effects of eO3. This is because N availability is essential for the synthesis of chlorophyll and Rubisco, which is a key enzyme in the Calvin cycle, and can directly influence the rate of photosynthesis [28]. N addition mitigated the O3-induced decline in Pn by 6.76% on day 21, indicating a protective effect under eO3 exposure. This may result from enhanced N-use efficiency during leaf ontogeny, which supports better maintenance of Pn and recovery from oxidative stress [17,29].
The decline in stomatal conductance (gs) under eO3 (Figure 1) could restrict CO2 uptake, contributing to reduced Pn by the 14th day. By the 21st day, the sustained reduction in Pn, independent of changes in gs, suggests a non-stomatal limitation, possibly due to PSII damage, chloroplast degradation [2], or Rubisco downregulation [8]. Additionally, prolonged O3 exposure likely induced membrane lipid peroxidation, further inhibiting photosynthetic efficiency and exacerbating Pn reduction [2]. These findings suggest that the initial Pn increase represents a short-term adaptive response, but sustained eO3 exposure ultimately overwhelms the plant’s oxidative compensatory mechanisms, leading to detrimental effects.
eO3 significantly reduced gs of cherry radish leaves only in the middle of the growing period (day 14), suggesting a transient response to oxidative stress. This short-term reduction in gs is a protective mechanism by the plant to limit O3 uptake and mitigate oxidative damage. When stomata partially close in response to O3, the entry of O3 into leaf tissues is restricted, potentially reducing cellular damage [23]. The lack of significant effects on gs on the 7th and 21st days indicates that the stomatal response to eO3 is dynamic and varies with the duration of exposure. On day 7, plants may not have experienced sufficient cumulative O3 stress to trigger a significant stomatal response. By day 21, acclimation mechanisms might have developed, enabling plants to maintain stomatal conductance at levels similar to the control. Alternatively, the extent of O3 damage may not correlate with stomatal O3 uptake, suggesting involvement of stomata-independent or impaired regulatory mechanisms [30].
Interestingly, N addition did not significantly influence gs throughout the experiment (Figure 1). This outcome suggests that while N addition can enhance photosynthetic rates by improving chlorophyll content and enzyme activities, it may not directly impact the stomatal response under O3 stress. N-induced improvements in Pn likely operate through biochemical processes rather than by modifying stomatal behavior. Therefore, the interaction between N availability and O3 exposure appears more influential on internal biochemical pathways rather than altering the plant’s gas exchange dynamics through gs, which was not in accordance with the first hypothesis.
The contrasting effects of eO3 and N addition on intercellular CO2 concentration (Ci) at the end of growth (day 21) highlight their different influences on plant physiology. The increase in Ci under eO3 (+24.24%) suggests that photosynthetic activity was impaired, likely due to O3-induced damage to the photosynthetic machinery, such as Rubisco or photosystem II [1]. As a result, CO2 uptake by the Calvin cycle decreases, leading to a buildup of CO2 in the leaf intercellular spaces. In contrast, the decrease in Ci under N addition (−17.70%) indicates enhanced photosynthetic capacity, because the extra N could improve chlorophyll content and Rubisco activity, boosting CO2 assimilation and lowering Ci levels. Pn, gs, and E results indicated the uncoupled changes in carbon and water relations experienced by the growing leaf as it develops to make it deferentially sensitive to environmental stresses throughout its ontogeny [31]. Although this experiment did not evaluate the effect of N on leaf lifespan, previous studies have reported that soil amendment can delay leaf senescence and is associated with a longer leaf lifespan [32,33]. Thus, these effects may also influence the gas exchange responses to N addition and eO observed on day 21.
AOT40 is often used to quantify the cumulative effects of O3 on plant physiology, as it captures the duration and intensity of exposure [34]. The regression analysis indicates a negative significant linear relationship between Pn and AOT40 under eO3 treatments (AAON and AAO), highlighting that O3 has a strong cumulative suppressive impact on Pn of cherry radish with time. Interestingly, N addition (AAON) did not alter the negative relationship between Pn and AOT40, and no significant differences were observed between the two linear regressions (Figure 4). This suggests that although N addition may partially alleviate O3-induced stress by improving nutrient availability, it is insufficient to counteract the cumulative oxidative damage caused by prolonged exposure to elevated O3, consistent with the findings of Matyssek et al. (2006) [29]. Notably, neither stomatal conductance (gs) nor intercellular CO2 concentration (Ci) showed a linear correlation with AOT40. This could further suggest that the reductions in Pn under eO3 are more directly related to mesophyll cell damage and biochemical processes rather than changes in stomatal function [35].
A very significant negative linear regression relationship was found between E and AOT40 of AAON and AAN (Figure 4), which means plants may employ a mechanism of “hydraulic regulation” where the hydraulic status of the plant influences transpiration rates independently of stomatal conductance [36]. The differences between AAN and AAO, AAN and AAON on E but not gs suggest N addition could adjust E by enhancing root water uptake or altering leaf water retention properties, thereby lowering overall transpiration rates without directly affecting stomatal opening. Therefore, while gs remained unchanged, N addition still could lead to lower transpiration rates. Overall, these findings highlight that N addition under ambient O3 concentrations can lead to a more efficient use of water in plants, even under conditions where gs does not respond.
The relationship between AOT40 and the leaf number during the 21 days revealed that eO3 suppressed leaf number increase. This phenomenon could be due to eO3 damaging cellular structures and reducing leaf initiation and expansion [23] as well as inducing early senescence [37]. Conversely, N addition increased leaf number likely by enhancing nutrient availability, thus supporting growth and leaf development. However, no significant differences between leaf number of AA and AAN, AAON, and AAO regarding the linear relationship and AOT40 suggest that N addition can partially alleviate O3-induced decline but not sufficiently to entirely reverse the adverse effects on leaf number significantly in the long term. Regarding leaf mass per area (LMA), eO3 increased LMA on day 14 (+12.68%), possibly as a compensatory response to O3-induced damage, such as increased cell wall thickness as a defense mechanism against oxidative stress [2]. However, by day 21, the stress may have led to tissue degradation, resulting in a decreased LMA (−11.90%). N addition consistently increased LMA, which suggests an improved structural robustness due to increased nutrient availability. On day 21, a significant interaction between eO3 and N addition was observed for whole plant biomass, including both hypocotyl and leaves. The results indicate that additional N can partially offset the negative effects of O3, consistent with previous studies showing that while O3 exposure impairs plant growth, adequate N supply can alleviate oxidative stress and support recovery [18]. The consistent trend observed in leaf biomass and overall biomass relative to AOT40, like hypocotyl biomass, further emphasizes that O3’s negative impact is pervasive across different plant organs. The fact that eO3 reduced more hypocotyl biomass rather than leaf biomass, which however can still be alleviated by N addition, confirms the second hypothesis. One possible explanation for the partial mitigation of O3-induced biomass reduction by N addition lies in its influence on plant physiological and biochemical defense pathways. eO3 induces oxidative stress by generating reactive oxygen species (ROS), leading to cellular damage, membrane peroxidation, and degradation of photosynthetic pigments [2]. N addition may enhance the antioxidant defense system, which helps scavenge ROS and protect cellular structures [38]. Furthermore, N addition may support Rubisco (the key enzyme involved in CO2 fixation) repair, thereby sustaining carbon assimilation rates. In addition, N contributes to chlorophyll biosynthesis, which is vital for light harvesting and maintaining photosynthetic efficiency under O3 exposure. The explanation for more hypocotyl loss is that, since O3 is a gaseous oxidant pollutant, more energy (non-structural carbohydrates) of plants is allocated from underground to leaves for repairing leaf surface oxidation damage and maintaining photosynthesis function; this is verified by our recent research on cherry radish [14]. Sweet potato [Ipomoea batatas (L.) Lam.], as a root vegetable, also performs a shift of biomass to maintain the canopy at the expense of tuber development under eO3 [39].
The response of plants to N addition often depends on the duration of exposure and the severity of O3 stress. The lack of significant differences in biomass between AAN and AA, as well as between AAON and AAO, in relation to AOT40 suggests that N addition did not substantially alter this relationship (the threshold or slope of O3-induced yield decline). This indicates that the protective effects of N only modify O3’s adverse effects when AOT40 is limited and N could not modify O3-induced biomass reduction in long-term O3 exposure, thus not supporting the third hypothesis. This outcome suggests that N addition alone is insufficient to shift the O3 dose–response relationship when O3 exposure is prolonged or when the accumulated O3 concentration (e.g., AOT40) surpasses a critical threshold, particularly when the plant’s capacity for repair and recovery is overwhelmed [34]. The temporal dynamics of O3 stress and N assimilation must be jointly considered; otherwise, the mitigation potential of N may be overestimated. Moreover, it is plausible that O3-induced damage to root systems could limit the uptake and utilization of added nitrogen over time [40], thereby weakening the long-term efficacy of N addition in sustaining growth or yield. This is particularly critical for root vegetables like cherry radish, where belowground biomass is both a yield component and a sensitive indicator of stress. Overall, the findings suggest that N input cannot fully counterbalance the cumulative oxidative effects imposed by high or prolonged O3 exposure, reinforcing the need for multi-faceted strategies beyond fertilization to protect crop productivity under atmospheric pollution.
5. Conclusions
Root vegetables play a critical role in food security, and understanding their responses to atmospheric pollutants is essential. Our study demonstrates that soil nitrogen (N) addition effectively mitigates ozone (O3)-induced reductions in photosynthesis rates and biomass in short-lifespan root vegetables like cherry radish. However, N addition does not significantly influence long-term O3 dose–response effects or key functional traits. These findings highlight the potential of N addition for alleviating acute oxidative stress while underscoring its limitations in addressing prolonged O3 exposure. The implications of this research are significant for agricultural and environmental management. While N addition offers a viable strategy to counteract acute O3 impacts, it is not a long-term solution. Integrated approaches combining N management with other agronomic and environmental practices are needed to enhance crop resilience to atmospheric pollution. This study emphasizes the importance of understanding the mechanistic interactions between atmospheric pollutants, nutrient management, and plant responses to develop sustainable agricultural systems in the face of rising atmospheric pollution. In future research, leaf ontogeny could be taken into account for providing broader insights into the mechanisms underlying leaf growth responses differentially sensitive to abiotic stresses during the growing process.
Supplementary Materials
The following supporting information can be downloaded at: https://www.mdpi.com/article/10.3390/atmos16070784/s1, Figure S1: The relative changes (%) of Pn(A), gs(B), Ci(C) and E(D) compared with control treatments (ambient air treatment, AA) during the growing process.
Author Contributions
Conceptualization, L.L.; methodology, L.L.; software, L.L.; validation, L.L. and J.L.; formal analysis, L.L.; investigation, J.L.; resources, L.L.; data curation, L.L. and J.L.; writing—original draft preparation, L.L.; writing—review and editing, L.L.; visualization, L.L.; supervision, L.L.; project administration, L.L.; funding acquisition, L.L. All authors have read and agreed to the published version of the manuscript.
Funding
This work was supported by the National Natural Science Foundation of China, grant numbers 31971509; 32171586.
Institutional Review Board Statement
Not applicable.
Informed Consent Statement
Not applicable.
Data Availability Statement
Data sets generated during the current study are available from the corresponding author on reasonable request.
Conflicts of Interest
I declare on behalf of my co-authors that the work described was original research that has not been published previously, and is not under consideration for publication elsewhere, in whole or in part. The authors declare no conflicts of interest.
References
- Ainsworth, E.A.; Lemonnier, P.; Wedow, J.M. The influence of rising tropospheric carbon dioxide and ozone on plant productivity. Plant Biol. 2020, 22, 5–11. [Google Scholar] [CrossRef] [PubMed]
- Li, L.; Li, J.; Wang, X.K.; Ullah, S.; Lin, S. Responses of morphological and biochemical traits of bamboo trees under elevated atmospheric O3 enrichment. Environ. Res. 2024, 252, 119069. [Google Scholar] [CrossRef]
- Li, L.; Wu, R.Q.; Li, J.L.; Wang, X.K.; Liu, X.; Wang, C. Effects of elevated O3 concentration and nitrogen deposition on photosynthesis, accumulation and allocation of biomass and nonstructural carbohydrates in soybean. Acta Ecol. Sin. 2022, 42, 7198–7209. [Google Scholar]
- Sicard, P.; Khaniabadi, Y.O.; Leca, S.; De Marco, A. Relationships between ozone and particles during air pollution episodes in arid continental climate. Atmos. Pollut. Res. 2023, 14, 101838. [Google Scholar] [CrossRef]
- Li, H.; Ma, Y.; Duan, F.; Zhu, L.; Ma, T.; Yang, S.; He, K. Stronger secondary pollution processes despite a decrease in gaseous precursors: A comparative analysis of summer 2020 and 2019 in Beijing. Environ. Pollut. 2021, 279, 116923. [Google Scholar] [CrossRef] [PubMed]
- Ramya, A.; Dhevagi, P.; Poornima, R.; Avudainayagam, S.; Watanabe, M.; Agathokleous, E. Effect of ozone stress on crop productivity: A threat to food security. Environ. Res. 2023, 236, 116816. [Google Scholar] [CrossRef]
- Zhao, H.; Zheng, Y.; Zhang, Y.; Li, T. Evaluating the effects of surface O3 on three main food crops across China during 2015–2018. Environ. Pollut. 2020, 258, 113794. [Google Scholar] [CrossRef]
- Li, S.; Montes, C.M.; Aspray, E.K.; Ainsworth, E.A. How do drought and heat affect the response of soybean seed yield to elevated O3? An analysis of 15 seasons of free-air O3 concentration enrichment studies. Glob. Change Biol. 2024, 30, e17500. [Google Scholar] [CrossRef]
- Wang, X.; Zhang, Q.; Zheng, F.; Zheng, Q.; Yao, F.; Chen, Z.; Lu, F. Effects of elevated O3 concentration on winter wheat and rice yields in the Yangtze River Delta, China. Environ. Pollut. 2012, 171, 118–125. [Google Scholar] [CrossRef]
- Montes, C.M.; Demler, H.J.; Li, S.; Martin, D.G.; Ainsworth, E.A. Approaches to investigate crop responses to ozone pollution: From O3-FACE to satellite-enabled modeling. Plant J. 2022, 109, 432–446. [Google Scholar] [CrossRef]
- Vandermeiren, K.; De Bock, M.; Horemans, N.; Guisez, Y.; Ceulemans, R.; De Temmerman, L. Ozone effects on yield quality of spring oilseed rape and broccoli. Atmos. Environ. 2012, 47, 76–83. [Google Scholar] [CrossRef]
- Scheelbeek, P.F.D.; Bird, F.A.; Tuomisto, H.L.; Green, R.; Harris, F.B.; Joy, E.J.; Dangour, A.D. Effect of environmental changes on vegetable and legume yields and nutritional quality. Proc. Natl. Acad. Sci. USA 2018, 115, 6804–6809. [Google Scholar] [CrossRef]
- Hassan, I.A.; Bell, N.B.; Ashmore, M.R.; Cotrozzi, L.; Haiba, N.S.; Basahi, J.M.; Ismail, I.M. Radish (Raphanus sativus L.) cultivar-specific response to O3: Patterns of biochemical and plant growth characteristics. Clean-Soil Air Water. 2018, 46, 1800124. [Google Scholar] [CrossRef]
- Li, L.; Yang, B.; Li, J.; Wang, X.K.; Ullah, S. Effects of elevated atmospheric ozone concentration on biomass and non-structural carbohydrates allocation of cherry radish. Front. Plant Sci. 2025, 16, 1547359. [Google Scholar] [CrossRef] [PubMed]
- Liu, L.; Xu, W.; Lu, X.; Zhong, B.; Guo, Y.; Lu, X.; Vitousek, P. Exploring global changes in agricultural ammonia emissions and their contribution to nitrogen deposition since 1980. Proc. Natl. Acad. Sci. USA 2022, 119, e2121998119. [Google Scholar] [CrossRef] [PubMed]
- Sanz, J.; Bermejo, V.; Gimeno, B.S.; Elvira, S.; Alonso, R. Ozone sensitivity of the Mediterranean terophyte Trifolium striatum is modulated by soil nitrogen content. Atmos. Environ. 2007, 41, 8952–8962. [Google Scholar] [CrossRef]
- Chakrabarti, B.; Sharma, S.; Mishra, A.K.; Kannojiya, S.; Kumar, V.; Bandyopadhyay, S.K.; Bhatia, A. Application of an additional dose of N could sustain rice yield and maintain plant nitrogen under elevated ozone (O3) and carbon dioxide (CO2) conditions. Front. Sustain. Food Syst. 2024, 8, 1477210. [Google Scholar] [CrossRef]
- Podda, A.; Pisuttu, C.; Hoshika, Y.; Pellegrini, E.; Carrari, E.; Lorenzini, G.; Paoletti, E. Can nutrient fertilization mitigate the effects of ozone exposure on an ozone-sensitive poplar clone? Sci. Total Environ. 2019, 657, 340–350. [Google Scholar] [CrossRef]
- Feng, Z.; Shang, B.; Li, Z.; Calatayud, V.; Agathokleous, E. Ozone will remain a threat for plants independently of nitrogen load. Funct. Ecol. 2019, 33, 1854–1870. [Google Scholar] [CrossRef]
- Li, P.; Yin, R.; Zhou, H.; Xu, S.; Feng, Z. Functional traits of poplar leaves and fine roots responses to ozone pollution under soil nitrogen addition. J. Environ. Sci. 2022, 113, 118–131. [Google Scholar] [CrossRef]
- Watanabe, M.; Li, J.; Matsumoto, M.; Aoki, T.; Ariura, R.; Fuse, T.; Izuta, T. Growth and photosynthetic responses to ozone of Siebold’s beech seedlings grown under elevated CO2 and soil nitrogen supply. Environ. Pollut. 2022, 304, 119233. [Google Scholar] [CrossRef]
- U.S. Environmental Protection Agency (USEPA). Air Quality Criteria for Ozone and Related Photochemical Oxidants; Report No. EPA/600/P-93/004bF; U.S. Environmental Protection Agency: Washington, DC, USA, 1996.
- Li, L.; Manning, W.J.; Tong, L.; Wang., X.K. Chronic drought stress reduced but did not protect Shantung maple (Acer truncatum Bunge) from adverse effects of ozone (O3) on growth and physiology in the suburb of Beijing, China. Environ. Pollut. 2015, 201, 34–41. [Google Scholar] [CrossRef] [PubMed]
- Xing, X.; Hu, T.; Wang, Y.; Li, Y.; Wang, W.; Hu, H.; Wang, J. Construction of SNP fingerprints and genetic diversity analysis of radish (Raphanus sativus L.). Front. Plant Sci. 2024, 15, 1329890. [Google Scholar] [CrossRef] [PubMed]
- Kou, B.; Hui, K.; Miao, F.; He, Y.; Qu, C.; Yuan, Y.; Tan, W. Differential responses of the properties of soil humic acid and fulvic acid to nitrogen addition in the North China Plain. Environ. Res. 2022, 214, 113980. [Google Scholar] [CrossRef] [PubMed]
- Foyer, C.H.; Noctor, G. Oxygen processing in photosynthesis: Regulation and signaling. New Phytol. 2000, 146, 359–388. [Google Scholar] [CrossRef]
- Mishra, S.; Kumari, M. Priming of plants with moderate stress: Enhanced stress tolerance as a preparatory defense mechanism. Environ. Exp. Bot. 2021, 183, 104362. [Google Scholar]
- Mason, R.E.; Craine, J.M.; Lany, N.K.; Jonard, M.; Ollinger, S.V.; Groffman, P.M.; Elmore, A.J. Evidence, causes, and consequences of declining nitrogen availability in terrestrial ecosystems. Science 2022, 376, eabh3767. [Google Scholar] [CrossRef]
- Matyssek, R.; Le Thiec, D.; Löw, M.; Dizengremel, P.; Nunn, A.J.; Häberle, K.H. Interactions between drought and O3 stress in forest trees. Plant Biol. 2006, 8, 11–17. [Google Scholar] [CrossRef]
- Morales, L.O.; Shapiguzov, A.; Safronov, O.; Leppälä, J.; Vaahtera, L.; Yarmolinsky, D.; Brosché, M. Ozone responses in Arabidopsis: Beyond stomatal conductance. Plant Physiol. 2021, 186, 180–192. [Google Scholar] [CrossRef]
- Pantin, F.; Simonneau, T.; Muller, B. Coming of leaf age: Control of growth by hydraulics and metabolics during leaf ontogeny. New Phytol. 2012, 196, 349–366. [Google Scholar] [CrossRef]
- Pornon, A.; Marty, C.; Winterton, P.; Lamaze, T. The intriguing paradox of leaf lifespan responses to nitrogen availability. Funct. Ecol. 2011, 25, 796–801. [Google Scholar] [CrossRef]
- Marty, C.; Lamaze, T.; Pornon, A. Endogenous sink-source interactions and soil nitrogen regulate leaf life-span in an evergreen shrub. New Phytol. 2009, 183, 1114–1123. [Google Scholar] [CrossRef]
- Mills, G.; Hayes, F.; Simpson, D.; Emberson, L.; Norris, D.; Harmens, H.; Büker, P. Evidence of widespread effects of ozone on crops and (semi-)natural vegetation in Europe (1990–2006) about AOT40- and flux-based risk maps. Glob. Change Biol. 2013, 19, 592–613. [Google Scholar]
- Hoshika, Y.; Haworth, M.; Watanabe, M.; Koike, T. Interactive effect of leaf age and ozone on mesophyll conductance in Siebold’s beech. Physiol. Plant. 2020, 170, 172–186. [Google Scholar] [CrossRef] [PubMed]
- Franks, P.J.; Drake, P.L.; Froend, R.H. Anisohydric but is hydrodynamic: Seasonally constant plant water potential gradient explained by a stomatal control mechanism incorporating variable plant hydraulic conductance. Plant Cell Environ. 2007, 30, 19–30. [Google Scholar] [CrossRef]
- Li, L.; Wang, X.; Manning, W.J. Effects of Elevated CO2 on leaf senescence, leaf nitrogen resorption, and late-season photosynthesis in Tilia americana L. Front. Plant Sci. 2019, 10, 1217. [Google Scholar]
- Gupta, G.S.; Tiwari, S. Role of antioxidant pool in management of ozone stress through soil nitrogen amendments in two cultivars of a tropical legume. Funct. Plant Biol. 2020, 48, 371–385. [Google Scholar] [CrossRef]
- Keutgen, N.; Keutgen, A.J.; Janssens, M.J.J. Sweet potato [Ipomoea batatas (L.) Lam.] cultivated as tuber or leafy vegetable supplier as affected by elevated tropospheric ozone. J. Agr. Food Chem. 2008, 56, 6686–6690. [Google Scholar] [CrossRef]
- Mrak, T.; Eler, K.; Badea, O.; Hoshika, Y.; Carrari, E.; Paoletti, E.; Kraigher, H. Elevated ozone prevents acquisition of available nitrogen due to smaller root surface area in poplar. Plant Soil. 2020, 450, 585–599. [Google Scholar] [CrossRef]
Disclaimer/Publisher’s Note: The statements, opinions and data contained in all publications are solely those of the individual author(s) and contributor(s) and not of MDPI and/or the editor(s). MDPI and/or the editor(s) disclaim responsibility for any injury to people or property resulting from any ideas, methods, instructions or products referred to in the content. |
© 2025 by the authors. Licensee MDPI, Basel, Switzerland. This article is an open access article distributed under the terms and conditions of the Creative Commons Attribution (CC BY) license (https://creativecommons.org/licenses/by/4.0/).