Article

Temporal and Spatial Dynamics of Dust Storms in Uzbekistan from Meteorological Station Records (2010–2023)

by
Natella Rakhmatova
1,
Bakhriddin E. Nishonov
1,2,
Lyudmila Shardakova
1,
Albina Akhmedova
3,
Alisher Khudoyberdiev
1,
Valeriya Rakhmatova
4 and
Dmitry A. Belikov
5,*
1
Hydrometeorological Research Institute, Agency of Hydrometeorological Service of the Republic of Uzbekistan, Tashkent 100052, Uzbekistan
2
Faculty of Hydrometeorology, National University of Uzbekistan, Tashkent 100174, Uzbekistan
3
Agency of the Hydrometeorological Service under the Ministry of Ecology, Environmental Protection and Climate Change of the Republic of Uzbekistan, Tashkent 100052, Uzbekistan
4
Graduate School of Engineering, Kyoto University, Gokasho, Uji 611-0011, Japan
5
Center for Environmental Remote Sensing, Chiba University, Chiba 263-8522, Japan
*
Author to whom correspondence should be addressed.
Atmosphere 2025, 16(7), 782; https://doi.org/10.3390/atmos16070782
Submission received: 23 April 2025 / Revised: 10 June 2025 / Accepted: 16 June 2025 / Published: 26 June 2025
(This article belongs to the Section Meteorology)

Abstract

This study provides a comprehensive spatiotemporal analysis of sand and dust storms (SDSs) in Uzbekistan using ground-based meteorological data from 2010 to 2023. The results reveal significant spatial heterogeneity in the SDS activity, with the highest frequency of SDS days observed in the southern and western regions, including Surkhandarya, Kashkadarya, Bukhara, Khorezm, and Republic of Karakalpakstan. In the most vulnerable areas, such as Karakalpakstan, Surkhandarya, and Kashkadarya, the annual number of SDS days can exceed 80 in certain years, reflecting a high recurrence of extreme dust events in certain climatic zones. About 53% of the SDS events were regional, affecting several stations, while 47% were localized, indicating a combination of large-scale dust transport and localized emissions. Seasonal patterns showed a peak SDS activity between March and August, coinciding with the dry season characterized by elevated temperatures, reduced soil moisture, and intense agricultural activity, all of which contribute to the surface exposure and increased vulnerability. This study found a significant variation in the event duration across regions, with Karakalpakstan and Surkhandarya experiencing the highest proportion of prolonged events due to its orography and persistent southerly wind patterns. Using ERA5 data and a decision tree regressor, the analysis identified the wind direction and mean wind speed as the most influential meteorological factors, followed by the maximum wind speed and soil temperature, with other variables such as solar radiation and soil moisture playing moderate roles. This study highlights the importance of regional wind patterns and geomorphology in SDS formation, with prevailing wind directions from the northwest, west, and south. The integration of the ERA5 reanalysis and machine learning techniques offers significant potential for improving SDS monitoring and studies.

1. Introduction

Sand and dust storms (SDSs) are natural phenomena that exert substantial environmental and socio-economic impacts, particularly in arid and semi-arid regions [1,2,3]. They occur when strong winds entrain loose sand and dust particles from extensive surface areas into the atmosphere [4,5,6,7]. Although most dust particles are elevated only a few meters above the surface, finer particles can reach significant heights above the ground. There, prevailing winds enable their long-range transport, extending their impact across national borders [1,7,8,9].
SDSs have a significant negative impact on various aspects of the environment and human activity. They contribute to soil erosion, deteriorate air quality, and reduce visibility, which is particularly hazardous for transportation infrastructure, including roads and air traffic [10,11,12]. The health impacts of SDSs are reflected in increased rates of respiratory and cardiovascular diseases, especially among vulnerable groups, such as children, the elderly, and individuals with chronic illnesses [13,14,15]. In agriculture, SDSs lead to the loss of the fertile topsoil, reduced crop yields, and worsened conditions for livestock farming [13]. Moreover, their effects can exacerbate climate change by influencing the radiation balance and the hydrological cycle [1,14]. The interplay between land degradation and climate is a key factor: degradation contributes to climate change through greenhouse gas emissions, shifts in the energy balance, and increased dust emissions. In arid regions, climate change can intensify droughts and SDSs, creating a closed cycle of impact [12].
On a global scale, Central Asia ranks second only to the Sahara in terms of dust emissions [13]. A significant portion of the region consists of both natural and anthropogenic deserts, which serve as major sources of dust emissions in the mid-latitudes. In recent years, an increase in the frequency of SDS events has been observed [16]. Additional contributing factors include the formation of the Aralkum Desert, climate change, more frequent droughts, land degradation, and inefficient water resource management. Recent studies on dust emissions and transport in the region have identified the eastern part of the Aral Sea basin as the primary source. This zone covers over 27,000 km2 and emitted an average of 87.6 Tg of dust per year from 2010 to 2020 [17].
Previous studies have examined the frequency of SDSs in Uzbekistan and the broader Central Asian region, with some studies based on ground-based meteorological observations [7,17,18,19,20,21,22]. One of the earliest contributions was Romanov’s analysis of the SDS recurrence and duration [19]. This was followed by Chirkov and Sapozhnikova’s [20,21] spatial and temporal assessments in the 1970s, which highlighted the uneven SDS activity across the arid former USSR due to different surface conditions and an increase in SDS frequency from north to south. Shardakova and Usmanova [22] analyzed SDSs in the Aral Sea region from 1990 to 2002 and identified it as the second most active SDS hotspot in Central Asia. Up to one-third of the year was affected by SDSs in this region.
Indoitu et al. [22] reported a decline in the SDS frequency from 1936 to 2000, noting an initial increase in the early decades linked to anthropogenic land-use changes. In addition, Shao and Dong [23] confirmed a high dust activity in Central Asia based on visibility records, MODIS satellite data, and simulations for 1998–2003. Temporal and spatial variability in the SDS frequency is evident, with peaks observed in the periods of 1966–1970, 1984–1986, and 2000–2002, and a decline in some regions is attributed to climatic factors and environmental measures to mitigate desertification [24,25,26]. Despite this, the SDS activity remains high in spring and summer, posing ongoing risks to populations, agriculture, and the environment [24,25,26,27]. Recent advances in SDS monitoring, including machine learning, satellite data, and mathematical modeling, have focused on identifying dust source areas. Notably, Nobakht et al. [28] used MODIS data from 2003 to 2012 to identify 13,500 point sources, with significant emissions from the Aralkum Desert, Taklamakan, and Balkhas.
For analyzing SDS dynamics in Central Asia, where arid conditions, a complex topography, and limited ground observations make conventional monitoring difficult, the meteorological product ERA5 reanalysis is a critical resource. With its high temporal (hourly) and spatial (~31 km) resolution and a broad suite of atmospheric variables, ERA5 enables detailed assessments of the SDS frequency, intensity, and key meteorological drivers, including the wind speed, pressure gradients, and surface temperature [29,30]. Recent applications of ERA5 have advanced the understanding of SDS climatology; interannual variability; and the role of regional circulation patterns, topography, and land surface conditions in dust emission and transport processes [31,32]. In recent years, machine learning methods, including support vector machines, random forests, and artificial neural networks, have been increasingly applied to SDS analysis, offering enhanced capabilities for detection, prediction, and source identification by effectively processing complex datasets, such as satellite imagery and meteorological information [33]. The review found that machine learning approaches improved the performance of dust aerosol detection using satellite data by addressing challenges related to the spatial and temporal variability [34,35]. Additionally, machine learning has enabled a faster, more flexible real-time SDS detection using ground-based sensor networks [36].
This study examines the spatiotemporal distribution of SDSs in Uzbekistan from 2010 to 2023 using ground-based meteorological observations. This study identifies regions with a high exposure to severe SDS events and analyzes associated wind parameters. This study evaluates existing datasets, identifies critical problem areas, and proposes recommendations to improve SDS monitoring within the national environmental monitoring framework. Using ERA5 reanalysis data and a decision tree regressor, this study identifies the wind direction and mean wind speed as the primary drivers of SDSs. Meanwhile, the soil temperature, radiation, moisture, and precipitation are found to have secondary influences, with a minimal impact observed from other variables. The structure of this paper is as follows: Section 2 details the datasets and study area. Section 3 provides a comprehensive assessment of the SDS activity in Central Asia from 2010 to 2023. Section 4 discusses the results and their implications and significance. Section 5 summarizes the key findings and offers concluding remarks.

2. Materials and Methods

2.1. Study Domain

Located in Central Asia, Uzbekistan partially encompasses several large deserts, including the Kyzylkum, Karakum, and Aralkum Deserts, the latter was formed by the degradation of the Aral Sea (Figure 1). Large areas of the country are also covered by the Karshi and Mirzachul steppes. The climate is distinctly continental, characterized by pronounced seasonal temperature variations, low annual precipitation (150–200 mm in the lowlands), and high evapotranspiration rates (up to 2500 mm), which collectively foster arid conditions. Long-term analyses indicate a persistent warming trend in mean annual air temperature since the early 1930s, despite interannual variations. The most pronounced temperature increases during 1928–2019 occurred in the Samarkand region and Karakalpakstan, reaching 2.8–2.9 °C. Prolonged hot and dry periods have been accompanied by an increasing atmospheric moisture deficit. From 1950 to 2019, moisture deficits increased by 45% in the Aral Sea region, 30% on the Ustyurt Plateau, and 17% in Khorezm. These changes exceed natural climatic variability by a factor ranging from 1.8 to 2.6 [37]. The resulting climatic shifts have exacerbated natural hazards, increasing drought frequency and intensifying extreme weather events, including SDSs.

2.2. Observations from Meteorological Stations Across Uzbekistan

The spatiotemporal distribution of SDSs from 2010 to 2023 was analyzed using data from 57 meteorological stations across Uzbekistan, operated by the Uzhydromet network. These observations are consistent with World Meteorological Organization (WMO) guidelines [38,39]. Key parameters include the type of dust event, such as SDS, dust haze, or blowing dust, as well as onset and cessation times, intensity, and relevant meteorological conditions. Intensity is primarily assessed by meteorological visibility range, with most stations relying on visual observation. A standardized classification system regulates the categorization of events [40].
In this study, SDS events were identified using a combination of meteorological indicators to ensure consistent and objective classification. Specifically, an event was defined as an SDS when the following three criteria were met simultaneously: (1) a reduction in horizontal visibility below 3000 m as recorded by surface meteorological observations, (2) strong surface winds with the maximum daily wind gust speed ≥ 10 m/s, and (3) the event persists for more than one hour. This approach is consistent with the definition adopted by the World Meteorological Organization (WMO, 2017 [https://www.undrr.org/understanding-disaster-risk/terminology/hips/mh0015], accessed on 20 June 2025) and follows established practices [41].

2.3. ERA5 Reanalysis

The ERA5 global reanalysis, produced by ECMWF, is a comprehensive dataset offering high-resolution atmospheric data, including temperature, wind speed, pressure, humidity, and other meteorological variables, at global scales and varying heights [29]. Spanning from 1940 to the present [30], ERA5 provides hourly data with a spatial resolution of about 31 km. Derived from a combination of observations and numerical weather models, the dataset is continuously updated for accuracy. ERA5 is widely used for weather prediction, climate modeling, and environmental monitoring, including in Central Asia [42]. It is particularly useful for studies like SDS analysis, offering key insights into meteorological factors that drive dust emission, transport, and deposition. In this study, ERA5 reanalysis data were utilized to characterize the meteorological conditions associated with SDS events, focusing on key factors that influence their formation and propagation. The variables analyzed include wind direction, mean wind speed, maximum wind speed, soil temperature at the first level, surface solar radiation, soil volumetric water content at the first level, total precipitation, boundary layer height, and friction velocity.

3. Results

3.1. Spatiotemporal Distribution of SDS Events

Figure 2 shows the average annual number of days with SDSs by region in Uzbekistan from 2010 to 2023. The highest frequency was observed in the Surkhandarya and Karakalpakstan region with more than 50 days per year, followed by Kashkadarya with more than 40 days, Bukhara with more than 30 days, and Navoi with more than 15 days per year.
The bar chart in Figure 3 shows the annual number of SDS days in nine administrative regions: Karakalpakstan, Khorezm, Navoi, Bukhara, Kashkadarya, Surkhandarya, Jizzakh, Namangan, and Andijan. The data reveal a pronounced interannual variability and distinct regional patterns in the SDS occurrence. Karakalpakstan consistently has the most SDS days, especially in 2010, 2012, 2013, and 2022. This makes it a persistent SDS hotspot. Regions such as Kashkadarya and Surkhandarya show notable spikes in certain years (e.g., 2011 and 2023), indicating episodic intensification. In contrast, the eastern regions of Namangan, Jizzakh, and Andijan experience relatively low SDS activity throughout the period. The Fergana, Tashkent, Syrdarya, and Samarkand regions were excluded from this analysis due to their low mean number of SDS events per year, which rendered trends statistically insignificant. These findings underscore the spatial heterogeneity of SDS impacts and the necessity of targeted regional mitigation efforts.
A spatial analysis of SDS occurrences from 2010 to 2023 (Figure 4) reveals a significant concentration of dust activity in the southern regions of Uzbekistan, particularly along the Amu Darya River. The most affected areas include Surkhandarya, Kashkadarya, Bukhara, Khorezm, and the Republic of Karakalpakstan. The Termez meteorological station in Surkhandarya recorded the highest average annual number of SDS days, exceeding 40 days per year. In the Bukhara region, approximately 25 days per year were observed at the Bukhara station and about 10 days at the Karakul station. In Karakalpakstan, the Jaslyk station reported the highest frequency, with an average of 15 days per year. In Kashkadarya, both Karshi and Mubarek stations recorded approximately 10 days per year.
The graph in Figure 5 shows that 53% of all SDSs recorded between 2010 and 2023 occurred simultaneously at two or more meteorological stations, indicating their regional-scale influence. In contrast, 47% were registered at a single station, signifying localized events. This distribution suggests that over half of SDS occurrences are expansive in nature, capable of impacting multiple administrative regions at once. Conversely, localized SDS events are typically constrained in their spatial extent and are shaped by site-specific factors, such as brief wind gusts, the proximity to dust-emitting surfaces, or localized topographic conditions. These distinctions highlight the critical need to incorporate spatial-scale and atmospheric dynamics into the classification and operational monitoring of SDS phenomena.
An examination of the SDS duration across Uzbekistan from 2010 to 2023 (Figure 6) reveals a predominance of short events lasting 1–2 h, accounting for 60% to 87% of all cases. The highest proportions are recorded in the Fergana (87%) and Namangan (86%) regions, likely due to their lower aridity and remoteness from primary dust sources. In contrast, the Tashkent region and Tashkent city exhibit a significantly higher frequency of prolonged SDSs, with only 44% of events lasting under 3 hours, while 29% persisted for 3 to 6 h and 25% for 6 to 12 h. These extended durations may reflect a convergence of natural and anthropogenic factors, including intensified wind regimes, local dust-emitting surfaces, open-pit mining, dense urban development, heavy traffic, and the wintertime operation of thermal power facilities. The Surkhandarya region stands out for the highest proportion (14%) of long-duration SDSs exceeding 12 h, attributable to its geographical proximity to arid landscapes, the influence of mountain–valley air circulation, sustained southerly winds, and widespread land degradation coupled with a sparse vegetation cover that facilitates a persistent atmospheric dust suspension.
An examination of the SDS duration across Uzbekistan from 2010 to 2023 (Figure 6) reveals a significant regional variation in the typical duration of SDS events. Western and southern regions such as Karakalpakstan, Khorezm, Navoiy, Bukhara, and Kashkadarya experience a more balanced distribution, with a high proportion of events lasting six hours or more, including a significant number of events exceeding 10 h. In contrast, the eastern and north-eastern regions, such as Namangan, Fergana, and Samarkand, are dominated by short-duration events, primarily in the 1–2 h category. This suggests that the SDS activity is less persistent in these regions. Surkhandarya is unique in showing a higher proportion of very long events (>15 h), which could indicate local persistence or a topographic influence. These findings emphasize the spatial heterogeneity and temporal characteristics of SDS events in Uzbekistan, which are essential for the development of region-specific early warning systems and mitigation strategies.
Figure 7 shows the percentage distribution of SDS occurrences throughout the day in different regions of Uzbekistan. The data are presented in stacked bar charts for each region, covering six four-hour intervals over a 24 h period. Most SDS events began during daylight hours, particularly between 10:00 and 14:00, corresponding to peak surface heating and convective activity. However, a notable share of events in some regions such as Karakalpakstan, Kashkadarya, and Surkhandarya were observed to start during nighttime hours (22:00 to 06:00). These nocturnal SDS onsets may be associated with transboundary dust transport, where dust originating from upwind arid regions such as Turkmenistan, Kazakhstan, or Afghanistan travels overnight and reaches Uzbekistan under stable atmospheric conditions and low nocturnal boundary layers. This highlights the significance of both local meteorological drivers and regional transport processes in shaping SDS dynamics.

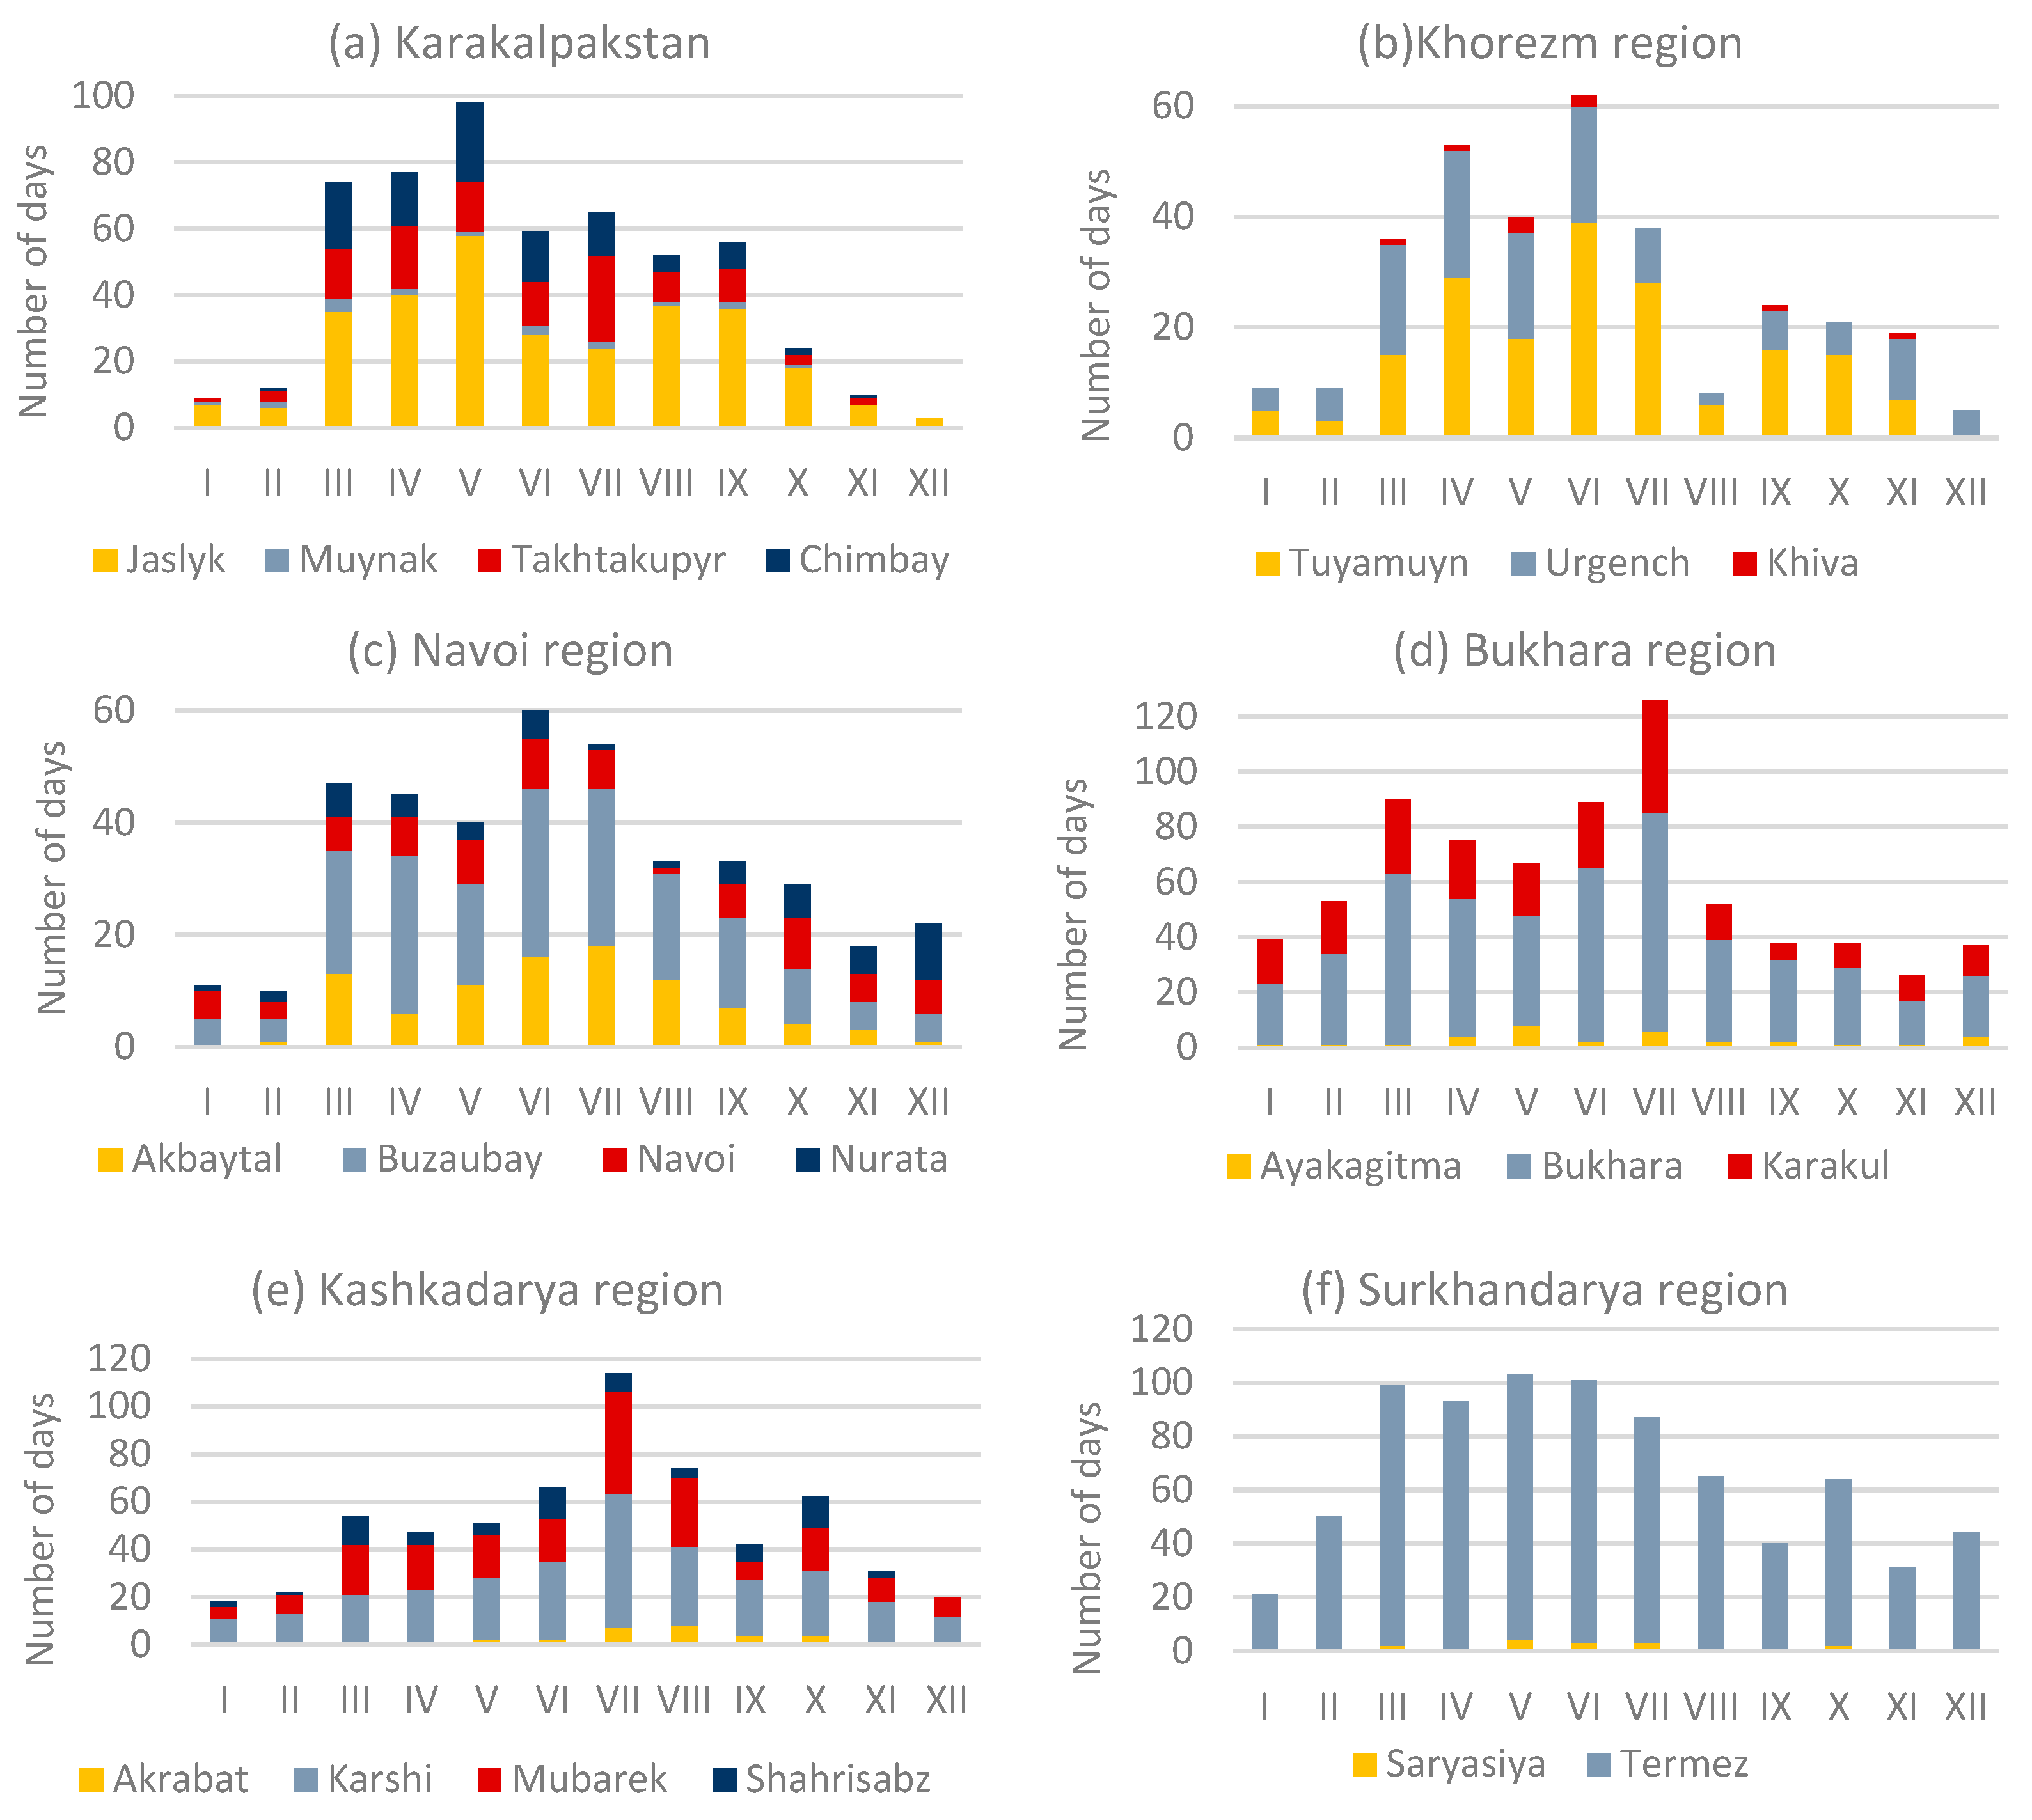
3.2. Seasonal Distribution of SDS Events

The intra-annual variability of the SDS activity was further investigated using observational data from meteorological stations located in regions of Uzbekistan characterized by frequent SDS events during the period of 2010–2023. Figure 8 shows the monthly distribution of SDS days across six regions: Karakalpakstan, Khorezm, Navoi, Bukhara, Kashkadarya, and Surkhandarya. Each subplot corresponds to one of these regions and displays data from multiple meteorological stations in the form of stacked bar charts, where each color represents a specific station.
The results indicate a clear seasonal trend, with the majority of SDS days occurring between March and August and a distinct peak generally observed from April to July. The SDS activity is notably low during the winter months, particularly in December, January, and February. Among the regions, Bukhara displays the highest peak, especially in July, driven mainly by observations at the Bukhara station. Karakalpakstan also shows a high SDS activity, particularly in May, with significant contributions from the Jaslyk and Takhtakupyr stations. In Khorezm, SDS days are most frequent in May and June, with Urgench being the most active station. The Navoi region shows a relatively even distribution of SDS activity from March to August, with Buzauabay and Navoi stations contributing notably. Kashkadarya experiences its peak in July, mainly due to the high activity at Mubarek. In Surkhandarya, SDS days are concentrated at the Termez station, with sustained activity from March to August. Overall, the figure highlights both seasonal and regional variations in the SDS occurrence across Uzbekistan, reflecting the influence of local climatic and geographic factors.
SDSs’ initiation and intensity are primarily modulated by meteorological parameters, particularly the near-surface wind speed, atmospheric stability, synoptic-scale pressure patterns, and antecedent soil moisture conditions [43]. These variables interact with land surface properties to modulate dust emission thresholds and control vertical and horizontal dust fluxes [44,45]. The wind stress exerted on the surface is the main driver of dust entrainment, with dust emission occurring when the frictional velocity exceeds a threshold that depends on surface characteristics, including the particle size distribution, surface crusting, and soil moisture [46]. For non-cohesive, dry sandy soils, it is typically in the range of 0.2–0.4 m/s, but increases significantly with increasing soil moisture and vegetation cover [47]. Once the saltation is initiated, bombardment and fragmentation processes release finer clay and silt-sized particles into suspension [48]. At the synoptic scale, SDSs are often associated with strong pressure gradients and baroclinic disturbances. Migrating midlatitude cyclones, frontal passages, and post-frontal cold air advection generate strong surface winds and turbulent mixing. In East and Central Asia, strong northwesterly winds behind cold fronts trigger large-scale dust outbreaks in spring [43,49]. Atmospheric stability controls the vertical mixing depth of dust and the potential for convective buoyancy. Neutral to unstable conditions during daytime heating enhance the boundary layer turbulence and loft particles up to 2–5 km, promoting long-range transport [50].
Using ERA5 data, we applied a decision tree regressor to assess the relative importance of selected meteorological and environmental variables (Figure 9). This machine learning algorithm identifies key factors by recursively partitioning the dataset based on feature values, aiming to minimize the variance within each split. At each node, the algorithm selects the feature and threshold that best separates the data into homogeneous subsets. The final output is obtained by averaging the target values of the samples in each leaf node. The model was implemented using the DecisionTreeRegressor class from the Python (version 3.11.12) scikit-learn library (version 1.6.1), which offers an efficient and flexible framework for building and evaluating decision tree models [51].
The bar chart in Figure 9 shows the relative importance of the top nine features used by a decision tree regressor for predicting a target variable based on meteorological and environmental inputs. The x-axis lists the feature abbreviations, while the y-axis displays their normalized importance values. The wind direction (WD) and mean wind speed (WS mean) are the most influential variables, with importance values exceeding 0.19. These are followed by the maximum wind speed (WS max) and soil temperature at level 1 (STL1), which contribute moderately to the model. The surface solar radiation (SSR), surface soil moisture in the top layer (SWVL1), and total precipitation (TP) exhibit a lower but still notable importance. In contrast, the boundary layer height (BLH) and surface friction velocity (ZUST) show the least importance, indicating a minimal impact on the model’s predictive performance.

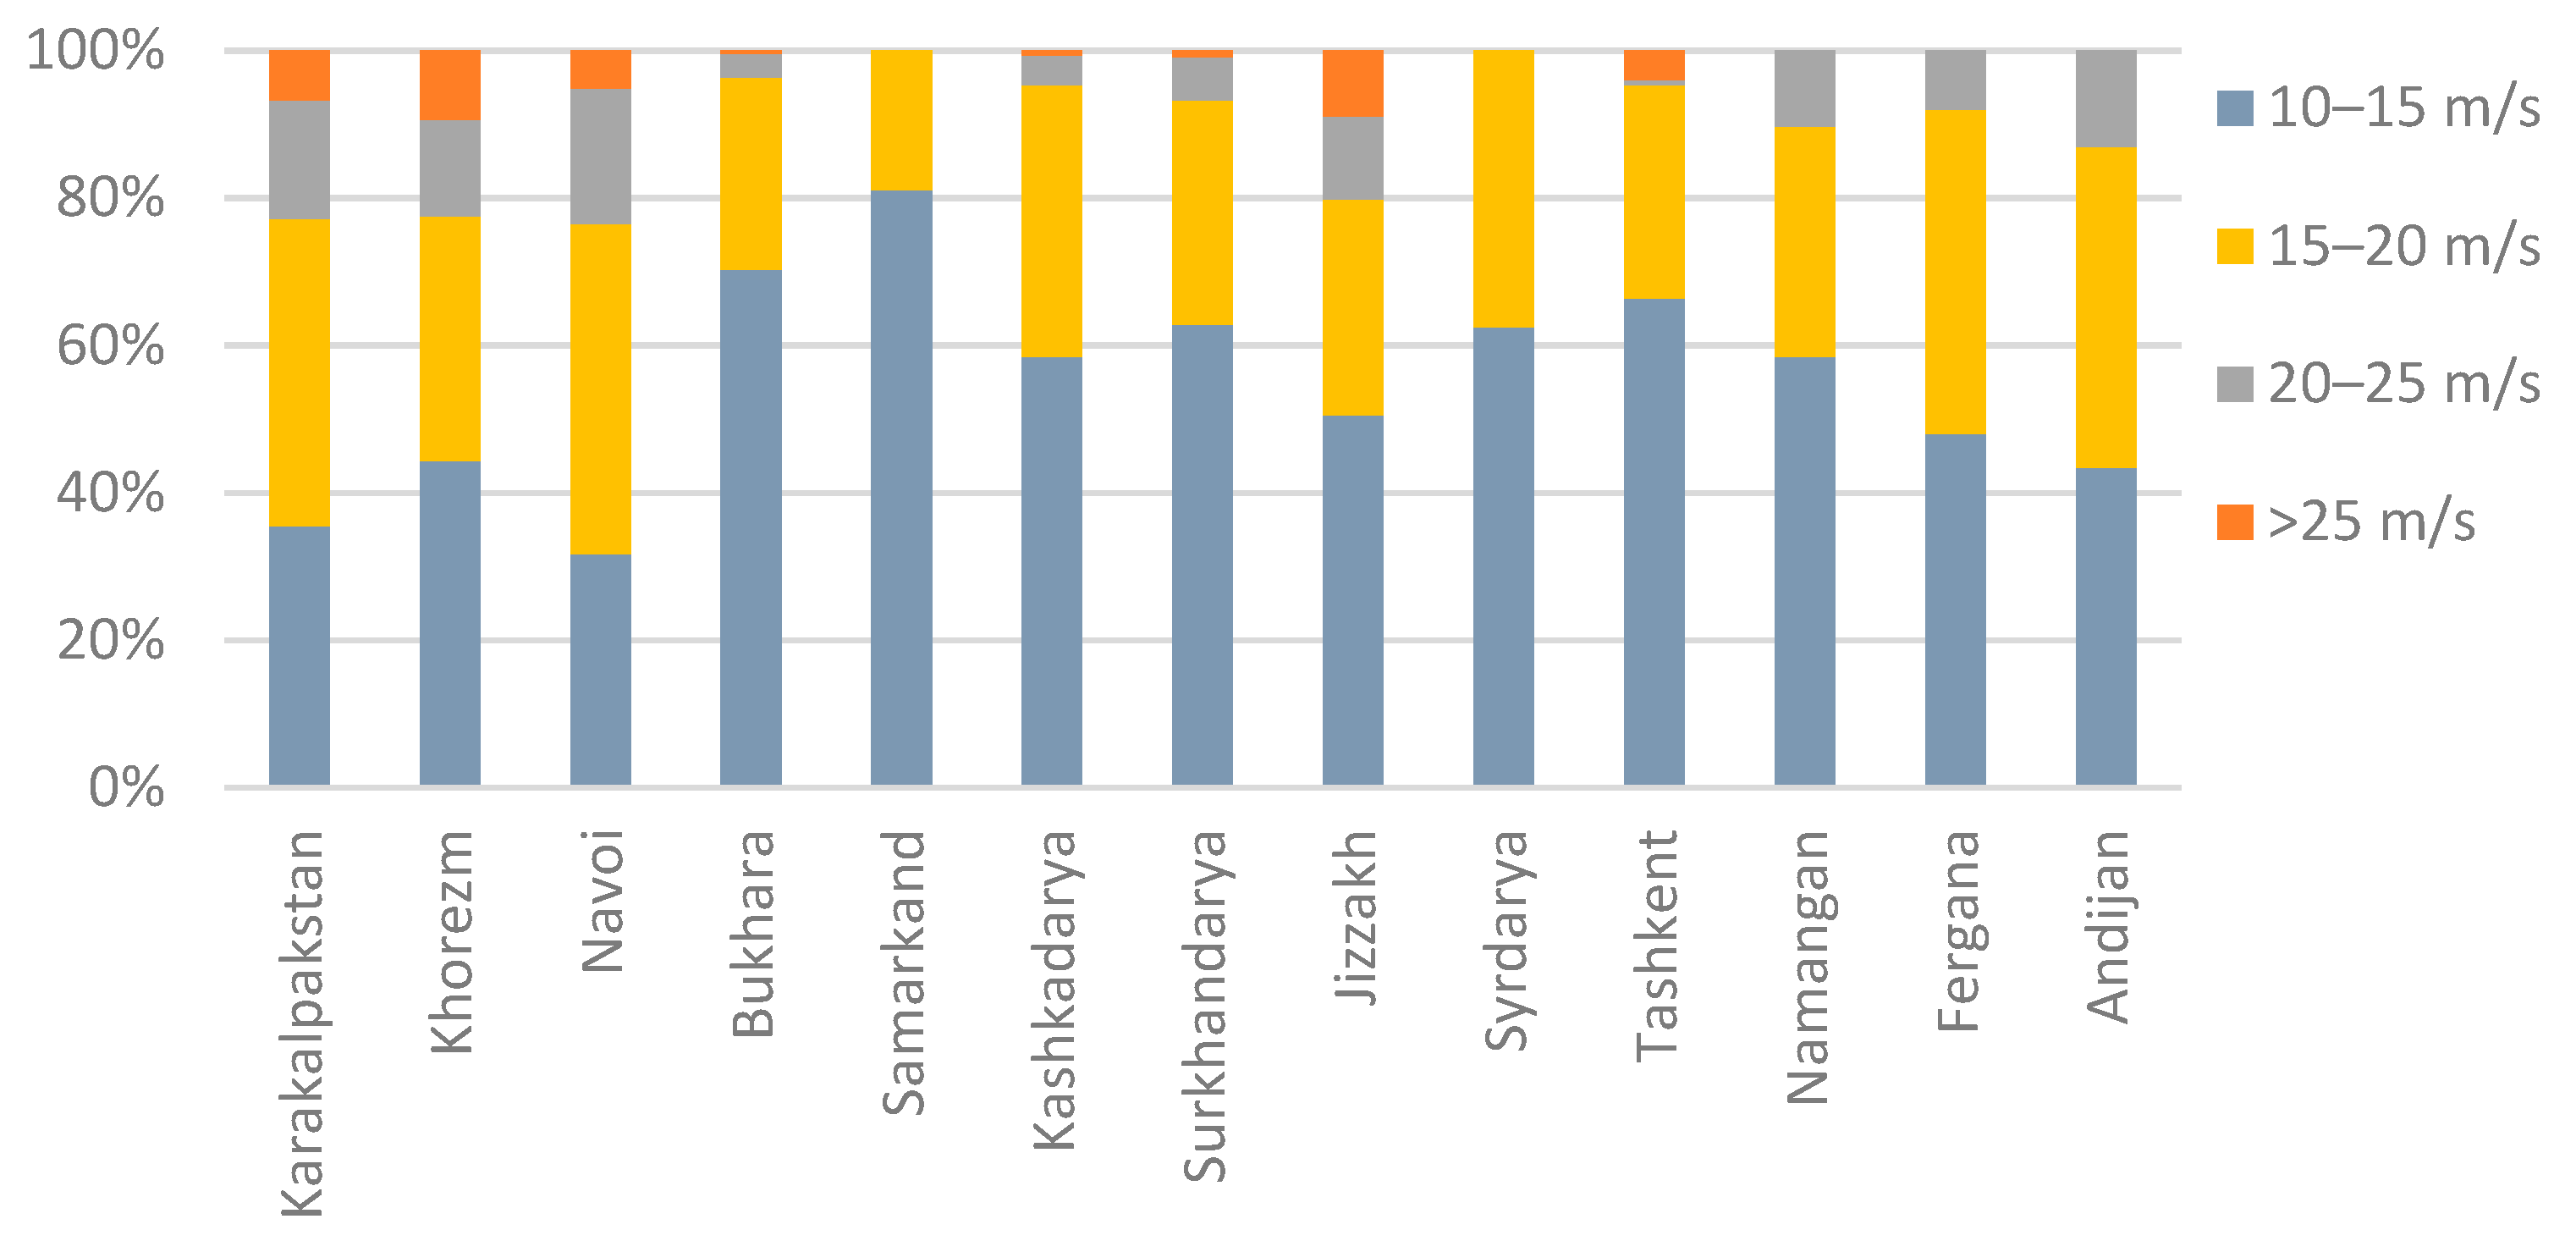
3.3. Analysis of Wind Activity SDS

As confirmed above, wind is the primary factor influencing the characteristics of SDS events. An analysis of wind directions recorded during SDS events in Uzbekistan from 2010 to 2023 led to the construction of wind rose diagrams for the meteorological stations with the highest SDS activity (Figure 10).
The Jaslyk station in Karakalpakstan stands out, with easterly and east–northeasterly winds being the most prevalent (Figure 10a). These winds account for 60 SDS days, which is significantly higher than at other stations in the region. These winds, which transport dust from the Aralkum Desert, dominate the area. In contrast, the Muynak, Takhtakupyr, and Chimbay stations primarily experience northwesterly and northerly winds, with SDS days ranging from 10 to 20. This variation in wind regimes likely results from local climatic and topographical factors. The Tuyamuyun station in Khorezm shows the highest SDS activity, with northeasterly, northerly, and northwesterly winds being dominant, leading to approximately 15 SDS days over the study period (Figure 10b). This suggests dust transport from the Aral Sea and Karakalpakstan. SDS events are less frequent at Urgench and Khiva, with occasional peaks linked to westerly and northwesterly winds.
The Navoi region (Figure 10c) exhibits significant SDS activity at the Buzubay station. North–northeast, west, and east winds prevail there, with north–northeast winds accounting for over 20 SDS days. At Akbaytal, SDS events are primarily associated with westerly winds, whereas southerly winds dominate at Nurata. The Navoi station shows a more evenly distributed wind pattern. These differences reflect the combined influence of regional atmospheric circulation and local geomorphological features on the SDS occurrence. In Bukhara (Figure 10d), the Bukhara station experiences the highest SDS activity, with southerly and northerly winds predominating. The southern sector is especially dominant, with over 60 SDS events, indicating bidirectional dust transport from arid regions. The Karakul station exhibits a similar pattern but with a lower intensity and dominated by southerly and south-southeasterly winds. Ayakagitma station shows minimal dust activity, suggesting a lack of significant SDS events in the area.
In Kashkadarya (Figure 10e), the prevailing wind directions during SDS events are west–northwesterly and easterly. At the Karshi and Mubarek stations, the frequency of SDS events is 15–20 days, likely due to dust advection from the northern and central arid zones. In Karshi, the influence of easterly winds suggests local dust contributions. The Shakhrisabz and Akrabat stations experience minimal SDS activity, with no clear dominant wind direction. The Termez station in Surkhandarya (Figure 10f) records the highest SDS activity, with over 300 days with SDSs, making it the most active location in the country. Westerly and west–southwesterly winds prevail, indicating dust transport from the arid regions of Kashkadarya and adjacent cross-border territories. This consistent unidirectional wind pattern results in a high frequency of SDSs. In contrast, the Sariasia and Denau stations show a much lower SDS activity (up to 12 days), with southerly and westerly winds predominant, particularly in Sariasia.
These findings reveal substantial spatial heterogeneity in wind directions during SDS events across Uzbekistan, with regional and local variations. The highest SDS frequencies are associated with northwesterly, westerly, and southerly winds, reflecting the influence of arid and desert regions as primary sources of dust. Persistent wind patterns in areas likeTermez, Jaslyk, and Bukhara contribute to the frequent occurrence of SDSs, making these regions especially vulnerable to dust-related impacts.
Figure 11 shows the percentage distribution of recorded SDS events in Uzbekistan, categorized by maximum daily wind gusts across different regions. Wind speeds are grouped into four categories: 10–15 m/s, 15–20 m/s, 20–25 m/s, and greater than 25 m/s. The data show that, in most regions, SDS events are primarily linked to wind speeds in the 10–15 and 15–20 m/s ranges. However, regions such as Jizzakh, Khorezm, and Navoi have a relatively higher proportion of events linked to stronger wind gusts in the 20–25 and >25 m/s categories. Conversely, areas such as Syrdarya, Fergana, and Samarkand have a higher concentration of events within the lower wind speed ranges. These findings reveal significant regional variations in SDS intensity, suggesting that certain areas are more vulnerable to stronger wind conditions, which could impact the frequency and severity of SDS events.

4. Discussion

This study highlights that recent advances in data availability, as demonstrated by the ERA5 reanalysis, and the application of machine learning techniques are significantly improving the ability to study SDS formation and dispersion, although these methods require more accurate and consistent measurements of SDS-related parameters. Uzbekistan’s current SDS monitoring infrastructure falls short of modern standards and requires substantial upgrades to effectively support both present and future analytical and forecasting demands. Expanding the automated meteorological station network is critical to improving the country’s observational and analytical capabilities. This expansion should include an increased station density and the installation of advanced sensors for the wind speed and direction, visibility, soil moisture, and aerosol concentration, particularly in high-risk regions such as Karakalpakstan, Surkhandarya, Kashkadarya, and Bukhara, including currently unmonitored areas. This will improve the spatial resolution and understanding of SDS dynamics, providing the basis for evidence-based mitigation.
The standardization and modernization of observation procedures through the implementation of unified methodologies for recording SDS characteristics, such as the intensity, duration, and hazard classification, and the adoption of digital data acquisition systems will significantly improve the data accuracy, interoperability, and timeliness, providing a solid basis for early warning systems. The integration of ground-based observations with reanalysis and satellite data through a centralized platform that merges station records with remote sensing products (e.g., MODIS and TROPOMI) will enable the real-time monitoring of dust sources and transport pathways, facilitating timely warnings and long-range forecasts. These actions are essential to developing an effective early warning and response system for SDSs, enhancing climate resilience in vulnerable regions, and mitigating adverse impacts on public health, agriculture, transportation, and ecosystems through timely detection, accurate forecasting, and evidence-based risk assessments.

5. Conclusions

This study presents a comprehensive spatiotemporal analysis of SDSs across Uzbekistan, based on ground-based meteorological observations from 2010 to 2023. The results reveal a pronounced spatial heterogeneity in dust activity, with the highest number of SDS days observed in the southern (Surkhandarya, Kashkadarya, and Bukhara) and western regions along the Amu Darya River (Khorezm and Karakalpakstan).
The annual average number of SDS days in the most vulnerable areas exceeds 80 days per year (e.g., Termez station), indicating the high recurrence of extreme dust events in specific climatic zones. Approximately 53% of SDS cases were regional in scale, observed simultaneously at two or more stations, while 47% were localized, reflecting a combination of large-scale dust transport and localized emissions driven by wind gusts and surface characteristics.
An intra-annual analysis revealed a clear seasonal pattern, with a peak SDS activity from March to August. This period coincides with the dry season, which is characterized by high temperatures, reduced soil moisture, and intense agricultural activity. These factors increase the surface exposure and susceptibility to deflation. Most SDS events began during daylight hours, especially between 10:00 and 14:00, coinciding with peak surface heating and convection. However, in regions like Karakalpakstan, Kashkadarya, and Surkhandarya, a significant number of events started at night (22:00–06:00), likely due to the transboundary dust transport from neighboring arid areas such as Turkmenistan, Kazakhstan, or Afghanistan. These patterns highlight the combined influence of local meteorology and regional dust transport on SDS activity.
Using ERA5 data, we employed a decision tree regressor to evaluate the relative importance of meteorological and environmental variables influencing SDS activity. This machine learning method predicts a continuous outcome by recursively splitting data to minimize the variance. We found the normalized importance of the top nine features, with the wind direction and mean wind speed emerging as the most influential, followed by the maximum wind speed and soil temperature. The surface solar radiation, top-layer soil moisture, and total precipitation contribute moderately, while the boundary layer height and surface friction velocity show a minimal impact.
Prevailing wind directions associated with SDSs include northwesterly, westerly, and southerly flows, reflecting the dominant influence of arid and desert landscapes as primary dust sources. In several stations, such as Termez, Jaslyk, and Bukhara, persistent wind circulation patterns contribute to the frequent occurrence of SDSs, emphasizing the importance of wind regimes and regional geomorphology in their formation and spread. Most events are linked to maximum daily wind gusts between 10 and 20 m/s, while stronger gusts exceeding 20 m/s are more common in regions such as Jizzakh, Khorezm, and Navoi, indicating a significant regional variation in SDS intensity.
This study highlights the potential of integrating ERA5 reanalysis and machine learning to enhance SDS studies. By modernizing observation infrastructure and standardizing data collection, Uzbekistan can improve SDS monitoring and develop real-time systems, supporting timely warnings and effective mitigation to protect public health, agriculture, and infrastructure.

Author Contributions

Conceptualization, N.R.; Formal analysis, N.R.; Methodology, N.R. and L.S.; Project administration, B.E.N.; Resources, A.A., A.K., V.R. and D.A.B.; Software, N.R. and D.A.B.; Supervision, B.E.N. and D.A.B.; Validation, N.R. and L.S.; Visualization, N.R., D.A.B. and V.R.; Writing—original draft, N.R. and L.S.; Writing—review and editing, N.R., L.S., B.E.N. and D.A.B. All authors have read and agreed to the published version of the manuscript.

Funding

This study was funded by the Agency of Innovative Development under the Ministry of Higher Education, Science and Innovation of the Republic of Uzbekistan (project AL-5721122055), which is implemented within the framework of the Partnership on Scientific and Technological Research for Sustainable Development (SATREPS-Blue Project) between Uzbekistan and Japan.

Institutional Review Board Statement

Not applicable.

Informed Consent Statement

Not applicable.

Data Availability Statement

The sources of the used data are mentioned in the “Methods”. Other generated data and tools are available upon request by any user. All data processing codes were developed using Python and can be made available upon request to the corresponding authors. To request the data from this study, please contact N.R. (natella.rakhmatova@gmail.com) or D.B.A. (d.belikov@chiba-u.jp).

Acknowledgments

We thank the ERA5 teams for producing the datasets used in this research.

Conflicts of Interest

The authors declare no conflicts of interest.

References

  1. Middleton, N.; Kang, U. Sand and Dust Storms: Impact Mitigation. Sustain. Sci. Pract. Policy 2017, 9, 1053. [Google Scholar] [CrossRef]
  2. Middleton, N.; Tozer, P.; Tozer, B. Sand and Dust Storms: Underrated Natural Hazards. Disasters 2019, 43, 390–409. [Google Scholar] [CrossRef] [PubMed]
  3. Jiao, P.; Wang, J.; Chen, X.; Ruan, J.; Ye, X.; Alavi, A.H. Next-Generation Remote Sensing and Prediction of Sand and Dust Storms: State-of-the-Art and Future Trends. Int. J. Remote Sens. 2021, 42, 5277–5316. [Google Scholar] [CrossRef]
  4. Khromov, S.P.; Mamontova, L.I. Meteorological Dictionary; Gidrometeoizdat: Leningrad, Russia, 1974. [Google Scholar]
  5. Leukhina, G.; Lyapina, O.; Veremeeva, T. Climate of Uzbekistan; SANIGMI: Tashkent, Uzbekistan, 1996. [Google Scholar]
  6. UNCCD. Policy Advocacy Framework for Sand and Dust Storms. In Draft Advocacy Policy Frameworks: Gender, Drought, and Sand and Dust Storms, ICCD/COP(13)/19, Proceedings of the Conference of the Parties, Thirteenth Session, Item 3 (d) of the Provisional Agenda, Ordos, China, 6–16 September 2017; UNCCD: Bonn, Germany, 2017. [Google Scholar]
  7. Indoitu, R.; Orlovsky, L.; Orlovsky, N. Dust Storms in Central Asia: Spatial and Temporal Variations. J. Arid Environ. 2012, 85, 62–70. [Google Scholar] [CrossRef]
  8. Youlin, Y.; Squires, V.; Qi, L. Global Alarm: Dust and Sandstorms from the World’s Drylands; United Nations Convention to Combat Desertification (UNCCD): Bonn, Germany, 2002. [Google Scholar]
  9. Nishonov, B.E.; Kholmatjanov, B.M.; Labzovskii, L.D.; Rakhmatova, N.; Shardakova, L.; Abdulakhatov, E.I.; Yarashev, D.U.; Toderich, K.N.; Khujanazarov, T.; Belikov, D.A. Study of the strongest dust storm occurred in Uzbekistan in November 2021. Sci. Rep. 2023, 13, 20042. [Google Scholar] [CrossRef]
  10. Middleton, N.J. Desert Dust Hazards: A Global Review. Aeolian Res. 2017, 24, 53–63. [Google Scholar] [CrossRef]
  11. UNCCD. Sand and Dust Storms Compendium: Information and Guidance on Assessing and Addressing the Risks; United Nations Convention to Combat Desertification (UNCCD): Bonn, Germany, 2022. [Google Scholar]
  12. UNEP; WMO; UNCCD. Global Assessment of Sand and Dust Storms; United Nations Environment Programme: Nairobi, Kenya, 2016. [Google Scholar]
  13. Goudie, A.S. Desert Dust and Human Health Disorders. Environ. Int. 2014, 63, 101–113. [Google Scholar] [CrossRef] [PubMed]
  14. Ravi, S.; D’Odorico, P.; Breshears, D.D.; Field, J.P.; Goudie, A.S.; Huxman, T.E.; Li, J.; Okin, G.S.; Swap, R.J.; Thomas, A.D.; et al. Aeolian Processes and the Biosphere. Rev. Geophys. 2011, 49, RG3001. [Google Scholar] [CrossRef]
  15. Goudie, A.S.; Middleton, N.J. Desert Dust in the Global System; Springer Science & Business Media: Berlin/Heidelberg, Germany, 2006; ISBN 9783540323556. [Google Scholar]
  16. Chen, Z.; Gao, X.; Lei, J. Dust Emission and Transport in the Aral Sea Region. Geoderma 2022, 428, 116177. [Google Scholar] [CrossRef]
  17. Shardakova, L.; Akhmedova, A.; Rakhmatova, N.; Nishonov, B. Analysis of Dust Storms in Surkhandarya Region Based on Ground Observation Data. Hydrometeorol. Environ. Monit. 2024, 3, 88–99. [Google Scholar]
  18. Shardakova, L.Y.; Akhmedova, A.R.; Rakhmatova, N.I.; Nishonov, B.E. Spatiotemporal Analysis of Dust Storms in the Aral Sea Region for 2010-2021. Hydrometeorol. Environ. Monit. 2022, 4, 90–99. [Google Scholar]
  19. Romanov, N.N. Dust Storms in Central Asia; SamGU: Tashkent, Uzbekistan, 1960. [Google Scholar]
  20. Sapozhnikova, S.A. Map-Scheme of the Number of Days with Dust Storms in the Southern Zone of the USSR and in the Adjacent Territories. Tr. Nauchno-Issledovatelskogo Instituta Aeroklimatologii 1970, 65, 61–68. [Google Scholar]
  21. Chirkov, Y.I. Recurrence of Dust Storms in the Territory of the USSR and the Possibility of Predicting Their Occurrence. Proc. USSR Hydrometeorol. Cent. 1970, 69, 109–119. [Google Scholar]
  22. Shardakova, L.Y.; Usmanova, L.V. Analysis of Dust Storms in the Aral Sea Region. Probl. Desert Dev. 2006, 3, 30–34. [Google Scholar]
  23. Shao, Y.; Dong, C.H. A Review on East Asian Dust Storm Climate, Modelling and Monitoring. Glob. Planet. Change 2006, 52, 1–22. [Google Scholar] [CrossRef]
  24. Shen, H.; Abuduwaili, J.; Samat, A.; Ma, L. A Review on the Research of Modern Aeolian Dust in Central Asia. Arab. J. Geosci. 2016, 9, 625. [Google Scholar] [CrossRef]
  25. Zhang, X.-X.; Claiborn, C.; Lei, J.-Q.; Vaughan, J.; Wu, S.-X.; Li, S.-Y.; Liu, L.-Y.; Wang, Z.-F.; Wang, Y.-D.; Huang, S.-Y.; et al. Aeolian Dust in Central Asia: Spatial Distribution and Temporal Variability. Atmos. Environ. 2020, 238, 117734. [Google Scholar] [CrossRef]
  26. Wang, W.; Samat, A.; Abuduwaili, J.; Ge, Y.; De Maeyer, P.; Van de Voorde, T. Temporal Characterization of Sand and Dust Storm Activity and Its Climatic and Terrestrial Drivers in the Aral Sea Region. Atmos. Res. 2022, 275, 106242. [Google Scholar] [CrossRef]
  27. Wang, W.; Samat, A.; Abuduwaili, J.; De Maeyer, P.; Van de Voorde, T. Machine Learning-Based Prediction of Sand and Dust Storm Sources in Arid Central Asia. Int. J. Digit. Earth 2023, 16, 1530–1550. [Google Scholar] [CrossRef]
  28. Nobakht, M.; Shahgedanova, M.; White, K. New Inventory of Dust Emission Sources in Central Asia and Northwestern China Derived from MODIS Imagery Using Dust Enhancement Technique. J. Geophys. Res. 2021, 126, e2020JD033382. [Google Scholar] [CrossRef]
  29. Hersbach, H.; Bell, B.; Berrisford, P.; Hirahara, S.; Horányi, A.; Muñoz-Sabater, J.; Nicolas, J.; Peubey, C.; Radu, R.; Schepers, D.; et al. The ERA5 Global Reanalysis. Quart. J. Roy. Meteor. Soc. 2020, 146, 1999–2049. [Google Scholar] [CrossRef]
  30. Soci, C.; Hersbach, H.; Simmons, A.; Poli, P.; Bell, B.; Berrisford, P.; Horányi, A.; Muñoz-Sabater, J.; Nicolas, J.; Radu, R.; et al. The ERA5 Global Reanalysis from 1940 to 2022. Q. J. R. Meteorol. Soc. 2024, 150, 4014–4048. [Google Scholar] [CrossRef]
  31. Wang, N.; Chen, J.; Zhang, Y.; Xu, Y.; Yu, W. The Spatiotemporal Characteristics and Driving Factors of Dust Emissions in East Asia (2000–2021). Remote Sens 2023, 15, 410. [Google Scholar] [CrossRef]
  32. Wang, W.; He, S.; Guo, H.; Abuduwaili, J.; Samat, A.; De Maeyer, P.; Van de Voorde, T. Sand and Dust Storm Risk Assessment in Arid Central Asia: Implications for the Environment, Society, and Agriculture. Int. J. Disaster Risk Sci. 2024, 15, 703–718. [Google Scholar] [CrossRef]
  33. Alshammari, R.K.; Alrwais, O.; Aksoy, M.S. Machine Learning Forecast of Dust Storm Frequency in Saudi Arabia Using Multiple Features. Atmos 2024, 15, 520. [Google Scholar] [CrossRef]
  34. Alshammari, R.K.; Alrwais, O.; Aksoy, M.S. Machine Learning Applications to Dust Storms: A Meta-Analysis. Aerosol Air Qual. Res. 2022, 22, 220183. [Google Scholar] [CrossRef]
  35. Mutawa, A.; Alshaibani, A.; Almatar, L.A. A Comprehensive Review of Dust Storm Detection and Prediction Techniques: Leveraging Satellite Data, Ground Observations, and Machine Learning. IEEE Access 2025, 13, 39694–39710. [Google Scholar] [CrossRef]
  36. Du, S.; Chen, S.; Cheng, S.; He, J.; Zhao, D.; Zhu, X.; Lian, L.; Tu, X.; Zhao, Q.; Zhang, Y. Dust Storm Detection for Ground-Based Stations with Imbalanced Machine Learning. Environ. Model. Softw. 2025, 188, 106420. [Google Scholar] [CrossRef]
  37. UzHydromet. The Fourth National Communication of the Republic of Uzbekistan to the UN Framework Convention on Climate Change; UzHydromet: Tashkent, Uzbekistan, 2024. [Google Scholar]
  38. Federal Service for Hydrometeorology and Environmental Monitoring (Roshydromet) Code for Operational Transmission of Surface Meteorological Observation Data from the Roshydromet Station Network (KN-01 SYNOP). 2013. Available online: https://meteoinfo.ru/images/media/books-docs/RHM/kn-01-synop.pdf (accessed on 20 June 2025).
  39. Bespalov, D.P.; Gorodetskiy, O.A. Manual for Hydrometeorological Stations and Posts; Meteorological Observations at Stations; Patr-1. State Committee of the USSR for Hydrometeorology and Environmental Monitoring; Gidrometeoizdat: Leningrad, Russia, 1985. [Google Scholar]
  40. WMO. Guide to Meteorological Instruments and Methods of Observation; WMO: Geneva, Switzerland, 2017. [Google Scholar]
  41. Kurosaki, Y.; Mikami, M. Threshold Wind Speed for Dust Emission in East Asia and Its Seasonal Variations. J. Geophys. Res. 2007, 112, D17202. [Google Scholar] [CrossRef]
  42. Rakhmatova, N.; Arushanov, M.; Shardakova, L. Evaluation of the Perspective of ERA-Interim and ERA5 Reanalyses for Calculation of Drought Indicators for Uzbekistan. Atmosphere 2021, 12, 527. [Google Scholar] [CrossRef]
  43. Wu, X.; Wu, C.; Lin, Z.; Yang, M. Intra-Seasonal Variations of Dust Activity over East Asia in Spring 2023 and Their Mechanisms. Glob. Planet. Change 2025, 244, 104638. [Google Scholar] [CrossRef]
  44. Shinoda, M.; Gillies, J.A.; Mikami, M.; Shao, Y. Temperate Grasslands as a Dust Source: Knowledge, Uncertainties, and Challenges. Aeolian Res. 2011, 3, 271–293. [Google Scholar] [CrossRef]
  45. Kok, J.F.; Parteli, E.J.R.; Michaels, T.I.; Karam, D.B. The Physics of Wind-Blown Sand and Dust. Rep. Prog. Phys. 2012, 75, 106901. [Google Scholar] [CrossRef] [PubMed]
  46. Marticorena, B.; Bergametti, G. Modeling the Atmospheric Dust Cycle: 1. Design of a Soil-derived Dust Emission Scheme. J. Geophys. Res. 1995, 100, 16415–16430. [Google Scholar] [CrossRef]
  47. Fécan, F.; Marticorena, B.; Bergametti, G. Parametrization of the Increase of the Aeolian Erosion Threshold Wind Friction Velocity Due to Soil Moisture for Arid and Semi-Arid Areas. Ann. Geophys. 1999, 17, 149–157. [Google Scholar] [CrossRef]
  48. Kok, J.F. A Scaling Theory for the Size Distribution of Emitted Dust Aerosols Suggests Climate Models Underestimate the Size of the Global Dust Cycle. Proc. Natl. Acad. Sci. USA 2011, 108, 1016–1021. [Google Scholar] [CrossRef]
  49. Sun, J.; Zhang, M.; Liu, T. Spatial and Temporal Characteristics of Dust Storms in China and Its Surrounding Regions, 1960–1999: Relations to Source Area and Climate. J. Geophys. Res. 2001, 106, 10325–10333. [Google Scholar] [CrossRef]
  50. Su, L.; Toon, O.B. Saharan and Asian Dust: Similarities and Differences Determined by CALIPSO, AERONET, and a Coupled Climate-Aerosol Microphysical Model. Atmos. Chem. Phys. 2011, 11, 3263–3280. [Google Scholar] [CrossRef]
  51. Pedregosa, F.; Varoquaux, G.; Gramfort, A.; Michel, V.; Thirion, B.; Grisel, O.; Duchesnay, E. Scikit-Learn: Machine Learning in Python. J. Mach. Learn. Res. 2011, 12, 2825–2830. [Google Scholar]
Figure 1. The landscape of the study domain. The regions of Uzbekistan are shown by number, ordered from west to east (see legend).
Atmosphere 16 00782 g001
Figure 2. The regional distribution of the average annual number of SDS days in Uzbekistan from 2010 to 2023.
Atmosphere 16 00782 g002
Figure 3. Regional dynamics of the annual number of SDS days across Uzbekistan from 2010 to 2023. The bar chart shows yearly totals for nine administrative regions: Karakalpakstan, Khorezm, Navoiy, Bukhara, Kashkadarya, Surkhandarya, Jizzakh, Namangan, and Andijan.
Atmosphere 16 00782 g003
Figure 4. The distribution of the average annual number of SDS days recorded at meteorological stations across Uzbekistan from 2010 to 2023.
Atmosphere 16 00782 g004
Figure 5. The proportion of SDS events observed at a single versus multiple meteorological stations across Uzbekistan from 2010 to 2023.
Atmosphere 16 00782 g005
Figure 6. The distribution of recorded SDS events (%) by duration (in hours) and regions in Uzbekistan, from 2010 to 2023. The horizontal stacked bar chart shows the percentage breakdown of SDS event durations, categorized into six classes: 1–2 h, 3–5 h, 6–10 h, 11–15 h, and greater than 15 h. Each bar represents the total number of SDS events in a given region, with colored segments indicating the proportion of events falling into each duration category.
Atmosphere 16 00782 g006
Figure 7. Distribution of recorded SDS event start times (%) by hourly intervals and regions in Uzbekistan from 2010 to 2023.
Atmosphere 16 00782 g007
Figure 8. Monthly distribution of total SDS days across regions of Uzbekistan from 2010 to 2023. Meteorological conditions favorable for SDS formation.
Atmosphere 16 00782 g008
Figure 9. Feature importance scores for meteorological and environmental variables derived from a decision tree regressor. Abbreviations: WD—Wind Direction, WS mean—Mean Wind Speed, WS max—Maximum Wind Speed, STL1—Soil Temperature Level 1, SSR—Surface Solar Radiation, SWVL1—Soil Water Volumetric Content Level 1, TP—Total Precipitation, BLH—Boundary Layer Height, and ZUST—Friction Velocity. The importance values reflect the relative contribution of each feature to the prediction accuracy of the model.
Atmosphere 16 00782 g009
Figure 10. Histogram of wind directions during SDS events observed at meteorological stations across regions of Uzbekistan from 2010 to 2023.
Atmosphere 16 00782 g010
Figure 11. Distribution of recorded SDS events (%) by maximum daily wind gust ranges across regions of Uzbekistan from 2010 to 2023.
Atmosphere 16 00782 g011
Disclaimer/Publisher’s Note: The statements, opinions and data contained in all publications are solely those of the individual author(s) and contributor(s) and not of MDPI and/or the editor(s). MDPI and/or the editor(s) disclaim responsibility for any injury to people or property resulting from any ideas, methods, instructions or products referred to in the content.

