1. Introduction
Air pollution continues to be one of the most significant environmental challenges globally, posing serious threats to public health, ecosystems, and climate stability. The impacts of air pollution are particularly pronounced in urban areas, where high population density, rapid industrialization, and increasing transportation contribute to the concentration of harmful pollutants. Urbanization, coupled with climate change, has further intensified the severity of air pollution in these regions, complicating efforts to regulate emissions and improve air quality. In East Asia, regions experiencing rapid economic development and urban expansion, such as Beijing and Seoul, are facing some of the highest levels of air pollution globally. These cities have long struggled with elevated concentrations of pollutants, including particulate matter (PM2.5, PM10), nitrogen dioxide (NO
2), sulfur dioxide (SO
2), carbon monoxide (CO), and ozone (O
3), all of which have been linked to a range of severe health problems, including respiratory and cardiovascular diseases [
1,
2]. Additionally, these pollutants contribute to environmental degradation, including reduced visibility, ecosystem disruption, and negative effects on climate change [
3].
In Beijing, the continued reliance on coal for residential heating during the winter months exacerbates pollution levels, particularly fine particulate matter (PM2.5), which tends to peak during the heating season. In addition to coal usage, Beijing’s industrial sector continues to contribute significantly to PM2.5 and PM10 emissions [
4]. These pollutants have been directly linked to public health concerns, with studies showing a correlation between high pollution levels and increased rates of respiratory diseases, such as asthma and chronic bronchitis, as well as cardiovascular problems, including heart attacks and strokes [
5]. Despite efforts to reduce pollution through policy changes and technological advancements, Beijing still faces challenges in mitigating these risks, especially during colder months when coal usage spikes [
6]. Furthermore, the city’s rapidly expanding transportation infrastructure continues to contribute significantly to PM2.5 and NO
2 emissions, which have been exacerbated by population growth and urban expansion [
7].
Seoul, South Korea, similarly faces significant air quality challenges, though its pollution sources differ somewhat from those in Beijing. While Seoul has made significant strides in reducing industrial emissions, vehicular emissions, particularly from diesel-powered vehicles, continue to be the dominant source of pollution. In addition, Seoul is heavily affected by transboundary pollution, primarily dust storms originating from northern China, which exacerbate particulate pollution during the spring [
8]. Seoul is significantly affected by transboundary pollution, particularly dust storms originating from northern China. Dust storms exacerbate particulate pollution during the spring months, contributing to elevated PM2.5 concentrations. Seasonal variations further complicate air quality management, with higher concentrations of pollutants, including NO
2 and O
3, during the warmer months. The increase in ozone (O
3) concentrations in Seoul, particularly during the summer, is also influenced by photochemical reactions, which are intensified by higher traffic emissions and increased sunlight [
9]. Despite measures aimed at reducing emissions from vehicles and promoting cleaner energy alternatives, air quality improvements in Seoul have been slower compared to Beijing, largely due to the city’s continued struggle with vehicular emissions and the seasonal effects of dust storms [
10]. In addition, the presence of urban heat islands has further compounded the problem of ozone formation during the warmer months, which exacerbates air quality challenges [
11].
Given the complexity of air pollution dynamics in both cities, understanding the factors that drive long-term pollution trends and seasonal variations is critical for effective policy development. Meteorological influences, such as temperature inversions and vertical convection, also play a significant role in pollutant concentrations, especially in Seoul, where higher ozone levels are observed during the summer months. In contrast, Beijing’s pollution levels are more significantly influenced by the continued use of coal during the winter months, exacerbated by meteorological conditions that prevent pollutant dispersion [
12]. Recent studies have also pointed to the combined effects of urbanization and climate change in exacerbating the long-term trends of PM2.5 and ozone concentrations in both cities [
13]. This study provides a comparative analysis of air pollution in Beijing and Seoul, focusing on the long-term trends of key pollutants, seasonal variations, and their health and environmental impacts. Additionally, the study examines the effectiveness of air quality management policies in each city and emphasizes the need for region-specific strategies that address both local and transboundary pollution sources. The findings of this study will contribute to the broader understanding of air pollution challenges in East Asia and inform the development of more effective air quality management strategies in rapidly urbanizing regions [
14].
3. Result
3.1. Overview of Air Pollution Trends in Beijing and Seoul
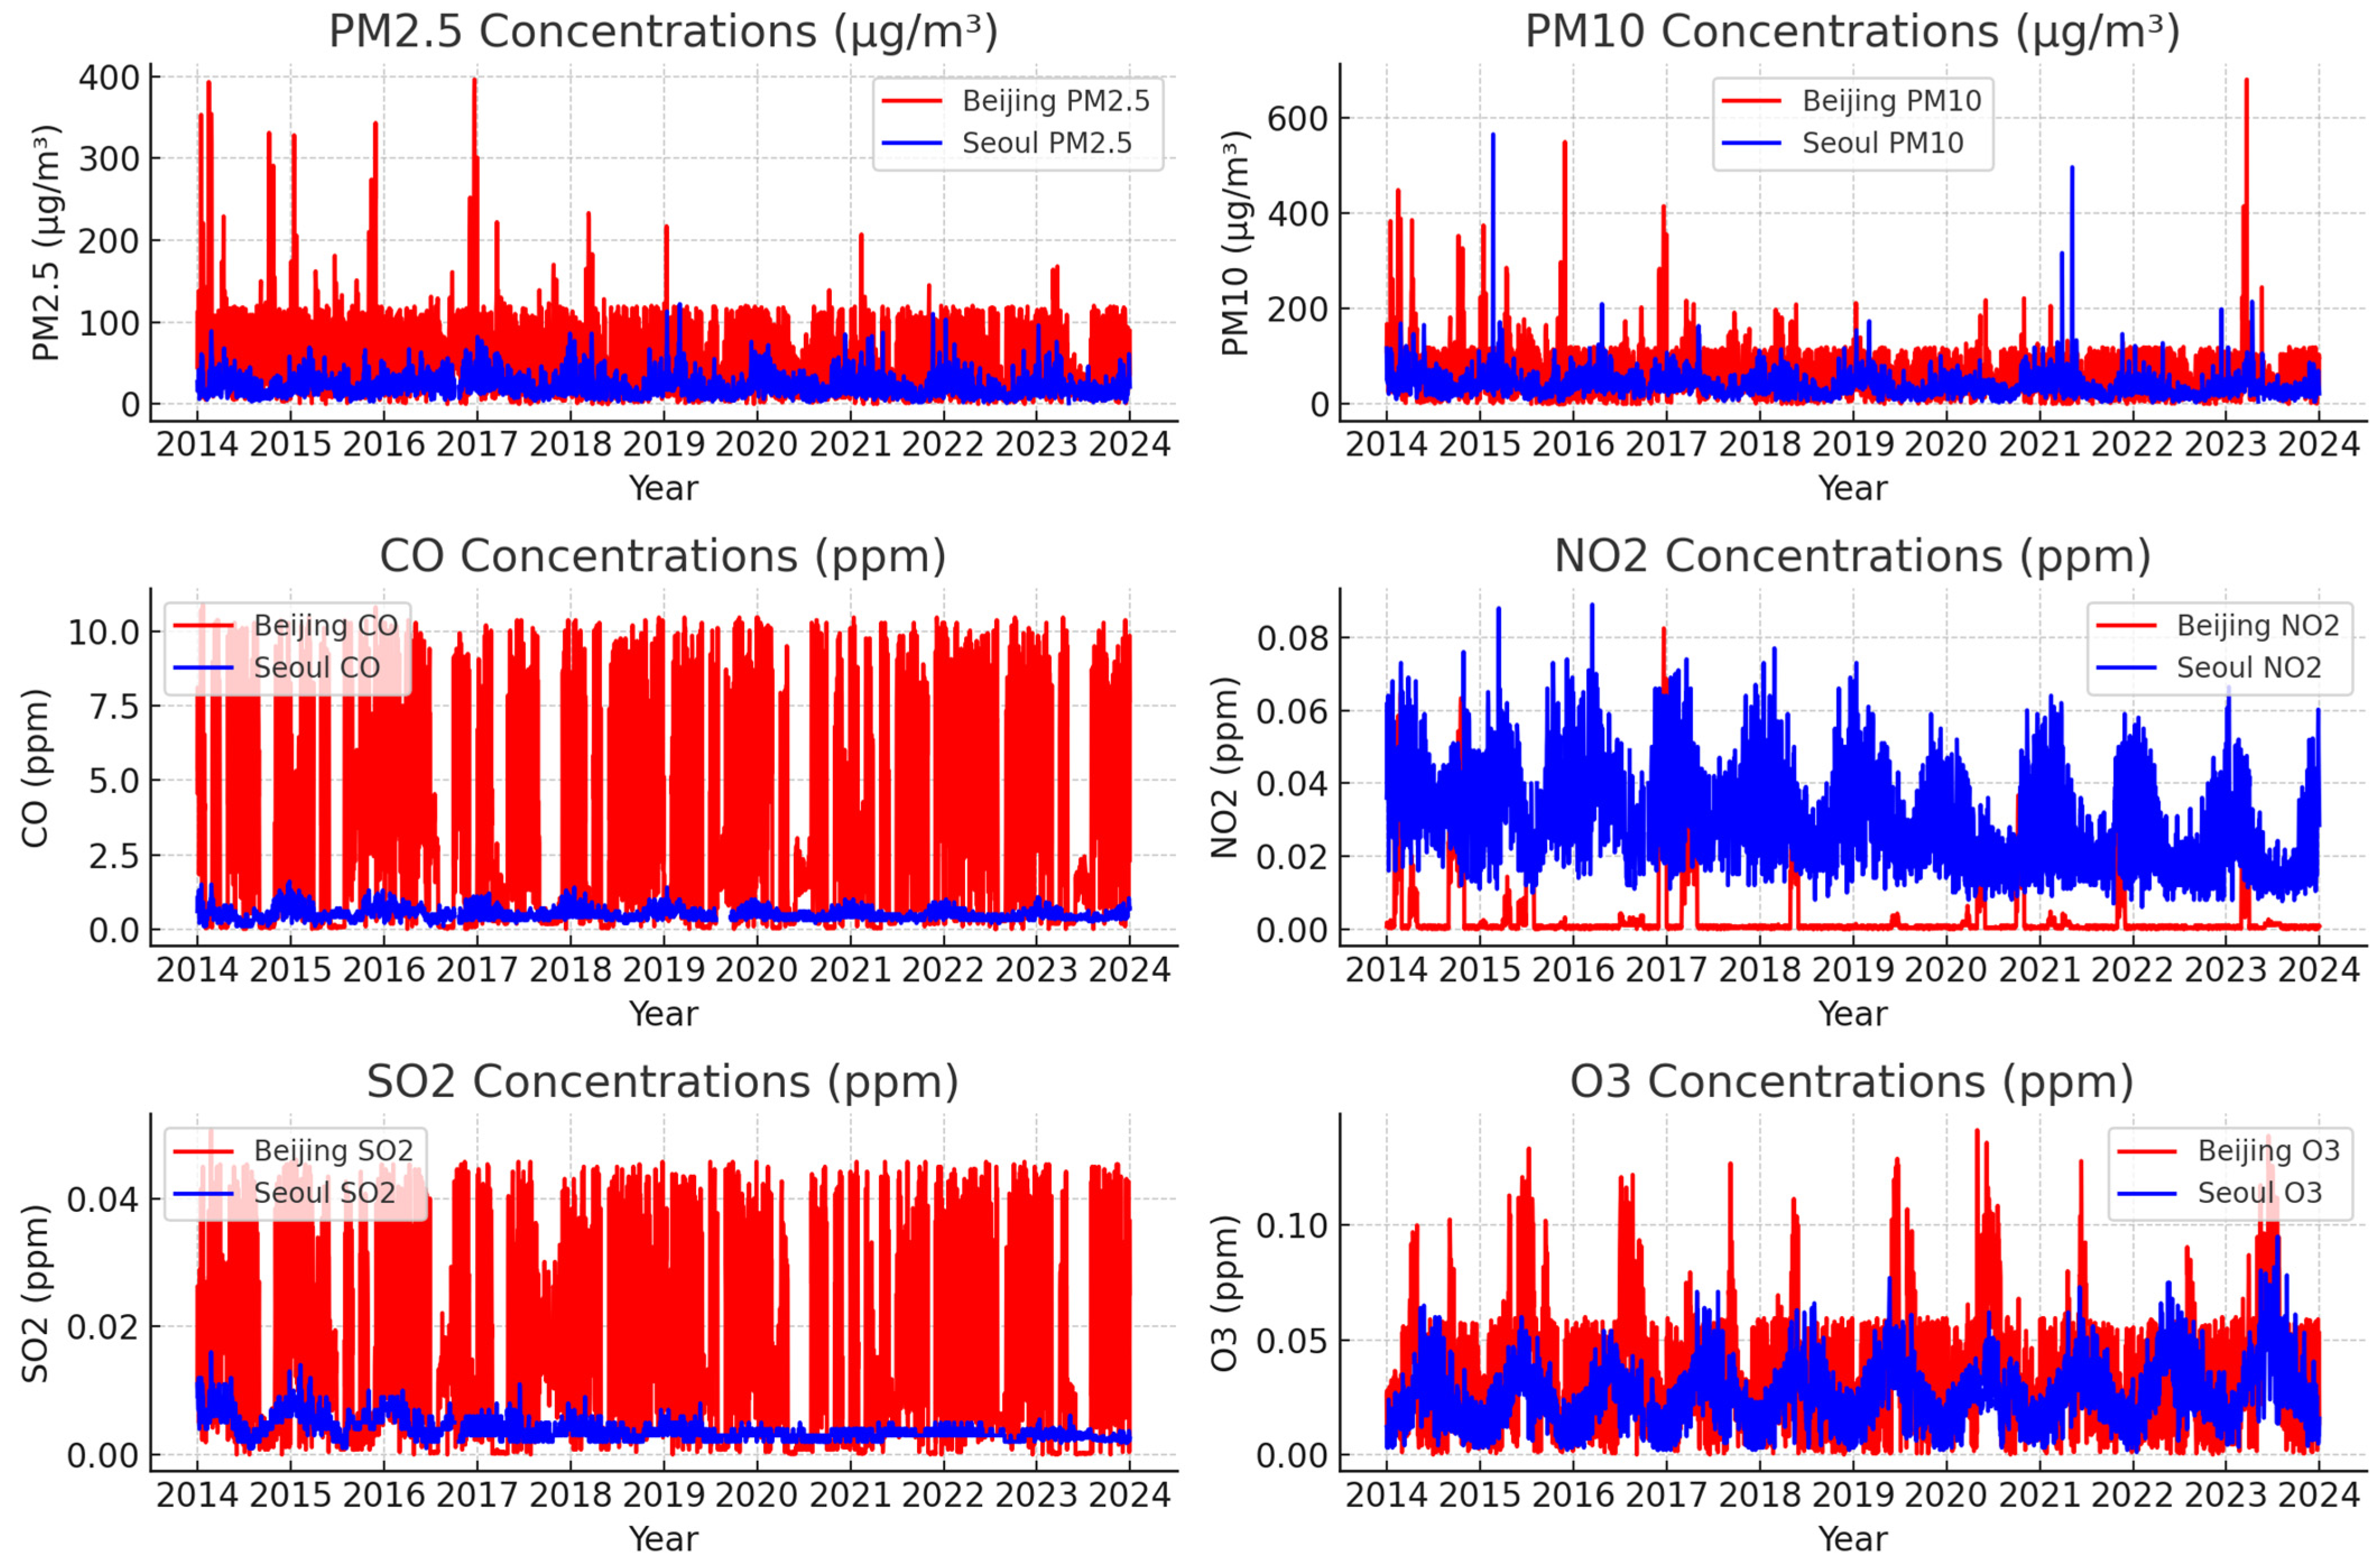
The analysis of air quality data from 2014 to 2024 revealed significant long-term trends in the concentration of key pollutants in both Beijing and Seoul. In Beijing, PM2.5 levels tend to peak in the winter months due to heating-related emissions, particularly from coal burning. [
16] highlighted that coal combustion for residential heating is the primary driver of these pollution peaks. On the other hand, in Seoul, vehicular emissions, especially from diesel vehicles, have been found to contribute significantly to PM2.5 and NO
2 levels, particularly during winter months when traffic is more intense due to heating demands [
17].
Figure 1 illustrates this seasonal trend, with PM2.5 levels consistently peaking in December and January, coinciding with the winter heating season. As shown in
Table 1, the annual average concentrations of PM2.5 in Beijing are considerably higher than the [
18] recommended levels, with winter months consistently exceeding the permissible limits by a significant margin. The elevated levels are strongly correlated with the use of coal for heating, along with local industrial emissions, which exacerbate the concentrations of particulate matter (PM).
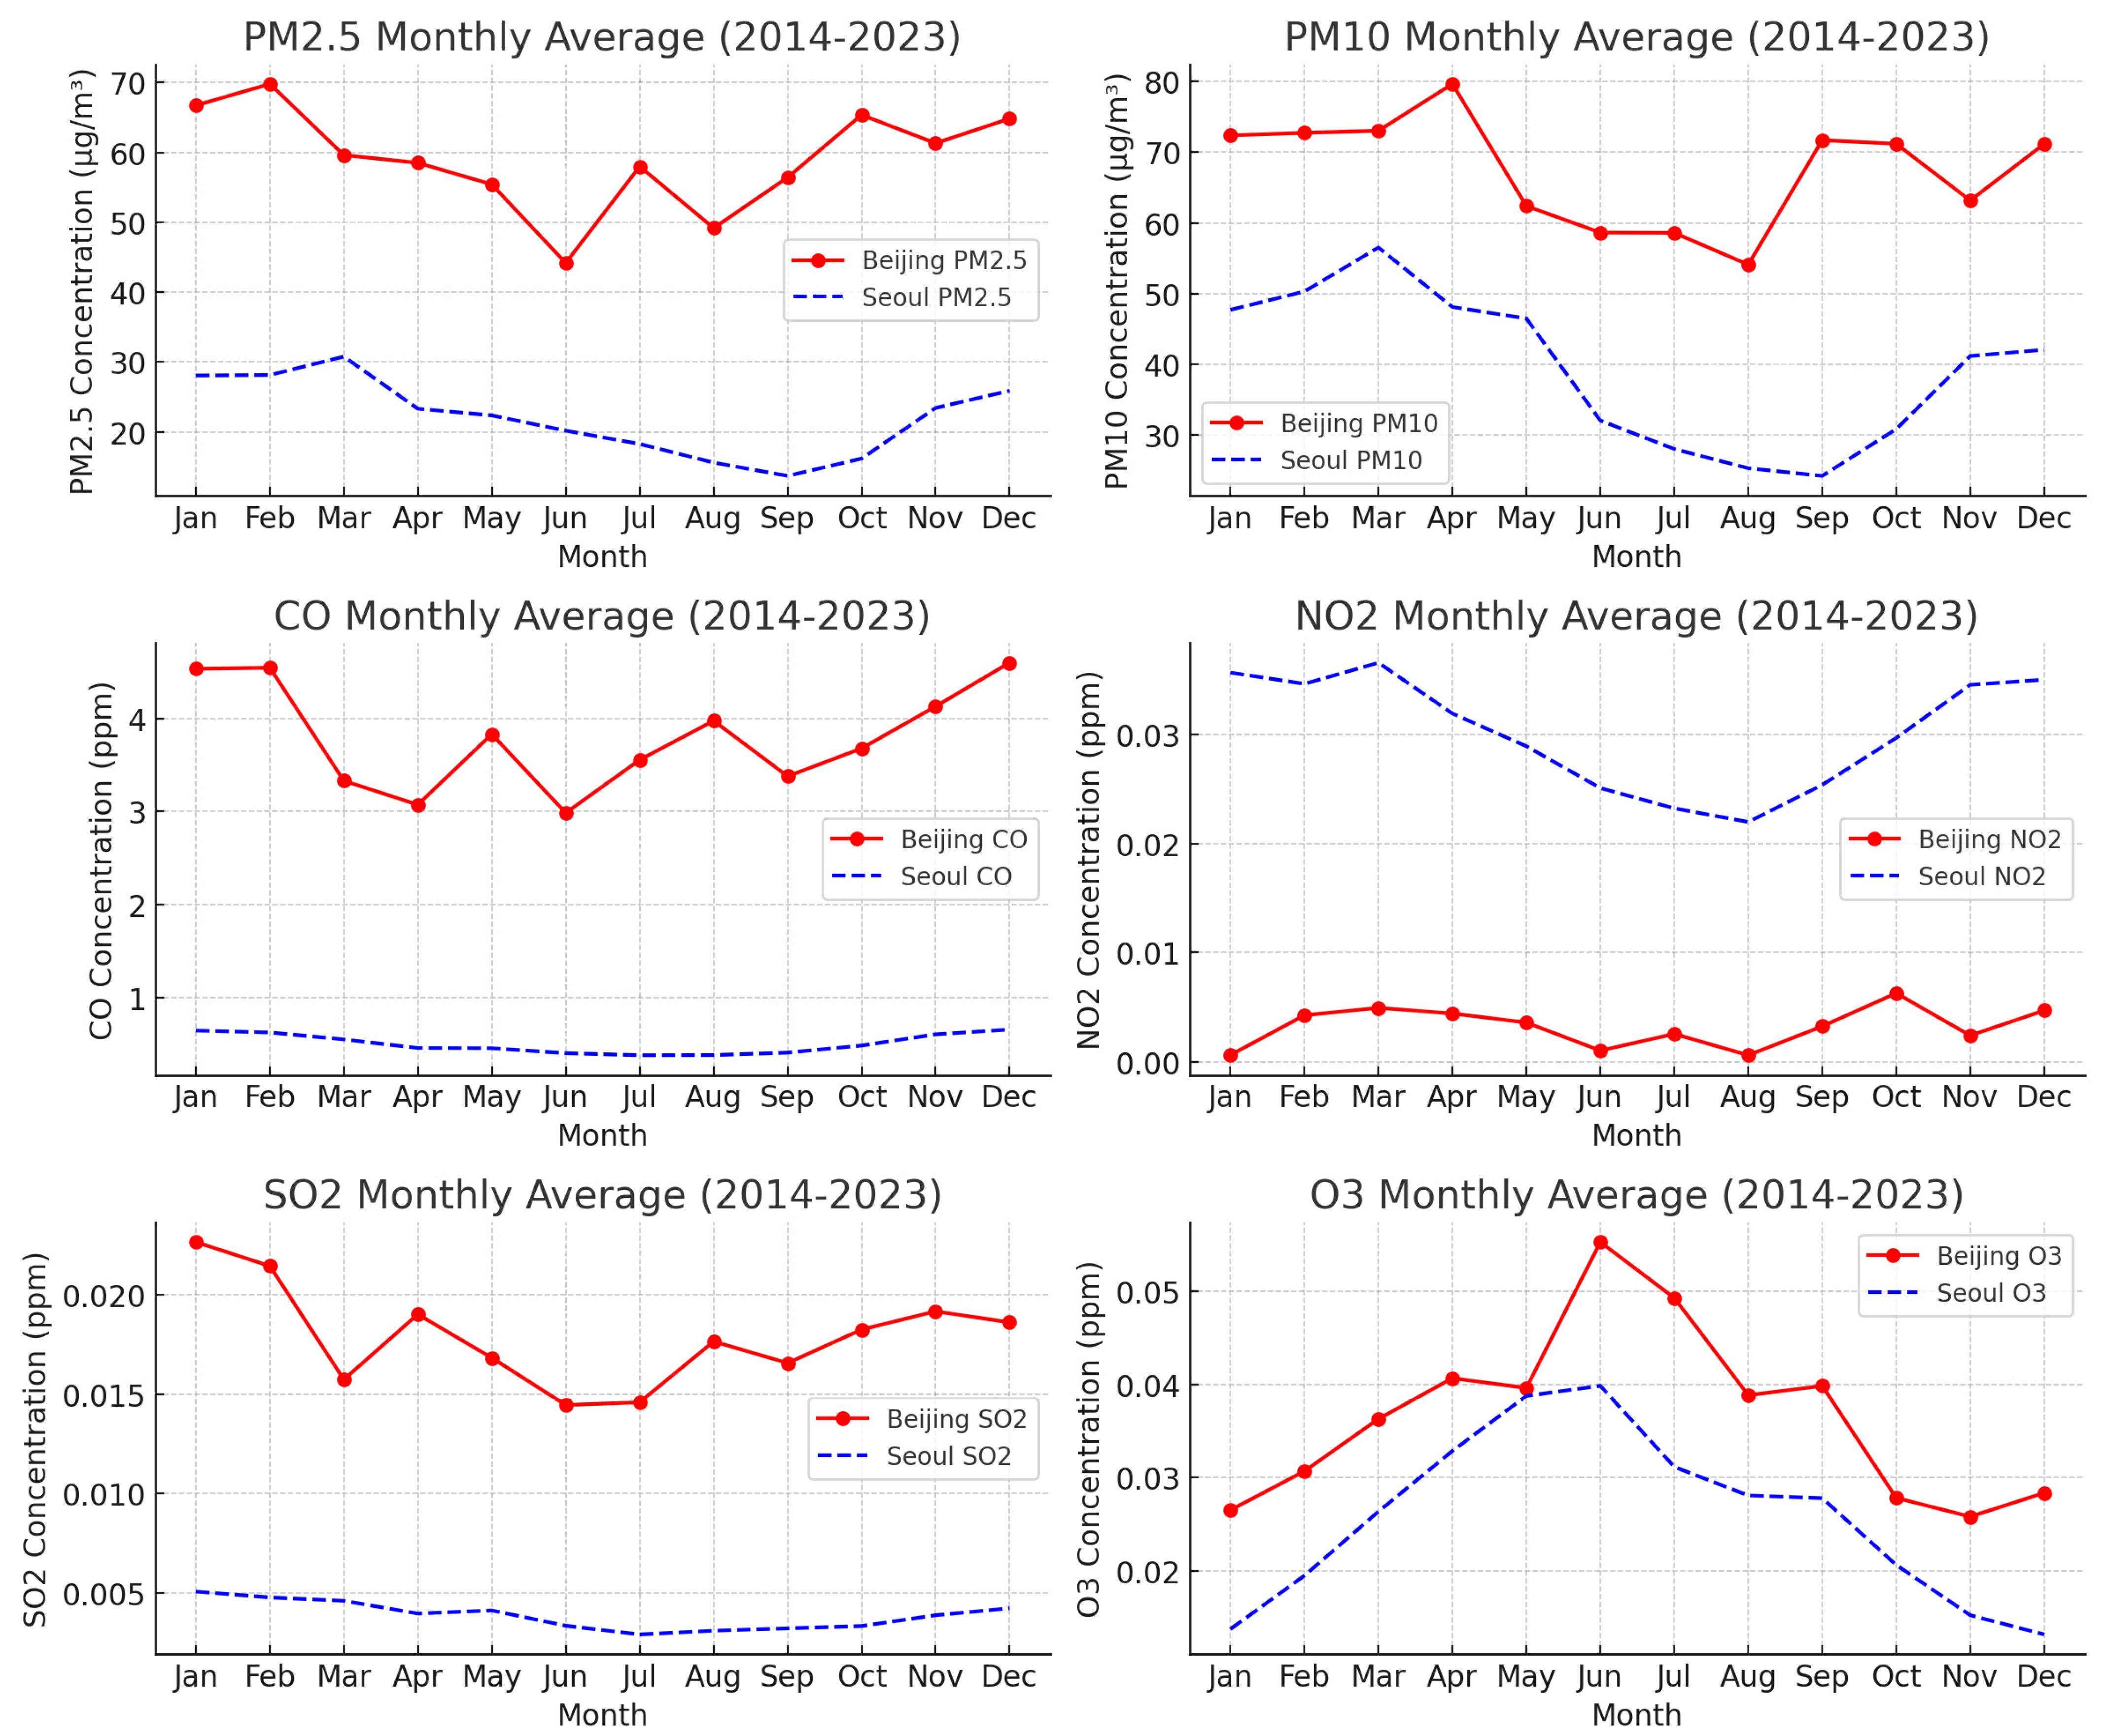
In Seoul, while the annual mean concentration of PM2.5 has gradually decreased due to stricter emission control measures, particulate pollution remains a significant concern, particularly in spring when transboundary pollution from dust storms originating in northern China contributes significantly to the PM2.5 levels.
Figure 2 shows a sharp increase in PM2.5 concentrations during the spring months, highlighting the impact of external pollution sources. Despite efforts to reduce local emissions, PM2.5 levels remain higher than international standards during this period, as evidenced by the data in
Table 2. Furthermore, Ozone (O3) concentrations in Seoul exhibit a clear seasonal trend, with summer months seeing a marked increase in O3 levels, as demonstrated in
Figure 3. This increase is primarily due to photochemical reactions facilitated by sunlight and increased vehicular emissions, highlighting the city’s struggle with ozone formation during warmer months.
Future studies could benefit from incorporating receptor modeling or source apportionment techniques, which would enable more robust quantification of the individual contributions of vehicular traffic and residential heating to the observed pollution levels in both cities. This approach has been successfully applied in other studies, such as those by [
1,
15].
3.2. Monthly and Seasonal Variability
The seasonal variation in pollutant concentrations was found to be one of the most significant factors influencing air quality in both cities. In Beijing, the highest concentrations of PM2.5 were consistently recorded during the winter months, primarily due to coal burning for residential heating. As shown in
Figure 3, PM2.5 levels peaked sharply between December and January, coinciding with the winter heating season. These findings are consistent with previous studies that have identified the impact of temperature inversions on the accumulation of pollutants during colder months, as
Figure 4 highlights. During this period, temperature inversions trap PM2.5 and PM10 near the surface, preventing their dispersion and worsening air quality.
Table 2 further demonstrates the PM2.5 concentration in Beijing during winter is significantly higher than in other seasons, reaffirming the contribution of coal combustion and industrial emissions during the cold months. Notably, these elevated concentrations have been linked to increased rates of respiratory diseases, such as asthma and chronic bronchitis, as shown in numerous public health studies.
Seasonal trends were calculated using monthly average values of pollutant concentrations. Mann–Kendall tests were then applied to the seasonal data to identify significant trends over the study period. In Seoul, seasonal variations also played a critical role in pollutant concentrations, particularly with respect to NO
2 and O
3. As illustrated in
Figure 4, NO2 levels in Seoul exhibited a clear increase during the summer months, correlating strongly with higher vehicular emissions due to increased traffic during warmer months. Similarly, O
3 levels rose significantly during the summer, as shown in
Figure 4. This seasonal increase in O
3 concentrations is primarily driven by photochemical reactions, where NO
2 from vehicular emissions interacts with sunlight to produce ozone. The rise in O
3 in Seoul is compounded by high temperatures and sunlight, leading to elevated ozone formation and worsening air quality, particularly during the summer. The high correlation between NO
2 and O
3 in Seoul (Pearson coefficient of 0.85) indicates that these pollutants are largely driven by the same source—vehicular emissions, with NO
2 serving as a precursor to O
3 formation [
19].
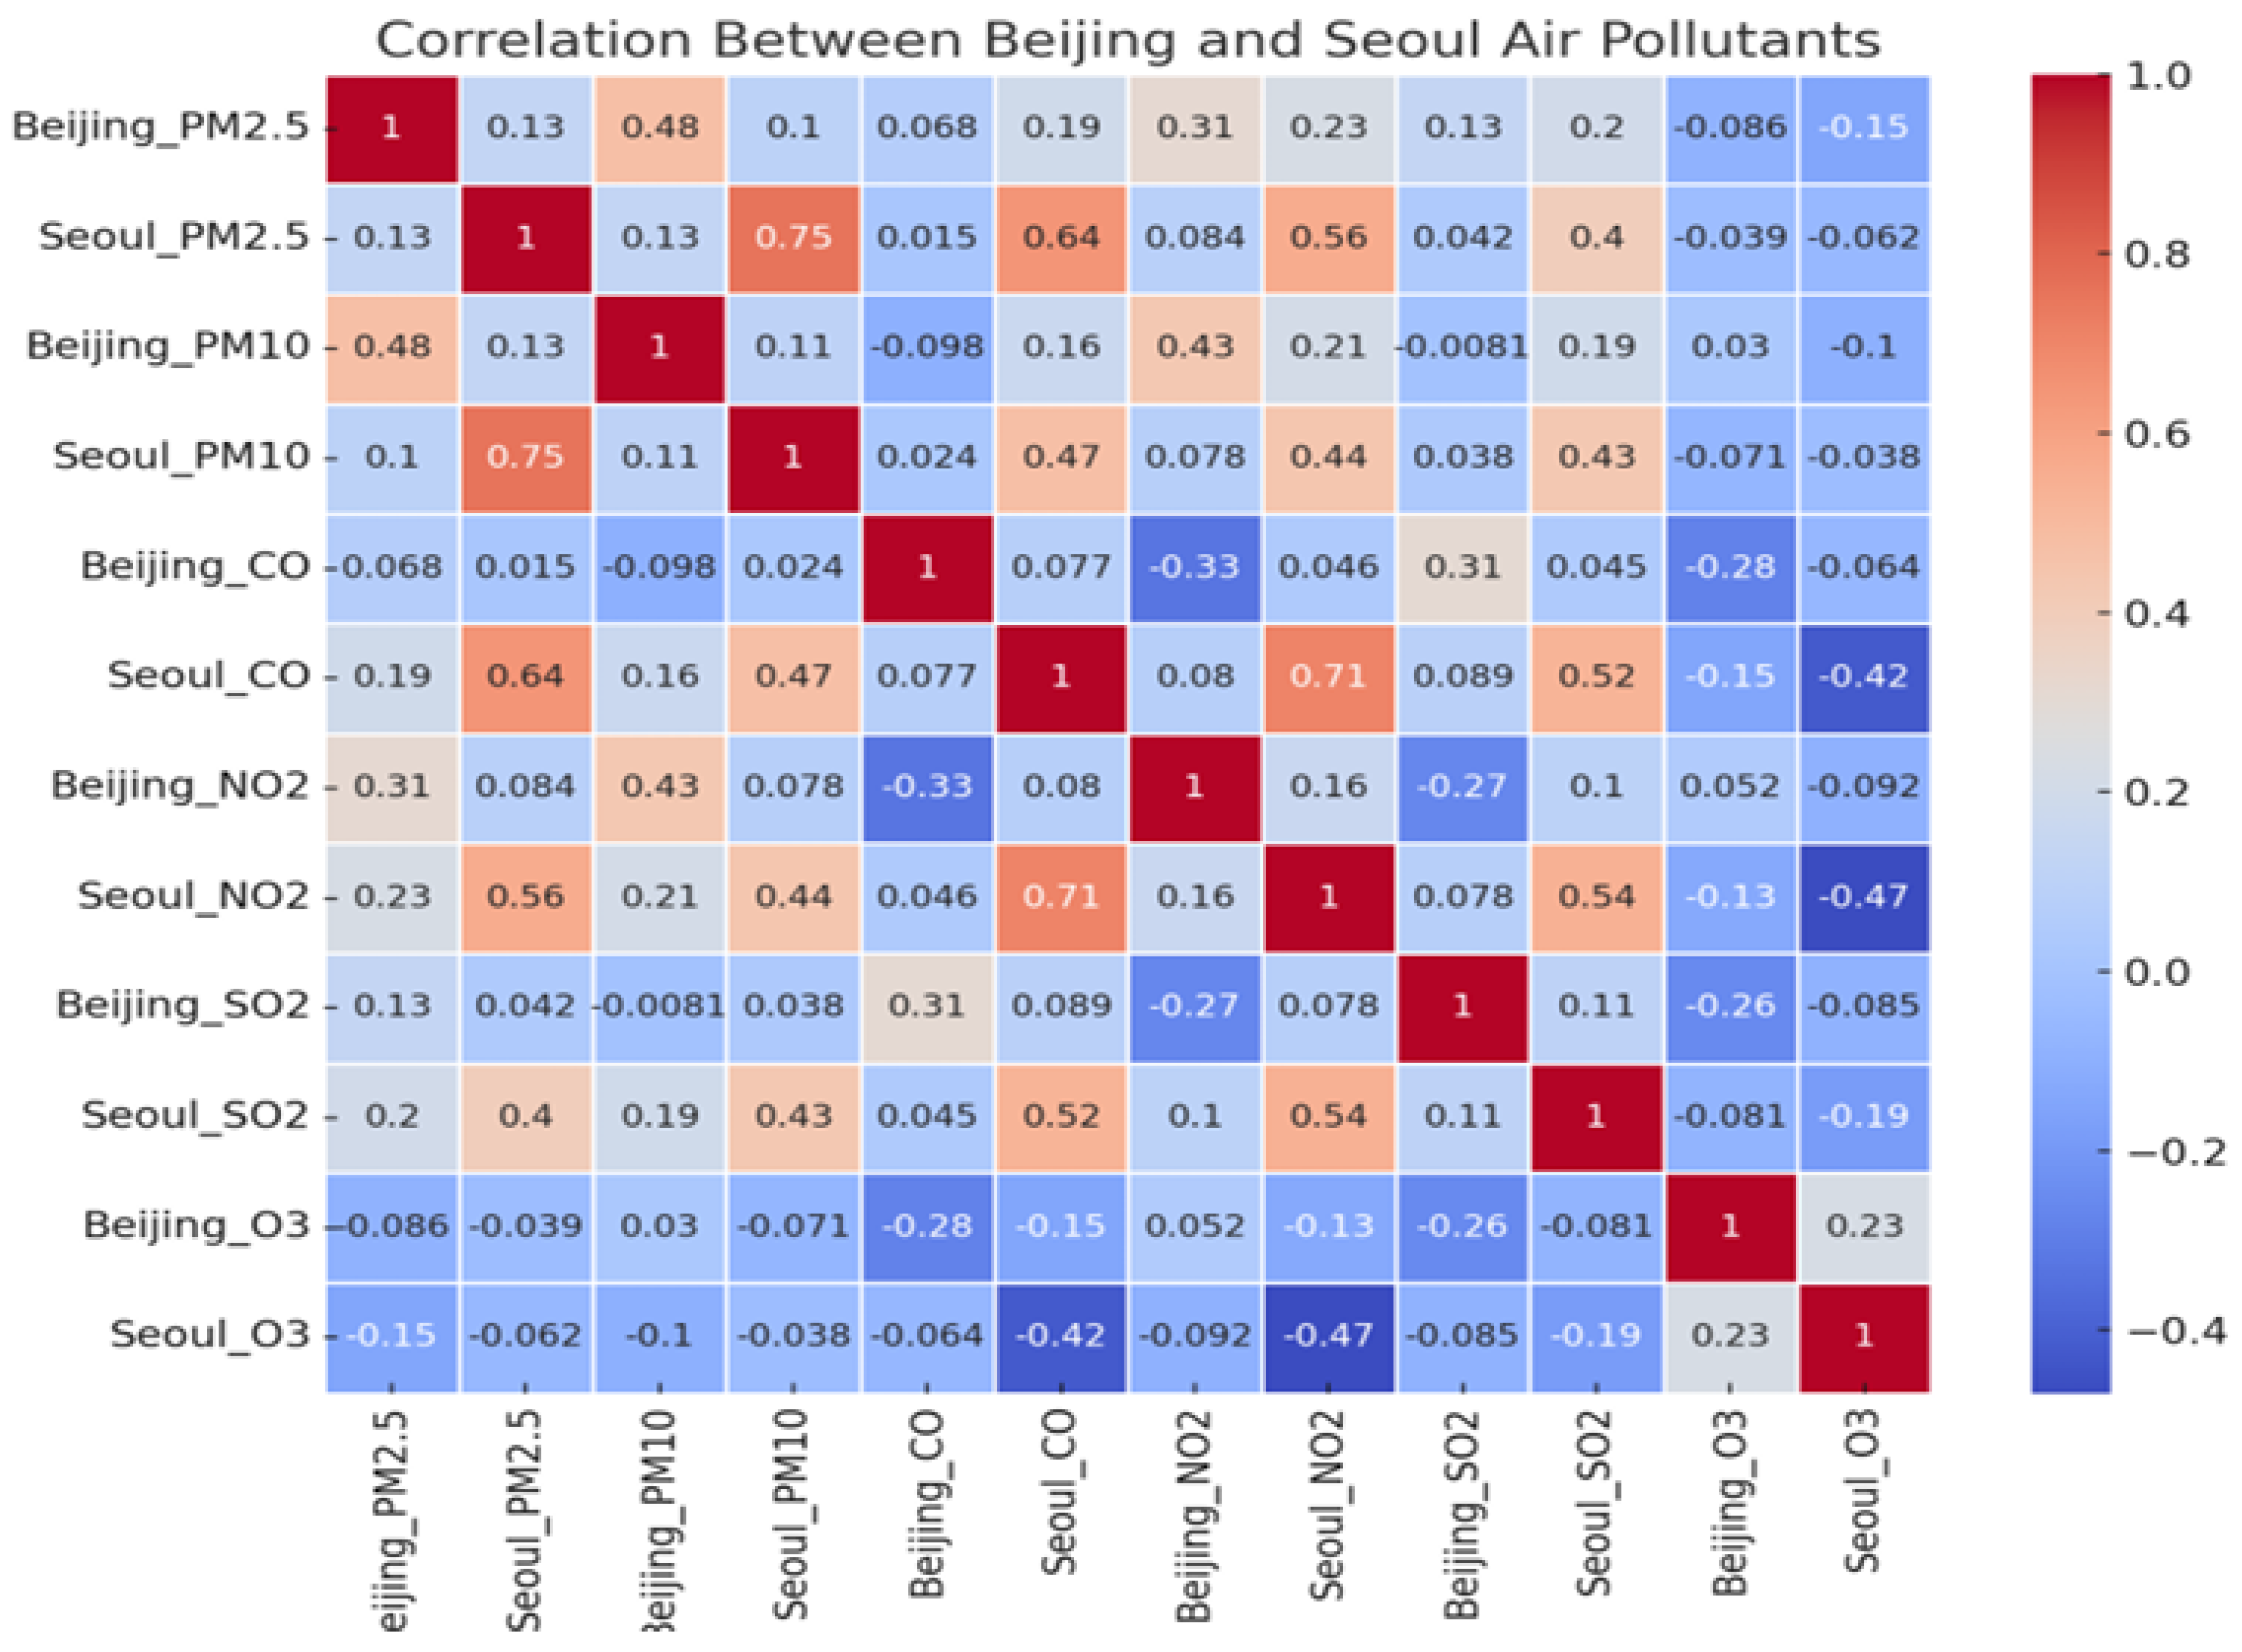
3.3. Correlations Between Pollutants
3.3.1. Correlation Between Beijing and Seoul Air Pollutants
The correlation analysis between the key pollutants, PM2.5, NO
2, and O
3, in Beijing and Seoul provides valuable insight into how these pollutants relate across both cities.
Figure 3 and
Table 2 present the comparison of PM2.5 and NO
2 concentrations in both cities over the study period. The correlation between PM2.5 and NO
2 was significantly strong in Seoul, with a Pearson correlation coefficient of 0.85. This suggests that both pollutants share a common source, primarily vehicular emissions, which are a major contributor to air pollution in Seoul. As illustrated in
Figure 3, PM2.5 levels in Seoul tend to increase with rising NO
2 concentrations, especially during high-traffic periods in the summer months. The strong positive correlation indicates that the emissions from vehicles, particularly diesel-powered vehicles, are responsible for both NO
2 and PM2.5 levels in Seoul, where both pollutants have a clear seasonal variation driven by traffic density and climatic conditions.
In contrast, in Beijing, the correlation between PM2.5 and NO
2 was slightly weaker, with a Pearson correlation coefficient of 0.77. This lower correlation can be attributed to the fact that Beijing’s pollution is heavily influenced not only by vehicular emissions but also by using coal for residential heating and industrial emissions, which are prominent during the winter months. As shown in
Figure 4, the seasonal peak of PM2.5 in Beijing during the winter does not always coincide with an increase in NO
2, as the major contributor to PM2.5 in this period is coal burning. This difference suggests that the correlation between these two pollutants is more complex in Beijing, where the role of industrial emissions and coal combustion complicates the analysis compared to Seoul, where traffic-related emissions are the dominant source of both pollutants.
3.3.2. Correlation Between Pollutants Within Each City
The analysis of correlations within each city reveals different patterns in the relationship between PM2.5, NO2, and O3 in Beijing and Seoul.
In Seoul, the correlation between PM2.5 and O
3 was found to be quite strong during the warmer months, with a Pearson correlation coefficient of 0.80. This positive correlation is primarily driven by the photochemical processes that occur when NO
2 emitted from vehicular traffic interacts with sunlight, leading to the formation of O
3.
Figure 4 shows how PM2.5 and O
3 concentrations in Seoul follow a similar seasonal pattern, with both pollutants peaking in the summer. The presence of PM2.5 can enhance the formation of O
3 by acting as a catalyst in photochemical reactions, thus leading to higher concentrations of ozone during periods of high traffic and sunlight exposure. This relationship emphasizes the interconnected nature of particulate matter and ozone formation in Seoul, where the high levels of NO
2 from vehicle emissions are key contributors to both PM2.5 and O
3 pollution.
In Beijing, the correlation between PM2.5 and O3 was weaker, with a Pearson correlation coefficient of 0.65. PM2.5 levels are much higher during the winter months, largely due to coal burning for heating, which does not significantly influence O3 concentrations. The formation of O3 in Beijing is driven more by industrial emissions and photochemical reactions, but the correlation between PM2.5 and O3 is not as strong as in Seoul due to the differing primary sources of pollution. The weaker correlation in Beijing suggests that coal combustion is the dominant factor influencing PM2.5 concentrations, while O3 formation is primarily driven by industrial emissions and vehicular traffic, which contribute to NO2 levels but not necessarily to PM2.5 in the same manner. Additionally, the impact of meteorological factors, such as temperature inversions during winter, limits the interaction between PM2.5 and O3, as the atmospheric conditions prevent the dispersion of pollutants and inhibit the photochemical processes that form O3.
3.4. Effectiveness of Air Quality Management Policies
The analysis of air quality management policies in Beijing and Seoul reveals varying degrees of success in the implementation of interventions aimed at reducing air pollution.
In Beijing, significant improvements have been made, particularly in transitioning from coal to natural gas for energy production and encouraging the use of cleaner industrial technologies. These initiatives have contributed to a general reduction in industrial emissions, but the city still faces severe challenges, especially during the winter heating season. The reliance on coal for residential heating remains a significant factor in the high concentrations of PM2.5 during the colder months. Despite the efforts to reduce emissions from industrial sources, the PM2.5 concentration remains high during the winter months, consistently exceeding acceptable thresholds. The persistence of coal usage in the colder season means that air quality does not improve significantly during this period, indicating that further policy interventions are needed to address the issue of coal burning.
Moreover, transboundary pollution from surrounding regions, such as dust and industrial emissions from neighboring provinces or countries, contributes significantly to Beijing’s air quality issues. This external factor complicates efforts to maintain cleaner air and highlights the need for stronger regional cooperation. Policies to reduce local emissions are important, but they need to be complemented by strategies that address cross-border pollution, including agreements with neighboring regions or countries to curb pollution transport across borders.
In Seoul, significant progress has been made in reducing NO2 levels, primarily through the implementation of stricter vehicle emission standards and the promotion of electric vehicles (EVs). The city has successfully reduced vehicular emissions over the past decade, which is evident in the steady decline of NO2 concentrations. These policies have helped mitigate NO2 pollution, especially in urban areas with heavy traffic. However, despite these advancements, diesel vehicles continue to be a significant source of both NO2 and PM2.5 pollution, particularly during the winter months. Diesel engines, known for their high emissions of nitrogen oxides and particulate matter, are still widely used in Seoul, exacerbating pollution levels during the colder season when heating demands and vehicular traffic are at their peak.
Additionally, transboundary pollution from dust storms originating in northern China remains a persistent issue for Seoul. These seasonal dust storms carry large amounts of particulate matter into the city, significantly increasing PM2.5 levels during the spring months. This external factor complicates efforts to improve Seoul’s air quality, as local emission reductions alone cannot fully counter the influx of dust from neighboring regions. This highlights the need for a broader, regional approach to air quality management, where Seoul collaborates with neighboring countries to address the challenges of transboundary pollution and mitigate its impact on the city’s air quality.
4. Summary and Conclusions
This study presents a comparative analysis of air pollution trends and their associated health and environmental impacts in two major East Asian cities, Beijing and Seoul, over a period of ten years (2014–2024). By examining the long-term trends of key pollutants such as PM2.5, NO2, and O3, this study provides a comprehensive understanding of the sources, seasonal variations, and health implications of air pollution in these rapidly urbanizing cities.
4.1. Summary of Key Findings
The analysis revealed several key findings regarding air pollution in Beijing and Seoul. In Beijing, the primary sources of PM2.5 are coal burning for residential heating and industrial emissions, with significant peaks in PM2.5 levels observed during the winter months. The continued reliance on coal has been a major challenge in improving air quality, despite significant efforts to reduce industrial emissions and promote cleaner technologies. Furthermore, transboundary pollution from neighboring regions, particularly during the winter heating season, continues to exacerbate Beijing’s air quality problems.
In Seoul, air quality has improved over the years, with significant reductions in NO2 levels primarily due to stricter vehicle emission standards and the promotion of electric vehicles. However, diesel vehicles remain a significant source of NO2 and PM2.5 pollution, especially during colder months. Transboundary pollution, particularly from dust storms originating in northern China, continues to complicate air quality management efforts, as it significantly increases PM2.5 levels during the spring months.
Seasonal variations in PM2.5, NO2, and O3 were observed in both cities, with higher concentrations during the winter in Beijing and during the summer in Seoul, highlighting the influence of meteorological conditions and climatic factors on pollution levels. The strong positive correlations between PM2.5 and NO2, and between PM2.5 and O3, particularly in Seoul, suggest a shared source of pollution, primarily from vehicular emissions.
4.2. Conclusions
In conclusion, this study has provided a detailed analysis of the long-term trends and seasonal variations of air pollution in Beijing and Seoul, highlighting the primary sources, impacts, and effectiveness of air quality management policies. While progress has been made in both cities, significant challenges remain, particularly in addressing transboundary pollution and coal usage in Beijing, as well as diesel vehicle emissions in Seoul. The findings underscore the importance of region-specific air quality management strategies, continued efforts to reduce emissions, and enhanced regional cooperation to address cross-border pollution. Future research should continue to refine these strategies and explore new approaches to improving air quality in rapidly urbanizing regions.


