Article

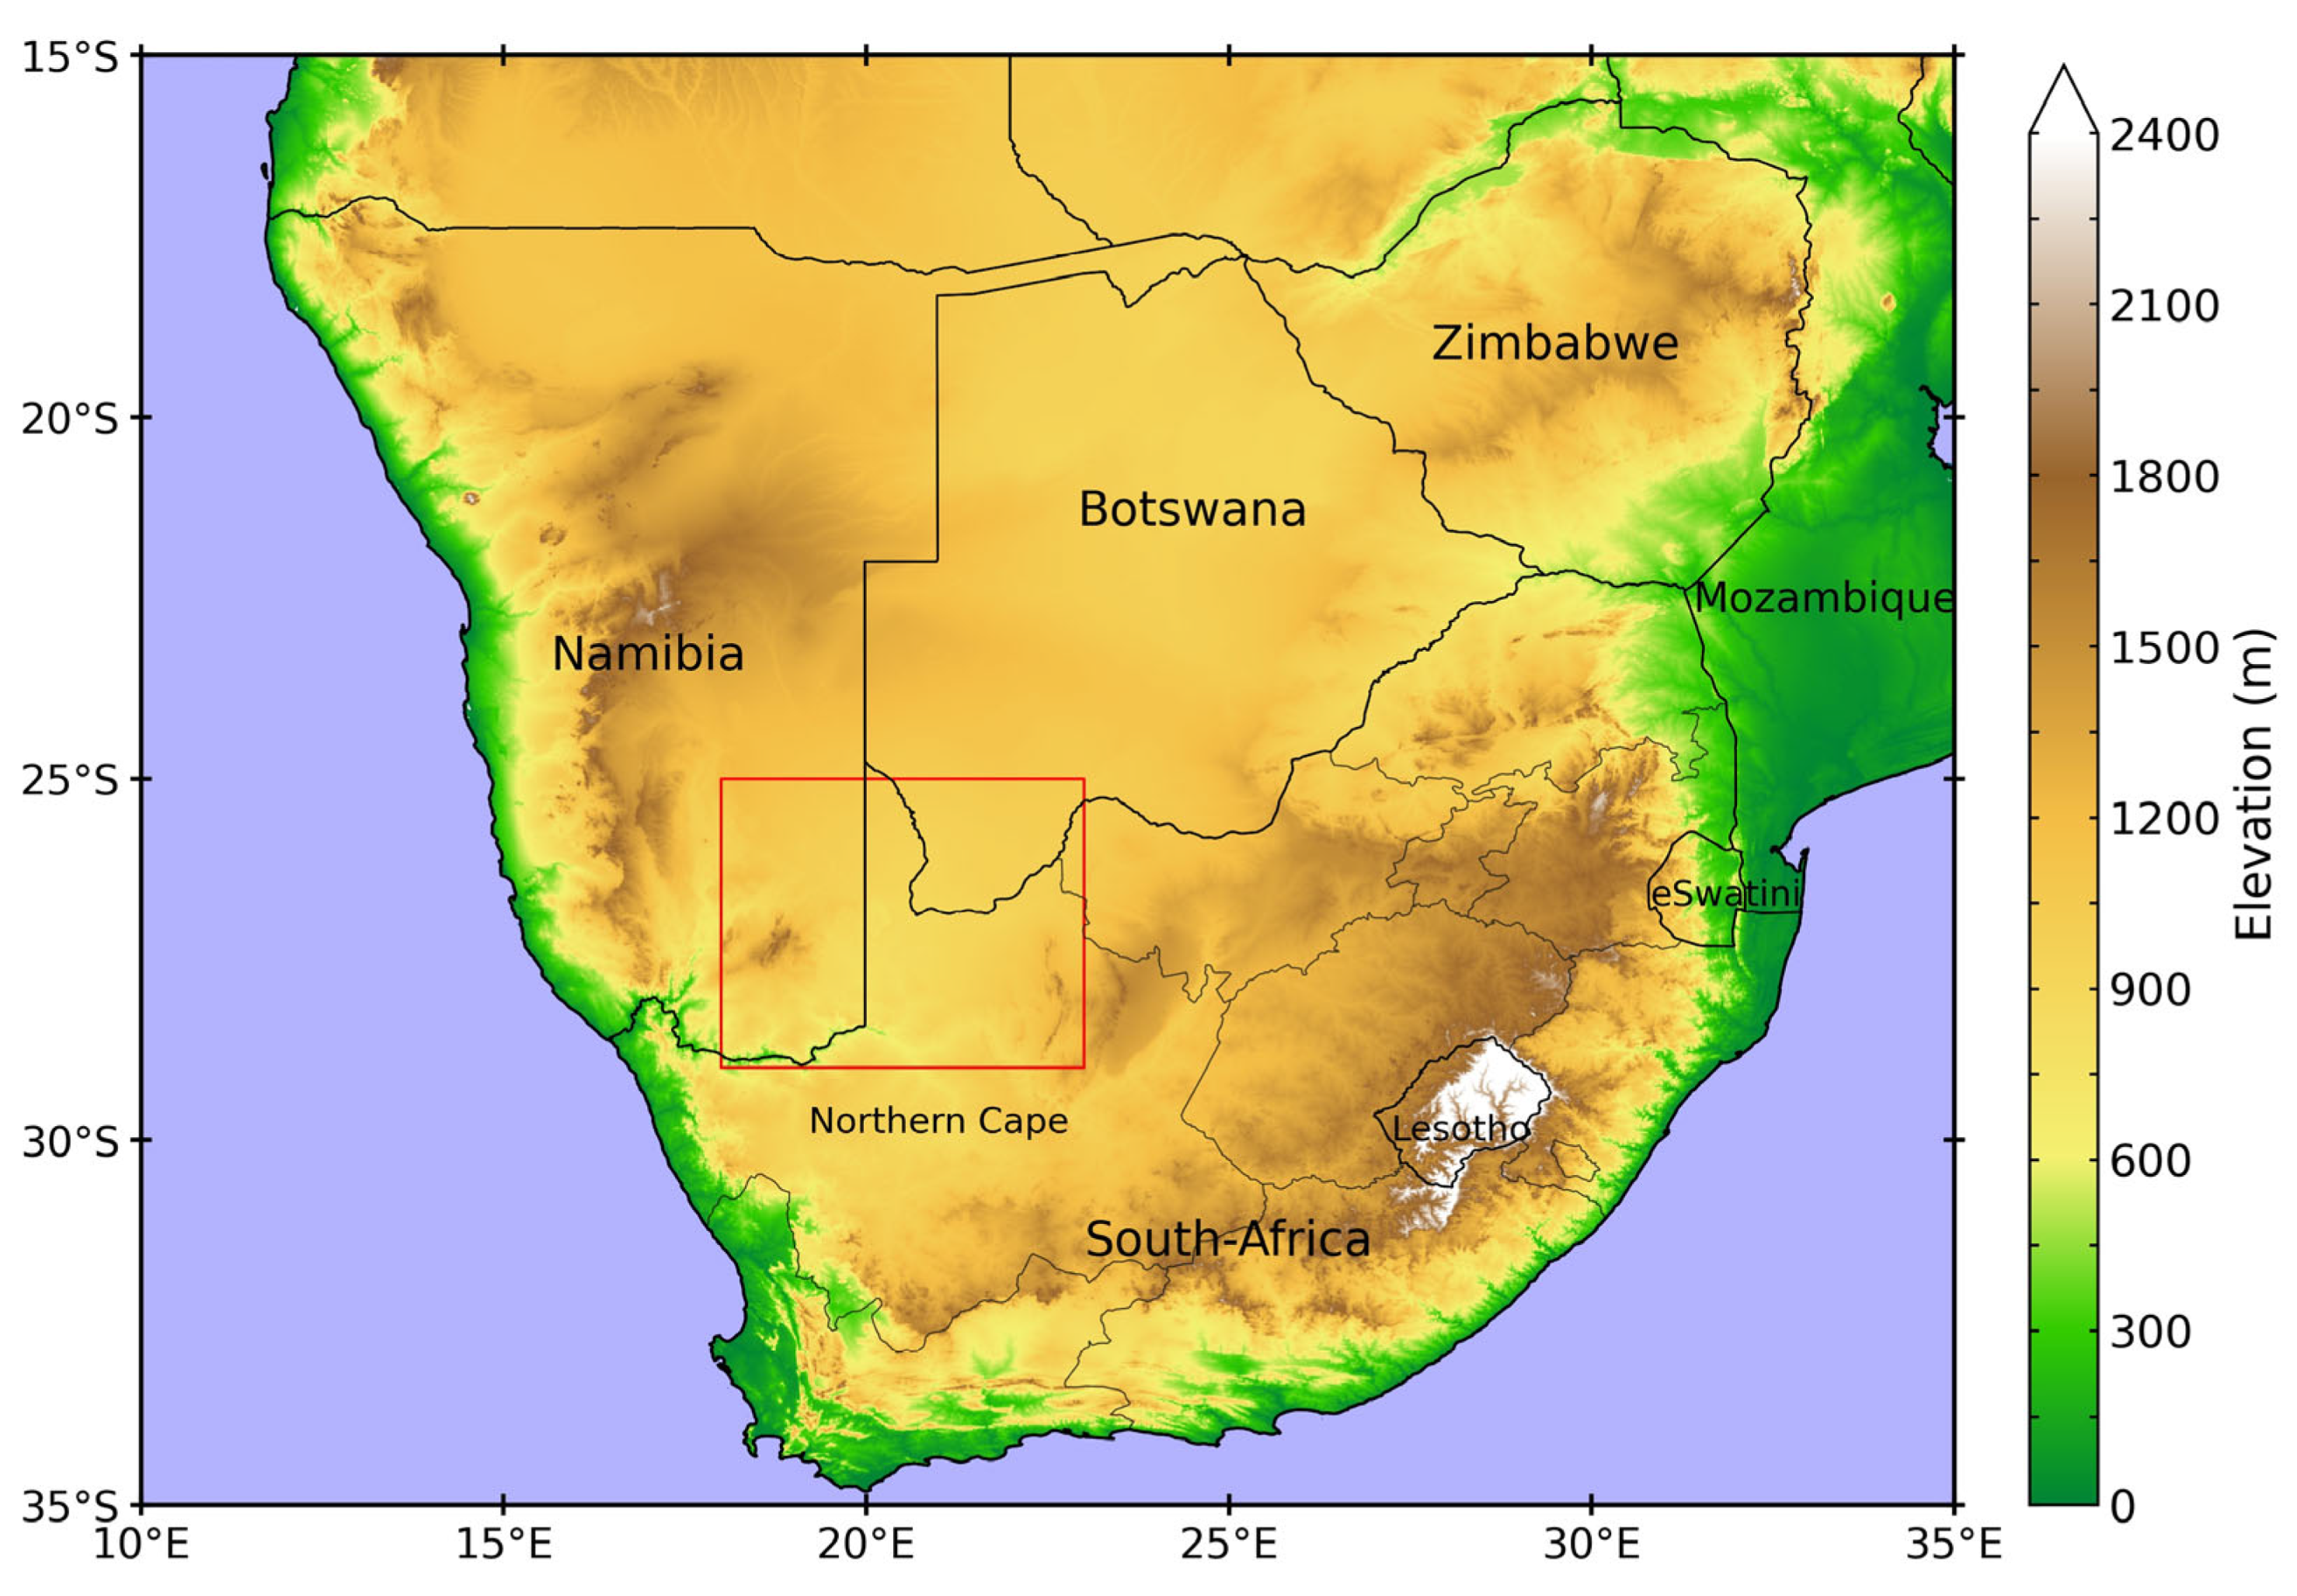
Variability in Summer Rainfall and Rain Days over the Southern Kalahari: Influences of ENSO and the Botswana High

Oceanography Department, University of Cape Town, Rondebosch 7700, South Africa
*
Author to whom correspondence should be addressed.
Atmosphere 2025, 16(6), 747; https://doi.org/10.3390/atmos16060747
Submission received: 1 April 2025 / Revised: 3 June 2025 / Accepted: 13 June 2025 / Published: 18 June 2025
(This article belongs to the Section Climatology)

Abstract

Rainfall variability in the sensitive Kalahari semi-desert in Southern Africa, a region of strong climatic gradients, has not been much studied and is poorly understood. Here, anomalies in rainfall totals and moderate and heavy rain day frequencies are examined for both the summer half of the year and three bi-monthly seasons using CHIRPS rainfall data and ERA5 reanalysis. Peak rainfall occurs in January–February, with anomalously wet summers marked by a significant increase in the number of rainy days rather than rainfall intensity. Wet summers are linked to La Niña events, cyclonic anomalies over Angola, and a weakened Botswana High, which enhances low-level moisture transport and convergence over the region as well as mid-level uplift. Roughly the reverse patterns are found during anomalously dry summers. On sub-seasonal scales, ENSO and the Botswana High (the Southern Annular Mode) are negatively (positively) significantly correlated with early summer rainfall, while in mid-summer, and for the entire November–April season, only ENSO and the Botswana High are correlated with rainfall amounts. In the late summer, weak negative correlations remain with the Botswana High, but they do not achieve 95% significance.

1. Introduction

Southern Africa, defined here as Africa south of 15° S, is marked by a distinct rainfall seasonality crucial to the livelihood of about 150 million people who depend on rain-fed agriculture. The region primarily receives rain between November and April, except along and near the west coast, which experiences winter rainfall and is semi-arid to arid, and the south coast, where rainfall is year-round [1,2,3]. This seasonal rainfall supports key activities such as agriculture, water supply, and energy generation in a few hydro-electric dams on large rivers such as the Zambezi, all vital to the economic and social fabric of the region [4]. Understanding rainfall variability in this area is essential, which is impacted by El Niño Southern Oscillation (ENSO), the Southern Annular Mode (SAM), and regional climate modes, since shifts in rainfall patterns or intensities have significant impacts on food security, economic stability, and environmental sustainability. Indeed, droughts and floods are major natural disasters in this region [5,6,7].
This study focuses on the Southern Kalahari (Figure 1), a semi-arid region on the western edge of Southern Africa’s summer rainfall zone, characterized by highly variable rainfall on a range of time scales, frequent droughts, and occasional flash floods [6,7,8,9]. The region’s rural communities, dependent upon subsistence farming and rainfed agriculture, are particularly vulnerable to extreme weather events, which threaten food security and livelihoods [8,10]. Additionally, the area supports unique ecosystems and wildlife, which are crucial for tourism and conservation, and faces potential risks from a changing climate [8,11,12]. It is situated in a transition zone between the wetter grassland savannahs to the east and the hyper-arid Namib Desert to the west. However, compared to other regions of subtropical southern Africa, relatively little research has been conducted on its climate variability.
Extreme rainfall events, though more common in coastal areas, have occasionally affected interior regions, including the Kalahari. Notable coastal examples include the 2022 KwaZulu–Natal floods and tropical cyclones impacting Mozambique and the surrounding areas [13]. However, less research has examined extreme rainfall in semi-arid zones, such as the Southern Kalahari focused on here, where interactions among tropical–extratropical cloud bands, cut-off lows, regional sea surface temperature variability, and large-scale climate modes like ENSO may contribute to unexpected rainfall events [14,15]. Identifying these interactions and their role in influencing rainfall patterns is critical, as the mechanisms that drive such events in the Southern Kalahari remain underexplored.
ENSO is the main driver of interannual climate variability across Southern Africa [16,17,18,19,20,21,22]. Typically, El Niño and La Niña are associated with drier and wetter summers, respectively, although the magnitude and spatial distribution of their impacts vary significantly, both globally [23] and within the region [19,21,22]. In addition to ENSO, other climate modes, such as the Southern Annular Mode (SAM) [24,25] and the Subtropical Indian Ocean Dipole (SIOD) [26,27], can also influence rainfall variability over certain parts of the region. These modes can interact with the ENSO and other climate systems, adding complexity to seasonal weather patterns [24]. Such interactions emphasize the multifaceted nature of Southern Africa’s climate, requiring integrated approaches to understand and potentially predict its interannual variability.
Regional atmospheric circulation systems, such as the Angola Low and Botswana High, also play a critical role in modulating rainfall patterns, with these interactions often influencing the development of tropical–extratropical cloud bands, the main summer rainfall producer in Southern Africa [28,29,30,31]. The Botswana High, a mid-tropospheric high-pressure system centred over Botswana, is most prominent during the mid-austral summer (December–February) [32,33]. Its variability in position and strength, on both interannual and decadal scales [32], affects rainfall and temperature patterns, with a weaker Botswana High promoting rainfall and cooler conditions, while a stronger High suppresses rainfall and increases temperatures [6,32]. Near the surface, the Angola Low is a semi-permanent low-pressure system over Angola and Northern Namibia, which is easily recognized in mid-austral summer [34,35]. When active, this system facilitates moisture transport from the tropical Southeast Atlantic, enhancing local convection and helping to promote the development of cloud bands [36,37,38]. Together, these systems are fundamental to understanding the drivers of Southern Africa’s summer climate.
This study aims to address the gap in understanding the climatic drivers of rainfall variability in the Southern Kalahari by investigating large-scale climate influences and circulation anomalies that contribute to wetter or drier than average summers. By examining both seasonal and sub-seasonal anomalies in rainfall totals and wet days, the study seeks to contribute towards improved monitoring and understanding of rainfall extremes and disaster preparedness, which is needed to help support the socio-economic resilience of communities that are reliant on the region’s climate-sensitive agricultural and ecological systems. The insights gained should be applicable to a range of user groups, including farmers, water resource managers, health workers, policymakers, and conservationists working to adapt to a changing climate in this vulnerable region.

2. Materials and Methods

Climate Hazard Group Infrared Precipitation with Stations (CHIRPS) data are employed to analyze rainfall variability within the Southern Kalahari. CHIRPS, with a 0.05° horizontal resolution and coverage from 1981 to the present, is recognized for its ability to fill the gaps left by declining rainfall station networks, particularly in regions dominated by convective rainfall [39,40,41]. Note that the results did not notably differ if the coarser resolution 0.25° CHIRPS dataset was used. While alternative datasets such as the Global Precipitation Climatology Project (GPCP) [42] and the Climate Prediction Centre (CPC) Merged Analysis of Precipitation (CMAP) [43] offer longer records, their coarser spatial and temporal resolutions limit their utility for detailed studies [44,45]. Similarly, satellite-based products, like African Rainfall Climatology version 2 (ARC2) [46] and the Tropical Applications of Meteorology using SATellite and ground-based observations (TAMSAT) [47], may struggle in mountainous regions [44,48]. CHIRPS has been extensively validated against observational networks, showing high accuracy across Southern Africa, although some limitations persist, such as underestimating extreme coastal rainfall events [13,45].
To examine regional circulation patterns, the study incorporates the ECMWF Reanalysis 5th Generation reanalysis (ERA5) [49] data with a 0.25° spatial resolution. HadISST1 sea surface temperature (SST) data are used to examine the regional SST patterns. For large-scale climate modes, the Oceanic Niño Index (ONI) [50] is used for ENSO, the Behera and Yamagata [26] index for the SIOD, and that derived by Marshall [51] for the SAM. For the Botswana High index, the 500 hPa geopotential height spatially averaged over 16–21° E, 19–23° S was used.
Rainfall data were analyzed for the entire austral summer (November–April), as well as for the bi-monthly periods of November–December (ND), January–February (JF), and March–April (MA), and the standardized anomalies derived for the study period (1981–2022). In addition to totals, anomalies in moderate (10–24 mm) and heavy (>25 mm) rain days were examined. These thresholds of 10 mm and 25 mm, which are motivated by agriculture (e.g., maize needs), have been found to be appropriate to analyze rainfall events in other parts of Southern Africa (e.g., [9]).
Correlation and composite techniques were used to examine the relationships between rainfall variability and circulation or SST fields and, hence, to suggest mechanisms/drivers that potentially may be associated with the rainfall variability over the study region. The latter were performed on the five wettest and five driest summers for the period. In addition, potential trends in rainfall characteristics were examined.

3. Results

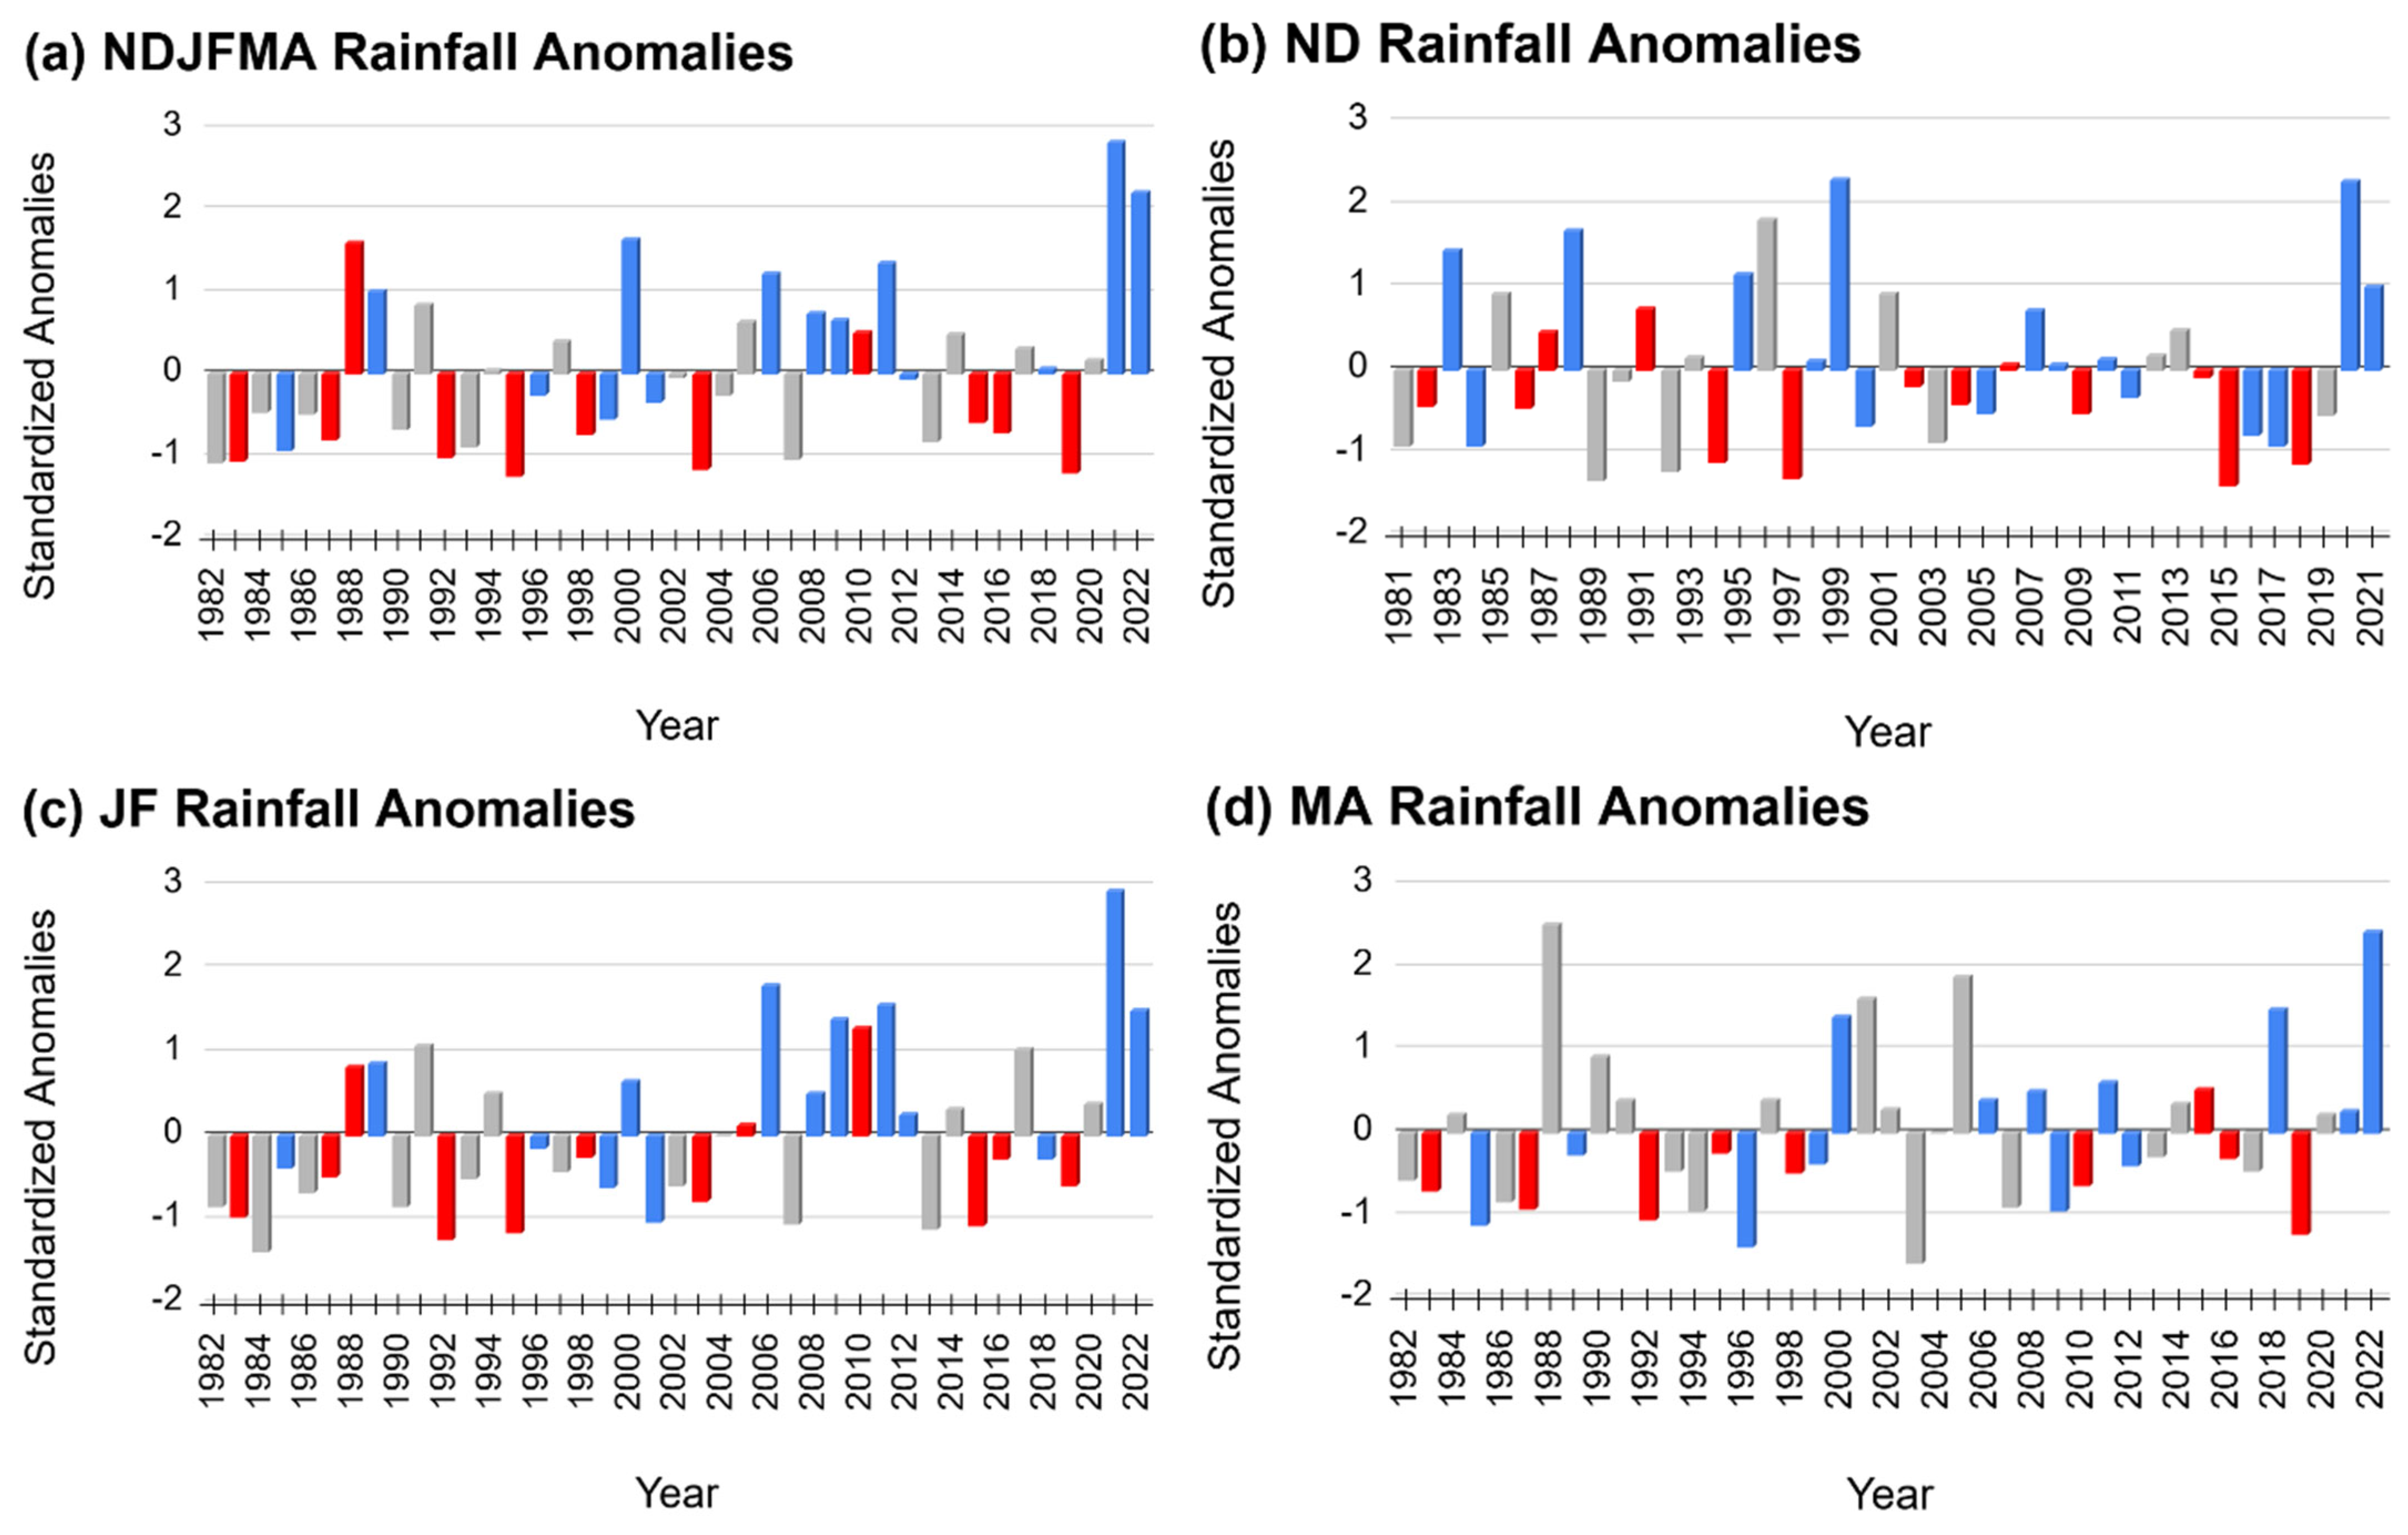
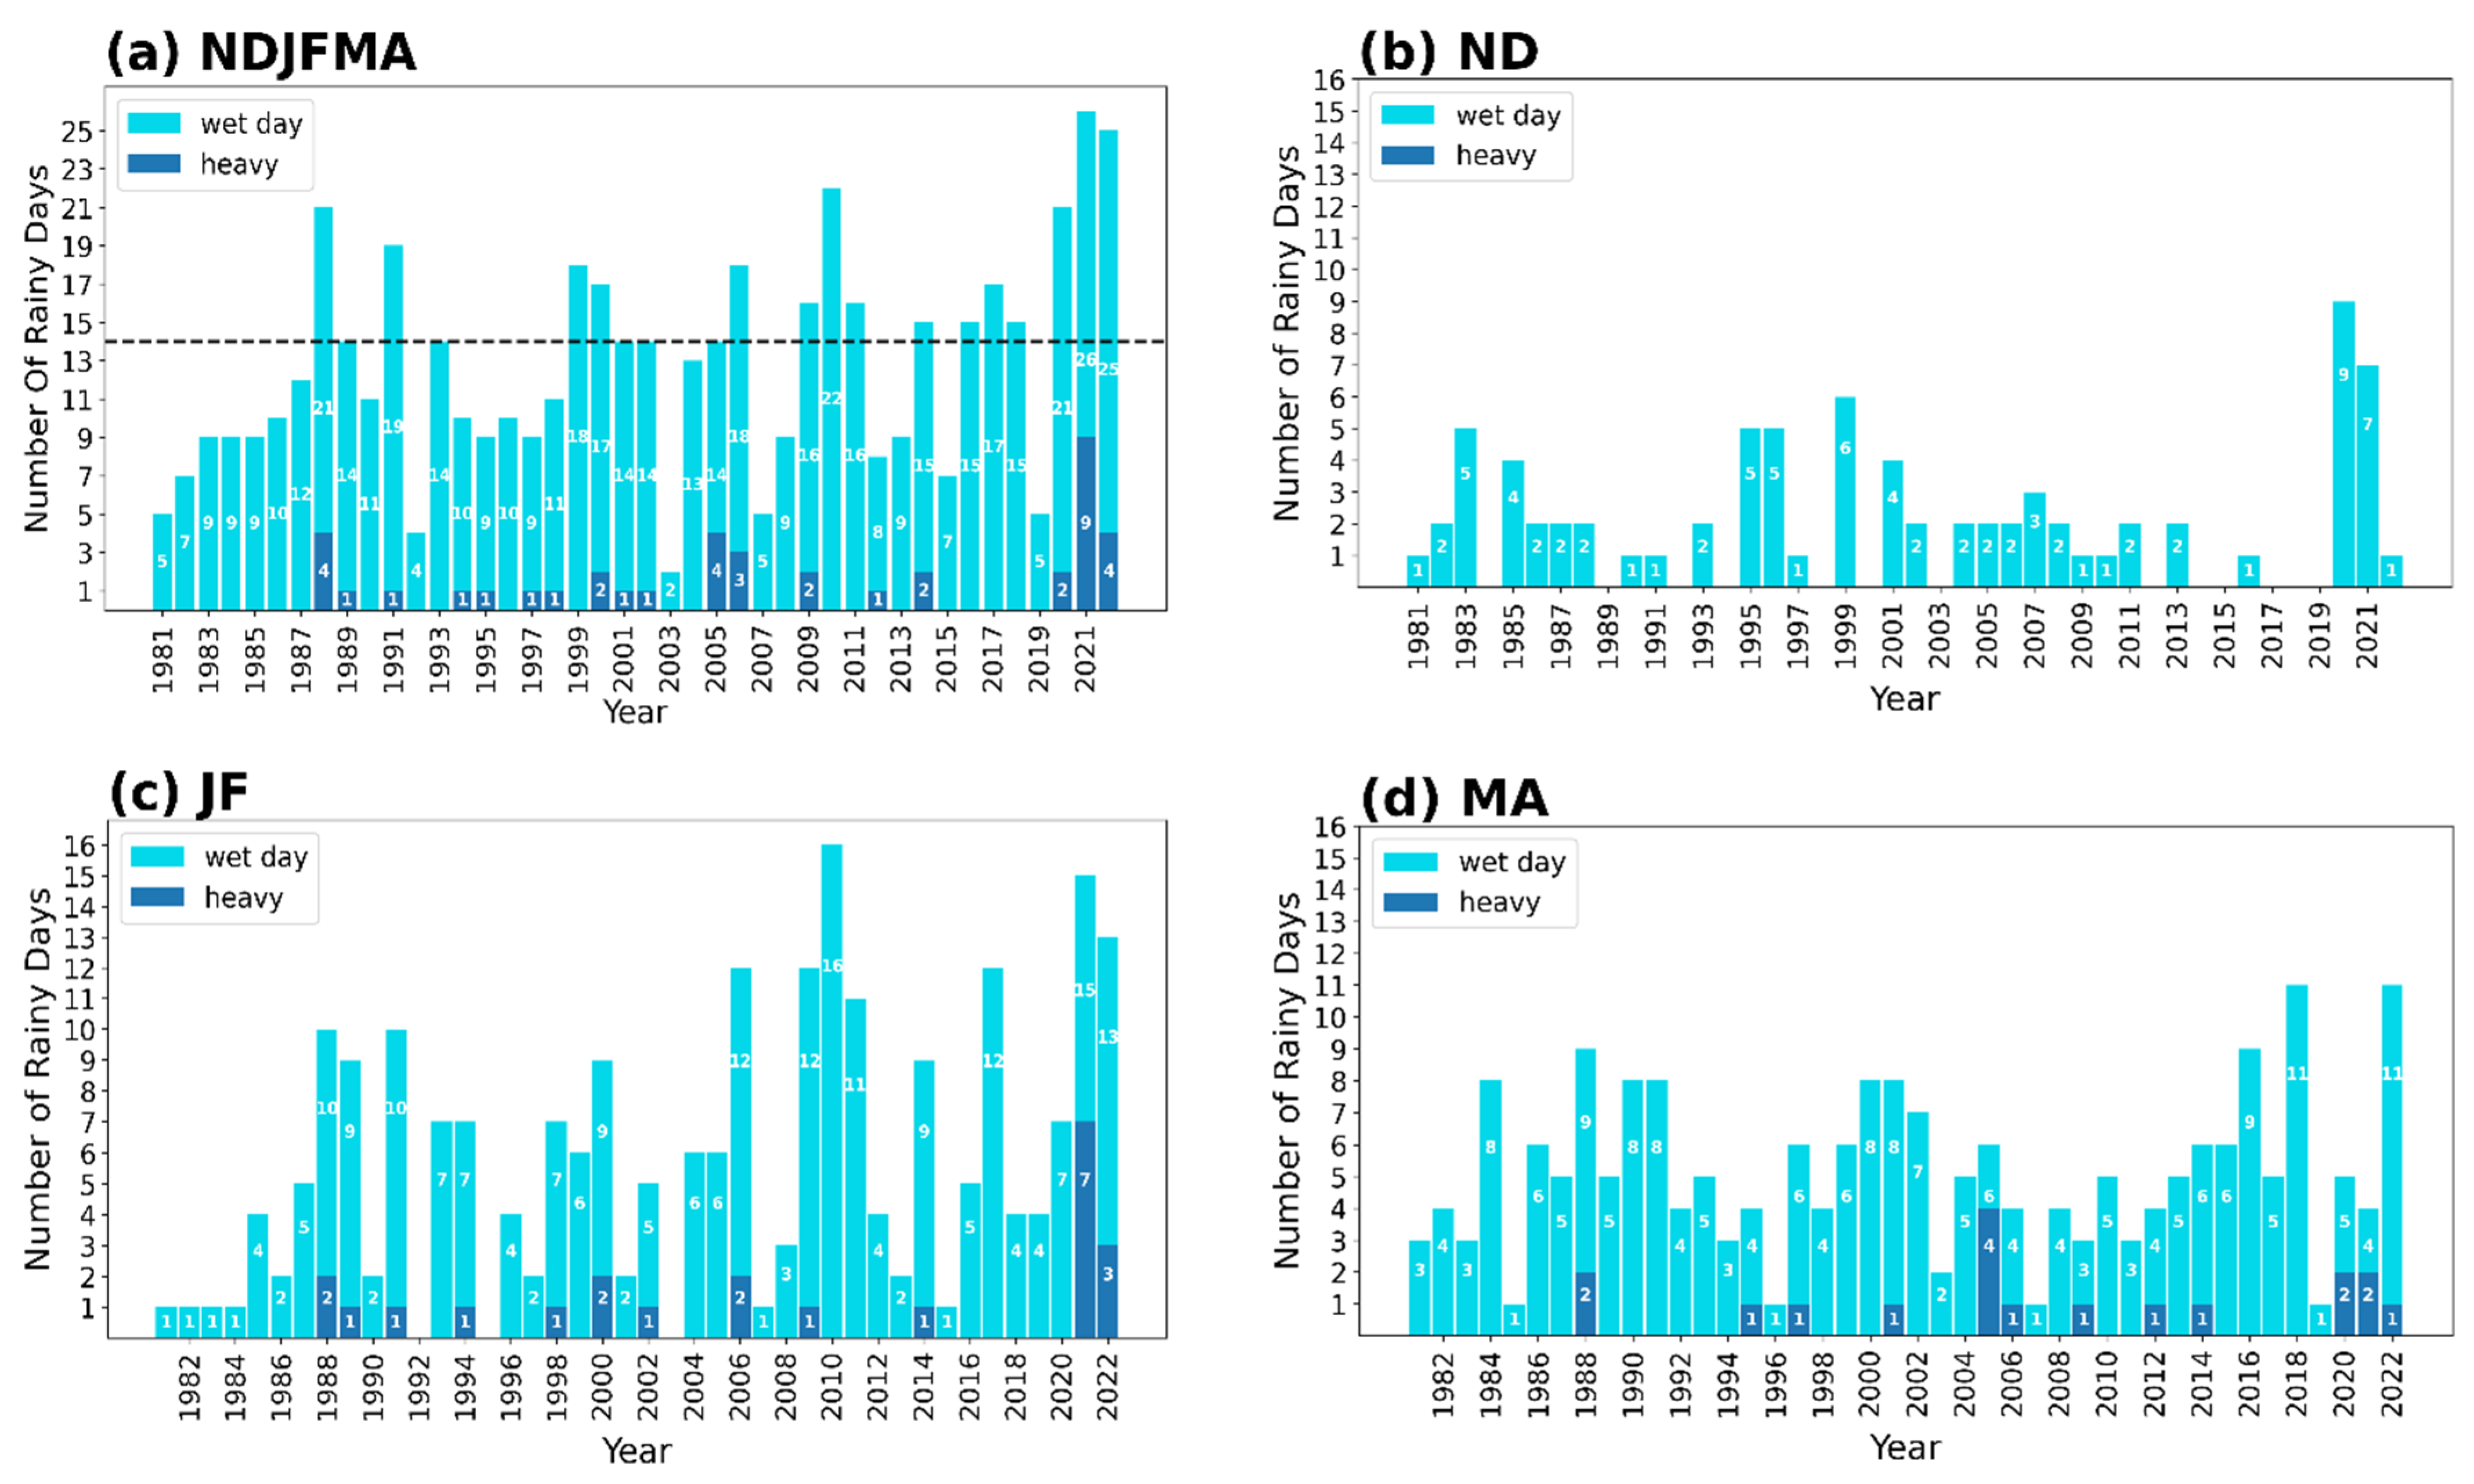
3.1. Rainfall Variations

Considerable interannual rainfall variability over the Southern Kalahari is evident when analyzed across either the season as a whole or in bi-monthly sub-seasons. The spatially averaged rainfall time series (Figure 2) highlights key years of anomalously high rainfall. Notably, the summers of 2021 (300 mm) and 2022 (270 mm) stand out as the wettest NDJFMA seasons in the 40-year period (Figure 2a). Other unusually wet summers include 1988 and 2000, which also show very high rainfall totals (Figure 2a). Over the study period, there were only seven instances where the NDJFMA summer rainfall exceeded 200 mm, emphasizing the rarity of such high seasonal rainfall amounts. Seasonal decomposition further reveals the contributions of individual sub-seasons to these anomalies. For example, the ND of 1999/2000 and 2020/21 rank among the highest in terms of rainfall for that bi-month, while the JF of 2021 stands out as the wettest bi-monthly period, followed by 2006, 2011, and 2022 (Figure 2b,c). However, as expected, an anomalously wet or dry summer overall does not necessarily mean that each bi-monthly sub-season showed the same behavior. For example, MA 2021 was not excessively wet despite that summer being the wettest on record and nor was ND 1987, even though NDJFMA 1987/88 received well above average rainfall.
Figure 2a shows that most of the anomalously wet summers (at least one standard deviation) occurred during La Niña, but not all La Niña summers were wetter than average. Specifically, six out of thirteen La Niñas experienced at least one standard deviation above the average rainfall, but one summer received one standard deviation below and two others around half a deviation less than average. Likewise, the dry summers tend to occur during El Niño summers. Of the eleven El Niños, six were significantly dry, but one received about 1.5 standard deviations more than average. On this basis, it appears that the La Niña signal is less consistent than El Niño over the study region. Diversity in the sign and magnitude of the ENSO impacts on summer rainfall occurs in other regions of Southern Africa [22]. Figure 2b–d indicate that the strength of the ENSO impact noticeably varies throughout the summer and appears most mixed in ND, when there are more seasons with the opposite-expected rainfall anomaly compared to the summer as a whole. MA appears to show the most consistent El Niño (but not La Niña) signal in terms of sign. However, the magnitudes of the rainfall anomalies are sometimes noticeably different from the entire season (cf. Figure 2a,d).
Trends were also calculated for the overall summer, as well as each sub-season. It was found that the NDJFMA rainfall totals show a statistically significant increasing trend (R2 = 0.121, p = 0.035). This wetting tendency essentially arises from the core summer (JF) (R2 = 0.167, p = 0.008) because the positive trend values for MA are only very slightly above zero, whereas ND shows a weak but significant drying trend.
Figure 3 shows the number of rainy days for the study period for the overall summer and each sub-season. On average, there are 14 (standard deviation 2.7) moderate wet days over the whole summer and 1 (standard deviation 0.5) heavy rain day. Consistent with the rainfall totals, 2021, 2022, and 1988 stand out with a large number of moderate rain days, as well as heavy rain days overall (Figure 3a), which is also apparent for the core (JF) sub-season (Figure 3c). On the other hand, 2021 only shows a large number of moderate wet days in ND (Figure 3b), whereas for MA, it is 2022 and 1988 that both show large numbers of moderate wet days (Figure 3d), contributing to the overall very wet summer. For the other wet summer (2000), both JF and MA have a relatively large number of moderate wet days, with JF also experiencing two heavy rain days (Figure 3a,c,d). As expected, there are numerous years with no heavy rain days (≥25 mm) and none at all in early summer (ND) (Figure 3b). This season also shows a few years with no moderate wet days (10–24 mm), either of which also happens during the El Niño JF (Figure 3b) seasons of 1992 and 2003 but never for MA (Figure 3d), where every year always experiences at least one moderate rain day.

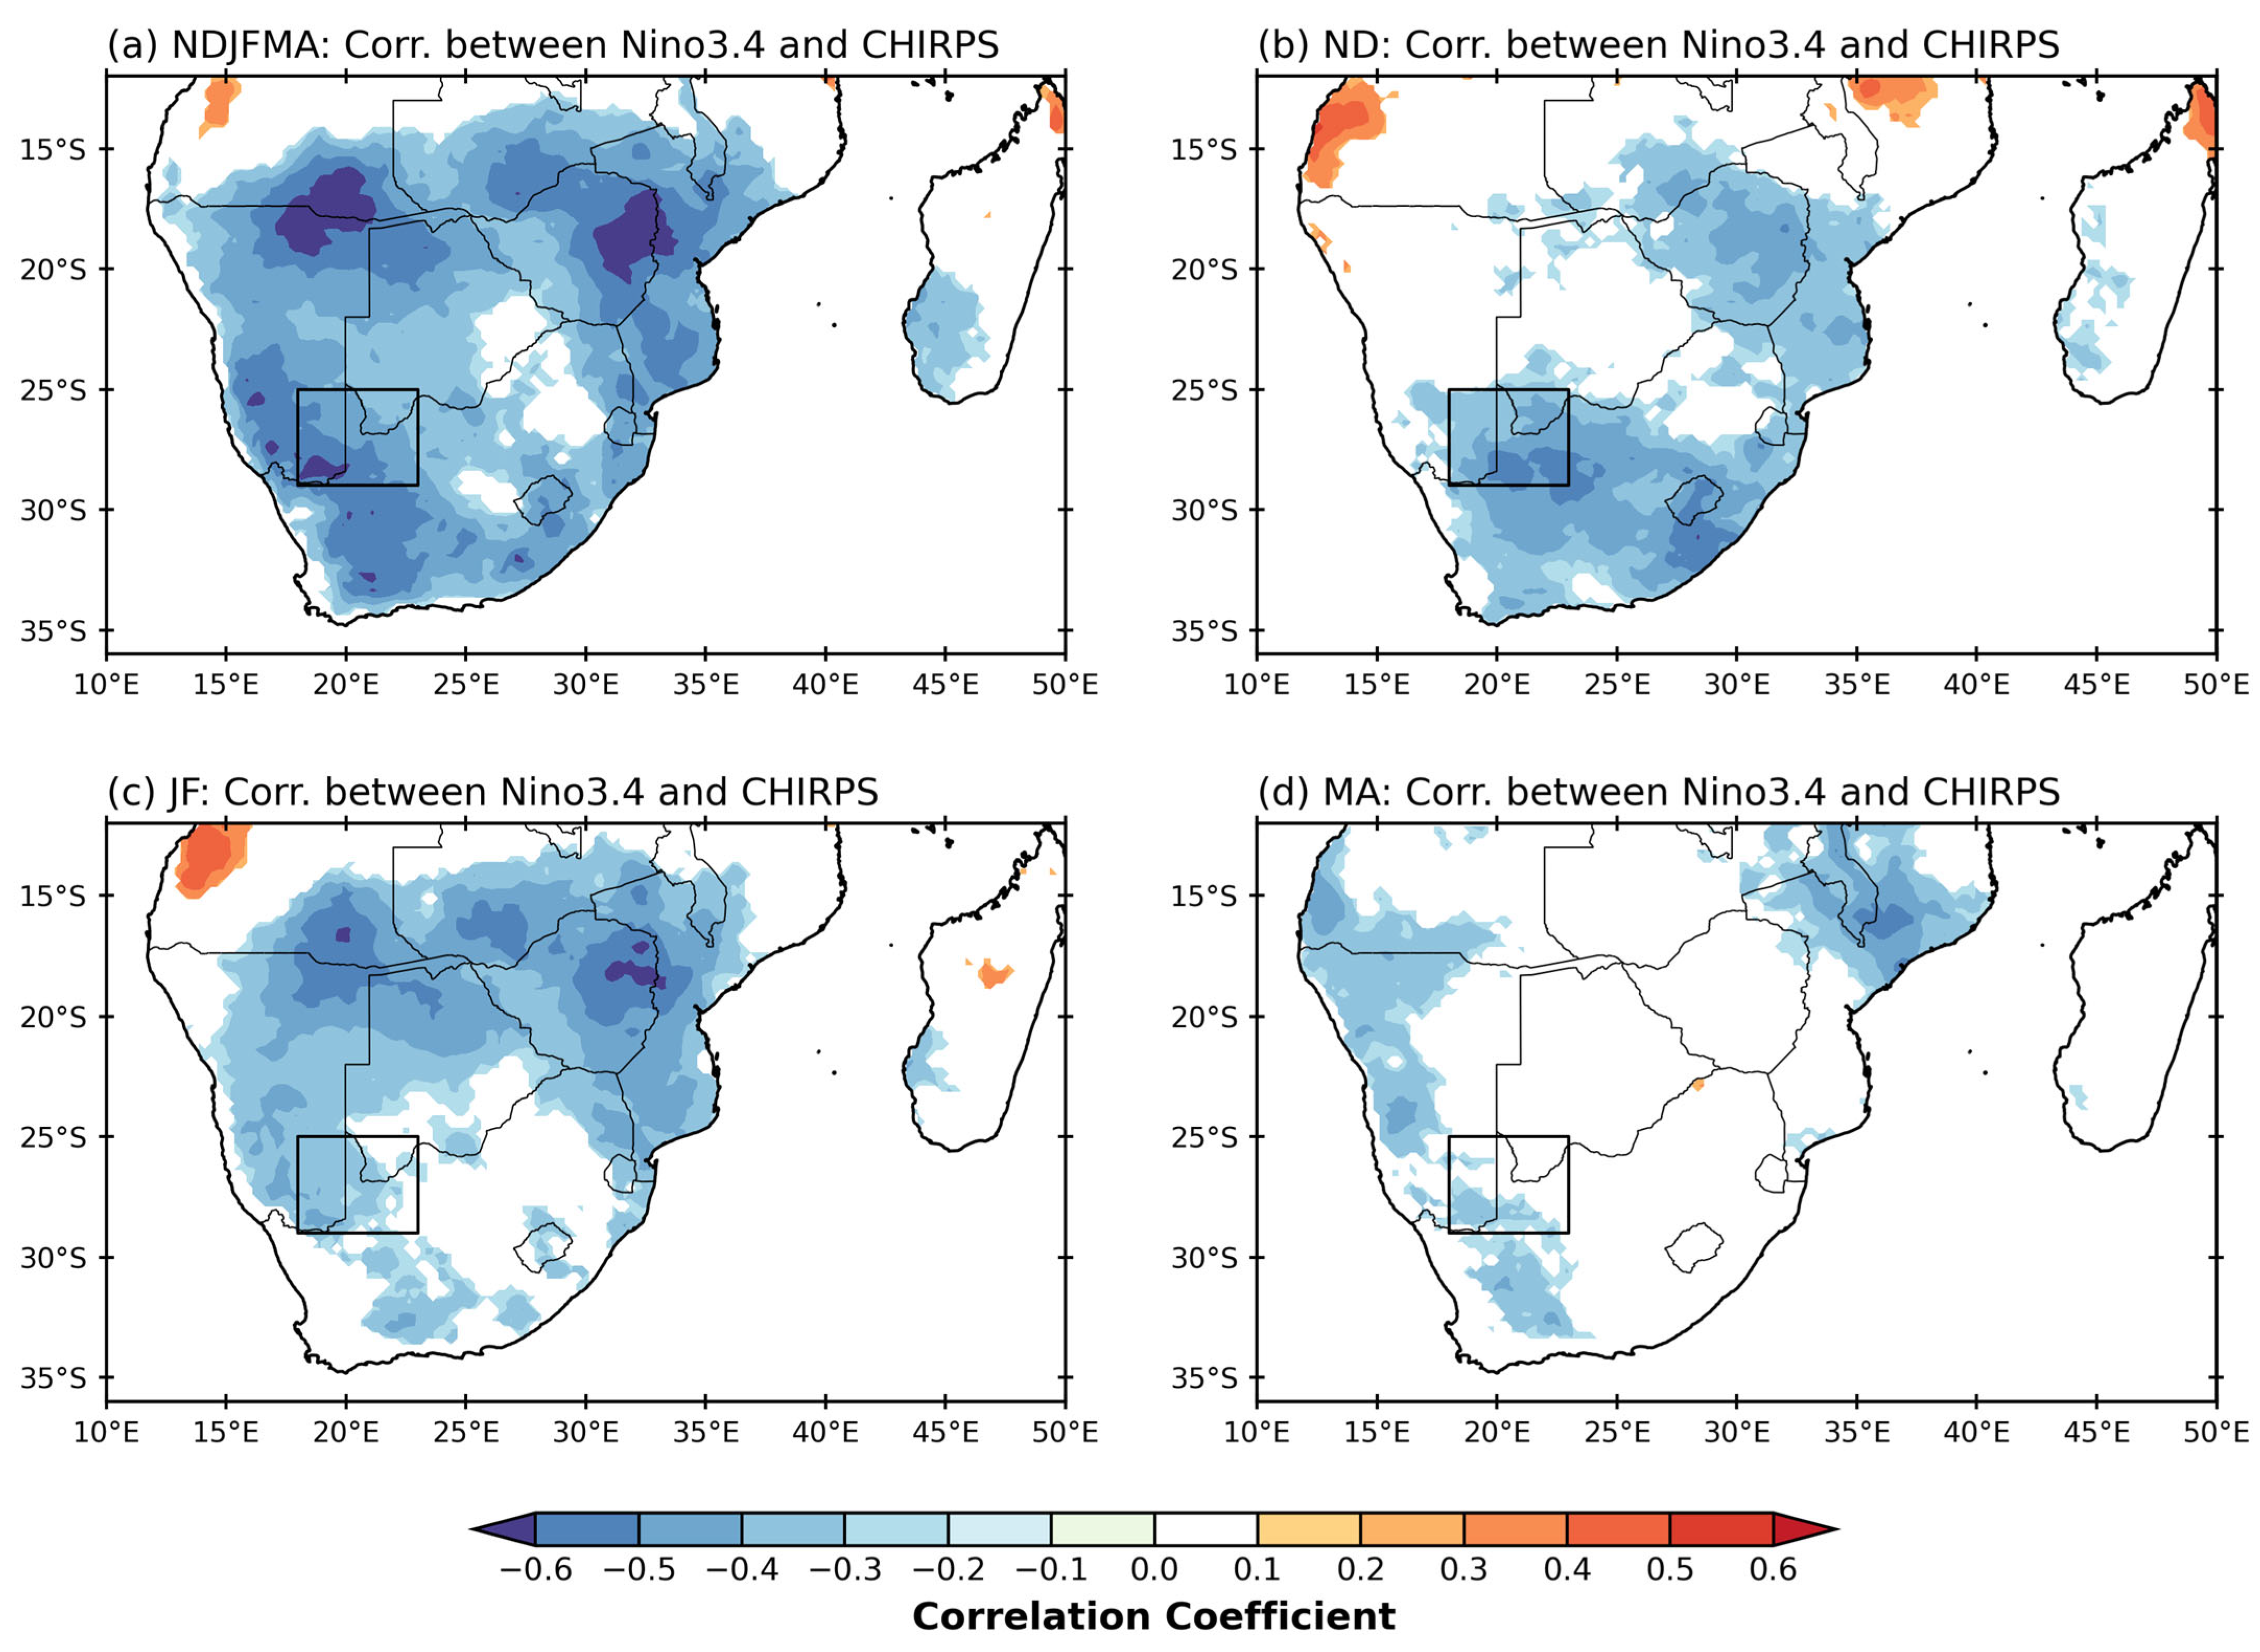
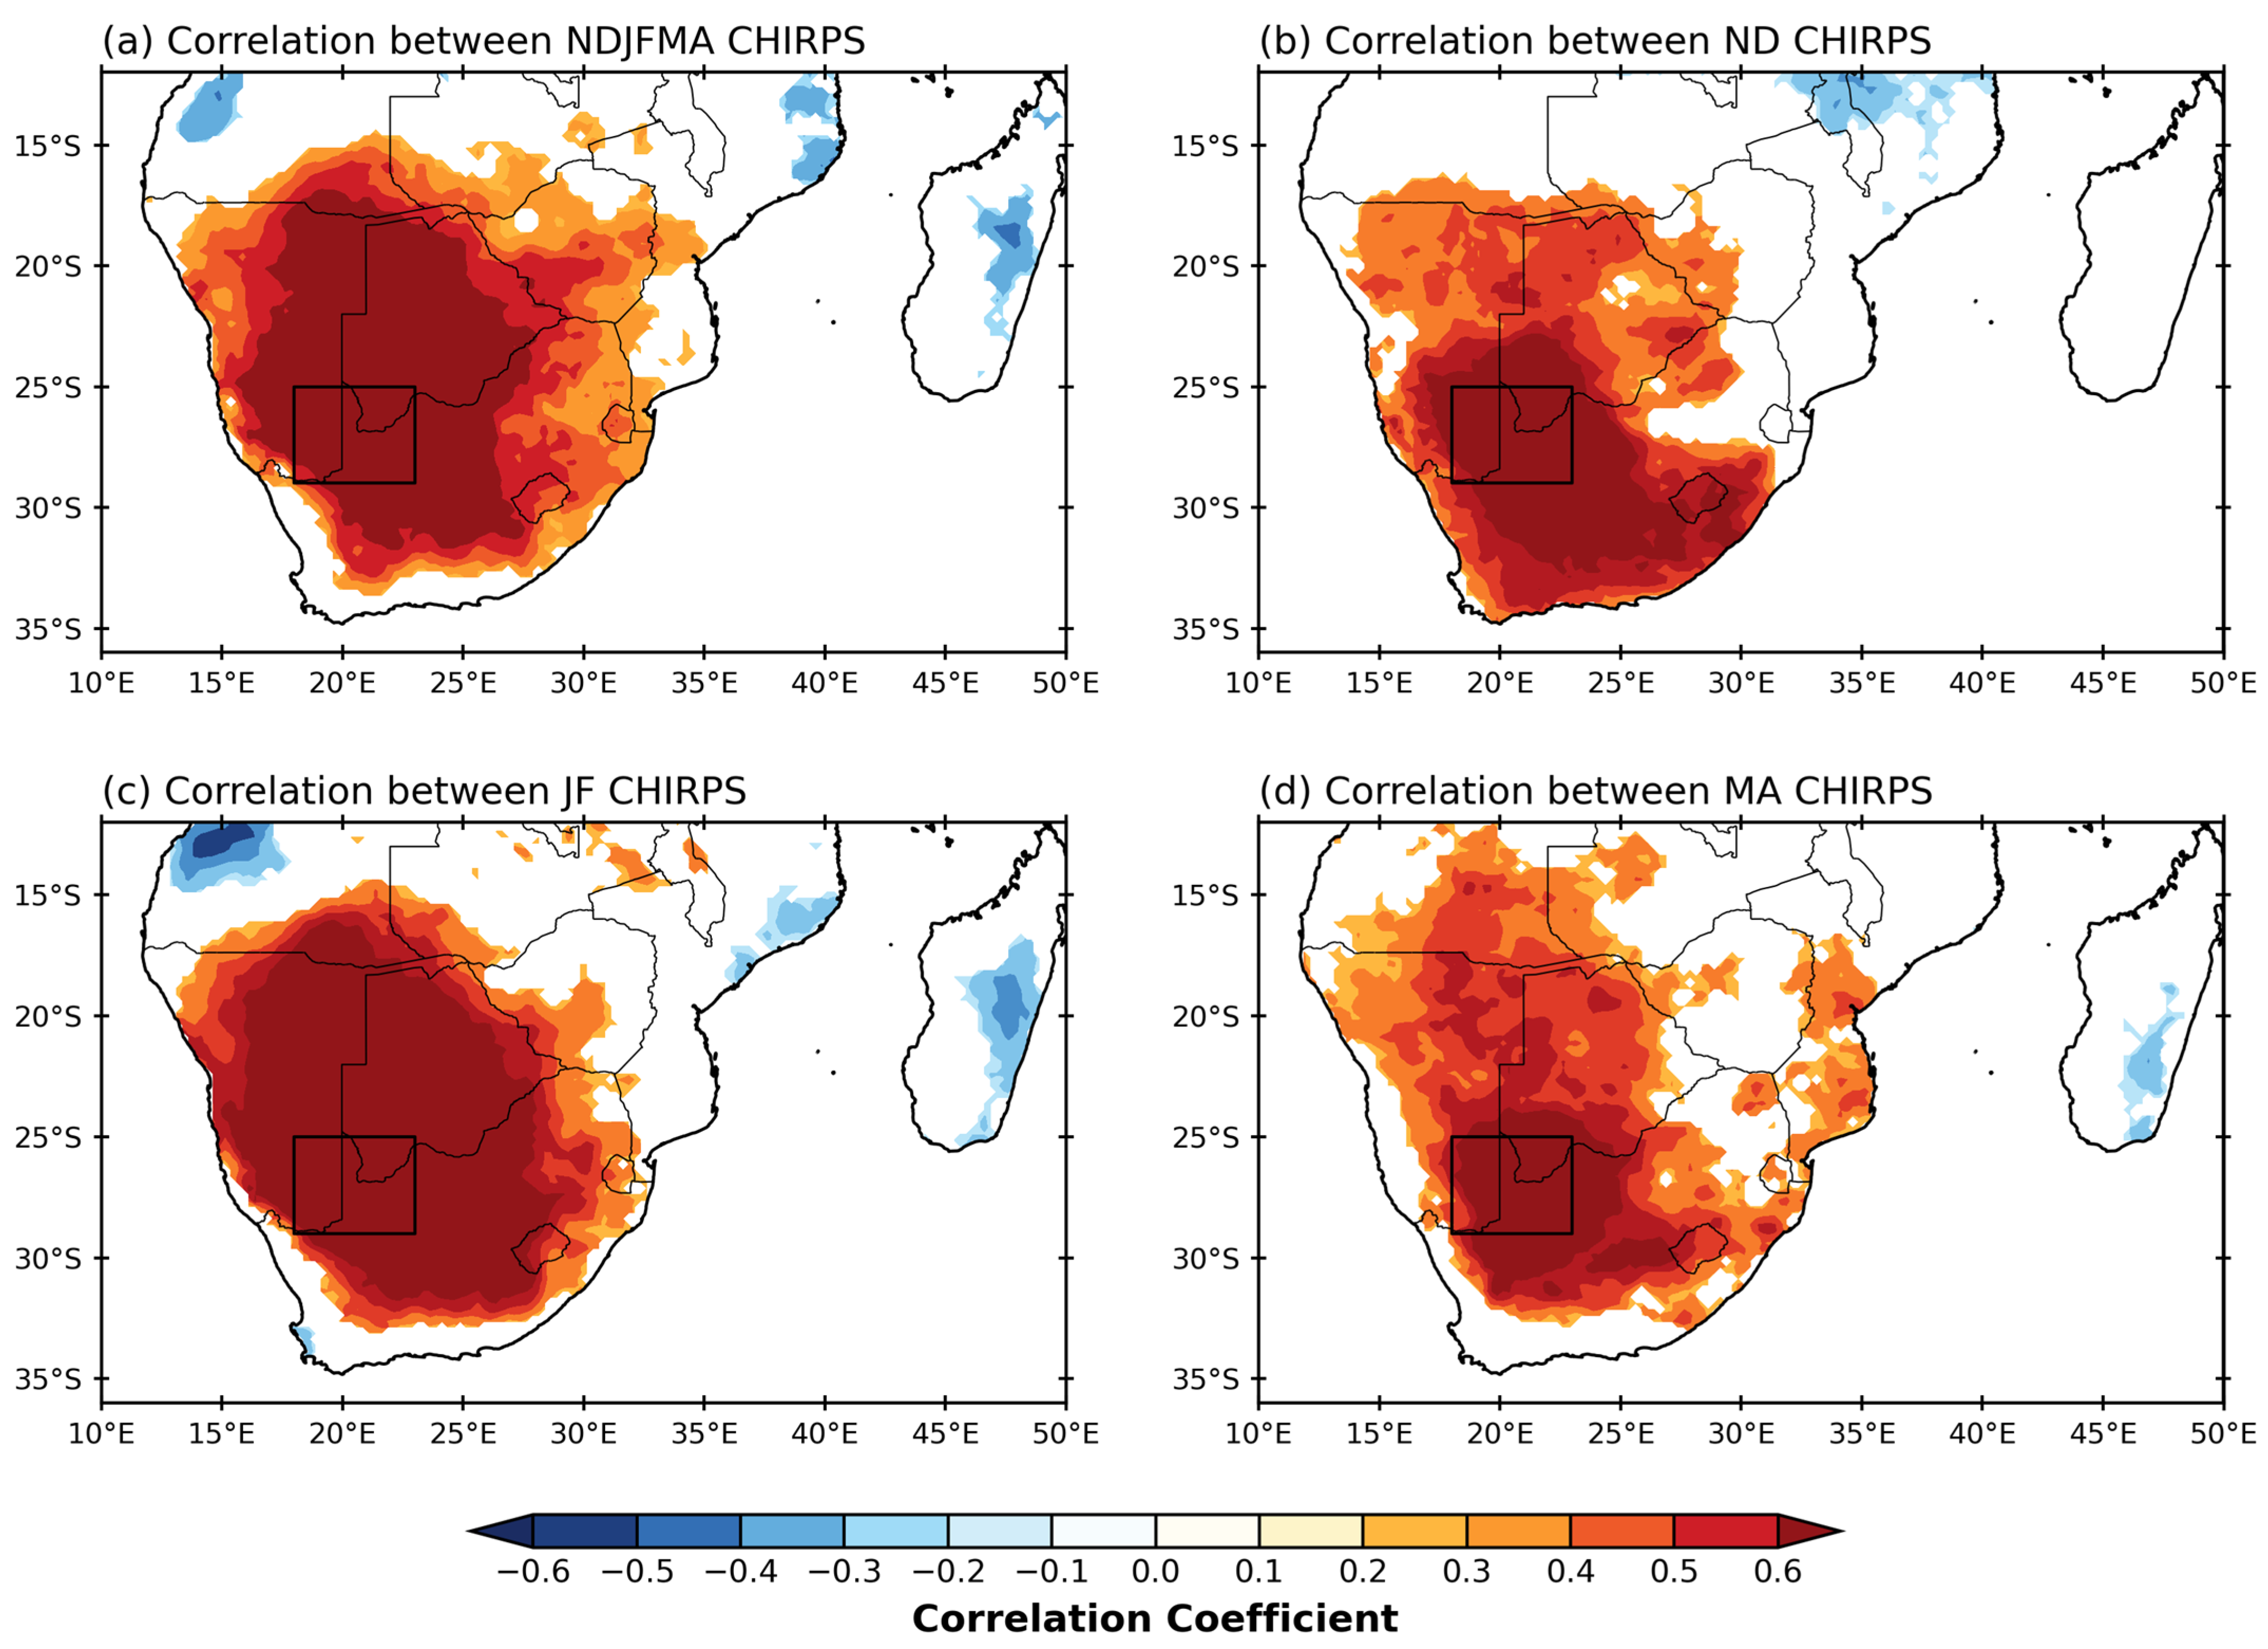
3.2. Rainfall Relationships with the Main Modes of Variability

Table 1 summarizes the correlations between rainfall and modes of climate variability (SAM, ENSO, and SIOD) as well as the Botswana High (BH) Index, with statistically significant correlations (p < 0.05) shown in bold. Detrending was applied to ensure that correlations are not influenced by underlying trends in the time series. For the NDJFMA season, both the ENSO and the BH Index show significant negative correlations with rainfall (−0.5, p < 0.05). For the bi-months, ND exhibits significant correlations for all modes except SIOD, with SAM showing a significant signal of similar magnitude (but opposite sign) to the Botswana High but weaker than ENSO. JF shows significant negative correlations with ENSO, and particularly the BH Index, but no significant results for either SAM or the SIOD. For MA, there are no significant correlations with any of these climate indices except ENSO. The spatial correlations between the SST and the rainfall time series revealed a clear ENSO signal in the Pacific and small areas of significant correlation in parts of the Indian Ocean. No significant correlations were found with the SST in the Atlantic Ocean, however. Consistent with Table 1, the strongest ENSO SST signals are seen in the early summer (ND), whereas MA shows coherent SST anomaly patterns only in the Pacific.
To highlight the contrast in sub-seasonal rainfall patterns between dry and wet years, Table 2 presents the 5 years with either the highest or the lowest rainfall amounts for the full summer and their values for the bi-months. Each of the 5 wettest years (1988/89, 1999/2000, 2010/11, 2020/21, and 2021/22) occurs during a La Niña summer, with two of them happening during so-called triple-dip La Niñas (1998–2001 and 2021–2023). Furthermore, 2021 and 2022 were also characterised by a positive SAM phase. Teleconnections may exist between ENSO and SAM [52,53], with SAM sometimes strengthening the ENSO impacts over Southern Africa [54]. On the other hand, only four of the five driest summers coincide with an El Niño event. Thus, in terms of the top wettest/driest summers in the forty-year record, the La Niña impact is more consistent than is El Niño, whereas when measured using a criterion of well-above versus well-below average rainfall (Figure 2a), the reverse is the case. To further show the relationship between rainfall over the region and ENSO, Figure 4 plots correlations with the Niño 3.4 index for the summer as a whole and for each sub-season. The strongest correlations over the summer as a whole (Figure 4a) are found near the Zimbabwe/Mozambique and the Angola/Namibia border regions, but parts of the study domain are also fairly well-correlated (r~−0.5–−0.6). For the bi-months, there is considerable variation in the relationship with ENSO over both the study domain and Southern Africa more generally. Figure 4b–d suggest that the strongest signal in the study box is in ND, consistent with Table 1, and particularly over its southern part, whereas for Southern Africa, the correlations are strongest in JF (and still significant over the study box). For MA, areas of weak correlation remain in some isolated parts of Southern Africa, including some areas of the study box, as well as strong correlations in Central–Northern Mozambique. In general, the results suggest that the ENSO impact starts off relatively strong in the study box at the beginning of summer and weakens in mid-summer but becomes more widespread over Southern Africa as a whole. By the end of summer, the ENSO signal appears less coherent over Southern Africa.
Correlating the rainfall over the study box with that over Southern Africa (Figure 5) indicates that the relatively strong relationship with that in the neighboring parts of South Africa, Namibia, and Botswana over the summer mainly comes about in JF and, to some extent, ND. For MA (Figure 5d), the areas that are best correlated to the study box are smaller than for the early or mid-summer and have weaker values. The NW-SE slant of the correlation patterns is reminiscent of the orientation of the cloud bands that bring much of subtropical Southern Africa’s summer rainfall [30,55]. Some of the weaker MA relationship may result because cloud bands across Southern Africa are less likely to occur in late summer compared to the earlier months [30] and because more mid-latitude systems such as cut-off lows, which on average occur most often in subtropical Southern Africa in MA [56,57], become substantial rainfall contributors then.

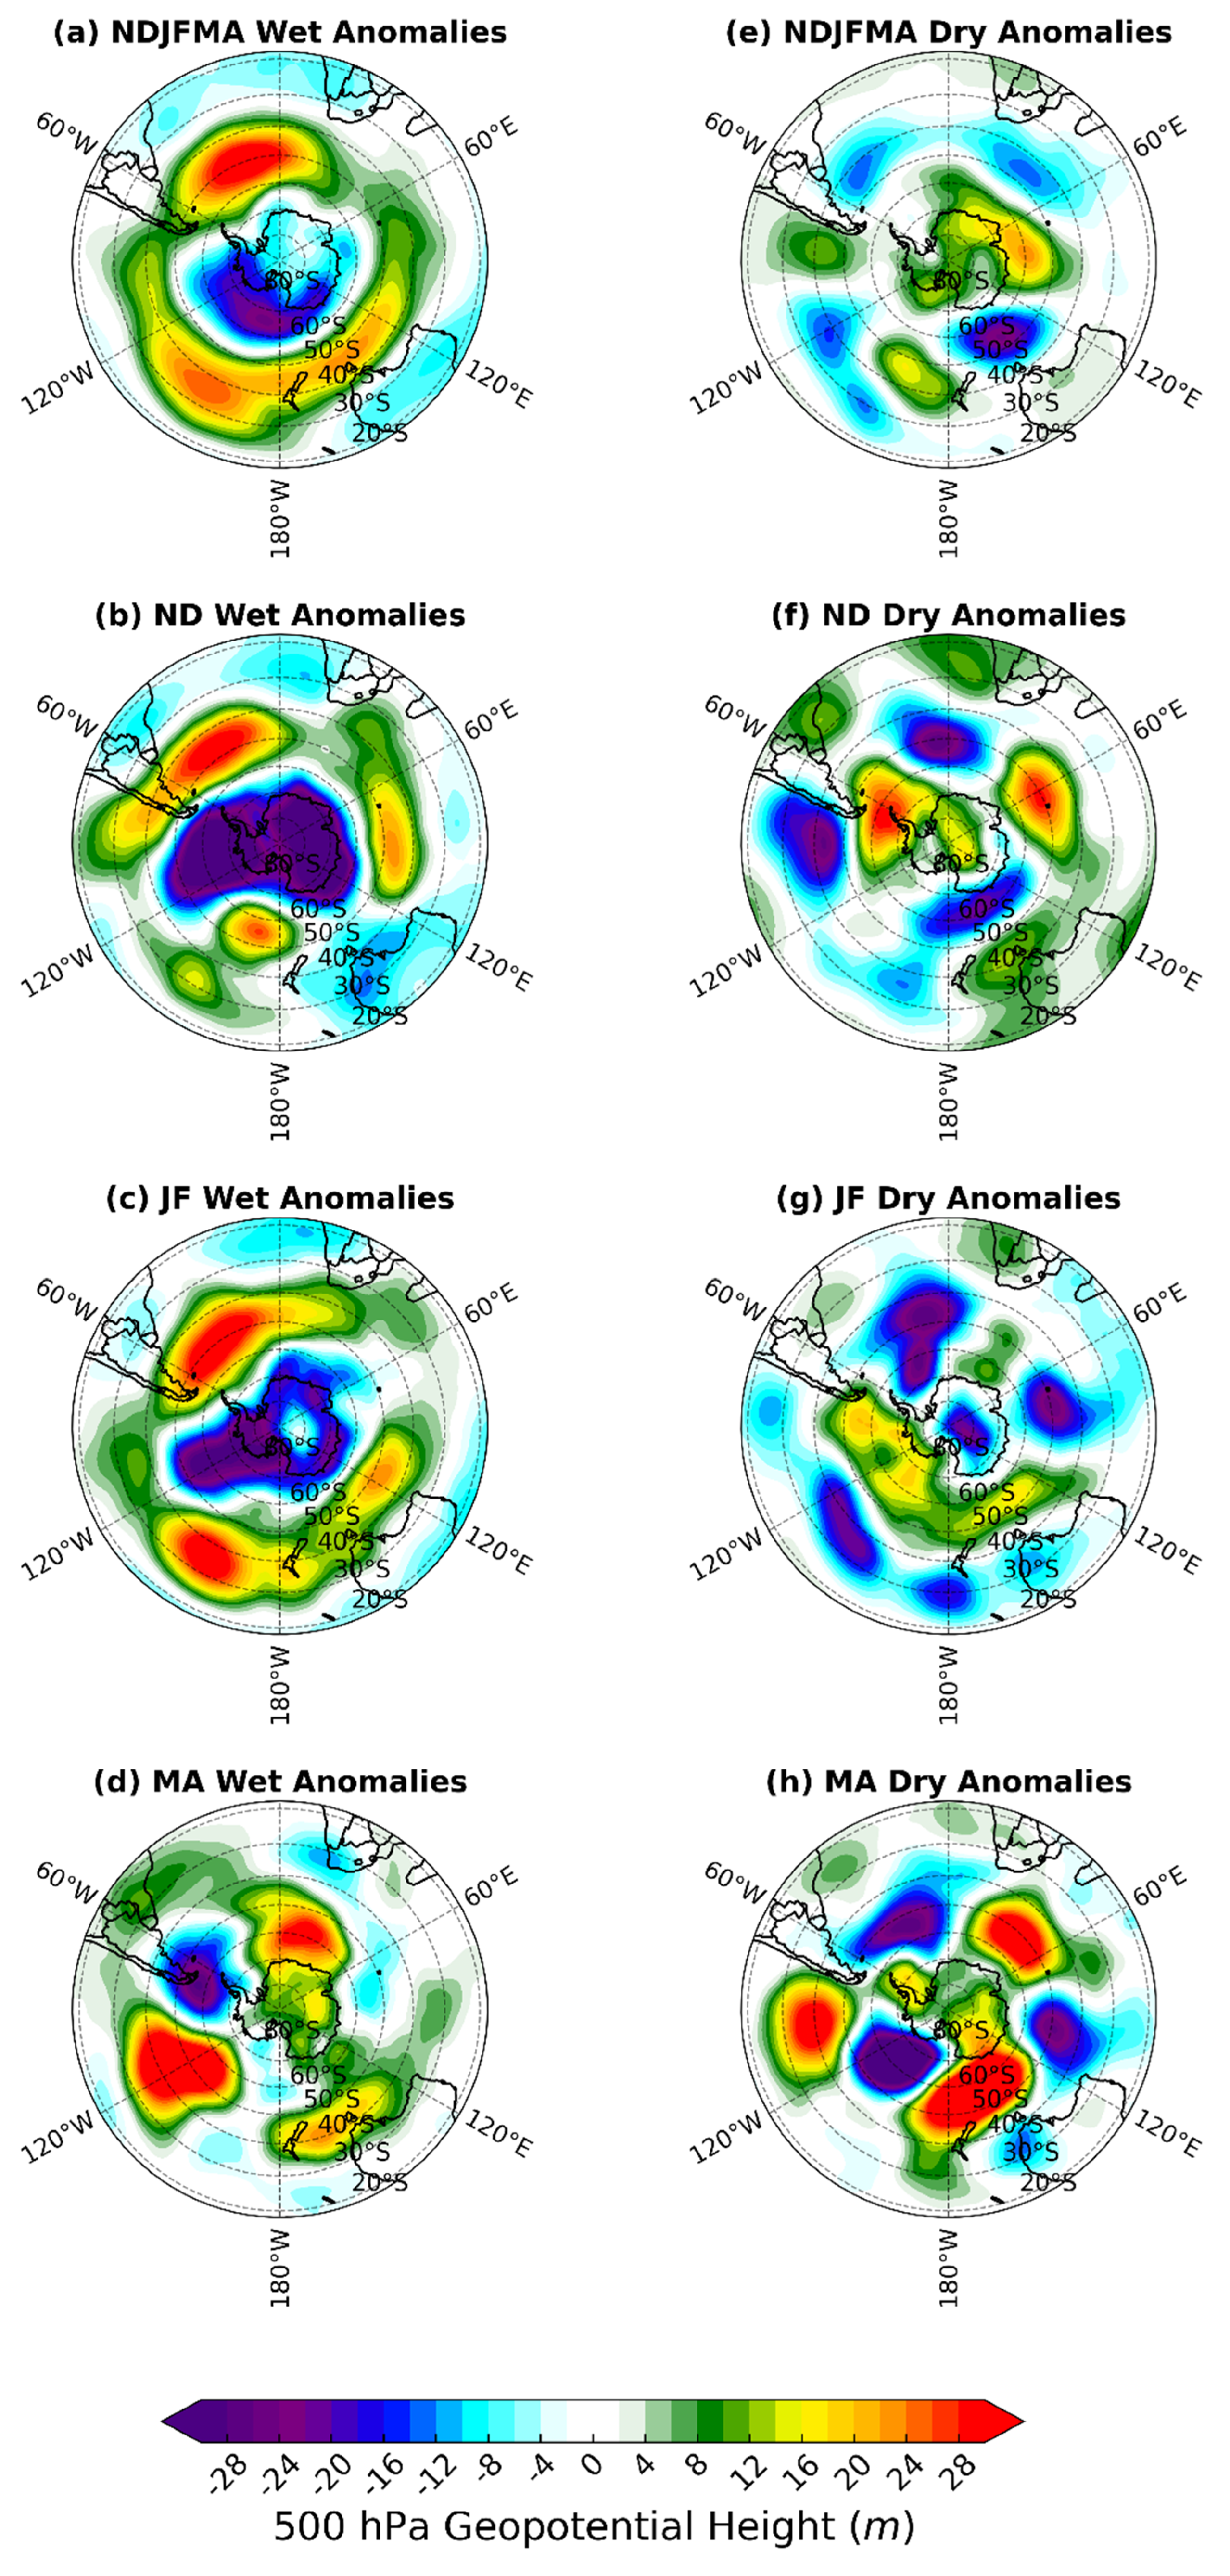
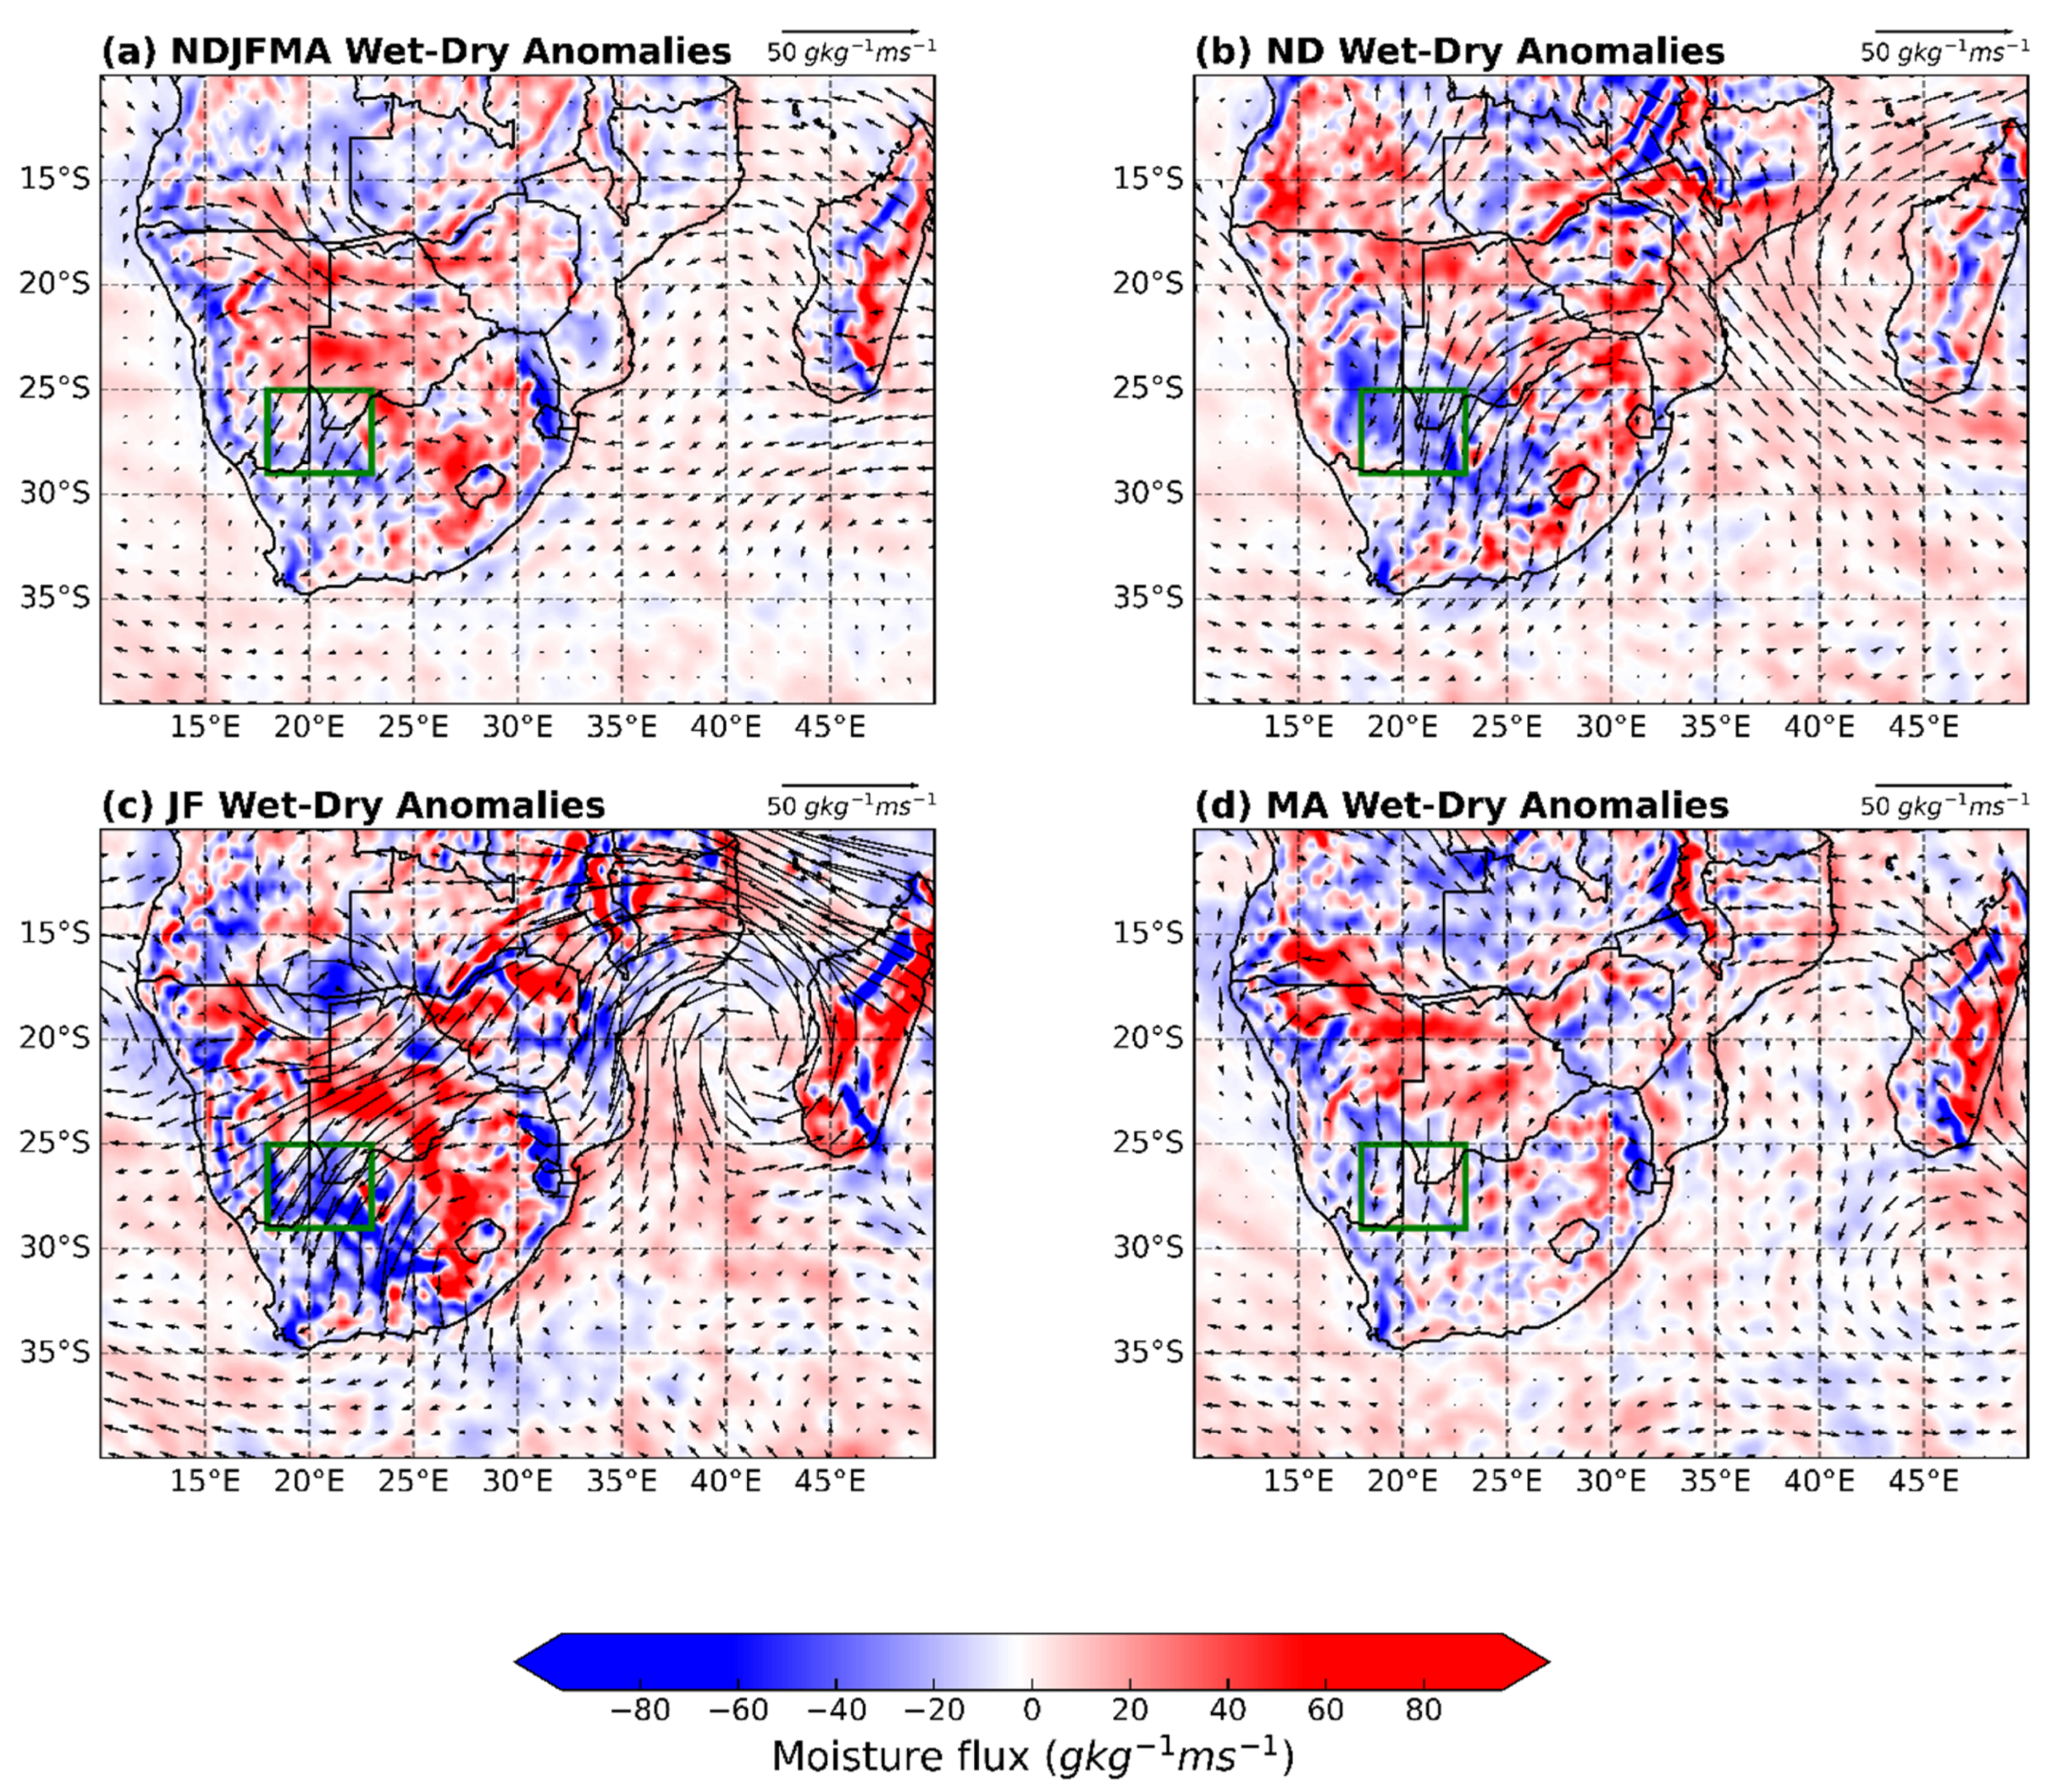
3.3. Circulation Patterns Linked to Wet and Dry Summers

Figure 6 shows wet and dry composite anomalies for 500 hPa geopotential height. Both regional and hemispheric differences are apparent for the summer as a whole (Figure 6a,e), with the wet (dry) composite being characterized by a positive (negative) SAM pattern. Other studies have identified a similar relationship between the SAM and summer rainfall over parts of subtropical Southern Africa [25]. During its positive phase in summer, the SAM tends to strengthen the subtropical jet and shift mid-latitude storm tracks southward, promoting cloud band formation, while the opposite occurs during its negative phase. Over Southern Africa, a weaker (stronger) Botswana High is evident during the wet (dry) case. This weakening (strengthening) is favorable (unfavorable) for rainfall due to less (more) mid-level subsidence and, hence, a greater (smaller) likelihood of deep convection and cloud bands developing. Other studies have also found strong links between changes in the Botswana High and summer rainfall over subtropical Southern Africa [22,32]. These changes in the Botswana High are evident through each of the bi-months (Figure 6b–h), but the SAM pattern breaks down in MA for the wet composite and is only obvious for ND in the dry composite.
An important necessary ingredient for substantial summer rainfall is widespread uplift. To assess changes in this ingredient, Figure 7 plots the wet and dry composite for omega at the 500 hPa level. Averaged over the whole summer, there is weak relative uplift over the study box and most of subtropical Southern Africa in the wet composite, whereas the dry case shows weak relative sinking over this box, as well as South Africa and most of Mozambique (Figure 7a). More obvious patterns may result in the sub-seasonal case, particularly since cloud bands that bring much of the rainfall tend to shift to preferred locations during the summer [30]. In ND, the wet composite shows enhanced relative uplift over the western and central interior, reminiscent of a cloud band pattern, while the dry shows roughly the reverse, with enhanced relative subsidence (Figure 7b,f). During mid-summer (Figure 7c,d), there is widespread relative uplift (sinking) over most of subtropical Southern Africa for the wet (dry) composite. For MA (Figure 7d,h), increased uplift (sinking) is clearly present over the study box and some other areas of the broader region but is less spatially extensive than in mid-summer. Overall, the patterns are consistent with those seen in rainfall.
Changes in the low-level moisture flux into the study box are more subtle and most clearly seen when plotted as the difference between the wet and dry composite (Figure 8). For the whole summer (Figure 8a), there is an increased moist easterly flow off the subtropical Southwest Indian Ocean, which diverges over Botswana to become a stronger northeasterly flow into the study box in the wet versus the dry case. In early summer (Figure 8b), the wet cases show a greater increased transport of moist marine air from the subtropical Southwest Indian Ocean than the dry case, with more (than the whole summer) entering as a northeasterly flow via the Limpopo River Valley, and relative convergence over the study box. The importance of the low-level jet through this valley for summer rainfall over Southern Africa has previously been highlighted [58,59]. In mid-summer (Figure 8c), a broader enhanced northeasterly flow is apparent in the wet, relative to the dry, composite, with convergence over the study box and with enhanced flow through the Zambezi River Valley region now being more important than in early summer. In addition, there is an anticyclonic anomaly in the Mozambique Channel in the mid-summer composite, implying a weaker Mozambique Channel Trough. A weaker trough was found [60] to correspond to increased summer rainfall over the mainland. There is also a cyclonic feature present over Southeastern Angola/Northeastern Namibia, together with increased moisture inflow from the tropical Southeast Atlantic in the wet versus the dry case, implying a stronger Angola low, which is known to be associated with wetter conditions over subtropical Southern Africa [35,36,37]. For the MA sub-season (Figure 8d), enhanced northerly flow and relative convergence over the study box are still present in the wet versus the dry case, but the anomalies elsewhere are much weaker than for the early or mid-summer.

4. Discussion

This study examined the interannual variability of rain days and associated large-scale circulation anomalies that result in wet and dry summers over the Southern Kalahari, a region also characterized by pronounced climate variability on interdecadal and longer time scales [61,62,63,64,65]. On average, this semi-arid region receives virtually no rainfall in the winter half of the year and is typically wettest in January, February, and March, with April being wetter than November but less wet than December. Hence, the bi-months of ND, JF, and MA were chosen. Overall, the summers of 2020/21 and 2021/22 were the wettest over the last four decades. A trend analysis suggests that summer as a whole is getting wetter. This significant trend results essentially from the mid-summer (JF), since the early summer (ND) shows a significant weak drying, whereas there are no significant trends for the late summer (MA).
Two types of rain days were considered, with the moderate defined as 10–24 mm and the heavy defined as 25 mm or more. This choice was motivated by amounts useful for agriculture (mainly cattle and sheep, as well as small areas of grapes and other fruits in irrigated areas [66] alongside the Orange River in the far south) and which may occur during organised convection such as tropical–extratropical cloud bands. As expected for this semi-arid region, the average number of heavy rain days is small (1 per season with a large standard deviation of 0.5 days) and less than in the wetter areas of Southern Africa near the east coast [9]. No heavy rain days occurred during the early summer sub-season. Most occurred during the mid-summer, with MA also experiencing a number of years with several heavy rain days. However, many JF and MA seasons experienced no heavy rain days at all, highlighting the large interannual variability in this category. The unusually wet summers of 2020/21 and 2021/22 both experienced a large number of heavy rain days, especially in JF. While every summer experienced at least one moderate rain day (average number is 14), there was, again, considerable interannual variability, both seasonally and for each sub-season. Every JF and MA had at least one moderate rain day, with several experiencing between 10 and 16, while for ND, the very wet 2020 and 2021 had 9 and 7 such days, respectively. But there were also several years with no moderate wet days at all. These findings suggest that the anomalies in the number of moderate or heavy rainy days through each sub-season (particularly in JF) are very important for determining whether the overall summer is particularly wet or dry.
Correlations between rainfall and major climate modes, including ENSO, SAM, and the Botswana High, varied across sub-seasons. While there were significant negative correlations between the overall summer rainfall and ENSO and the Botswana High, these were insignificant in MA and strongest in ND (ENSO) and JF (Botswana High). The SAM only showed significant correlations in ND (positive but weaker than magnitude than ENSO). No significant correlations were found either for the overall summer or for any of the sub-seasons with the SIOD or with the Atlantic SST. These results suggest that more attention may need to be paid to the predictability of the Botswana High, given its overall stronger correlations than ENSO in JF and equally strong as SAM in ND. The lack of significant correlation with any of these indices in MA may result from this sub-season coming near the end of the ENSO mature phase and close to the ENSO predictability barrier in boreal spring, as well as the Botswana High typically starting to break down sometime in April [32].
Although the analysis provides insight into the nature of Kalahari rainfall variability, there are limitations that motivate further investigation. Unfortunately, there are not many stations in this region, which may reduce the accuracy of the CHIRPS and ERA-5 datasets used here. An important regional system not explicitly considered here is the Kalahari heat low, which plays a role in the development of convection over this area, particularly via drylines, favoring thunderstorm initiation.

5. Conclusions

The following conclusions may be drawn from the study. First, whether the overall summer in the Southern Kalahari region is particularly wet or dry strongly depends on the numbers of moderate or heavy rainy days occurring in each bi-month.
Second, the statistically significant ENSO correlation with summer rainfall is considerably stronger in November–December than in the other two sub-seasons. Similar variation applies to the Botswana High, except that January–February shows the strongest negative correlation and March–April the weakest. SAM is only significantly correlated (positive) in November–December.
Third, changes in two regional circulation systems, the Botswana High and the Angola Low, are very important for driving summer rainfall variability over the study region through modulations in low-level moisture flux and mid-level subsidence. During wet summers, stronger northeasterly moisture flux anomalies occur towards the Southern Kalahari region, with moisture originating from the Southwest Indian Ocean, on both the seasonal and sub-seasonal scales.
Finally, the findings of this study hold implications for resource management, agricultural planning, and disaster preparedness in this drought-prone region. Insights into rainfall variability and its drivers can aid policymakers in improving early-warning systems and formulating adaptation strategies to mitigate the socio-economic impacts of extreme rainfall seasons. As the Southern Kalahari faces challenges from climate change and a poor, vulnerable population, further research is needed to better understand its climate variability and how this may change in a warming climate.

Author Contributions

Conceptualization, C.R. and R.B.; methodology, B.K., R.B. and C.R.; software, B.K.; validation, B.K., R.B. and C.R.; formal analysis, B.K.; investigation, B.K.; resources, R.B. data curation, B.K.; writing—original draft preparation, B.K.; writing—review and editing, B.K., C.R. and R.B.; visualization, B.K.; supervision, C.R. and R.B.; project administration, C.R.; funding acquisition, R.B. All authors have read and agreed to the published version of the manuscript.

Funding

This research was partially funded by The Royal Society FLAIR programme, grant number FLR\R1\201615.

Institutional Review Board Statement

Not applicable.

Informed Consent Statement

Not applicable.

Data Availability Statement

The ERA5 data used was downloaded from the Copernicus Climate Change Service (C3S) Climate Data Store. CHIRPS rainfall data are freely available from https://www.chc.ucsb.edu/data/chirps (accessed on 4 November 2024).

Acknowledgments

The first author thanks The Royal Society FLAIR programme, grant number FLR\R1\201615, which helped fund her MSc and the current study.

Conflicts of Interest

The authors declare no conflicts of interest.

References

  1. Weldon, D.; Reason, C.J.C. Variability of rainfall characteristics over the South Coast region of South Africa. Theor. Appl. Climatol. 2014, 115, 177–185. [Google Scholar] [CrossRef]
  2. Chase, B.M.; Meadows, M.E. Late Quaternary dynamics of southern Africa’s winter rainfall zone. Earth-Sci. Rev. 2007, 84, 103–138. [Google Scholar] [CrossRef]
  3. Engelbrecht, C.J.; Landman, W.A.; Engelbrecht, F.A.; Malherbe, J. A synoptic decomposition of rainfall over the Cape south coast of South Africa. Clim. Dyn. 2015, 44, 2589–2607. [Google Scholar] [CrossRef]
  4. Conway, D.; Van Garderen, E.A.; Deryng, D.; Dorling, S.; Krueger, T.; Landman, W.; Lankford, B.; Lebek, K.; Osborn, T.; Ringler, C.; et al. Climate and southern Africa’s water–energy–food nexus. Nat. Clim. Change 2015, 5, 837–846. [Google Scholar] [CrossRef]
  5. Rouault, M.; Richard, Y. Intensity and spatial extension of drought in South Africa at different time scales. Water SA 2003, 29, 489–500. [Google Scholar] [CrossRef]
  6. Moses, O.; Blamey, R.C.; Reason, C.J.C. Drought metrics and temperature extremes over the Okavango River basin, southern Africa, and links with the Botswana high. Int. J. Climatol. 2023, 43, 6463–6483. [Google Scholar] [CrossRef]
  7. Tramblay, Y.; Villarini, G.; Zhang, W. Observed changes in flood hazard in Africa. Environ. Res. Lett. 2020, 15, 1040b5. [Google Scholar] [CrossRef]
  8. Spear, D.; Haimbili, E.; Angula, M.; Baudoin, M.A.; Hegga, S.; Zaroug, M.; Okeyo, A. Vulnerability and Adaptation to Climate Change in the Semi-Arid Regions of Southern Africa; ASSAR Working Paper; University of Cape Town: Rondebosch, South Africa, 2015. [Google Scholar]
  9. Thoithi, W.; Blamey, R.C.; Reason, C.J.C. Dry spells, wet days, and their trends across Southern Africa during the summer rainy season. Geophys. Res. Lett. 2021, 48, e2020GL091041. [Google Scholar] [CrossRef]
  10. Bunting, E.; Steele, J.; Keys, E.; Muyengwa, S.; Child, B.; Southworth, J. Local perception of risk to livelihoods in the semi-arid landscape of Southern Africa. Land 2013, 2, 225–251. [Google Scholar] [CrossRef]
  11. Kaphengst, T.; Ward, D. Effects of habitat structure and shrub encroachment on bird species diversity in arid savanna in Northern Cape province, South Africa. J. Afr. Ornithol. 2008, 79, 133–140. [Google Scholar] [CrossRef]
  12. Perkins, J.S. ‘Only connect’: Restoring resilience in the Kalahari ecosystem. J. Environ. Manag. 2019, 249, 109420. [Google Scholar] [CrossRef] [PubMed]
  13. Thoithi, W.; Blamey, R.; Reason, C.J.C. Floods over east coast South Africa: Interactions between a Mesoscale Convective System and a Coastal Meso-Low. Atmosphere 2023, 14, 78. [Google Scholar] [CrossRef]
  14. Dyson, L.L.; Van Heerden, J. The heavy rainfall and floods over the northeastern interior of South Africa during February 2000. S. Afr. J. Sci. 2001, 97, 80–86. [Google Scholar]
  15. Muller, A.; Reason, C.J.; Fauchereau, N. Extreme rainfall in the Namib Desert during late summer 2006 and influences of regional ocean variability. Int. J. Climatol. 2008, 28, 1061–1070. [Google Scholar] [CrossRef]
  16. Lindesay, J.A. South African rainfall, the Southern Oscillation and a Southern Hemisphere semi-annual cycle. J. Climatol. 1988, 8, 17–30. [Google Scholar] [CrossRef]
  17. Rocha, A.; Simmonds, I. Interannual variability of south-eastern African summer rainfall. Part 1: Relationships with air–sea interaction processes. Int. J. Climatol. 1997, 17, 235–265. [Google Scholar] [CrossRef]
  18. Mason, S.J. El Niño, climate change, and Southern African climate. Environmetrics Off. J. Int. Environmetrics Soc. 2001, 12, 327–345. [Google Scholar] [CrossRef]
  19. Reason, C.J.C.; Allan, R.J.; Lindesay, J.A.; Ansell, T.J. ENSO and climatic signals across the Indian Ocean basin in the global context: Part I, Interannual composite patterns. Int. J. Climatol. 2000, 20, 1285–1327. [Google Scholar] [CrossRef]
  20. Cook, K.H. A Southern Hemisphere wave response to ENSO with implications for southern Africa precipitation. J. Atmos. Sci. 2001, 58, 2146–2162. [Google Scholar] [CrossRef]
  21. Reason, C.J.; Jagadheesha, D. A model investigation of recent ENSO impacts over southern Africa. Meteorol. Atmos. Phys. 2005, 89, 181–205. [Google Scholar] [CrossRef]
  22. Blamey, R.C.; Kolusu, S.R.; Mahlalela, P.; Todd, M.C.; Reason, C.J.C. The role of regional circulation features in regulating El Niño climate impacts over southern Africa: A comparison of the 2015/2016 drought with previous events. Int. J. Climatol. 2018, 38, 4276–4295. [Google Scholar] [CrossRef]
  23. Philander, S.G.H. A review of tropical ocean–atmosphere interactions. Tellus B 1999, 51, 71–90. [Google Scholar] [CrossRef]
  24. Mahlalela, P.T.; Blamey, R.C.; Reason, C.J.C. Mechanisms behind early winter rainfall variability in the southwestern Cape, South Africa. Clim. Dyn. 2019, 53, 21–39. [Google Scholar] [CrossRef]
  25. Gillett, N.P.; Kell, T.D.; Jones, P.D. Regional climate impacts of the Southern Annular Mode. Geophys. Res. Lett. 2006, 33. [Google Scholar] [CrossRef]
  26. Behera, S.K.; Yamagata, T. Subtropical SST dipole events in the southern Indian Ocean. Geophys. Res. Lett. 2001, 28, 327–330. [Google Scholar] [CrossRef]
  27. Reason, C.J.C. Subtropical Indian Ocean SST dipole events and southern African rainfall. Geophys. Res. Lett. 2001, 28, 2225–2227. [Google Scholar] [CrossRef]
  28. Harrison, M.S.J. A generalized classification of South African summer rain-bearing synoptic systems. J. Climatol. 1984, 4, 547–560. [Google Scholar] [CrossRef]
  29. Todd, M.; Washington, R. Circulation anomalies associated with tropical-temperate troughs in southern Africa and the south west Indian Ocean. Clim. Dyn. 1999, 15, 937–951. [Google Scholar] [CrossRef]
  30. Hart, N.C.; Reason, C.J.C.; Fauchereau, N. Cloud bands over southern Africa: Seasonality, contribution to rainfall variability and modulation by the MJO. Clim. Dyn. 2013, 41, 1199–1212. [Google Scholar] [CrossRef]
  31. Macron, C.; Pohl, B.; Richard, Y. How do Tropical Temperate Troughs Form and Develop over Southern Africa? J. Clim. 2014, 27, 1633–1647. [Google Scholar] [CrossRef]
  32. Reason, C.J.C. The Bolivian, Botswana, And Bilybara Highs And Southern Hemisphere Drought/Floods. Geophys. Res. Lett. 2016, 43, 1280–1286. [Google Scholar] [CrossRef]
  33. Unganai, L.S.; Mason, S.J. Long-range predictability of Zimbabwe summer rainfall. Int. J. Climatol. 2002, 22, 1091–1103. [Google Scholar] [CrossRef]
  34. Mulenga, H.M. Southern African Climate Anomalies, Summer Rainfall and the Angola Low. Ph.D. Dissertation, University of Cape Town, Cape Town, South Africa, 1999. Available online: http://hdl.handle.net/11427/19649 (accessed on 4 November 2024).
  35. Munday, C.; Washington, R. Circulation controls on southern African precipitation in coupled models: The role of the Angola Low. J. Geophys. Res. Atmos. 2017, 122, 861–877. [Google Scholar] [CrossRef]
  36. Rouault, M.; Florenchie, P.; Fauchereau, N.; Reason, C.J. South East tropical Atlantic warm events and southern African rainfall. Geophys. Res. Lett. 2003, 30. [Google Scholar] [CrossRef]
  37. Cook, C.; Reason, C.J.C.; Hewitson, B.C. Wet and dry spells within particularly wet and dry summers in the South African. Clim. Res. 2004, 26, 17–31. [Google Scholar] [CrossRef]
  38. Hart, N.C.G.; Reason, C.J.C.; Fauchereau, N. Tropical–extratropical interactions over southern Africa: Three cases of heavy summer season rainfall. Mon. Weather Rev. 2010, 138, 2608–2623. [Google Scholar] [CrossRef]
  39. Funk, C.; Peterson, P.; Landsfeld, M.; Pedreros, D.; Verdin, J.; Shukla, S.; Husak, G.; Rowland, J.; Harrison, L.; Hoell, A.; et al. The climate hazards infrared precipitation with stations—A new environmental record for monitoring extremes. Sci. Data 2015, 2, 150066. [Google Scholar] [CrossRef]
  40. Saeidizand, R.; Sabetghadam, S.; Tarnavsky, E.; Pierleoni, A. Evaluation of CHIRPS rainfall estimates over Iran. Q. J. R. Meteorol. Soc. 2018, 144, 282–291. [Google Scholar] [CrossRef]
  41. Pitman, W.V.; Bailey, A.K. Can CHIRPS fill the gap left by the decline in the availability of rainfall stations in Southern Africa? Water SA 2021, 47, 162–171. [Google Scholar] [CrossRef]
  42. Adler, R.F.; Huffman, G.J.; Chang, A.; Ferraro, R.; Xie, P.P.; Janowiak, J.; Rudolf, B.; Schneider, U.; Curtis, S.; Bolvin, D.; et al. The version-2 global precipitation climatology project (GPCP) monthly precipitation analysis (1979–present). J. Hydrometeorol. 2003, 4, 1147–1167. [Google Scholar] [CrossRef]
  43. Xie, P.; Arkin, P.A. Global precipititation: A 17-year monthly analysis based on gauge observations, satellite estimates, and numerical model outputs. Bull. Am. Meteorol. Soc. 1997, 78, 2539–2558. [Google Scholar] [CrossRef]
  44. Dinku, T.; Funk, C.; Peterson, P.; Maidment, R.; Tadesse, T.; Gadain, H.; Ceccato, P. Validation of the CHIRPS satellite rainfall estimates over eastern Africa. Q. J. R. Meteorol. Soc. 2018, 144, 292–312. [Google Scholar] [CrossRef]
  45. du Plessis, J.A.; Kibii, J.K. Applicability of CHIRPS-based satellite rainfall estimates for South Africa. J. S. Afr. Inst. Civ. Eng. 2021, 63, 43–54. [Google Scholar] [CrossRef]
  46. Novella, N.S.; Thiaw, W.M. African rainfall climatology version 2 for famine early warning systems. J. Appl. Meteorol. Climatol. 2013, 52, 588–606. [Google Scholar] [CrossRef]
  47. Maidment, R.I.; Grimes, D.; Allan, R.P. The 30 year TAMSAT African rainfall climatology and time series (TARCAT) data set. J. Geophys. Res. Atmos. 2014, 119, 610–619. [Google Scholar] [CrossRef]
  48. Maphugwi, M.; Blamey, R.C.; Reason, C.J.C. Rainfall characteristics over the Congo Air Boundary region in southern Africa: A comparison of station and gridded rainfall products. Atmos. Res. 2024, 311, 107718. [Google Scholar] [CrossRef]
  49. Hersbach, H.; Bell, B.; Berrisford, P.; Hirahara, S.; Horányi, A.; Muñoz-Sabater, J.; Nicolas, J.; Peubey, C.; Radu, R.; Schepers, D.; et al. The ERA5 global reanalysis. Q. J. R. Meteorol. Soc. 2020, 146, 1999–2049. [Google Scholar] [CrossRef]
  50. Trenberth, K.E. The definition of El Niño. Bull. Am. Meteorol. Soc. 1997, 78, 2771–2778. [Google Scholar] [CrossRef]
  51. Marshall, G.J. Trends in the Southern Annular Mode from observations and reanalyses. J. Clim. 2003, 16, 4134–4143. [Google Scholar] [CrossRef]
  52. Carvalho, L.M.V.; Jones, C.; Ambrizzi, T. Opposite phases of the Antarctic oscillation and relationships with intraseasonal to interannual activity in the tropics during the austral summer. J. Clim. 2005, 18, 702–718. [Google Scholar] [CrossRef]
  53. Clem, K.R.; Fogt, R.L. Varying roles of ENSO and SAM on the Antarctic Peninsula climate in austral spring. J. Geophys. Res. Atmos. 2013, 118, 11481–11492. [Google Scholar] [CrossRef]
  54. Pohl, B.; Fauchereau, N.; Richard, Y.; Rouault, M.; Reason, C.J.C. Interactions between synoptic, intraseasonal and interannual convective variability over Southern Africa. Clim. Dyn. 2009, 33, 1033–1050. [Google Scholar] [CrossRef]
  55. Fauchereau, N.; Pohl, B.; Reason, C.J.C.; Rouault, M.; Richard, Y. Rouault Recurrent daily OLR patterns in the Southern Africa/Southwest Indian Ocean region, implications for South African rainfall and teleconnections. Clim. Dyn. 2009, 32, 575–591. [Google Scholar] [CrossRef]
  56. Singleton, A.T.; Reason, C.J.C. Variability in the characteristics of cut-off low pressure systems over subtropical southern Africa. Int. J. Climatol. 2007, 27, 295–310. [Google Scholar] [CrossRef]
  57. Favre, A.; Hewitson, B.; Lennard, C.; Cerezo-Mota, R.; Tadross, M. Cut-off lows in the South Africa region and their contribution to precipitation. Clim. Dyn. 2013, 41, 2331–2351. [Google Scholar] [CrossRef]
  58. Spavins-Hicks, Z.D.; Washington, R.; Munday, C. The Limpopo Low-Level Jet: Mean climatology and role in water vapor transport. J. Geophys. Res. Atmos. 2021, 126, e2020JD034364. [Google Scholar] [CrossRef]
  59. Munday, C.; Washington, R.; Hart, N. African low-level jets and their importance for water vapor transport and rainfall. Geophys. Res. Lett. 2021, 48, e2020GL090999. [Google Scholar] [CrossRef]
  60. Barimalala, R.; Blamey, R.C.; Desbiolles, F.; Reason, C.J. Variability in the Mozambique Channel Trough and Impacts on Southeast African Rainfall. J. Clim. 2020, 33, 749–765. [Google Scholar] [CrossRef]
  61. Tyson, P.D.; Dyer, T.G.; Mametse, M.N. Secular changes in South African rainfall: 1880 to 1972. Q. J. R. Meteorol. Soc. 1975, 101, 817–833. [Google Scholar] [CrossRef]
  62. Tyson, P.D.; Preston-Whyte, R. The Weather and Climate of Southern Africa; Oxford University Press: Oxford, UK, 2000; 396p. [Google Scholar]
  63. Allan, R.J.; Reason, C.J.C.; Lindesay, J.A.; Ansell, T.J. Protracted ENSO episodes and their impacts in the Indian Ocean region. Deep Sea Res. Part II Top. Stud. Oceanogr. 2003, 50, 2331–2347. [Google Scholar] [CrossRef]
  64. Reason, C.J.C.; Rouault, M. ENSO-like decadal patterns and South African rainfall. Geophys. Res. Lett. 2002, 29, 16-1–16-4. [Google Scholar] [CrossRef]
  65. Malherbe, J.; Dieppois, B.; Maluleke, P.; Van Staden, M.; Pillay, D.L. South African droughts and decadal variability. Nat. Hazards 2016, 80, 657–681. [Google Scholar] [CrossRef]
  66. Gillitt, C.G.; Nieuwoudt, W.L.; Backeberg, G.R. Water markets in the lower Orange River catchment of South Africa. Agrekon 2005, 44, 363–382. [Google Scholar] [CrossRef]
Figure 1. Map showing the elevation (shaded; m) and location of the study domain (Southern Kalahari) found in the western parts of Southern Africa (represented by the red box). The study area covers the southeastern parts of Namibia, the southwestern parts of Botswana, and the western parts of South Africa (i.e., the northern parts of Northern Cape province).
Atmosphere 16 00747 g001
Figure 2. Standardized rainfall anomalies for the full summer (a) NDJFMA, as well as per bi-seasons (b) ND, (c) JF, and (d) MA from 1981 through to 2022. Blue (red) columns correspond to La Niña (El Niño). Grey columns denote neutral ENSO conditions.
Atmosphere 16 00747 g002
Figure 3. Number of rainy days (a) NDJFMA, (b) ND, (c) JF, and (d) MA calculated for when at least 10% of the grid points within the study region exceeding 10 mm (25 mm) for moderate (heavy) wet days depicted in light (dark) blue bars. Each bar has its own count written within the bars as numbers in white. The line in panel (a) represents the average number of moderate wet days during NDJFMA.
Atmosphere 16 00747 g003
Figure 4. Detrended correlation between the Niño 3.4 index and rainfall over Southern Africa for (a) NDJFMA, (b) ND, (c) JF, and (d) MA. Only values that are statistically significant (p < 0.05) are plotted. The black box shows the study region.
Atmosphere 16 00747 g004
Figure 5. Detrended correlation between the average rainfall over the study box (Figure 1) and rainfall over southern Africa for (a) NDJFMA, (b) ND, (c) JF, and (d) MA. Only values that are statistically significant (p < 0.05) are plotted. The black box shows the study region.
Atmosphere 16 00747 g005
Figure 6. 500 hPa geopotential height composite anomalies (shaded; m). These are anomalies for the top 5 wettest (ad) and driest (eh) years for the seasons NDJFMA, ND, JF, and MA. The five wettest (driest) years used here are presented in Table 2.
Atmosphere 16 00747 g006
Figure 7. Composite anomalies of low level (500 hPa) omega (shaded; P a / s ) during wet (dry) years for (a,e) NDJFMA, (b,f) ND, (c,g) JF, and (d,h) MA. The five wet years used for the composite are presented in Table 2. Negative values imply relative uplift. The green box shows the study region.
Atmosphere 16 00747 g007
Figure 8. Wet minus dry composite of low-level (850 hPa) moisture flux (shaded with vectors; g k g 1 m s 1 ) for (a) NDJFMA, (b) ND, (c) JF, and (d) MA. The five years used for the composites are presented in Table 2. The green box shows the study region.
Atmosphere 16 00747 g008
Table 1. Correlation of the climate modes (i.e., SAM, ENSO, and SIOD) and the BH index with rainfall. Values in bold are statistically significant at least at 95% (p < 0.05).
SAMENSOSIODBH Index
NDJFMA0.3−0.5−0.1−0.5
ND0.4−0.5−0.1−0.4
JF0.04−0.30.2−0.5
MA0.1−0.3−0.05−0.3
Table 2. The top 5 wettest years and driest years are based on standardised anomalies, rainfall totals, and phases for NDJFMA, ND, JF, and MA from the 40-year period.
Months Wet Dry
YearRain Total (mm)Std. AnomENSOSAMYearRain Total (mm)Std. AnomENSOSAM
NDJFMA2020/21301.92.8La NiñaPos1981/8258.9−2.0NeutralPos
NDJFMA2021/22271.32.2La NiñaPos1994/9598.2−1.2El NiñoPos
NDJFMA1999/2000242.91.6La NiñaNeg2019/20100.5−1.2NeutralNeg
NDJFMA1987/88240.41.6La NiñaPos2002/03102.0−1.2El NiñoNeg
NDJFMA2010/11227.8 1.3La NiñaPos1982/83106.4−1.1El NiñoNeg
ND199971.02.3La NiñaPos201515.1−1.4El NiñoPos
ND202070.82.3La NiñaPos198916.0−1.4NeutralPos
ND199663.81.8NeutralNeg199716.4−1.3El NiñoNeg
ND198861.61.7La NiñaPos199217.8−1.2NeutralPos
ND198358.01.4La NiñaPos201818.9−1.2El NiñoPos
JF2021170.63.0La NiñaPos198419.0−1.4NeutralNeg
JF2006130.31.8La NiñaNeg199224.4−1.2El NiñoNeg
JF2011122.51.6La NiñaPos199527.1−1.1El NiñoPos
JF2022120.41.5La NiñaPos201328.8−1.1NeutralPos
JF2009116.51.4La NiñaPos201530.3−1.1El NiñoPos
MA1988100.82.5NeutralPos200327.8−1.5NeutralPos
MA202299.52.4La NiñaPos199631.5−1.3La NiñaPos
MA200589.61.9NeutralPos198133.0−1.3NeutralNeg
MA200184.91.6NeutralPos201934.2−1.2El NiñoPos
MA201882.61.5La NiñaNeg198535.9−1.1La NiñaPos
Disclaimer/Publisher’s Note: The statements, opinions and data contained in all publications are solely those of the individual author(s) and contributor(s) and not of MDPI and/or the editor(s). MDPI and/or the editor(s) disclaim responsibility for any injury to people or property resulting from any ideas, methods, instructions or products referred to in the content.

