Article

Comprehensive Analysis of the Driving Forces Behind NDVI Variability in China Under Climate Change Conditions and Future Scenario Projections

1
Jiangsu Key Laboratory of Atmospheric Environment Monitoring and Pollution Control, Jiangsu Collaborative Innovation Center of Atmospheric Environment and Equipment Technology, School of Environmental Science and Engineering, Nanjing University of Information Science & Technology, Nanjing 210044, China
2
State Key Laboratory of Remote Sensing and Digital Earth, Aerospace Information Research Institute, Chinese Academy of Sciences, Beijing 100101, China
3
Collaborative Innovation Center on Forecast and Evaluation of Meteorological Disasters (CIC-FEMD), Nanjing University of Information Science & Technology, Nanjing 210044, China
*
Author to whom correspondence should be addressed.
Atmosphere 2025, 16(6), 738; https://doi.org/10.3390/atmos16060738
Submission received: 1 May 2025 / Revised: 10 June 2025 / Accepted: 14 June 2025 / Published: 17 June 2025
(This article belongs to the Section Air Quality and Health)

Abstract

Climate change has a significant impact on vegetation development. While existing studies provide some insights, long-term trend analysis and multifactor driver assessments for China are still lacking. At the same time, research on the future vegetation development under different climate change scenarios needs further strengthening. In response to these issues, this study analyzed China’s normalized difference vegetation index (NDVI) data from 2001 to 2023, exploring vegetation cover trends, driving factors, and predicting the impact of future climate change. Firstly, this study decomposed the time series data into seasonal, trend, and residual components using the Seasonal–Trend decomposition using Loess (STL) decomposition method, quantifying vegetation changes across different climate zones. Partial least squares (PLS) regression analysis was then used to examine the relationship between NDVI and driving factors, and the contribution of these factors to NDVI variation was determined through the variable importance in projection (VIP) score. The results show that NDVI has significantly increased over the past two decades, especially since 2010. Further analysis revealed that vegetation growth is primarily influenced by soil moisture, shortwave radiation, and total precipitation (VIP scores > 0.8). Utilizing machine learning with Coupled Model Intercomparison Project Phase 6 (CMIP6) multimodel data, this study predicts NDVI trends from 2023 to 2100 under four emission scenarios (SSP126, SSP245, SSP370, SSP585), quantifying future meteorological factors such as temperature, precipitation, and radiation to NDVI. Findings indicate that under high-emission scenarios, the vegetation greenness in some regions may experience improved vegetation conditions despite global warming challenges. Future land management strategies must consider climate change impacts on ecosystems to ensure sustainability and enhance ecosystem services.

1. Introduction

Vegetation, acting as a critical interface between the atmosphere and the lithosphere, is an indispensable component of terrestrial ecosystems. It plays a pivotal role in regulating the global carbon cycle, mitigating greenhouse gas effects, protecting water resources, and reducing diurnal temperature variation [1,2,3,4]. Through the process of photosynthesis, vegetation converts solar energy into chemical energy, serving as an energy source for nearly all terrestrial life while absorbing carbon dioxide and releasing oxygen, thereby maintaining the balance of these two gases in the atmosphere [5,6,7,8,9]. This process is not only essential for modulating global climate patterns but also directly impacts air quality by helping to mitigate the health risks associated with air pollution [10]. As a result of long-term interactions between climatic conditions, human activities, and topographic features, vegetation ecosystems provide valuable indicative information [11,12,13,14]. Given the increasingly significant impact of climate change on vegetation development, monitoring these changes has become a crucial area of focus [15].
Advancements in remote sensing technology have opened new avenues for the dynamic monitoring of vegetation. As this technology continues to evolve, an increasing number of researchers are utilizing satellite remote sensing data to track and analyze patterns of vegetation change. This approach is characterized by ease of acquisition, broad coverage, spatial continuity, and a reduction in the impact of topography on observational results compared with traditional methods, thereby significantly advancing in-depth studies in Earth sciences [16,17]. Among the various technical indices used to assess vegetation status, the normalized difference vegetation index (NDVI) stands out due to its strong correlation with vegetation physiological characteristics. NDVI is a critical metric for gauging the condition and extent of vegetation growth [18,19,20], commonly employed to reflect aspects such as vegetation cover, type, and leaf area index (LAI), which are quantitative features of vegetation. Research by Chen et al. has shown that NDVI is strongly correlated with net primary productivity (NPP) [21], photosynthetic capacity, and LAI, effectively revealing changes in vegetation growth. As a simple yet powerful tool, NDVI bridges the physical properties of the Earth’s surface with biological processes, holding irreplaceable importance in ecology, agriculture, forestry, and environmental science [22,23,24]. It effectively monitors vegetation health and reflects changes in the growth cycle, finding broad application in crop management, forest resource assessment, land use planning, and environmental protection [25,26]. NDVI serves as a key parameter for measuring vegetation cover and density, supporting agricultural production optimization, forest management, and responses to natural disasters [27,28]. As a sensitive indicator of climate change, NDVI reveals patterns of vegetation response to variations in climatic factors, providing crucial evidence for understanding past climate changes and predicting future trends [29,30]. Due to its universal applicability and ease of acquisition, NDVI has become an essential tool for assessing vegetation status [31,32]. Given these advantages, NDVI stands out as the most applicable index for evaluating vegetation dynamics [33]. Through its application, scientists can achieve a more precise understanding of the spatiotemporal distribution of vegetation and its responses to environmental changes.
In recent years, scientists have conducted long-term sequence analysis using NDVI. Research conducted globally indicates that the NDVI has shown an overall upward trend. Eastman et al. demonstrated [34], based on a global NDVI dataset from 1982 to 2011, that except for Oceania, NDVI significantly increased across all other continents. In China, studies on vegetation changes have particularly focused on ecological reserves or ecologically vulnerable areas. Research mainly concentrates on regions such as the southwestern area [35,36,37], northern regions [38,39], coastal zones [40,41], the middle and upper reaches of the Yellow River [42], the Loess Plateau [43], the Ruoergai Wetland [44], and the Sanjiangyuan National Conservation Area [45]. However, most current studies focus on vegetation changes in specific regions or types of ecosystems, and there is a lack of comprehensive analysis of vegetation dynamics across China as a whole or across different regions.
Climate is one of the most important factors influencing vegetation condition. Wu et al. reported the trends of the annual FVCmax and FVCmean datasets over the past 30 years using the Mann–Kendall method and Sen’s slope estimator and suggested that the primary reason for the significant increase in NDVI in most regions is global warming [46]. As global temperatures rise, the atmospheric water vapor content increases, leading to greater precipitation [47], which in turn contributes to an increase in regional NDVI. Zhao et al. found that temperature is the climatic factor driving vegetation changes in southern regions [48], whereas precipitation regulates vegetation growth changes in northern areas. Lai et al. established a significant positive correlation between plateau vegetation and surface heat sources on the plateau [49]. Bao et al. used land surface models CLM4.5-CNDV to study the feedback of plateau vegetation to future climate change [50], finding that an increase in plateau vegetation cover shows good consistency with changes in precipitation and soil conditions. Surface water cycle components (precipitation) may become the most important climatic factor limiting vegetation growth. Liang et al. confirmed that seasonal differences exist in the effect of climate change on vegetation growth within the Yellow River’s source conservation area [51]. It is evident from the existing literature that there is a significant correlation between NDVI values and climate change in relevant studies. However, current research often focuses on the impact of temperature and precipitation, while giving insufficient consideration to other potential factors.
Accurately predicting NDVI is crucial for guiding regional ecological restoration and environmental management. Machine learning models, which have become popular methods today, are capable of modeling highly complex nonlinear relationships, unlike traditional statistical methods. Cui et al. proposed a convolutional neural network model combined with feature engineering, which effectively improved the accuracy of NDVI predictions for the next three months in multiple complex regions [52]. Huang et al. developed a combined prediction model based on three independent prediction models in order to improve the performance of NDVI predictions for the Yellow River Basin in China [53]. Gao et al. developed an innovative NDVI prediction model and conducted an in-depth study on the response mechanism of NDVI to climate factors [54]. Although these studies have successfully predicted future NDVI values, they have largely failed to adequately consider the variations in NDVI under different climate change scenarios.
In order to address the shortcomings of previous studies, this research makes contributions in the following aspects. Firstly, this study will conduct a long-term time series analysis of NDVI in China over nearly 20 years, providing a detailed analysis of spatial and temporal variation patterns, revealing its long-term trends, and exploring its relationship with multiple important meteorological factors. Secondly, a stacking model will be employed, using Random Forest, XGBoost, and Support Vector Regression (SVR) as base models, with a linear regression model serving as the meta-model to determine the optimal weighting of these base models. By incorporating multimodel ensemble data provided by the Coupled Model Intercomparison Project Phase 6 (CMIP6), this study will use machine learning to predict and model future NDVI changes under different emission scenarios. Finally, through an in-depth multifactor coupling analysis, by quantifying the contribution rates of meteorological factors to NDVI changes, this study further explores the mechanisms and relative significance of each meteorological variable’s role in influencing vegetation dynamics. The findings of this study provide new insights into the trends of NDVI changes in China and its responses to future climate changes, thereby promoting the implementation of more scientifically sound and reasonable natural resource management and environmental protection measures.

2. Materials and Methods

2.1. Datasets

In our study, multiple datasets were used, and in order to address the differences in spatial resolution across these datasets, a unified resampling method was employed, which adjusted all the data to the same spatial resolution, ensuring the consistency of the analysis results. Specifically, this study employed a bilinear interpolation method, which is capable of preserving the spatial characteristics of the original data to the greatest extent, maintaining the spatial continuity and features of the original data to some degree. This method avoids the jagged effects that could arise from simple nearest-neighbor interpolation, while also minimizing the potential errors that might occur due to resolution differences. In the analysis of NDVI and meteorological factors, this study standardized the data to the resolution of the ERA5 dataset, and necessary projection transformations were applied to all the datasets, ensuring that they were all in the same coordinate system, WGS84.

2.1.1. NDVI Data

The NDVI data employed in this study originate from the MOD13A3 data product released by the National Aeronautics and Space Administration (NASA), updated on a monthly basis with a spatial resolution of 1 km [18,55]. This dataset has undergone comprehensive preprocessing steps, including geometric correction, radiometric calibration, and atmospheric correction, aimed at minimizing the impact of cloud cover and other atmospheric effects on the data [56]. To align with research requirements, necessary projection transformations and image mosaicking were performed using the MODIS Reprojection Tool (MRT), followed by clipping according to the geographical extent of China, resulting in an NDVI time series dataset spanning from 2001 to 2023. MOD13A3 is a globally standardized vegetation index product provided by NASA, which holds high authority and scientific recognition. It is widely used in vegetation dynamics monitoring, ecological research, and climate change analysis. The monthly update frequency allows it to capture changes in vegetation growth cycles, making it suitable for dynamic analysis over long time series (2001–2023). Additionally, its spatial resolution of 1 km provides sufficient detail at the regional scale, which is why this dataset was chosen for the analysis in this study.

2.1.2. Land Cover Data

Land cover information is sourced from the high-resolution (300 m spatial resolution) dataset provided by the Copernicus Climate Change Service [57]. Considering the specific vegetation characteristics of the study area, similar land cover types within the original classification system were aggregated, leading to the establishment of four primary vegetation cover categories: cropland, forest, grassland, and shrubland. The data, based on advanced remote sensing technologies and algorithms, provide a spatial resolution of 300 m, allowing for a more detailed description of the spatial distribution of land cover types with high scientific credibility. Additionally, in its original classification system, similar land cover types are aggregated into four major vegetation cover categories (cropland, forest, grassland, and shrubland), which facilitates integration with research objectives. Therefore, this study selects this dataset to categorize NDVI into different vegetation cover types.

2.1.3. Meteorological Data

(1)
Reanalysis of precipitation, temperature, soil moisture, and relative humidity products. The meteorological data used in this study are sourced from the ERA5 dataset provided by the Copernicus Climate Change Service Data Store, which is the fifth-generation global climate reanalysis produced by the European Centre for Medium-Range Weather Forecasts (ECMWF) [58]. Integrating advanced models and data assimilation systems with extensive historical observations, ERA5 offers various critical meteorological parameters such as precipitation, temperature, soil moisture, and relative humidity, at a spatial resolution of 0.25° × 0.25°, providing high-precision spatiotemporal variation information [59]. Additionally, for carbon dioxide (CO2) data, this study utilizes information from the Copernicus Atmosphere Monitoring Service (CAMS). CAMS provides comprehensive data on atmospheric composition, including CO2 concentrations, which are essential for understanding and analyzing climate change impacts. The integration of CO2 data from CAMS complements the meteorological parameters from ERA5, offering a more holistic view of environmental conditions and their variability over space and time. The ERA5 dataset integrates advanced numerical models and data assimilation systems, combining a large volume of historical observational data to provide high-precision spatiotemporal variation information. ERA5 offers a wide range of key meteorological parameters that can comprehensively reflect changes in meteorological conditions [60]. Additionally, the long temporal coverage of ERA5 allows it to fully encompass the time period under analysis in this study, which is why this dataset was selected for the analysis.
(2)
Shortwave radiation. Shortwave radiation data originate from the SYN1 deg-Level 3 dataset of the CERES (Clouds and the Earth’s Radiant Energy System) project within NASA’s Earth Observing System, specifically utilizing the “daily surface radiation components—downward shortwave radiation” product, with a spatial resolution of 1° × 1° and units measured in watts per square meter (W/m2). The CERES project focuses on the study of Earth’s radiation energy balance, and its shortwave radiation data holds a high degree of specialization and scientific value [61,62].

2.1.4. CMIP6 Data

The Coupled Model Intercomparison Project (CMIP) involves climate models developed by various national and institutional entities. CMIP6, the sixth phase of CMIP, features an increased number of participating models, improved experimental design, and a larger simulation database compared with previous CMIP projects over the past two decades [63,64]. CMIP6 data are sourced from the NASA Center for Climate Simulation (https://www.nccs.nasa.gov).
This study integrates multiple CMIP6 models to estimate NDVI changes under different scenarios. Traditional multimodel ensemble (MME) averaging calculates the arithmetic mean of Gross Primary Productivity (GPP) values across all models to reduce uncertainty in multimodel simulations. A weighted MME method uses ERA5 meteorological data as a benchmark, assigning weights to each model based on its performance during the historical period (2001–2014). For each CMIP6 model, the difference between its simulation results and ERA5 data is calculated, and the weight for each model is assigned based on the Root Mean Square Error (RMSE). This study uses an inverse error weighting method to assign the weights, meaning that models with smaller errors are given higher weights. The calculation formula is as follows:
W i = 1 / e i j = 1 n 1 / e i
where Wi is the weight of the i-th model, ei is the RMSE value of the model, and n is the total number of models.
The climate models adopted in this study, along with their relevant information and assigned weights, are presented in Table 1. Four Shared Socioeconomic Pathways (SSPs) were selected, SSP126, SSP245, SSP370, and SSP585, representing varying future economic development conditions under different carbon emission levels and radiative forcing scenarios, where SSP126 denotes a low-emission scenario, SSP245 and SSP370 indicate medium-emission scenarios, and SSP585 represents a high-emission scenario.

2.2. Method

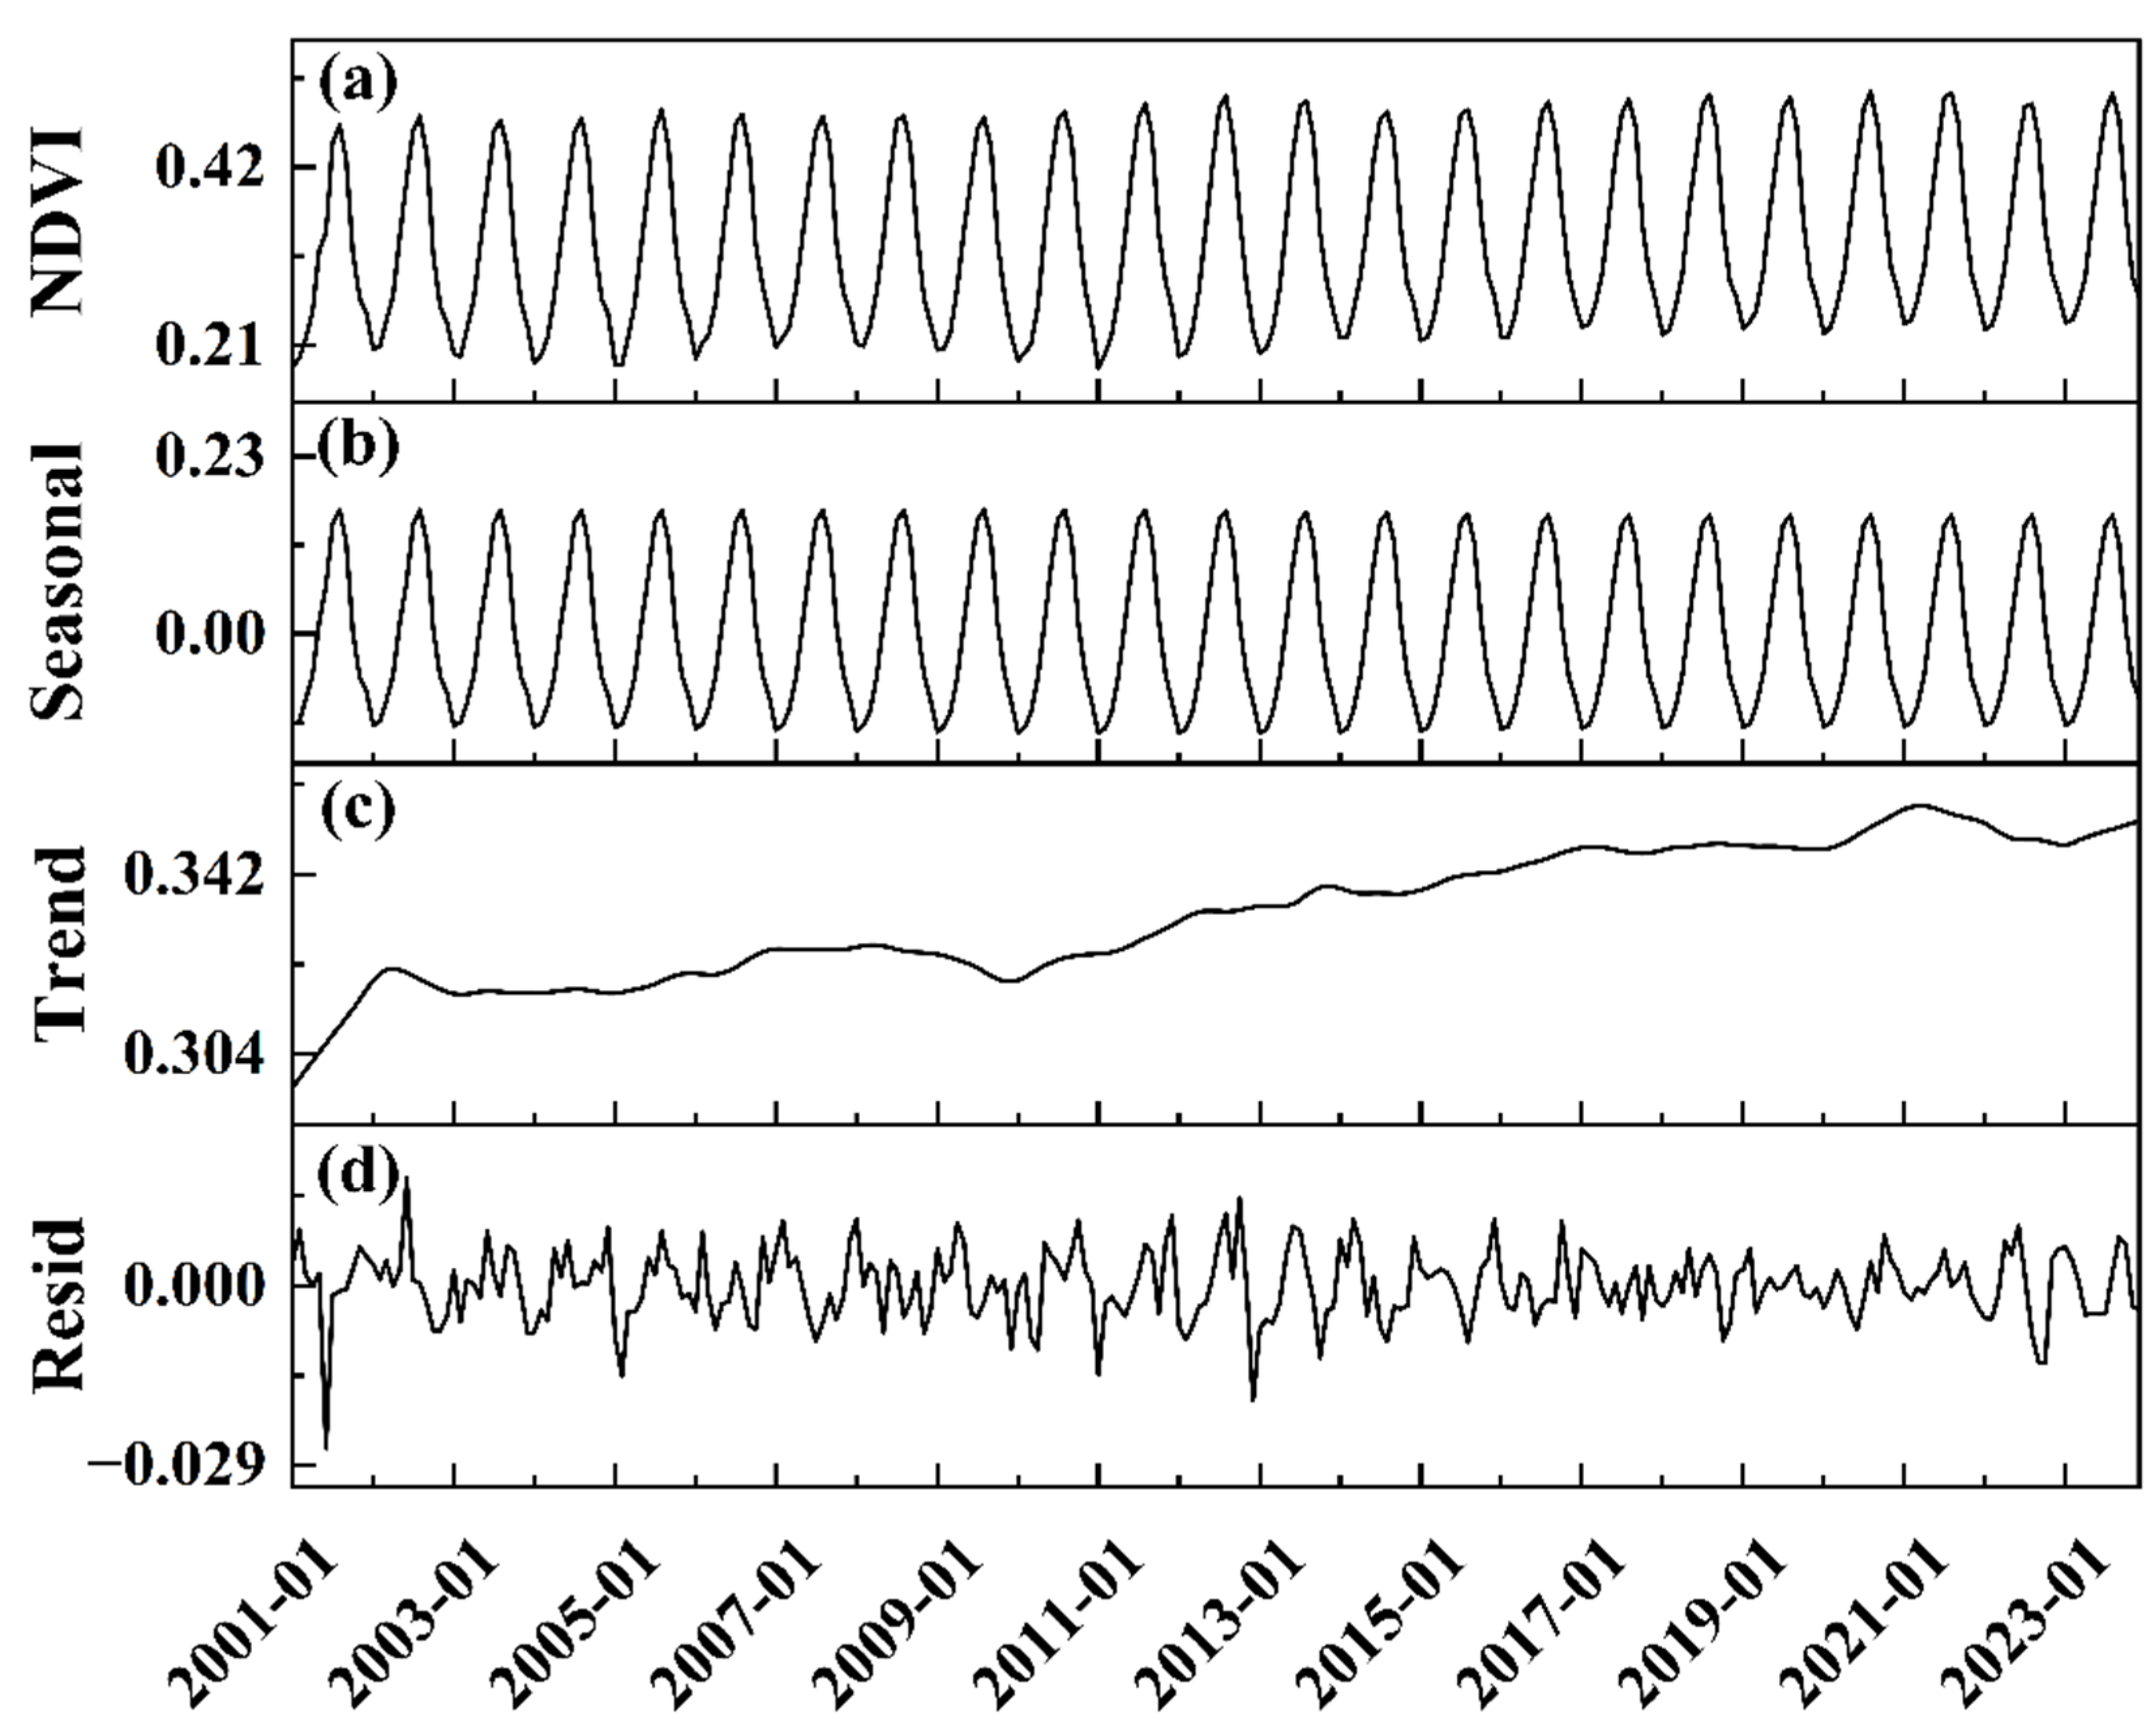
2.2.1. Seasonal and Trend Decomposition Using Loess

Seasonal and Trend decomposition using Loess (STL), proposed by Cleveland et al. in 1990, is a classical time series decomposition method capable of handling time series data with irregular seasonal patterns and missing values [79]. It is a versatile and robust approach for estimating nonlinear relationships. Compared with conventional decomposition methods such as Variational Mode Decomposition and Empirical Mode Decomposition, STL is based on loess, offering a more intuitive principle and robustness against data anomalies without inducing mode mixing or boundary effects. It employs robust locally weighted regression as its smoothing technique. The typical decompositions performed by STL include additive and multiplicative models, where the time series at time t is decomposed into trend component Tt, seasonal component St, and remainder component Et, as expressed in Equation (2):
Yt = Tt + St + Et = 1, 2, … N
The implementation of STL decomposition primarily consists of nested inner and outer loop recursive processes. The inner loop calculates the trend and seasonal components, while the outer loop computes the robustness weights used to adjust the neighborhood weights for the subsequent inner loop iteration based on the results of the previous inner loop. This study applies the STL method to decompose the NDVI time series of China’s regions from 2001 to 2023. Using this method, this study decomposes the NDVI time series into three components: the trend component, which reflects the long-term directional changes; the seasonal component, which represents the periodic changes within a year; and the residual component, which indicates random disturbances that cannot be explained by the trend or seasonal components. The resulting trend component is used for subsequent trend analysis.

2.2.2. Trend Analysis and Testing

Theil–Sen Median trend analysis is a nonparametric statistical method utilized for trend detection, extensively applied in meteorological, hydrological, and vegetation data. A primary advantage of this method is its independence from specific distribution requirements and its resilience to the influence of a small number of outliers [80]. The computational formula is as follows:
slope = median (Xj − Xi)/(j − i) (1 < i < j < n)
where Xi and X are the i and j data points in the time series; when slope > 0, it indicates an improving trend in the NDVI time series; when slope < 0, it indicates a degrading trend; and when slope = 0, the NDVI time series remains essentially unchanged. The Mann–Kendall test is employed to assess the significance of Sen’s slope estimate results [81,82], with the test statistic denoted by Z. At the given significance level σ, when |Z| > 1.96, it indicates that the change trend has passed the 95% significance test. Combining the slope value and |Z| value, this study categorizes the NDVI change trends in China into five levels: significant decrease (slope ≤ −0.003/year, |Z| > 1.96), slight decrease (−0.003/year < slope ≤ −0.00005/year, |Z| > 1.96), stable (−0.00005/year < slope < 0.00005/year, |Z| > 1.96), significant increase (slope ≥ 0.003/year, |Z| > 1.96), and slight increase (0.00005/year ≤ slope < 0.003/year, |Z| > 1.96). This classification provides a detailed assessment of vegetation dynamics across the region. In evaluating the long-term trend of NDVI at the spatial scale, this study uses the Theil–Sen Median method combined with significance testing for trend estimation. The trend component is calculated separately for the time series of each pixel. The trend results are visualized spatially using slope values, distinguishing areas with significant increase, no significant change, and significant decrease, thereby revealing the spatial heterogeneity of NDVI changes.

2.2.3. Partial Least Squares Regression

Partial least squares (PLS) regression is a robust statistical method that integrates core functionalities of linear regression analysis, principal component analysis, and canonical correlation analysis. It enables simultaneous regression modeling, data structure simplification, and association analysis between two sets of variables. As an effective multivariate data analysis strategy, PLS is particularly suitable for datasets with multicollinearity—where independent variables are highly correlated—a common scenario in meteorological factor studies [83,84]. Many researchers have already used the PLS method to identify the effective climate parameters influencing the variables under study [85,86,87]. By combining the advantages of principal component analysis (PCA) and multivariate regression, PLS becomes an ideal choice for addressing these issues. Additionally, VIP, also known as “variable projection influence”, is a crucial tool for variable selection in PLS models. VIP scores reflect the importance of independent variables to model fitting, calculated as the weighted sum of squared PLS weights based on the variance explained by each extracted latent variable [88]. The VIP score formula is as follows:
Vj = p a = 1 A S S a W a j / W a 2 / a = 1 A S S a
where Vj represents the VIP score of the jth variable, SSa denotes the sum of squares explained by the ath latent component, and (Waj/‖Wa‖)2 signifies the relative importance of the jth variable with respect to all variables on the ath latent component, where p is the number of independent variables. VIP scores assess the importance of independent variables in explaining the dependent variable (Y). According to Wold (1995), if a variable’s VIP score is below 0.8, it can be considered less contributive to the dependent variable [89]. This approach helps identify the most influential independent variables, thereby enhancing model interpretability and effectiveness. VIP scores provide researchers with a systematic method to understand which predictors best explain the variation in the dependent variable and estimate their contribution to the PLS regression model, thus promoting data structure comprehension and optimizing variable selection during model building. To explore the influence mechanism of meteorological factors on NDVI changes, this study adopts PLS for multivariate modeling. VIP is used to evaluate the relative contribution of each meteorological factor to NDVI changes. The key driving factors that have a significant impact on NDVI are then identified and further used for future scenario prediction modeling.

2.2.4. Ensemble Learning

Machine learning has strong capabilities in nonlinear modeling and adaptability to high-dimensional data. Vegetation’s response to climate factors exhibits significant nonlinear characteristics, and machine learning models are adept at capturing such complex patterns. In machine learning, ensemble learning is a method that enhances predictive performance by combining multiple models. Stacking is an advanced ensemble learning technique that improves overall prediction performance by integrating predictions from multiple base models. This method not only leverages the unique strengths of each base model to improve prediction accuracy and robustness but also effectively reduces overfitting, enhancing the model’s generalization ability. Through this multilevel learning mechanism, stacking models provide more stable and accurate predictions in complex data environments, which are widely applicable to various practical problems. In this study, to predict future NDVI, the authors first analyzed historical climate factor data from 2001 to 2023. To determine which meteorological factors should be prioritized as model inputs, this study first used the Random Forest method to analyze the relationships between multiple meteorological factors and NDVI. Through importance ranking, this study selected the top five meteorological factors with the strongest correlation as model inputs. In addition, although CO2 does not rank highly in the importance order, this study specifically considered and included this variable in the final model inputs due to its key role in the carbon cycle, particularly its close relationship with emissions and plant respiration. Therefore, our final model is based on the following meteorological factors: relative humidity (RH), shortwave radiation (SWR), soil moisture (SWVL1), temperature at 2 m (T2m), precipitation (TP), and carbon dioxide concentration. This forms a comprehensive overlay model aimed at more accurately predicting future NDVI trends. The model integrated various machine learning algorithms, using Random Forest, XGBoost, and Support Vector Regression (SVR) as base models, and a linear regression model as the meta-model to determine the optimal weighting of these base models, optimizing the final prediction results and generating the final NDVI predictions. This study selects Random Forest, XGBoost, and SVR as the base models, primarily because of their unique advantages and complementarity. Random Forest provides strong anti-overfitting ability and good adaptability to nonlinear relationships by integrating multiple decision trees. XGBoost, with its efficient gradient boosting algorithm and regularization techniques, performs excellently in handling complex, multivariate nonlinear problems and effectively enhances the model’s generalization ability. SVR, using kernel functions, handles nonlinear relationships, making it particularly suitable for small sample datasets and reducing the impact of noise. These three models, when used together, can capture data features from multiple angles, enhancing model stability and prediction accuracy. Finally, linear regression is used as the meta-model to integrate the results of these base models, optimizing weight distribution and further improving the accuracy and reliability of NDVI prediction. In our research, for hyperparameter optimization, this study adopted a combined strategy of grid search and random search. This approach allowed us to carefully adjust the parameters and determine the optimal parameter set based on the specific performance of each model. For the evaluation of the stacked ensemble model, this study used a stratified K-fold cross-validation method [90]. This strategy ensured the consistency of sample distribution between the training and validation sets during the cross-validation process, effectively reducing the risk of overfitting while enhancing the model’s generalization ability. To further predict NDVI values for 2100, this study combined future climate scenario data provided by CMIP6, obtained corresponding climate factor data for 2100, performed consistency checks, and handled missing values to ensure alignment with historical data formats. Subsequently, the preprocessed 2100 climate factor data were input into the trained stacking model to generate future NDVI predictions.

3. Results

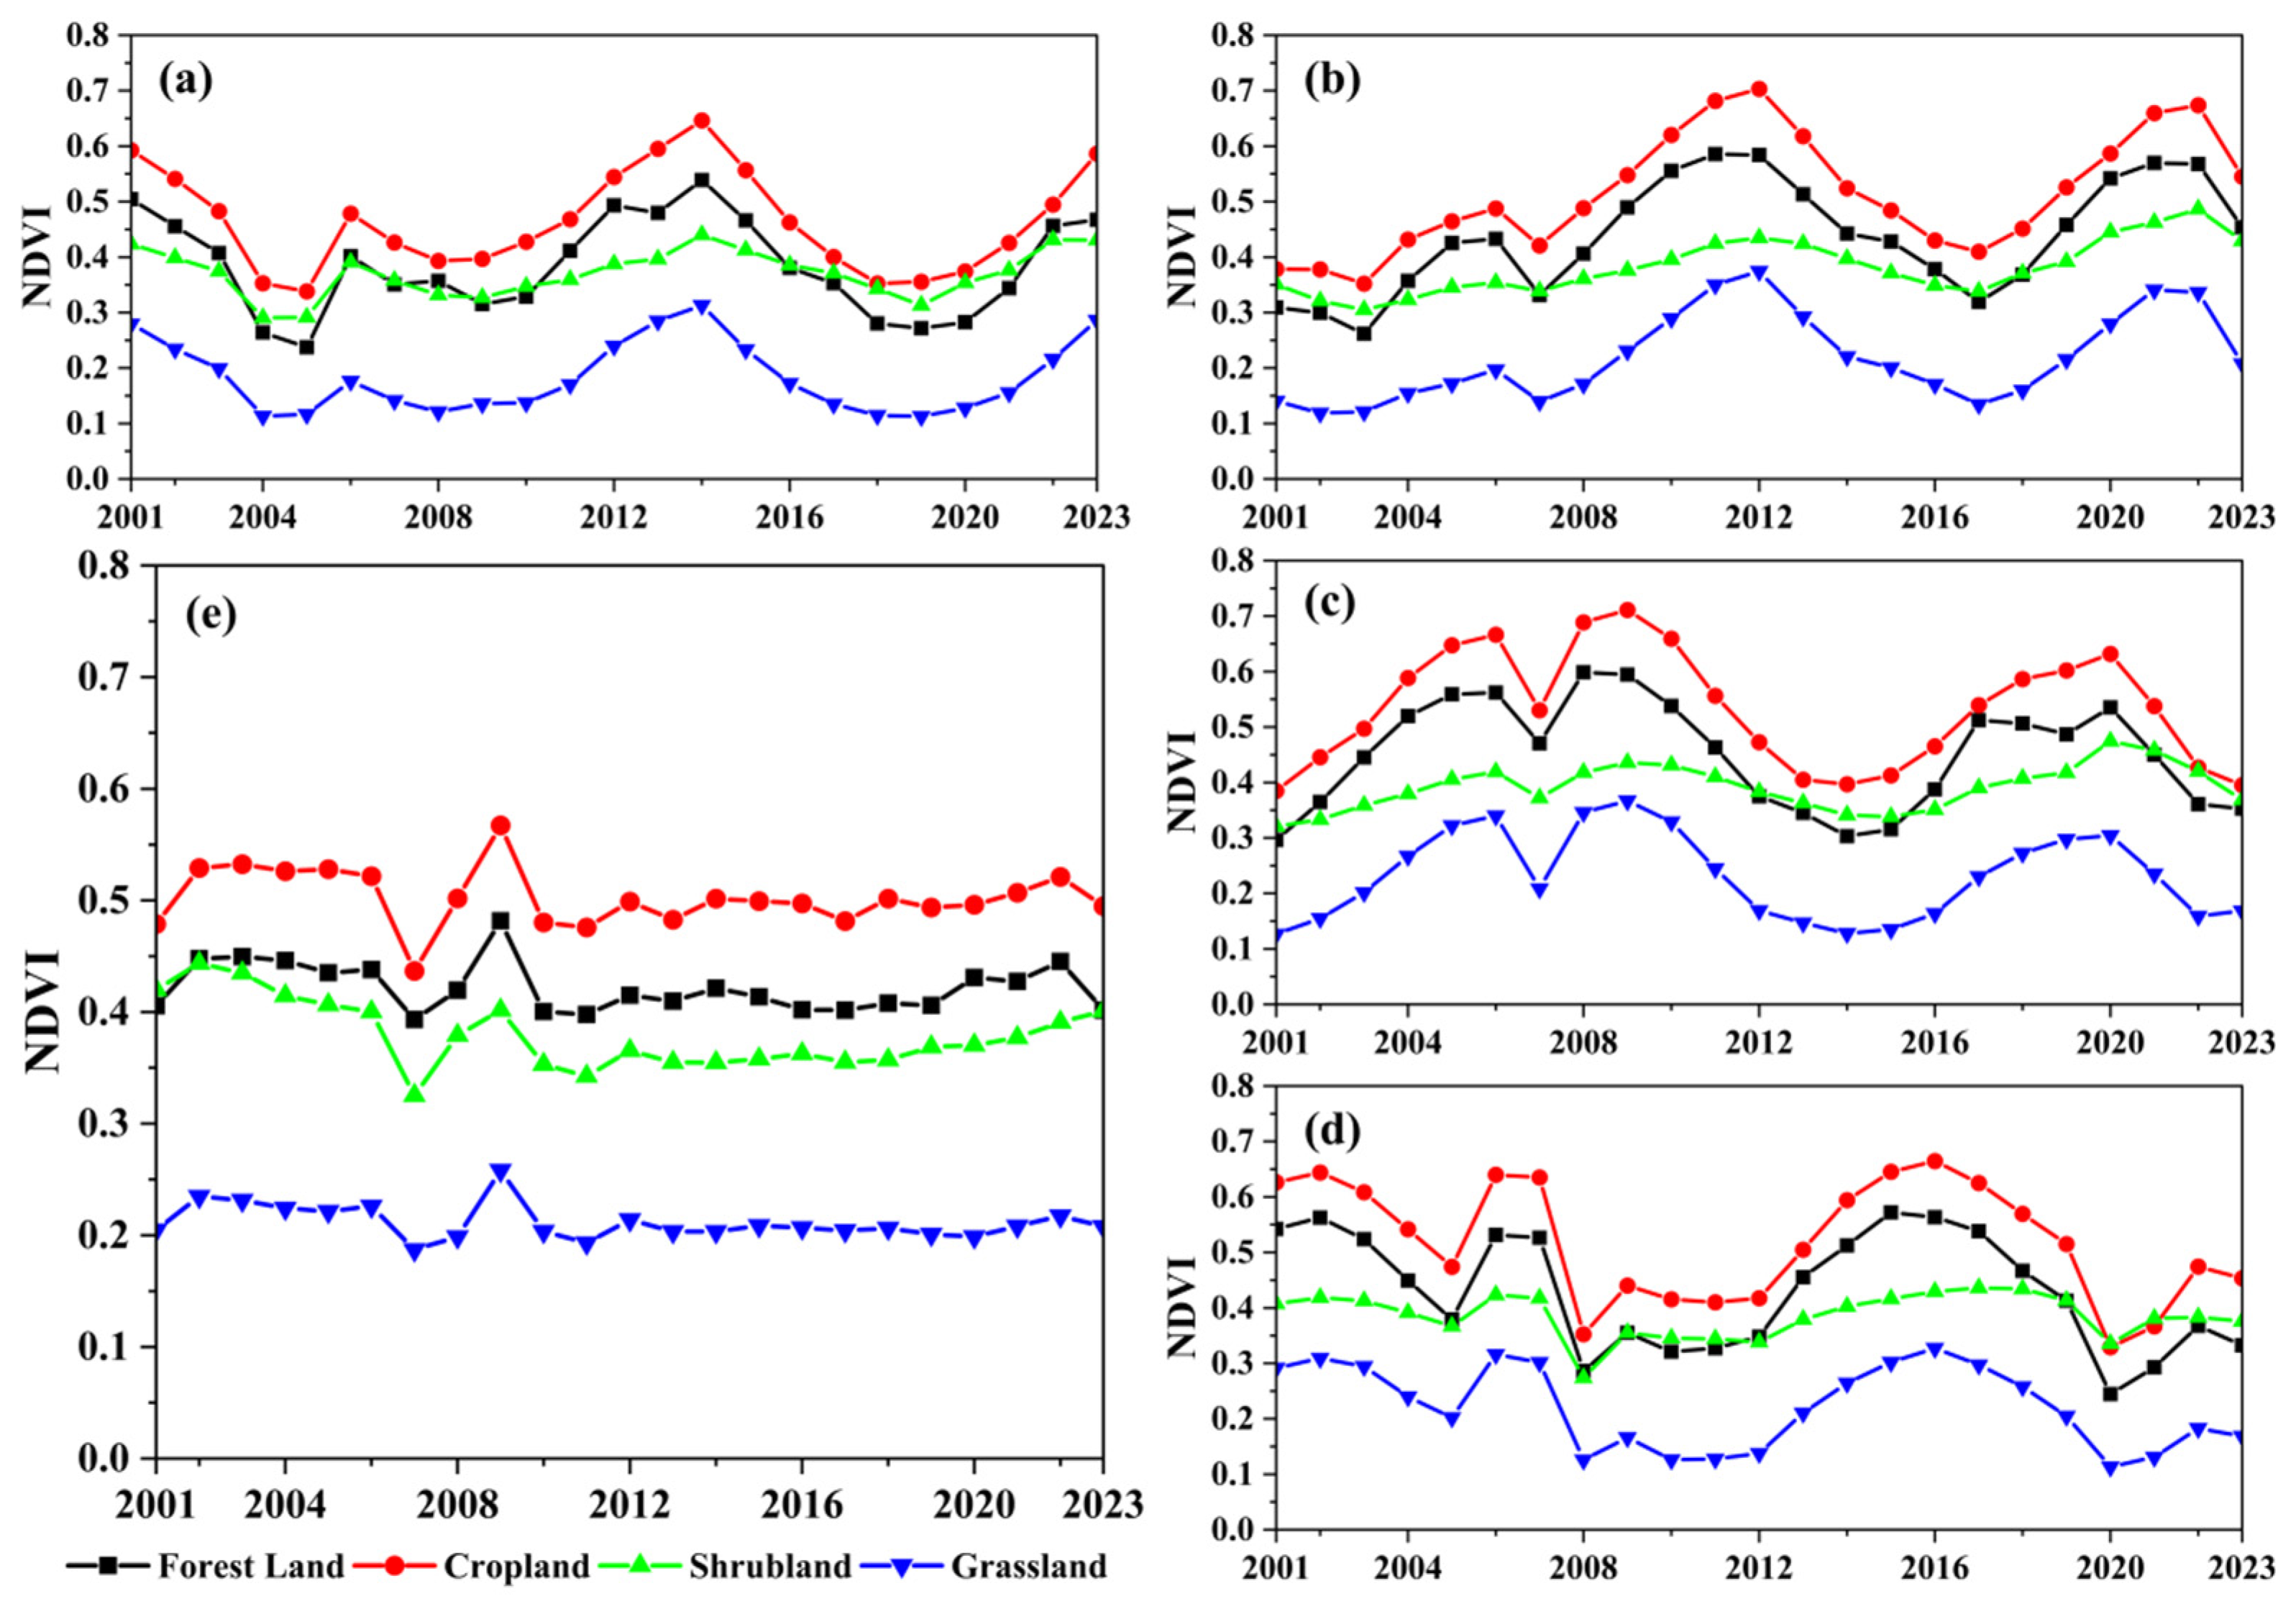
3.1. Historical Trend Analysis of NDVI

To investigate the long-term dynamic changes in NDVI across China, spatial changes were analyzed, as shown in Figure 1. The results indicate that, overall, most regions in China maintained relatively stable NDVI values from 2001 to 2023. However, specific areas exhibited distinct change patterns. Notably, significant increases in NDVI were observed in southeastern Henan Province and northwestern Anhui Province, likely attributable to successful afforestation projects, optimized farmland management, and ecological restoration initiatives. These activities typically enhance vegetation growth and land productivity, leading to increased NDVI values. Conversely, a slight decline in NDVI was noted in the northwestern part of Inner Mongolia Autonomous Region and its border with Gansu Province, possibly due to intensified drought, overgrazing, or agricultural reclamation exerting pressure on natural vegetation. A significant decrease in NDVI occurred in a small area northeast of Heihe City in Heilongjiang Province, which may be associated with localized environmental degradation, water scarcity, or other anthropogenic disturbances. It is worth noting that despite their limited extent, southern Xiaogan City and Qianjiang City in Hubei Province showed substantial NDVI increases, reflecting the positive impact of effective local ecological conservation measures or urban greening projects. The slight reduction in NDVI surrounding these increased zones might be induced by edge effects from urban expansion or agricultural activities [91].
Furthermore, an in-depth analysis using STL decomposition was conducted on the monthly NDVI data from 2001 to 2023 for this region, with results presented in Figure 2. The analysis revealed a significant annual cyclic variation pattern in the NDVI values, specifically showing that the NDVI values reach their lowest point in winter (particularly in January and February), while peaking in summer (July and August). Although there are some fluctuations in the NDVI values each year, the amplitude of seasonal changes remains largely consistent, indicating that the NDVI variations strictly follow a distinct seasonal pattern. Post 2015, positive peaks (indicative of peak vegetation growth) began to exhibit a gradually ascending trend, with the magnitude of both positive and negative peaks appearing to increase year by year. In recent years, there has been a gradual improvement in spring and autumn vegetation cover, evidenced by an increasing amplitude of seasonal fluctuations. The trend component, representing the overall change in NDVI over time after removing seasonal and random factors, shows an upward trend from 2001 to 2023. Although interspersed with fluctuations, this growth trend became particularly significant since 2010, reflecting an increase in vegetation cover in China during this period. This phenomenon may be associated with a series of ecological restoration policies implemented by the Chinese government, such as the “Three-North Shelter Forest” project and the “Grain for Green” policy, aimed at enhancing forest coverage and improving environmental quality [92,93]. The residual component, denoting the variation in data unexplained by seasonal and trend factors, typically exhibits small values. Notably, the residual reached its minimum value of −0.0263 in June 2001; conversely, the maximum positive value of 0.0174 was observed in June 2002. Through the decomposition of monthly NDVI data for China using the STL method, the seasonal characteristics and long-term growth trend of NDVI have been clearly identified.
Further, according to China’s climate classification, the country can be divided into several regions characterized by distinct climatic features, including Temperate Monsoon Climate (TMC), Temperate Continental Climate (TCC), Plateau Mountain Climate (PMC), Subtropical Monsoon Climate (SMC), and Tropical Monsoon Climate (TRMC). The spatial long-term dynamic changes in NDVI across different climatic zones in China were analyzed using STL decomposition, with results presented in Figures S1–S5. Research has found that although the NDVI in different climate zones has shown different trends and fluctuations over the past 20 years, the trend component exhibits a common characteristic: a general decline followed by an increase. The seasonal component shows clear annual cyclical fluctuations, with each cycle lasting 12 months, demonstrating a distinct seasonal pattern. In the early stage, from 2001 to 2003, the NDVI trend values in different climate zones showed some changes. Specifically, the trend value of TMC slightly decreased from 0.430 to 0.411; the trend value of TCC decreased slightly from 0.145 to 0.142. At the same time, the trend value of SMC dropped from 0.593 to 0.576. Notably, PMC experienced a more significant decline, with its trend value decreasing from 0.197 to 0.180. In contrast, the trend value of TRMC only saw a slight decrease, from 0.659 to 0.640, indicating a relatively stable characteristic during this period. During the period from 2004 to 2008, the trend values in all climate zones generally showed significant improvement. The value of TMC increased to 0.471, and TCC rose to 0.161. Meanwhile, the value of SMC saw a substantial jump to 0.630. PMC also showed signs of recovery, with its value rising to 0.196. In addition, the value of TRMC increased to 0.690. During this phase, the trend values in all climate zones experienced a growth of over 0.05 units, indicating a positive change in vegetation cover. Since 2009, the system has entered a phase of fluctuating adjustments, with significant changes observed in the temperate climate zones. The trend value of the TMC zone fluctuated and decreased from 0.471 to 0.460, while the trend value of the TCC zone dropped from 0.161 to 0.154. Meanwhile, the monsoon climate zones showed a divergent trend: the trend value of the SMC zone decreased from 0.630 to 0.580, and the value of the TRMC zone also dropped from 0.690 to 0.626. In contrast, the PMC zone remained relatively stable between 2012 and 2016, with its value staying around 0.186. In recent years, most climate zones have shown a trend of stability and recovery. Specifically, the NDVI trend value in the TMC zone has rebounded from 0.460 to 0.467, while the TCC zone has increased from approximately 0.146 to 0.152. At the same time, the trend value in the SMC zone has seen a slight increase, rising from about 0.580 to 0.590. The PMC zone experienced a small fluctuation, rising from around 0.183 to 0.189. Additionally, the trend value in the TRMC zone has also improved, increasing from 0.626 to 0.635.
To thoroughly examine the long-term dynamics of NDVI in China, this study categorized vegetation types into forest land, cropland, shrubland, and grassland, analyzing each type’s NDVI from 2001 to 2023, as shown in Figure 3. The results indicate that the vegetation index for cropland and forest land exhibited certain fluctuations but was generally stable or slightly improved over time; in contrast, grassland and shrubland experienced fluctuations or slight declines, particularly grassland, likely due to natural factors or changes in land use. Specifically, the NDVI for forest land was 0.40551 in 2001 and fluctuated to 0.40167 by 2023, with a relatively minor change, indicating stable vegetation coverage and growth status. Cropland NDVI showed a noticeable upward trend from 2001 to 2009, followed by greater variability after 2010, yet without significant changes, potentially associated with climate change, advancements in agricultural technology, or shifts in farming practices. Although the NDVI values for shrubland fluctuated throughout the period, there were no dramatic changes overall, possibly due to the greater influence of natural factors on shrubland vegetation cover and growth status. Grassland NDVI demonstrated variability from 2001 to 2023, notably with a markedly lower value in 2007 (0.18703), which may have been influenced by drought, climate change, or human activities. Generally, grassland NDVI showed larger fluctuations and periods of lower values, potentially related to grassland degradation or inadequate management.
Furthermore, seasonal analysis reveals heterogeneous trends in NDVI across different vegetation types. Overall, from 2001 to 2023, vegetation in China exhibited varying trends across seasons. In spring, the NDVI values of forest, cropland, and grassland experienced a significant downward trend between 2001 and 2005, followed by a gradual recovery, reaching a notable peak in 2014. However, between 2016 and 2023, the NDVI values of these vegetation types fluctuated again, particularly remaining at lower levels from 2016 to 2019, but they started to gradually rise again from 2020 onwards. In contrast, the NDVI of shrub vegetation continued to show a steady upward trend during this period. In summer, the NDVI values of forest, cropland, and grassland showed a fluctuating upward trend from 2001 to 2012, peaking in 2012. After that, the NDVI values gradually declined, reaching a low point in 2017, before starting to rise again. By 2021, the values were close to the previous peak, although there was a slight decline by 2023. In contrast, the NDVI of shrub vegetation remained relatively stable, with a slow upward trend throughout the entire observation period. In autumn, the NDVI values of all four vegetation types (forest, cropland, grassland, and shrub) generally increased before entering a phase of fluctuating decline. Particularly between 2007 and 2021, the changes in NDVI were especially dramatic, with peaks in 2008 and 2009, followed by a downward trend. In contrast, the NDVI of shrub vegetation showed a relatively stable upward trend during this period. In winter, there was no clear trend of increase or decrease overall, but rather a fluctuating pattern. The NDVI values of forest, cropland, and grassland experienced significant fluctuations between 2006 and 2012, with a noticeable trough in 2008. Similarly, the NDVI of shrub vegetation also encountered a trough in 2008, but then gradually recovered and maintained a relatively stable upward trend.

3.2. Analysis of Meteorological Drivers of NDVI Variation

To delve into the impact of climate change on vegetation growth, this study conducted a detailed study on the relationship between vegetation growth and meteorological factors in China from 2001 to 2023. By analyzing the VIP scores of NDVI changes influenced by multiple meteorological factors, including RH, SWR, SWVL1, T2m, TP, and CO2, the results shown in Figure 4 were obtained. The findings indicate that over the past two decades, vegetation growth in China has been significantly influenced by meteorological factors such as soil moisture, solar radiation, and precipitation. Specifically, SWVL1 exhibited the highest VIP score with a spatial average of 1.0153, and 79.22% of regions had VIP scores exceeding 0.8, suggesting that soil moisture is one of the key factors affecting vegetation growth. Subsequently, SWR and TP had VIP scores of 0.9581 and 0.9661, respectively, with 71.86% and 74.78% of areas having VIP scores above 0.8, underscoring their critical roles in plant photosynthesis and water supply. Although RH and T2m had relatively lower VIP scores of 0.8981 and 0.8933, respectively, they play significant roles in regulating plant transpiration. Notably, despite having the lowest VIP score of 0.8452, and only 55.09% of regions exhibiting VIP scores exceeding 0.8, the long-term effects of CO2 on vegetation growth under global climate change warrant further investigation. Spatially, high VIP score regions for RH are mainly concentrated in Yunnan, Guizhou, and eastern Sichuan, along with western Tibet and eastern and northern Xinjiang; low-value regions are primarily found in Guangdong, Fujian, and Jiangxi, with other scattered low-value zones. Low VIP score regions for SWR are predominantly located in Heilongjiang, central-western Inner Mongolia, and Chongqing. Low-value regions for SWVL1 are relatively sparse and scattered, with few low-value areas at the border of Guizhou and Hunan, while most regions exhibit high VIP scores. High VIP score regions for T2m are concentrated in Guangxi, Guangdong, western Sichuan, Jiangsu, Anhui, and Heilongjiang, whereas low-value clusters appear mainly at the borders of Inner Mongolia, Heilongjiang, and Jilin. Low-value regions for TP are primarily situated in western China, especially Xinjiang and Qinghai, with generally high VIP scores along the southern coastal areas. Low-value regions for CO2 are widely distributed, particularly in southeastern areas (such as Guangxi, Guangdong, Hunan, Jiangxi, Fujian, Zhejiang), while high-value regions are mainly concentrated in Shaanxi and Shanxi. This spatial distribution variability is closely related to the climate, geographical environment, and human activities across different regions of China. In southwestern regions (such as Yunnan, Guizhou, Sichuan), abundant soil moisture, high relative humidity, and suitable temperatures lead to greater influence of soil moisture and humidity on vegetation growth; conversely, northwestern regions (such as Xinjiang, Qinghai) are constrained by aridity and low precipitation, resulting in weaker vegetation growth. Moreover, the high level of economic development and frequent human activities in southeastern coastal areas may lead to localized climatic environmental changes, thereby impacting the distribution of VIP scores for CO2 and other meteorological factors.
In summary, it can be concluded that the patterns of how vegetation growth is influenced by meteorological factors vary across different regions. In southwestern areas, such as Yunnan, Guizhou, and Sichuan, where soil moisture levels are high, relative humidity is high, and temperatures are moderate, these conditions collectively promote lush vegetation growth, which indicates that humidity plays a particularly crucial role in this region. By contrast, in northwestern areas, such as Xinjiang and Qinghai, where arid conditions prevail and precipitation is scarce, these factors become the key constraints on vegetation growth, resulting in relatively low vegetation coverage in this region. In addition, in the southeastern coastal areas, due to the higher level of economic development and more intensive human activities, these factors may lead to changes in the local climate environment, which in turn affect meteorological factors such as carbon dioxide concentration. This influence is further reflected in the VIP distribution of vegetation growth in these areas, with the low VIP score regions of CO2 being widely distributed, especially in the southeastern regions.

3.3. Performance Evaluation of NDVI Prediction Models

In this study, to ensure the predictive performance and stability of the stacked model, a dataset partitioning method was employed, whereby 20% of the data were randomly assigned to the test set, with the remaining 80% allocated for the training set. Upon finalizing the model configuration, an independent 20% test set was utilized for external validation aimed at assessing the model’s generalization capability on unseen data. For a comprehensive evaluation of the predictive models constructed under various SSP scenarios, multiple evaluation metrics were adopted for an integrated analysis, encompassing RMSE, MAE, and R2. As illustrated in Figure S6, the experimental results reveal that, on the test set, the model exhibited outstanding performance, characterized by an RMSE as low as 0.0621, an MAE of 0.044, and an R2 value reaching up to 0.927, which indicates that the model possesses minimal prediction error alongside high explanatory power, thereby validating its reliability and efficacy across different scenarios. Through this approach, a more precise understanding and prediction of various changing trends under future scenarios can be achieved.
To comprehensively evaluate the performance of the prediction model, this study plotted the spatial distribution of the model’s RMSE across China, as shown in Figure S7. The results indicate that while high RMSE values are predominantly concentrated in the eastern region, particularly the northeast, where denser data points and more pronounced environmental changes or human activities may have introduced higher errors during the modeling of complex data patterns, the overall RMSE values across China remain relatively low, suggesting a high degree of regional adaptability of the models. In summary, our stacked models effectively and stably predict under various SSP scenarios, despite certain regional challenges. Nonetheless, these models exhibit outstanding predictive capability and broad applicability.

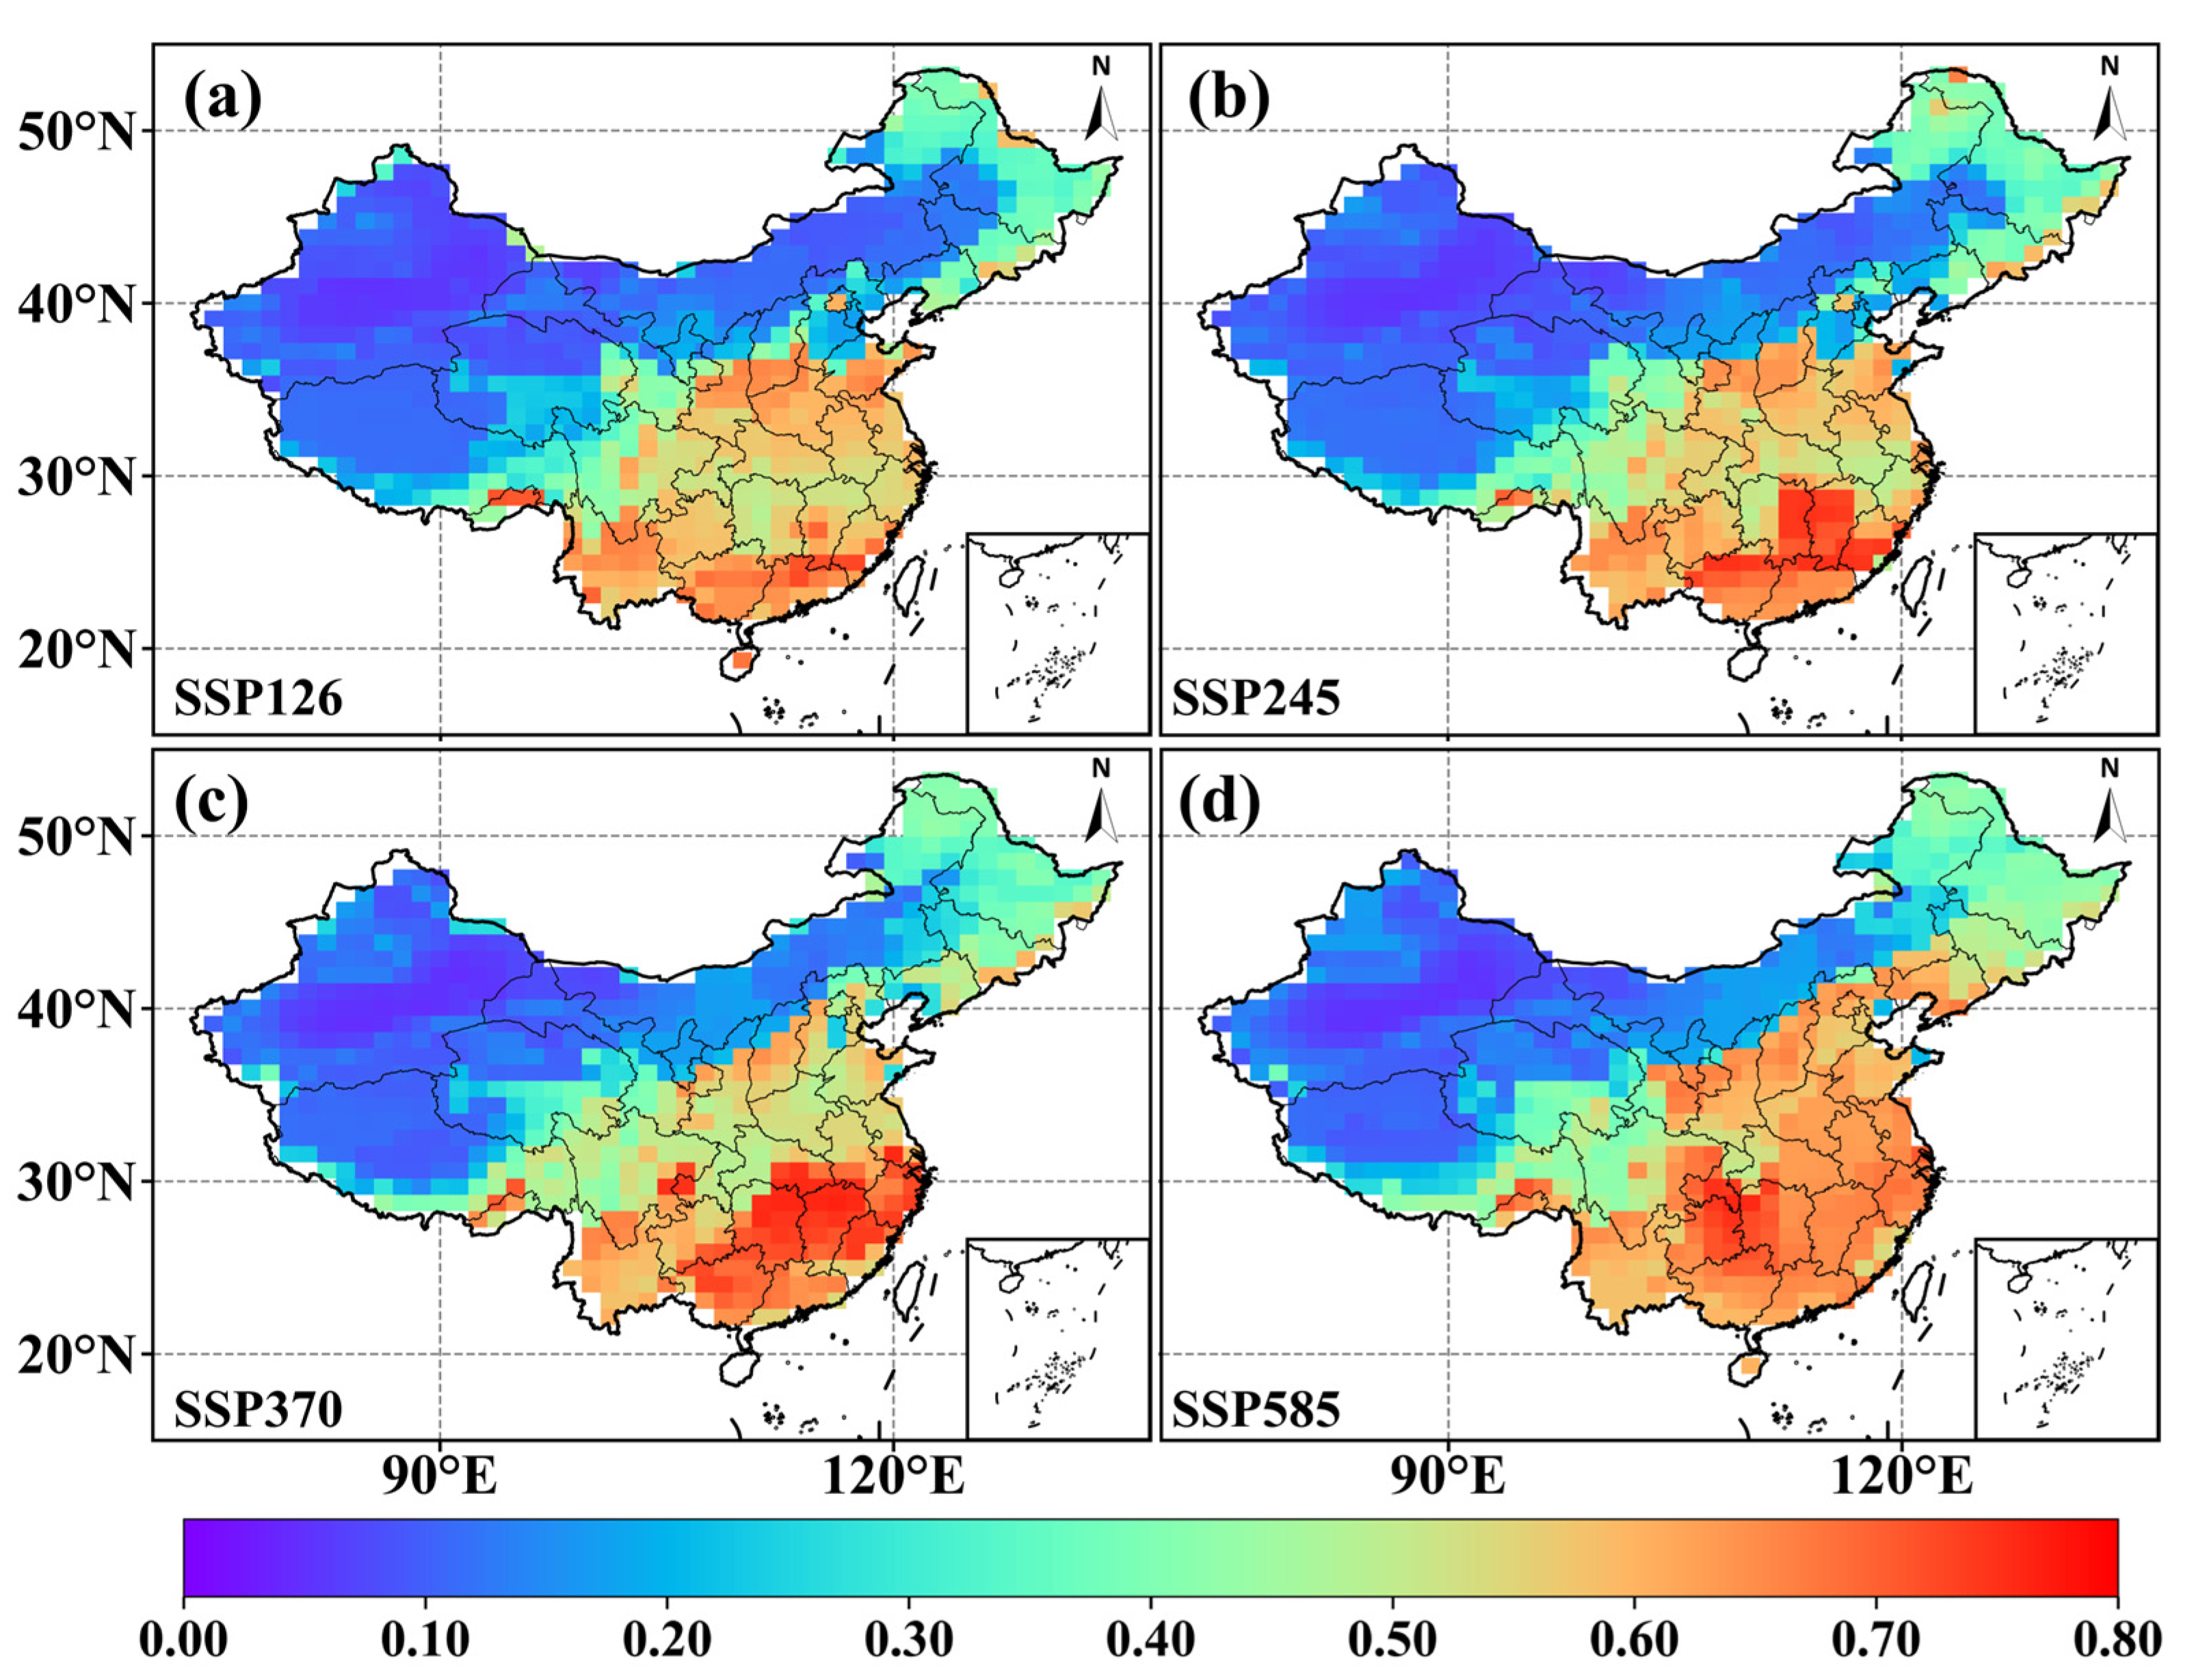
3.4. Model-Based NDVI Future Trend Prediction

To thoroughly examine the impact of future climate change on vegetation health in China, this study adopted multiple emission scenarios to evaluate the trends in NDVI changes. Based on this approach, this study plotted the spatial distribution of the model’s RMSE across China, as shown in Figure S7, which shows the obtained predictions of NDVI and its spatial distribution for China under four different SSP scenarios (namely SSP126, SSP245, SSP370, and SSP585) (Figure 5). The results indicate that the spatial distribution of NDVI values exhibits distinct regional characteristics across all SSP scenarios. Under all four scenarios, China’s NDVI generally presents a pattern of being lower in the northwest and higher in the southeast, closely related to regional precipitation patterns and climatic conditions. Water limitations in arid and semi-arid regions result in lower NDVI values in northern and northwestern areas such as Inner Mongolia, Gansu, and Xinjiang. Specifically, long-term drought, limited rainfall, and high evaporation rates in these regions adversely affect vegetation growth, leading to low NDVI figures. In contrast, the southeastern humid zone maintains higher NDVI levels due to abundant precipitation and suitable climatic conditions. Under the SSP126 scenario, although some high-value areas exist, they are predominantly concentrated in South China, yet not significantly. Comparatively, under the SSP245 scenario, high-value areas concentrate in Jiangxi Province, the Guangxi Zhuang Autonomous Region, Guangdong Province, and eastern Hunan Province. Under the SSP370 scenario, regions with high NDVI values are more extensive, focusing on Jiangxi, Hunan, and several provinces along the southeastern coast, with the largest range of high-value areas among all scenarios, potentially reflecting increased precipitation and temperature rise promoting vegetation growth. Under the SSP585 scenario, higher NDVI values occur in eastern Guizhou, western Hunan, and southern Chongqing, possibly associated with climate change patterns in this region under strong greenhouse gas emissions, particularly improvements in water supply and temperature suitability. Notably, under the SSP370 and SSP585 scenarios, NDVI values in Northeast China are markedly higher than in other scenarios, indicating that climate changes in these high-emission scenarios may enhance vegetation growth in this region.
Under varying SSP scenarios, the average NDVI nationwide is 0.3072 under the lower emission scenario SSP126; this value increases progressively in higher emission scenarios to 0.3218 under SSP245 and 0.3419 under SSP370, and it reaches 0.3678 under the highest emission scenario, SSP585. This indicates that, although increased greenhouse gas emissions theoretically lead to global warming and its associated negative impacts, from the perspective of vegetation health, vegetation conditions are projected to improve with rising emissions. However, under the high-emission scenario SSP370, the distribution of NDVI exhibits a polarized trend: the maximum value significantly rises to 0.7636, while the minimum drops to 0.04845. This suggests that while certain suitable areas may maintain or increase their vegetation cover, arid, semi-arid regions, or areas with poor environmental conditions might experience more severe vegetation degradation amid frequent extreme climatic events and intensified resource competition. Notably, although the spatial average NDVI peaks under the highest emission scenario, SSP585, its maximum value is slightly lower than under the SSP370 scenario (0.7605), indicating that vegetation responses are influenced not only by CO2 concentration but also by other environmental stresses and resource availability resulting from climate change. The impact of future climate change on vegetation will be multidimensional and complex, necessitating a comprehensive consideration of multiple factors to fully understand the trends in vegetation dynamics.
To more distinctly reveal the characteristics of NDVI changes in China under four SSP scenarios, this study conducted a spatial distribution analysis of NDVI change from 2023 to 2100 under different SSP scenarios, as shown in Figure 6. The results indicate that the spatial patterns of NDVI change exhibit certain differences across scenarios. Generally, under lower greenhouse gas emission scenarios (e.g., SSP126), negative change areas are more widely distributed, especially in Inner Mongolia, the northeast, and parts of southern China. In contrast, higher emission scenarios (e.g., SSP370 and SSP585) show an increased proportion of positive change areas, particularly in some inland regions and Tibet. Specifically, under the SSP126 scenario, with aggressive mitigation measures and sustainable development strategies leading to strict control of greenhouse gas emissions, over half of the regions (61.20%) experienced NDVI decline. Under SSP245, slightly more than half of the regions (55.82%) showed a downward trend in NDVI. For SSP370, a marginally greater extent of regions (55.21%) also exhibited declining NDVI trends. However, under SSP585, the proportion of regions with NDVI increase exceeded those with a decrease, with 44.01% of regions experiencing NDVI reduction and 55.99% showing growth. Moreover, the magnitude of NDVI change varies among scenarios; the maximum increase under SSP370 far surpasses other scenarios, reaching 0.7362, indicating significant vegetation growth in some areas, possibly due to adaptation measures or natural ecosystem recovery. Under SSP585, both the maximum increase and decrease exhibit larger magnitudes (maximum increase: 0.7366, maximum decrease: −0.3158). Spatially, the distribution of negative and positive change areas differs by scenario. Under SSP126, NDVI decreases predominantly occur in central and eastern Inner Mongolia, northeastern China, the Sichuan Basin, Yungui Plateau, and southeastern hills, while positive change areas are relatively limited, concentrating in southern Shanxi and Shandong. Under SSP245, although the distribution pattern of negative change areas resembles SSP126, its extent narrows, mainly restricted to the northeast, Yungui Plateau, and Sichuan Basin regions, while positive change areas extend to small high-value zones in southeastern Tibet. Under SSP370, NDVI declines concentrate in the northeast, Yungui Plateau, and Sichuan Basin, whereas positive change areas appear in Hunan and Jiangxi, with small high-value zones also emerging in southeastern Tibet. Under SSP585, negative change areas are minimal, confined to Yunnan, eastern Inner Mongolia, and South China, while positive change areas form a strip-like distribution along the central border of Inner Mongolia and include small high-value zones in southeastern Tibet. The concentration of negative change areas may correlate with these regions’ higher sensitivity to climate change and impacts of temperature and precipitation changes, while the increase in positive change areas could be associated with enhanced ecological adaptability or climatic conditions becoming more favorable for vegetation growth in these regions.

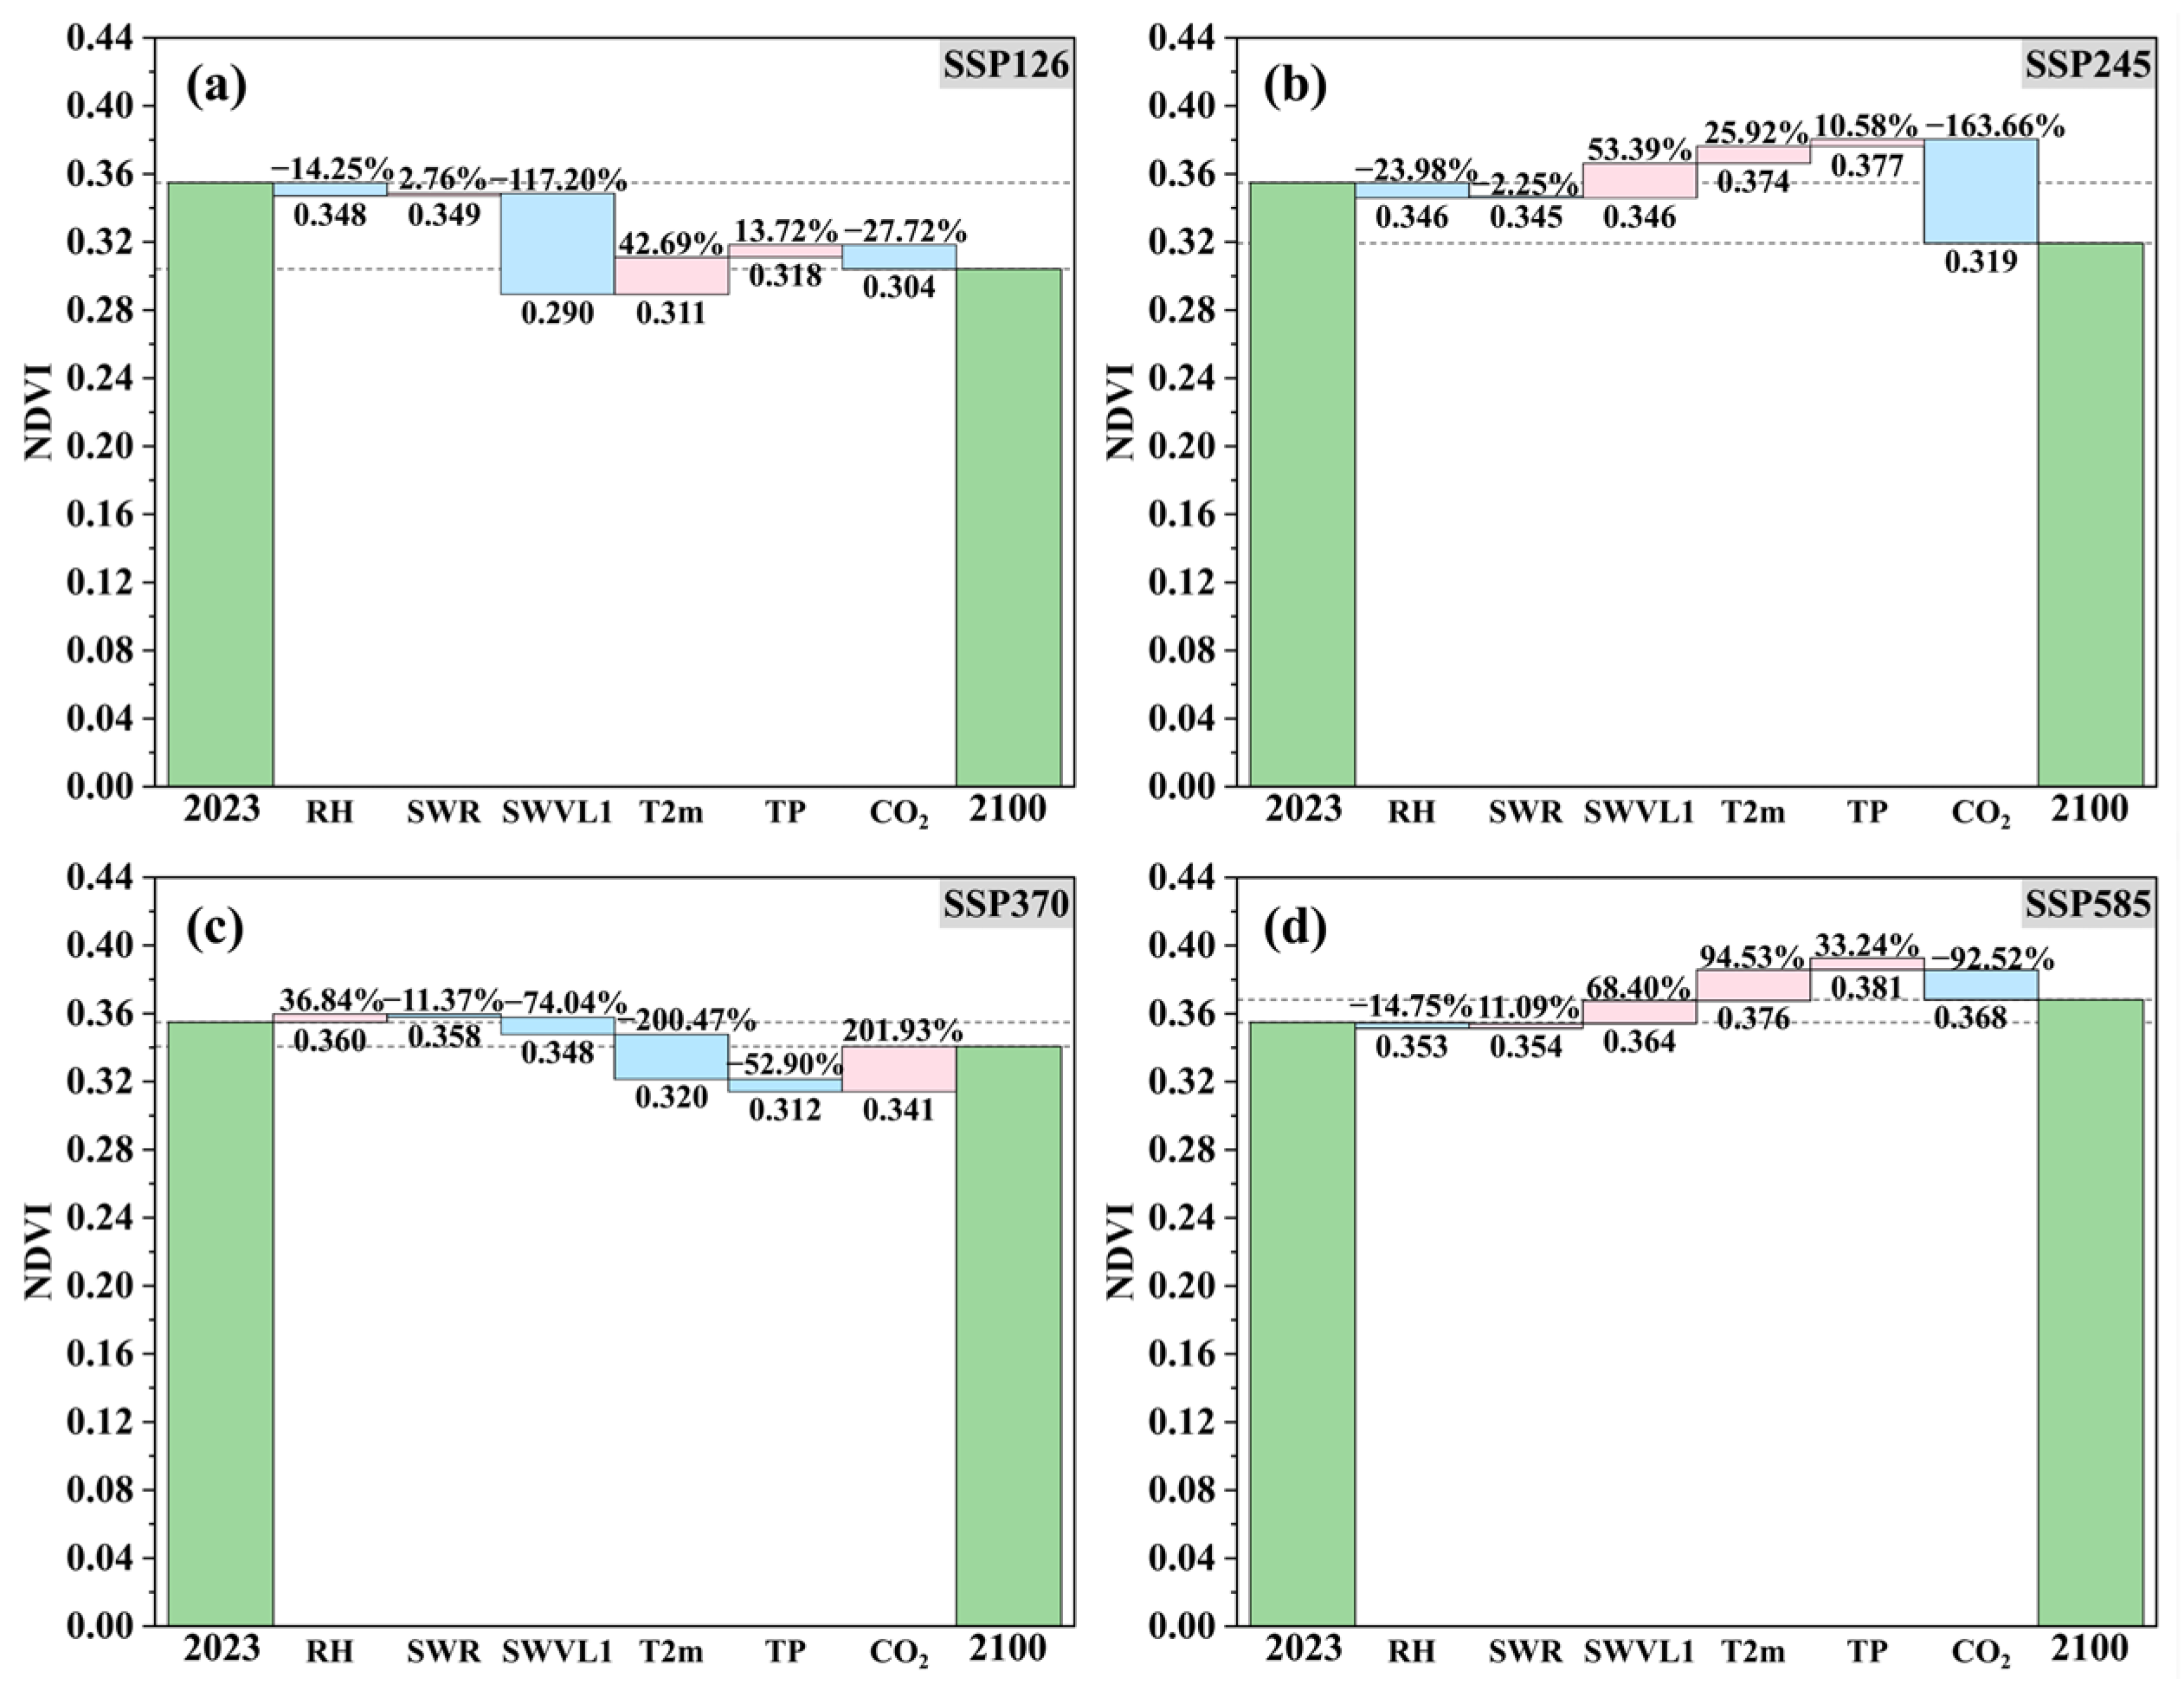
3.5. Impact of Future Meteorological Factors on NDVI

To further decompose the influence of different meteorological elements on NDVI, an analysis was conducted on the changes in NDVI and the contributions of meteorological factors across China from 2023 to 2100 under four SSP scenarios. Six key meteorological factors were identified: RH, SWR, SWVL1, T2m, TP, and CO2. The impact of these meteorological factors on vegetation cover change varies across the different SSP scenarios, as illustrated in Figure 7. Overall, RH, TP, and T2m are the primary factors influencing vegetation growth. Specifically, the average contribution rates of each factor across all scenarios are as follows: RH (−0.0306), SWR (0.00034), SWVL1 (−0.17313), T2m (−0.09306), and TP (0.01112). The results indicate that changes in RH and SWVL1 have a negative impact on vegetation growth, particularly in regions with low soil moisture, where plant growth is significantly constrained. Conversely, variations in T2m and TP exert relatively positive effects on vegetation growth. The contribution of SWR is minor but still affects NDVI changes. The influence of CO2 is complex and varies across scenarios. Under SSP126 and SSP245, the negative contribution rate of RH suggests that lower RH in these climate change scenarios may lead to decreased NDVI. In the SSP370 scenario, the positive contribution rate of RH indicates that increased RH benefits vegetation growth, thereby raising NDVI. Overall, higher warming scenarios (SSP370 and SSP585) are typically associated with greater variability in RH, indicating that RH’s effect on vegetation growth is influenced by the climate scenario. SWR is closely related to photosynthesis. Positive contribution rates under SSP126 and SSP585 suggest that increased radiation in these scenarios favors plant growth. In contrast, negative SWR contribution rates under SSP245 and SSP370 could be due to enhanced warming effects leading to more heat radiation, which may result in increased evaporation and plant dehydration, thus adversely affecting plant growth. Changes in SWVL1 are critical for vegetation growth; overly dry or wet soils can limit plant development. Negative SWVL1 contribution rates under SSP126 and SSP370 imply that drought conditions in these scenarios may restrict vegetation growth and decrease NDVI. Positive contributions under SSP245 and SSP585 suggest that appropriate soil moisture levels positively influence vegetation growth, potentially increasing NDVI. Temperature is a significant factor affecting plant growth. Higher temperatures generally promote plant growth, but extreme heat can cause thermal stress and inhibit it. Positive impacts of T2m changes on vegetation growth are observed under SSP126, SSP245, and SSP585, especially with the highest contribution rate under SSP585, possibly leading to increased NDVI. Under SSP370, the negative contribution rate of T2m indicates that high temperatures have a more detrimental effect on vegetation growth, resulting in decreased NDVI. TP is a crucial factor influencing NDVI changes. Increased TP generally signifies favorable conditions for plant growth, while reduced TP can lead to drought and vegetation decline. Positive TP contribution rates under SSP126 and SSP245 suggest that adequate precipitation supports vegetation growth and increases NDVI. The negative contribution rate under SSP370 implies potential exacerbation of drought, limiting vegetation growth. Under SSP585, the higher TP contribution rate suggests that increased precipitation may benefit vegetation growth, possibly enhancing NDVI. CO2 concentration plays a vital role in photosynthesis. Higher CO2 concentrations usually promote plant growth, although extremely high levels can induce thermal stress. Negative contribution rates of CO2 under SSP126, SSP245, and SSP585 suggest that CO2 concentrations in these scenarios do not reach the most beneficial range. A positive contribution rate under SSP370 indicates that elevated CO2 levels enhance photosynthesis and plant growth, promoting NDVI increase. This variation reflects the multifaceted impact of climate change on vegetation cover. Under future climate change trends, T2m, RH, and TP will become critical factors influencing vegetation growth in China. Therefore, when formulating policies to adapt to climate change, it is essential to consider the changes in these meteorological factors to mitigate the negative impacts on ecosystems.

4. Discussion

4.1. The Impact of Policies and Land Use on NDVI

Changes in policies and land use have a significant impact on vegetation. Between 2001 and 2023, NDVI values in China’s climate zones showed notable changes, largely due to policy adjustments and land use transformations. The TMC climate zone, covering the eastern coastal regions, North China, and Northeast China, experienced a decline in NDVI values, likely due to rapid urbanization and industrialization, which increased environmental pressures. In contrast, the TCC climate zone, located in the northwestern inland areas such as Inner Mongolia and Xinjiang, saw degradation primarily driven by overgrazing and land reclamation [94]. This zone’s vegetation is particularly sensitive to climate change due to the uneven distribution of precipitation. The SMC climate zone, which includes the middle and lower reaches of the Yangtze River and South China, also experienced a decline in NDVI values, mainly caused by urbanization reducing vegetation cover. The PMC climate zone, covering the Tibetan Plateau, faced a significant NDVI decline, likely due to habitat degradation from glacial retreat. Between 2004 and 2008, NDVI values in various climate zones generally showed a significant improvement trend. The increase in NDVI values in the TMC climate zone during this period was mainly due to the carbon sink effect brought about by the Grain-for-Green program. In the TCC climate zone, the growth in NDVI values was closely related to the implementation of grassland ecological compensation policies. The recovery of NDVI values in the SMC climate zone reflected the positive results of the collective forest rights system reform. In the PMC climate zone, the improvement in NDVI values demonstrated the important contribution of the Three Rivers Source ecological protection project. The increase in NDVI values in the TRMC climate zone aligned with the effective advancement of tropical rainforest conservation measures. However, in recent years, most climate zones have shown signs of vegetation stability and recovery, reflecting the continuous improvement and effective implementation of recent vegetation protection policies.

4.2. Changes in NDVI in China Under a High-Emission Scenario

Under a high-emission scenario (such as SSP585), although global warming is projected to lead to a series of negative environmental effects, the NDVI in China’s region is forecasted to increase. This phenomenon may appear counterintuitive at first glance since higher greenhouse gas emissions are typically associated with more severe ecological challenges. However, through quantifying changes in various meteorological factors and NDVI from 2023 to 2100 under different SSP scenarios, this phenomenon can be understood more profoundly. Quantification results for changes in different meteorological factors and NDVI in China’s region under the SSP585 scenario during this period are shown in Figure 8, while results under SSP126, SSP245, and SSP370 scenarios are presented in Supplementary Material (Figures S8–S10). Within this timeframe, SWVL1 changes predominantly manifest as significant reductions, with nearly all (96.11%) regions showing decreased SWVL1, and only a tiny proportion (3.89%) showing an increase. TP changes are primarily positive, with the vast majority (89.74%) of regions experiencing increased TP, while about 10% saw decreases. SWR changes are also predominantly positive, accounting for about 85.9%, indicating that most regions received enhanced solar radiation, while approximately 14% experienced reduced SWR. T2m changes are almost entirely positive, with virtually all regions (99.35%) undergoing temperature increases, and only a negligible number showed slight decreases. This anomalous phenomenon likely stems from the combined effect of multiple factors. Firstly, rising temperatures could extend the growing season of plants, thereby favoring vegetation expansion and lushness [95]. Specifically, near-universal temperature increases (over 99% of regions) provide more favorable thermal conditions, prolonging the plant growth cycle. Yang et al.’s study on vegetation temperature sensitivity under global warming highlights that under the SSP245 and SSP585 scenarios, vegetation temperature sensitivity shows an increasing trend, with a more significant rise under the SSP585 scenario, especially in the northern Eurasian continent and the Tibetan Plateau. In contrast, under the SSP126 scenario, vegetation temperature sensitivity increases before 2080 but starts to decline after 2080 [96]. This also confirms that under the SSP585 scenario, the rise in temperature is expected to lead to an increase in NDVI values. Secondly, elevated atmospheric CO2 concentrations can enhance photosynthetic efficiency, thus boosting vegetation productivity [97]. Moreover, increased precipitation (nearly 90% of regions) might improve moisture conditions in some arid areas, supporting vegetation growth. Although RH and SWVL1 generally show decreasing trends, these adverse impacts may be compensated for or outweighed by other more favorable conditions. The enhancement of SWR (about 85.9% of regions) may also promote the photosynthesis process, further supporting vegetation growth. In summary, under the SSP585 scenario, despite facing adverse factors such as reductions in RH and SWVL1, the NDVI value in China’s region is expected to rise due to the influence of increased temperatures, precipitation, and SWR. This suggests that certain aspects of climate change may temporarily promote an increase in vegetation cover under specific conditions. However, this study must consider the concept of ecosystem tipping points. Although current predictions show an overall upward trend in NDVI under the SSP585 scenario, this improvement may mask potential vulnerabilities. The response of vegetation to climate change is not a linear relationship; rather, it is constrained by resilience thresholds [98]. Once these thresholds are exceeded, the ecosystem’s ability to recover from stress will significantly decline [99]. In the case of prolonged droughts, extremely high temperatures, or soil moisture depletion, despite short-term increases in NDVI, the ecosystem may exceed its resilience threshold over a longer period, resulting in reduced vegetation cover, loss of biodiversity, or even desertification [100]. Nguyen et al. also studied this phenomenon. They used CMIP6 data to predict NDVI values under different future SSP scenarios. The study pointed out that globally, during the near-term period of 2021–2040, the average NDVI value under the SSP585 scenario is slightly higher than that under SSP245 and SSP370, indicating that significant temperature increases in the short term have a positive effect on vegetation growth. However, by 2081–2100, SSP370 and SSP585 show a downward trend, with the average NDVI value under SSP585 falling below the levels of 1981–2000. A further analysis of data across continents revealed that between 2021 and 2100, under the SSP585 scenario, NDVI values in Africa, South America, and Oceania decrease over time, while Asia shows an increasing trend. Specifically, during the period of 2081–2100, the NDVI values in Asia under the SSP126 scenario decrease compared with other scenarios [101]. This study focuses on the entire China region, which is located in Asia, and its results align with this observation. Therefore, although NDVI shows a short-term increase under high-emission scenarios, long-term climate change may bring more negative impacts. Long-term predictions must account for the risks of ecosystem instability caused by exceeding resilience thresholds. Meanwhile, human activities play a crucial role in changes in vegetation cover. This study primarily focuses on the impact of meteorological factors on NDVI and thus may not fully capture the specific contribution of human activities. In future research, the authors will place greater emphasis on the impact of human activities on NDVI, particularly in the context of approaching or exceeding ecosystem critical points, in order to provide a more comprehensive understanding framework.

4.3. Limitations and Outlook of This Study

The NDVI shows varying degrees of lag in response to different climate factors for different types of vegetation, which is crucial for analyzing the climate–vegetation relationship. Cai et al. pointed out that there are significant differences in the responses of various vegetation types and growth stages to climate factors. NDVI responds more significantly to temperature than other factors, and the lag time varies greatly depending on the growth stage and vegetation type. Precipitation typically has a lag of 1 to 2 months on NDVI, with precipitation in May and June having the greatest impact on NDVI for alpine grasslands, alpine sparse vegetation, and temperate desert vegetation types [102]. Hua et al. pointed out that the lag effect is a key factor in studying vegetation’s response to climate anomalies. In semi-arid regions, grasslands have the shortest lag time in response, possibly because grasslands are more susceptible to water stress than other vegetation types associated with crops. In contrast, deciduous forests have the longest lag time in response, which means that when deciduous forests face extreme climate conditions, their own stress response and adaptive capacity make them less affected by climate anomalies [103]. Liu et al. pointed out that vegetation growth is significantly influenced by the lag effect of climate factors. The proportion of grids across the entire Tibetan Plateau affected by the combined lag and cumulative effects of climate factors ranges from 43.42% to 45.78%. When establishing models to relate climate factors and vegetation indices, the combined lag-cumulative effects of climate factors should be fully considered. Multiple studies have shown that analyzing these lag effects can help us more accurately predict how different types of vegetation will respond to climate change [104]. However, this study is primarily based on an annual scale, and therefore, it does not cover the impact of lag effects on the interaction between vegetation and climate. However, it is important to note that this study primarily relies on data collected from 2001 to 2023 due to the temporal limitations of the MODIS dataset. Although this period provides valuable insights into the short-term dynamics between climate and vegetation, it does not reach the 30-year benchmark recommended by the World Meteorological Organization (WMO) for robust climate cycle analysis [105]. This limitation may affect our ability to capture long-term trends and variability in the interactions between climate factors and vegetation health. In addition, the predictive model developed in this study may have uncertainties in long-term forecasting. When using CMIP6 climate scenario data for future NDVI prediction, the inherent uncertainties of CMIP6 climate models present a challenge, potentially leading to uncertainties in vegetation’s response to climate change. At the same time, the relationship between climate factors (such as temperature and precipitation) and vegetation response (NDVI) may change over time, which could lead to biased NDVI predictions when climate or ecological processes undergo significant changes. Moreover, this study acknowledges certain limitations related to data quality and retrieval processes. First, the datasets used in this study—particularly the meteorological and remote sensing data—have inherent uncertainties. For example, spatial and temporal mismatches between climate variables and NDVI observations may affect the accuracy of the derived relationships. Second, although the MODIS NDVI product undergoes rigorous cloud screening, thin clouds may still influence pixel values, potentially introducing noise or bias into the NDVI time series. This could affect the detection of subtle vegetation dynamics, especially in regions with frequent cloud cover or complex terrain. In future research, the authors plan to conduct analyses on smaller time scales, with a particular focus on the lag effects of climate factors on NDVI, while also improving data preprocessing techniques to better account for atmospheric interference and dataset inconsistencies. Additionally, this study will continue to monitor the development of longer time series remote sensing data and strive to expand the temporal coverage of our analyses when data availability permits. Our goal is to align future studies more closely with the 30-year climate cycle standard, thereby enhancing the robustness and applicability of our findings in the context of long-term climate–vegetation interactions. These improvements will help provide more detailed and accurate insights into the dynamic interactions between climate and vegetation.

5. Conclusions

Firstly, this study conducted a long-term time series analysis of the NDVI in China from 2001 to 2023, comprehensively revealing the long-term dynamic changes in vegetation coverage across various regions of China. It showed that, overall, NDVI data for China exhibited significant seasonal fluctuations and a long-term upward trend during 2001–2023, especially noteworthy is the pronounced growth since 2010, largely attributed to a series of ecological restoration policies implemented by the Chinese government, such as the “Three-North Shelter Forest” and “Grain for Green”. Meanwhile, variations among different regions were observed: NDVI significantly increased in southeastern Henan and northwestern Anhui, while it slightly decreased in northwestern Inner Mongolia and northeastern Heihe, and NDVI notably rose in southern Xiaogan and Qianjiang of Hubei, demonstrating the effectiveness of local conservation measures. Further, through STL decomposition, a long-term series analysis of NDVI across different climatic zones in China revealed complex fluctuations, with seasonal components showing clear annual periodicity. During 2001–2010, NDVI values in TMC and TCC climatic zones significantly declined, mainly due to urbanization, industrialization, and overgrazing, but with the implementation of environmental protection policies, vegetation gradually recovered. In PMC and SMC climatic zones, NDVI first decreased and then increased, whereas in TRMC climatic zones, there was a marked recovery after 2010, highlighting the positive roles of policies, technological innovations, and climate change, leading to significant improvements in vegetation coverage. Moreover, different vegetation types exhibited heterogeneity in NDVI across seasons: The NDVI of forest, cropland, and grassland experienced a decline followed by a rebound in spring, peaking in 2014, and then fluctuating again. In summer, the NDVI first increased, then decreased, and rebounded, reaching two peaks in 2012 and 2021. In autumn, there was an overall trend of first increasing and then fluctuating downward, with particularly sharp changes between 2007 and 2021. In winter, there was no clear trend of increase or decrease, mainly exhibiting a fluctuating pattern. In contrast, the NDVI of shrub vegetation remained relatively stable and showed a continuous upward trend throughout the entire observation period, exhibiting dynamic characteristics distinct from other vegetation types. Additionally, using VIP scores as an important tool for variable selection in PLS models, the relationship between NDVI and meteorological factors was thoroughly examined, indicating that from 2001 to 2023, vegetation growth in China was primarily influenced by SWVL1 (79.22% of areas scored > 0.8), SWR (71.86% of areas scored > 0.8), and TP (74.78% of areas scored > 0.8), albeit CO2’s impact was relatively minor, yet its long-term effect remains to be monitored.
Secondly, this study fully considered the changes in NDVI under different climate change scenarios. By using ensemble learning methods and CMIP6 multimodel data, it assessed the NDVI changes in China from 2023 to 2100 under four emission scenarios (SSP126, SSP245, SSP370, and SSP585). Results indicate that, under all scenarios, China’s NDVI displayed a spatial pattern of lower values in the northwest and higher values in the southeast, primarily constrained by precipitation patterns and climatic conditions. Specifically, as greenhouse gas emissions increased, the national average NDVI also sequentially rose, from 0.3041 under the SSP126 scenario to 0.3682 under the SSP585 scenario, suggesting that despite potential negative impacts brought by global warming, vegetation conditions in certain regions are expected to improve under high-emission scenarios. However, this improvement is regionally heterogeneous: while southeastern China generally experienced enhanced vegetation growth across all scenarios, arid and semi-arid areas in the northwest may face more severe vegetation degradation due to intensified drought stress. Furthermore, spatial patterns of NDVI changes varied under different scenarios: under lower emission scenarios (e.g., SSP126), areas with reduced NDVI were more widespread, particularly in northern and western China, whereas under higher emission scenarios (e.g., SSP370 and SSP585), the proportion of areas with increased NDVI grew, especially in inland regions and Tibet, where temperature limitations on vegetation growth are more pronounced. Notably, although the spatial average NDVI reached its peak under the SSP585 scenario, its marginal increase over SSP370 was relatively small compared with the much stronger forcing, indicating possible saturation effects or increasing environmental constraints such as water availability under extreme warming. This suggests that vegetation responses are not only influenced by CO2 concentrations but also by other environmental pressures and resource availability.
Finally, this study comprehensively considered the influence of multiple meteorological factors on NDVI, using Random Forest to rank the importance of these factors. It analyzed the impact of six key meteorological factors (RH, SWR, SWVL1, T2m, TP, and CO2) on the NDVI changes in China from 2023 to 2100 under four different SSP scenarios. The analysis revealed that RH, TP, and T2m are the main factors influencing vegetation growth. Generally, suitable RH and TP along with moderate temperature increases benefit vegetation growth, whereas low soil moisture under drought conditions and extremely high temperatures inhibit vegetation development. The influence of CO2 concentration is complex but may aid photosynthesis under certain high-emission scenarios. Future climate change will exert complex effects on China’s vegetation through the interaction of these meteorological factors, necessitating comprehensive consideration of trends in each factor when formulating adaptation policies to mitigate the negative impacts of climate change on ecosystems and ensure the health of vegetation and ecosystem sustainability.

Supplementary Materials

The following supporting information can be downloaded at https://www.mdpi.com/article/10.3390/atmos16060738/s1. Figure S1: NDVI Changes in the PMC climate zone from 2001 to 2023: analysis of seasonal fluctuations, long-term trends, and residual components based on the STL method. Subplots from top to bottom represent the original data, seasonal components, trend components, and residual components, respectively; Figure S2: NDVI changes in the SMC Climate Zone from 2001 to 2023: Analysis of Seasonal Fluctuations, Long-term Trends, and residual components based on the STL method. Subplots from top to bottom represent the original data, seasonal components, trend components, and residual components, respectively; Figure S3: NDVI changes in the TCC climate zone from 2001 to 2023: analysis of seasonal fluctuations, long-term trends, and residual components based on the STL method. Subplots from top to bottom represent the original data, seasonal components, trend components, and residual components, respectively; Figure S4: NDVI changes in the TMC climate zone from 2001 to 2023: analysis of seasonal fluctuations, long-term trends, and residual components based on the STL method. Subplots from top to bottom represent the original data, seasonal components, trend components, and residual components, respectively; Figure S5: NDVI changes in the TRMC climate zone from 2001 to 2023: analysis of seasonal fluctuations, long-term trends, and residual components based on the STL method. Subplots from top to bottom represent the original data, seasonal components, trend components, and residual components, respectively; Figure S6: Scatter density plot for performance evaluation of NDVI prediction using stacking models; Figure S7: Spatial distribution maps of RMSE for stacked model prediction performance; Figure S8: Spatial distribution of different meteorological factors and NDVI changes in China under the SSP126 scenario from 2023 to 2100: Figures a, b, c, d, e, and f represent the spatial distribution of changes in RH, SWR, T2m, TP, SWVL1, and NDVI, respectively; Figure S9: Spatial distribution of different meteorological factors and NDVI changes in China under the SSP245 scenario from 2023 to 2100: Figures a, b, c, d, e, and f represent the spatial distribution of changes in RH, SWR, T2m, TP, SWVL1, and NDVI, respective; Figure S10: Spatial distribution of different meteorological factors and NDVI changes in China under the SSP370 scenario from 2023 to 2100: Figures a, b, c, d, e, and f represent the spatial distribution of changes in RH, SWR, T2m, TP, SWVL1, and NDVI, respectively.

Author Contributions

Software, validation, formal analysis, investigation, data curation, writing—original draft, A.L.; conceptualization, methodology, writing—review and editing, S.Y.; project administration, supervision, C.S. and N.L. All authors have read and agreed to the published version of the manuscript.

Funding

This work is supported by The Third Xinjiang Scientific Expedition Program (grant number 2022xjkk0903) and the National Natural Science Foundation of China (42475142).

Institutional Review Board Statement

Not applicable.

Informed Consent Statement

Not applicable.

Data Availability Statement

The original contributions presented in this study are included in the article/Supplementary Material. Further inquiries can be directed to the corresponding author.

Acknowledgments

We would like to express gratitude to the anonymous reviewers for their careful work and thoughtful suggestions that helped a lot to improve and clarify this paper.

Conflicts of Interest

The funders had no role in the design of the study; in the collection, analyses, or interpretation of data; in the writing of the manuscript; or in the decision to publish the results.

Abbreviations

The following abbreviations are used in this manuscript:
NDVINormalized Difference Vegetation Index
CMIP6Coupled Model Intercomparison Project Phase 6
CO2carbon dioxide
SSPShared Socioeconomic Pathways
STLSeasonal and Trend decomposition using Loess
PLSPartial Least Squares
VIPVariable Importance in Projection
RHrelative humidity
SWRshortwave radiation
SWVL1soil moisture
T2mtemperature at 2 m
TPprecipitation
TMCTemperate Monsoon Climate
TCCTemperate Continental Climate
PMCPlateau Mountain Climate
SMCSubtropical Monsoon Climate
TRMCTropical Monsoon Climate
RMSERoot Mean Square Error
MAEMean Absolute Error
R2Coefficient of Determination

References

  1. Piao, S.; Ciais, P.; Huang, Y.; Shen, Z.; Peng, S.; Li, J.; Zhou, L.; Liu, H.; Ma, Y.; Ding, Y. The impacts of climate change on water resources and agriculture in China. Nature 2010, 467, 43–51. [Google Scholar] [CrossRef] [PubMed]
  2. Shilong, P.; Jingyun, F. Dynamic changes of vegetation cover in China in the last 18 years. Quat. Res. 2001, 21, 294–302. [Google Scholar]
  3. Lan, X.Y.; Li, R.W.; Wang, X.; Zhou, T.C.; Li, Y.H.; Duo, J.; Sun, J. Vegetation Dynamics and Sensitivity Responds to Climate Change in the Upstream of the Yellow River, China. Ecosyst. Health Sustain. 2025, 11, 0292. [Google Scholar] [CrossRef]
  4. Guha, S. Dynamic seasonal analysis on LST-NDVI relationship and ecological health of Raipur City, India. Ecosyst. Health Sustain. 2021, 7, 1927852. [Google Scholar] [CrossRef]
  5. Letu, H.; Ma, R.; Nakajima, T.Y.; Shi, C.; Hashimoto, M.; Nagao, T.M.; Baran, A.J.; Nakajima, T.; Xu, J.; Wang, T.X.; et al. Surface Solar Radiation Compositions Observed from Himawari-8/9 and Fengyun-4 Series. Bull. Am. Meteorol. Soc. 2023, 104, E1772–E1789. [Google Scholar] [CrossRef]
  6. Tana, G.; Ri, X.; Shi, C.; Ma, R.; Letu, H.; Xu, J.; Shi, J.C. Retrieval of cloud microphysical properties from Himawari-8/AHI infrared channels and its application in surface shortwave downward radiation estimation in the sun glint region. Remote Sens. Environ. 2023, 290, 113548. [Google Scholar] [CrossRef]
  7. Dennison, P.E.; Lamb, B.T.; Campbell, M.J.; Kokaly, R.F.; Hively, W.D.; Vermote, E.; Dabney, P.; Serbin, G.; Quemada, M.; Daughtry, C.S. Modeling global indices for estimating non-photosynthetic vegetation cover. Remote Sens. Environ. 2023, 295, 113715. [Google Scholar] [CrossRef]
  8. Liu, Y.; Tian, J.; Liu, R.; Ding, L. Influences of climate change and human activities on NDVI changes in China. Remote Sens. 2021, 13, 4326. [Google Scholar] [CrossRef]
  9. Shi, C.; Letu, H.; Nakajima, T.Y.; Nakajima, T.; Wei, L.; Xu, R.; Lu, F.; Riedi, J.; Ichii, K.; Zeng, J.; et al. Near-global monitoring of surface solar radiation through the construction of a geostationary satellite network observation system. Innovation 2025, 6, 100876. [Google Scholar] [CrossRef]
  10. Ottosen, T.-B.; Kumar, P. The influence of the vegetation cycle on the mitigation of air pollution by a deciduous roadside hedge. Sustain. Cities Soc. 2020, 53, 101919. [Google Scholar] [CrossRef]
  11. Ukkola, A.; Keenan, T.; Kelley, D.I.; Prentice, D.I. Vegetation plays an important role in mediating future water resources. Environ. Res. Lett. 2016, 11, 094022. [Google Scholar] [CrossRef]
  12. Xin, Z.; Xu, J.; Zheng, W. Spatiotemporal variations of vegetation cover on the Chinese Loess Plateau (1981–2006): Impacts of climate changes and human activities. Sci. China Ser. D Earth Sci. 2008, 51, 67–78. [Google Scholar] [CrossRef]
  13. Deery, D.M.; Smith, D.J.; Davy, R.; Jimenez-Berni, J.A.; Rebetzke, G.J.; James, R.A. Impact of Varying Light and Dew on Ground Cover Estimates from Active NDVI, RGB, and LiDAR. J. Remote Sens. 2021, 2021, 9842178. [Google Scholar] [CrossRef] [PubMed]
  14. Fan, L.; Dong, G.; Frappart, F.; Wigneron, J.-P.; Yue, Y.; Xiao, X.; Zhang, Y.; Tao, S.; Cao, L.; Li, Y.; et al. Satellite-Observed Increase in Aboveground Carbon over Southwest China during 2013–2021. J. Remote Sens. 2024, 4, 0113. [Google Scholar] [CrossRef]
  15. Liu, D.; Xu, Z. Decline in Coupling Between Vegetation Photosynthesis and Greening in Northern Ecosystems During the Photosynthesis-Up Period. Glob. Change Biol. 2024, 30, e17569. [Google Scholar] [CrossRef]
  16. Anyamba, A.; Tucker, C.J. Analysis of Sahelian vegetation dynamics using NOAA-AVHRR NDVI data from 1981–2003. J. Arid. Environ. 2005, 63, 596–614. [Google Scholar] [CrossRef]
  17. Sun, T.; Li, X.; Xu, M.; Zhang, M. Spatial temporal variations of vegetation coverage in the Tarim River Basin from 2000 to 2018. Arid Land Geogr. 2020, 43, 415–424. [Google Scholar] [CrossRef]
  18. Huete, A.; Justice, C.; Van Leeuwen, W. MODIS Vegetation Index (MOD13) Algorithm Theoretical Basis Document; NASA Goddard Space Flight Center: Greenbelt, MD, USA, 1999.
  19. Mu, X.; Yang, Y.; Xu, H.; Guo, Y.; Lai, Y.; McVicar, T.R.; Xie, D.; Yan, G. Improvement of NDVI mixture model for fractional vegetation cover estimation with consideration of shaded vegetation and soil components. Remote Sens. Environ. 2024, 314, 114409. [Google Scholar] [CrossRef]
  20. Tucker, C.J. Red and photographic infrared linear combinations for monitoring vegetation. Remote Sens. Environ. 1979, 8, 127–150. [Google Scholar] [CrossRef]
  21. Chen, Y.; Sun, Q.; Hu, J. Quantitatively estimating of InSAR decorrelation based on Landsat-derived NDVI. Remote Sens. 2021, 13, 2440. [Google Scholar] [CrossRef]
  22. Banskota, A.; Kayastha, N.; Falkowski, M.J.; Wulder, M.A.; Froese, R.E.; White, J.C. Forest monitoring using Landsat time series data: A review. Can. J. Remote Sens. 2014, 40, 362–384. [Google Scholar] [CrossRef]
  23. Yengoh, G.T.; Dent, D.; Olsson, L.; Tengberg, A.E.; Tucker, C.J., III. Use of the Normalized Difference Vegetation Index (NDVI) to Assess Land Degradation at Multiple Scales: Current Status, Future Trends, and Practical Considerations; Springer: Berlin/Heidelberg, Germany, 2015. [Google Scholar]
  24. Zelený, J.; Mercado-Bettín, D.; Müller, F. Towards the evaluation of regional ecosystem integrity using NDVI, brightness temperature and surface heterogeneity. Sci. Total Environ. 2021, 796, 148994. [Google Scholar] [CrossRef] [PubMed]
  25. Bellón, B.; Bégué, A.; Lo Seen, D.; De Almeida, C.A.; Simões, M. A remote sensing approach for regional-scale mapping of agricultural land-use systems based on NDVI time series. Remote Sens. 2017, 9, 600. [Google Scholar] [CrossRef]
  26. Jin, J.; Wang, Y.; Jiang, H.; Cheng, M. Recent NDVI-based variation in growth of boreal intact forest landscapes and its correlation with climatic variables. Sustainability 2016, 8, 326. [Google Scholar] [CrossRef]
  27. Basuki, Y. Hydrometeorological hazard prediction in the kuto bodri river region central java based on normalized difference vegetation index (ndvi) analysis. IOP Conf. Ser. Earth Environ. Sci. 2021, 683, 012098. [Google Scholar] [CrossRef]
  28. Digavinti, J.; Manikiam, B. Satellite monitoring of forest fire impact and regeneration using NDVI and LST. J. Appl. Remote Sens. 2021, 15, 042412. [Google Scholar] [CrossRef]
  29. Ghebrezgabher, M.G.; Yang, T.; Yang, X.; Sereke, T.E. Assessment of NDVI variations in responses to climate change in the Horn of Africa. Egypt. J. Remote Sens. Space Sci. 2020, 23, 249–261. [Google Scholar] [CrossRef]
  30. Hou, M.; Zhao, H.; Wang, Z.; Yan, X. Vegetation responses to climate change by using the satellite-derived normalized difference vegetation index: A review. Clim. Environ. Res. Technol. 2013, 18, 353–364. [Google Scholar]
  31. Fawcett, D.; Bennie, J.; Anderson, K. Monitoring spring phenology of individual tree crowns using drone-acquired NDVI data. Remote Sens. Ecol. Conserv. 2021, 7, 227–244. [Google Scholar] [CrossRef]
  32. Fensholt, R.; Sandholt, I.; Stisen, S.; Tucker, C. Analysing NDVI for the African continent using the geostationary meteosat second generation SEVIRI sensor. Remote Sens. Environ. 2006, 101, 212–229. [Google Scholar] [CrossRef]
  33. Xu, Y.; Huang, W.-T.; Dou, S.-Q.; Guo, Z.-D.; Li, X.-Y.; Zheng, Z.-W.; Jing, J.-L. Responding mechanism of vegetation cover to climate change and human activities in Southwest China from 2000 to 2020. Huanjing Kexue 2022, 43, 3230–3240. [Google Scholar] [PubMed]
  34. Eastman, J.R.; Sangermano, F.; Machado, E.A.; Rogan, J.; Anyamba, A. Global trends in seasonality of normalized difference vegetation index (NDVI), 1982–2011. Remote Sens. 2013, 5, 4799–4818. [Google Scholar] [CrossRef]
  35. Guo, B.; Jiang, L.; Ge, D.; Shang, M. Driving Mechanism of Vegetation Coverage Change in the Yarlung Zangbo River Basin under the Stress of Global Warming. J. Trop. Subtrop. Bot. 2017, 25, 209–217. [Google Scholar] [CrossRef]
  36. Jiang, S.; Chen, X.; Smettem, K.; Wang, T. Climate and land use influences on changing spatiotemporal patterns of mountain vegetation cover in southwest China. Ecol. Indic. 2021, 121, 107193. [Google Scholar] [CrossRef]
  37. Zheng, C.; Zeng, Y.; Zhao, Y.; Zhao, D.; Wu, B. Monitoring and dynamic analysis of fractional vegetation cover in southwestern China over the past 15 years based on MODIS data. Remote Sens. Nat. Resour. 2017, 29, 128–136. [Google Scholar] [CrossRef]
  38. Guo, L.; Zuo, L.; Gao, J.; Jiang, Y.; Zhang, Y.; Ma, S.; Zou, Y.; Wu, S. Revealing the fingerprint of climate change in interannual NDVI variability among biomes in Inner Mongolia, China. Remote Sens. 2020, 12, 1332. [Google Scholar] [CrossRef]
  39. Li, Y.; Jia, K.; Wei, X.; Yao, Y.; Sun, J.; Mu, L. Fractional vegetation cover estimation in northern China and its change analysis. Remote Sens. Nat. Resour. 2015, 27, 112–117. [Google Scholar]
  40. Cheng, F.; Liu, S.; Yin, Y.; Lü, Y.; An, N.; Liu, X. The dynamics and main driving factors of coastal vegetation in Guangxi based on MODIS NDVI. Acta Ecol. Sin. 2017, 37, 788–797. [Google Scholar]
  41. Wang, X.; Hou, X. Variation of Normalized Difference Vegetation Index and its response to extreme climate in coastal China during 1982–2014. Geogr. Res. 2019, 4, 807–821. [Google Scholar]
  42. Lu, C.; Hou, M.; Liu, Z.; Li, H.; Lu, C. Variation characteristic of NDVI and its response to climate change in the middle and upper reaches of Yellow River Basin, China. IEEE J. Sel. Top. Appl. Earth Obs. Remote Sens. 2021, 14, 8484–8496. [Google Scholar] [CrossRef]
  43. Zhao, A.; Zhang, A.; Lu, C.; Wang, D.; Wang, H.; Liu, H. Spatiotemporal variation of vegetation coverage before and after implementation of Grain for Green Program in Loess Plateau, China. Ecol. Eng. 2017, 104, 13–22. [Google Scholar] [CrossRef]
  44. Zhang, Y.; Wen, X.; Luo, S.; Li, M. Study on the Relationship between Vegetation Cover Change and Climate Factors in Zoige Wetland in Recent 20 Years. Plateau Meteorol. 2022, 41, 317–327. [Google Scholar] [CrossRef]
  45. Zhao, H.; Cao, X. Vegetation cover changes and its climate driving in Three-River-Source National Park. Plateau Meteorol. 2022, 41, 328–337. [Google Scholar]
  46. Wu, D.; Wu, H.; Zhao, X.; Zhou, T.; Tang, B.; Zhao, W.; Jia, K. Evaluation of spatiotemporal variations of global fractional vegetation cover based on GIMMS NDVI data from 1982 to 2011. Remote Sens. 2014, 6, 4217–4239. [Google Scholar] [CrossRef]
  47. Zhu, J.; Yang, Q.; Li, X.; Li, Y. Characteristics and East Downscaling Forecast Model of Summer Precipitation in Northwest China. Plateau Meteorol. 2023, 42, 646–656. [Google Scholar]
  48. Zhao, Q.; Zhang, J.; Zhao, T.; Li, J. Vegetation Changes and Its Response to Climate Change in China Since 2000. Plateau Meteorol. 2021, 40, 292–301. [Google Scholar] [CrossRef]
  49. Lai, X.; Fan, G.; Hua, W.; Ding, X. Progress in the study of influence of the Qinghai-Xizang Plateau land atmosphere interaction on east Asia regional climate. Plateau Meteorol. 2021, 40, 1263–1277. [Google Scholar]
  50. Bao, Y.; Wang, Y.; Nan, S.; Yu, M. Response of Vegetation over the Qinghai-Xizang Plateau to Projected Warming Climate. Plateau Meteorol. 2023, 42, 553–563. [Google Scholar] [CrossRef]
  51. Liang, Z.; Sun, R.; Duan, Q. Spatiotemporal variation of NDVI in the Yellow River water conservation zone and its driving factors. Prog. Geogr. 2023, 42, 1717–1732. [Google Scholar] [CrossRef]
  52. Cui, C.; Zhang, W.; Hong, Z.; Meng, L. Forecasting NDVI in multiple complex areas using neural network techniques combined feature engineering. Int. J. Digit. Earth 2020, 13, 1733–1749. [Google Scholar] [CrossRef]
  53. Huang, S.; Ming, B.; Huang, Q.; Leng, G.; Hou, B. A case study on a combination NDVI forecasting model based on the entropy weight method. Water Resour. Manag. 2017, 31, 3667–3681. [Google Scholar] [CrossRef]
  54. Gao, P.Q.; Du, W.F.; Lei, Q.W.; Li, J.Z.; Zhang, S.J.; Li, N. NDVI Forecasting Model Based on the Combination of Time Series Decomposition and CNN-LSTM. Water Resour. Manag. 2023, 37, 1481–1497. [Google Scholar] [CrossRef]
  55. Didan, K.; Munoz, A.B.; Solano, R.; Huete, A. MODIS vegetation index user’s guide (MOD13 series). Univ. Ariz. Veg. Index Phenol. Lab 2015, 35, 2–33. [Google Scholar]
  56. van Leeuwen, W.J.; Huete, A.R.; Laing, T.W. MODIS vegetation index compositing approach: A prototype with AVHRR data. Remote Sens. Environ. 1999, 69, 264–280. [Google Scholar] [CrossRef]
  57. Xu, L.; Herold, M.; Tsendbazar, N.-E.; Masiliūnas, D.; Li, L.; Lesiv, M.; Fritz, S.; Verbesselt, J. Time series analysis for global land cover change monitoring: A comparison across sensors. Remote Sens. Environ. 2022, 271, 112905. [Google Scholar] [CrossRef]
  58. Bell, B.; Hersbach, H.; Simmons, A.; Berrisford, P.; Dahlgren, P.; Horányi, A.; Muñoz-Sabater, J.; Nicolas, J.; Radu, R.; Schepers, D. The ERA5 global reanalysis: Preliminary extension to 1950. Q. J. R. Meteorol. Soc. 2021, 147, 4186–4227. [Google Scholar] [CrossRef]
  59. Hersbach, H.; Bell, B.; Berrisford, P.; Hirahara, S.; Horányi, A.; Muñoz-Sabater, J.; Nicolas, J.; Peubey, C.; Radu, R.; Schepers, D. The ERA5 global reanalysis. Q. J. R. Meteorolog. Soc. 2020, 146, 1999–2049. [Google Scholar] [CrossRef]
  60. Muñoz-Sabater, J.; Dutra, E.; Agustí-Panareda, A.; Albergel, C.; Arduini, G.; Balsamo, G.; Boussetta, S.; Choulga, M.; Harrigan, S.; Hersbach, H. ERA5-Land: A state-of-the-art global reanalysis dataset for land applications. Earth Syst. Sci. Data 2021, 13, 4349–4383. [Google Scholar] [CrossRef]
  61. Smith, G.; Priestley, K.; Loeb, N.; Wielicki, B.; Charlock, T.; Minnis, P.; Doelling, D.; Rutan, D. Clouds and Earth Radiant Energy System (CERES), a review: Past, present and future. Adv. Space Res. 2011, 48, 254–263. [Google Scholar] [CrossRef]
  62. Wielicki, B.A.; Barkstrom, B.R.; Baum, B.A.; Charlock, T.P.; Green, R.N.; Kratz, D.P.; Lee, R.B.; Minnis, P.; Smith, G.L.; Wong, T. Clouds and the Earth's Radiant Energy System (CERES): Algorithm overview. IEEE Trans. Geosci. Remote Sens. 1998, 36, 1127–1141. [Google Scholar] [CrossRef]
  63. O'Neill, B.C.; Tebaldi, C.; Van Vuuren, D.P.; Eyring, V.; Friedlingstein, P.; Hurtt, G.; Knutti, R.; Kriegler, E.; Lamarque, J.-F.; Lowe, J. The scenario model intercomparison project (ScenarioMIP) for CMIP6. Geosci. Model Dev. 2016, 9, 3461–3482. [Google Scholar] [CrossRef]
  64. Zelinka, M.D.; Myers, T.A.; McCoy, D.T.; Po-Chedley, S.; Caldwell, P.M.; Ceppi, P.; Klein, S.A.; Taylor, K.E. Causes of higher climate sensitivity in CMIP6 models. Geophys. Res. Lett. 2020, 47, e2019GL085782. [Google Scholar] [CrossRef]
  65. Semmler, T.; Danilov, S.; Rackow, T.; Sidorenko, D.; Barbi, D.; Hegewald, J.; Sein, D.; Wang, Q.; Jung, T. AWI AWI-CM1.1MR Model Output Prepared for CMIP6 CMIP Historical; Earth System Grid Federation: Greenbelt, MD, USA, 2018. [CrossRef]
  66. Wu, T.; Chu, M.; Dong, M.; Fang, Y.; Jie, W.; Li, J.; Li, W.; Liu, Q.; Shi, X.; Xin, X.; et al. BCC BCC-CSM2MR Model Output Prepared for CMIP6 CMIP Historical; Earth System Grid Federation: Greenbelt, MD, USA, 2018. [CrossRef]
  67. Chai, Z. CAS CAS-ESM1.0 Model Output Prepared for CMIP6 CMIP Historical; Earth System Grid Federation: Greenbelt, MD, USA, 2020. [CrossRef]
  68. Danabasoglu, G. NCAR CESM2 Model Output Prepared for CMIP6 CMIP Historical; Earth System Grid Federation: Greenbelt, MD, USA, 2019. [CrossRef]
  69. Danabasoglu, G. NCAR CESM2-FV2 Model Output Prepared for CMIP6 CMIP Historical; Earth System Grid Federation: Greenbelt, MD, USA, 2019. [CrossRef]
  70. Danabasoglu, G. NCAR CESM2-WACCM Model Output Prepared for CMIP6 CMIP Historical; Earth System Grid Federation: Greenbelt, MD, USA, 2019. [CrossRef]
  71. Lovato, T.; Peano, D. CMCC CMCC-CM2-SR5 Model Output Prepared for CMIP6 CMIP Historical; Earth System Grid Federation: Greenbelt, MD, USA, 2020. [CrossRef]
  72. Lovato, T.; Peano, D.; Butenschön, M. CMCC CMCC-ESM2 Model Output Prepared for CMIP6 CMIP Historical; Earth System Grid Federation: Greenbelt, MD, USA, 2021. [CrossRef]
  73. Song, Z.; Qiao, F.; Bao, Y.; Shu, Q.; Song, Y.; Yang, X. FIO-QLNM FIO-ESM2.0 Model Output Prepared for CMIP6 CMIP Historical; Earth System Grid Federation: Greenbelt, MD, USA, 2019. [CrossRef]
  74. Ridley, J.; Menary, M.; Kuhlbrodt, T.; Andrews, M.; Andrews, T. MOHC HadGEM3-GC31-MM Model Output Prepared for CMIP6 CMIP Historical; Earth System Grid Federation: Greenbelt, MD, USA, 2019. [CrossRef]
  75. Jungclaus, J.; Bittner, M.; Wieners, K.-H.; Wachsmann, F.; Schupfner, M.; Legutke, S.; Giorgetta, M.; Reick, C.; Gayler, V.; Haak, H.; et al. MPI-M MPI-ESM1.2-HR Model Output Prepared for CMIP6 CMIP Historical; Earth System Grid Federation: Greenbelt, MD, USA, 2019. [CrossRef]
  76. Yukimoto, S.; Koshiro, T.; Kawai, H.; Oshima, N.; Yoshida, K.; Urakawa, S.; Tsujino, H.; Deushi, M.; Tanaka, T.; Hosaka, M.; et al. MRI MRI-ESM2.0 Model Output Prepared for CMIP6 CMIP Historical; Earth System Grid Federation: Greenbelt, MD, USA, 2019. [CrossRef]
  77. Bentsen, M.; Oliviè, D.J.L.; Seland, Ø.; Toniazzo, T.; Gjermundsen, A.; Graff, L.S.; Debernard, J.B.; Gupta, A.K.; He, Y.; Kirkevåg, A.; et al. NCC NorESM2-MM Model Output Prepared for CMIP6 CMIP Historical; Earth System Grid Federation: Greenbelt, MD, USA, 2019. [CrossRef]
  78. Lee, W.-L.; Liang, H.-C. AS-RCEC TaiESM1.0 Model Output Prepared for CMIP6 CMIP Historical; Earth System Grid Federation: Greenbelt, MD, USA, 2020. [CrossRef]
  79. Cleveland, R.B.; Cleveland, W.S.; McRae, J.E.; Terpenning, I. STL: A seasonal-trend decomposition. J. off. Stat. 1990, 6, 3–73. [Google Scholar]
  80. Hou, Q.; Ji, Z.; Yang, H.; Yu, X. Impacts of climate change and human activities on different degraded grassland based on NDVI. Sci. Rep. 2022, 12, 15918. [Google Scholar] [CrossRef] [PubMed]
  81. Kendall, M.G. Rank Correlation Methods. 1948. Available online: https://psycnet.apa.org/record/1948-15040-000 (accessed on 24 October 2024).
  82. Mann, H.B. Nonparametric tests against trend. Econom. J. Econom. Soc. 1945, 13, 245–259. [Google Scholar] [CrossRef]
  83. Mehmood, T.; Liland, K.H.; Snipen, L.; Sæbø, S. A review of variable selection methods in partial least squares regression. Chemom. Intell. Lab. Syst. 2012, 118, 62–69. [Google Scholar] [CrossRef]
  84. Yin, S. Exploring the relationships between ground-measured particulate matter and satellite-retrieved aerosol parameters in China. Environ. Sci. Pollut. Res. 2022, 29, 44348–44363. [Google Scholar] [CrossRef]
  85. Mkhabela, M.S.; Bullock, P.R.; Sapirstein, H.D. Characterising the most critical climatic parameters that impact the quality of spring-wheat (Triticum aestivum L.) on the Canadian Prairies using partial least squares (PLS) analysis. J. Cereal Sci. 2018, 81, 44–51. [Google Scholar] [CrossRef]
  86. Guo, M.; Yao, Q.C.; Suo, H.Q.; Xu, X.X.; Li, J.; He, H.S.; Yin, S.; Li, J.N. The importance degree of weather elements in driving wildfire occurrence in mainland China. Ecol. Indic. 2023, 148, 110152. [Google Scholar] [CrossRef]
  87. Sabziparvar, A.; Khoshhal Jahromi, F. Evaluating the most effective climatic parameters affecting the monthly mean soil temperature estimates using the PLS method. Arabian J. Geosci. 2022, 15, 1044. [Google Scholar] [CrossRef]
  88. Farrés, M.; Platikanov, S.; Tsakovski, S.; Tauler, R. Comparison of the variable importance in projection (VIP) and of the selectivity ratio (SR) methods for variable selection and interpretation. J. Chemom. 2015, 29, 528–536. [Google Scholar] [CrossRef]
  89. Wold, S. PLS for multivariate linear modeling. In Chemometric Methods in Molecular Design; Weily-VCH: Hoboken, NJ, USA, 1995; pp. 195–218. [Google Scholar]
  90. Fushiki, T. Estimation of prediction error by using K-fold cross-validation. Stat. Comput. 2011, 21, 137–146. [Google Scholar] [CrossRef]
  91. Gong, H.; Cao, L.; Duan, Y.; Jiao, F.; Xu, X.; Zhang, M.; Wang, K.; Liu, H. Multiple effects of climate changes and human activities on NPP increase in the Three-north Shelter Forest Program area. For. Ecol. Manag. 2023, 529, 120732. [Google Scholar] [CrossRef]
  92. Zhang, Y.; Yang, Z.; Liu, F.; Xu, M.; Zhang, J. Impact of the Project of Returning Farmland to Forest on Promoting Forest Coverage Rates in Mountainous Areas: An Empirical Analysis Based on Remote Sensing in Yunnan. Forests 2024, 15, 1956. [Google Scholar] [CrossRef]
  93. Guerra, T.N.; Araújo, E.L.; Sampaio, E.V.; Ferraz, E.M. Urban or rural areas: Which types of surrounding land use induce stronger edge effects on the functional traits of tropical forests plants? Appl. Veg. Sci. 2017, 20, 538–548. [Google Scholar] [CrossRef]
  94. Liu, W.; Zhang, H.; Lü, X.t.; Zhou, Y.; Yang, Y.; Lü, Y.; Yang, J.; Wen, L.; Pan, Q.; Han, X. Dynamics and drivers of primary productivity along a 40-year grazing exclusion chronosequence in a typical steppe of Inner Mongolia. Restor. Ecol. 2025, 33, e14377. [Google Scholar] [CrossRef]
  95. Marklein, A.; Elias, E.; Nico, P.; Steenwerth, K. Projected temperature increases may require shifts in the growing season of cool-season crops and the growing locations of warm-season crops. Sci. Total Environ. 2020, 746, 140918. [Google Scholar] [CrossRef]
  96. Yang, H.; Zhong, C.H.; Jin, T.Y.; Chen, J.H.; Zhang, Z.J.; Hu, Z.M.; Wu, K. Stronger Impact of Extreme Heat Event on Vegetation Temperature Sensitivity under Future Scenarios with High-Emission Intensity. Remote Sens. 2024, 16, 3708. [Google Scholar] [CrossRef]
  97. Lee, Y.-H.; Sang, W.-G.; Baek, J.-K.; Kim, J.-H.; Shin, P.; Seo, M.-C.; Cho, J.-I. The effect of concurrent elevation in CO2 and temperature on the growth, photosynthesis, and yield of potato crops. PLoS ONE 2020, 15, e0241081. [Google Scholar] [CrossRef]
  98. Dakos, V.; Matthews, B.; Hendry, A.P.; Levine, J.; Loeuille, N.; Norberg, J.; Nosil, P.; Scheffer, M.; De Meester, L. Ecosystem tipping points in an evolving world. Nat. Ecol. Evol. 2019, 3, 355–362. [Google Scholar] [CrossRef]
  99. Suz, L.M.; Bidartondo, M.I.; van der Linde, S.; Kuyper, T.W. Ectomycorrhizas and tipping points in forest ecosystems. New Phytol. 2021, 231, 1700–1707. [Google Scholar] [CrossRef] [PubMed]
  100. Moore, J.C. Predicting tipping points in complex environmental systems. Proc. Natl. Acad. Sci. USA 2018, 115, 635–636. [Google Scholar] [CrossRef] [PubMed]
  101. Nguyen, K.A.; Seeboonruang, U.; Chen, W. Projected Climate Change Effects on Global Vegetation Growth: A Machine Learning Approach. Environments 2023, 10, 204. [Google Scholar] [CrossRef]
  102. Cai, S.H.; Song, X.N.; Hu, R.H.; Guo, D. Ecosystem-Dependent Responses of Vegetation Coverage on the Tibetan Plateau to Climate Factors and Their Lag Periods. ISPRS Int. J. Geo-Inf. 2021, 10, 394. [Google Scholar] [CrossRef]
  103. Hua, L.; Wang, H.D.; Sui, H.G.; Wardlow, B.; Hayes, M.J.; Wang, J.X. Mapping the Spatial-Temporal Dynamics of Vegetation Response Lag to Drought in a Semi-Arid Region. Remote Sens. 2019, 11, 1873. [Google Scholar] [CrossRef]
  104. Liu, N.; Ding, Y.X.; Peng, S.Z. Temporal effects of climate on vegetation trigger the response biases of vegetation to human activities. Global Ecol. Conserv. 2021, 31, e01822. [Google Scholar] [CrossRef]
  105. WMO. WMO Guidelines on the Calculation of Climate Normals; WMO: Geneva, Switzerland, 2017. [Google Scholar]
Figure 1. Spatial distribution of significant NDVI change trends in China from 2001 to 2023: significant decrease (slope ≤ −0.003/year, |Z| > 1.96), slight decrease (−0.003/year < slope ≤ −0.00005/year, |Z| > 1.96), stable (−0.00005/year < slope < 0.00005/year, |Z| > 1.96), significant increase (0.003/year ≤ slope, |Z| > 1.96), slight increase (0.00005/year ≤ slope < 0.003/year, |Z| > 1.96).
Atmosphere 16 00738 g001
Figure 2. NDVI changes in China from 2001 to 2023. Analysis of seasonal fluctuations, long-term trends, and residual components using the STL method: panels (ad) represent the original data, seasonal component, trend component, and residual component, respectively.
Atmosphere 16 00738 g002
Figure 3. Seasonal and annual NDVI trends for various vegetation types in China from 2001 to 2023: panels (ad) show the trends for spring, summer, autumn, and winter, respectively; panel (e) illustrates the comprehensive annual changes.
Atmosphere 16 00738 g003
Figure 4. VIP scores of NDVI changes influenced by different meteorological factors in China from 2001 to 2023: figures (af) represent the VIP scores of RH, SWR, SWVL1, T2m, TP, and CO2, respectively, on NDVI changes.
Atmosphere 16 00738 g004
Figure 5. Spatial distribution of predicted NDVI values in China under four SSP scenarios: panels (ad) correspond to the NDVI of China in 2100 under the SSP126, SSP245, SSP370, and SSP585 scenarios, respectively.
Atmosphere 16 00738 g005
Figure 6. Spatial distribution of NDVI changes in China from 2023 to 2100 under four SSP scenarios: panels (ad) represent the NDVI of China in 2100 under the SSP126, SSP245, SSP370, and SSP585 scenarios, respectively.
Atmosphere 16 00738 g006
Figure 7. Trends in NDVI changes and the contributions of meteorological factors in China from 2023 to 2100: panels (ad) illustrate the temporal evolution of NDVI trends and the relative influence of each meteorological factor under the SSP126, SSP245, SSP370, and SSP585 scenarios, respectively.
Atmosphere 16 00738 g007
Figure 8. Spatial distribution of changes in various meteorological factors and NDVI in China under the SSP585 scenario from 2023 to 2100: panels (af) show the spatial distribution of changes in SWVL1, RH, TP, SWR, T2m, and NDVI, respectively.
Atmosphere 16 00738 g008
Table 1. Basic information of CMIP6 models and the assigned weights.
IDModel NameCountryResolutionWeights
1AWI-CM-1-1-MR [65]Germany~0.9375° × 0.9375° (~90 km)0.0928
2BCC-CSM2-MR [66]China~1.125° × 1.125° (~106.9 km)0.0427
3CAS-ESM2-0 [67]China~1.4° × 1.4° (~132.9 km)0.0808
4CESM2 [68]USA~0.9375° × 1.25° (~101.4 km)0.0697
5CESM2-FV2 [69]USA~0.9° × 1.25° (~99.3 km)0.0900
6CESM2-WACCM [70]USA~0.938° × 1.25° (~101.4 km)0.0912
7CMCC-CM2-SR5 [71]Italy~0.938° × 1.25° (~101.4 km)0.0779
8CMCC-ESM2 [72]Italy~0.938° × 1.25° (~101.4 km)0.0788
9FIO-ESM-2-0 [73]China~0.938° × 1.25° (~101.4 km)0.0865
10HadGEM3-GC31-MM [74]UK~0.556° × 0.833° (~70.1 km)0.0418
11MPI-ESM1-2-HR [75]Germany~0.938° × 0.938° (~90 km)0.0361
12MRI-ESM2-0 [76]Japan~1.125° × 1.125° (~106.9 km)0.0914
13NorESM2-MM [77]Norway~0.938° × 1.25° (~101.4 km)0.0353
14TaiESM1 [78]China, Taiwan~0.938° × 1.25° (~101.4 km)0.0850
Disclaimer/Publisher’s Note: The statements, opinions and data contained in all publications are solely those of the individual author(s) and contributor(s) and not of MDPI and/or the editor(s). MDPI and/or the editor(s) disclaim responsibility for any injury to people or property resulting from any ideas, methods, instructions or products referred to in the content.

