
Trends in Annual, Seasonal, and Daily Temperature and Its Relation to Climate Change in Puerto Rico

 , ,
, ,
Abstract
1. Introduction
2. Data and Methods
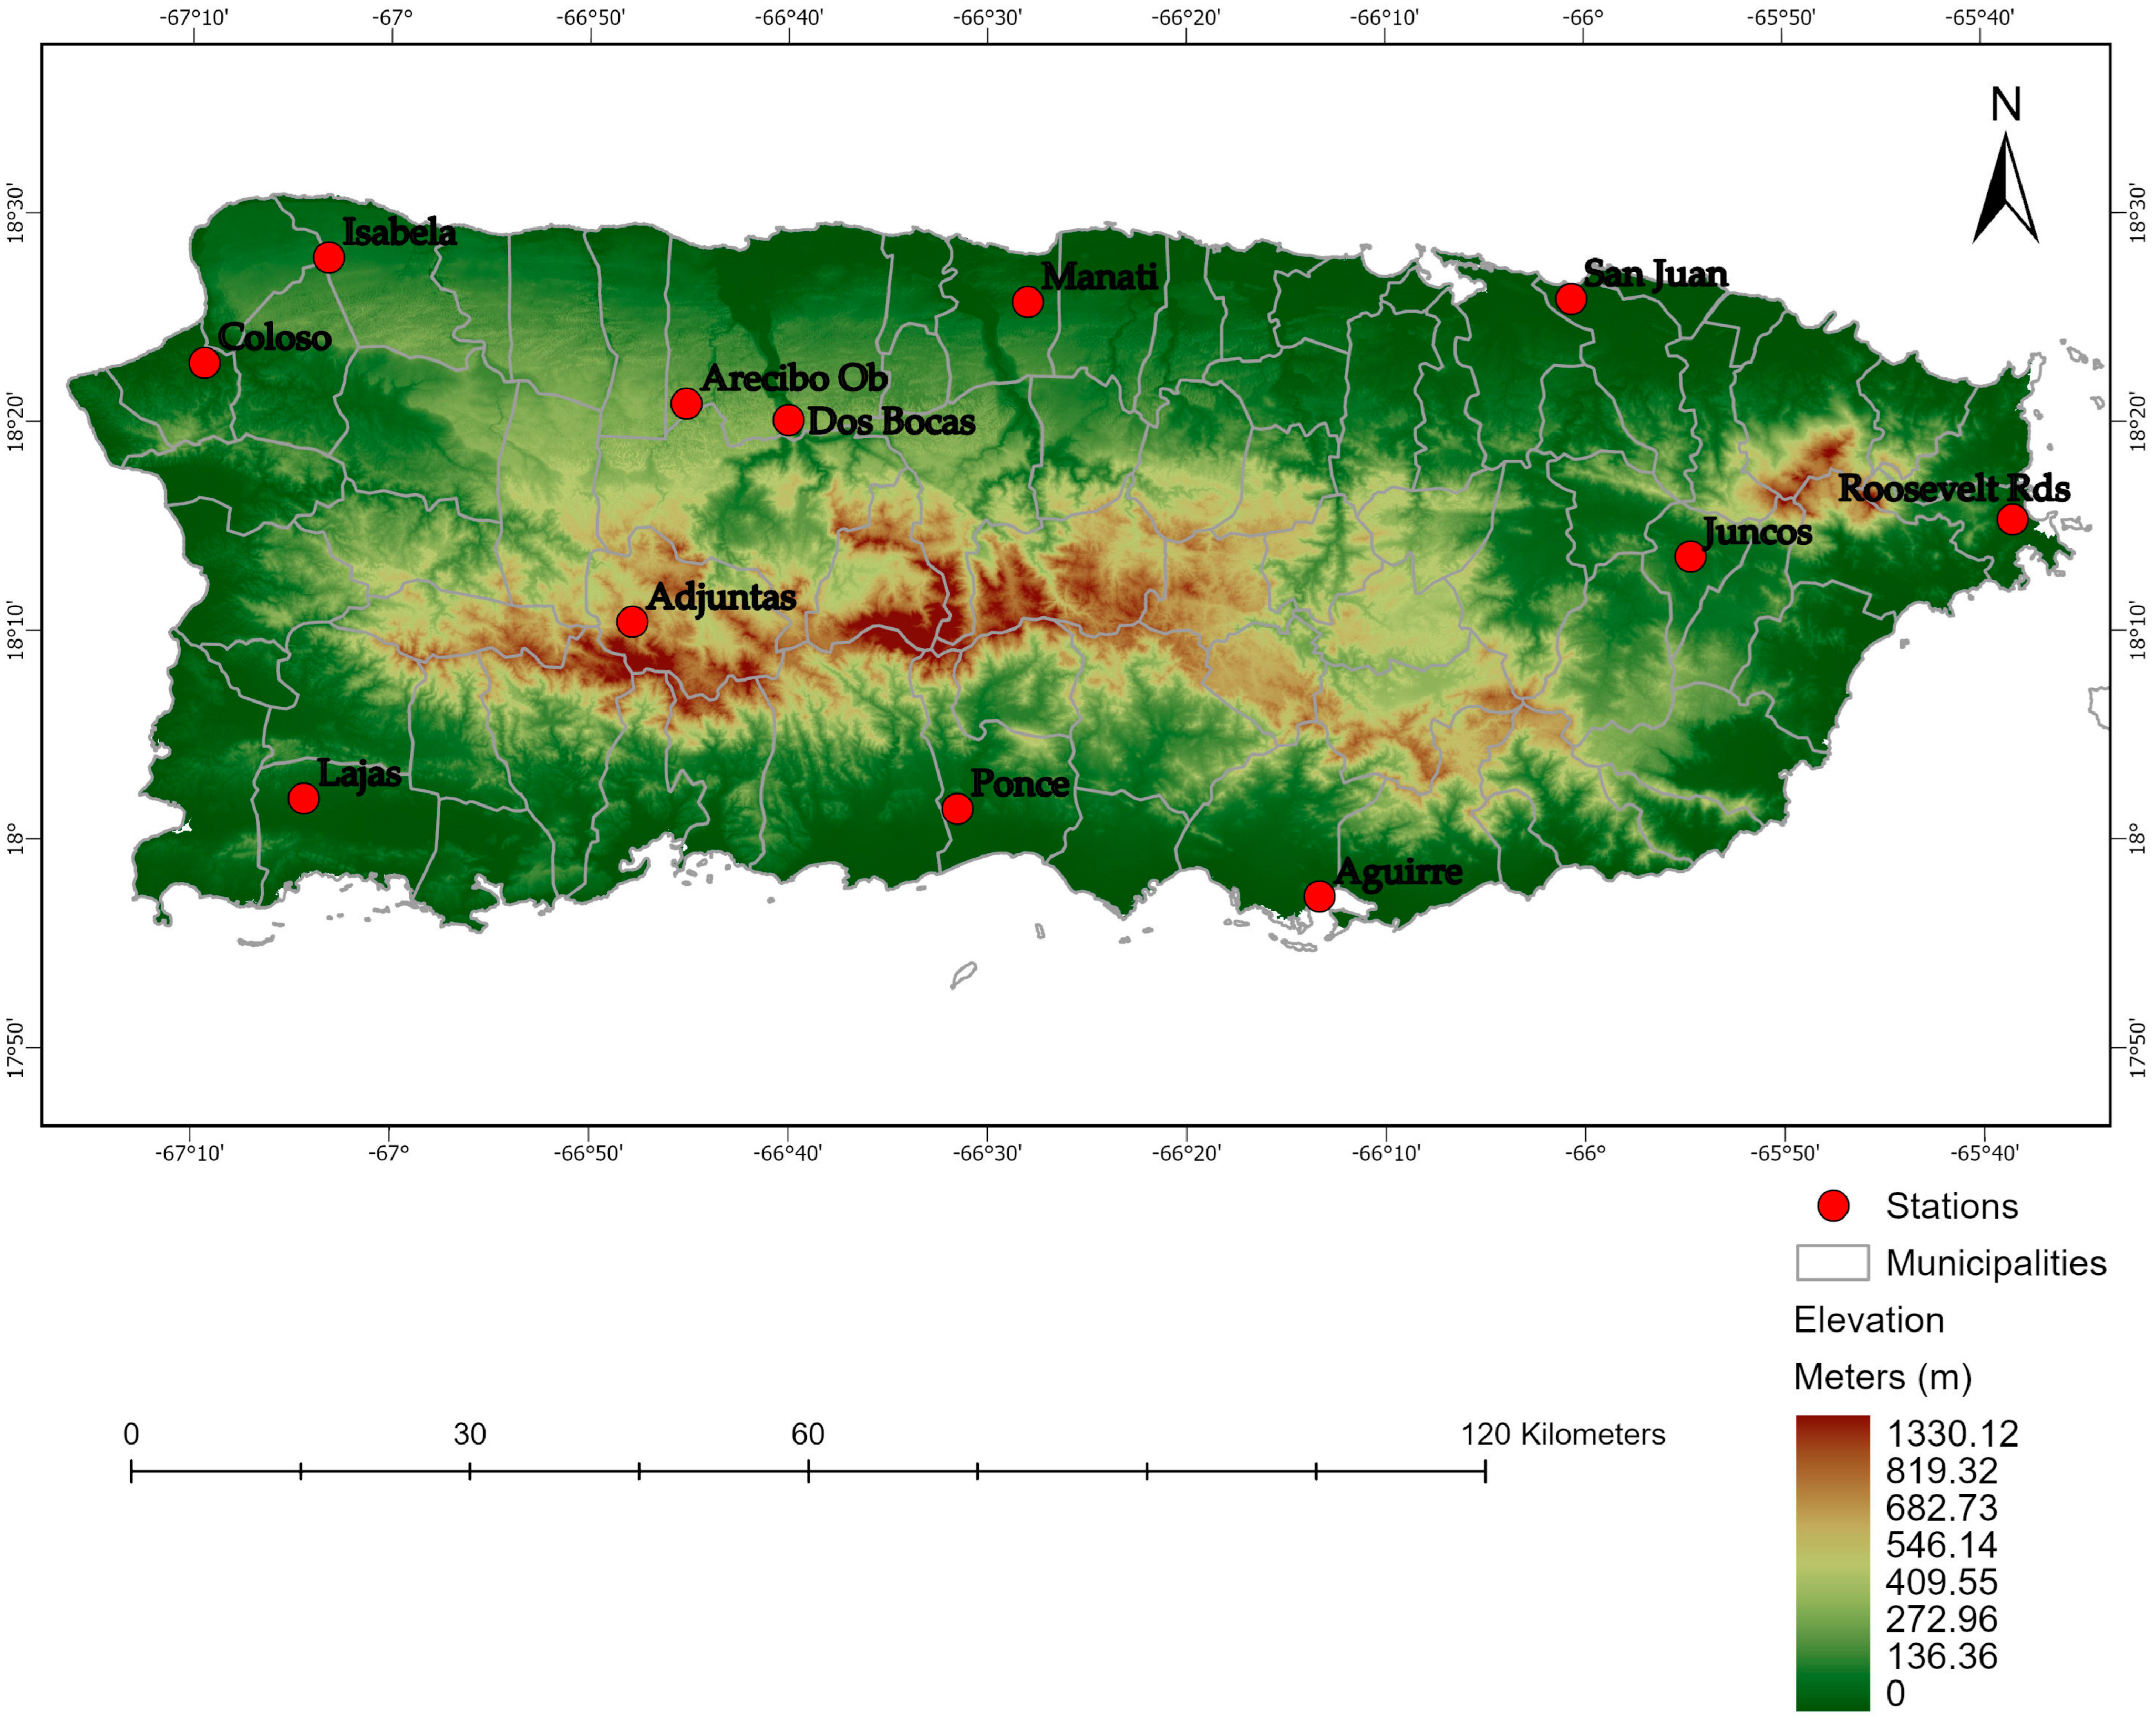
2.1. Data Sources and Processing
2.2. Trend Analysis Using the Mann–Kendall Test
2.3. Analysis of Daily Extreme Temperatures
2.4. Trend Detection in Extreme Temperature Frequencies
2.5. Forward Stepwise Regression Procedures
3. Results & Discussion
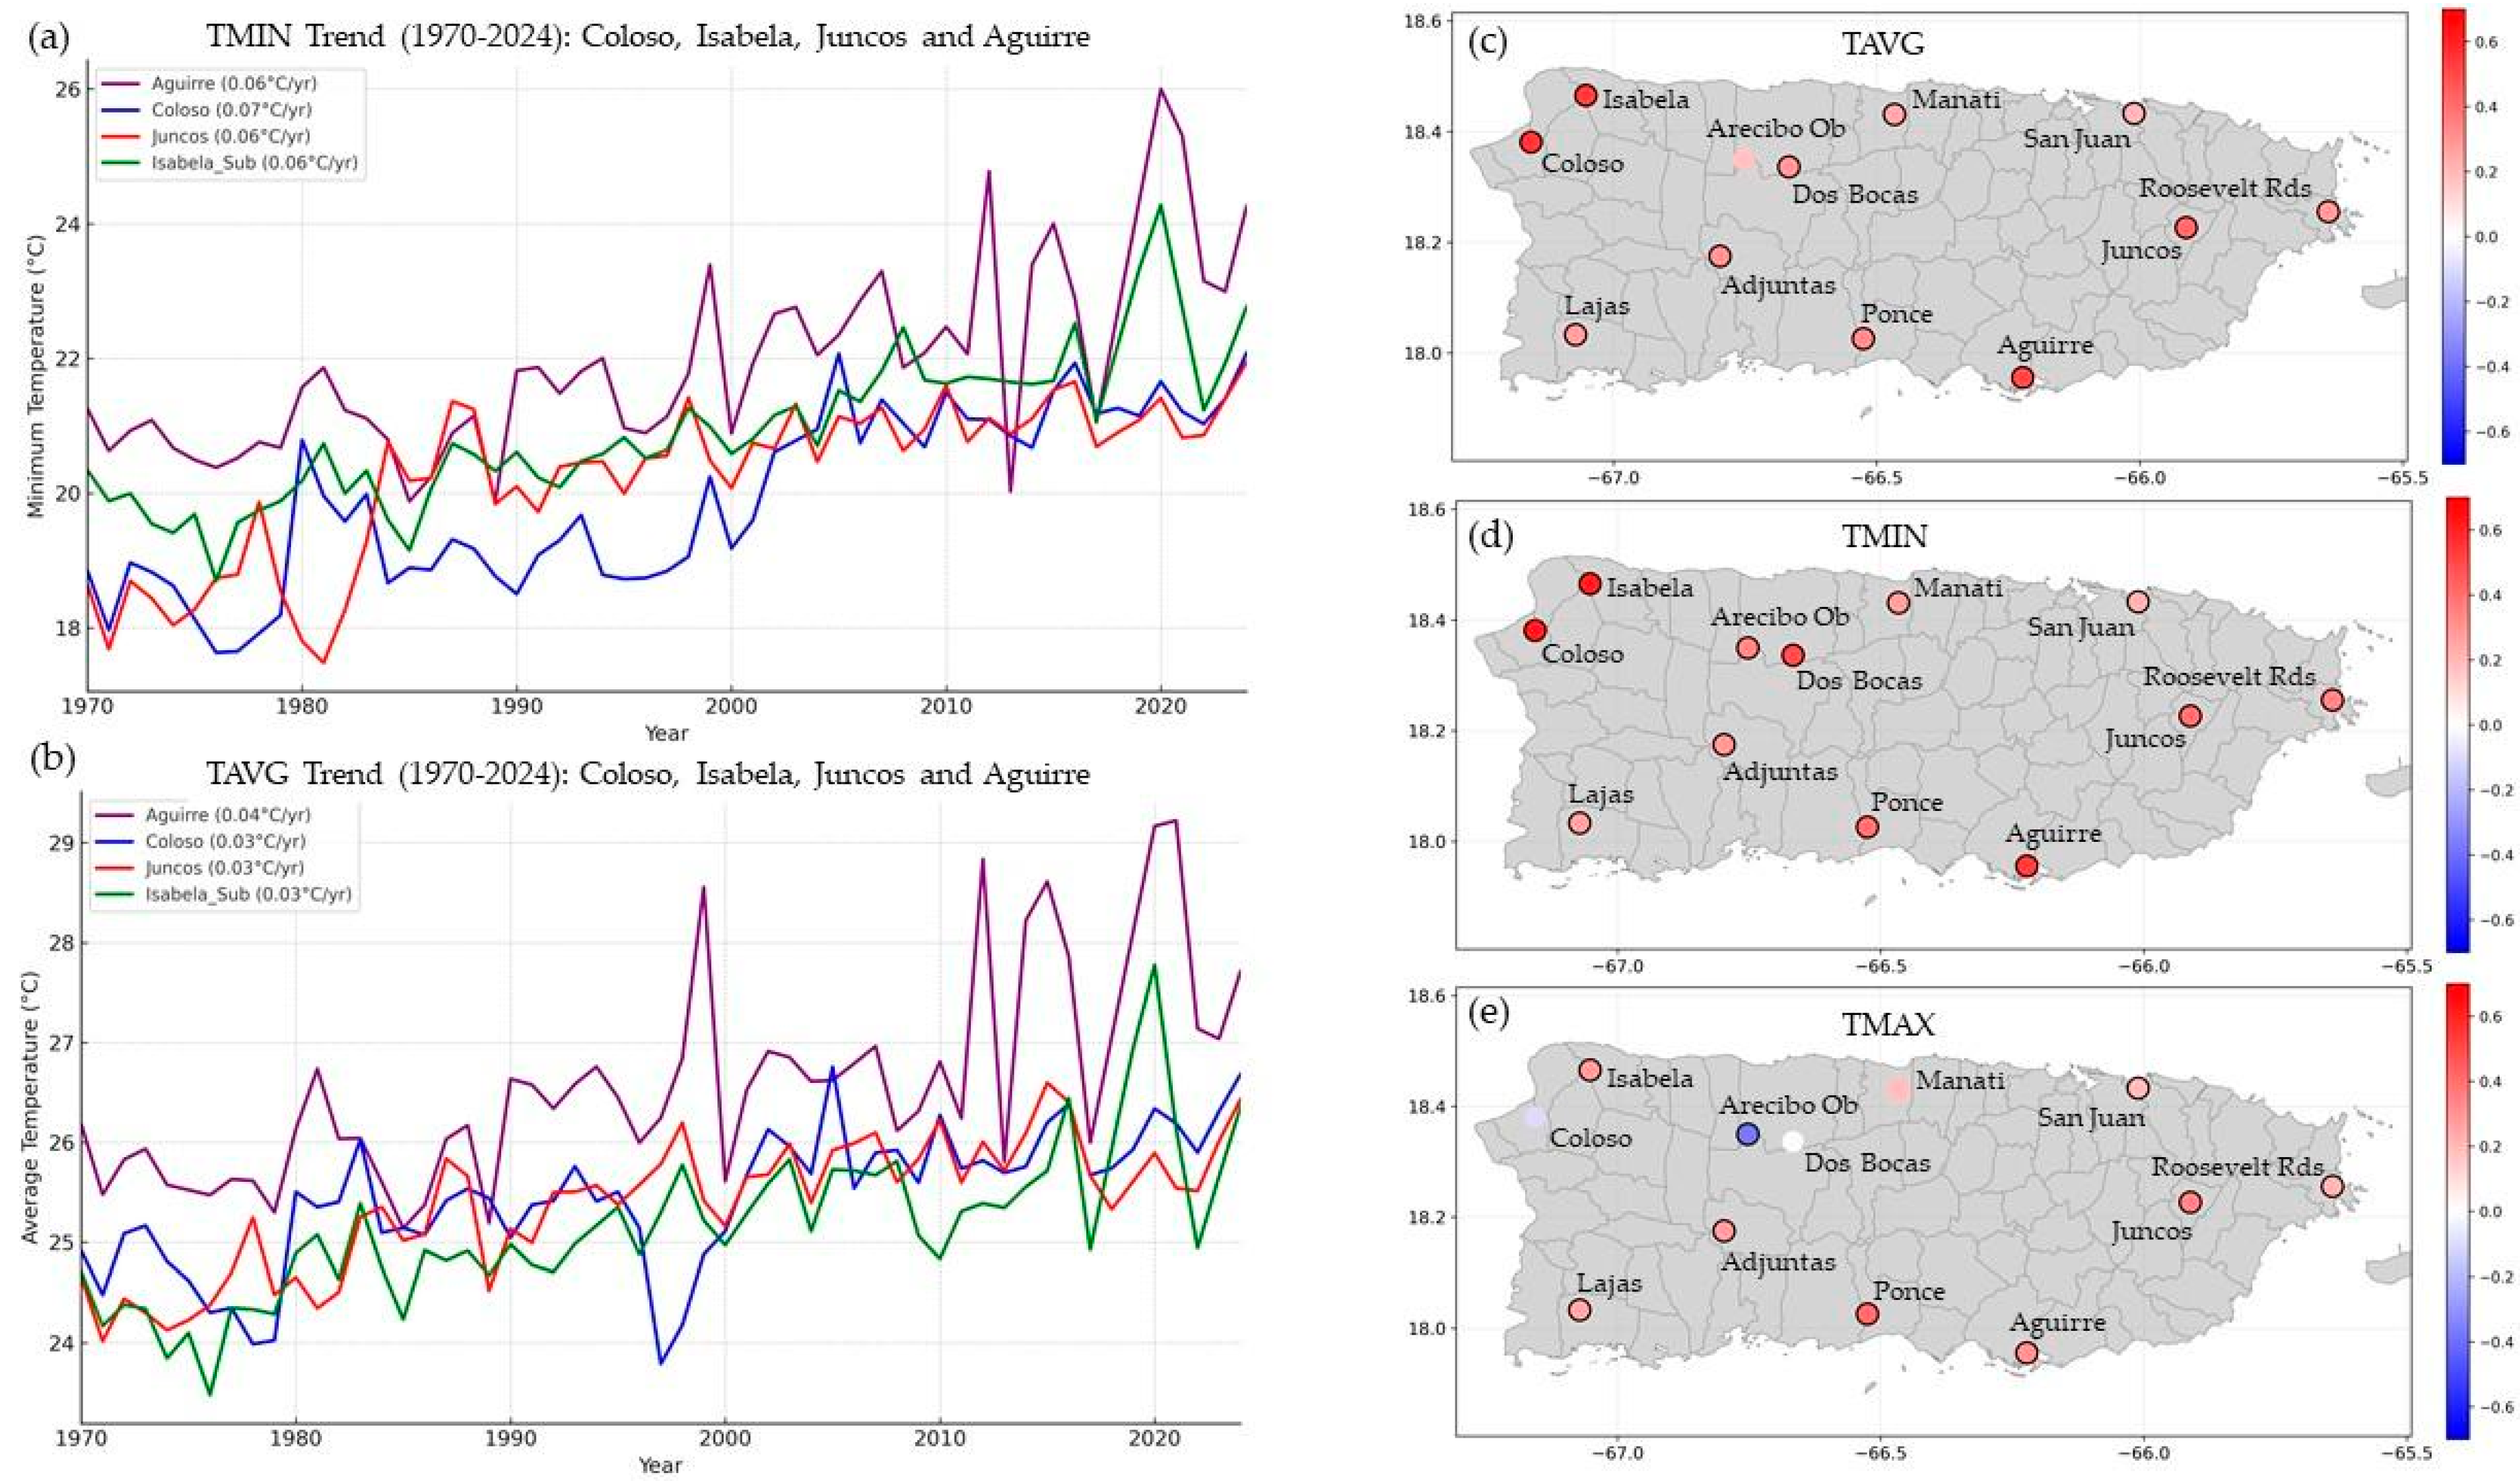
3.1. Annual Temperature Trends
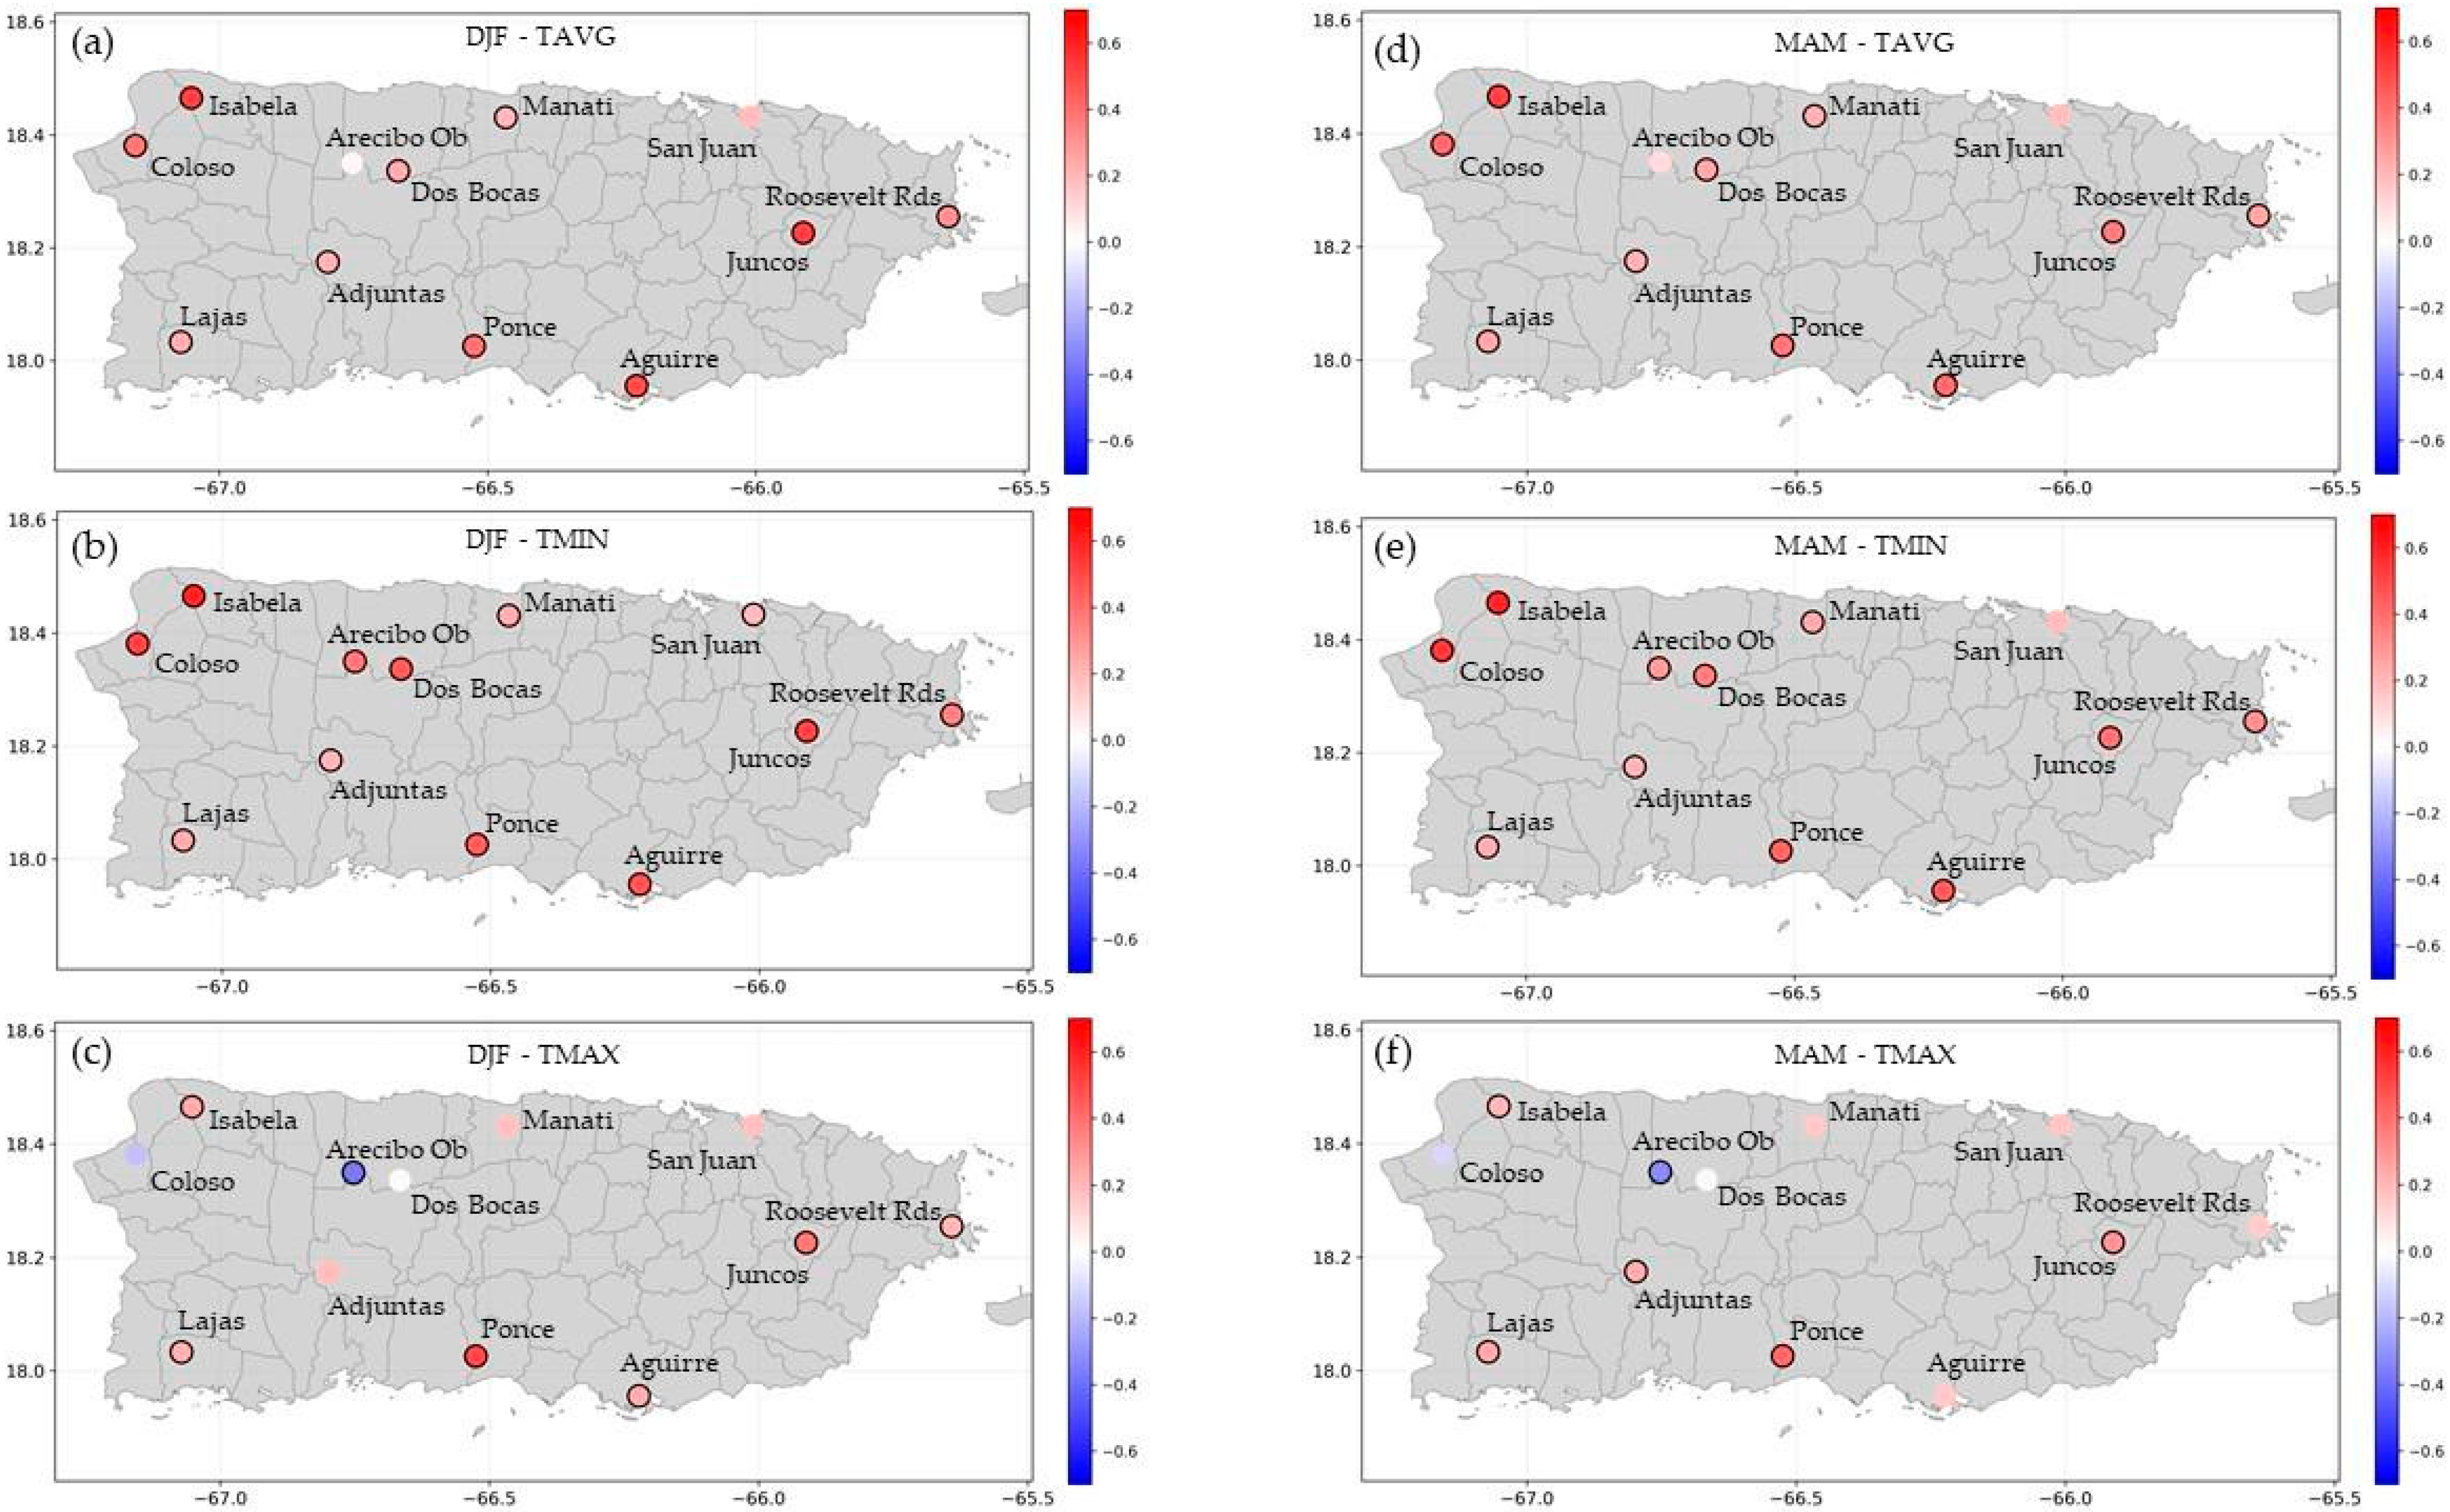
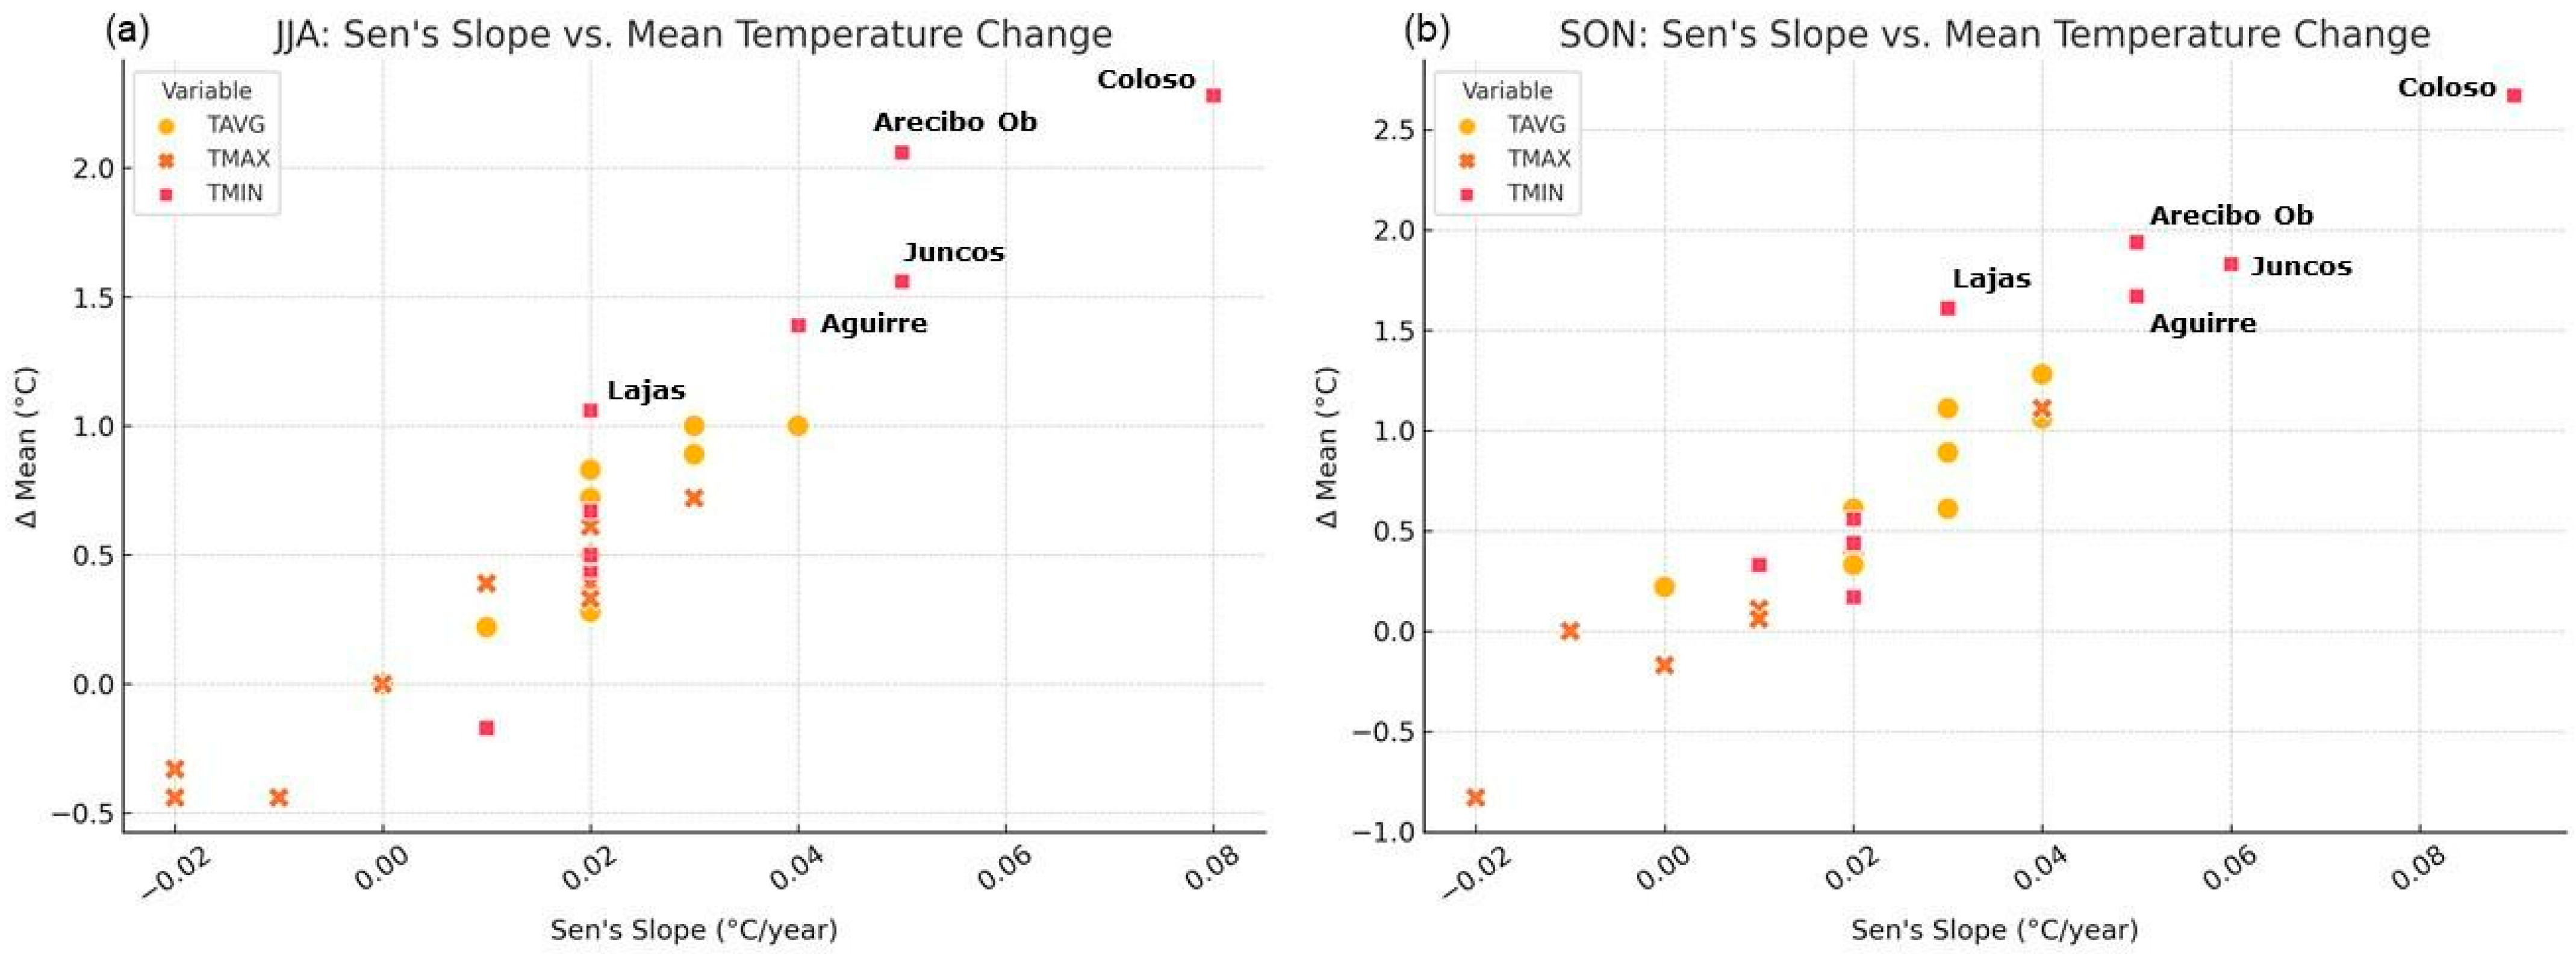
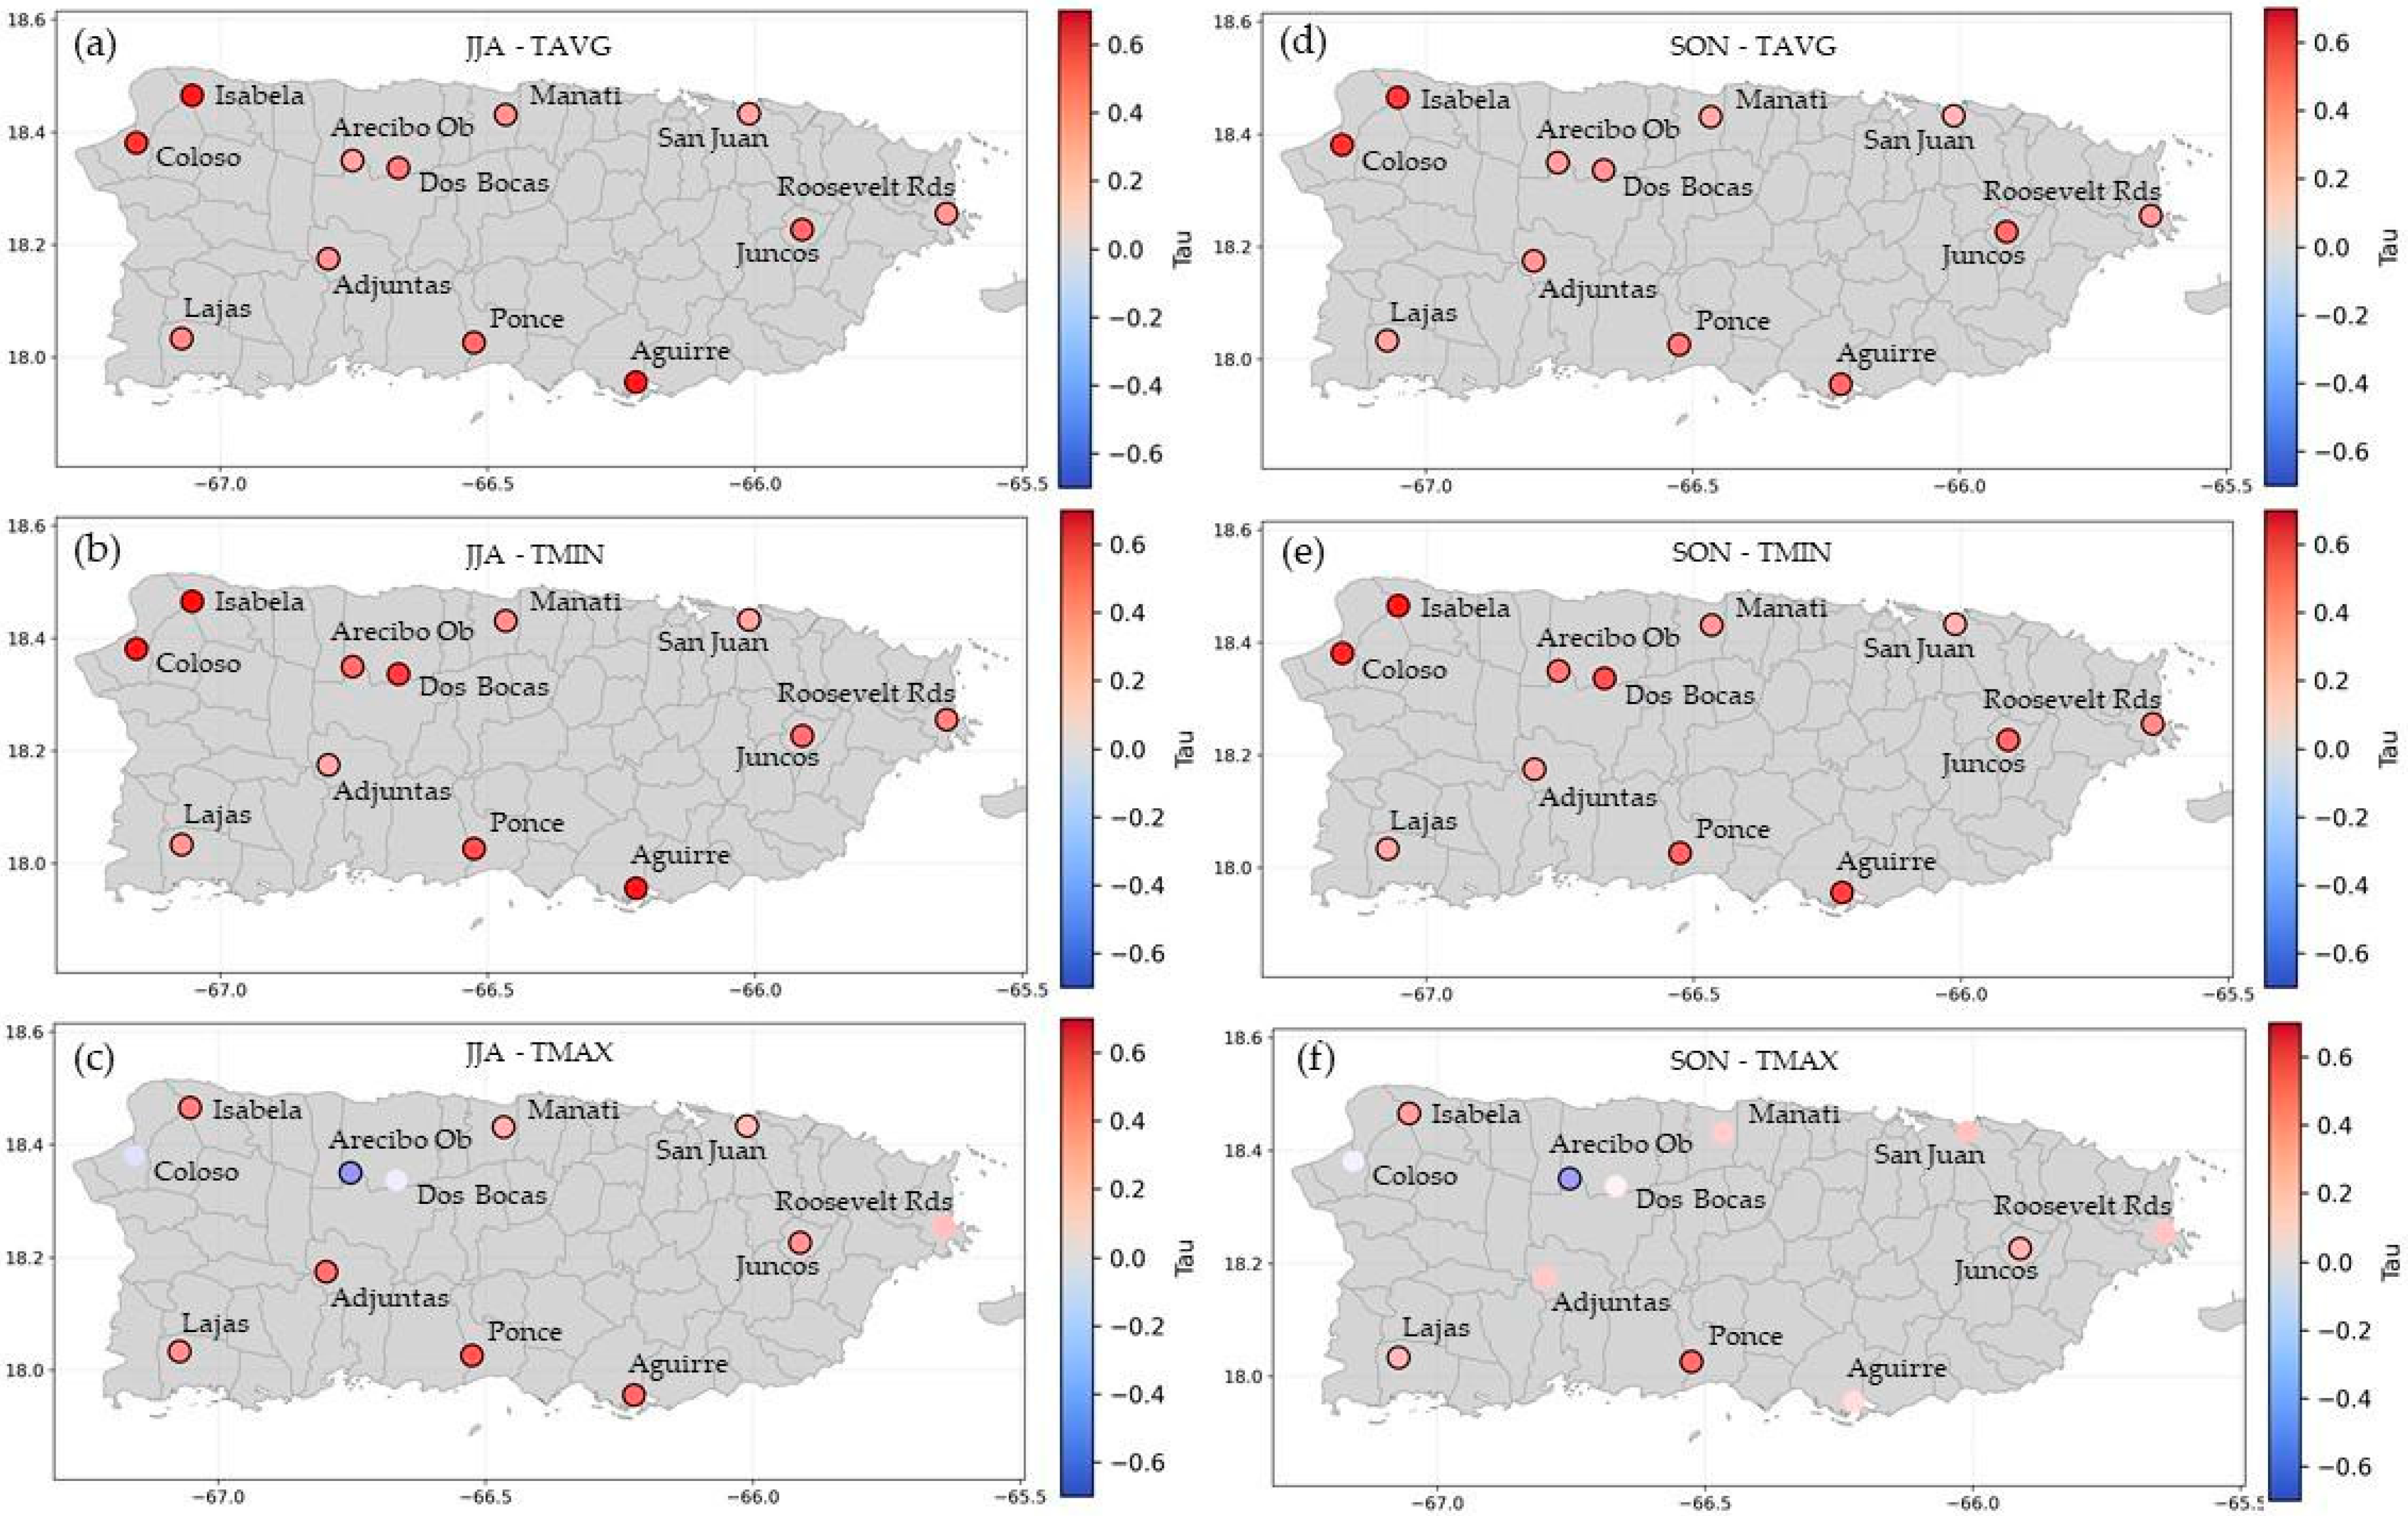
3.2. Seasonal Temperature Trends
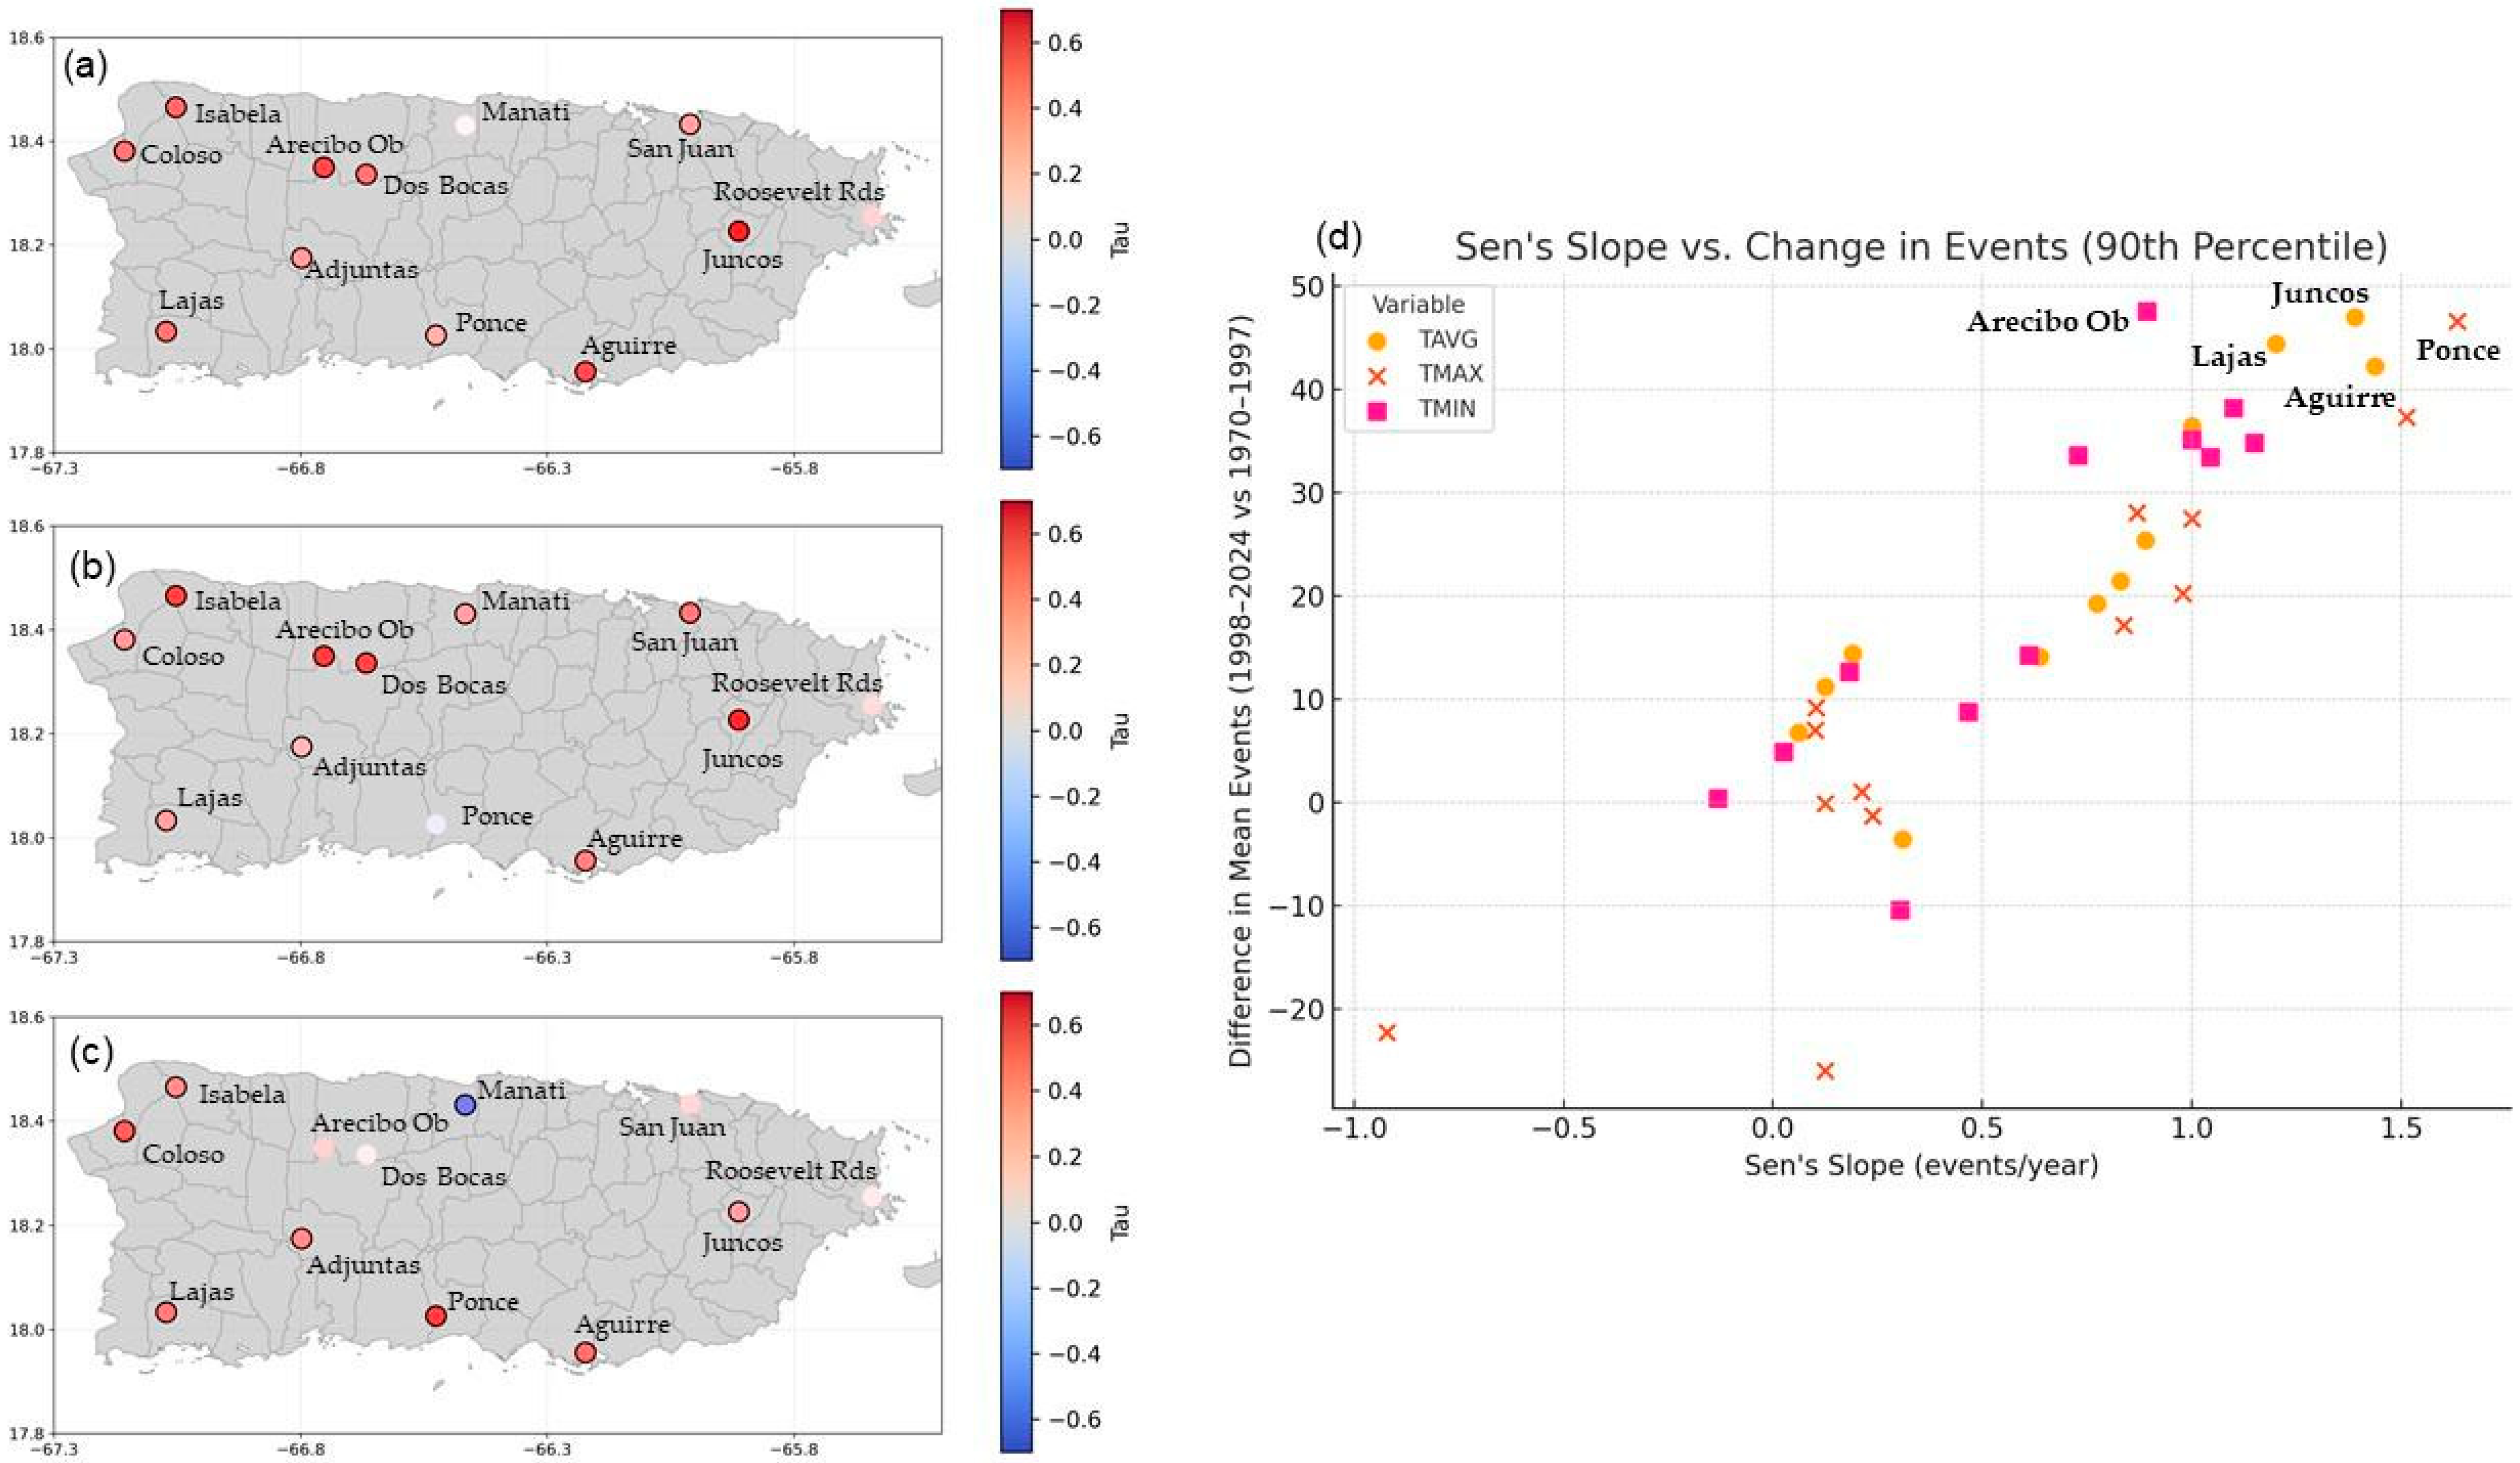
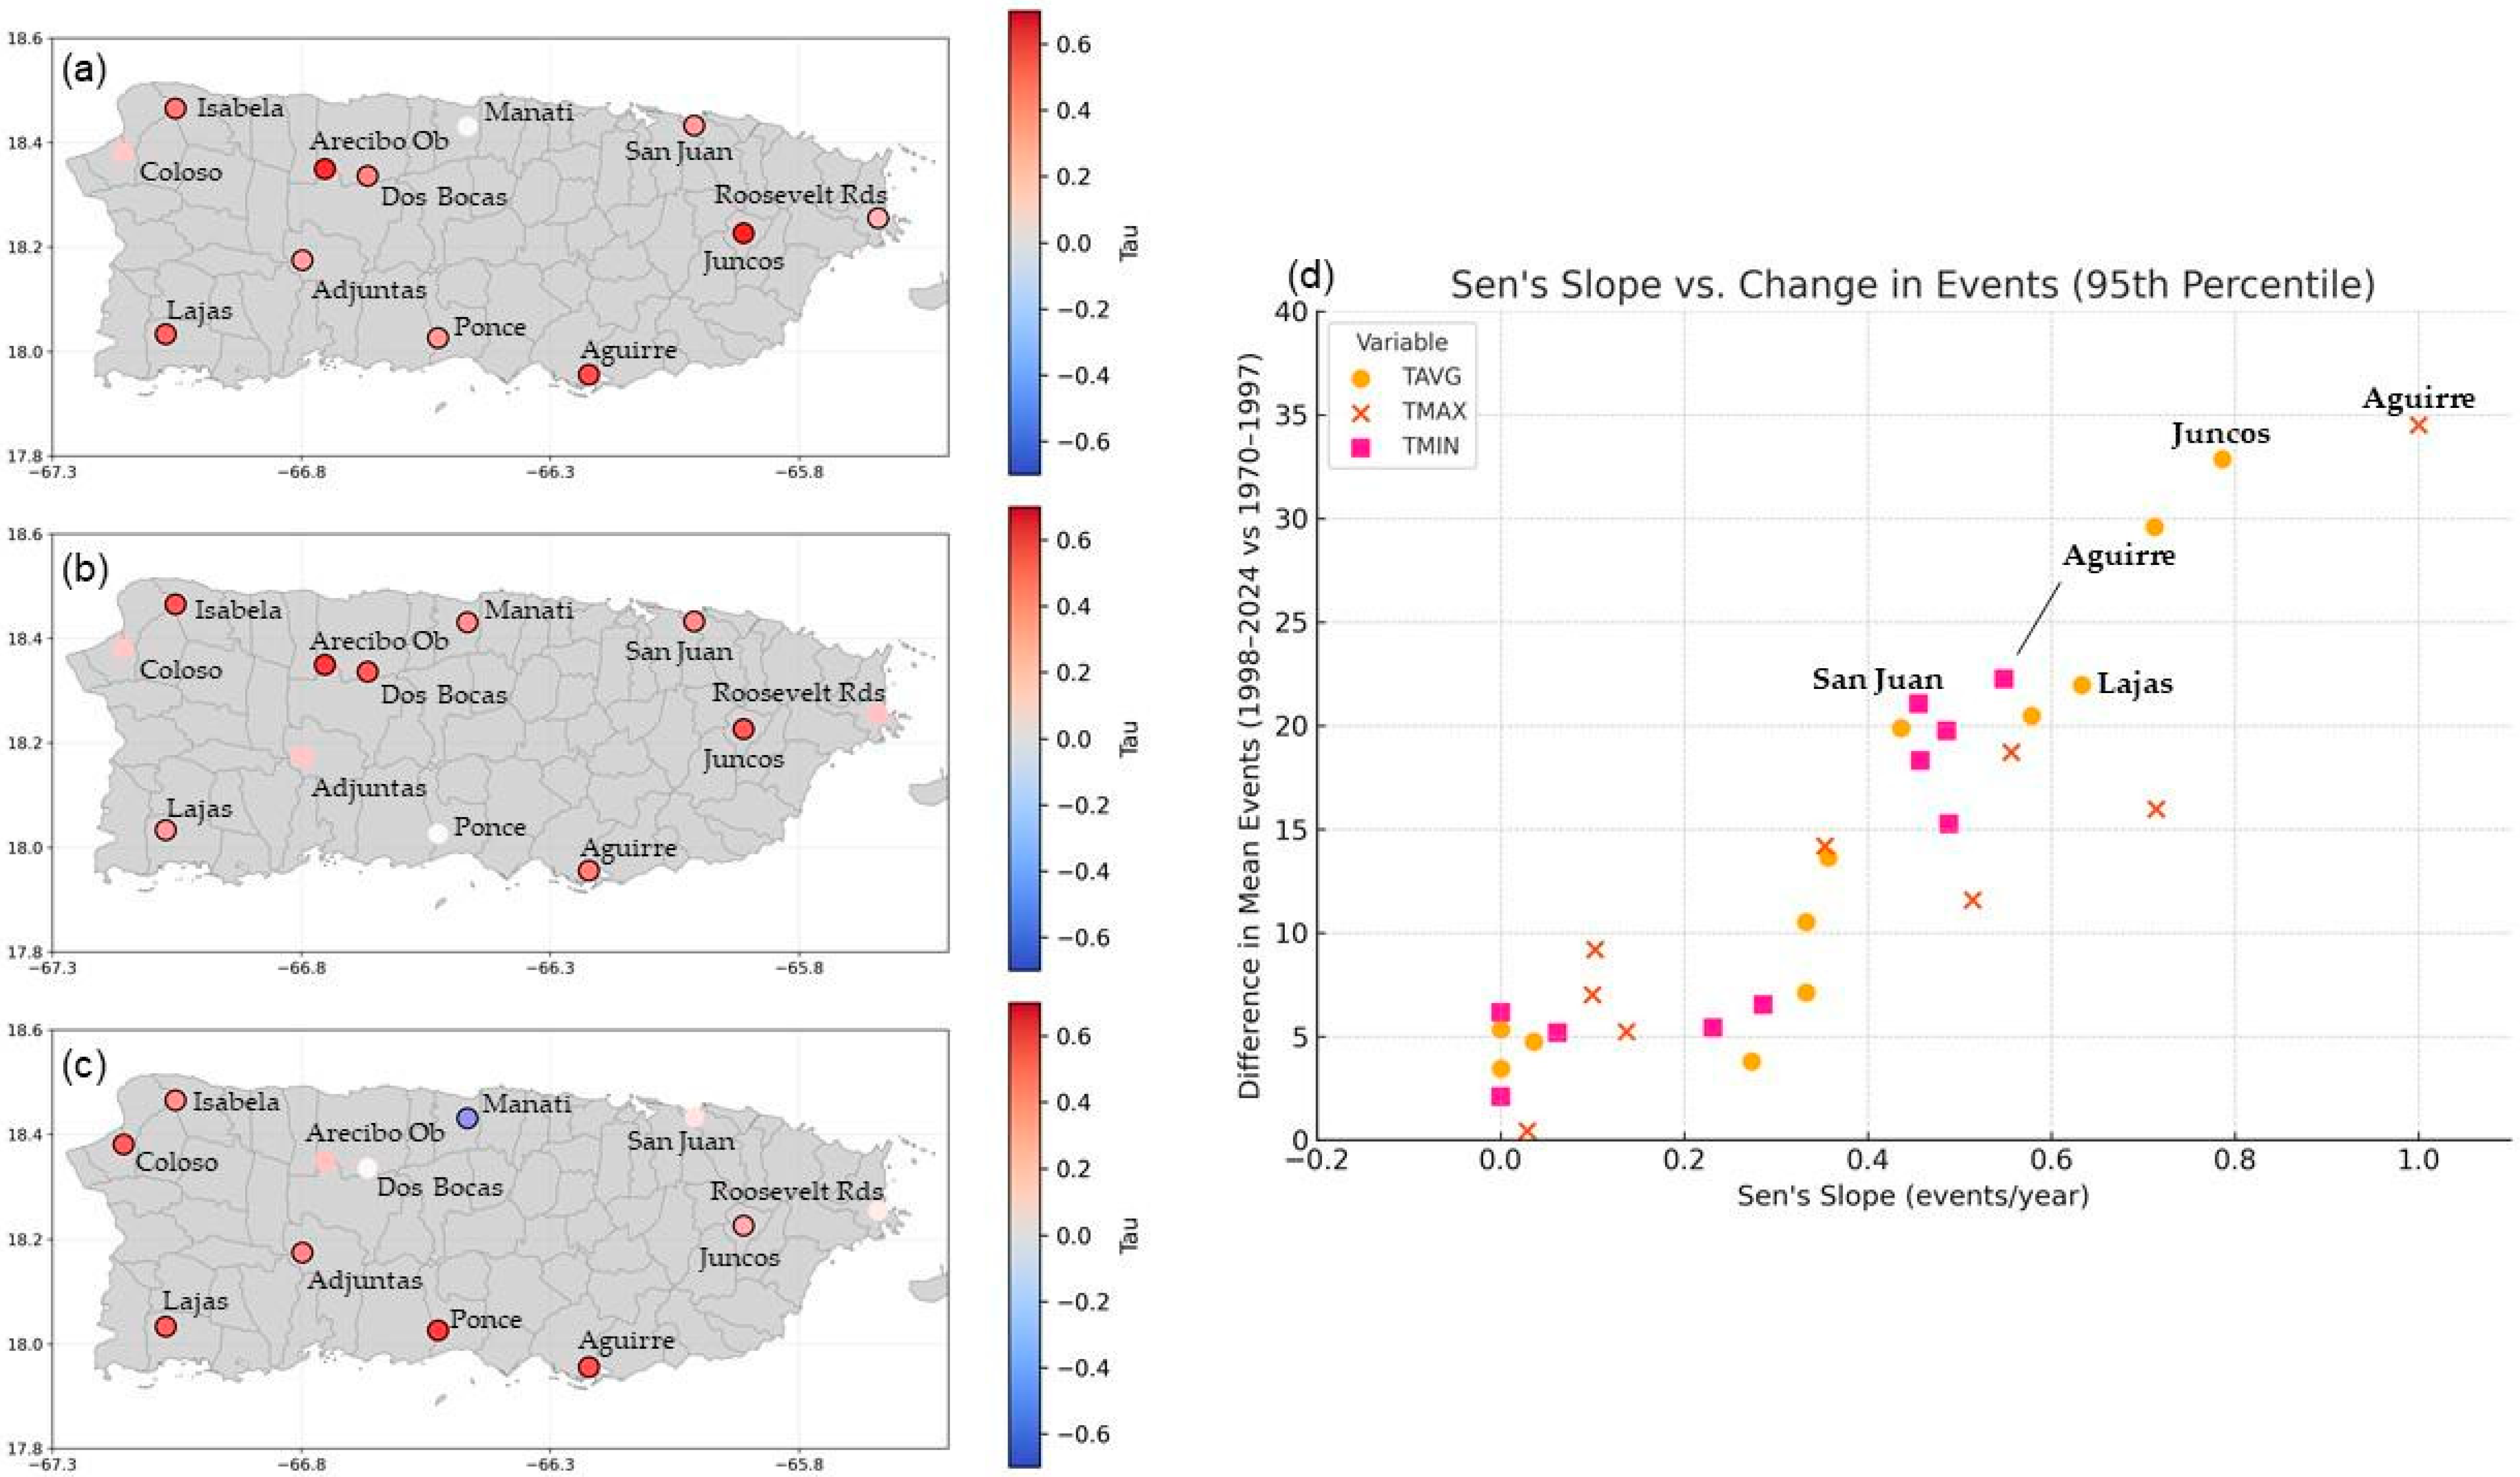
3.3. Daily Temperature Events Trends
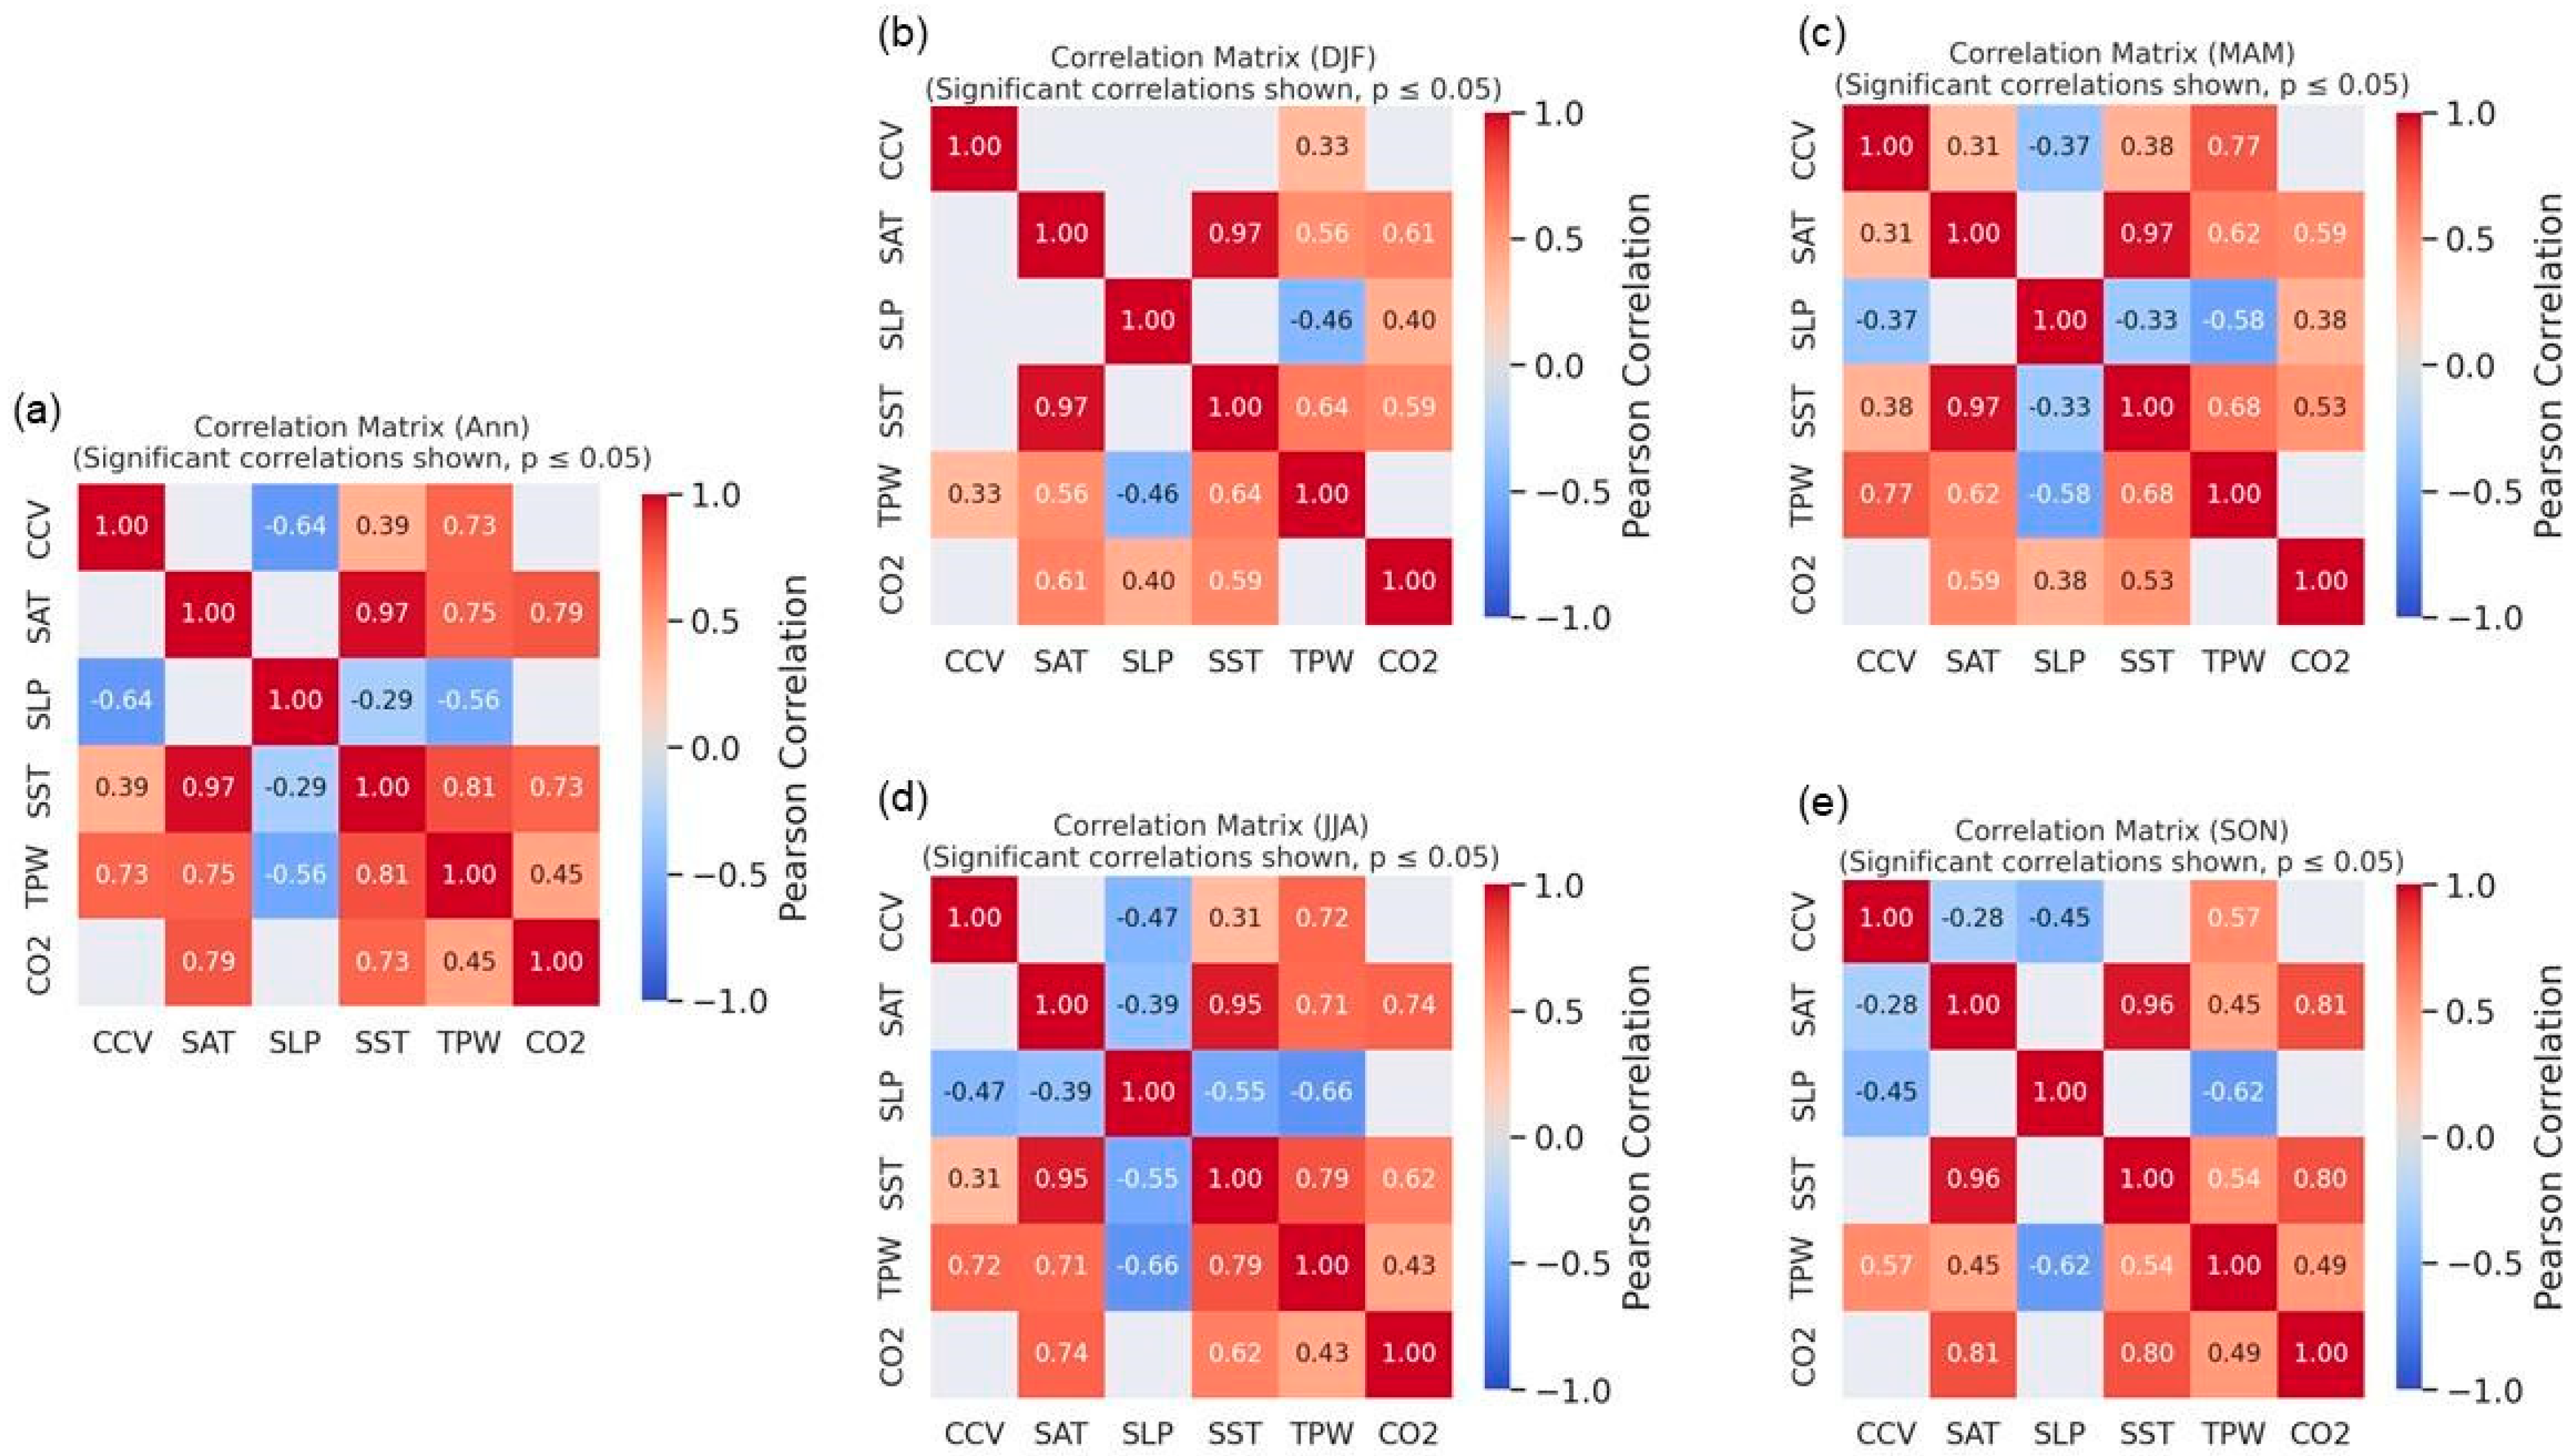
3.4. Forward Stepwise Regression Models
4. Conclusions
Author Contributions
Funding
Institutional Review Board Statement
Informed Consent Statement
Data Availability Statement
Conflicts of Interest
References
- Méndez-Lázaro, P.A.; Pérez-Cardona, C.M.; Rodríguez, E.; Martínez, O.; Taboas, M.; Bocanegra, A.; Méndez-Tejeda, R. Climate change, heat, and mortality in the tropical urban area of San Juan, Puerto Rico. Int. J. Biometeorol. 2018, 62, 699–707. [Google Scholar] [CrossRef]
- IPCC. Climate Change 2021: The Physical Science Basis. Contribution of Working Group I to the Sixth Assessment Report of the Intergovernmental Panel on Climate Change; Cambridge University Press: Cambridge, UK, 2021; Available online: https://www.ipcc.ch/report/ar6/wg1/ (accessed on 22 January 2025).
- Puerto Rico Climate Change Council (PRCCC). Puerto Rico’s State of the Climate 2010 Report; NOAA Coral Reef Conservation Program and The Nature Conservancy: San Juan, Puerto Rico, 2013. Available online: https://www.pr-ccc.org/en/publications/estado-del-clima-de-puerto-rico-2010-2013/ (accessed on 22 January 2025).
- Velazquez-Lozada, A.; González, J.E.; Winter, A. Urban Heat Island Effect Analysis for San Juan, Puerto Rico. Atmos. Environ. 2006, 40, 1731–1741. [Google Scholar] [CrossRef]
- Murphy, D.J.; Hall, M.H.; Hall, C.A.; Heisler, G.M.; Stehman, S.V.; Anselmi-Molina, C. The relationship between land cover and the urban heat island in northeastern Puerto Rico. Int. J. Climatol. 2011, 31, 1222–1239. [Google Scholar] [CrossRef]
- Wong, K.V.; Paddon, A.; Jimenez, A. Review of world urban heat islands: Many linked to increased mortality. J. Energy Resour. Technol. 2013, 135, 022101. [Google Scholar] [CrossRef]
- Jennings, L.N.; Douglas, J.; Treasure, E.; González, G. Climate Change Effects in El Yunque National Forest, Puerto Rico, and the Caribbean Region; General Technical Report SRS-GTR-193; USDA-Forest Service, Southern Research Station: Asheville, NC, USA, 2014; Volume 193, 47p. [Google Scholar] [CrossRef]
- Jennings, L.N.; Treasure, E.A.; McNulty, S.G. Climate Change and Your National Forest: Assessing the Potential Effects of Climate Change on the El Yunque National Forest. 2013. Available online: https://research.fs.usda.gov/treesearch/44323 (accessed on 22 January 2025).
- Campbell, J.D.; Taylor, M.A.; Bezanilla-Morlot, A.; Stephenson, T.S.; Centella-Artola, A.; Clarke, L.A.; Stephenson, K.A. Generating Projections for the Caribbean at 1.5, 2.0 and 2.5 C from a High-Resolution Ensemble. Atmosphere 2021, 12, 328. [Google Scholar] [CrossRef]
- Terando, A.J.; Youngsteadt, E.; Meineke, E.K.; Prado, S.G.; Collins, E. Developing Multi-Model Ensemble Projections of Ecologically Relevant Climate Variables for Puerto Rico and the US Caribbean; Southeast Climate Adaptation Science Center, North Carolina State University: Raleigh, NC, USA, 2020; Available online: https://secasc.ncsu.edu/wp-content/uploads/sites/178/2020/01/020-Final-Memo-Terando.pdf (accessed on 28 January 2025).
- Méndez-Tejeda, R. Increase in the Number of Hot Days for Decades in Puerto Rico 1950–2014. Environ. Nat. Resour. Res. 2017, 7, 16–26. [Google Scholar] [CrossRef]
- Runkle, J.; Kunkel, K.; Stevens, L.; Puerto Rico and the U.S. Virgin Islands State Climate Summary; NOAA Technical Report NESDIS. 2018. Available online: https://www.weather.gov/media/sju/climo/monthly_reports/2018/2018.pdf (accessed on 6 June 2025).
- Duchon, C.E. Temperature Trends at San Juan, Puerto Rico. Bull. Am. Meteorol. Soc. 1986, 67, 1370–1377. [Google Scholar] [CrossRef]
- Méndez-Tejeda, R. Change in the Diurnal Temperature Range over Puerto Rico between 1950–2014. J. Sci. Res. Rep. 2018, 19, 1–19. [Google Scholar] [CrossRef]
- Van Beusekom, A.E.; González, G.; Rivera, M.M. Short-Term Precipitation and Temperature Trends along an Elevation Gradient in Northeastern Puerto Rico. Earth Interact. 2015, 19, 1–33. [Google Scholar] [CrossRef]
- Méndez-Lázaro, P.; Martínez-Sánchez, O.; Méndez-Tejeda, R.; Rodríguez, E.; Morales, E.; Schmitt-Cortijo, N. Extreme Heat Events in San Juan, Puerto Rico: Trends and Variability of Unusual Hot Weather and its Possible Effects on Ecology and Society. J. Climatol. Weather Forecast. 2015, 3, 135. [Google Scholar] [CrossRef]
- Torres-Valcárcel, Á.R.; Harbor, J.; Torres-Valcárcel, A.L.; González-Avilés, C.J. Historical Differences in Temperature between Urban and Non-Urban Areas in Puerto Rico. Int. J. Climatol. 2015, 35, 1648–1661. [Google Scholar] [CrossRef]
- Hamed, K.H.; Rao, A.R. A modified Mann–Kendall trend test for autocorrelated data. J. Hydrol. 1998, 204, 182–196. [Google Scholar] [CrossRef]
- Yue, S.; Pilon, P.; Phinney, B.; Cavadias, G. The influence of autocorrelation on the ability to detect trend in hydrological series. Hydrol. Process. 2002, 16, 1807–1829. [Google Scholar] [CrossRef]
- Klein Tank, A.M.G.; Können, G.P. Trends in indices of daily temperature and precipitation extremes in Europe, 1946–1999. J. Clim. 2003, 16, 3665–3680. [Google Scholar] [CrossRef]
- Abatan, A.A.; Abiodun, B.J.; Lawal, K.A.; Gutowski, W.J., Jr. Trends in extreme temperature over Nigeria from percentile-based threshold indices. Int. J. Climatol. 2016, 36, 2527–2540. [Google Scholar] [CrossRef]
- Sen, P.K. Estimates of the regression coefficient based on Kendall’s tau. J. Am. Stat. Assoc. 1968, 63, 1379–1389. [Google Scholar] [CrossRef]
- Bendel, R.B.; Afifi, A.A. Comparison of stopping rules in forward “stepwise” regression. J. Am. Stat. Assoc. 1977, 72, 46–53. [Google Scholar] [CrossRef]
- Ruengvirayudh, P.; Brooks, G.P. Comparing stepwise regression models to the best-subsets models, or, the art of stepwise. Gen. Linear Model J. 2016, 42, 1–14. Available online: https://digitalcommons.lmu.edu/gess_fac/3/ (accessed on 3 February 2025).
- Hession, S.L.; Moore, N. A spatial regression analysis of the influence of topography on monthly rainfall in East Africa. Int. J. Climatol. 2011, 31, 1440–1456. [Google Scholar] [CrossRef]
- Hernández Ayala, J.J.; Méndez Tejeda, R. Examining the Spatiotemporal Changes in the Annual, Seasonal, and Daily Rainfall Climatology of Puerto Rico. Climate 2023, 11, 225. [Google Scholar] [CrossRef]
- Hernández Ayala, J.J.; Méndez-Tejeda, R. The extremely active 2020 hurricane season in the North Atlantic and its relation to climate variability and change. Atmosphere 2022, 13, 1945. [Google Scholar] [CrossRef]
- Hersbach, H.; Bell, B.; Berrisford, P.; Hirahara, S.; Horányi, A.; Muñoz-Sabater, J.; Nicolas, J.; Peubey, C.; Radu, R.; Schepers, D.; et al. The ERA5 global reanalysis. Q. J. R. Meteorol. Soc. 2020, 146, 1999–2049. [Google Scholar] [CrossRef]
- Colón, J.A. Climatología de Puerto Rico; La Editorial, Universidad de Puerto Rico: San Juan, Puerto Rico, 2009. [Google Scholar]
- NOAA Global Monitoring Laboratory. Trends in Atmospheric Carbon Dioxide—Mauna Loa; NOAA Earth System Research Laboratories: Boulder, CO, USA, 2024. Available online: https://gml.noaa.gov/ccgg/trends/ (accessed on 31 March 2025).
- DelSole, T.; Shukla, J. Artificial skill due to predictor screening. J. Clim. 2009, 22, 331–345. [Google Scholar] [CrossRef]


| Official Station Name | Short Name | Lat | Lon | Elev (M) |
|---|---|---|---|---|
| Adjuntas Substation, US | Adjuntas | 18.17 | −66.80 | 557.8 |
| Aguirre, US | Aguirre | 17.96 | −66.22 | 7.6 |
| Arecibo Observatory, US | Arecibo Ob | 18.35 | −66.75 | 323.1 |
| Coloso, US | Coloso | 18.38 | −67.16 | 12.2 |
| Dos Bocas, US | Dos Bocas | 18.34 | −66.67 | 61 |
| Isabela Substation, US | Isabela | 18.47 | −67.05 | 128 |
| Juncos 1 SE, US | Juncos | 18.23 | −65.91 | 64.9 |
| Lajas Substation, US | Lajas | 18.03 | −67.07 | 27.4 |
| Manati 2 E, US | Manati | 18.43 | −66.47 | 76.2 |
| Ponce 4 E, US | Ponce | 18.03 | −66.53 | 21.3 |
| Roosevelt Roads, US | Roosevelt Rds | 18.26 | −65.64 | 10.1 |
| San Juan LM Marin International Airport, US | San Juan | 18.43 | −66.01 | 3 |
| Sites | Target | Best Predictors | Adj. R2 |
|---|---|---|---|
| Isabela | TMIN | CO2, SST, TPW | 0.80 |
| Coloso | TMIN | CO2, CCV, SST | 0.79 |
| Juncos | TAVG | SAT, CO2, SST, SLP, CCV | 0.72 |
| Isabela | TAVG | SAT, SLP, SST, CO2 | 0.68 |
| Ponce | TMAX | CO2, SST, CCV | 0.66 |
| Aguirre | TMIN | CO2, SST, TPW, SLP, SAT | 0.62 |
| Juncos | TMIN | CO2, SLP | 0.61 |
| Lajas | TMAX | SAT, CCV, CO2 | 0.57 |
| Arecibo Ob | TMAX | CO2, SAT, SST, CCV | 0.57 |
| Lajas | TAVG | SST, CO2 | 0.55 |
| Dos Bocas | TMIN | SAT, CO2, SLP | 0.54 |
| Aguirre | TAVG | CO2, SAT, SLP, SST | 0.53 |
| Coloso | TAVG | CO2, CCV | 0.51 |
| San Juan | TAVG | SAT, CO2, CCV, TPW | 0.48 |
| San Juan | TMIN | SAT | 0.40 |
| Dos Bocas | TAVG | SAT | 0.44 |
| Roosevelt Rds | TMIN | CO2, SLP, SAT | 0.38 |
| Arecibo Ob | TMIN | SST, SAT, CO2 | 0.37 |
| Manati | TMAX | CO2, SAT, SLP, SST | 0.37 |
| Site | Target | Best Predictors | Adjusted R² |
|---|---|---|---|
| Selected DJF Model Results | |||
| Isabela | TMIN | CO2, SST | 0.78 |
| Coloso | TMIN | CO2, SLP | 0.75 |
| Juncos | TAVG | CO2, SAT, SST, SLP | 0.68 |
| Juncos | TMIN | CO2, SAT, SST | 0.66 |
| Ponce | TMAX | CO2, SAT, SLP | 0.65 |
| Isabela | TAVG | CO2, SAT | 0.63 |
| Aguirre | TMIN | CO2, TPW | 0.59 |
| Dos Bocas | TMIN | CO2, SAT, SST, CCV | 0.58 |
| Aguirre | TAVG | CO2, TPW | 0.55 |
| Coloso | TAVG | CO2, TPW | 0.49 |
| Selected MAM Model Results | |||
| Coloso | TMIN | CO2, TPW, SST | 0.78 |
| Isabela | TMIN | CO2, SST, TPW, CCV | 0.78 |
| Juncos | TAVG | CO2, SAT, SLP, SST | 0.69 |
| Ponce | TMAX | CO2, SST | 0.65 |
| Isabela | TAVG | CO2, SAT, TPW | 0.65 |
| Juncos | TMIN | CO2, SLP, CCV | 0.64 |
| Aguirre | TMIN | CO2, SAT, SLP, SST, TPW | 0.60 |
| Aguirre | TAVG | CO2, SAT, SLP | 0.55 |
| Lajas | TMAX | CO2, SAT, SST, SLP, TPW | 0.55 |
| Coloso | TAVG | CO2, TPW, SAT, SST | 0.54 |
| Site | Target | Best Predictors | Adjusted R² |
|---|---|---|---|
| Selected JJA Model Results | |||
| Coloso | TMIN | CO2, TPW | 0.77 |
| Isabela | TMIN | CO2, SST | 0.77 |
| Ponce | TMAX | CO2, TPW | 0.65 |
| Juncos | TAVG | CO2, SAT | 0.63 |
| Isabela | TAVG | CO2, SAT, SLP | 0.61 |
| Juncos | TMIN | CO2, TPW | 0.60 |
| Arecibo Ob | TMAX | CO2, SAT, SST, SLP | 0.57 |
| Aguirre | TMIN | CO2, SAT, TPW, SST | 0.55 |
| Dos Bocas | TMIN | CO2, SST | 0.51 |
| Coloso | TAVG | CO2, CCV | 0.50 |
| Selected SON Model Results | |||
| Isabela | TMIN | CO2, SST, SAT, SLP | 0.79 |
| Coloso | TMIN | CO2, SST, SAT, TPW, CCV | 0.79 |
| Isabela | TAVG | CO2, SST, SLP, SAT | 0.66 |
| Ponce | TMAX | CO2, SST, SAT | 0.62 |
| Juncos | TAVG | CO2, SAT, CCV | 0.62 |
| Juncos | TMIN | CO2, TPW | 0.61 |
| Aguirre | TMIN | CO2, SST, SLP, SAT | 0.57 |
| Dos Bocas | TMIN | CO2, TPW, SLP, SST | 0.56 |
| Lajas | TAVG | SST, SAT | 0.54 |
| Lajas | TMAX | SAT, CO2, CCV | 0.52 |
| Station | Metric | Best Predictors | Adjusted R² |
|---|---|---|---|
| 90th Percentile Results | |||
| Juncos | TMIN | SAT, CO2, SLP, SST, CCV | 0.72 |
| Dos Bocas | TMIN | SST, CO2, SLP, SAT | 0.69 |
| Juncos | TAVG | SAT, CO2, SLP, SST | 0.69 |
| Aguirre | TAVG | SAT, SLP, SST, CCV | 0.68 |
| Dos Bocas | TAVG | SAT, SST | 0.58 |
| Aguirre | TMIN | SAT | 0.56 |
| Arecibo Ob | TAVG | SAT | 0.56 |
| Aguirre | TMAX | CO2, SAT, SST | 0.55 |
| Ponce | TMAX | SAT, CO2, SLP, SST | 0.55 |
| Arecibo Ob | TMIN | SST, SLP, CO2, TPW, CCV | 0.49 |
| 95th Percentile Results | |||
| Juncos | TAVG | SAT, SLP, SST, CO2, CCV, TPW | 0.67 |
| Juncos | TMIN | SAT, SLP, SST, CO2, CCV | 0.64 |
| Aguirre | TMAX | CO2, SLP, SAT, TPW | 0.63 |
| Aguirre | TAVG | SAT, SLP, SST, CCV | 0.61 |
| Dos Bocas | TMIN | SST, SLP, CO2, SAT | 0.60 |
| Arecibo Ob | TAVG | SAT, TPW, CO2 | 0.56 |
| Aguirre | TMIN | SAT | 0.50 |
| Arecibo Ob | TMIN | SST, SLP, CO2, TPW, CCV | 0.49 |
| Adjuntas | TMAX | SST, SLP, CCV, CO2 | 0.49 |
| Ponce | TMAX | CO2, SAT, SST, CCV | 0.47 |
| 99th Percentile Results | |||
| Juncos | TAVG | SAT, SLP, SST, CCV, TPW, CO2 | 0.56 |
| Aguirre | TMAX | CO2, SLP, TPW | 0.55 |
| Ponce | TMAX | CO2, SLP, SAT, SST | 0.49 |
| Adjuntas | TMAX | SAT, SLP, SST, TPW | 0.46 |
| Juncos | TMIN | SAT, SST, SLP, TPW | 0.45 |
| Arecibo Ob | TMIN | SST, TPW, SLP, CO2 | 0.45 |
| Adjuntas | TMIN | SAT, CO2, CCV, TPW | 0.39 |
| Dos Bocas | TMIN | SAT, SLP, CCV | 0.38 |
| Ponce | TMIN | SAT, CO2, TPW | 0.37 |
| Arecibo | TAVG | CO2, SLP, TPW, SST | 0.37 |
Disclaimer/Publisher’s Note: The statements, opinions and data contained in all publications are solely those of the individual author(s) and contributor(s) and not of MDPI and/or the editor(s). MDPI and/or the editor(s) disclaim responsibility for any injury to people or property resulting from any ideas, methods, instructions or products referred to in the content. |
© 2025 by the authors. Licensee MDPI, Basel, Switzerland. This article is an open access article distributed under the terms and conditions of the Creative Commons Attribution (CC BY) license (https://creativecommons.org/licenses/by/4.0/).
Share and Cite
Hernández Ayala, J.J.; Méndez Tejeda, R.; Silvagnoli Santos, F.L.; Villafañe Rolón, N.A.; Martis Cruz, N. Trends in Annual, Seasonal, and Daily Temperature and Its Relation to Climate Change in Puerto Rico. Atmosphere 2025, 16, 737. https://doi.org/10.3390/atmos16060737
Hernández Ayala JJ, Méndez Tejeda R, Silvagnoli Santos FL, Villafañe Rolón NA, Martis Cruz N. Trends in Annual, Seasonal, and Daily Temperature and Its Relation to Climate Change in Puerto Rico. Atmosphere. 2025; 16(6):737. https://doi.org/10.3390/atmos16060737
Chicago/Turabian StyleHernández Ayala, José J., Rafael Méndez Tejeda, Fernando L. Silvagnoli Santos, Nohán A. Villafañe Rolón, and Nickanthony Martis Cruz. 2025. "Trends in Annual, Seasonal, and Daily Temperature and Its Relation to Climate Change in Puerto Rico" Atmosphere 16, no. 6: 737. https://doi.org/10.3390/atmos16060737
APA StyleHernández Ayala, J. J., Méndez Tejeda, R., Silvagnoli Santos, F. L., Villafañe Rolón, N. A., & Martis Cruz, N. (2025). Trends in Annual, Seasonal, and Daily Temperature and Its Relation to Climate Change in Puerto Rico. Atmosphere, 16(6), 737. https://doi.org/10.3390/atmos16060737