
Analysis of the PM2.5/PM10 Ratio in Three Urban Areas of Northeastern Romania


Abstract
1. Introduction
- -
- To analyze the trends in PM2.5/PM10 ratios and PM2.5 and PM10 concentrations, and the correlation relationships between PM2.5/PM10 ratios and PM2.5 and PM10 concentrations by season;
- -
- To analyze the frequency distribution of PM2.5/PM10 ratios in each season, namely, spring (March–May), summer (June–August), autumn (September–November), and winter (December–February), to determine the nature of natural or anthropogenic emissions;
- -
- To investigate the relationship between the PM2.5/PM10 ratio and temperature;
- -
- To analyze the spatial variation of the PM2.5/PM10 ratio in the three urban areas.
2. Materials and Methods
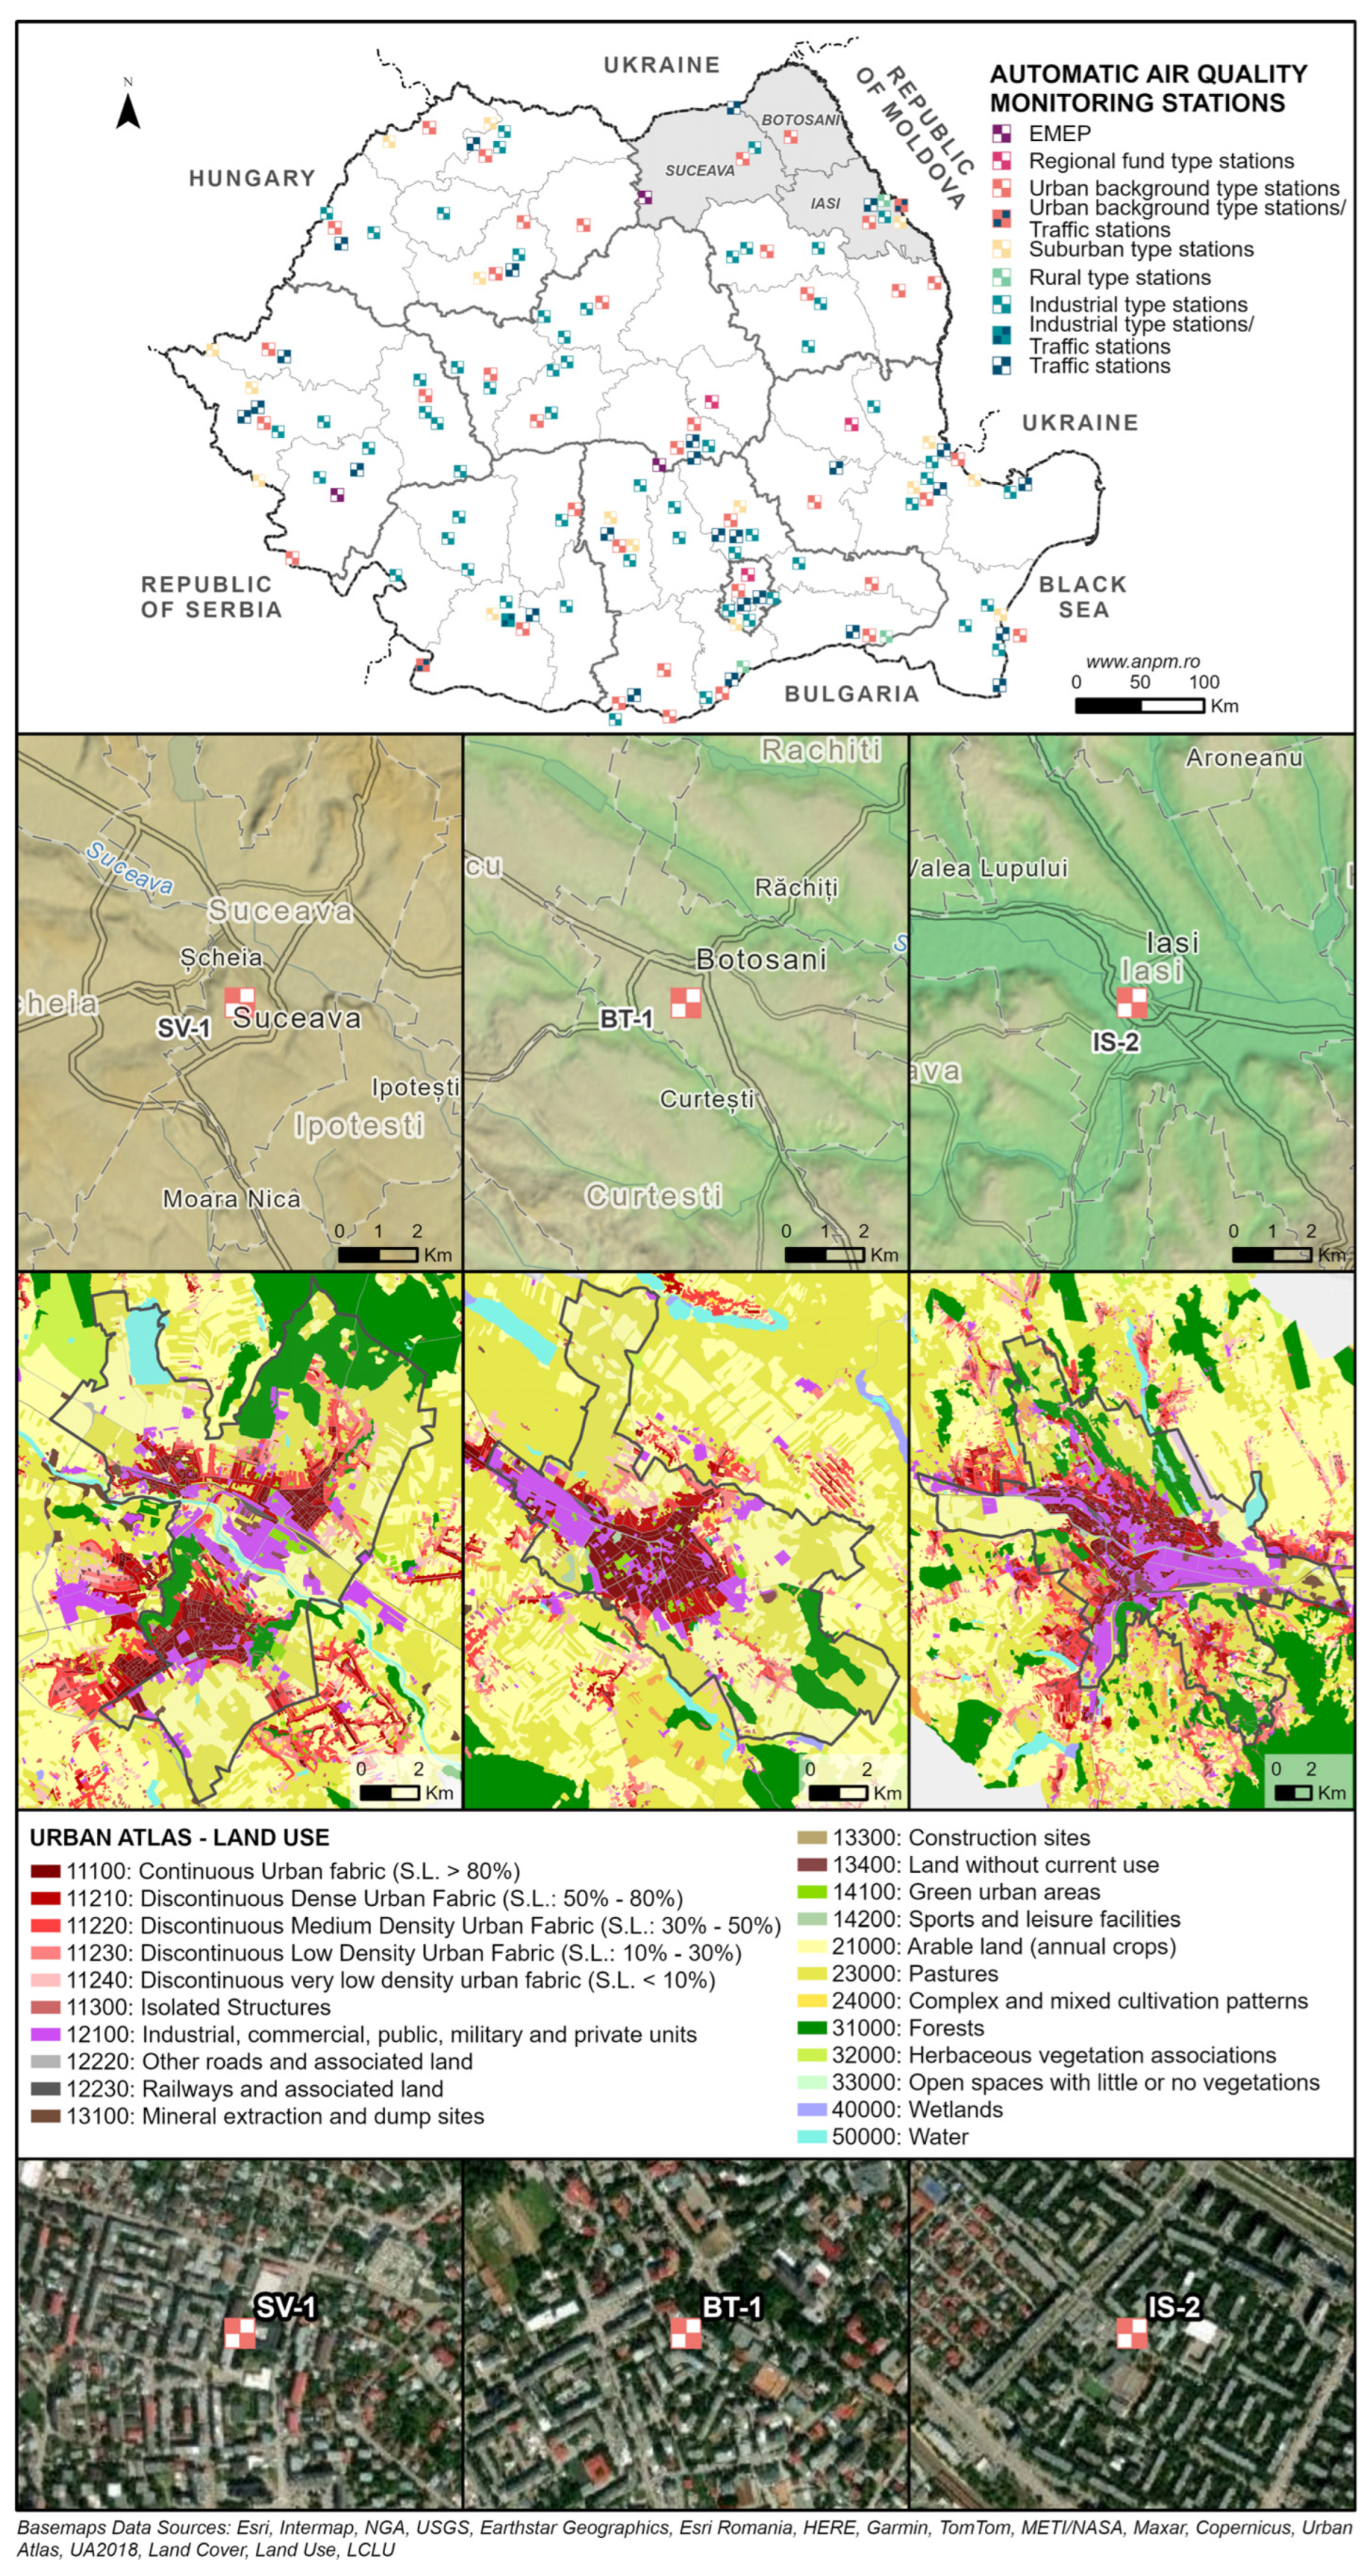
2.1. Study Area
2.2. Data Analysis
- -
- Coverage of a variety of urban areas with different topography and population density;
- -
- Availability of valid daily PM2.5 and PM10 data obtained by the gravimetric method;
- -
- Only data available for both PM2.5 and PM10 concentrations on the same day were included. Invalid ratios were excluded due to missing a PM fraction.
3. Results and Discussion
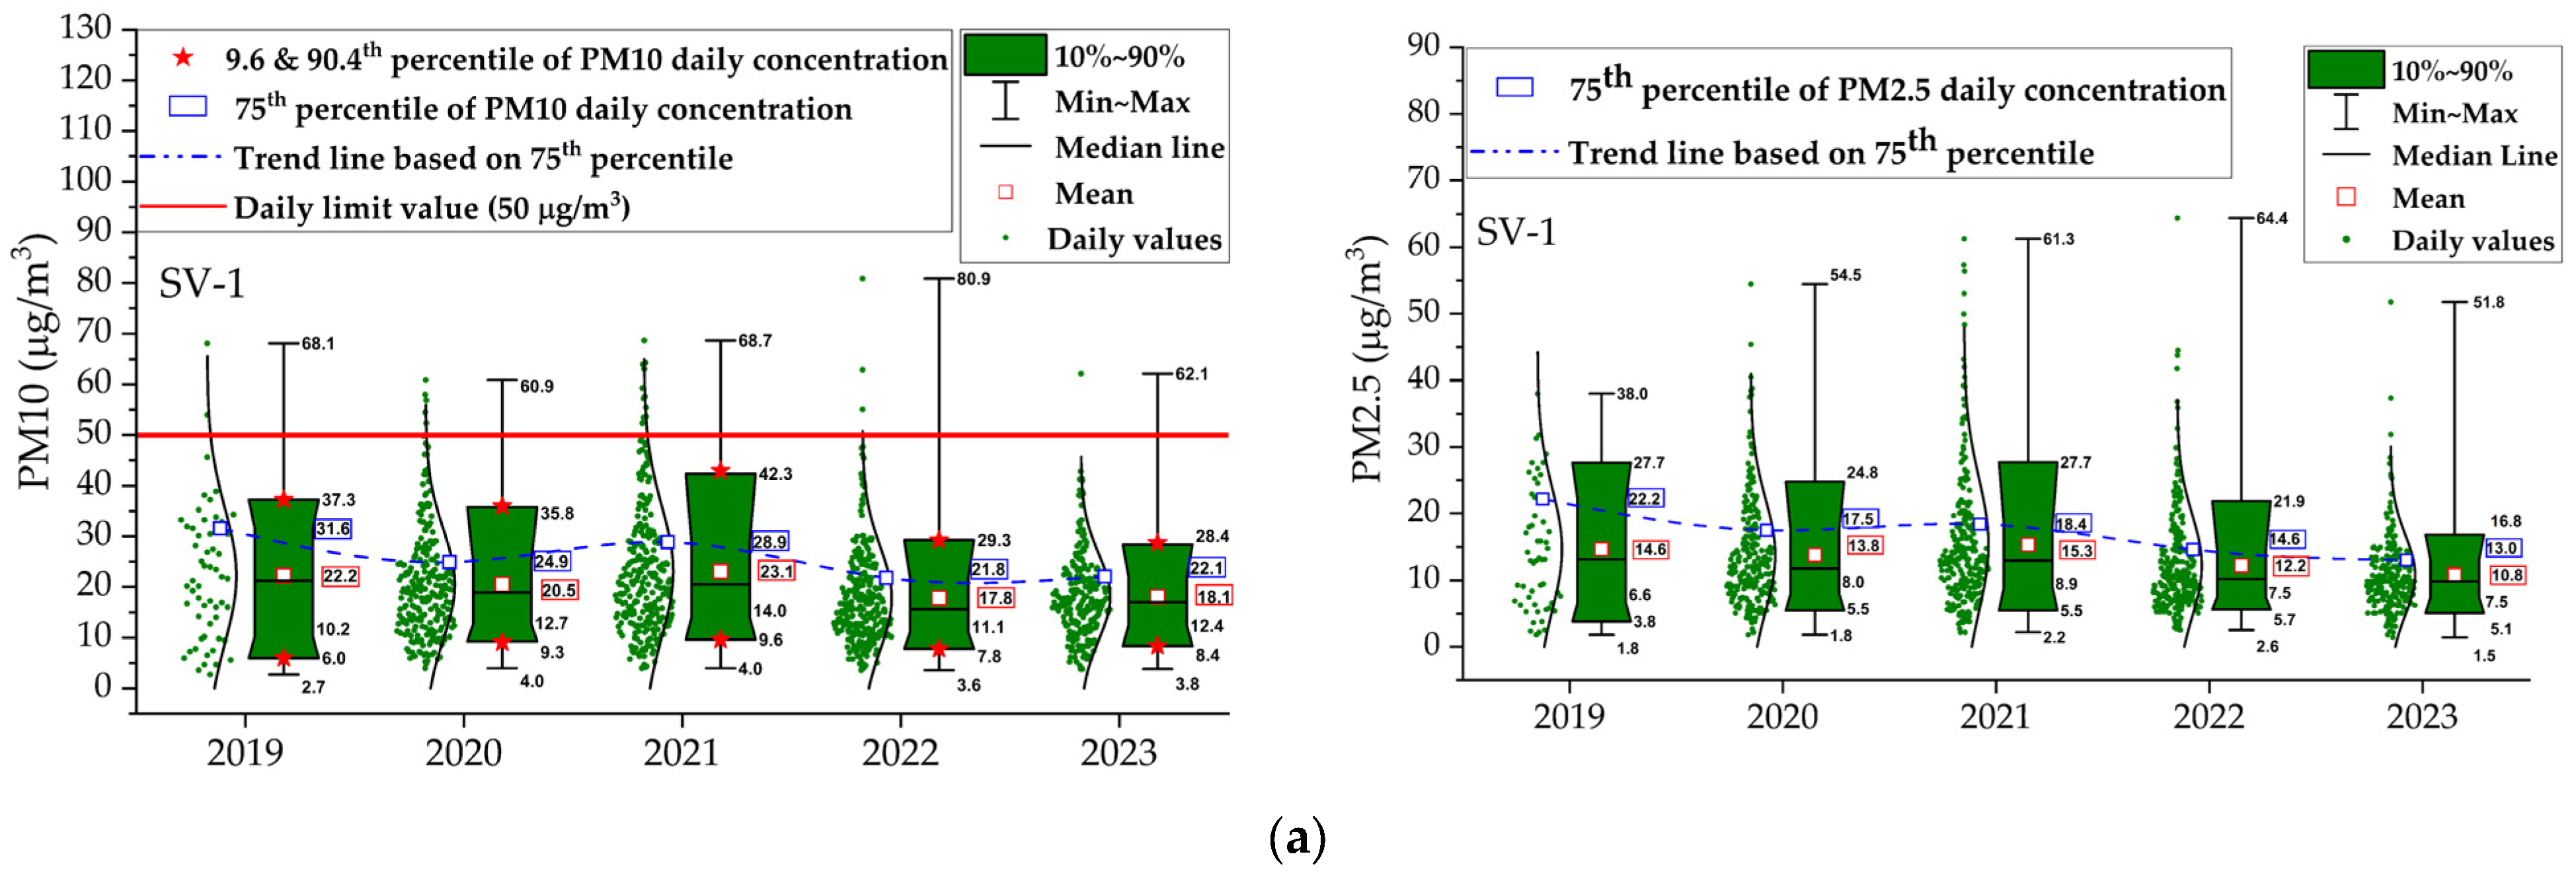
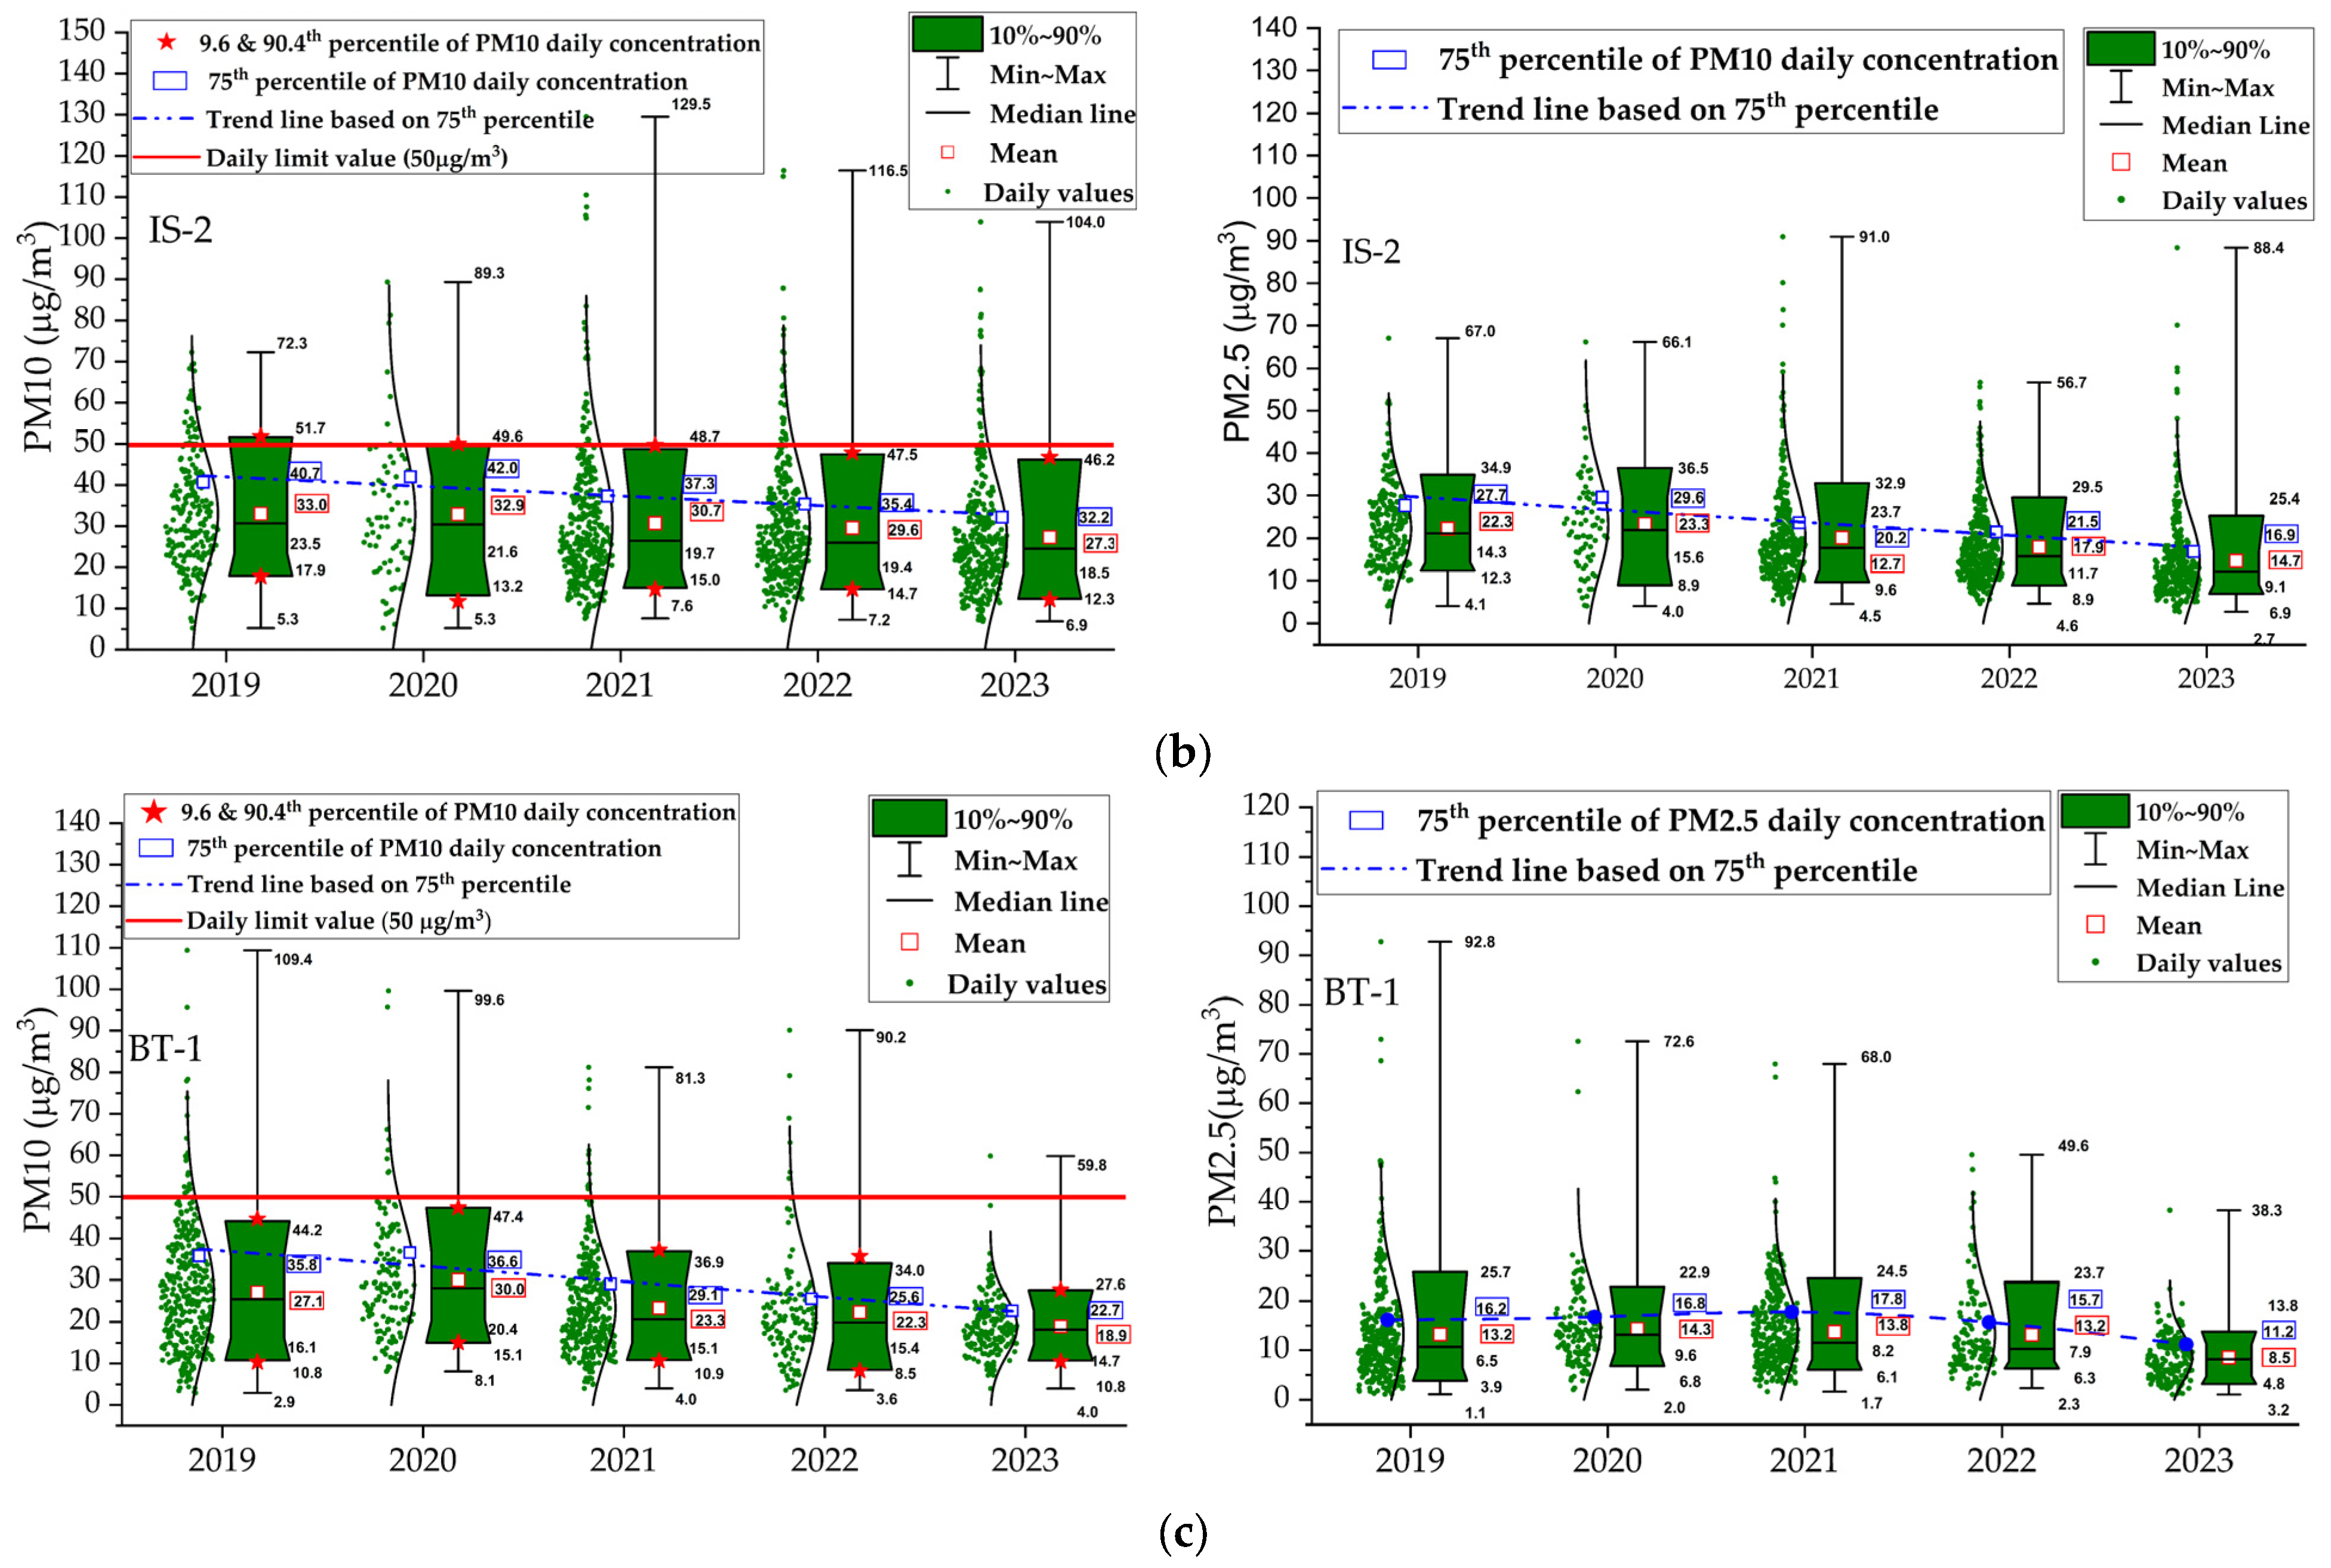
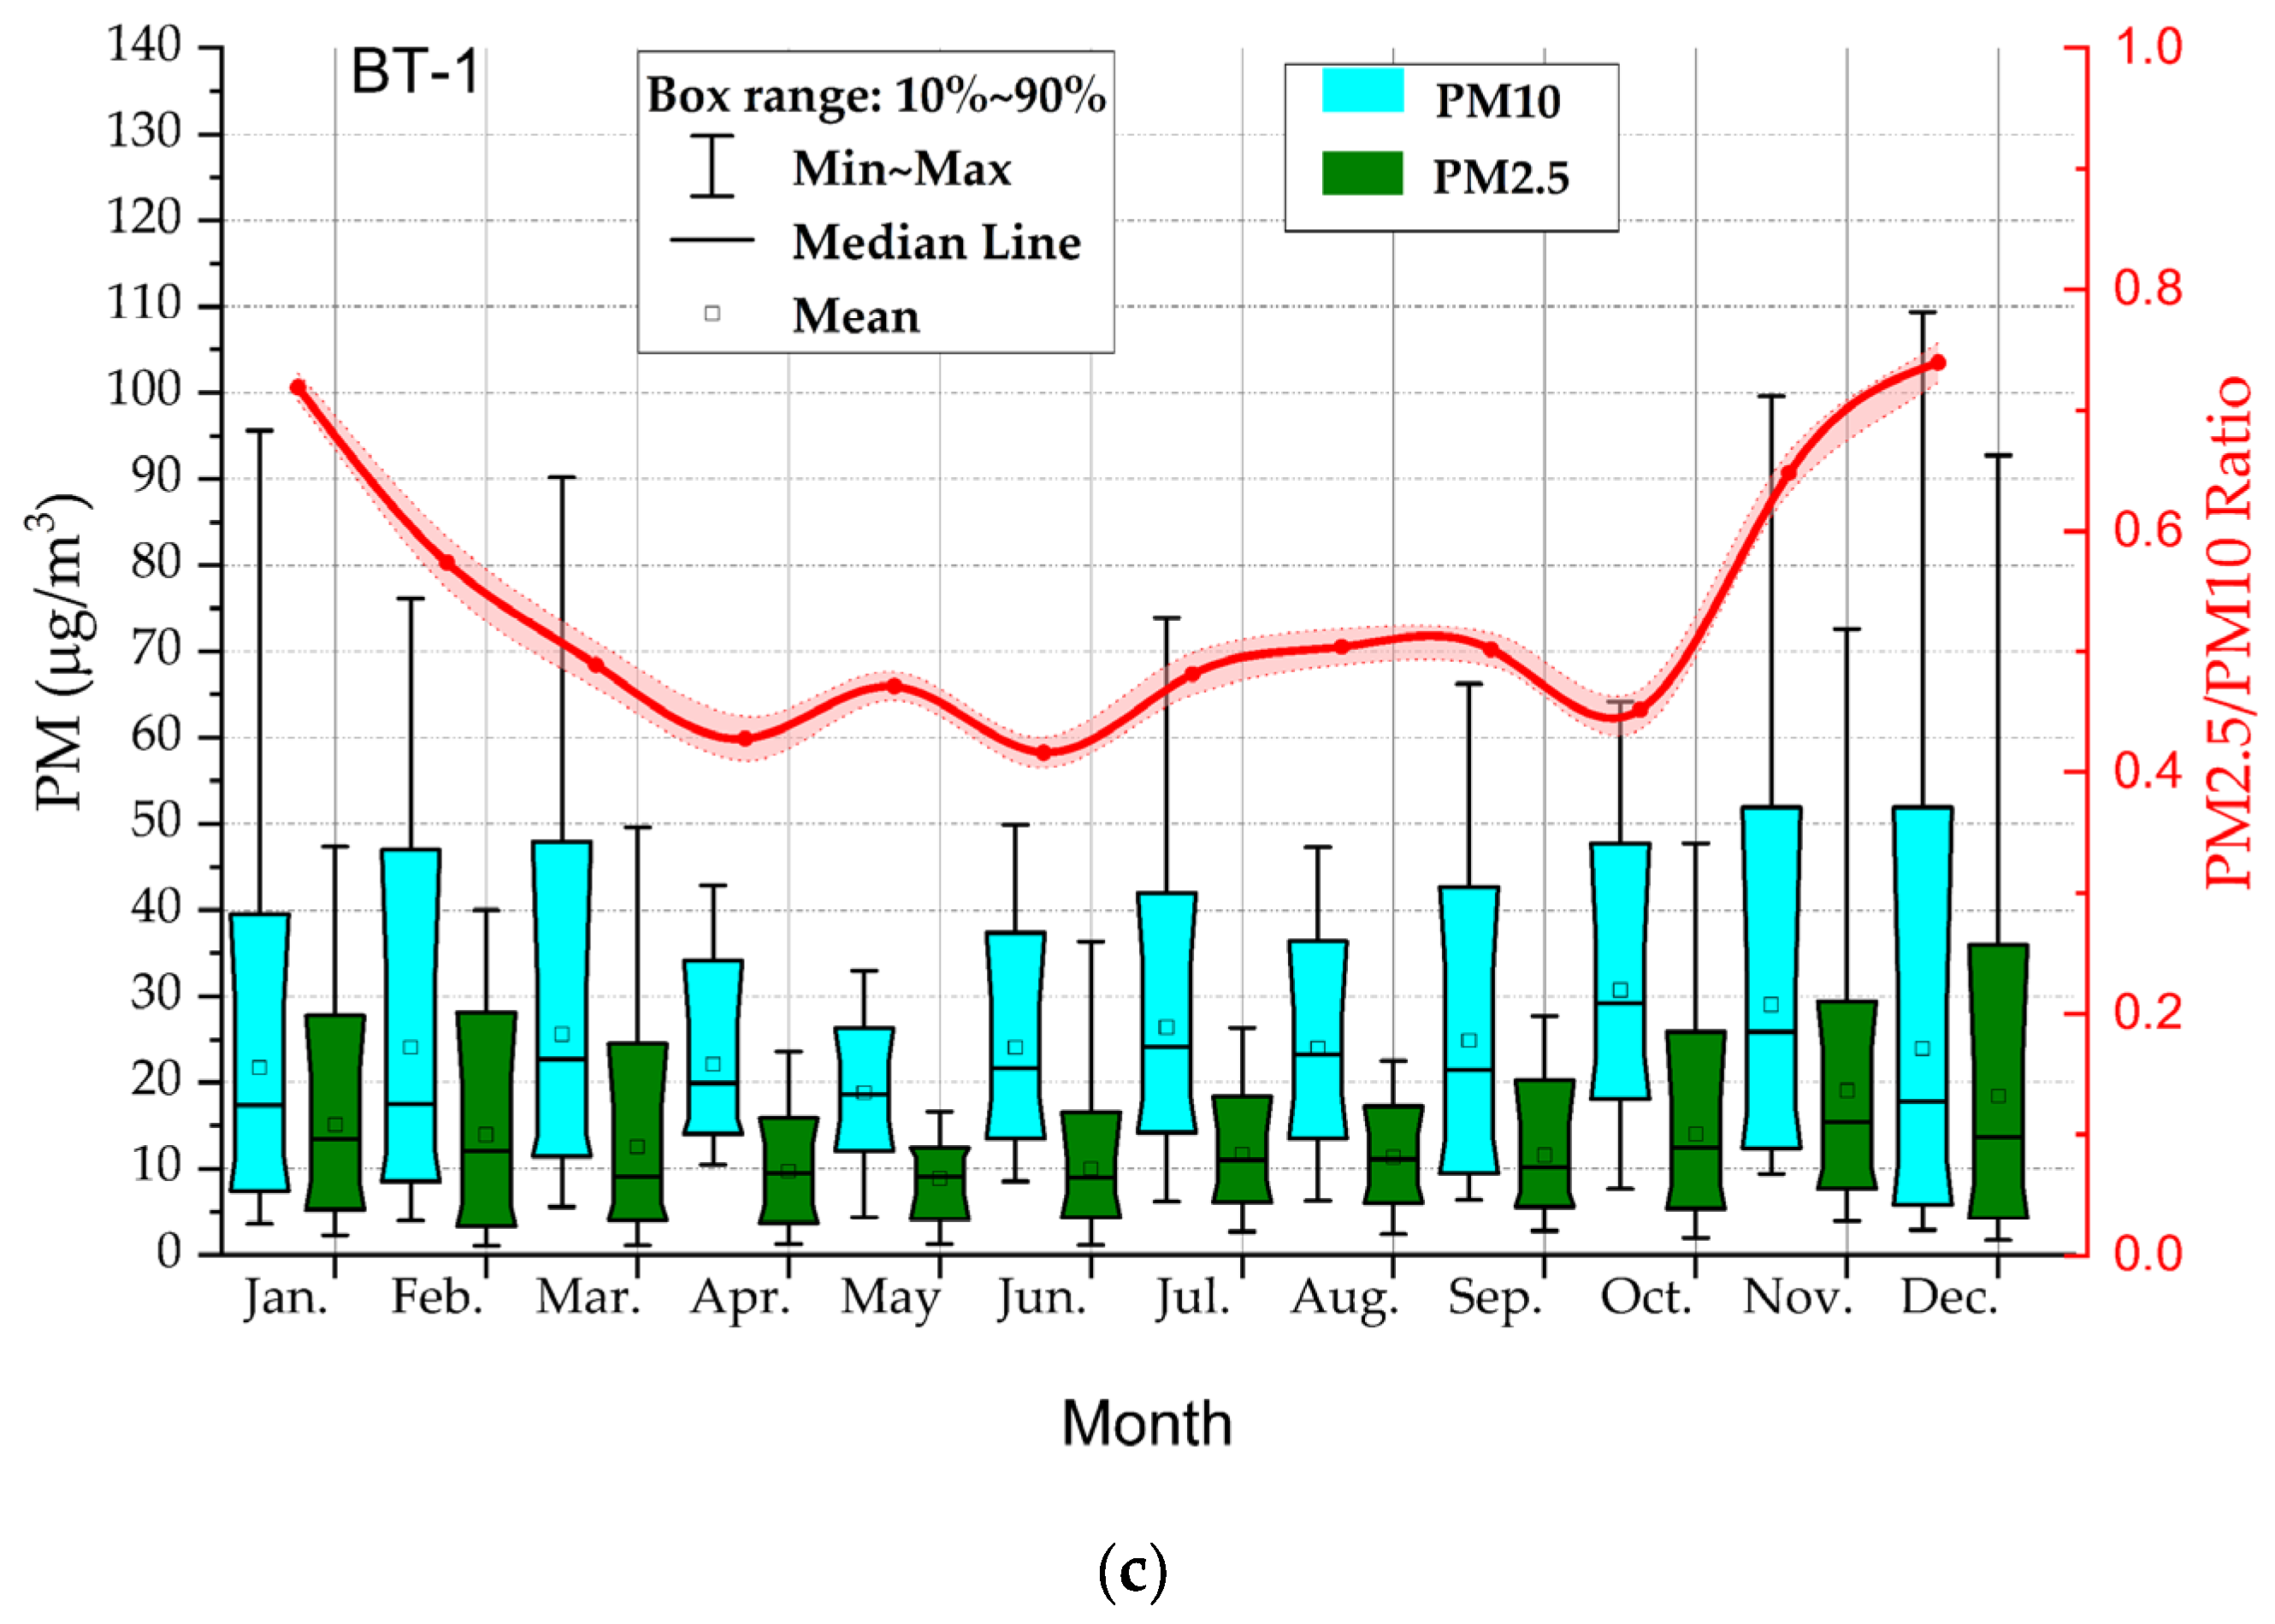
3.1. Variation of Particulate Matter (PM10 and PM2.5)
3.2. Temporal Variability of PM2.5/PM10 Ratios
3.2.1. Annual Variation of PM2.5/PM10 Ratios
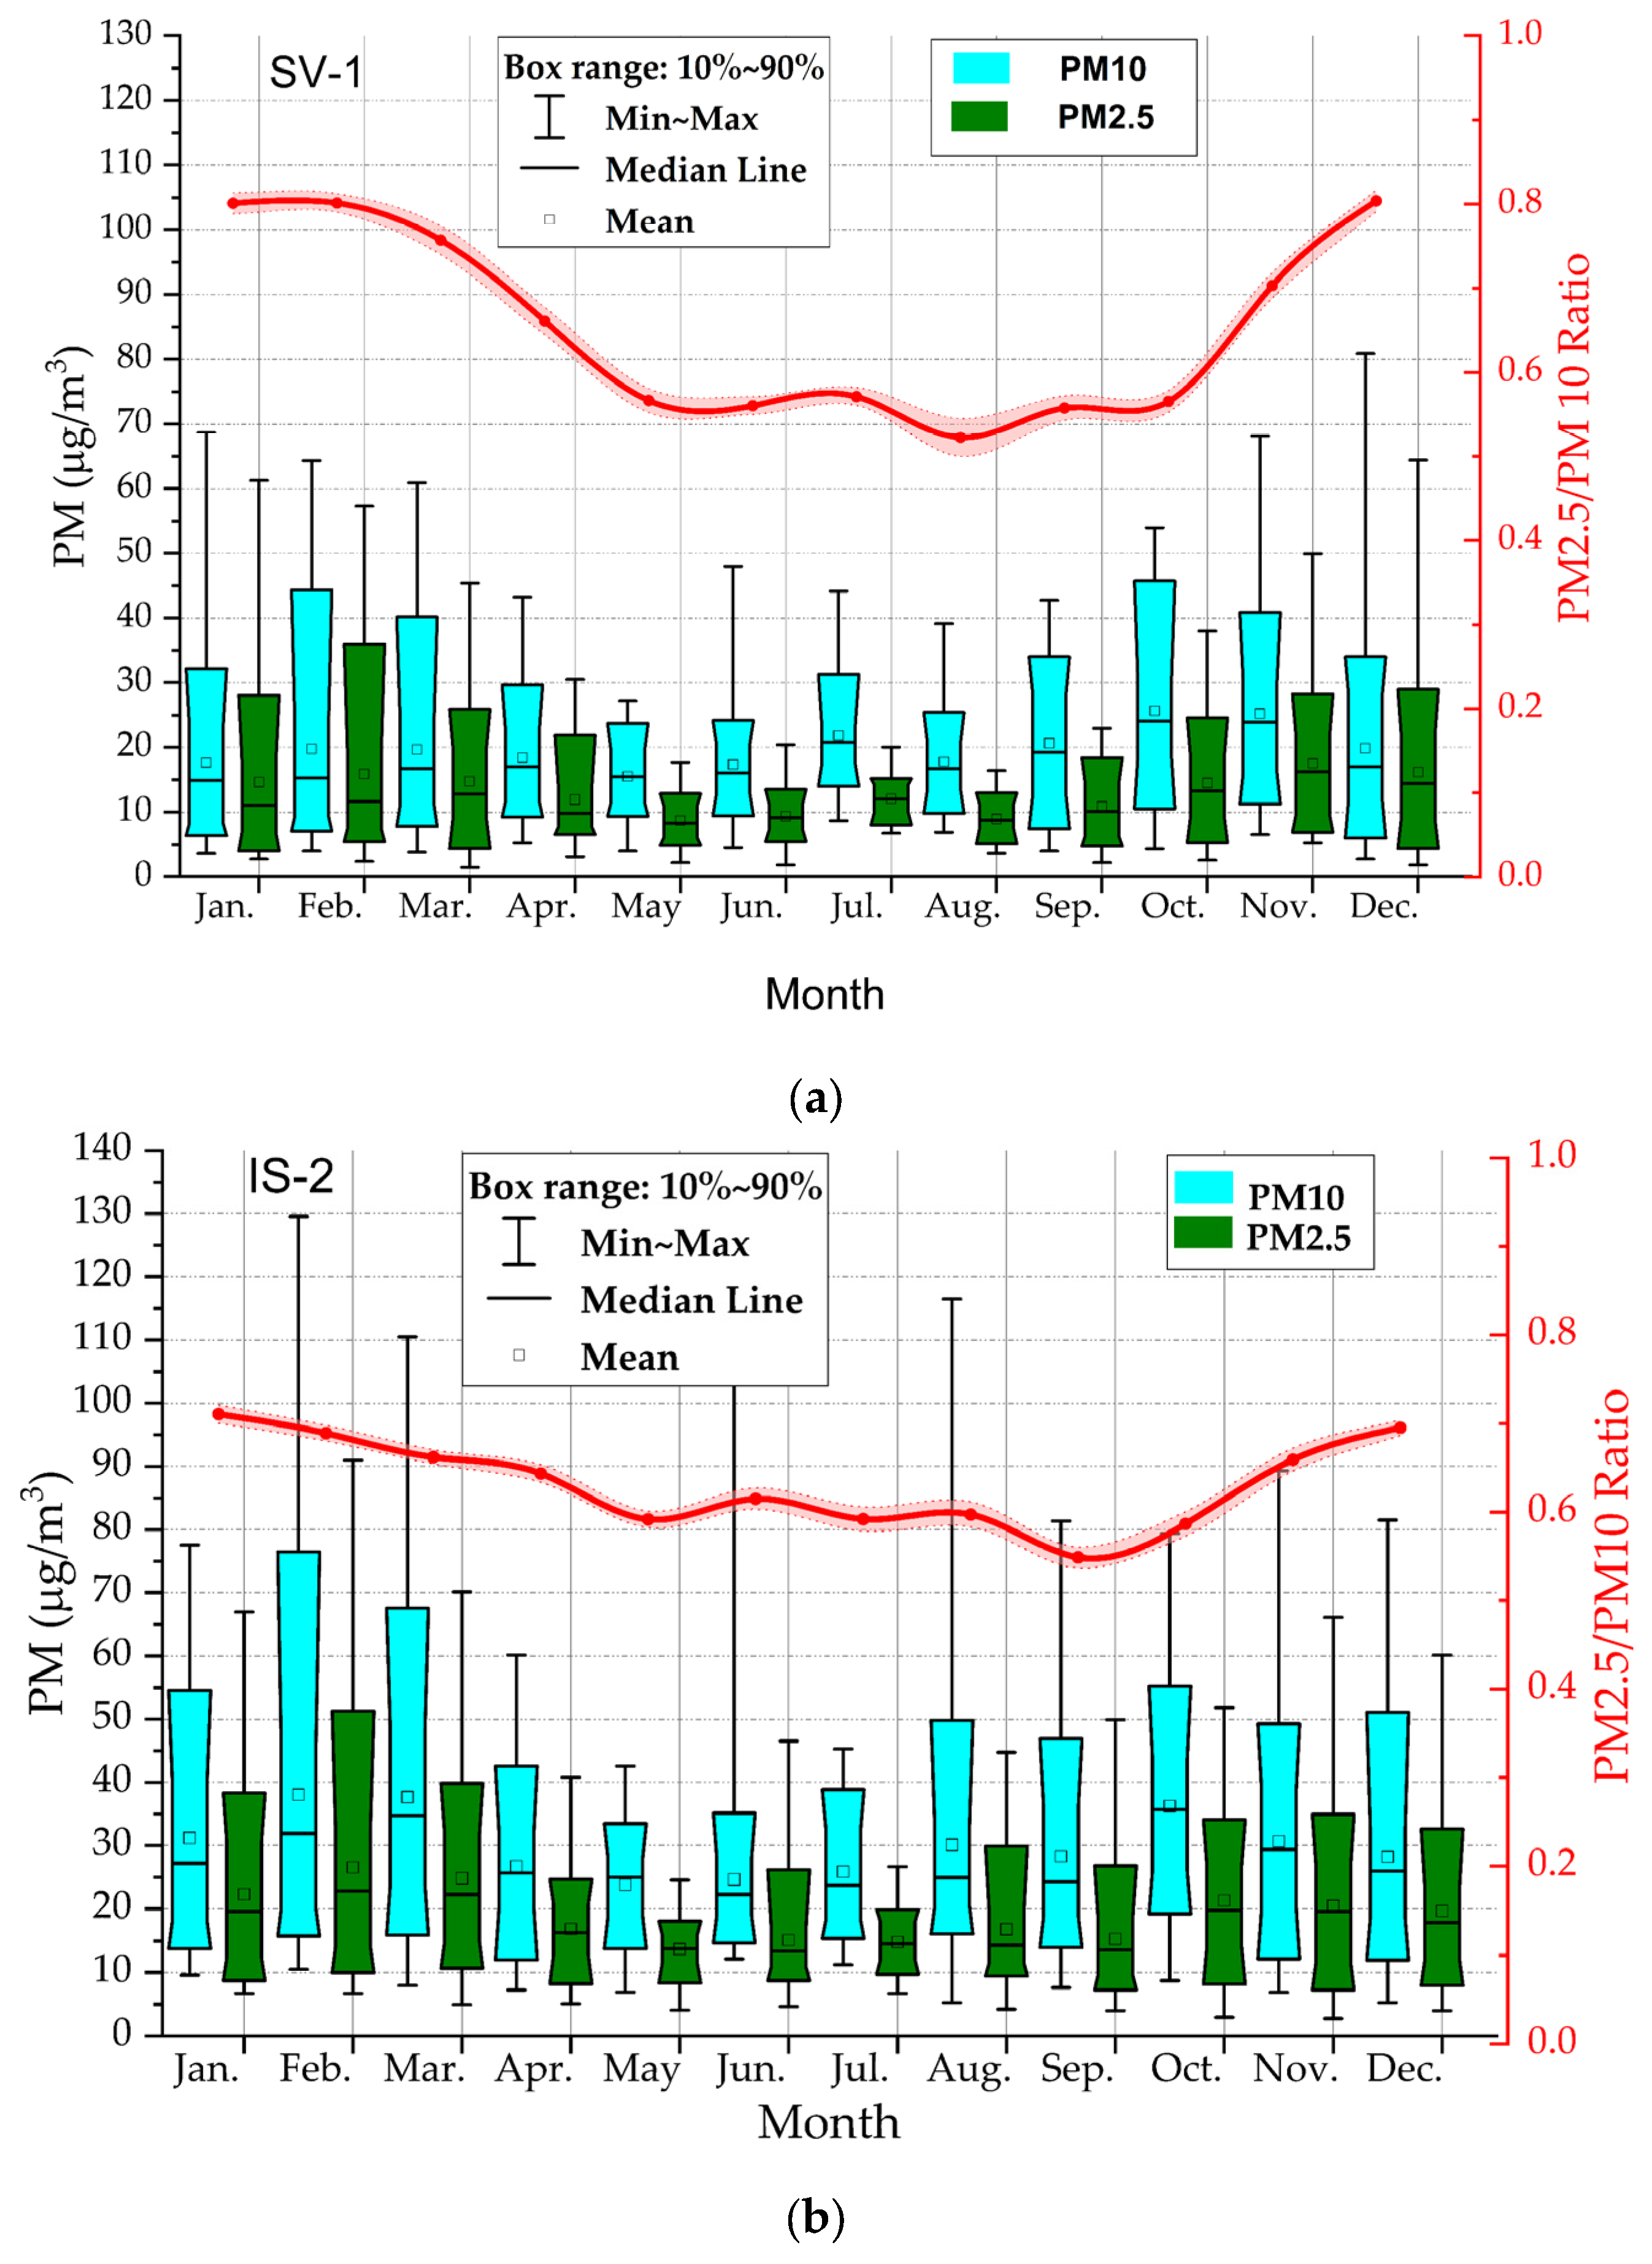
3.2.2. Monthly Variation of PM2.5/PM10 Ratios Compared to Monthly Variation of PM10 and PM25 Concentrations Monthly Variation of CO, NO2, and SO2 Concentrations—Monthly Variation of PM2.5 and PM2.5–10
Monthly Variation of CO, NO2, and SO2 Concentrations
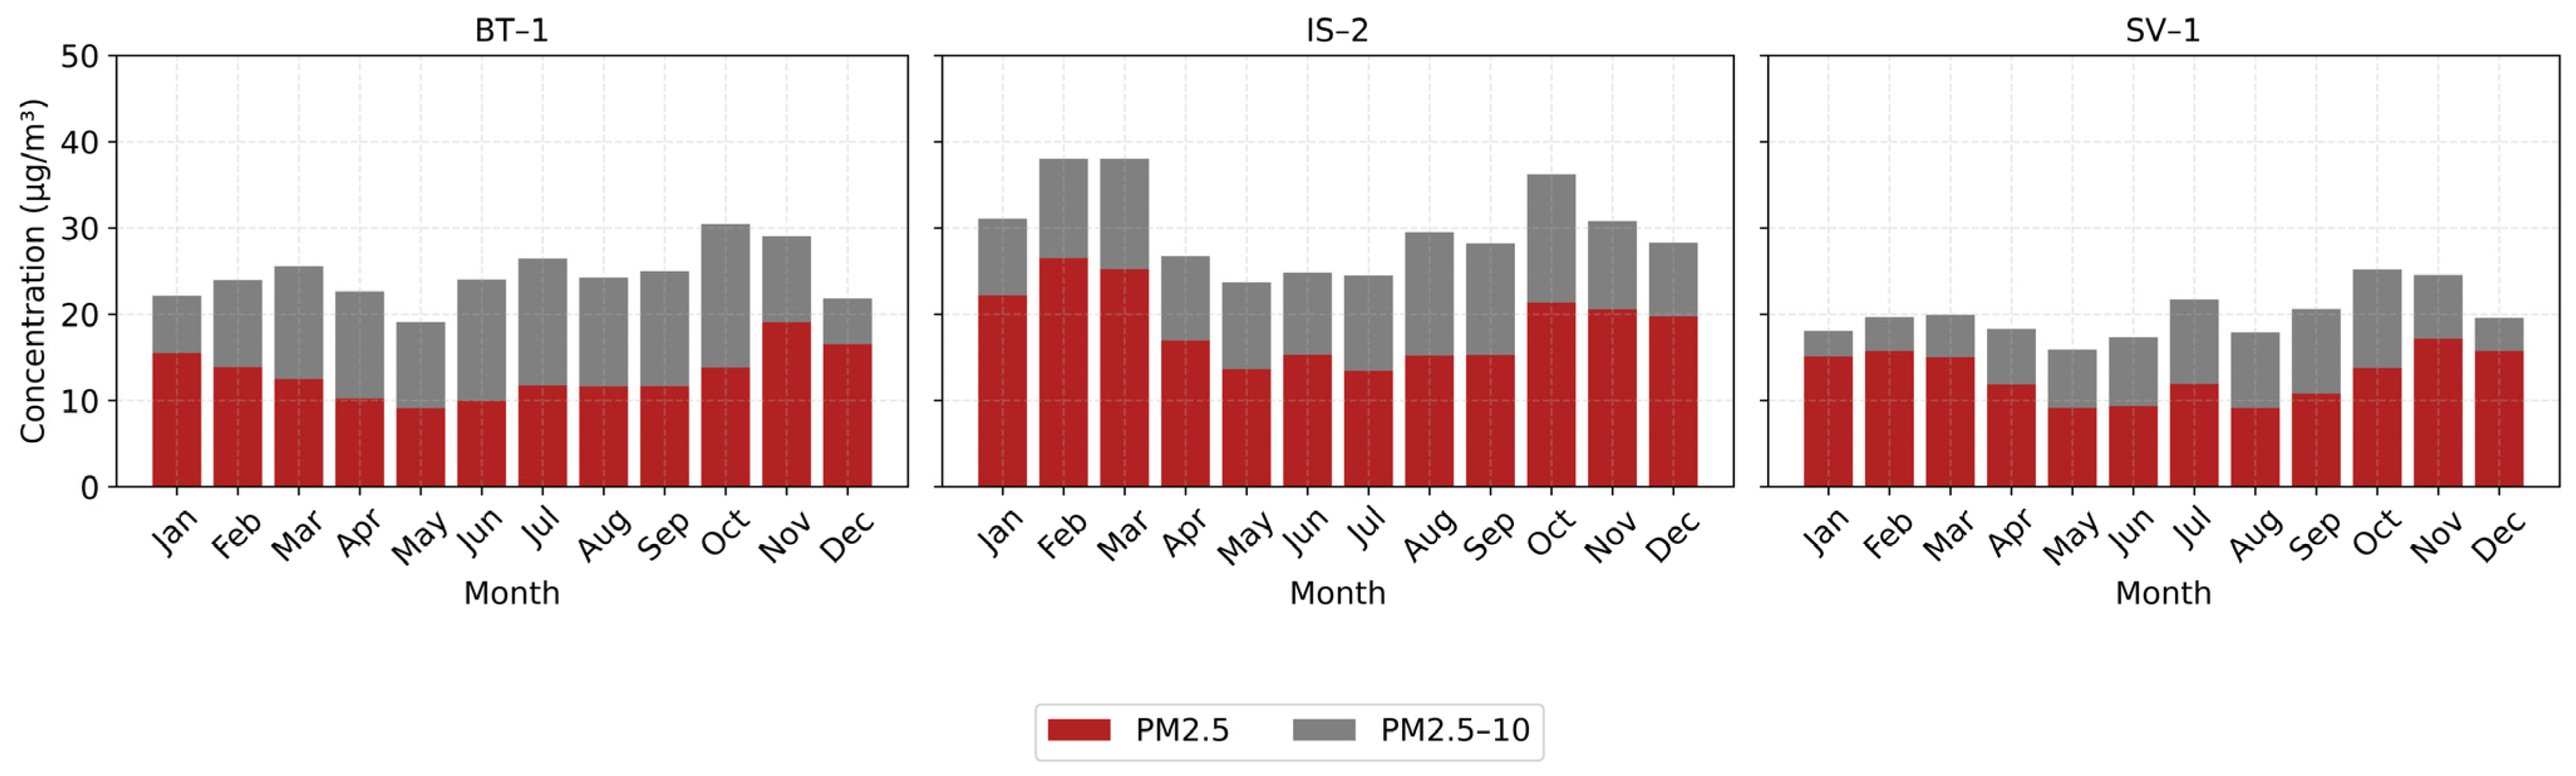
Monthly Variation of PM2.5 and PM2.5–10
3.2.3. Seasonal Variation of PM2.5/PM10 Ratios
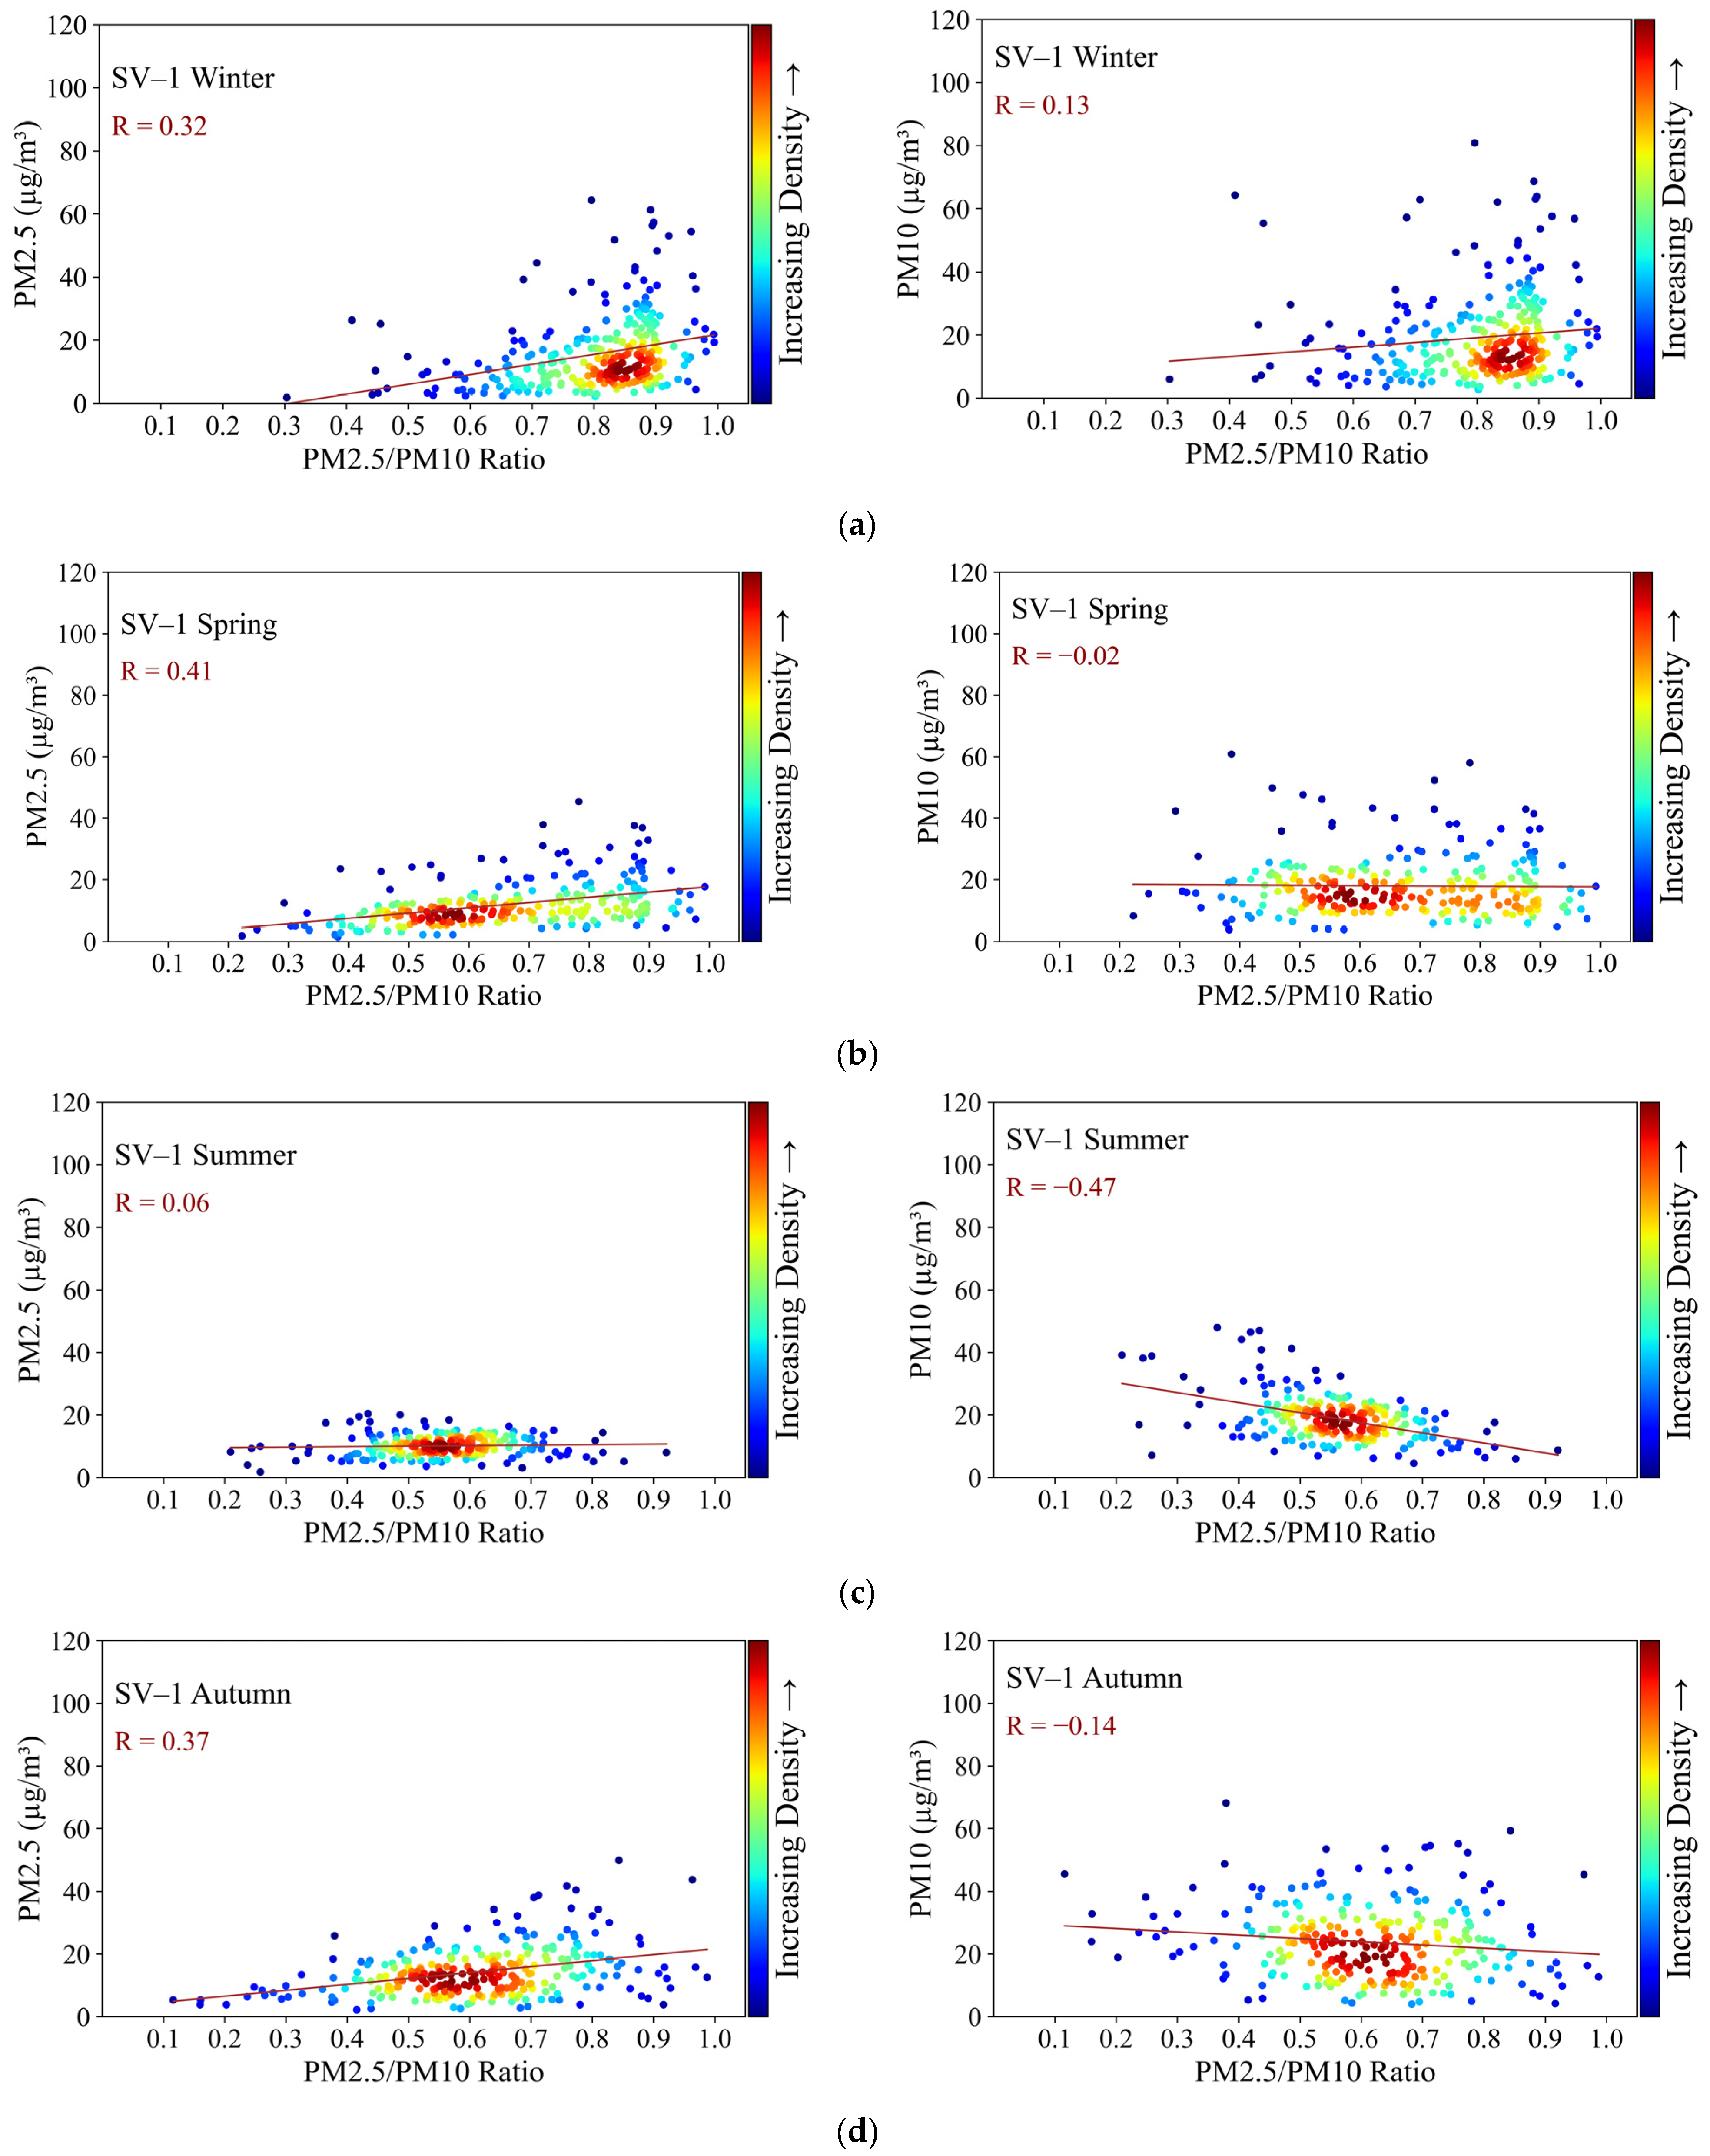
- PM10 concentrations and PM2.5/PM10 ratios showed a weak positive correlation in winter (R = 0.13) and a negative correlation in the other three seasons.
- During the winter season, most the PM2.5/PM10 ratios are in the range of 0.8–0.9, due to PM2.5 concentrations of about 14.6 μg/m3. The emission sources for these concentrations are mainly residential combustion plants, energy combustion plants, and road traffic. As the PM2.5/PM10 ratios tend to increase, an increase in PM2.5 concentrations is observed, with a slope of 31.4 μg/m3. The increase in the PM2.5/PM10 ratio is directly proportional to the increase in PM2.5 concentrations (R = 0.32).
- In spring and autumn, most PM2.5/PM10 ratios are in the range of 0.5–0.7 due to PM2.5 concentrations around 10 μg/m3. Anthropogenic emission sources are lower in these two seasons than in the winter season. The increase in the PM2.5/PM10 ratio is directly proportional to the increase in PM2.5 concentrations, R = 0.41 in spring and R = 0.37 in autumn.
- In summer, the correlation between PM2.5 and the PM2.5/PM10 ratio decreases (R = 0.06) and the values of most PM2.5/PM10 ratios are between 0.5 and 0.6, which confirms the decrease in anthropogenic fine particle emissions. The high negative R between PM10 and PM2.5/PM10 (R = −0.47) suggests an inversely proportional behavior between PM10 concentrations and the analyzed ratio in the summer season. This behavior can be explained by a more pronounced decrease in PM2.5 concentrations in the warm season, most likely due to the absence of combustion sources (such as residential heating), but also due to a more efficient atmospheric dispersion.
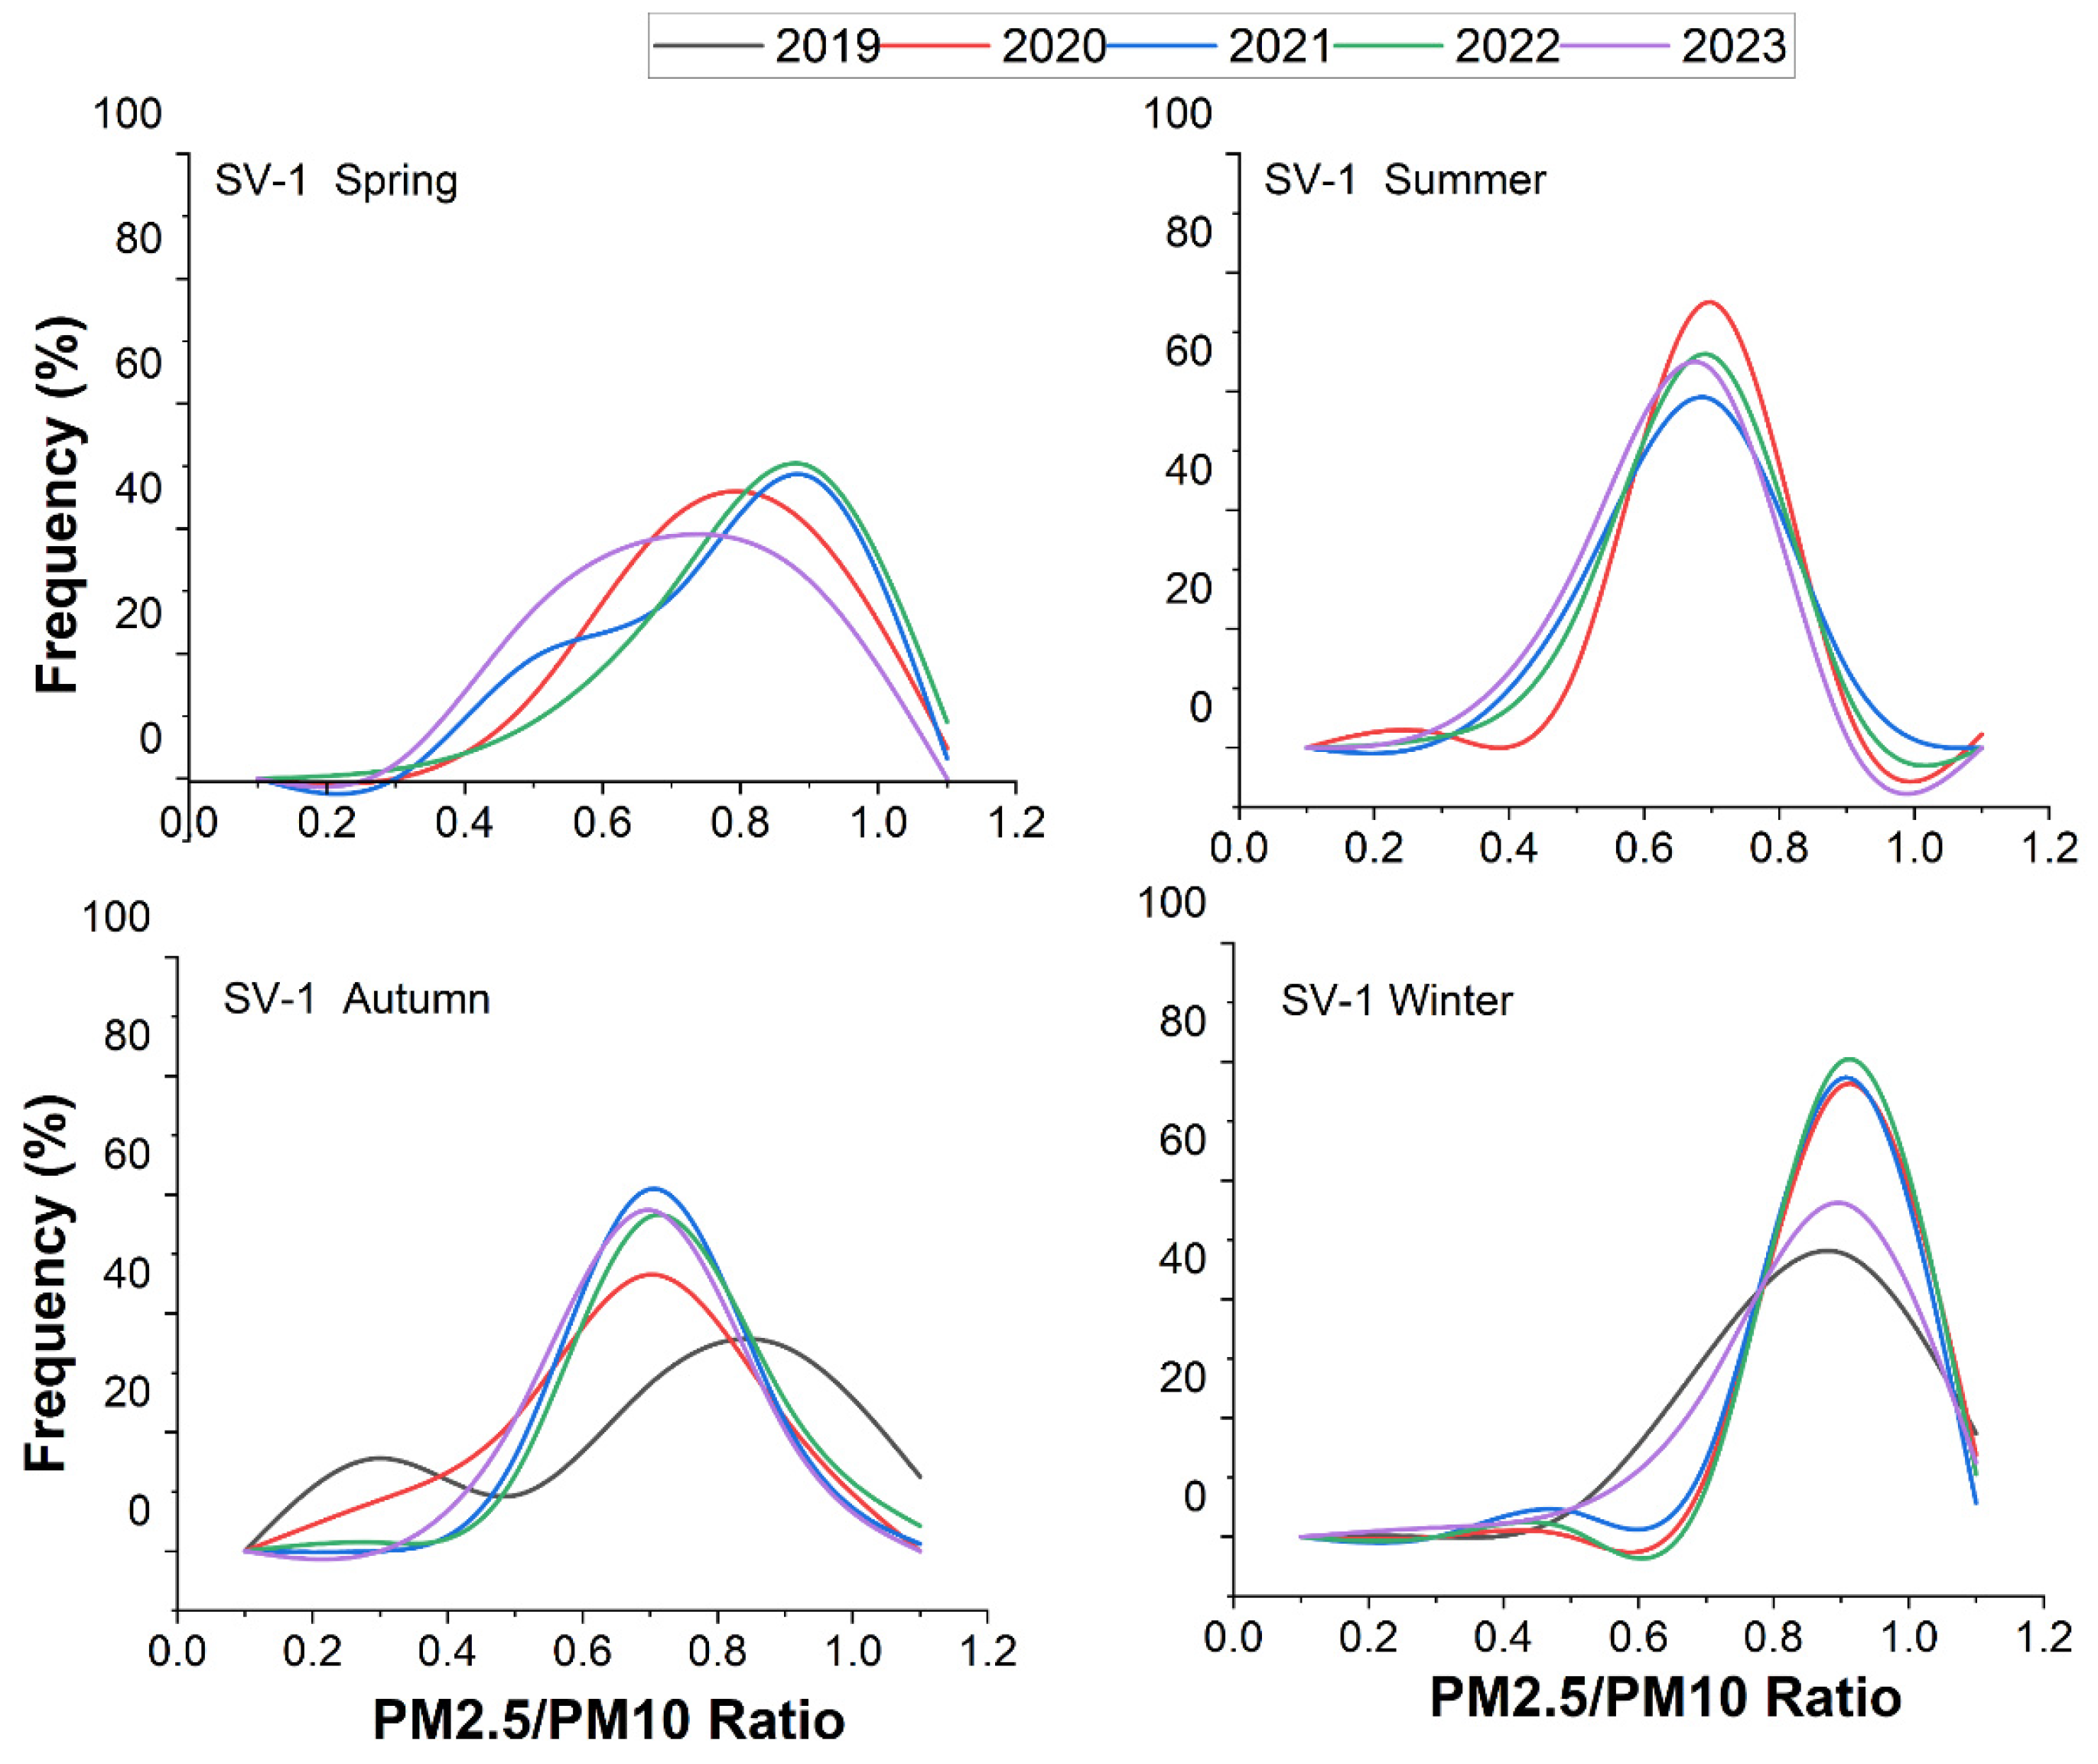
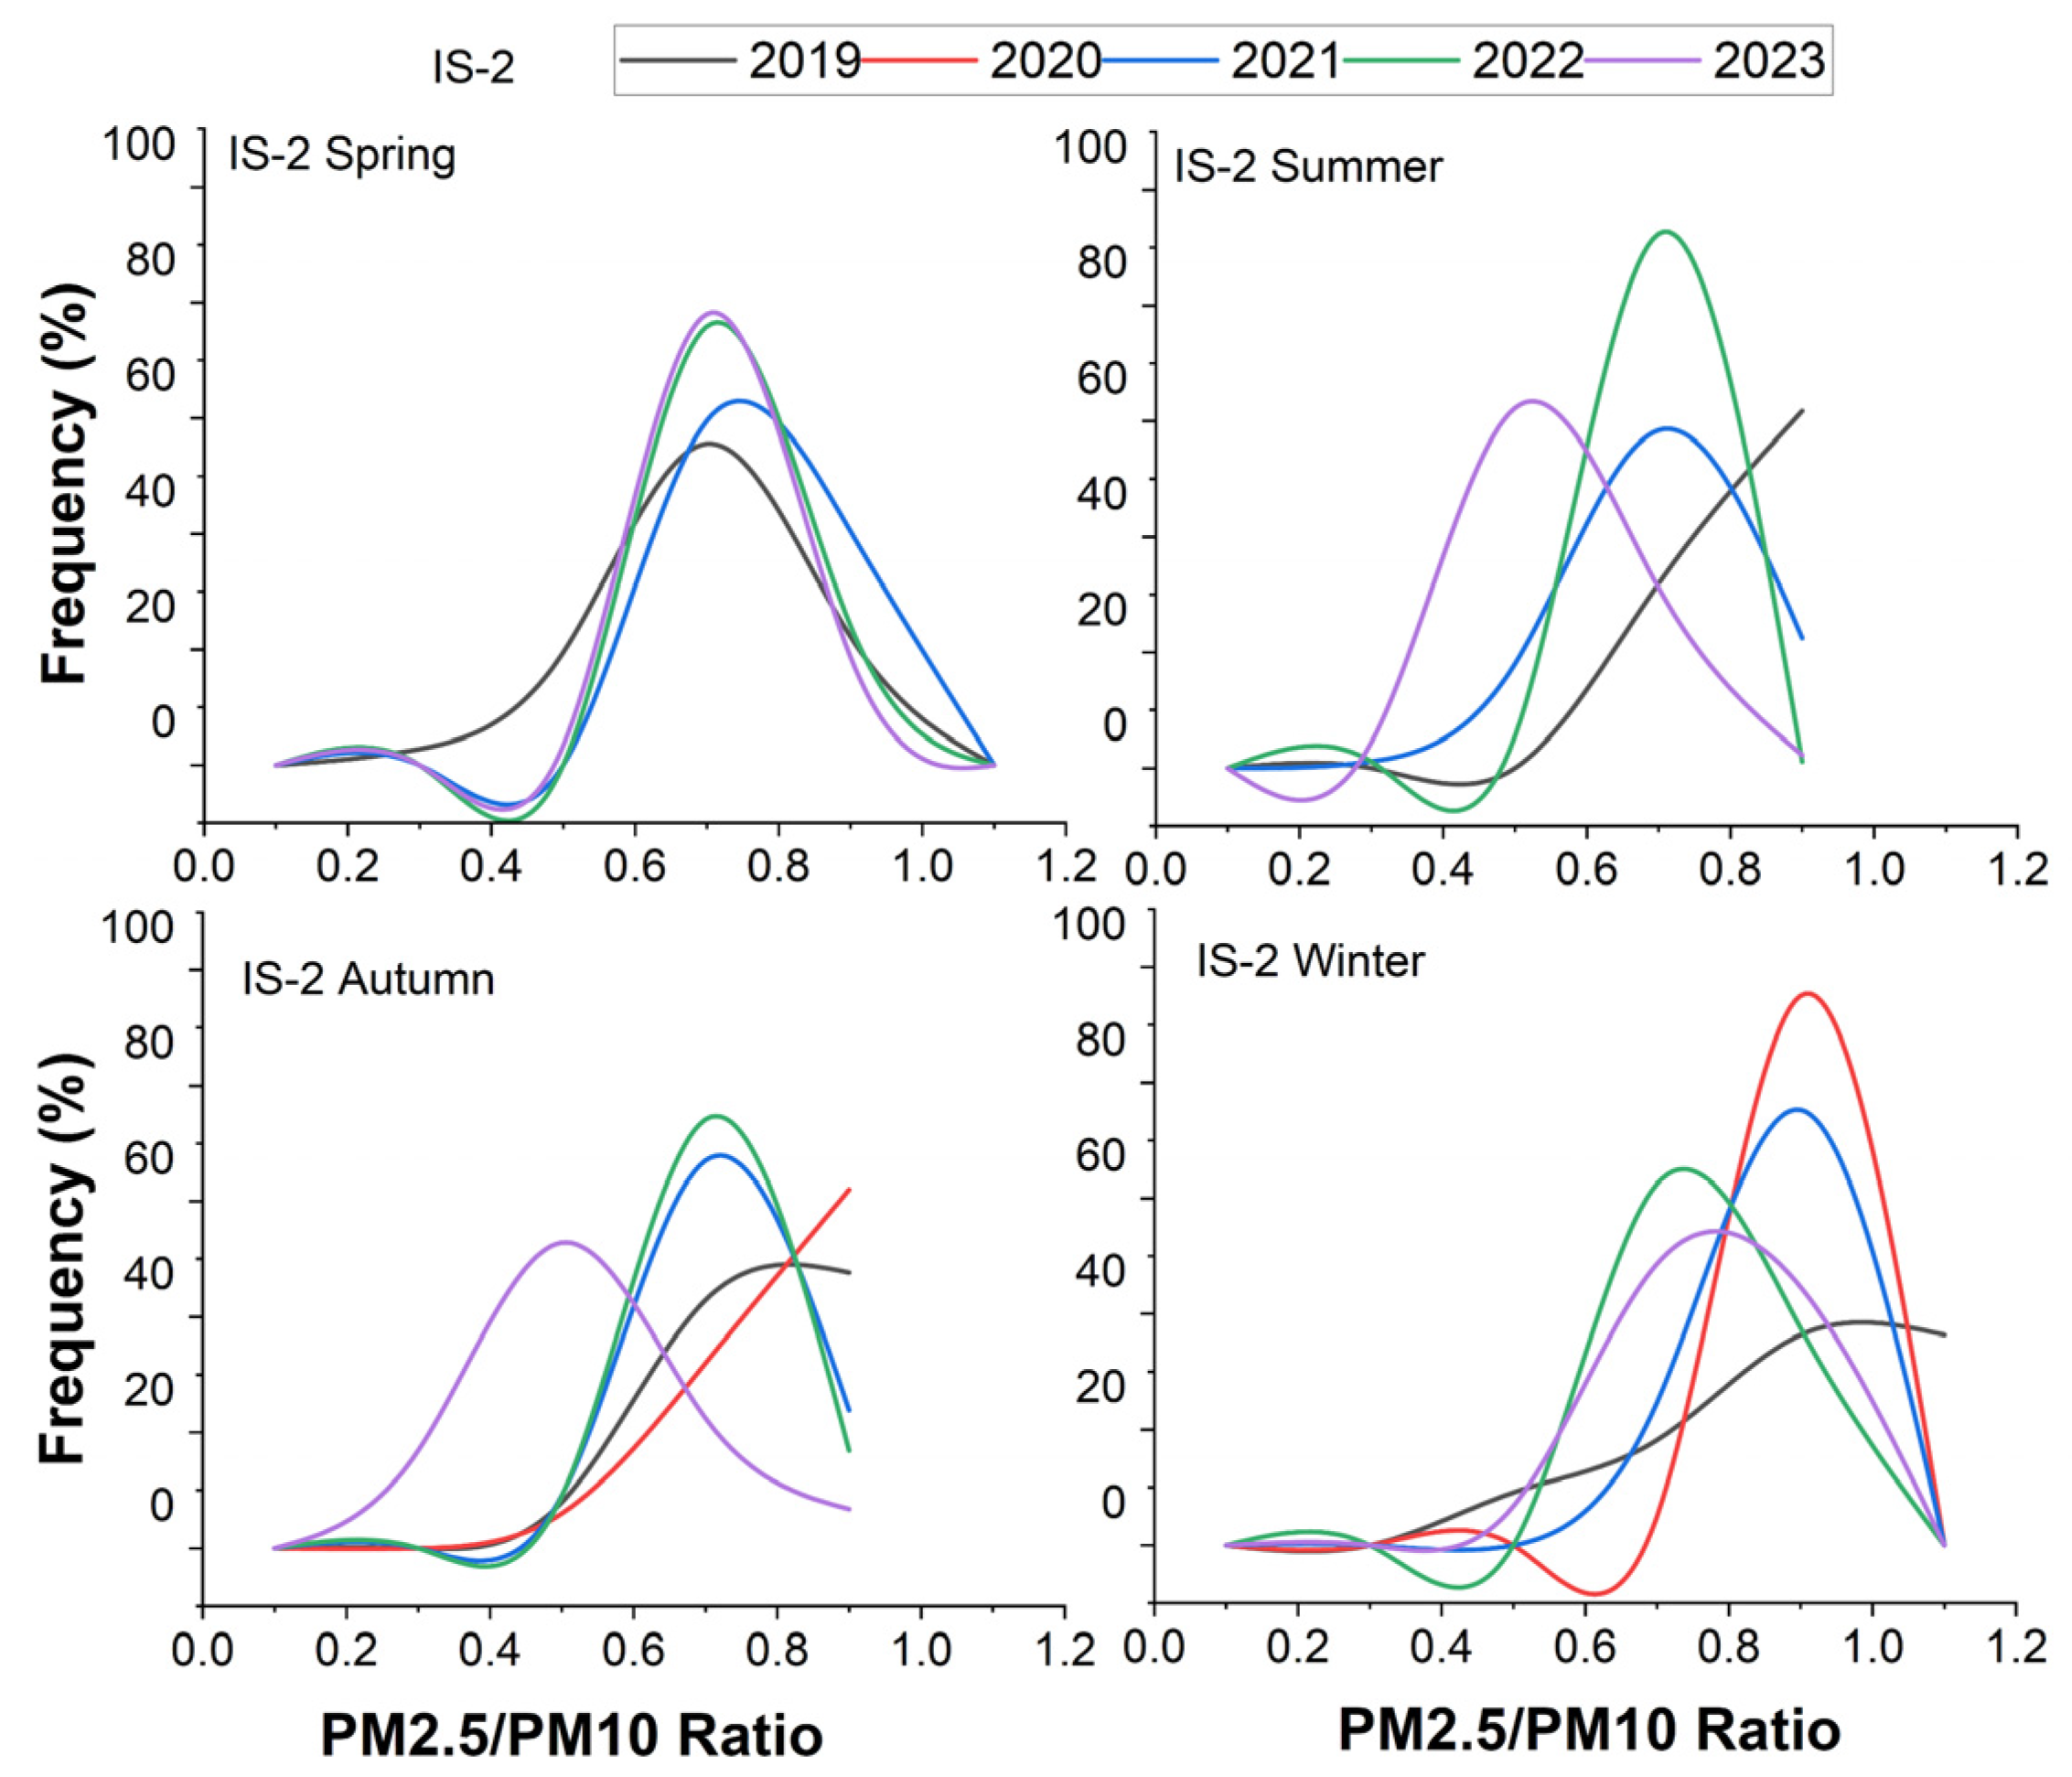
- In 2023, the PM2.5/PM10 ratios with values ≤ 0.5 were in the following proportions: 6.3% in winter, 29.4% in spring, and 34.5% in summer, increasing the frequency of these ratios compared to previous years. This trend indicates an increase in emissions from natural sources. In the autumn season, there was a significant increase in the frequency of PM2.5/PM10 ratios ≤ 0.5 in 2020 (31%), followed by a decrease from 2021 to 2023, reaching 22.2% in 2023.
- In the winters of 2020–2022, the frequency of PM2.5/PM10 ratios above 0.7 ranged from 75.9% to 80%, decreasing to 56.3% in 2023. In the winters of 2021 and 2022, an increase in high ratios (0.7–0.9) was observed despite a slight decrease in PM2.5 concentrations, suggesting that the variations in ratios are independent of PM2.5 trends.
- In the autumn season, the lowest frequency of ratios > 0.5 (69%) occurred in 2020, followed by slight increases in 2021 (84%) and 2022 (86%).
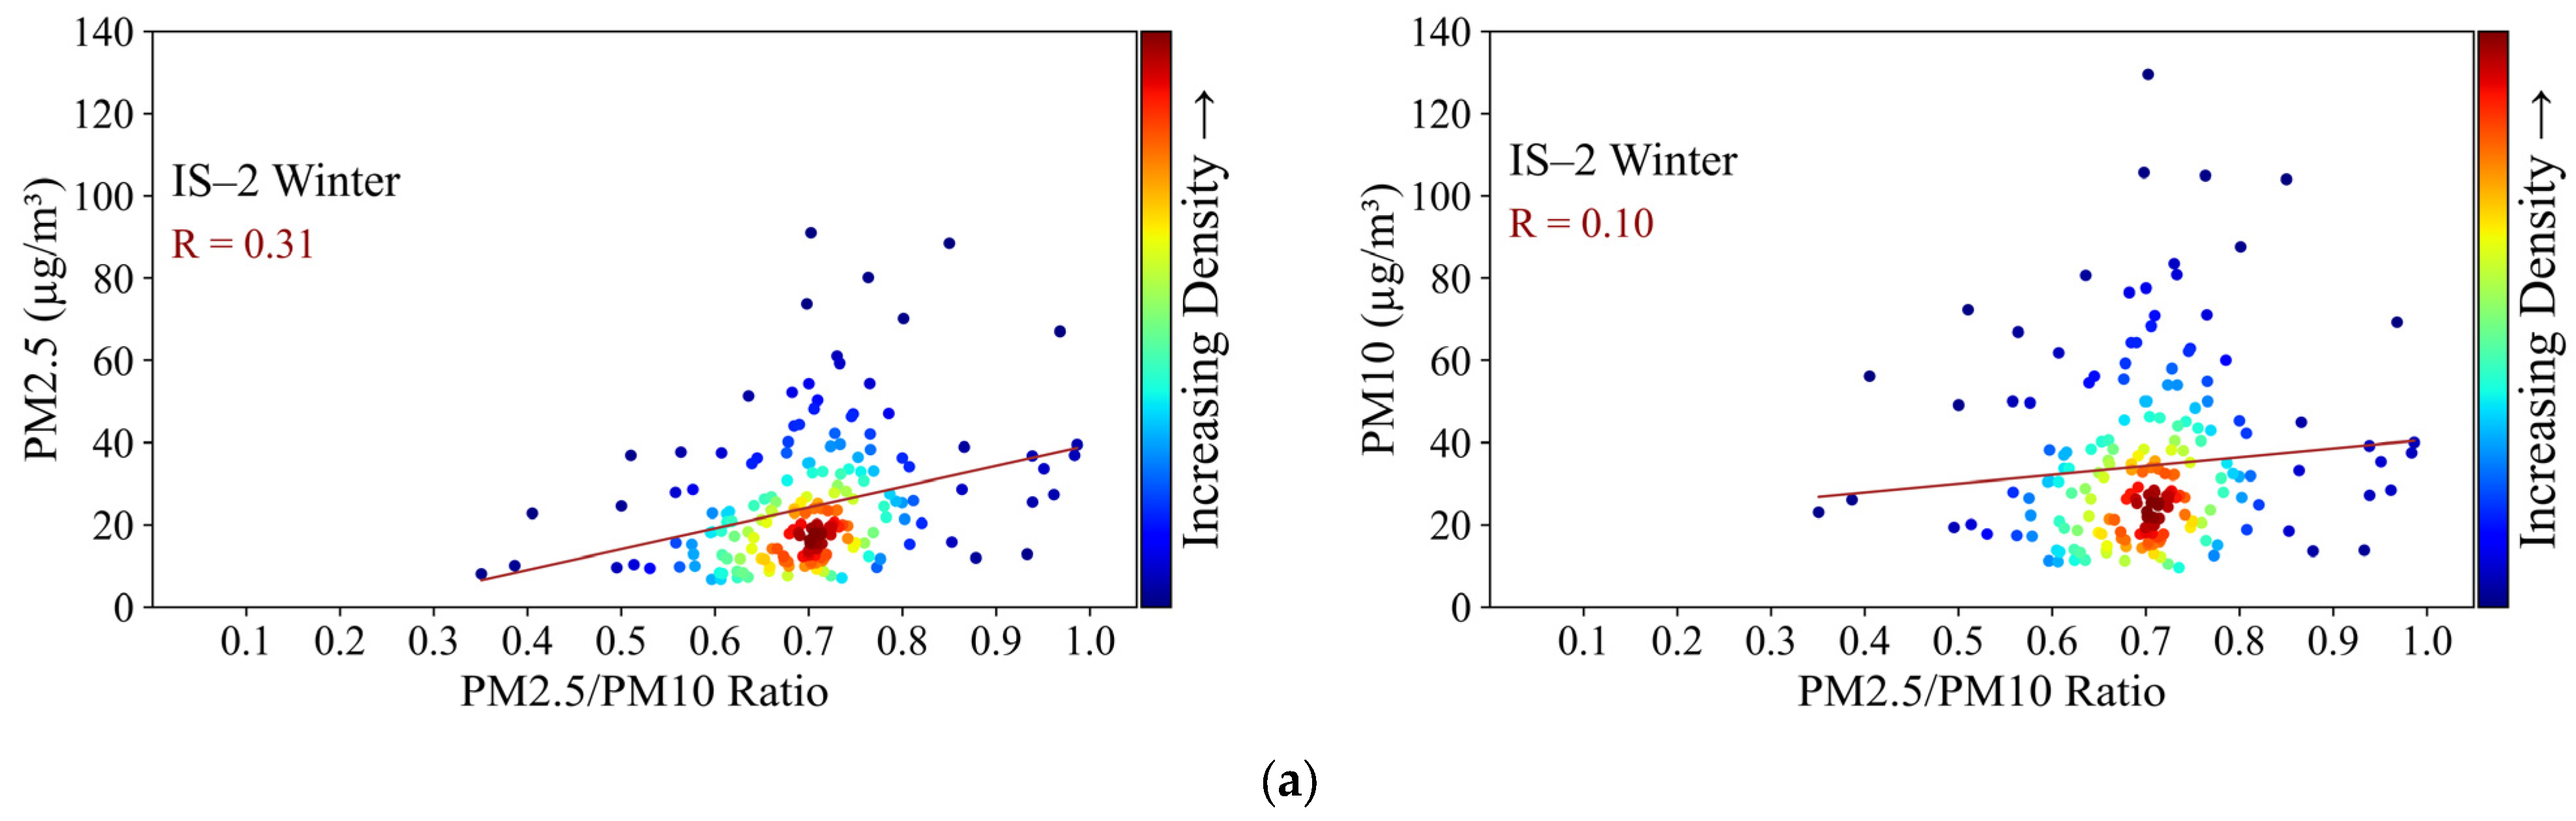
- During the winter, most of the PM2.5/PM10 ratios are in the range of 0.65–0.75, determined by PM2.5 concentrations with peaks of around 20 μg/m3. The emission sources for these concentrations are anthropogenic in origin and different in composition from Suceava, which shows lower ratios. As the PM2.5/PM10 ratio increases, the PM2.5 concentrations increase proportionally, reaching a maximum slope of 50.4 μg/m3. The relationship between the increase in the ratio and PM2.5 concentrations is confirmed by R = 0.31.
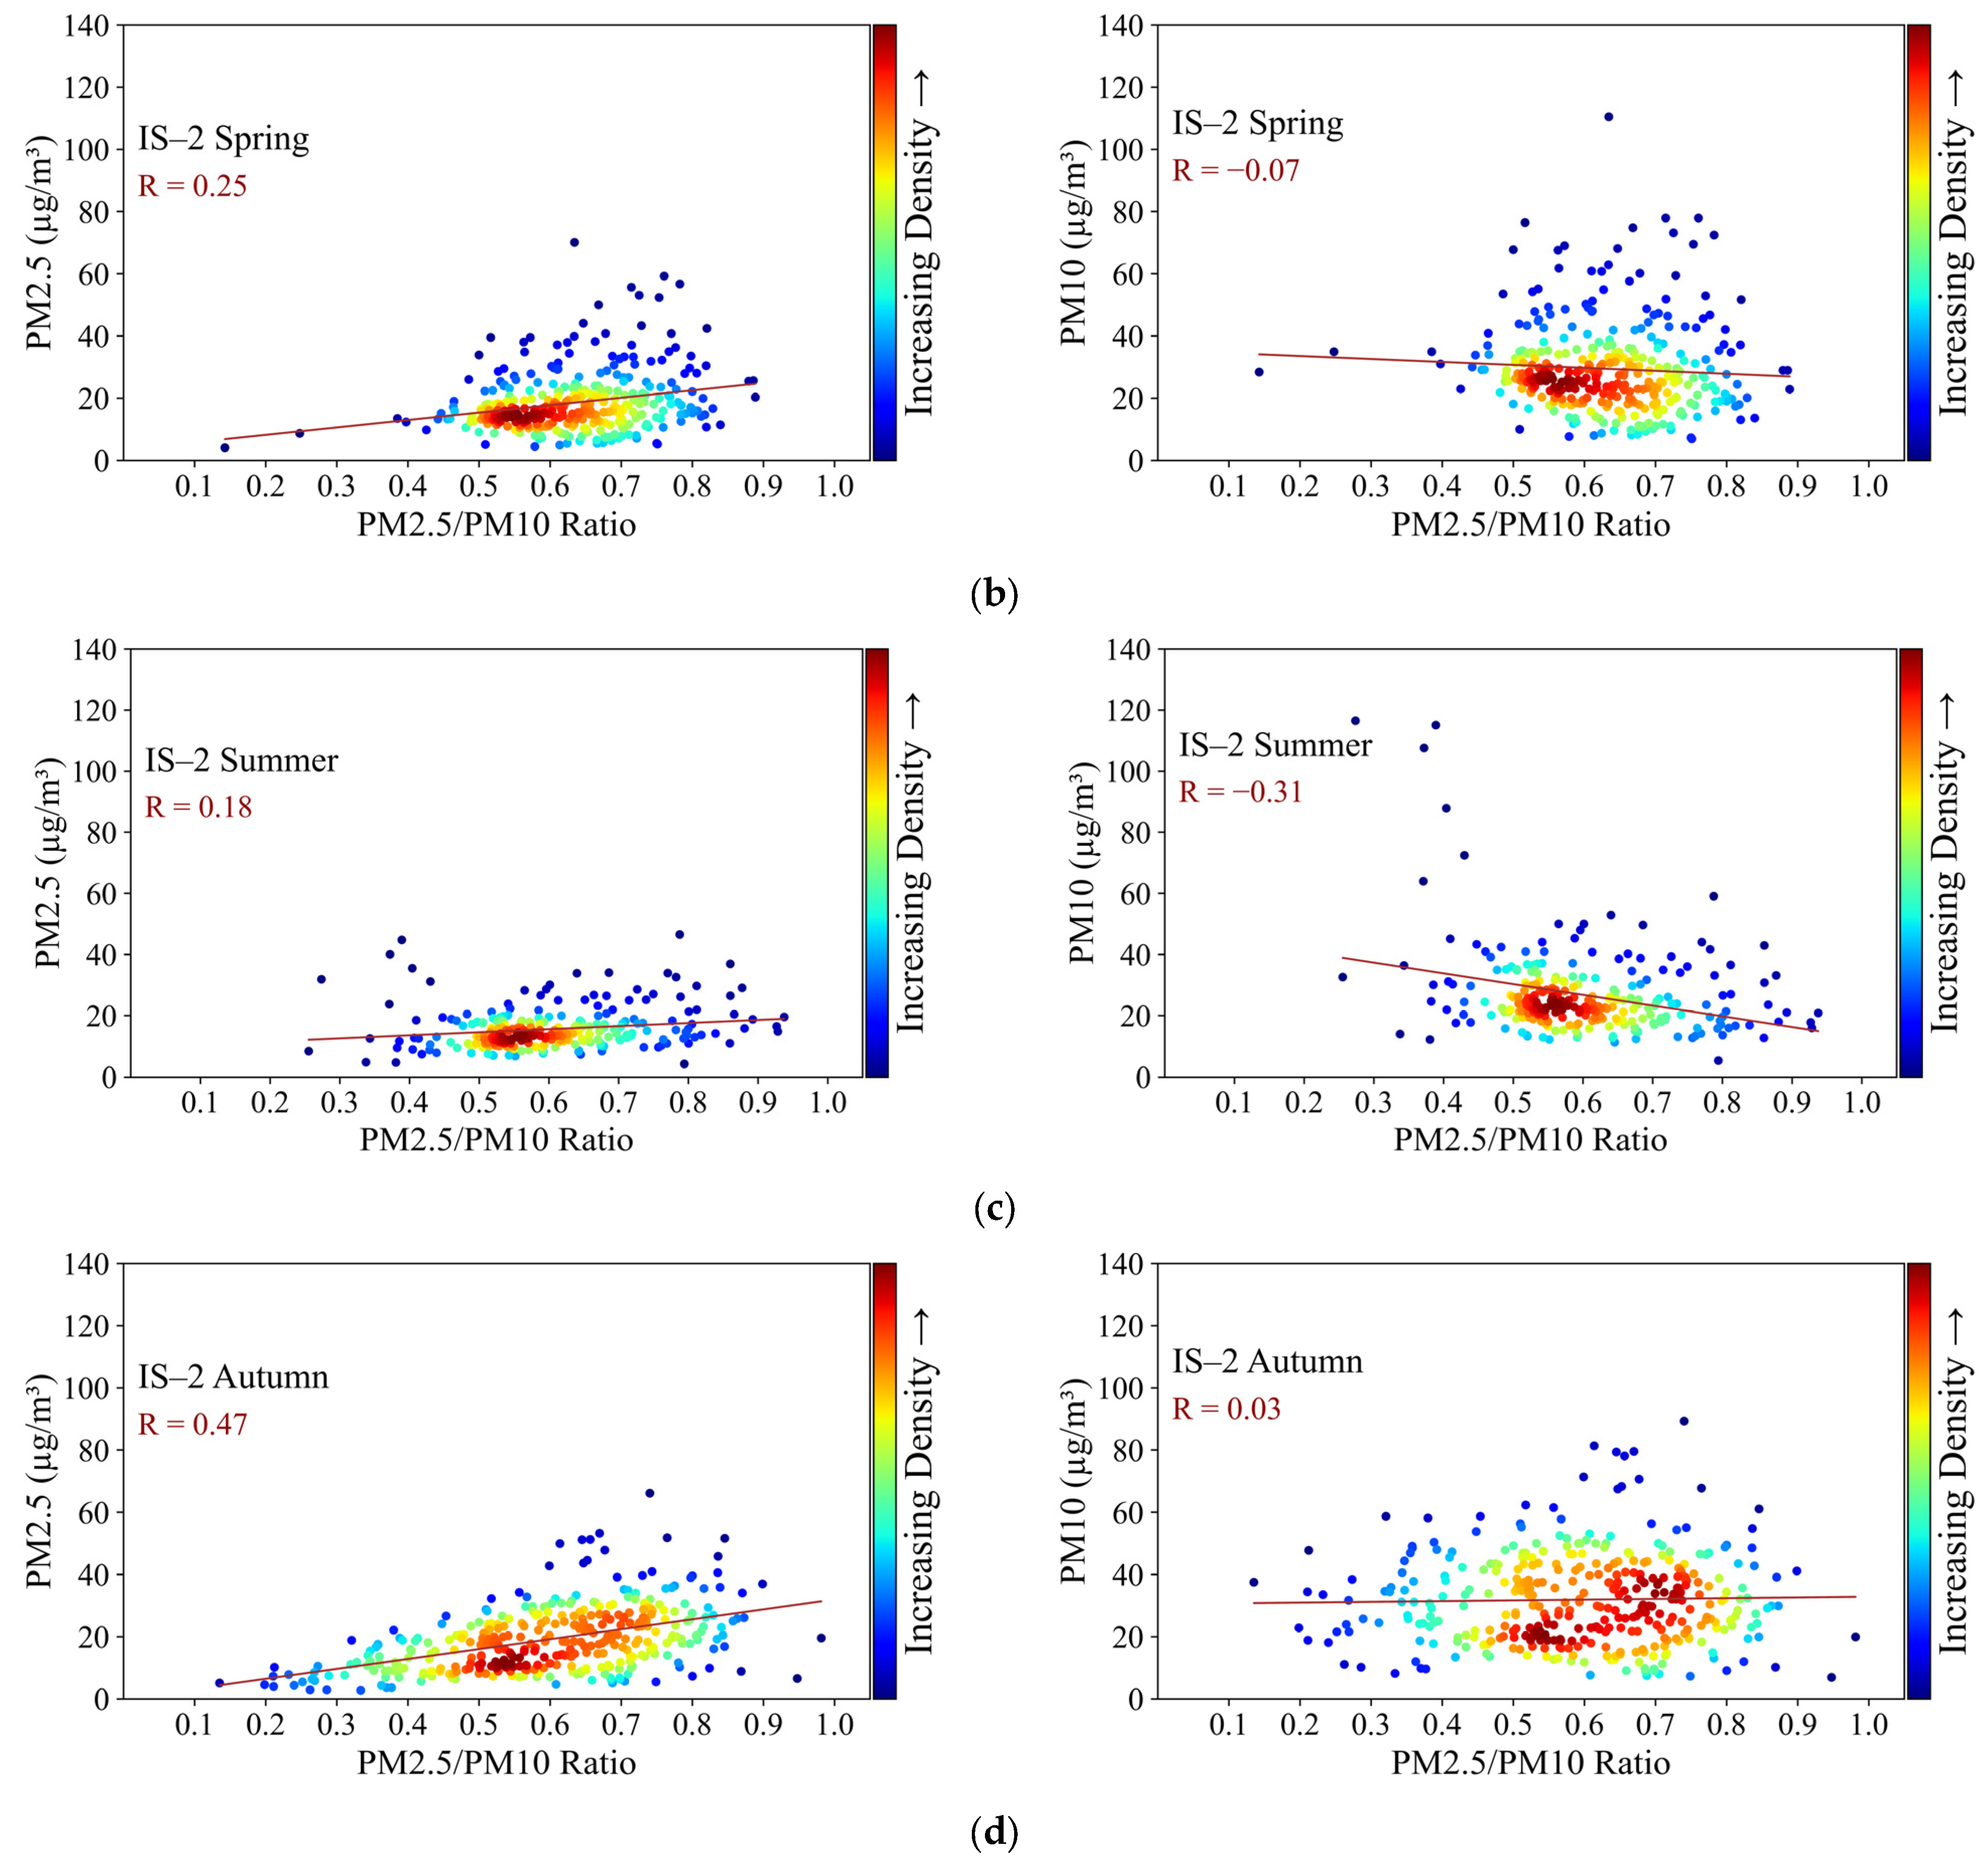
- In spring and autumn, most PM2.5/PM10 ratios are in the range of 0.5–0.65 and are influenced by PM2.5 concentrations with maxima of about 15 μg/m3. During these periods, anthropogenic emission sources are lower than in the winter season. The increase in the PM2.5/PM10 ratio is directly proportional to the increase in PM2.5 concentrations (R = 0.25 in spring and R = 0.47 in autumn).
- In summer, most ratios are in the range 0.5–0.6 and the correlation between PM2.5 and PM2.5/PM10 ratios decreases significantly (R = 0.18), which confirms the reduction of anthropogenic fine particle emissions in this season. The high negative R between PM10 and PM2.5/PM10 (R = −0.31) suggests an inversely proportional behavior between PM10 concentrations and the PM2.5/PM10 ratio. This behavior can be explained by a more pronounced decrease in PM2.5 concentrations in the warm season, most likely due to the absence of combustion sources (such as residential heating), but also due to more efficient atmospheric dispersion.
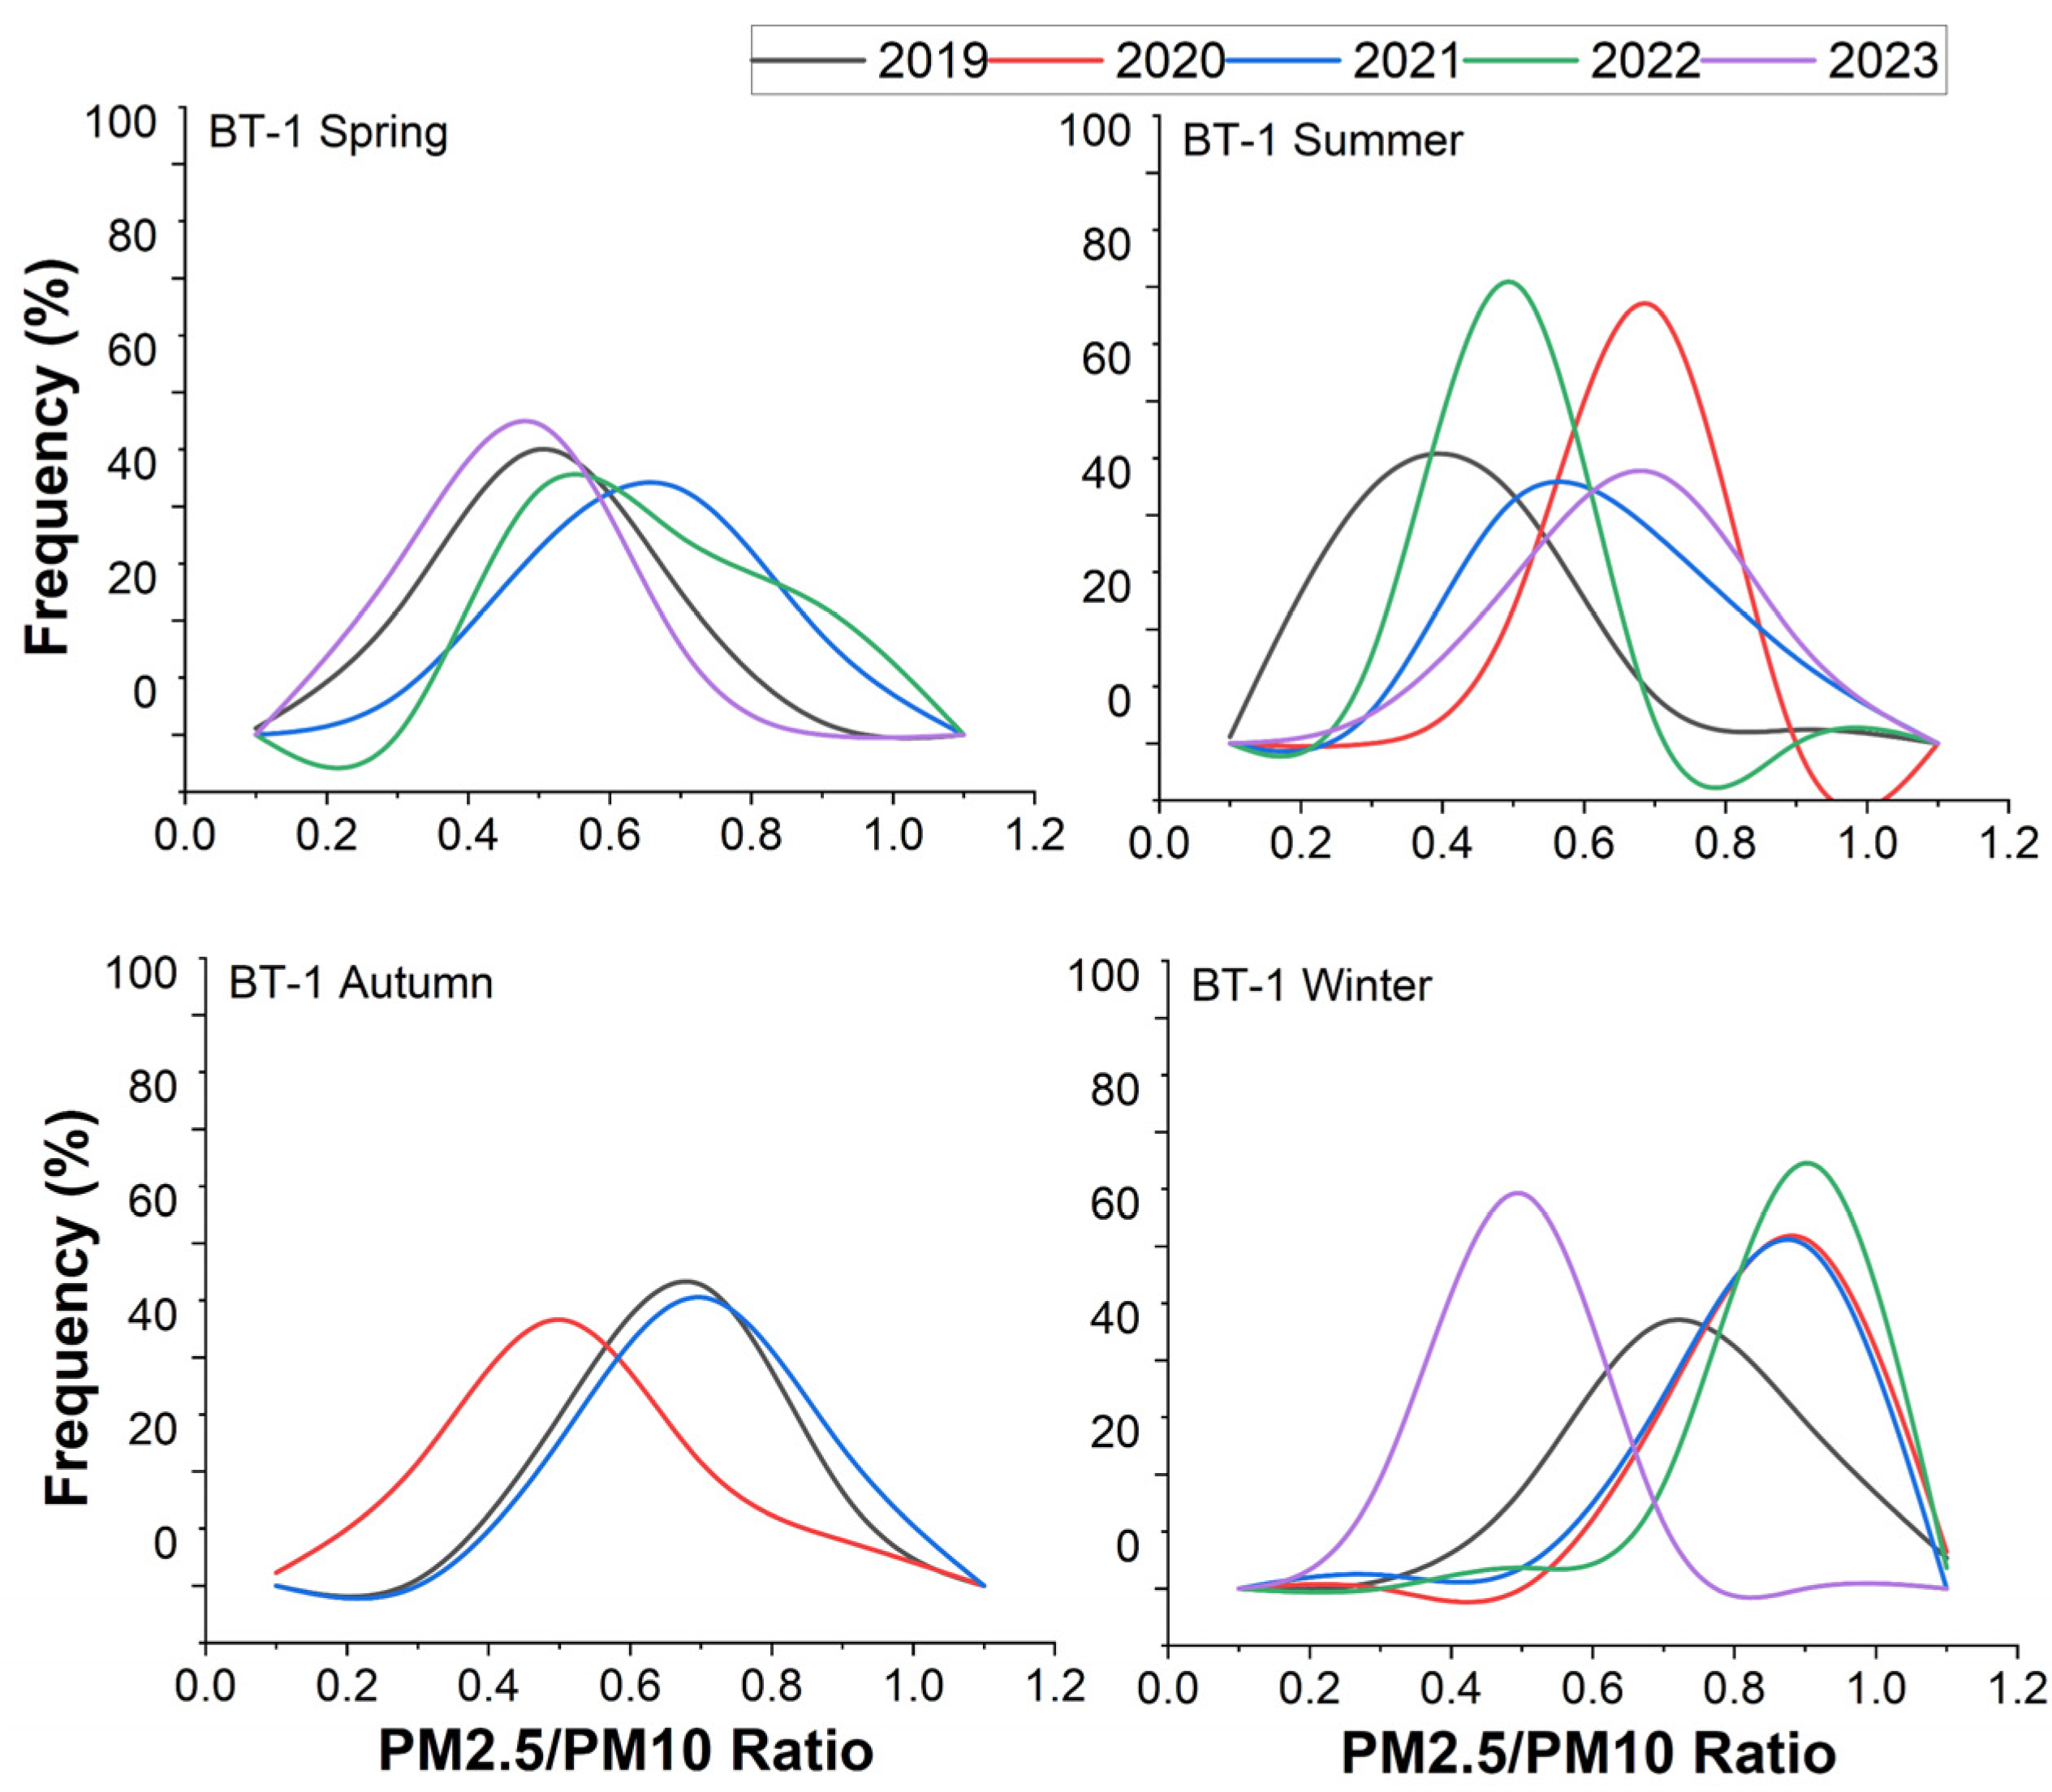
- In winter, the PM2.5/PM10 ratios are generally higher than 0.5, with small exceptions: 9.1% of the 2019 and 6.8% of the 2023 PM2.5/PM10 ratios are in the range of 0.3–0.5. During 2020–2022, PM2.5/PM10 ratios higher than 0.7 were observed in proportions ranging from 37.5% to 95%, indicating a different particle composition compared to that in Suceava.
- In spring, PM2.5/PM10 ratios with values ≤ 0.5 were observed, accounting for 22.2% in 2019 and only 3.3% in 2023.
- In summer, natural sources contribute the most (66.7% of the PM2.5/PM10 ratios are less than 0.5) in 2023. Data for summer 2020 could not be processed due to a lack of data.
- In autumn, anthropogenic sources seem to contribute significantly in 2019–2022. In 2023, the contribution decreases to 29.2%.
- PM10 concentrations and PM2.5/PM10 ratios have a non-significant correlation in spring (R = 0.04) or negative correlation in summer (R = −0.32).
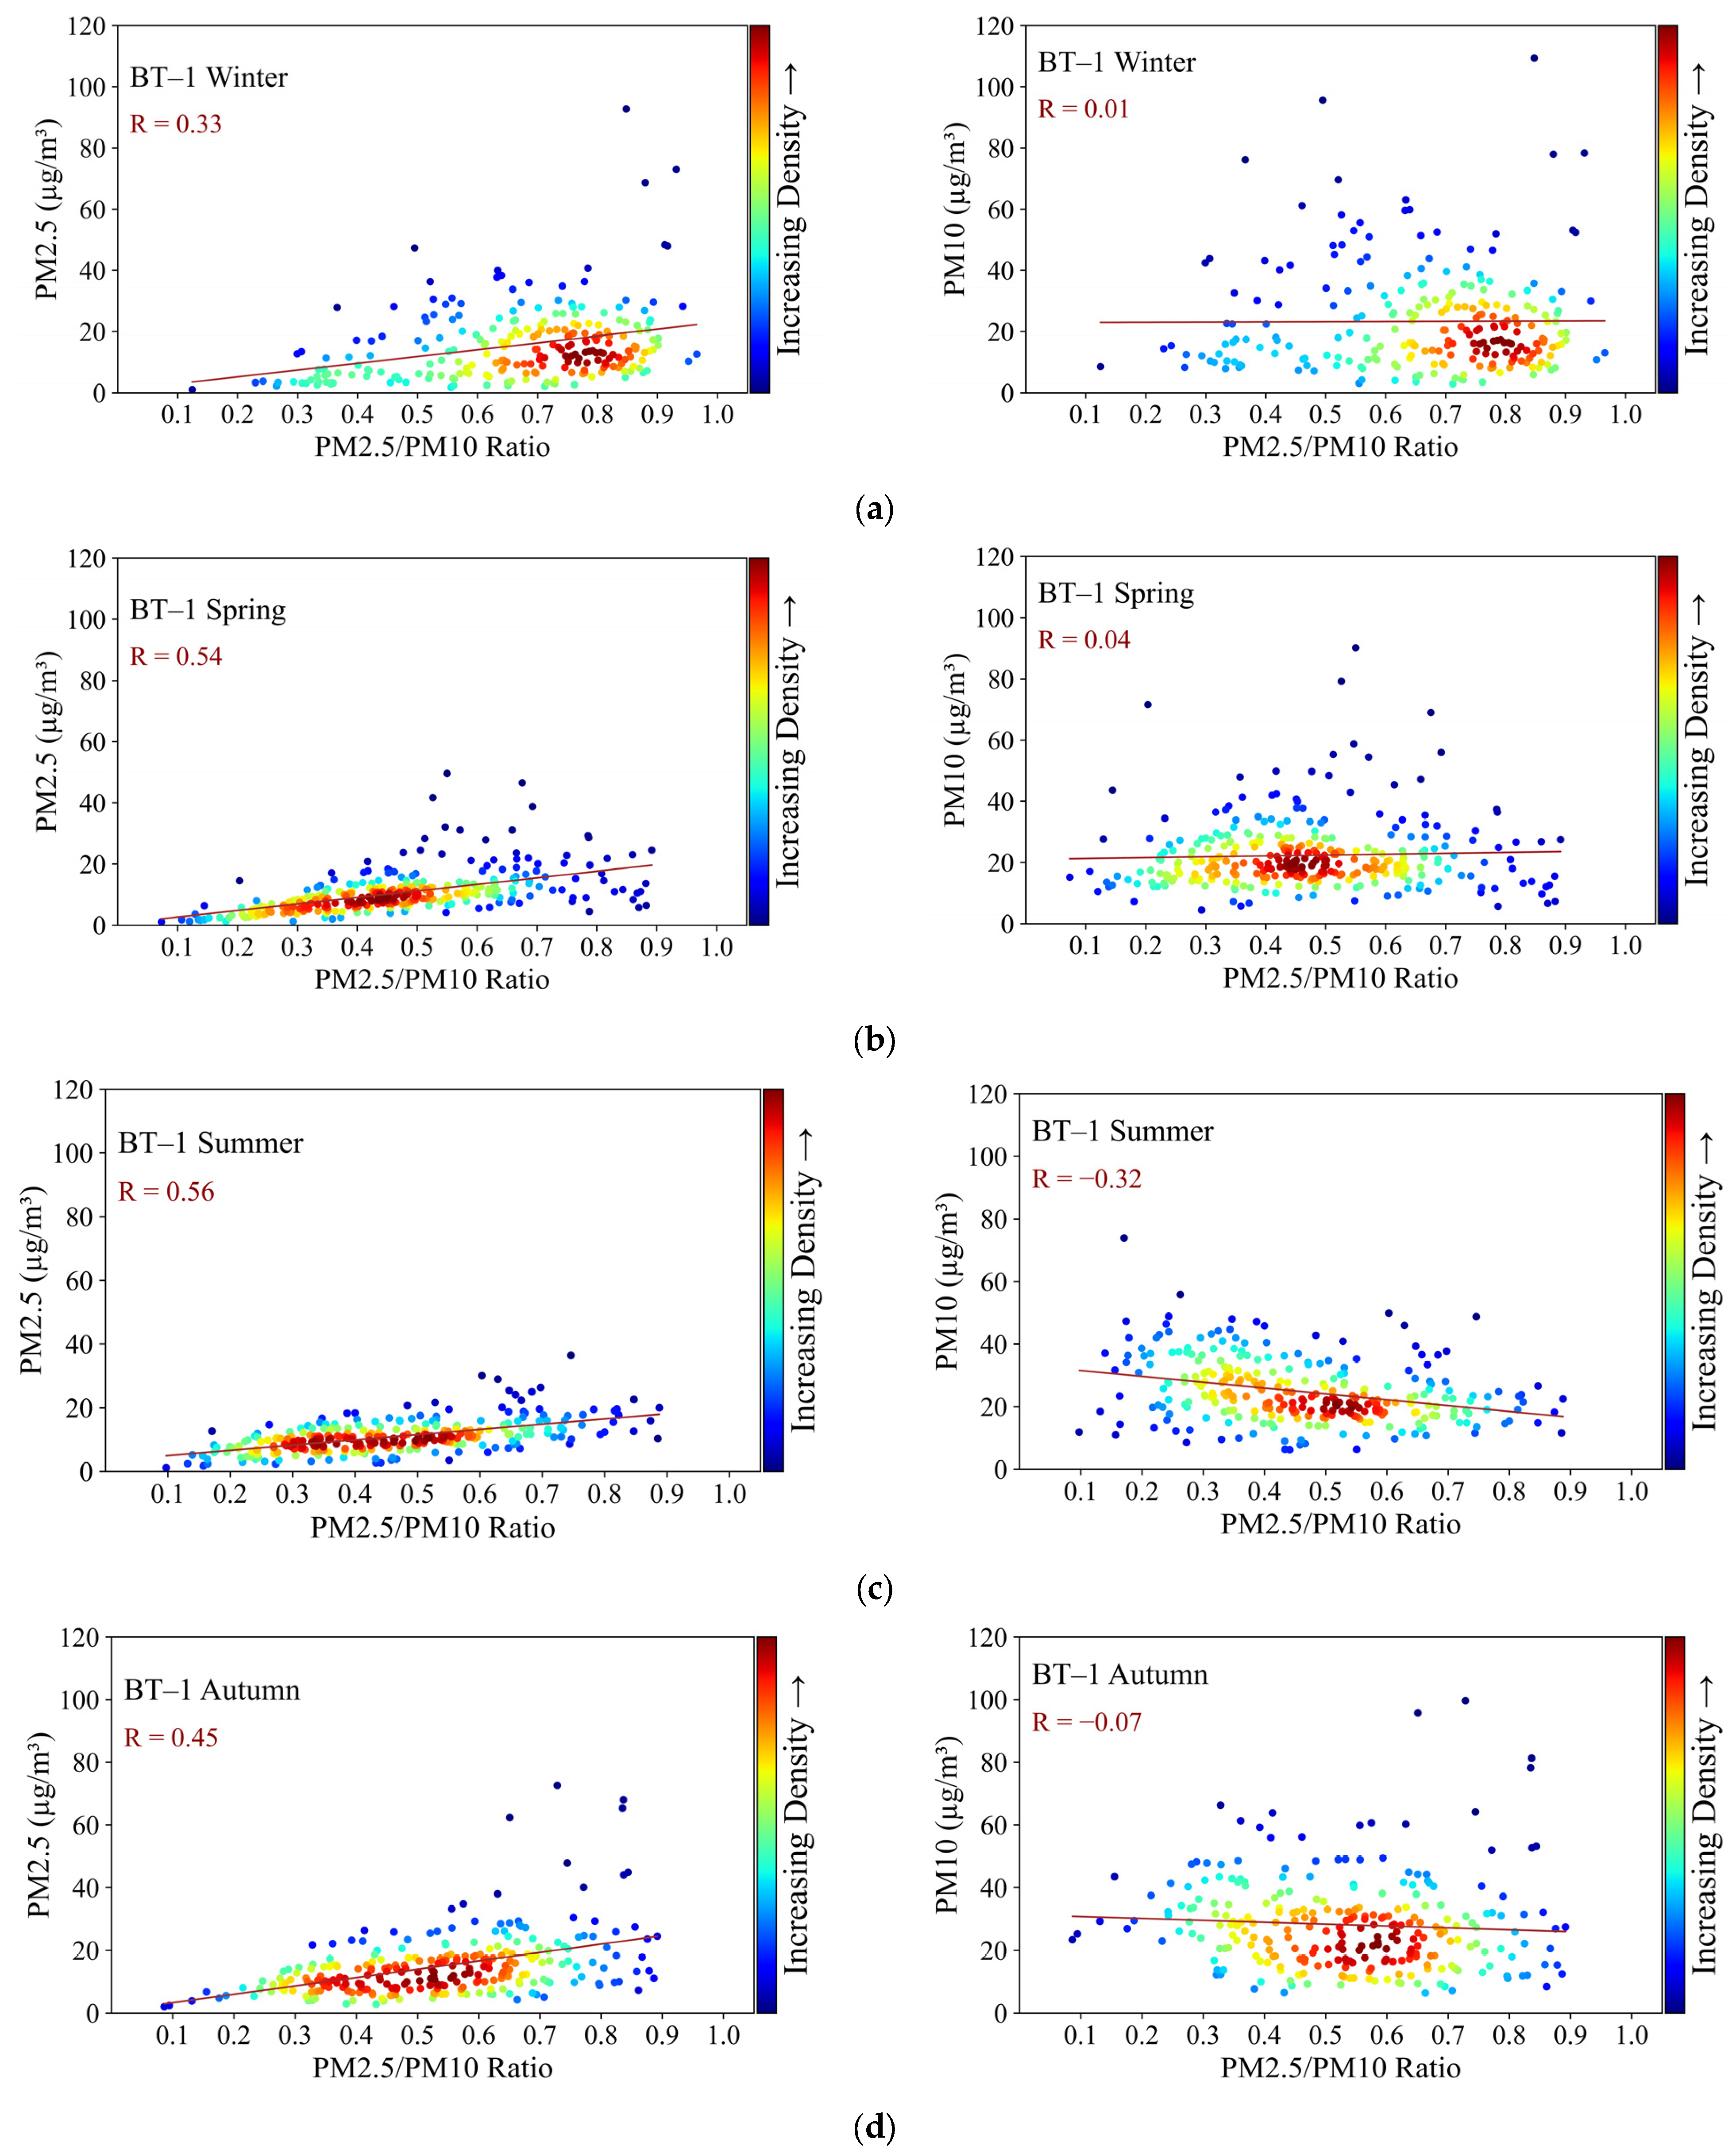
- During the winter season, most PM2.5/PM10 ratios fall within the range of 0.65–0.85 due to PM2.5 concentrations around 10 μg/m3, suggesting that these concentrations originate from anthropogenic sources. As PM2.5/PM10 ratio values increase, PM2.5 concentrations rise with a slope of 22.2 μg/m3. The increase in the PM2.5/PM10 ratio is directly proportional to the increase in PM2.5 concentrations (R = 0.33).
- In spring and autumn, most PM2.5/PM10 ratios range between 0.3–0.65 due to PM2.5 concentrations with maxima of 20 μg/m3. The anthropogenic emission sources are lower compared to the winter season and differ from the Suceava sources and from the Iasi sources. In these two seasons are also ratio values ≤ 0.5, indicating the presence of emissions from natural sources. The increase in the PM2.5/PM10 ratio is directly proportional to the increase in the PM2.5 concentrations, with R = 0.54 in spring and R = 0.45 in autumn.
- In summer, a different behavior is observed compared to other urban areas, with a much stronger correlation between PM2.5 concentrations and the PM2.5/PM10 ratio (R = 0.56). Most of the ratios are in the range of 0.3–0.6, confirming the presence of both anthropogenic and natural emissions during this season.
- In winter, the frequency of PM2.5/PM10 ratio values ≤ 0.5 increased significantly in 2023, reaching 88.5%, compared to previous years.
- In the spring of 2023, 84.4% of the PM2.5/PM10 ratios were below 0.5, marking a significant increase from 42.9% in spring 2022.
- In the summer of 2022, there was a significant increase in the distribution of PM2.5/PM10 ratios, with a contribution of 96.2%, followed by a decrease in 2023, with a contribution of 34.2%. This suggests an increase in anthropogenic emissions in the summer of 2023. Data for the spring 2020 season were not available.
- The number of PM2.5/PM10 ratios above 0.5 was highest in the winters of 2019–2022. However, this number decreased significantly in the winter of 2023 (11.5% in 2023 compared to 81.3% in 2019). In the summer of 2022, the distribution of PM2.5/PM10 ratios decreased significantly, but increased in 2023.
- In the autumn season, the number of PM2.5/PM10 ratios >0.5 increased in 2021 compared to 2020 (45.2%). Data were not available for the autumn seasons of 2022 and 2023.
- Both trends indicate that the higher PM2.5 contribution of PM2.5 from PM10 is lowest in 2023 in the spring and winter seasons. Analysis of the data shows that anthropogenic emission sources in these seasons are highest in 2020–2022. A comparison of these data with county emission inventories is useful to confirm this phenomenon.
3.3. Spatial Variations of PM2.5/PM10 Ratios
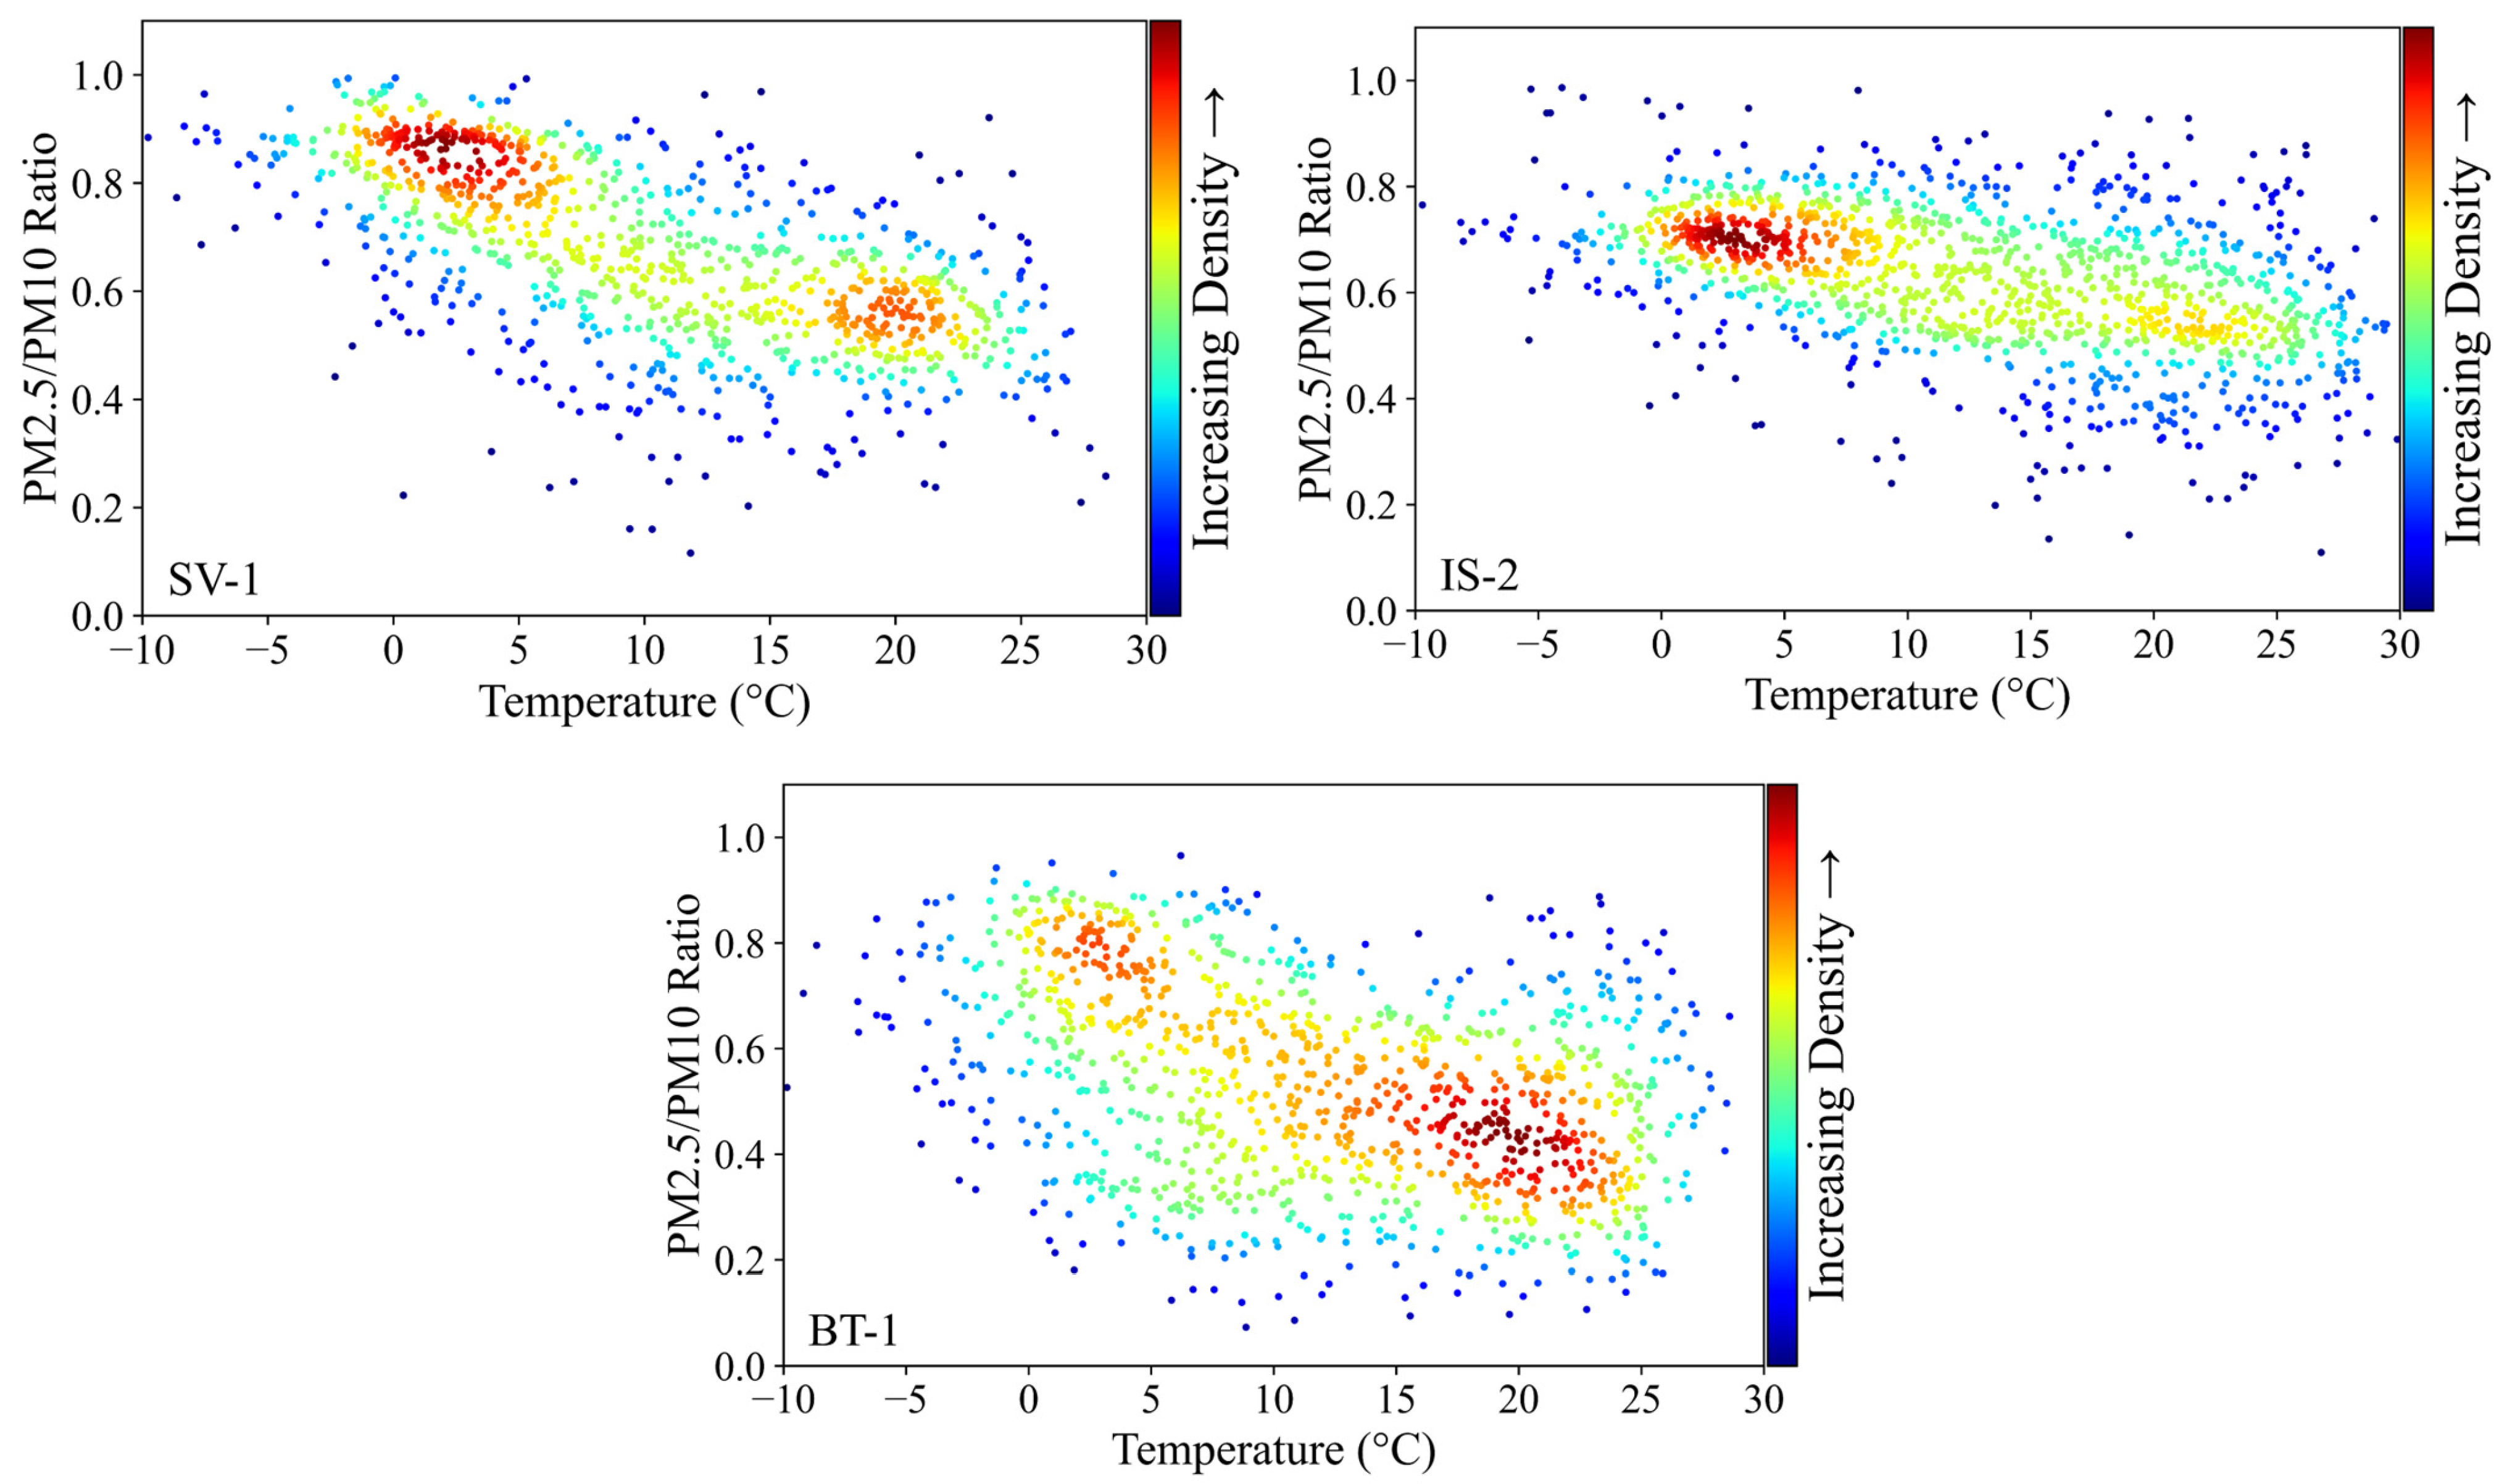
3.4. Distribution of PM2.5/PM10 Ratios in Relation to Temperature
- PM2.5/PM10 ratios with the highest values in Suceava (0.9) and Botoșani (0.7–0.9) are most often found on days with temperatures between 0–5 °C.
- In Iasi, PM2.5/PM10 ratios in the range of 0.7–0.75 are frequent on days with temperatures between 0–2.5 °C.
- An increase in PM concentrations up to a temperature of 5 °C followed by a decrease was observed by Czarnecki et al. This phenomenon emphasizes the role of anthropogenic activities, especially the combustion of fuels for residential heating, during periods of low temperatures [41].
- In Botoșani, PM2.5/PM10 ratios with values between 0.3–0.5 are frequent, showing the predominance of coarse particles recorded at temperatures around 20 °C.
4. Conclusions
- The analyzed statistical parameters for PM10 and PM2.5 concentrations indicate an improvement in air quality, reflected by lower values in 2023 compared to 2019 in all three urban areas.
- The PM2.5/PM10 ratios decreased, but not with the same trend as the PM10 and PM2.5 concentrations.
- The PM2.5/PM10 ratios varied from year to year and between different areas, ranging from 0.48 to 0.61 at BT-1, from 0.54 to 0.72 at IS-2, and from 0.60 to 0.71 at SV-1.
- Seasonally, the PM2.5/PM10 ratio was highest in winter in Suceava, where biomass heating is used, followed by Iasi and Botoșani, correlating with low temperatures and high PM2.5 concentrations. In Suceava, most of the PM2.5/PM10 ratios in winter showed that 80–90% of PM10 originated from PM2.5, compared to 65–75% in Iasi and 65–85% in Botosani.
- The highest PM2.5/PM10 ratios were recorded in the colder months of the year at temperatures between 0–5 °C in Suceava and Botosani and 0–2.5 °C in Iasi.
- In summer, most of the PM2.5/PM10 ratios are in the range 0.5–0.6 in Suceava and Iasi, and 0.3–0.6 in Botosani, which confirms the reduction of anthropogenic emissions during this season.
- The analysis of the distribution of PM2.5/PM10 ratios per season of each year led to a better understanding of the origin of PM in the studied areas. Thus, the lowest PM2.5/PM10 ratios were recorded in summer, except for Botosani, where increases were observed in summer 2023, showing the influence of anthropogenic emissions. Also, the distribution of PM2.5/PM10 ratios showed lower proportions of PM2.5 in PM10 in 2023 compared to 2020–2022, thereby showing an improvement of air quality in terms of PM2.5.
- The analysis of the spatial variation of the PM2.5/PM10 ratios showed differences between the three urban areas. The largest differences were observed between Botosani and Iasi.
Supplementary Materials
Author Contributions
Funding
Institutional Review Board Statement
Informed Consent Statement
Data Availability Statement
Acknowledgments
Conflicts of Interest
References
- World Health Organization. Air Quality Guidelines. Global Update 2005. Available online: https://www.who.int/publications/i/item/WHO-SDE-PHE-OEH-06.02 (accessed on 4 September 2024).
- European Environment Agency. EMEP/EEA Air Pollutant Emission Inventory Guidebook 2023. Available online: https://www.eea.europa.eu/en/analysis/publications/emep-eea-guidebook-2023 (accessed on 14 August 2024).
- Agenția Națională Pentru Protecția Mediului. Raport Anual Privind Starea Mediului în România, Anul 2022. Available online: https://www.anpm.ro/documents/12220/2209838/RSM+2022.pdf (accessed on 10 August 2024).
- Bera, B.; Bhattacharjee, S.; Sengupta, N.; Saha, S. Variation and dispersal of PM10 and PM2.5 during COVID-19 lockdown over Kolkata metropolitan city, India investigated through HYSPLIT model. Geosci. Front. 2022, 13, 101291. [Google Scholar] [CrossRef] [PubMed]
- Zoran, M.A.; Savastru, R.S.; Savastru, D.M.; Tautan, M.N. Assessing the relationship between surface levels of PM2.5 and PM10 particulate matter impact on COVID-19 in Milan, Italy. Sci. Total Environ. 2020, 738, 139825. [Google Scholar] [CrossRef]
- Pražnikar, Z.J.; Pražnikar, J. The effects of particulate matter air pollution on respiratory health and on the cardiovascular system. Zdr. Varst. 2012, 51, 190–199. [Google Scholar] [CrossRef]
- Park, J.; Kim, H.J.; Lee, C.H.; Lee, C.H.; Lee, H.W. Impact of long-term exposure to ambient air pollution on the incidence of chronic obstructive pulmonary disease: A systematic review and meta-analysis. Environ. Res. 2021, 194, 110703. [Google Scholar] [CrossRef] [PubMed]
- Miller, M.R. The cardiovascular effects of air pollution: Prevention and reversal by pharmacological agents. Pharmacol. Ther. 2022, 232, 107996. [Google Scholar] [CrossRef]
- Delfino, R.J.; Brummel, S.; Wu, J.; Stern, H.; Ostro, B.; Lipsett, M.; Winer, A.; Street, D.H.; Zhang, L.; Tjoa, T.; et al. The relationship of respiratory and cardiovascular hospital admissions to the southern California wildfires of 2003. Occup. Environ. Med. 2009, 66, 189–197. [Google Scholar] [CrossRef]
- Taj, T.; Poulsen, A.H.; Ketzel, M.; Geels, C.; Brandt, J.; Christensen, J.H.; Puett, R.; Hvidtfeldt, U.A.; Sørensen, M.; Raaschou-Nielsen, O. Exposure to PM2.5 constituents and risk of adult leukemia in Denmark: A population-based case–control study. Environ. Res. 2021, 196, 110418. [Google Scholar] [CrossRef]
- Bamola, S.; Goswami, G.; Dewan, S.; Goyal, I.; Agarwal, M.; Dhir, A.; Lakhani, A.L. Characterising temporal variability of PM2.5/PM10 ratio and its correlation with meteorological variables at a sub-urban site in the Taj City. Urban Clim. 2024, 53, 101763. [Google Scholar] [CrossRef]
- The European Parliament and the Council of the European Union. Directive (EU) 2008/50 of the European Parliament and of the Council of 21 May 2008 on Ambient Air Quality and Cleaner Air for Europe. Available online: https://eur-lex.europa.eu/eli/dir/2008/50/oj/eng (accessed on 16 September 2024).
- Xu, L.; Batterman, S.; Chen, F.; Li, J.; Zhong, X.; Feng, Y.; Rao, Q.; Chen, F. Spatiotemporal characteristics of PM2.5 and PM10 at urban and corresponding background sites in 23 cities in China. Sci. Total Environ. 2017, 599–600, 2074–2084. [Google Scholar] [CrossRef]
- Chu, H.J.; Huang, B.; Lin, C.Y. Modeling the spatio-temporal heterogeneity in the PM10-PM2.5 relationship. Atmos. Environ. 2015, 102, 176–182. [Google Scholar] [CrossRef]
- Munir, S. Analysing temporal trends in the ratios of PM2.5/PM10 in the UK. Aerosol Air Qual. Res. 2017, 17, 34–48. [Google Scholar] [CrossRef]
- Xu, G.; Jiao, L.; Zhang, B.; Zhao, S.; Yuan, M.; Gu, Y.; Liu, J.; Tang, X. Spatial and temporal variability of the PM2.5/PM10 ratio in Wuhan, Central China. Aerosol Air Qual. Res. 2017, 17, 741–751. [Google Scholar] [CrossRef]
- Abuelgasim, A.; Farahat, A. Investigations on PM10, PM2.5, and Their Ratio over the Emirate of Abu Dhabi, United Arab Emirates. Earth Syst. Environ. 2020, 4, 763–775. [Google Scholar] [CrossRef]
- Cabello-Torres, R.J.; Carbo-Bustinza, N.; Romero-Cabello, E.A.; Ureta Tolentino, J.M.; Torres Armas, E.A.; Turpo-Chaparro, J.E.; Rodriguets, P.C.; López-Gonzales, J.L. An exploratory analysis of PM2.5/PM10 ratio during spring 2016–2018 in Metropolitan Lima. Sci. Rep. 2024, 14, 1–15. [Google Scholar] [CrossRef]
- Yue, D.L.; Hu, M.; Wu, Z.J.; Guo, S.; Wen, M.T.; Nowak, A.; Wehner, B.; Wiedensohler, A.; Takegawa, N.; Kondo, Y.; et al. Variation of particle number size distributions and chemical compositions at the urban and downwind regional sites in the Pearl River Delta during summertime pollution episodes. Atmos. Chem. Phys. 2010, 10, 9431–9439. [Google Scholar] [CrossRef]
- Querol, X.; Alastuey, A.; Ruiz, C.R.; Artiñano, B.; Hansson, H.C.; Harrison, R.M.; Buringh, E.; ten Brink, H.M.; Lutz, M.; Bruckmann, P.; et al. Speciation and origin of PM10 and PM2.5 in selected European cities. Atmos. Environ. 2004, 38, 6547–6555. [Google Scholar] [CrossRef]
- Spandana, B.; Srinivasa Rao, S.; Upadhya, A.R.; Kulkarni, P.; Sreekanth, V. PM2.5/PM10 ratio characteristics over urban sites of India. Adv. Space Res. 2021, 67, 3134–3146. [Google Scholar] [CrossRef]
- Querol, X.; Alastuey, A.; Rodriguez, S.; Plana, F.; Ruiz, C.R.; Cots, N.; Massague, G.; Puig, O. PM10 and PM2.5 source apportionment in the Barcelona Metropolitan area, Catalonia, Spain. Atmos. Environ. 2001, 35, 6407–6419. [Google Scholar] [CrossRef]
- Li, Z.; Yang, X.; Zhao, C.; Fan, T. Ratio of PM 2.5 to PM 10 Mass Concentrations in Beijing and Relationships with Pollution from the North China Plain. Asia-Pac. J. Atmos. Sci. 2020, 57, 421–434. [Google Scholar] [CrossRef]
- Bodor, K.; Szép, R.; Bodor, Z. The human health risk assessment of particulate air pollution (PM2.5 and PM10) in Romania. Toxicol. Rep. 2022, 9, 556–562. [Google Scholar] [CrossRef]
- Ichim, P.; Sfîcă, L. The influence of urban climate on bioclimatic conditions in the city of Iași, Romania. Sustainability 2020, 12, 9652. [Google Scholar] [CrossRef]
- Briciu, A.E.; Mihaila, D.; Graur, A.; Oprea, D.I.; Prisacariu, A.; Bistricean, P.I. Changes in the water temperature of rivers impacted by the urban heat island: Case study of Suceava city. Water 2020, 12, 1343. [Google Scholar] [CrossRef]
- Sfîcă, L.; Corocăescu, A.C.; Crețu, C.Ș.; Amihăesei, V.A.; Ichim, P. Spatiotemporal Features of the Surface Urban Heat Island of Bacău City (Romania) during the Warm Season and Local Trends of LST Imposed by Land Use Changes during the Last 20 Years. Remote Sens. 2023, 15, 3385. [Google Scholar] [CrossRef]
- INSSE. Available online: http://statistici.insse.ro:8077/tempo-online (accessed on 4 September 2024).
- Dragoi (Oniu), L.; Breabăn, I.G.; Cazacu, M.-M. 2017–2020 trends of particulate matter PM10 concentrations in the cities of Suceava and Botoșani. Present Environ. Sustain. Dev. 2023, 17, 335–349. [Google Scholar] [CrossRef]
- UNECE. Air Quality in Europe-2020 Report–European Environment Agency. Available online: https://www.eea.europa.eu/publications/air-quality-in-europe-2020-report (accessed on 7 November 2021).
- Zhao, D.; Chen, H.; Yu, E.; Luo, T. PM 2.5/PM 10 ratios in eight economic regions and their relationship with meteorology in China. Adv. Meteorol. 2019, 2019, 5295726. [Google Scholar] [CrossRef]
- Zhou, X.; Cao, Z.; Ma, Y.; Wang, L.; Wu, R.; Wang, W. Concentrations, correlations and chemical species of PM2.5/PM10 based on published data in China: Potential implications for the revised particulate standard. Chemosphere 2016, 144, 518–526. [Google Scholar] [CrossRef]
- Eeftens, M.; Tsai, M.Y.; Ampe, C.; Anwander, B.; Beelen, R.; Bellander, T.; Cesaroni, G.; Cirach, M.; Cyrys, J.; De Hoogh, K.; et al. Spatial variation of PM2.5, PM10, PM2.5 absorbance and PM coarse concentrations between and within 20 European study areas and the relationship with NO2–Results of the ESCAPE project. Atmos. Environ. 2012, 62, 303–317. [Google Scholar] [CrossRef]
- Adães, J.; Pires, J.C.M. Analysis and modelling of PM2.5 temporal and spatial behaviors in European cities. Sustainability 2019, 11, 6019. [Google Scholar] [CrossRef]
- Municipiul Suceava, Plan de Calitate a Aerului în Municipiul Suceava Pentru Particule în Suspensie PM10, Perioada 2023–2027. Available online: http://apmsv.anpm.ro/documents/27459/66982468/PCA+municipiul+Suceava+2023_2027_avizat.pdf/ace1fb91-2638-46d2-80ab-ffd1d3702916 (accessed on 14 August 2024).
- Primaria Municipiului Iasi. Plan Integrat de Calitate a Aerului în Municipiul Iaşi, Perioada 2023–2027. Available online: https://www.primaria-iasi.ro/dm_iasi/portal.nsf/atasament/E8871219E6B9F2E5C2258B78001FC2F3/$FILE/PICA%20IASI%202023-2027_V1_rev0_09.08.2024.pdf?Open (accessed on 14 August 2024).
- Ma, Q.; Wu, Y.; Zhang, D.; Wang, X.; Xia, Y.; Liu, X.; Tian, P.; Han, Z.; Xia, X.; Wang, Y.; et al. Roles of regional transport and heterogeneous reactions in the PM2.5 increase during winter haze episodes in Beijing. Sci. Total Environ. 2017, 599–600, 246–253. [Google Scholar] [CrossRef]
- Liu, P.; Ye, C.; Xue, C.; Zhang, C.; Mu, Y.; Sun, X. Formation mechanisms of atmospheric nitrate and sulfate during the winter haze pollution periods in Beijing: Gas-phase, heterogeneous and aqueous-phase chemistry. Atmos. Chem. Phys. 2020, 20, 4153–4165. [Google Scholar] [CrossRef]
- Hu, J.; Wang, Y.; Ying, Q.; Zhang, H. Spatial and temporal variability of PM2.5 and PM10 over the North China Plain and the Yangtze River Delta, China. Atmos. Environ. 2014, 95, 598–609. [Google Scholar] [CrossRef]
- Megaritis, A.G.; Fountoukis, C.; Charalampidis, P.E.; Denier Van Der Gon, H.A.C.; Pilinis, C.; Pandis, S.N. Linking climate and air quality over Europe: Effects of meteorology on PM2.5 concentrations. Atmos. Chem. Phys. 2014, 14, 10283–10298. [Google Scholar] [CrossRef]
- Czarnecka, M.; Nidzgorska-Lencewicz, J. The impact of thermal inversion on the variability of PM10 concentration in winter seasons in Tricity. Environ. Prot. Eng. 2017, 44, 157–172. [Google Scholar] [CrossRef]


| BT-1 PM2.5 | IS-2 PM2.5 | SV-1 PM2.5 | |
|---|---|---|---|
| PM10 | 0.8 | 0.9 | 0.86 |
| SV-1 PM2.5/PM10 Ratio | IS-2 PM2.5/PM10 Ratio | BT-1 PM2.5/PM10 Ratio | |
|---|---|---|---|
| PM10 | −0.086 | −0.108 | −0.074 |
| PM2.5 | 0.358 | 0.227 | 0.457 |
| Mean | CV | IS-2 | BT-1 | |
|---|---|---|---|---|
| SV-1 | 0.666 | 0.251 | 0.135 | 0.208 |
| IS-2 | 0.622 | 0.213 | 0.236 | |
| BT-1 | 0.529 | 0.360 |
| SV-1 | IS-2 | |
|---|---|---|
| IS-2 | 0.441 | |
| BT-1 | 0.414 | 0.090 |
Disclaimer/Publisher’s Note: The statements, opinions and data contained in all publications are solely those of the individual author(s) and contributor(s) and not of MDPI and/or the editor(s). MDPI and/or the editor(s) disclaim responsibility for any injury to people or property resulting from any ideas, methods, instructions or products referred to in the content. |
© 2025 by the authors. Licensee MDPI, Basel, Switzerland. This article is an open access article distributed under the terms and conditions of the Creative Commons Attribution (CC BY) license (https://creativecommons.org/licenses/by/4.0/).
Share and Cite
Drăgoi, L.; Cazacu, M.-M.; Breabăn, I.-G. Analysis of the PM2.5/PM10 Ratio in Three Urban Areas of Northeastern Romania. Atmosphere 2025, 16, 720. https://doi.org/10.3390/atmos16060720
Drăgoi L, Cazacu M-M, Breabăn I-G. Analysis of the PM2.5/PM10 Ratio in Three Urban Areas of Northeastern Romania. Atmosphere. 2025; 16(6):720. https://doi.org/10.3390/atmos16060720
Chicago/Turabian StyleDrăgoi (Oniu), Liliana, Marius-Mihai Cazacu, and Iuliana-Gabriela Breabăn. 2025. "Analysis of the PM2.5/PM10 Ratio in Three Urban Areas of Northeastern Romania" Atmosphere 16, no. 6: 720. https://doi.org/10.3390/atmos16060720
APA StyleDrăgoi, L., Cazacu, M.-M., & Breabăn, I.-G. (2025). Analysis of the PM2.5/PM10 Ratio in Three Urban Areas of Northeastern Romania. Atmosphere, 16(6), 720. https://doi.org/10.3390/atmos16060720