3.2.1. Comparative Distributions Across the Longitudes
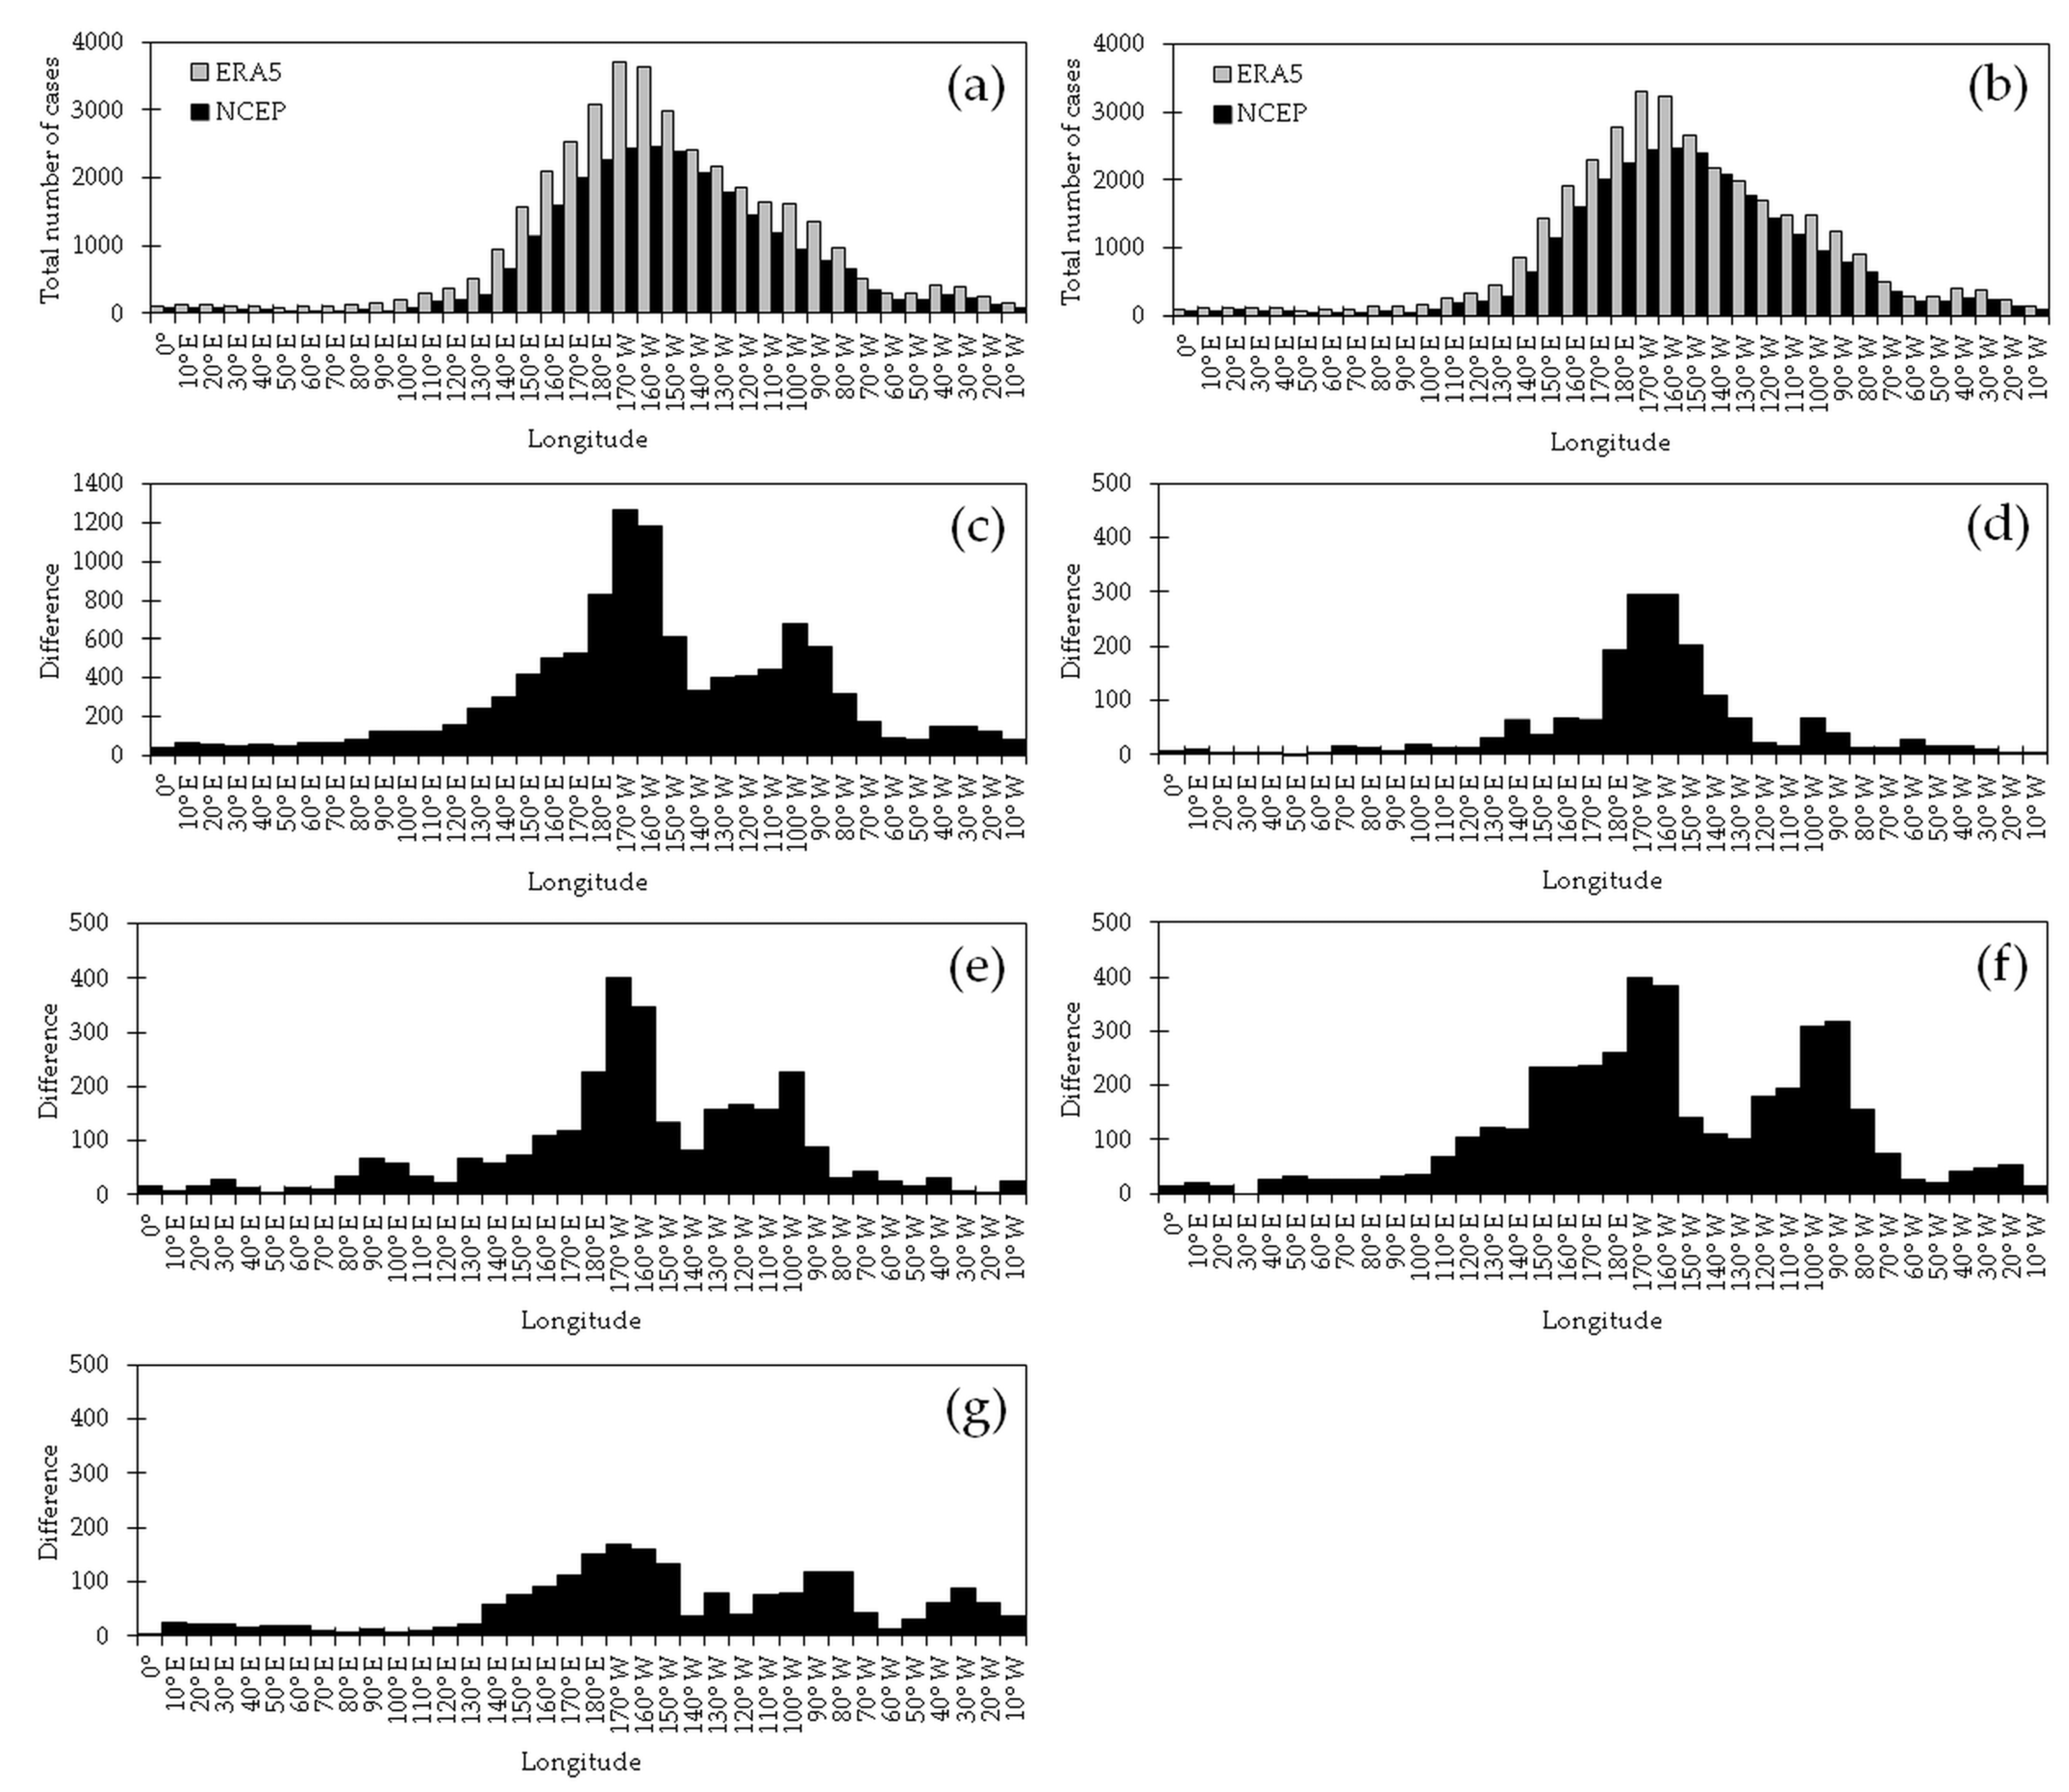
Figure 4 presents an overview of the climatology of blocking cases in both datasets, but given that each entire dataset spanned different periods, the absolute values were not appropriate for making comparisons. Following this,
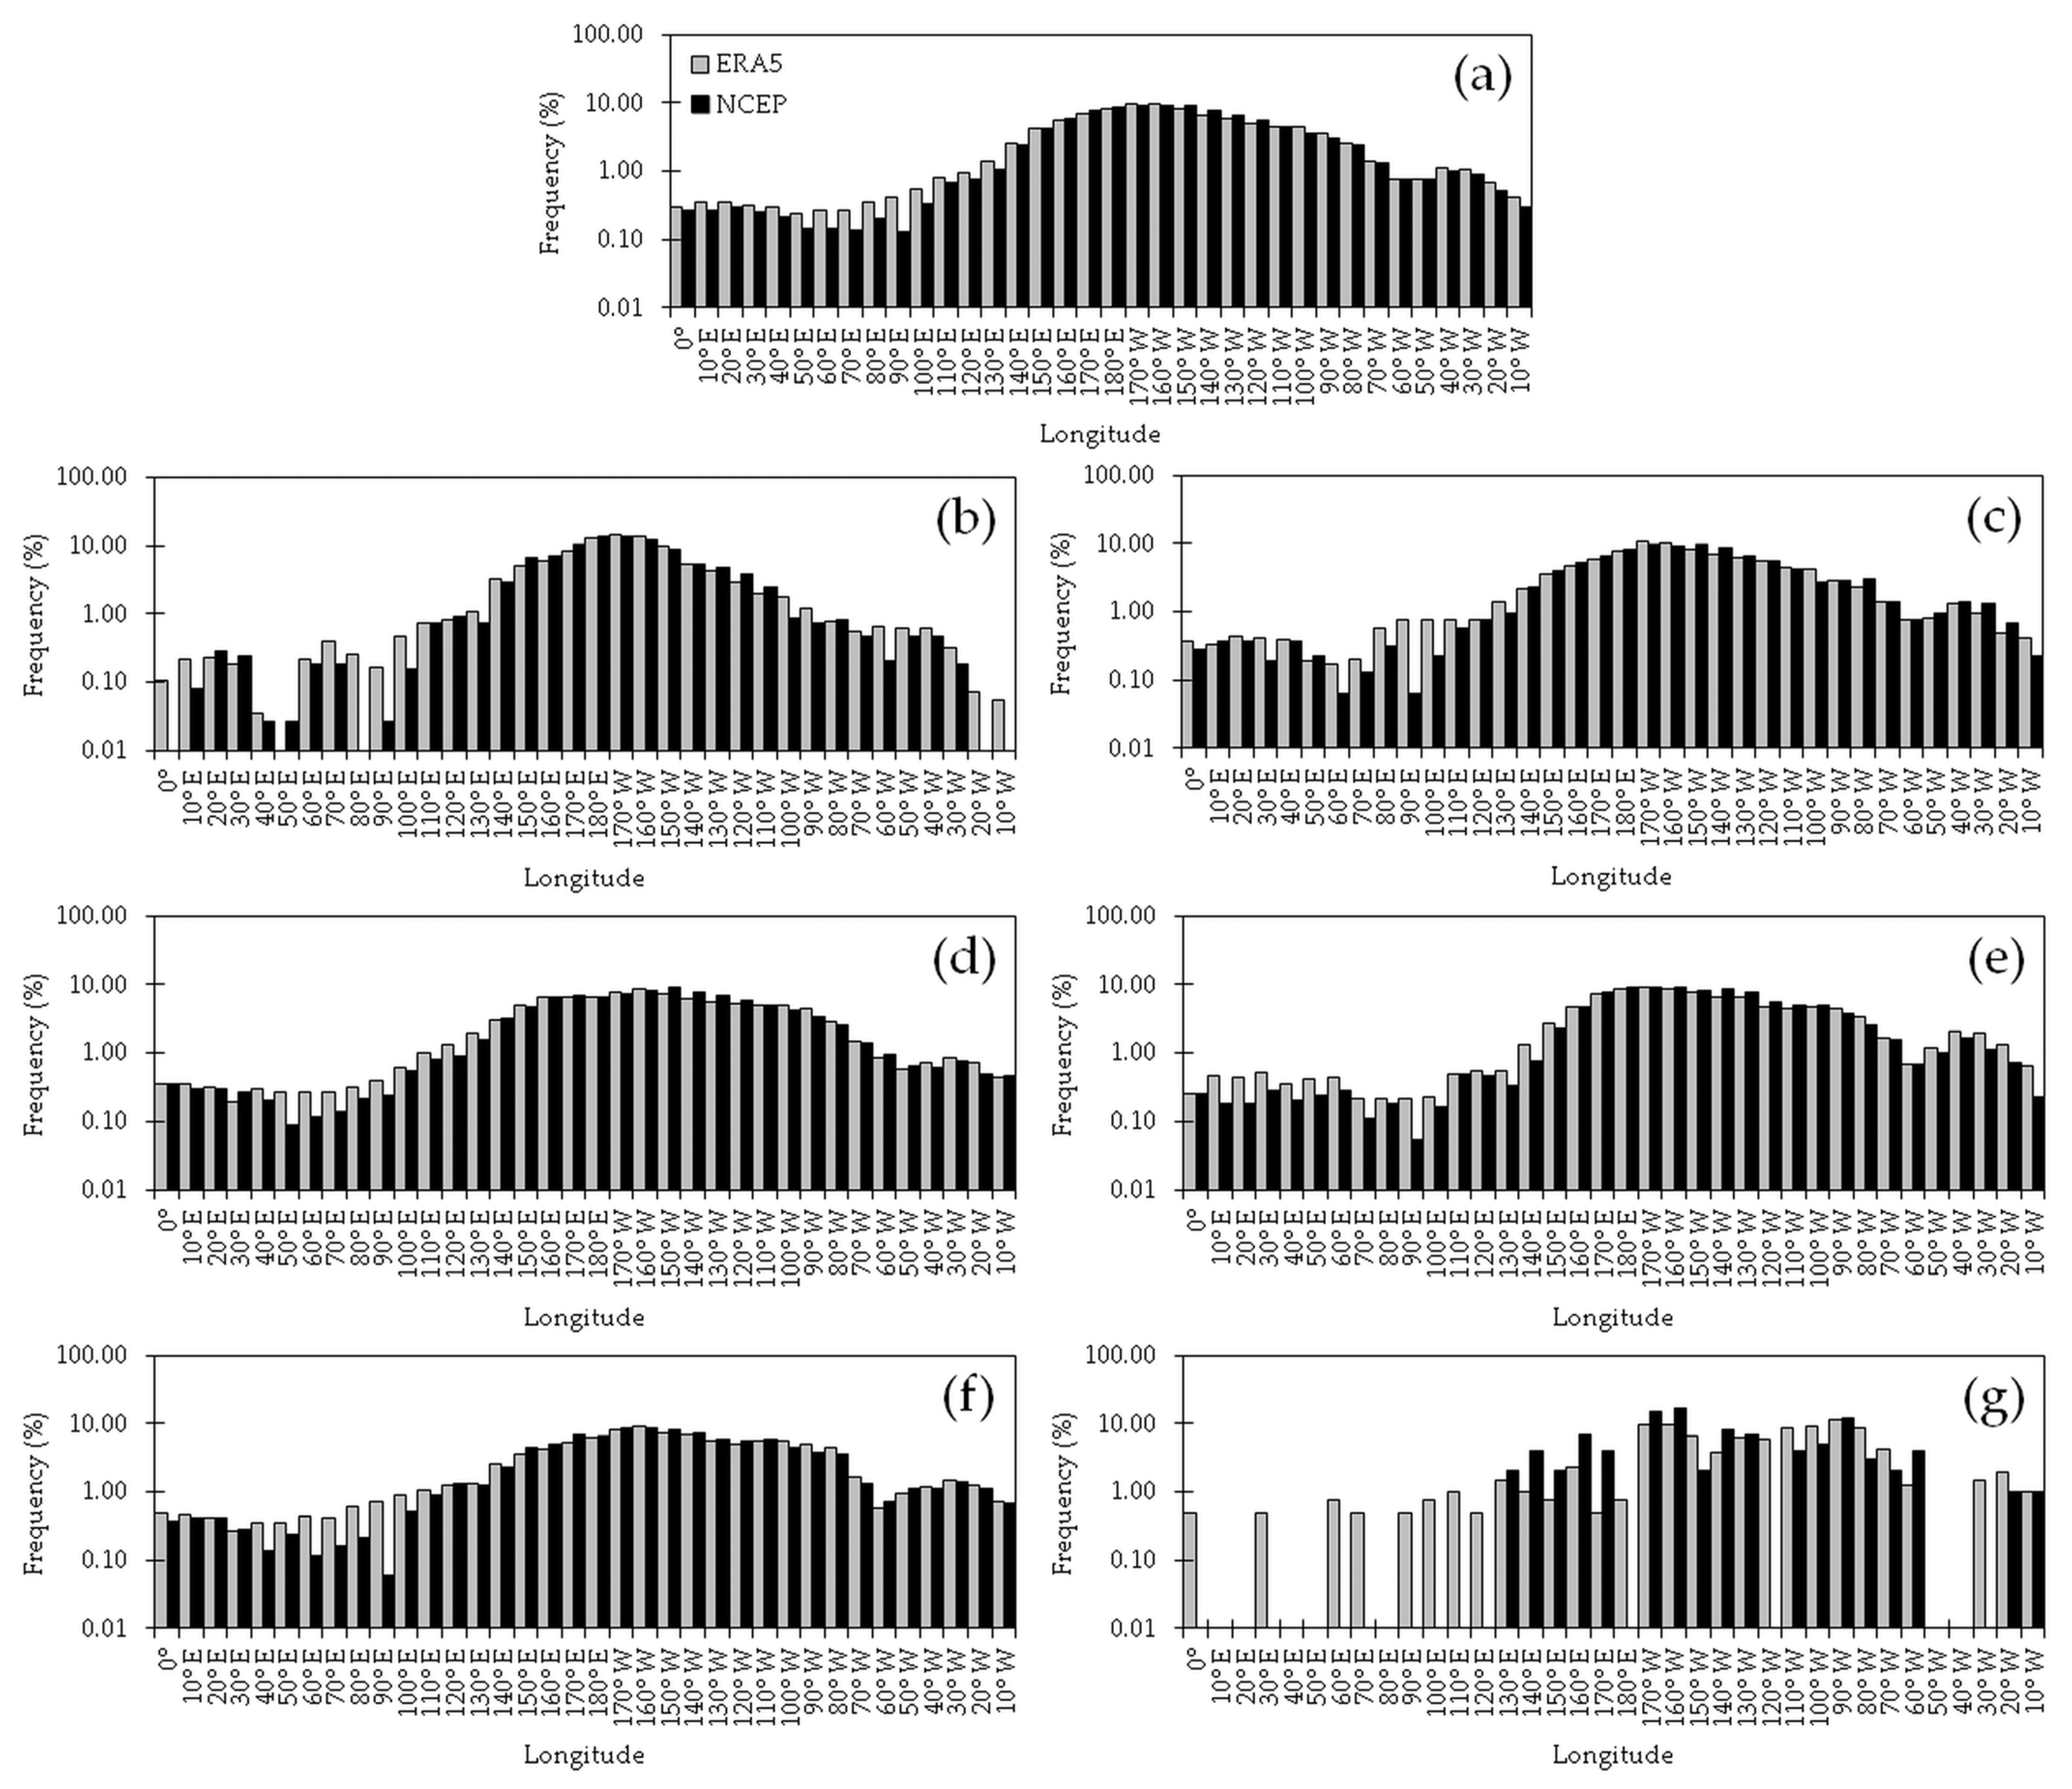
Figure 5 shows the annual and seasonal distributions in the frequency of blockings for every 10° of longitude in the two datasets. Unlike with the absolute values, the frequencies were normalized, and hence, they were comparable to each other, despite one of the records being longer. As in
Figure 4a, the annual averages showed that the entire Pacific basin was the preferred region for the occurrence of blockings, and apparent secondary and tertiary maxima, as enhanced by the logarithmic vertical scale, occurred to the west and to the east of the GM, respectively (
Figure 5a). The overall maximum took place at 170° W (9.86%) and 160° W (9.26%) in the ERA5 and in the NCEP datasets, respectively. These maxima shifted to the east of the one found in [
22], in which the Australian dataset (ADS) encompassing less than 10 years was used, and the maximum, west of the DL, represented less than 5% of the total blocking cases. The secondary maxima were located at 40° W in both the ERA5 (1.11%) and the NCEP (1.01%) datasets; the tertiary maxima took place at 20° E in both datasets too, representing 0.35% (ERA5) and 0.30% (NCEP). Second- and third-rank maxima were also found in [
22] the west and east of the GM, respectively. Our results were also in agreement with those presented in [
18], whose calculations were carried out using the ADS, too, but the approach of persistent anomalies for the location of blockings was taken. Their overall maximum was vaguely described as taking place in the New Zealand sector within a longitudinal region stretching across 60°, and the secondary and tertiary maxima were situated in SWA and in the Southern Indian Ocean, respectively.
On a longitude-by-longitude analysis, the frequencies in the ERA5 and the NCEP datasets generally matched well across the SH; the exception was the 50° E–90° E area, where the values were quite lower in the latter reanalysis. For the distributions in
Figure 5a, the asymmetry coefficients, measured through the skewness coefficients [
69] (p. 28), were 1.01 (ERA5) and 0.94 (NCEP). This implied the presence of more blocking cases in the WH than in the EH in both reanalyses, something that is obscured in
Figure 5a owing to the smoothing created by the logarithmic scale but can be easily identified in
Figure 4a. A simpler support for these asymmetry values could be given by the number of blocking cases in the two hemispheres, which accounted for 25.93% (ERA5) and 25.18% (NCEP) in the EH, versus 74.07% (ERA5) and 74.82% (NCEP) in the WH. The skewnesses for the rest of the distributions in
Figure 5 could also be exploited as a measurement of the seasonal adjustment in the frequency of blocking cases across the longitudes and the hemispheres.
Let us label the percentual frequencies introduced in
Figure 5 as
and
for the ERA5 and the NCEP datasets, respectively. The difference
is illustrated in
Figure 6. The subtraction of the NCEP figures from the ERA5 ones is in agreement with the results presented in
Figure 4. Nevertheless, for the assessment of the difference, a reversion in the foregoing subtraction leads to the same results, as explained below. The difference
can be written as
, where
and
are the proportion of located blockings at any given longitude for the ERA5 and the NCEP datasets, respectively, estimated using the number of cases at that longitude,
and
, over the total number of located blockings,
and
, either in the annual average or in the corresponding season. At every longitude, in order to establish whether
and
differed statistically from zero, the pooled z-test for independent proportions was employed. To address the difference, and following [
70], the statistic below, which includes the correction for continuity, was compared against the critical value
of the normal distribution having a mean equal to 0 and a standard deviation equal to 1:
In the above equation,
stands for the pooled proportion
and
. If
, by taking into account the number of cases in each sample, the second term in the numerator of (4) prevents us from erroneously considering the two proportions as statistically equal unless the values of both
and
are sufficiently large. As expected, switching the variables in (4) yields the same outcome, and, hence, the order of the proportions in the subtraction
is irrelevant to the test. Setting the level of significance at 95%, at every longitude, there was a statistical difference between the corresponding proportions
and
if
.
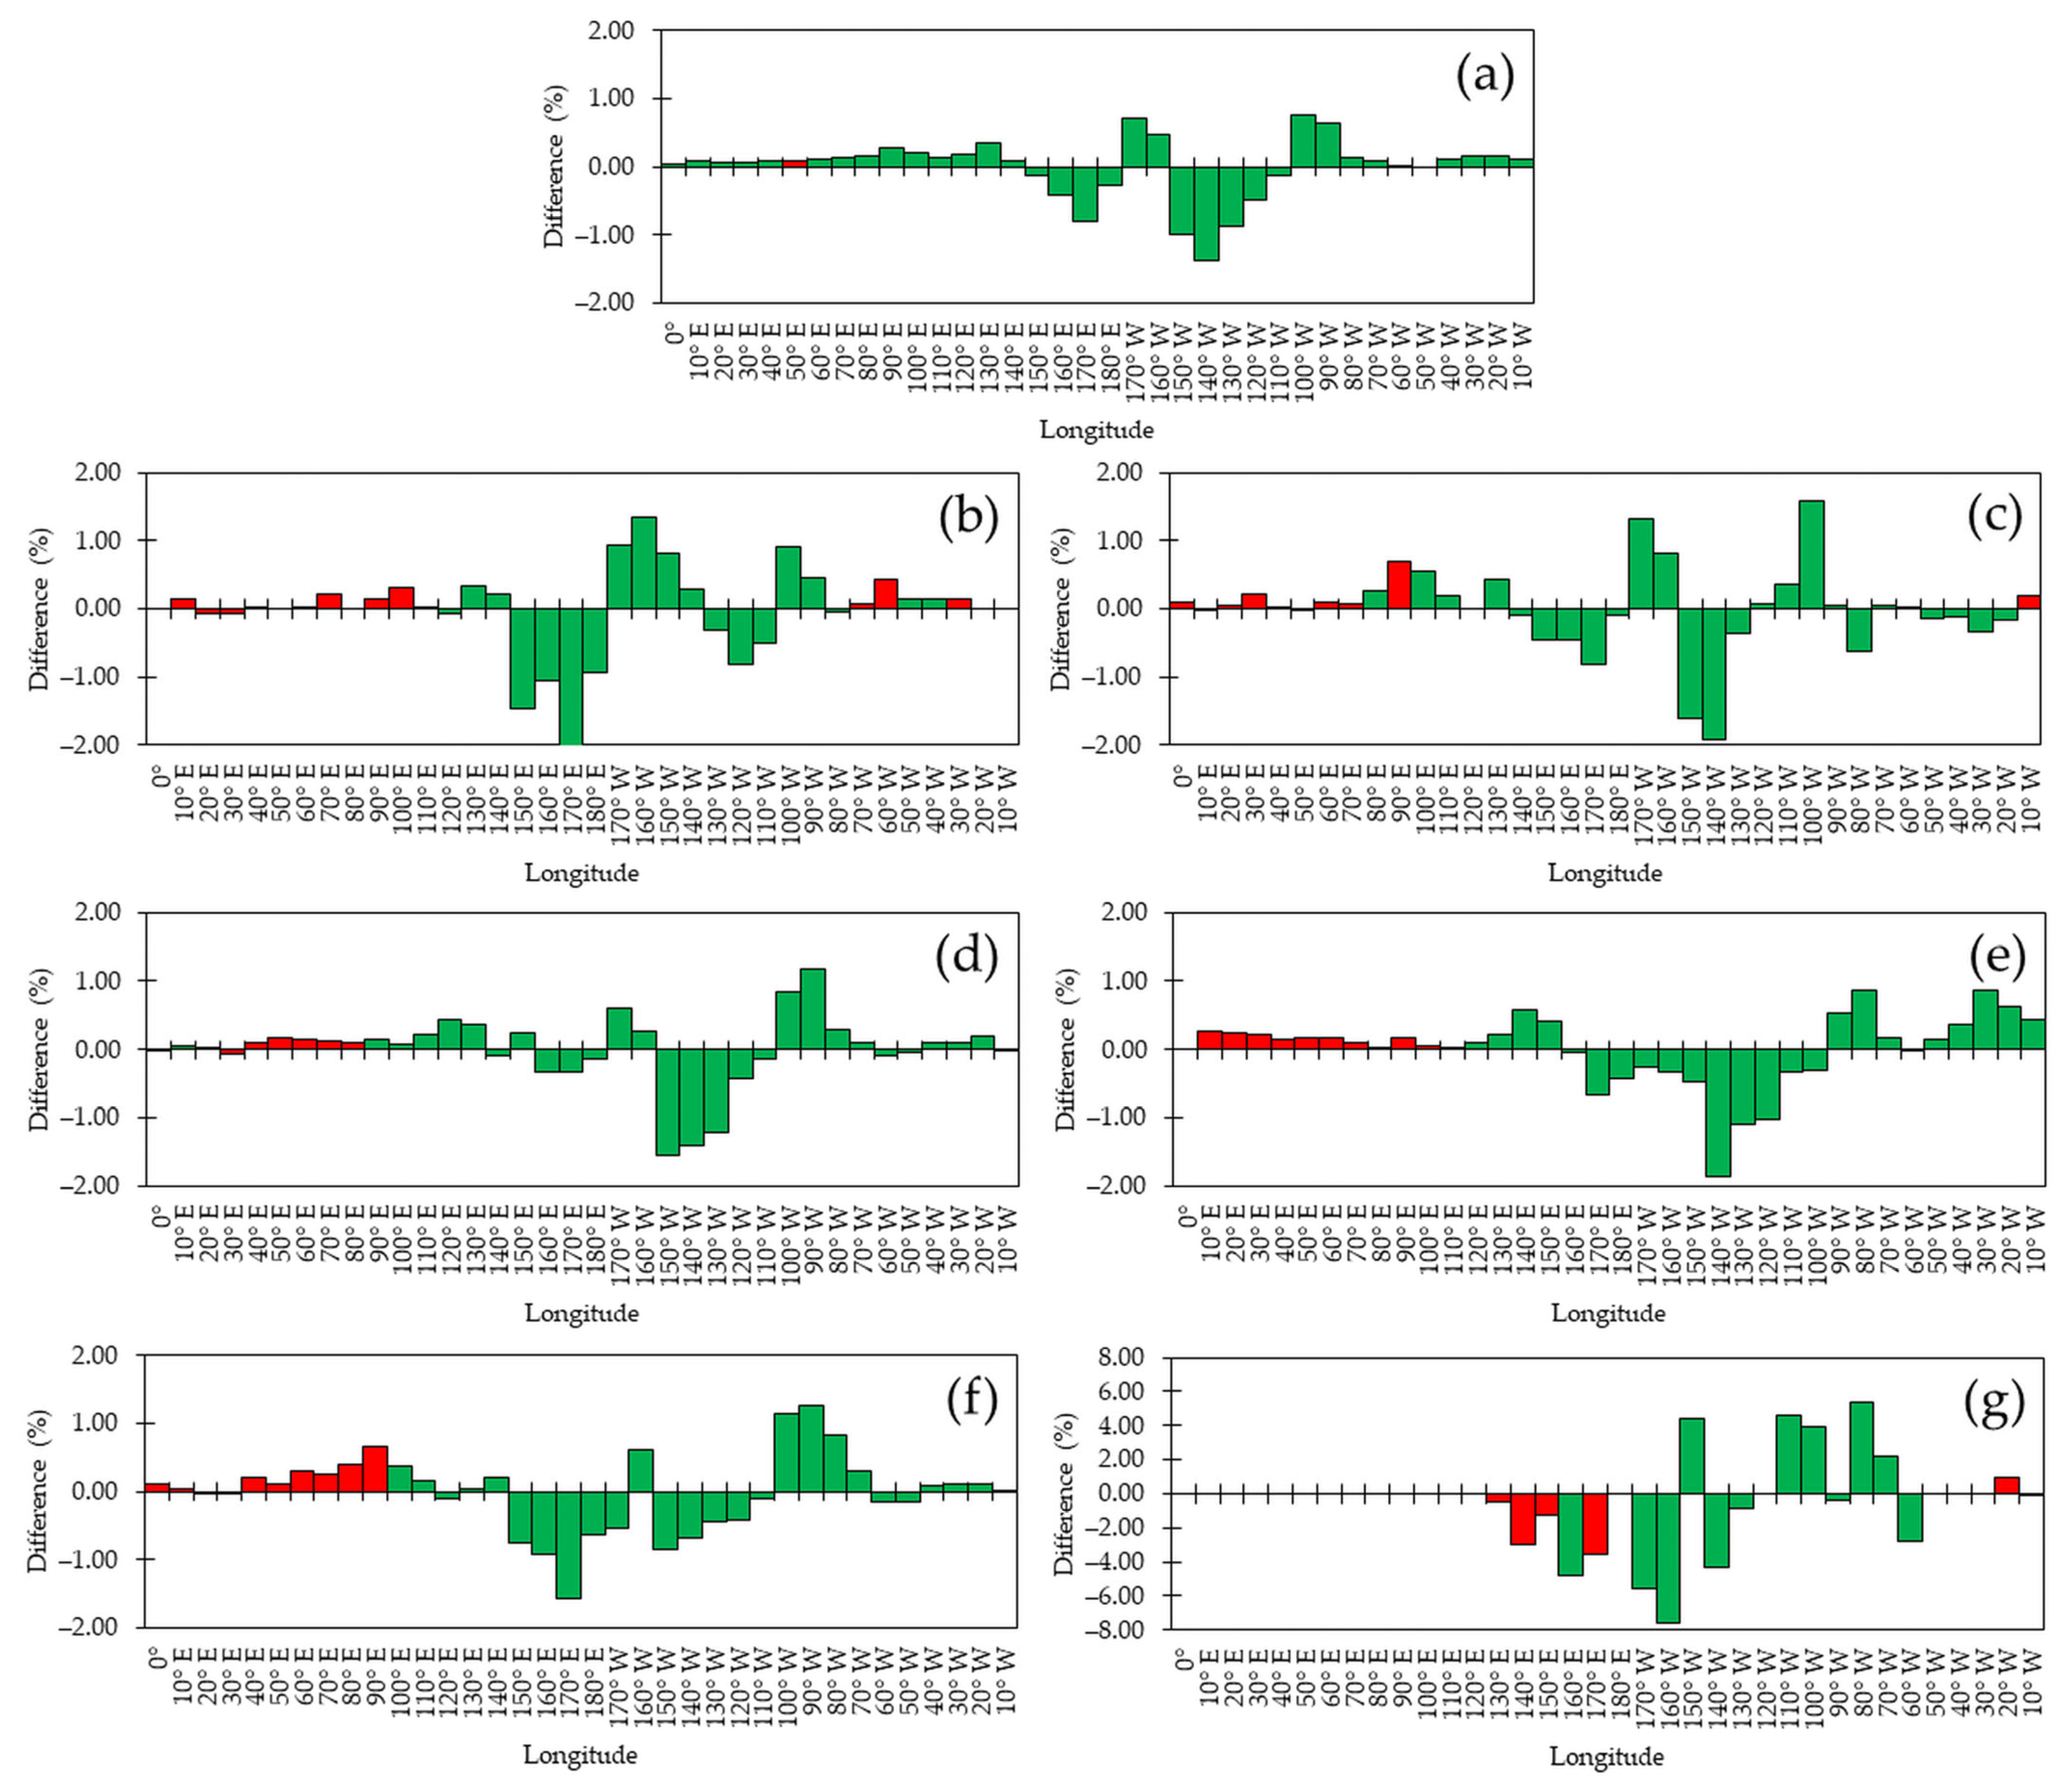
Figure 6 also accounts for the outcome of the test.
Figure 6.
Difference
in correspondence to the values presented in
Figure 5: (
a) annual; (
b) DJF; (
c) MAM; (
d) JJA; (
e) SON. Panels (
f) and (
g) show the annual distribution of
for the blocking index restricted to values less than –100 m and –200 m, respectively. The vertical scales are the same in all the panels, with the exception of (
g). Red bars indicate a statistical difference that was significant at a 95% level of confidence, green bars indicate no statistical difference, and blanks indicate that significance could not be assessed due to missing data in either dataset.
On an annual basis, the two datasets were indistinguishable from one another at all the longitudes, with the exception of 50° E (
Figure 6a). Furthermore, the datasets differed by 2% at most (the ordinate’s top and bottom values), and the largest discrepancies were recorded in the Pacific, east of the DL, between 150° W and 130° W. Actually, the extreme value occurred at 140° E, where the number of blockings in the NCEP dataset exceeded that in the ERA5 counterpart by 1.38%. It is also worth stressing that the differences were positive between 100° W and 140° E, negative in the 150° E–180° E range, positive in the 170° W–160° W region (where the greater counting of blockings was recorded in both datasets, cf.
Figure 5a), and negative between 150° W and 110° W.
In order to focus the analysis of the frequency distributions in
Figure 5 across the seasons in just three different regions covering the SH, for comparison purposes, we followed [
22] and defined the Pacific (PAC, 110° E–80° W), the Atlantic (ATL, 70° W–0°), and the Indian Ocean (IND, 10° E–100° E) regions.
Table 1 shows the annual and seasonal frequencies at these regions. On an annual basis, the frequency of blocking cases in the PAC accounted for 90.11% (ERA5) and 92.09% (NCEP) of the totals, 6.48% (ERA5) and 5.80% (NCEP) in the ATL, and 3.41% (ERA5) and 2.12% (NCEP) in the IND.
In DJF (
Figure 5b), the maximum frequency occurred at 170° W in the ERA5 dataset (14.65%) and at 180° E and 170° W (13.71% each) in the NCEP dataset; a secondary maximum was found at 60° W in the ERA5 (0.65%) and at 50° W and 40° W in the NCEP (0.48% each). In the ERA5 dataset, a tertiary maximum took place at 70° E (0.40%), and there was also a quaternary maximum that peaked at 20° E (0.23%). There were third- and fourth-rank maxima in the NCEP dataset too: the former took place at 20° E (0.29%), while the latter was circumscribed to just two longitudes, at 60° E and 70° E, accounting for 0.19% each. Generally speaking, the differences between the two datasets were not significant in the region that stretched between 110° E and 70° W, and they were significant elsewhere (
Figure 6b). As in the annual case, the largest values took place in the region of maximum counting, between 150° E and 90° W; clusters enclosing up to four adjoining longitudes with differences of the same sign alternated with each other within this area. The difference exceeded the 2% threshold at 170° E (2.28%), where more blockings were located in the NCEP dataset.
Further details could be extracted from the comparisons with the annual frequencies.
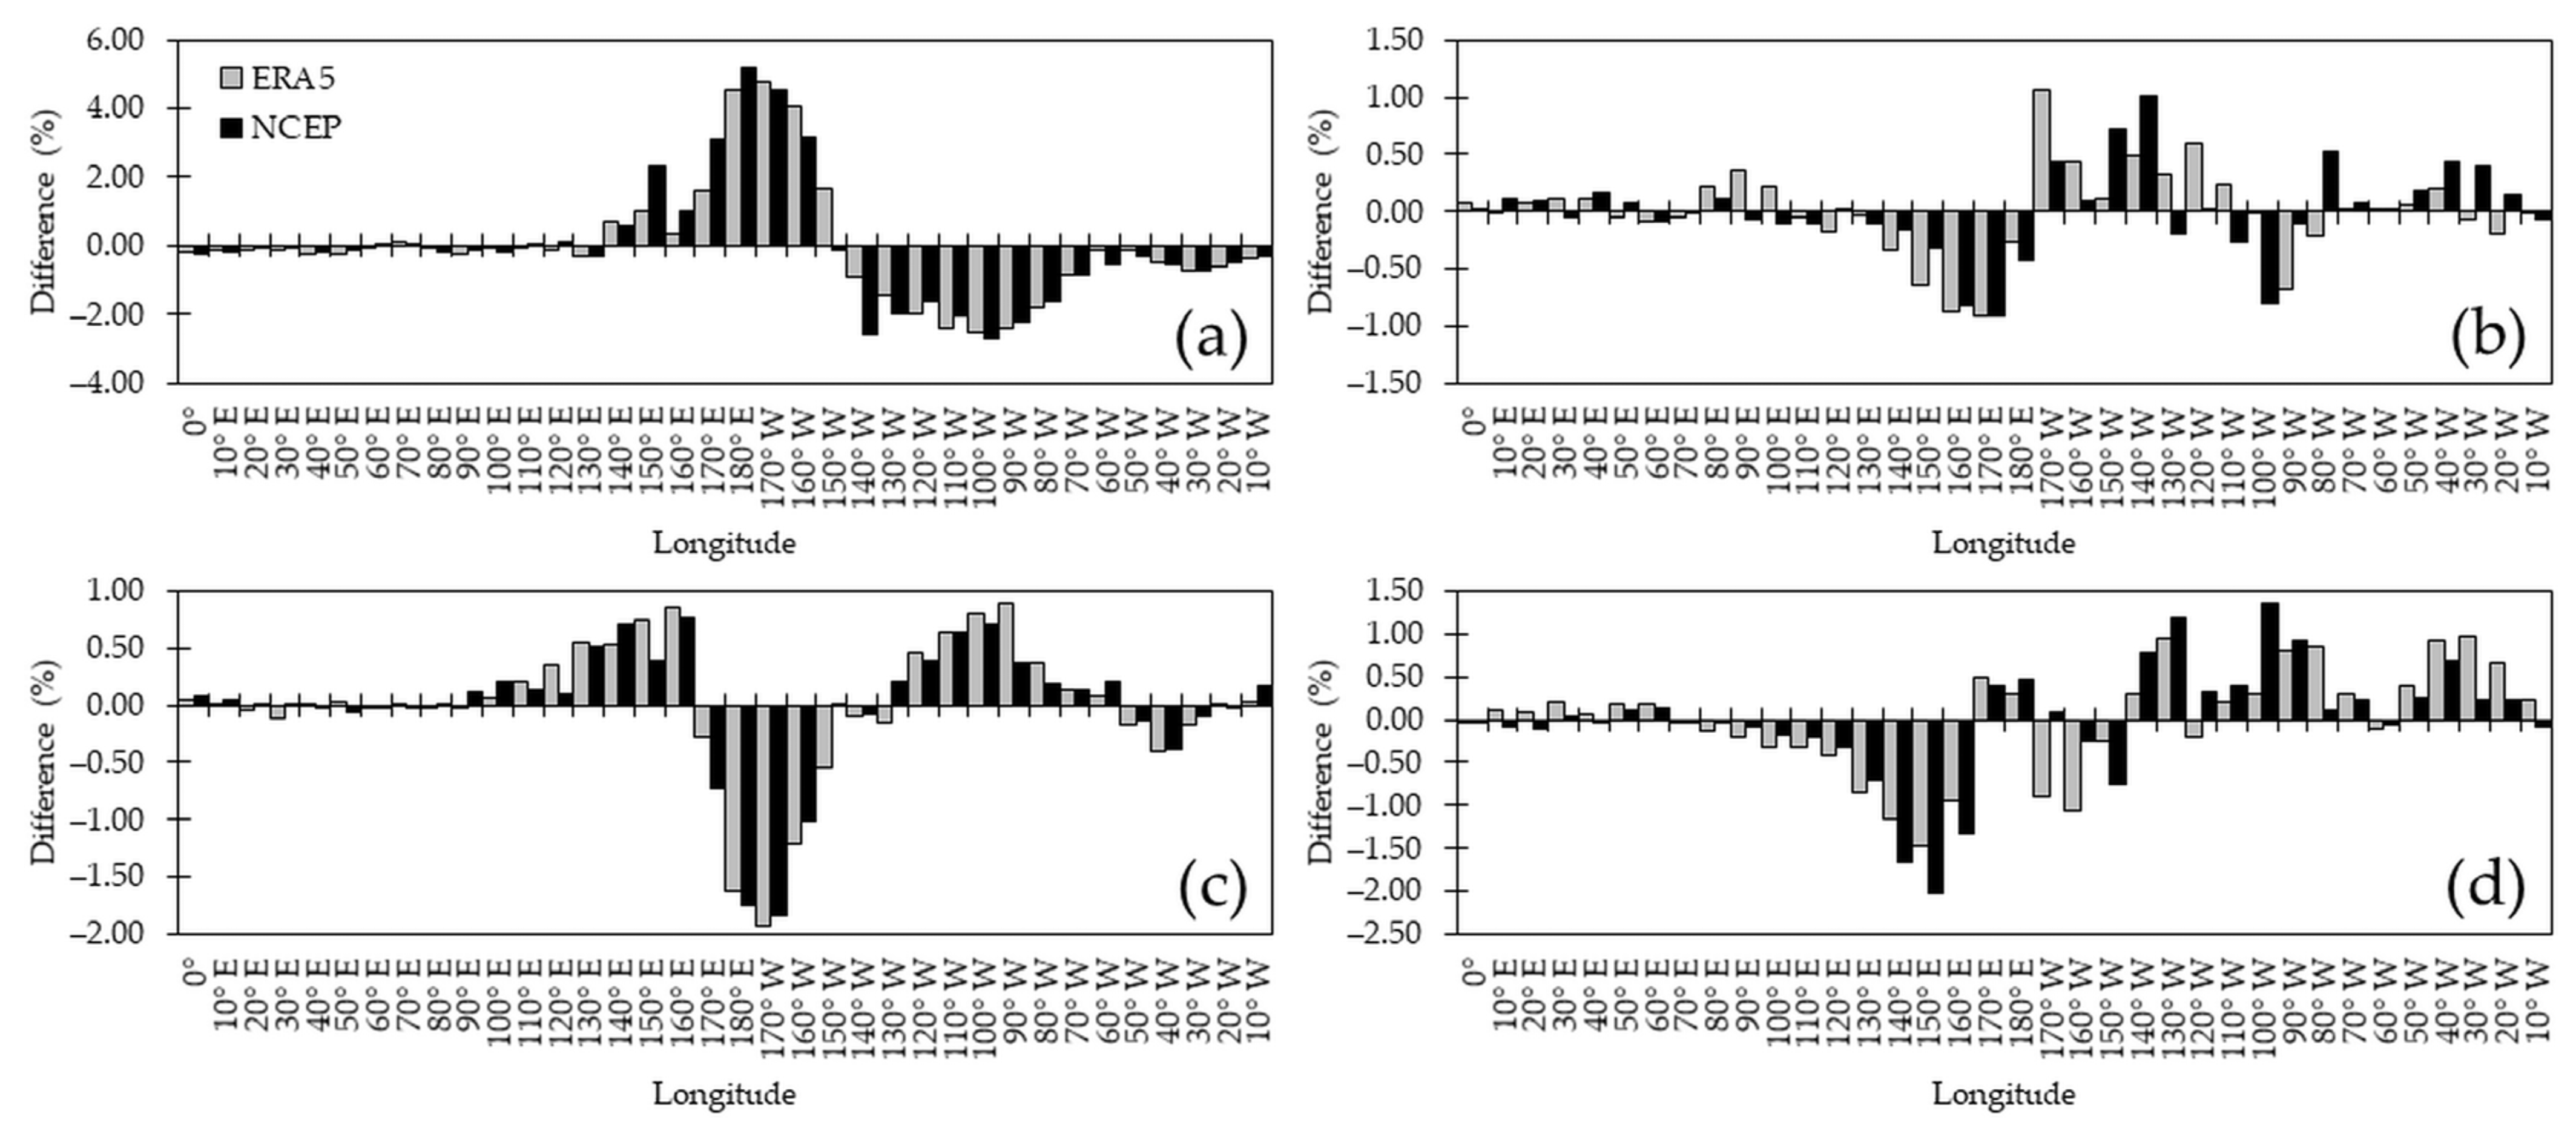
Figure 7 shows the deviations of the seasonal distributions with respect to the annual average. The first thing worth noting is that DJF had the largest deviations of all seasons (
Figure 7a). Aside from this, the most outstanding feature during DJF was the noticeable reduction in the number of blocking cases east of 150° W in both reanalyses, and that there was an even more notable increase—up to 5.21% in the NCEP case, in the 140° E–160° W sector. As drawn by a visual inspection of
Figure 5a, in general terms, the excesses and deficits in the DJF frequencies were in apparent concordance across the longitudes in both datasets. We used Spearman’s correlation coefficient
, which relates the ranks of the data pairs rather than the raw values as the Pearson’s correlation coefficient does [
69,
71], as a single parameter to quantify this. The greater the absolute value of
the more likely the correlated variables were related by a monotonous, yet undetermined, increasing
or decreasing
function. The calculations of
were carried out using the subroutine
spear included in [
72]. The value of
for DJF indicated that the deviations in both datasets were actually in very good agreement with each other.
The concentration of more blockings around the DL in DJF led to an imbalance in the frequencies (as seen in
Figure 7a) that was consistent with larger skewnesses of the corresponding distributions in
Figure 5b, namely 1.68 (ERA5) and 1.37 (NCEP). Alternatively, this was backed by an increase in the counting of blockings in the EH to 27.63% (ERA5) and to 30.87% (NCEP) of the total number of recorded cases in the season.
In a regional fashion, the frequencies during this season decreased with respect to the annual average to 3.02% (ERA5) and 1.83% (NCEP) in the ATL and to 2.16% (ERA5) and 1.22% (NCEP) in the IND, in favor of an increase to 94.82% (ERA5) and 96.96% (NCEP) in the PAC (
Table 1).
Four different regions where blockings were more prone to occur during MAM could be located in the ERA5 dataset from
Figure 5c: the maximum frequency took place at 170° W (10.92%) and second-, third-, and fourth-rank maxima occurred at 40° W (1.32%), 90° E (0.77%), and 20° E (0.44%), respectively. A spread in the frequencies across the longitudes was more apparent in the NCEP dataset, as the absolute maximum occurred at 150° W (9.69%), and local maxima could be spotted at 80° W (2.98%), 40° W (1.43%), 20° E and 40° E (0.38% each), and 80° E (0.32%). Yet with alternating signs in the differences, the counts of blockings in both datasets were in overall statistical agreement between 100° E and 20° W (
Figure 6c) and in disagreement elsewhere. The larger difference, slightly below 2%, occurred at 140° W, with fewer blockings located in the ERA5 dataset. Moreover, it is worth pointing out that there was a local increase in the differences in the 50° W–20° W band in the region that exhibited an autumnal rise in the number of blockings; in this area, the counting in the NCEP dataset outnumbered the ERA5’s by as much as 0.33% at 30° W.
At first sight, and opposite to DJF, there seemed to be an overall decrease (increase) in the frequency of blockings in the EH (WH), yet with values that did not exceed 1.50%, both in the positive and in the negative deviations (
Figure 7b). This was actually the case, as the percentages of detected blockings in the EH decreased to 23.86% (ERA5) and to 22.99% (NCEP). With exceptions, at longitudes beyond the vicinities of the DL, the frequencies were discrepant; the low value
captured this mismatch well. According to
Table 1, the big picture shows that blockings were less frequent than in the annual average in the PAC―and hence, more frequent in the two remaining sectors in both datasets. More specifically, the frequencies in the PAC constituted 89.12% (ERA5) and 90.69% (NCEP) of the total number of cases in the season, they were 6.57% (ERA5) and 6.97% (NCEP) in the ATL, and in the IND, they reached 4.31% (ERA5) and 2.34% (NCEP).
The low value of
warrants a deeper analysis of the discrepancies. The literature’s usual assumption that any pixel in either the ERA5 or the NCEP datasets could be used as a proxy for an observation (e.g., [
73]) might, within the scope of the present work, have entered into conflict in MAM. Aside from the statistical indistinguishability in the 100° E–20° W range (
Figure 6c), both datasets were discordant at several longitudes regarding the departures from the corresponding annual averages (
Figure 7b), so the selection of a third dataset was in order for the evaluations. As for the ERA5 dataset, in the NH, the occurrence of blockings was overestimated in the 0–30° E region when compared with the Coupled Model Intercomparison Project (CMIP) multimodel dataset in their Phases 5 (CMIP5) [
74] and 6, which included 29 and 32 datasets, respectively [
6] (p. 465). Unfortunately, to the best of our knowledge, no such comparisons were presented for the SH. Notwithstanding, annual and seasonal climatologies for the occurrence of blockings were introduced in [
75] using the ERA-Interim (ERA-I) [
76,
77] and the CMIP5 datasets. Despite using a different methodology than the one used here for the detection of blockings (the authors in [
75] based their definition of a blocking on persistent anomalies of surface pressure above a threshold), comparisons with their outcome are of interest to interpret our results, given the general barotropic nature of blockings (e.g., [
2] (pp. 334–335), [
78] and references therein). Also worth considering is that only four different models belonging to the CMIP5 dataset were used in [
75]. In spite of this, it could be seen that this CMIP5 subset showed an increase in the frequencies of blocking occurrences along 45° W, north of 45° S, during MAM ([
75]; see their
Figure 2), something that was, to a greater or lesser degree, in accordance with the differences shown in
Figure 7b for both datasets. In contrast, according to [
75], there was a slight decrease in the frequency of blockings between 135° W and 90° W during MAM in the CMIP5 dataset; this was unmatched in the ERA5 dataset, but the decrease in the blocking counting seemed to be properly reproduced in the NCEP dataset within the area (
Figure 7b). These disparate results could be tied to the location of blockings being sensitive to the chosen dataset [
42].
Skewness minima were recorded during JJA (
Figure 5d), which meant that the number of blockings in the EH and in the WH had the least difference of all seasons. Blockings in the former hemisphere accounted for 28.84% of the season’s total, the greatest of all seasons in the ERA5 dataset, while in the NCEP dataset, this percentage was 27.45%, only exceeded by the one in DJF (30.87%). The skewness represented this situation well, as it was lower for the ERA5 distribution than for the NCEP counterpart. The frequencies, as estimated from both datasets, were statistically different between 20° E and 80° E, whereas they were alike elsewhere (
Figure 6d). Again, the maximum absolute difference in the frequencies, 1.55% at 150° E, took place in or close to the region where the most number of blockings were located (
Figure 5d). It was also embedded in a cluster of longitudes where the NCEP figures outnumbered the ERA5 ones, 150° W–110° W, with the difference decreasing eastwards, ultimately shifting to positive values in the 100° W–70° W band. Besides significance,
Figure 6 also shows that JJA was the season that had the overall lower difference.
Regarding the deviations with respect to the annual average, the results in both reanalyses agreed reasonably well, with
(
Figure 7c). The maximum frequencies still occurred in the surroundings of the DL, at 160° W (8.51%) and at 150° W (8.98%) for the ERA5 and the NCEP datasets, respectively (
Figure 5d). The two distinct maxima that were located on both sides of the GM in DJF merged into a single lobe of secondary maxima in JJA. In the ERA5 dataset, it spanned approximately the 50° W–30° E longitudes with a peak (0.87%) in the SWA at 30° W; in the case of the NCEP dataset, this single lobe also had its peak at 30° W (0.78%), but it stretched from 40° W to 50° E. A remarkable contrast with respect to DJF was the reduction in the number of blockings within the 170° E–130° W range when compared to the annual average, which resulted in an increase in the frequencies just east and west of this range (
Figure 7c).
Regionally, when compared with the annual figures, there was an increase in blocking cases in the PAC in the ERA5 dataset (90.66%), whereas a decrease in the NCEP dataset occurred (91.82%); a decrease to 3.29% and an increase to 2.41% were recorded in the IND in the ERA5 and in the NCEP datasets, respectively. On the other hand, the behavior in both reanalyses was the same in the ATL, with decreases to 6.05% (ERA5) and to 5.77% (NCEP) (
Table 1).
As for SON, the primary location of blockings was just east of the DL, at 170° W in both reanalyses, accounting for 8.97% (ERA5) and 9.24% (NCEP) of the total number of the seasons’ cases (
Figure 5e). The frequencies were in statistical disagreement between the GM and 100° E, and concordant elsewhere (
Figure 6e). The maximum absolute difference took place at 140° W (1.87%). Moreover, blockings in the ERA5 dataset outnumbered those in the NCEP counterpart between 90° W and 160° E, and the opposite occurred beyond these longitudes.
Overall, the EH had an apparent reduction in frequencies when compared with the annual averages, whereas in the WH east of 150° W, the opposite took place (
Figure 7d). This was confirmed by the counting of blocking cases, which, in the EH, reached the lowest value in both reanalyses, accounting for 21.26% (ERA5) and 19.09% (NCEP), and resulted in more symmetric distributions than in the annual case, as supported by the skewness values of 0.89 (ERA5) and 0.93 (NCEP). In addition, according to
Figure 7d, the negative deviations were stronger than the positive ones. Indeed, the frequencies around 150° E went down to just below –2%, whereas the largest excesses, at 100° W, were slightly below 1.5%, with the anomalies in both cases being stronger in the NCEP dataset. The correlation between the anomalies in both datasets resulted in
; this aligned with the deterioration in the longitudinal jointness when compared with the solstices (
Figure 7a,c). On the other hand, only second- and third-rank maxima could, at first glance, be devised from
Figure 5e, but
Figure 7d aids with splitting the 110° W–10° W sector with positive frequency anomalies into two separate areas, namely 120° W–70° W in the SEP and 50° W–20° W in the SWA, with negative anomalies in between. Following this, the second-rank maximum occurred at 100° W, representing 4.63% (ERA5) and 4.93% (NCEP) of the total number of cases, and the third-rank maxima took place at 40° W in both the ERA5 (2.04%) and the NCEP (1.68%) datasets. The fourth-rank maximum was at 30° E (0.51%) in the ERA5 dataset, and in the NCEP dataset, there was a lobe of relative maximum frequencies that spanned the 0–90° E range and peaked at 30° E and at 60° E (0.28% each).
When compared to the regional annual figures, there was a decrease in the counting of blockings in the PAC to 86.69% (ERA5) and to 90.85% (NCEP) at the expense of a rise in the other two sectors (ERA5) (
Table 1). Regarding the NCEP dataset, the frequency reshuffling entailed a decrease in both the PAC and the IND (1.88% versus 2.12%) and an increase in the ATL (7.26% versus 5.80%).
The annual distributions of blocking cases restricted to
and
are concisely discussed for the sake of completeness. It can be seen from
Figure 5f that the distribution for
followed a pattern that was similar to the one for the entire sample of blockings (
Figure 5a). The skewnesses revealed that these blockings were more symmetrically distributed around the DL. The frequency differences in
Figure 6a,f generally resembled each other, but with magnified values in the latter case. A noteworthy feature was that in the area stretching from the GM to 90° E, the differences were significant and reached their maximum value (0.66%) in the latter longitude. When compared with
Figure 6a, the overall maximum is positioned at 170° E, where these mid-intense blockings were more frequent in the NCEP database by 1.58%. Actually, when compared with
Figure 6a, greater negative differences were found in the area encompassing the 150° E–180° E band. The opposite occurred in the region between 100° W and 70° W, where positive differences were magnified when compared with
Figure 6a. In contrast, the area between the two foregoing regions that saw an amplification of the differences exhibited smaller values, and the difference at 170° W changed from positive to negative.
The most intense blockings, i.e.,
, were more frequent at 90° W in the ERA5 dataset, accounting for 11.60% of the cases, and at 160° W (17%) in the NCEP dataset (
Figure 5g). Moreover, in the NCEP dataset, there were no extreme cases within the IND basin; therefore, the associated skewness was relatively large when compared with the ERA5’s counterpart. The frequency difference in these blockings was, in general, greater than the ones discussed so far. The location of the maximum absolute values took place at 170° W (7.62%) and 160° W (5.62%) (
Figure 6g). Although statistically indistinguishable, as with the majority of the differences shown in
Figure 6g, the counting at the latter two longitudes in the NCEP dataset outnumbered the ERA5 counterpart. Conversely, there existed statistical discordance in the 130° E–150° E range, at 170° E, and in the 20° W–10° W band, with the counting of these particular blockings being greater in the ERA5 dataset than in the NCEP counterpart in the latter case only.
3.2.2. Comparative Distributions Across the Year at Selected Longitudes
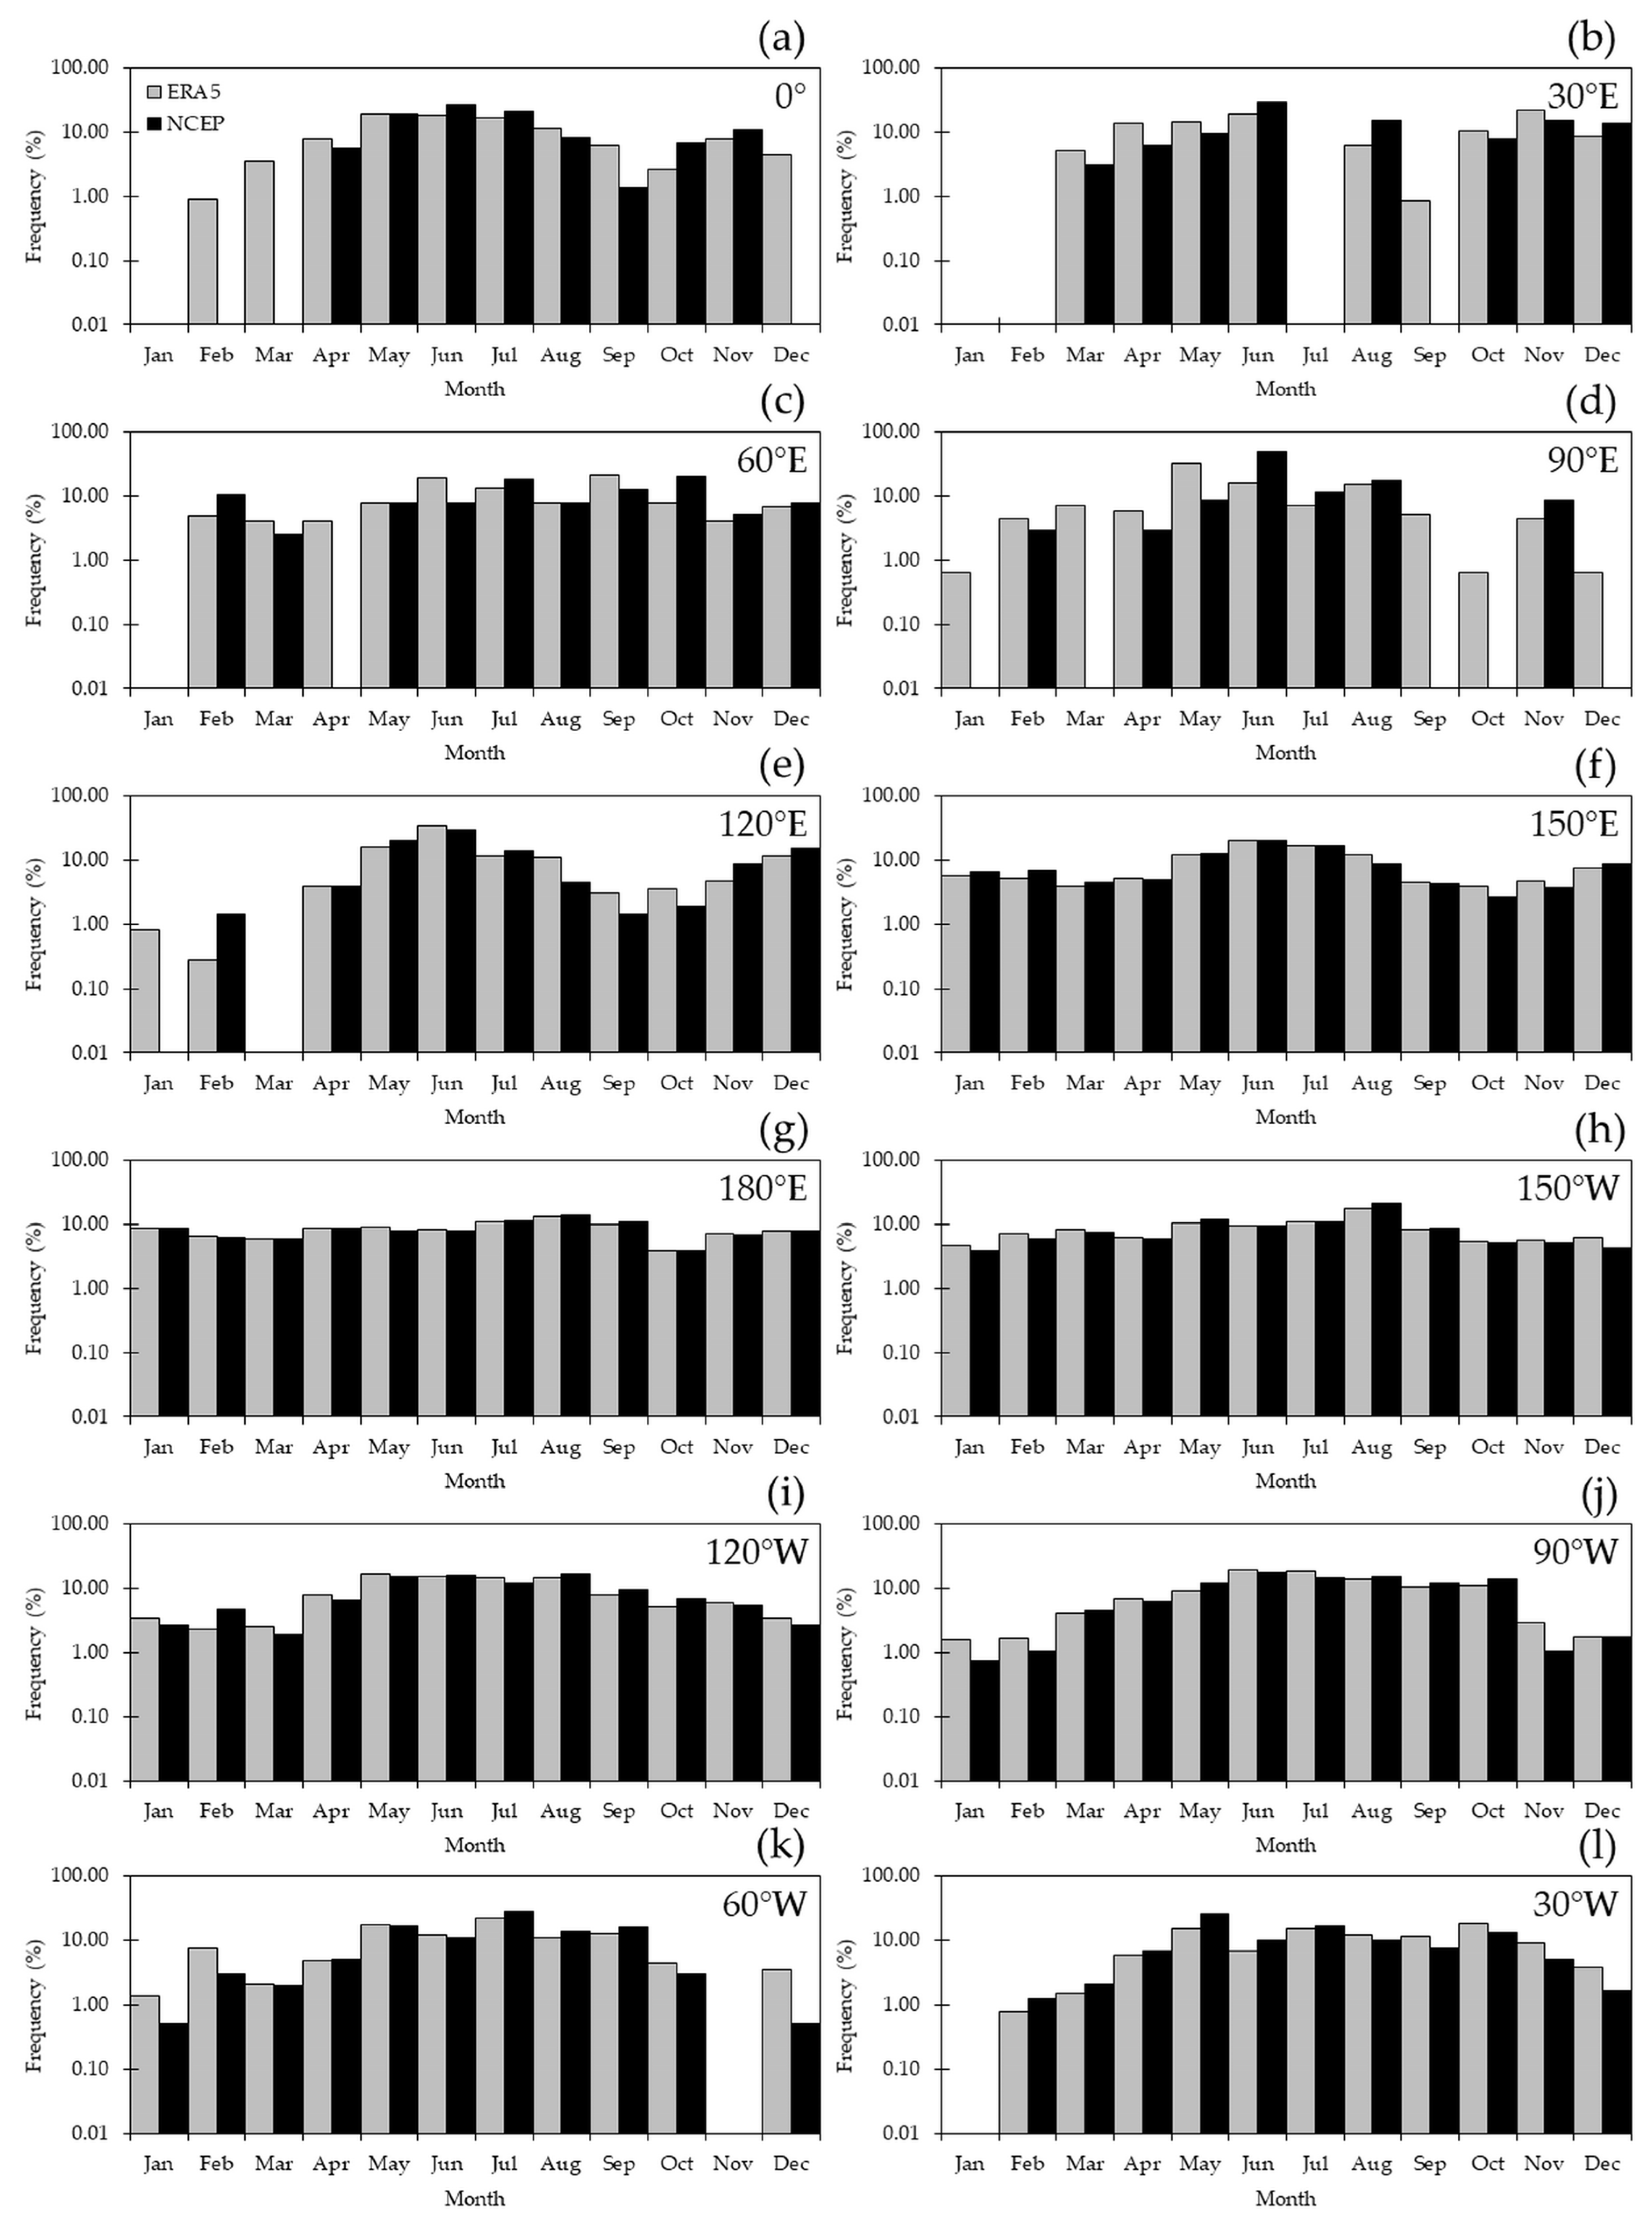
Illustrated in
Figure 8 is the annual cycle in the frequency of blocking cases for every 30°of longitude. At the GM (
Figure 8a), there were no detected blockings in January in both reanalyses. Besides this month, the ERA5 dataset had blockings in the rest of the year, with loci of primary and secondary maxima peaking in May (19.47%) and in November (7.96%), respectively, whereas the location of blockings in the NCEP dataset was restricted to the April–November span, with maxima in June (26.39%) and in November (11.11%). The analysis of this longitude is in concordance with the aforementioned fact that blockings were more prone to occur in the cool season and over the oceans. At 30° E (
Figure 8b), there were no blockings in January, February, and July. The latter month marked a discontinuity in the presence of blockings in this particular area. Actually, the quarter March–June registered cases in both datasets, with the maximum frequency peaking at 18.97% (ERA5) and 29.23% (NCEP), there were no cases at all in mid-winter, and blockings re-emerged in the area from August to December in a continuous fashion in the ERA5 dataset, ranging from 0.86% (September) to 21.55% (November), and with a gap in September in the NCEP dataset. Not considering September, the frequencies in the NCEP dataset ranged from 7.69% (October) to 15.38% (August and November). As with the two previous longitudes, there were no blockings located at 60° E in January (
Figure 8c). The occurrence of blockings in the other months had a match in both reanalyses, with the exception of April, in which no blockings were found in the NCEP dataset. The distinction of different loci at this longitude was not as clear as it was in the previous two cases. The frequencies varied from 3.96% (March, April, and November) and 20.79% (September) in the ERA5 dataset, and from 2.56% (March) to 20.51% (October) in the NCEP dataset. There was a continuous presence of blockings in the ERA5 dataset across the year at 90° E, with a maximum in May (32.69%) and a minimum in January and in October (0.64% each) (
Figure 8d). On the other hand, the monthly NCEP time series had breaks in January, March, September, October, and December. Aside from these months, the minimum frequency was 2.86% in February and in April, and the maximum frequency occurred in June (48.57%). As seen in
Figure 8, the easternmost longitude in the EH that exhibited alterations no occurrence of blockings was 120° E (
Figure 8e): it had no observed cases in March (ERA5) and in January and March (NCEP). In spite of these missing values, the frequency time series seemed to be modulated by a strong semi-annual wave that maximized in the solstices, with frequencies accounting for 33.52% (June) and 11.63% (December) in the ERA5 dataset and 29.61% (June) and 15.05% (December) in the NCEP counterpart. The presence of the semi-annual cycle is not unexpected, as it is one of the main forcings of the whole troposphere ([
79] and references therein). More specifically, [
80] analyzed the semi-annual wave in the frequency of COLs, whose interplay with the low-over-high blocking was described in the Introduction. Nonetheless, it is worth noting that the annual evolution of the frequency of blockings in
Figure 8e was not expected to follow the one for COLs in a close fashion since the other two types of 500 hPa patterns that fit into the definition of Equations (2) and (3), i.e., omega blockings and large-amplitudes ridges, presumably were unaccounted for in [
80].
There was a region spanning at least 120°, between 150° E and 90° W (
Figure 8f–j), in which the frequency time series had no interruptions throughout the year in both reanalyses. At 150° E (
Figure 8f), the frequencies ranged between 3.84% and 19.85% in the ERA5 reanalysis and between 2.71% and 20.14% in the NCEP counterpart, with the maxima (minima) taking place in June (October) in both cases. At 180° E (
Figure 8g), the minima also occurred in October in both datasets, with frequencies of 3.79% (ERA5) and 3.90% (NCEP). However, the maxima shifted to August: 13.40% (ERA5) and 14.08% (NCEP). It is worth noting that the maximum frequencies were smaller than those at 150° E because of a more even distribution of blockings at 180° E than at 150° E, something that is visible from
Figure 7. The unevenness increased to the east of the DL at 150° W (
Figure 8h), with minima of 4.58% (ERA5) and 3.90% (NCEP), both in January, and maxima of 17.12% (ERA5) and 21.32% (NCEP), both in August. At 120° W (
Figure 8i), the minimum frequencies were 2.27% in February (ERA5) and 1.87% in March (NCEP), while the maximum values were 17.02% in May (ERA5) and 16.98% in August (NCEP). Such behavior marked, on average, a steeper minimum-to-maximum transition in the NCEP dataset that was unseen in the three foregoing latitudes. The remaining longitude with an uninterrupted record across the year, i.e., 90° W (
Figure 8j), showed minima of 1.55% (ERA5) and 0.76% (NCEP), both in January, and maxima of 19.30% (ERA5) and 17.13% (NCEP), both in June.
There was a single month with missing blockings at 60° W and at 30° W (
Figure 8k,l, respectively), in November and January, respectively. For the rest of the year, the frequencies at 60° W were in the 1.39–22.22% range in the ERA5 dataset, with the minimum (maximum) occurring in January (July), and were between 0.51% and 28.28% in the NCEP dataset, with a double minimum in December–January and a maximum in July. As for 30° W (
Figure 8l), the maximum was 18.04% in October (ERA5) and 25.42% in May (NCEP); from another perspective, these particular results replicated the local maxima found in the ATL during the equinoxes (cf.
Figure 5c,e). If the longitudes were not restrained to those presented in
Figure 8, the absolute maximum frequency reached 34.09% at 80° E in July in the ERA5 dataset and 48.57% at 90° E in June in the NCEP dataset (
Figure 8d).
3.2.3. Comparative Wave Analysis
In the example provided at the beginning of
Section 3 (cf.
Figure 3 and
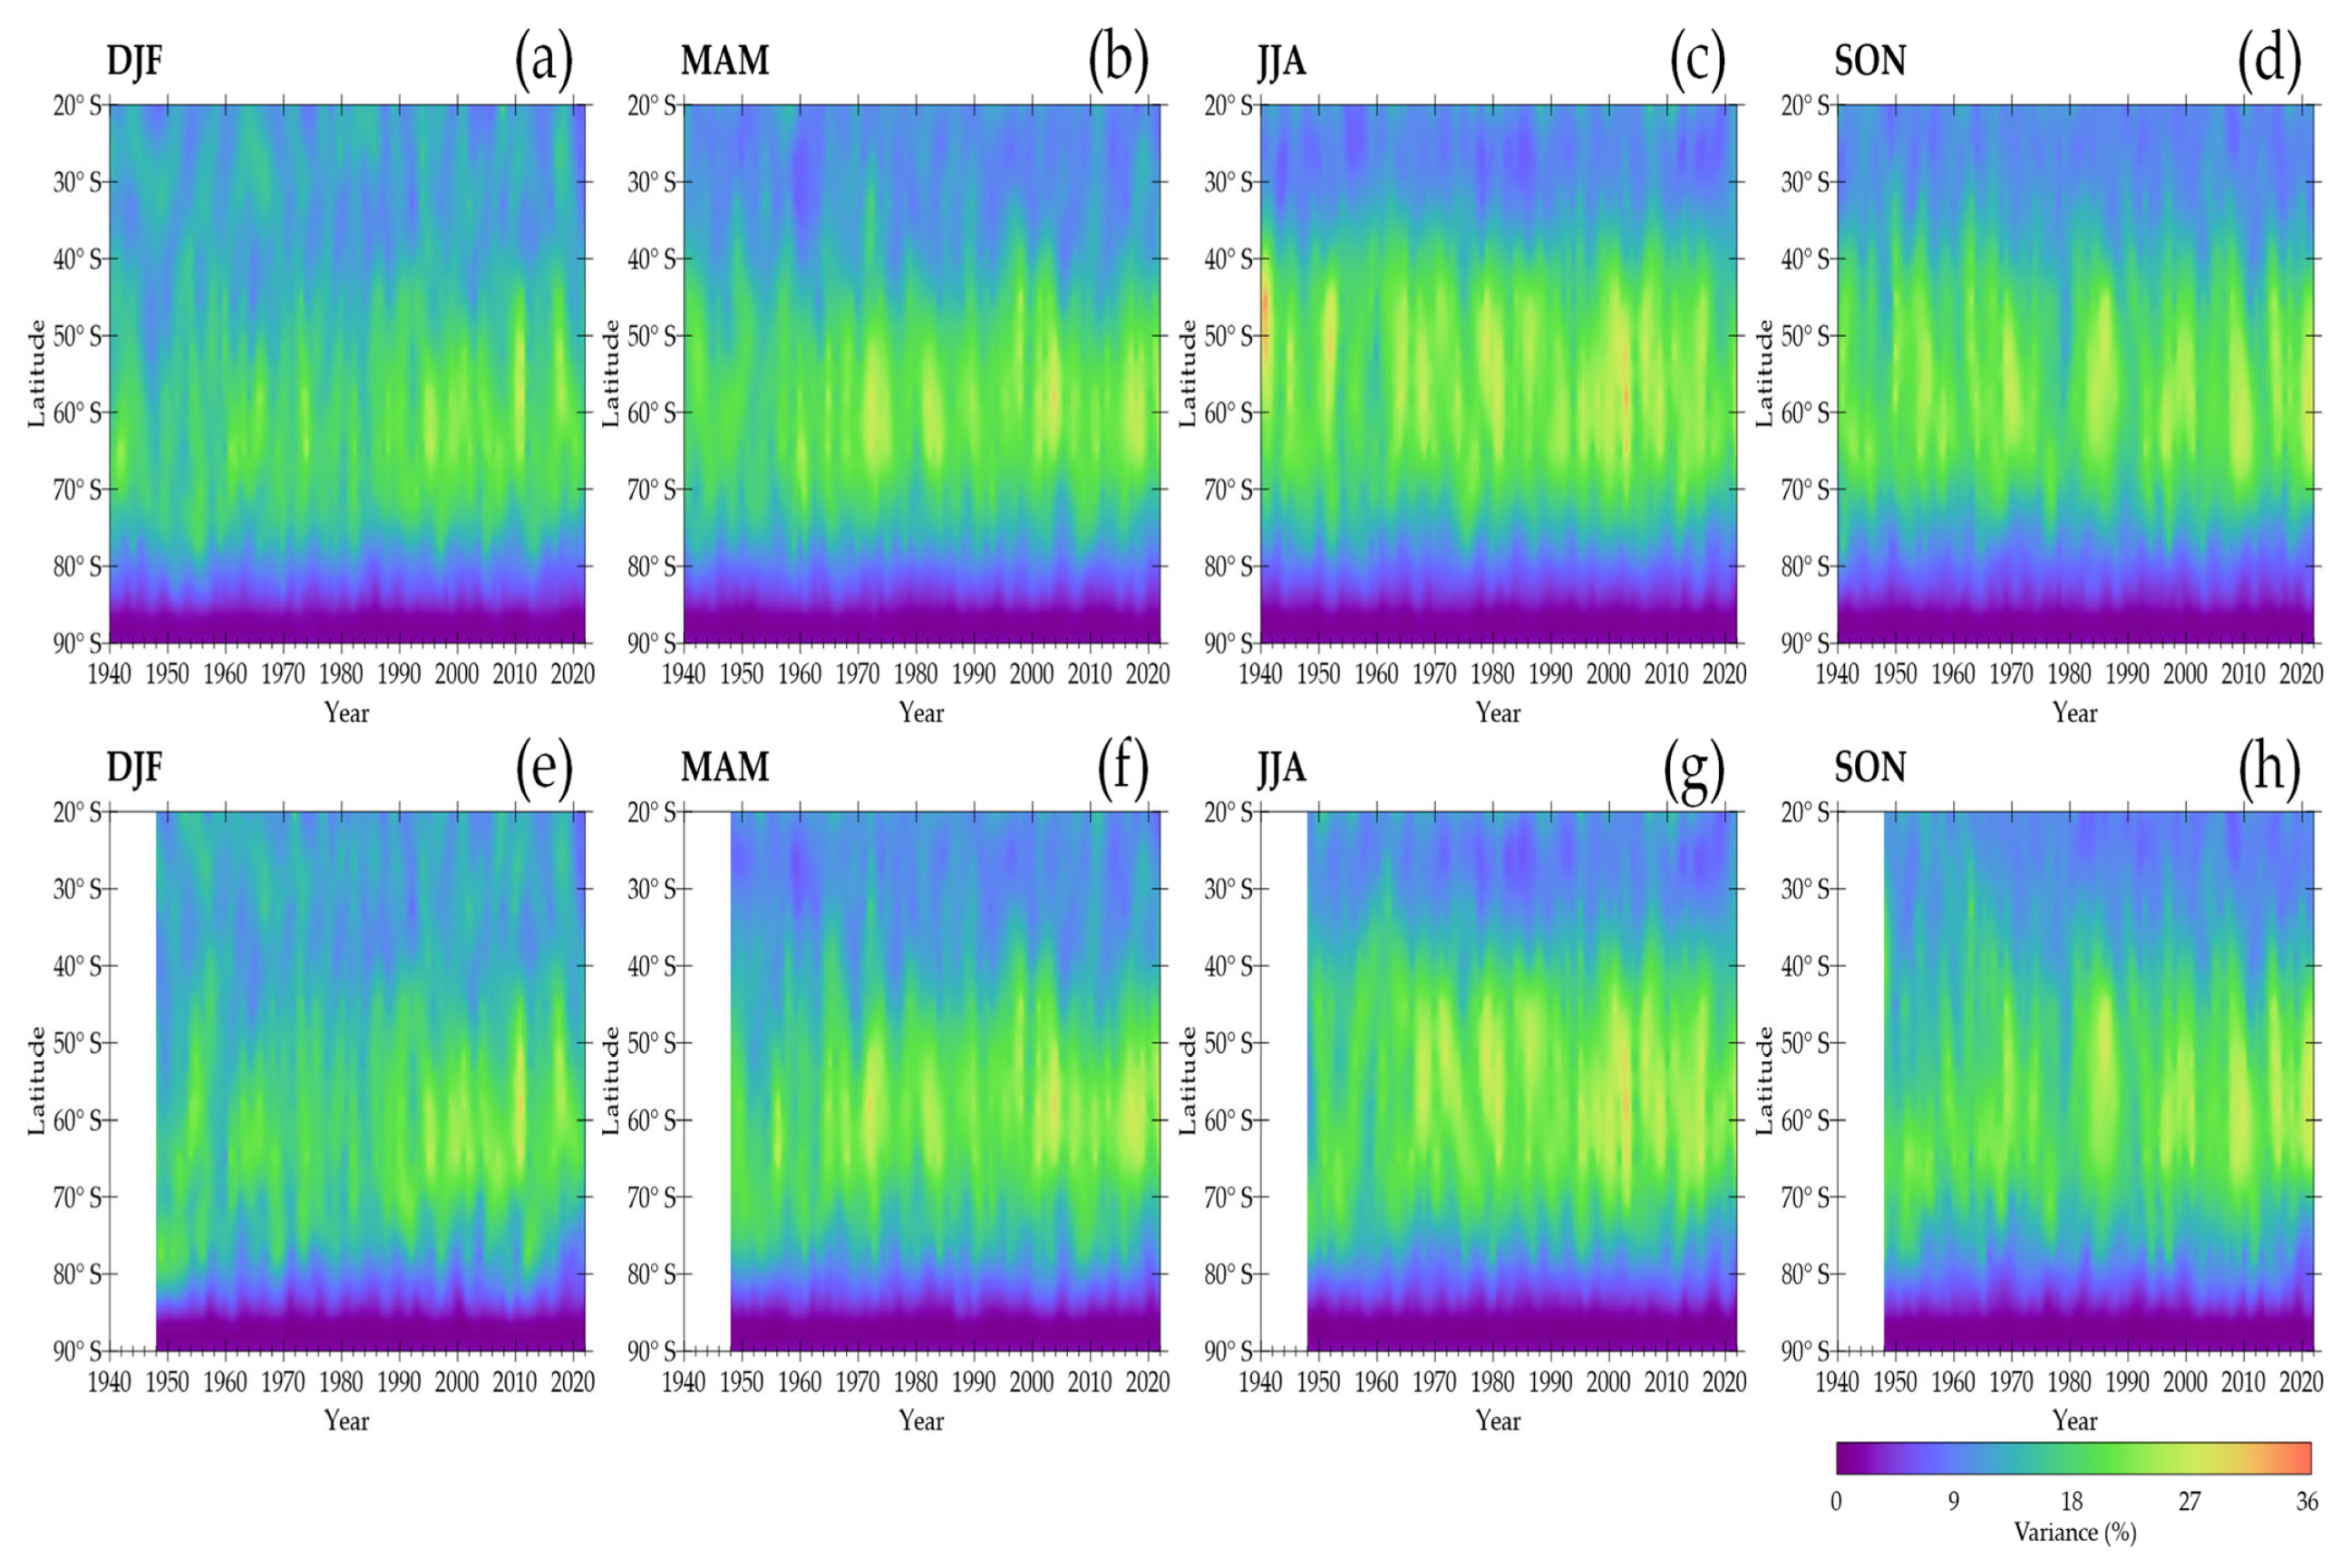
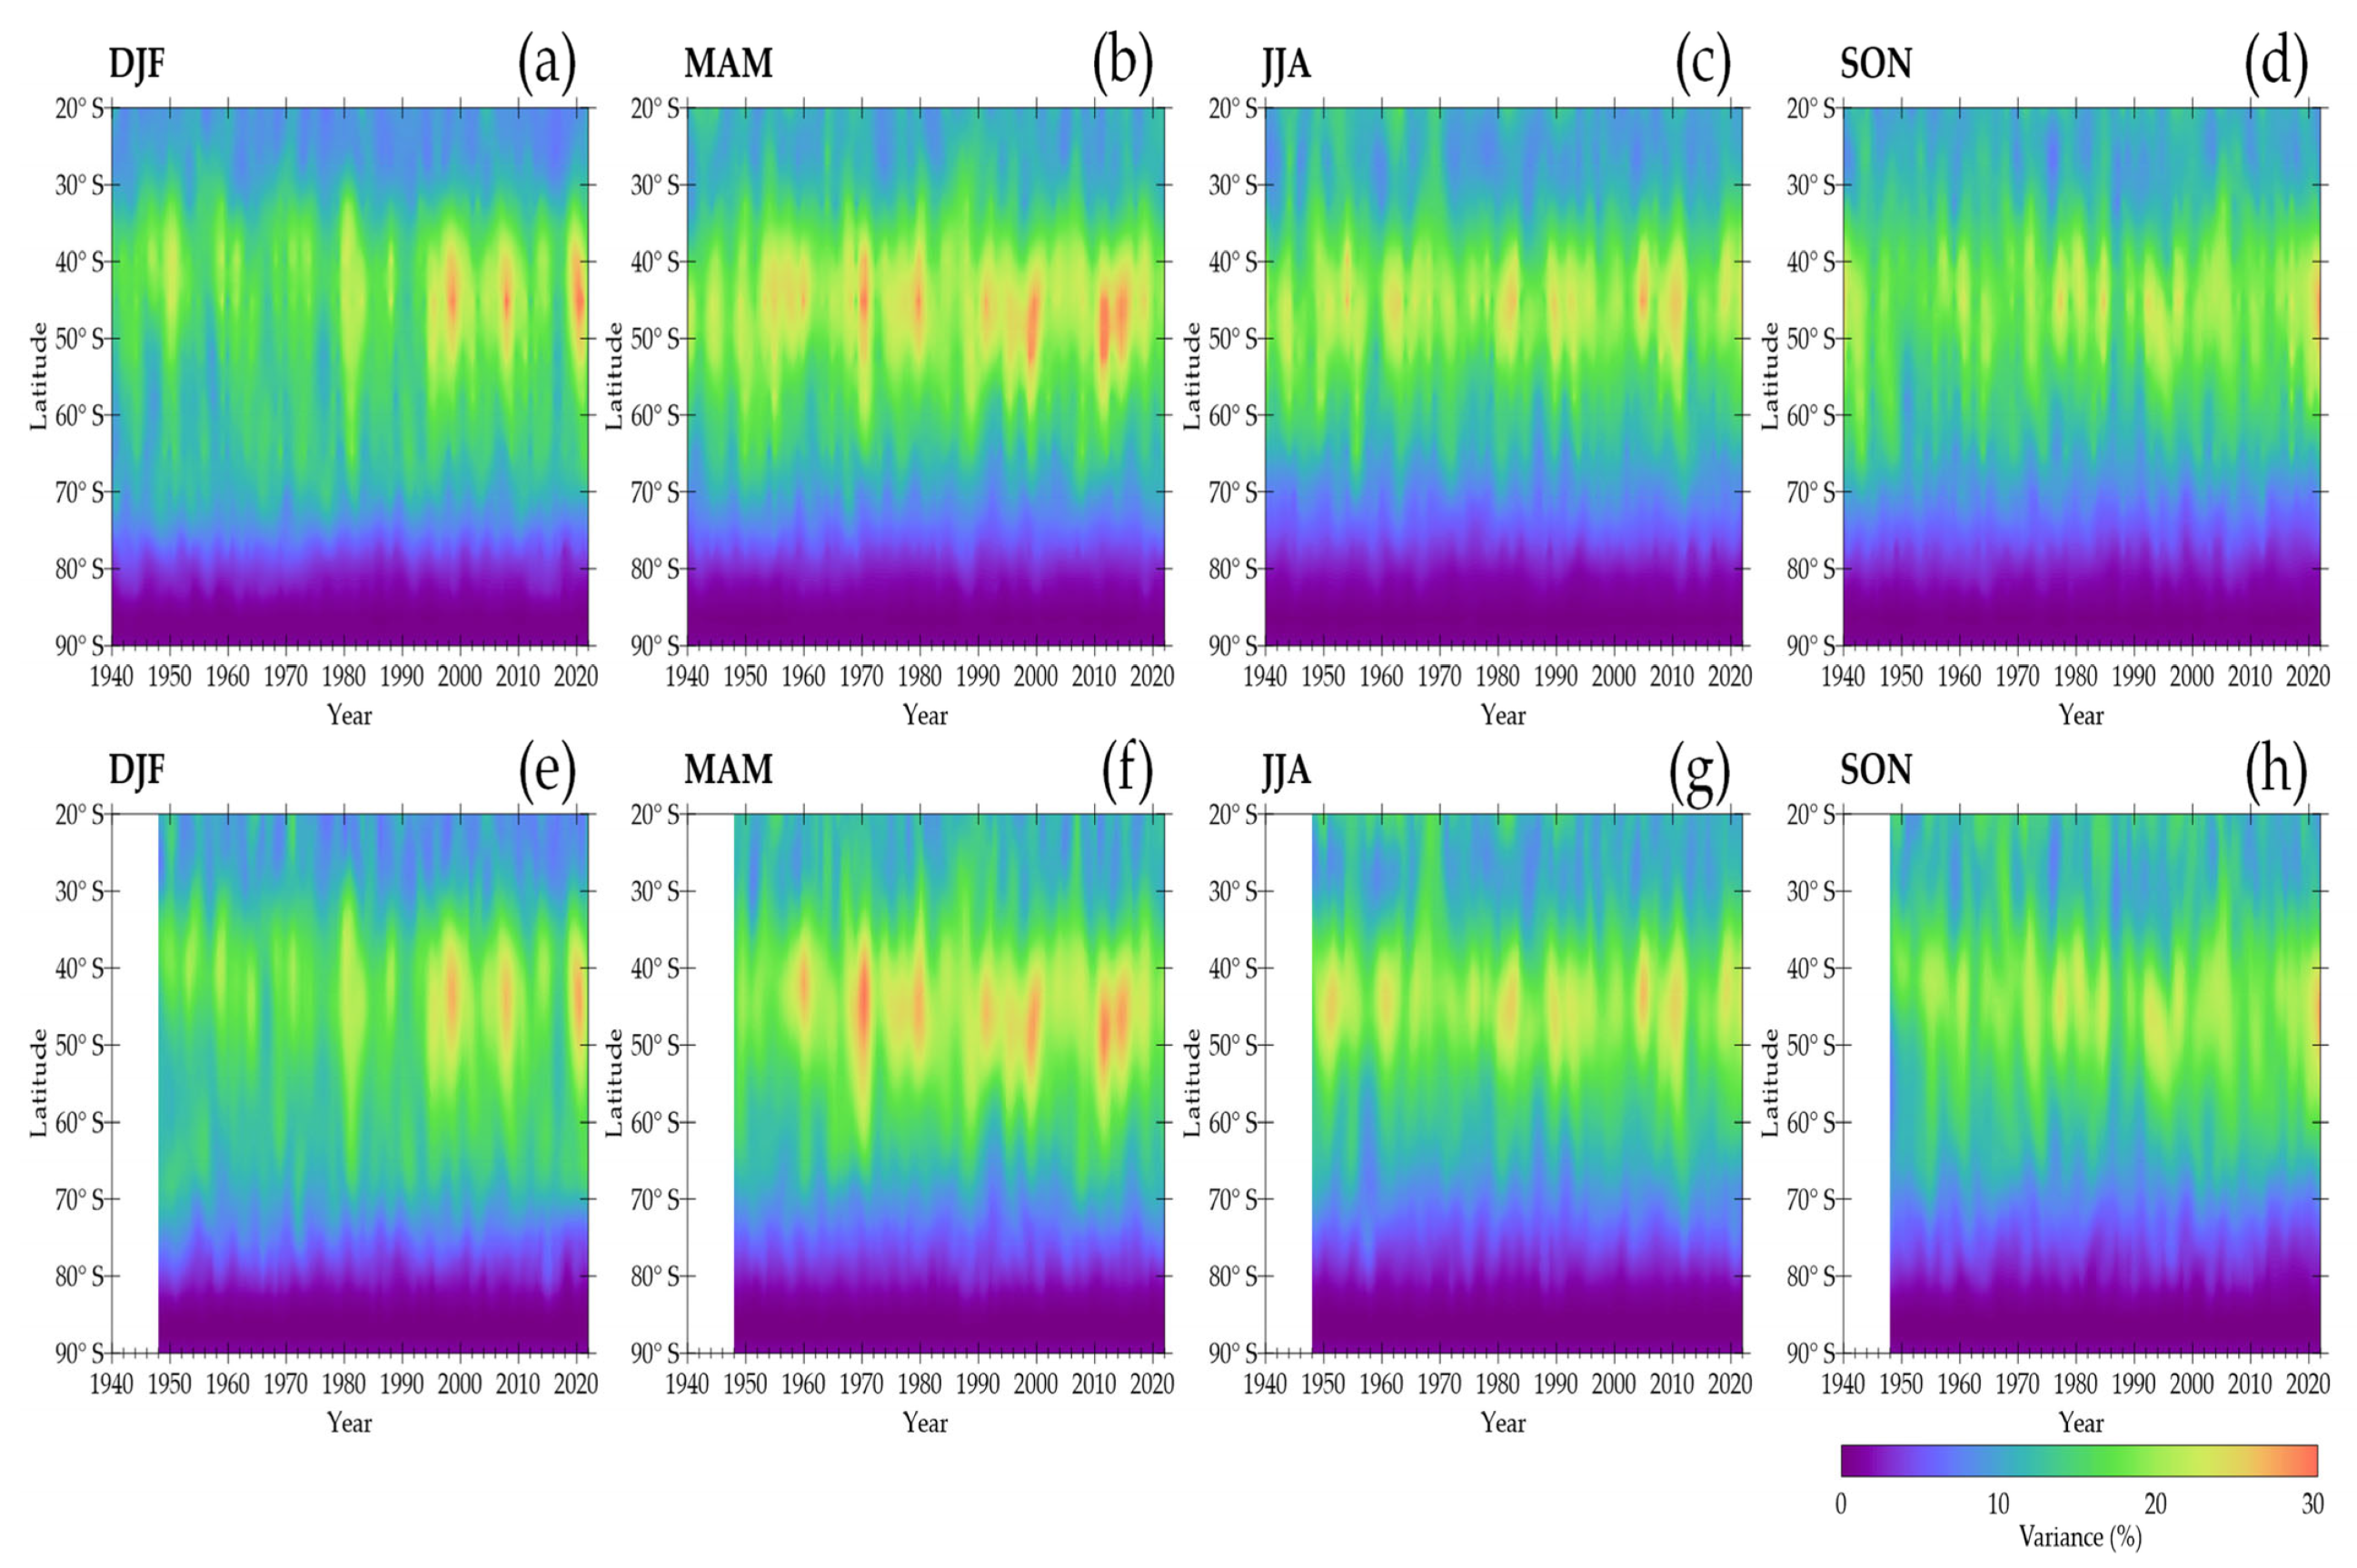
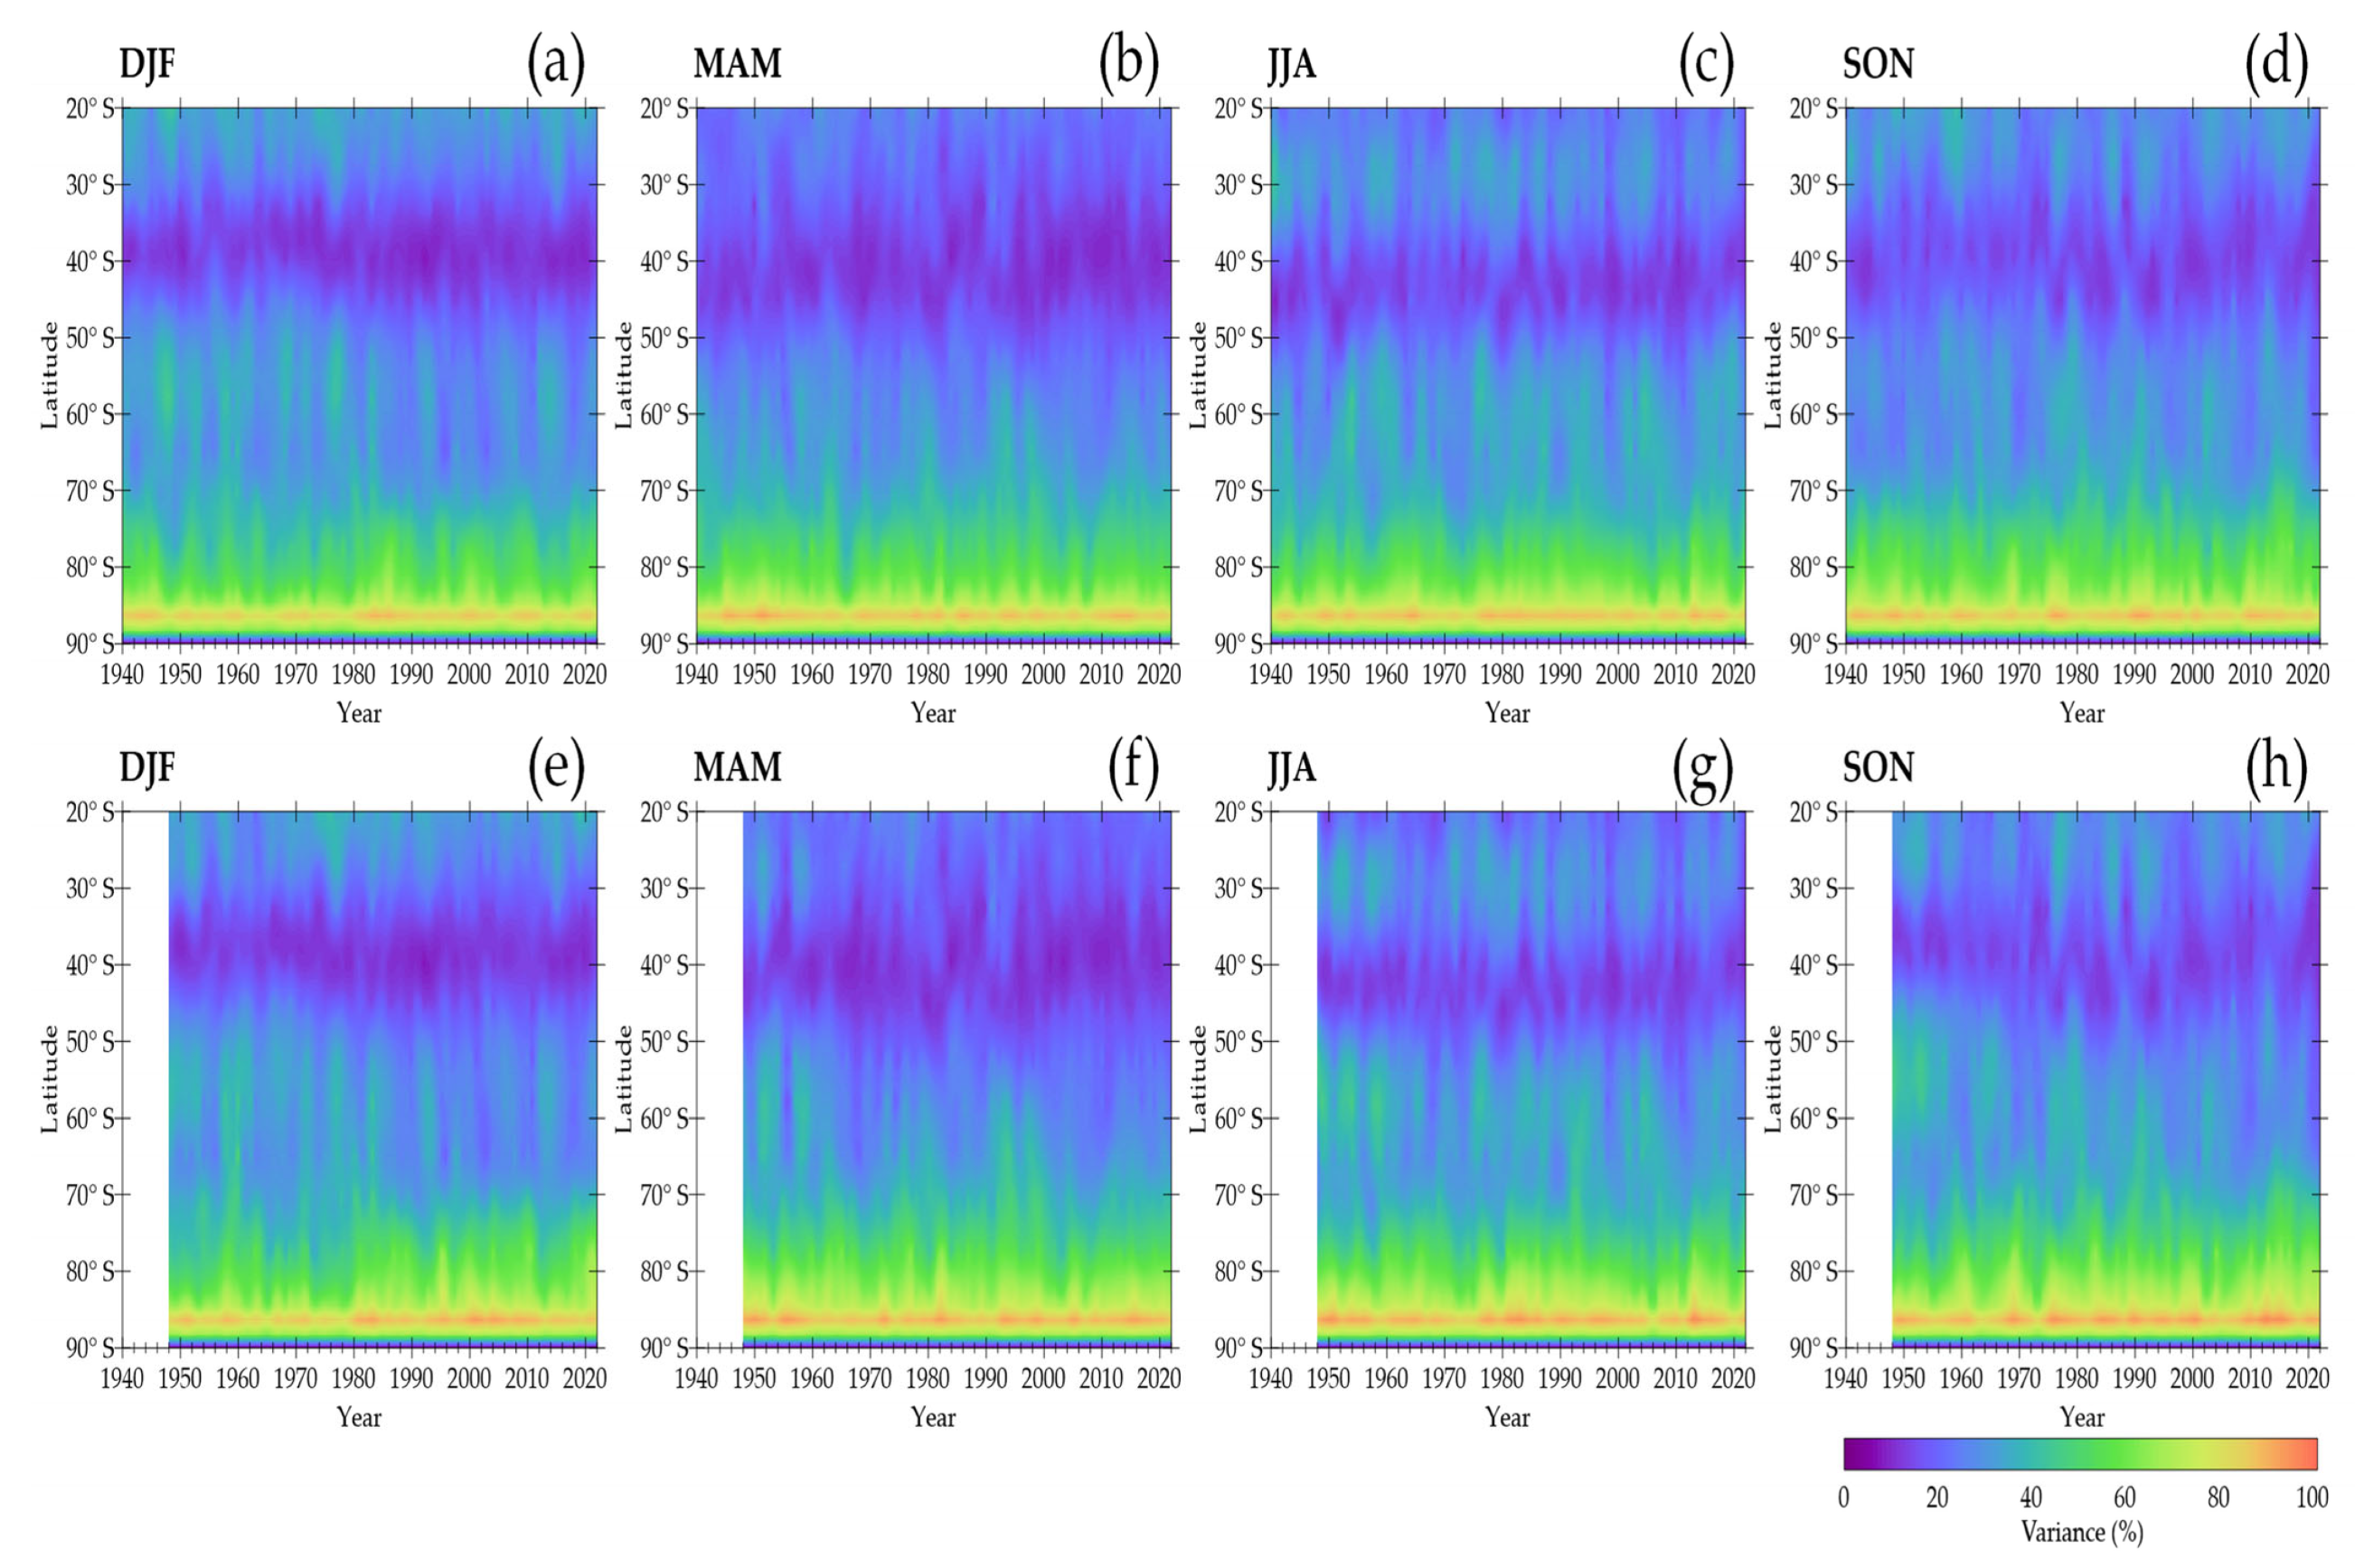
Figure S1), the contributions of the most representative wavenumbers at 35° S and 50° S were presented. In this sub-section, we introduce the contribution of the most representative wavenumbers at the foregoing two latitudes for the entire blocking dataset that was extracted from the two databases. The most representative wave was estimated by identifying the largest single contribution to the variance of the ZGH field, i.e., the largest value of
in (1) (or the largest amplitude).
Table 2 shows a consolidated picture of the combined contribution, on an annual basis, of the wavenumber that accounted for most of the variance at each of the latitudes on the individual dates on which the blocking condition was fulfilled at least once (i.e., a blocked day). Similarly,
Table 3 and
Table 4 show the contributions in DJF and JJA, respectively.
Out of 5191 blocked days in the annual case in the ERA5 dataset (
Table 2), W1 took on the variance’s largest proportion, both at 35° S and at 50° S, with 2008 (38.68%) and 2068 (39.83%) days, respectively. It was followed by W4 (706 days, 13.60%) and W5 (703 days, 13.54%) at 35° S, and by W3 (1316 days, 25.35%) and W4 (703 days, 17.72%) at 50° S. Denoting the pair of dominant wavenumbers at the foregoing latitudes as
, the most frequent combination was (W1,W1), associated with 769 days (14.81%), followed by (W1,W3) (550 days, 10.60%) and (W1,W4) (354 days, 6.82%). The longest wavenumbers that took on the variance’s maximum percentage were W9 at 35° S (3 days) and W7 at 50° S (1 day).
Regarding the NCEP dataset, there were 3818 blocked days. The three most representative waves at 35° S were W1 (39.50%, 1508 days), W4 (13.36%, 514 days), and W2 (13.41%, 512 days), while at 50° S, they were W1 (44.39%, 1695 days), W3 (23.57%, 900 days), and W4 (16.06%, 613 days). In this case, the (W1,W1) pair was also the most frequent, tallying 17.50% of the days (668), and it was also followed by the (W1,W3) and the (W1,W4) pairs, with 363 days (9.51%) and 252 days (6.60%), respectively. The percentage represented by the (W1,W1) pair was higher in the NCEP dataset, whereas the opposite occurred for the other two pairs. The longest wavenumbers that exhibited the variance’s maximum fraction were W9 at 35° S (3 days) and W6 at 50° S (14 days).
From a wave standpoint, the exclusion of W2 from the analysis presented in
Section 2.1 is further supported by the following considerations. Out of 5191 blocked days in the ERA5 dataset, W2 was the most prominent wave in 683 and 601 days, at 35° S and 50° S, respectively, taking on 13.16% and 11.58% of the total. In the NCEP dataset, out of 3818 blocked days, W2 was the most prominent wave on 512 (13.41%) and 450 (11.79%) days at 35° S and 50° S, respectively. The similarities in the importance of W2 to blockings at these two latitudes in both datasets are worth noting. Additionally, in terms of represented days, W2 came behind W1, W4, and W5 at 35° S, and behind W1, W3, and W4 at 50° S in the ERA5 dataset. In the NCEP counterpart, W2 came behind W1 and W4 at 35° S, and behind W1, W3, and W4 at 50° S. The dominance of W1, W3, and W4 over W2 was also in conformity with the findings in [
66] using an EOF approach, in which W1 and W3 had a prevalence for EOF1, whereas EOF2 was driven by W4 and was tied to winter. Despite the differences between the NH and the SH regarding blockings [
30,
81], our results are also in agreement with those presented in [
29] for the NH, for it was found that the preponderance of W1 during blockings more than quintupled that of W2.
The number of blocked days in DJF totaled 829 (ERA5) and 583 (NCEP), and they constituted 15.97% and 15.27% of the corresponding totals presented in
Table 2. This made a difference of less than 1% between the two datasets. Considering 35° S alone, in the ERA5 dataset, W1 made up 61.22% (245 days) of the total (versus 38.68% in the annual figures). As for the NCEP dataset, it represented 56.96% (158 days) of the total (compared to 39.50% in the annual case). At 50° S, the figures for W1 were at 33.03% (454 days) (ERA5) and 27.86% (323 days) (NCEP), versus 39.83% (ERA5) and 44.39% (NCEP) in the annual case. Following these results, with respect to the annual figures, W1 had a remarkable increase in its occurrence during blocked days at 35° S, whereas there was a fall in its contribution at 50° S. As for the second and third most representative waves at 35° S, they were W2 and W5 in the ERA5 dataset, accounting for 17.73% (147 days) and 16.16% (134 days), respectively, while in the NCEP dataset, these waves were W2 (18.87%, 110 days) and W4 (17.67%, 103 days). The counterparts at 50° S were W3 and W4 in both datasets, with the relative contributions being 147 days (17.73%) and 108 days (13.03%), respectively, in the ERA5 dataset, and 98 days (16.81%) and 80 days (13.72%) in the NCEP dataset, respectively. Considering the two latitudes altogether, (W1,W1) was, as in the annual case, the more frequent combination, representing 16.82% (150 days) (ERA5) and 15.43% (90 days) (NCEP). Furthermore, (W2,W1) and (W5,W1) were the second and third most representative pairs in the ERA5 dataset, with 8.69% (72 days) and 8.56% (71 days), respectively, whereas in the NCEP dataset, (W4,W1) and (W5,W1) were second to (W1,W1), with 53 days each (9.09%).
The number of blocked days in JJA was 1947 (ERA5) and 1464 (NCEP) (
Table 4). These figures accounted for 37.51% and 38.34%, respectively, of the corresponding annual totals in
Table 2. Aside from the tiny difference between these two percentages, they show that more than a third of the blockings occurred in the cold season. At 35° S, W1 had the most explained variance in 973 days (49.97%) (ERA5) and 739 days (50.48%) (NCEP). The waves that followed W1 were W4 and W5 in both reanalyses: W4 took most of the variance in 224 days (11.50%) (ERA5) and in 160 days (10.93%) (NCEP), while for W5, these figures were 210 days (10.79%) (ERA5) and 159 (10.86%) (NCEP). Regarding 50° S, in both datasets, W1 also took on most of the variance, followed by W3 and W4. In the case of the ERA5 dataset, the number of days on which these waves had most of the variance were 666 (34.21%), 585 (30.05%), and 353 (18.13%), respectively, and in the NCEP dataset, these figures were 587 (40.10%), 403 (27.52%), and 243 (16.60%), respectively. With the two latitudes combined, (W1,W1), (W1,W3), and (W1,W4) were the pairs that had the most occurrence in both reanalyses, in 311 (15.97%), 305 (15.67%), and 184 days (9.45%), respectively, in the ERA5 dataset, and in 295 (20.15%), 204 (13.93%), and 129 (8.81%), respectively, in the NCEP dataset. A noticeable difference that arises from the comparison of
Table 3 and
Table 4 is that about half of the total number of blocked days in the cold season—973 out of 1947 (ERA5) and 739 out of 1464 (NCEP)— relied on the superposition of W1 at 35° S with longer waves at 50° S. Conversely, approximately the same fraction of blocked days in the hot season—454 out of 829 (ERA5) and 323 out of 583 (NCEP)—relied on the coexistence of W1 at 50° S with longer waves at 35° S.
