1. Introduction
Climate is one of the key factors shaping the dynamics of tourism on a global scale [
1,
2], influencing both the attractiveness of destinations and the overall visitor experience. Climate variables such as air temperature, precipitation, humidity, solar radiation, and wind directly affect not only tourists’ thermal comfort and health but also the functioning of tourism services, urban infrastructure, and the seasonality of demand [
1,
3,
4]. This influence is particularly critical in coastal regions, where sun-and-beach tourism is heavily dependent on favorable weather conditions [
3,
5,
6,
7].
In Brazil, tourism has emerged over the past few decades as a strategic driver of economic, social, and cultural development [
8,
9]. While traditionally established sun-and-beach destinations such as Salvador and Rio de Janeiro remain among the most visited by both domestic and international tourists [
5], there is increasing interest in alternative routes and cities outside the major tourism circuits [
10].
The city of João Pessoa is experiencing rapid tourism growth, positioning itself as one of the most sought-after emerging destinations in Brazil [
11]. This expansion has intensified pressure on the urban infrastructure and natural systems, demanding effective planning and management strategies to ensure the sustainability of tourism activities [
2,
3]. In this context, this study asks, how do climatic conditions shape the tourist experience and challenge the adaptive capacity of coastal cities like João Pessoa, particularly human thermal comfort and rainfall patterns? High thermal stress has been shown to alter the spatial behavior of tourists and reduce their satisfaction with urban destinations [
4,
12], reinforcing the need for climate-sensitive tourism planning.
Previous research has analyzed the relationship between climate and tourism in Brazilian contexts using both conceptual and empirical approaches, assessing the vulnerability of tourism to climate risks in Brazilian and Portuguese cities, highlighting the importance of locally adapted planning strategies [
13], and presenting the impacts of extreme heat on thermal comfort in Rio de Janeiro, using the Physiological Equivalent Temperature (PET), Modified Physiological Equivalent Temperature (mPET), and Heat Index (HI) to assess tourists’ exposure to heat stress [
14].
Despite these contributions, there is still a lack of studies in Brazil that use bioclimatic indicators such as PET and CTIS to compare emerging tourist cities to established ones, as an approach that could support more regionally appropriate planning strategies. Regarding this perspective, João Pessoa is an important case: it has relatively stable climatic conditions, shares important coastal characteristics with more prominent destinations, and is undergoing rapid tourism expansion without facing the intense urban saturation seen in cities such as Rio de Janeiro and Salvador [
11]. This positions João Pessoa as an opportune setting to investigate how climatic conditions shape tourism potential in the context of increasing tourist demand in the region.
This study aimed to analyze how the climatic conditions of João Pessoa influence sustainable tourism in the city, focusing on thermal sensation and rainfall. It also compares these aspects with those observed in Salvador and Rio de Janeiro, aiming to identify climatic patterns, local challenges, and adaptive strategies relevant to the growing tourism context of the Paraíba state capital. These two reference cities—consolidated coastal tourism hubs in Brazil—provide a comparative framework to highlight both similarities and differences in climatic conditions, helping to extract context-sensitive strategies applicable to João Pessoa.
The article proceeds by detailing the study area, climatic datasets, selected indicators, and analytical procedures. It then presents the main findings regarding thermal sensation and rainfall distribution in João Pessoa and their comparison with Salvador and Rio de Janeiro. The discussion explores the implications of these findings for sustainable tourism planning, emphasizing opportunities and adaptation needs. Finally, the conclusion summarizes the contributions of this study to outline future research directions in the field of climate-sensitive and resilient tourism.
2. Materials and Methods
2.1. Study Area
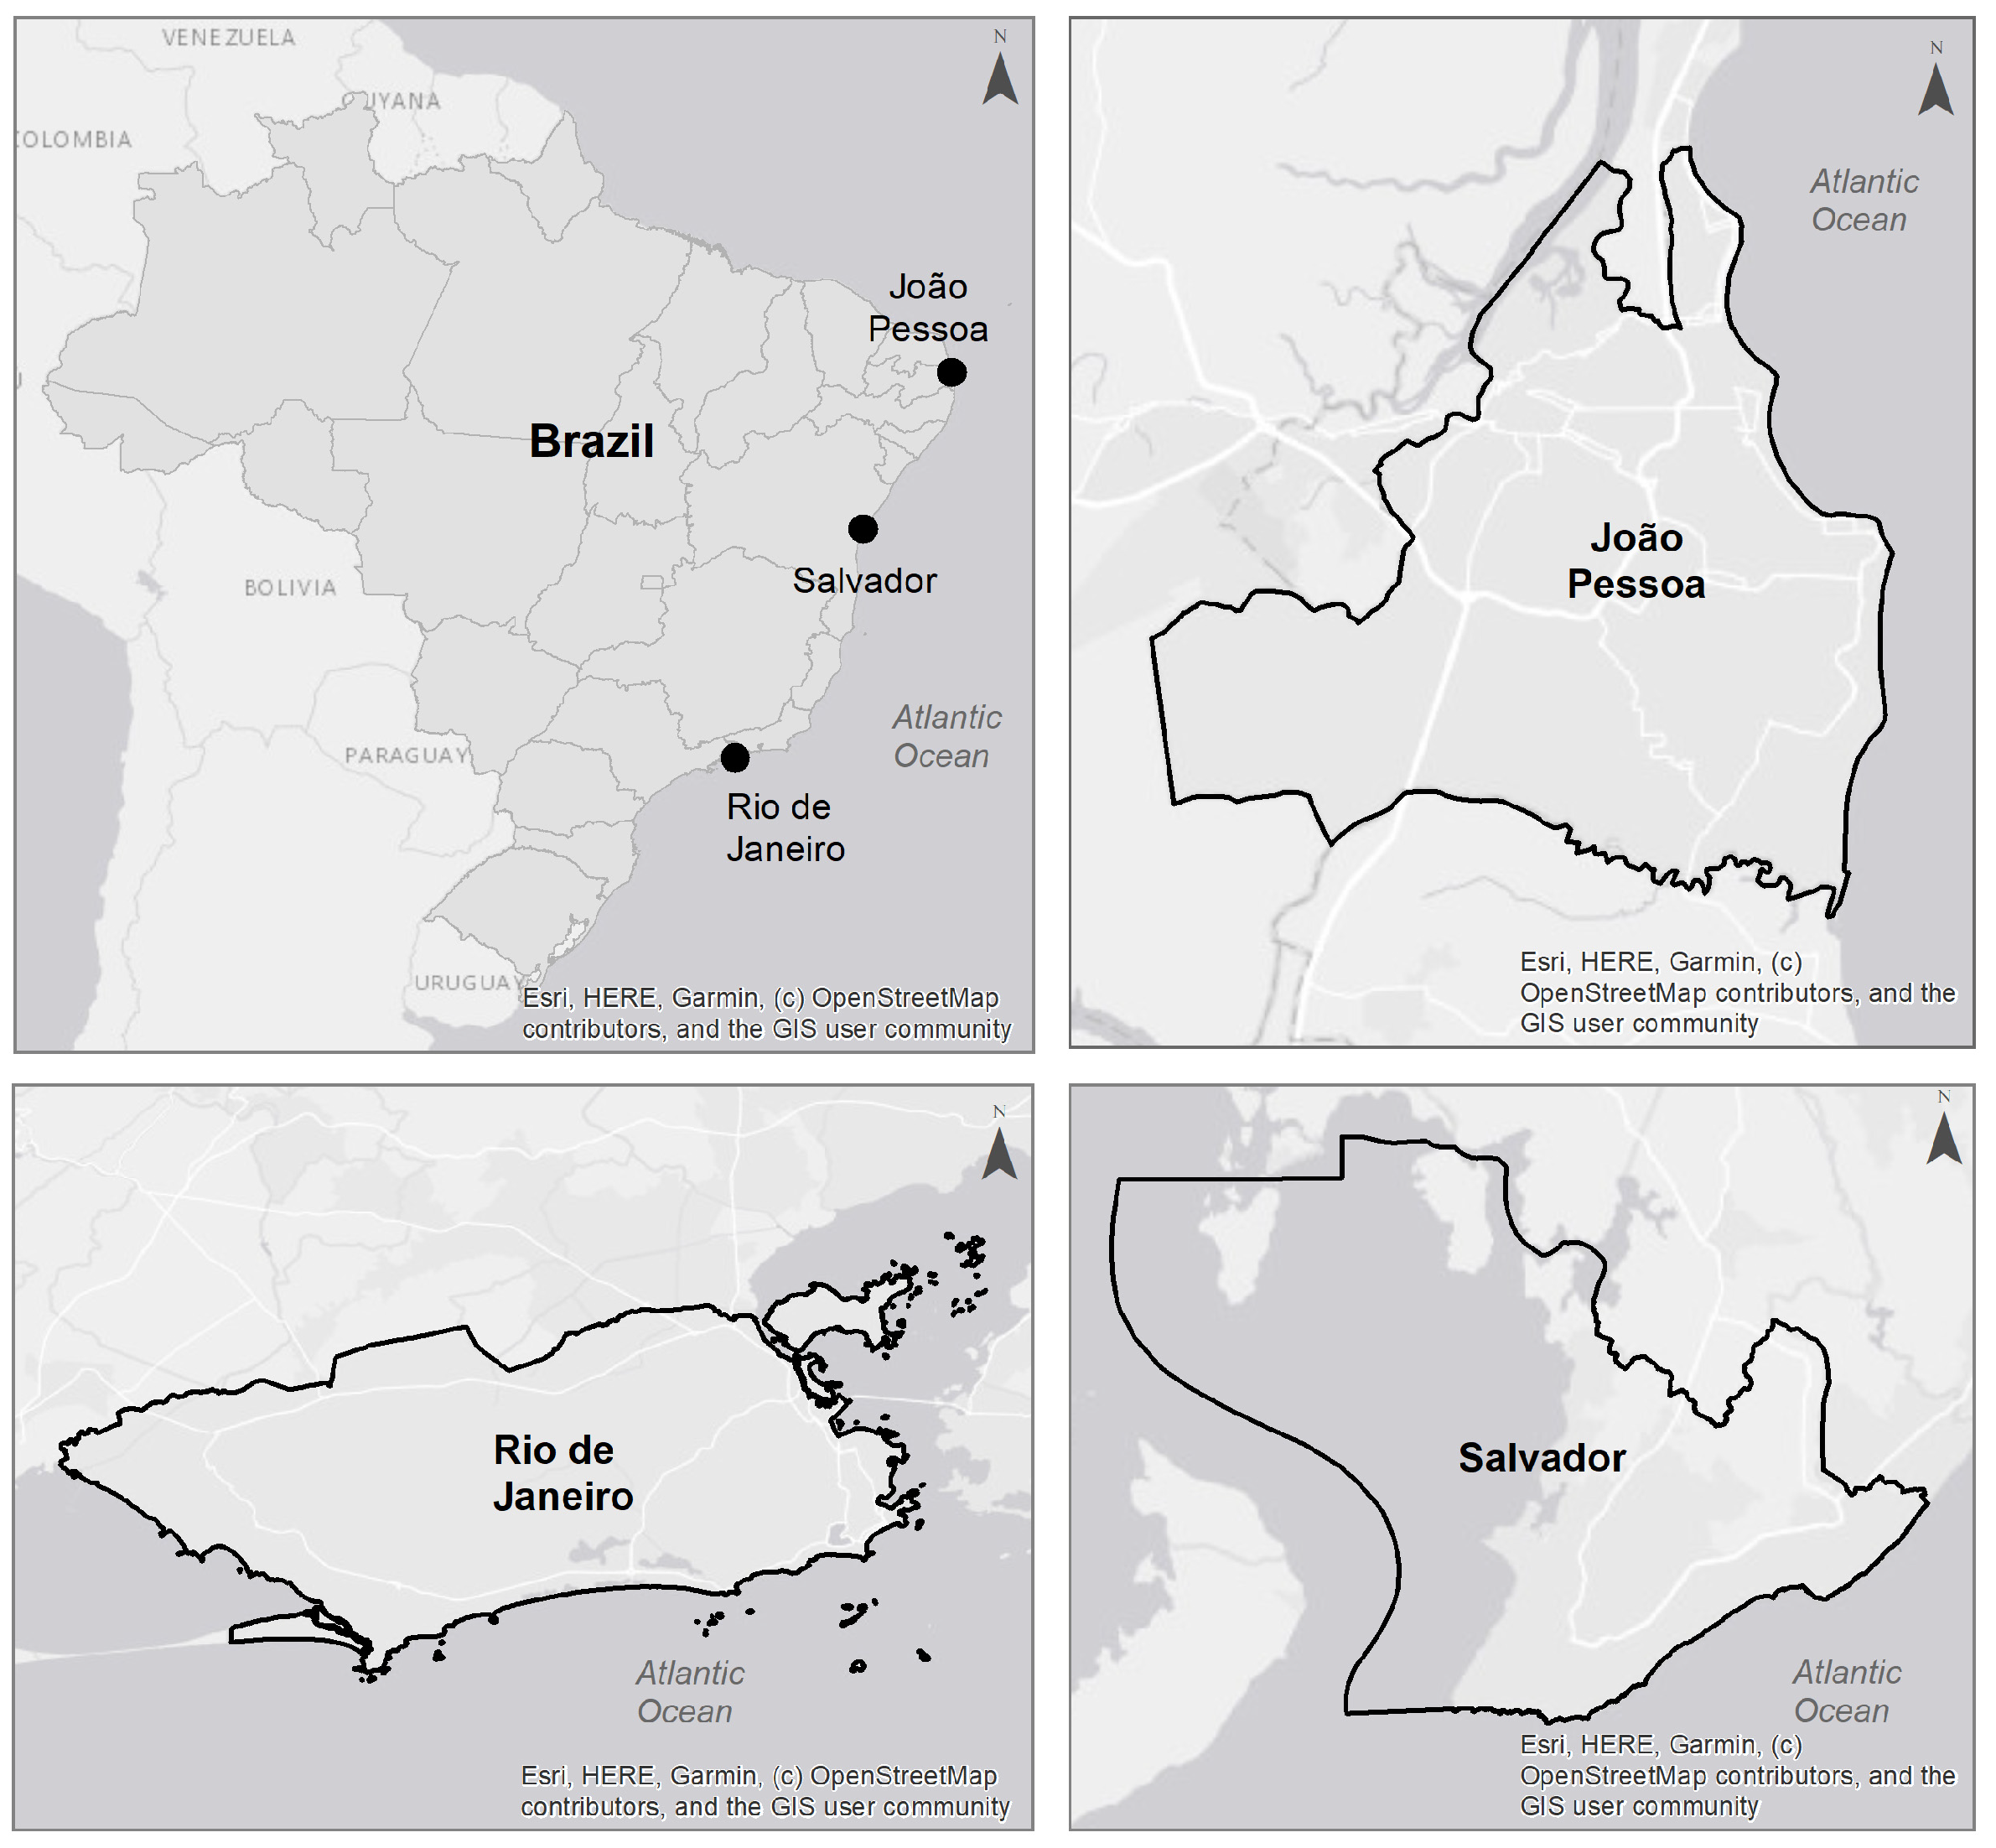
The study area encompasses the city of João Pessoa (
Figure 1), capital of the state of Paraíba, located on the eastern coast of the Brazilian Northeast. It is known for being the easternmost point of the American continent. The city of João Pessoa and its metropolitan region have an estimated population of approximately 888,000 and 1,400,000 inhabitants, respectively [
15]. João Pessoa lies within the geomorphological unit known as the Coastal Plains and Tablelands [
16], with altitudes ranging from sea level to approximately 40 m. The prevailing climate is humid tropical (As/Af transition) [
17], characterized by high temperatures throughout the year and a rainy season concentrated between March and August [
17].
Reference Cities for Comparison: Salvador and Rio de Janeiro
This study also considered the Brazilian cities of Salvador and Rio de Janeiro as comparative references, aiming to contextualize the tourism growth of João Pessoa in relation to two historically established Brazilian destinations. These cities, shown in
Figure 1, share similar geographical characteristics, as they are coastal capitals located in tropical zones, with a strong presence in the national tourism economy. Each of the three cities is situated on the coast and exposed to oceanic influences; their urban and climatic characteristics are distinct, reinforcing the relevance of a comparative approach [
17,
18]; however, they differ in population density and climatic aspects that may affect tourism dynamics.
The city of Salvador, capital of the state of Bahia, has an estimated population of 2,500,000 inhabitants [
15]. It is located on a coastal plateau with steep escarpments facing the sea and features a humid tropical climate (Af) [
17], with high temperatures throughout the year and more intense rainfall during the autumn and winter months [
17].
The city of Rio de Janeiro, capital of the state of the same name, has an estimated population of 6,700,000 inhabitants [
15]. It is situated in an area with a diverse topography, including coastal plains, isolated hills, and mountainous massifs that are part of the Serra do Mar system [
19]. The city has a tropical oceanic climate (Aw/Am transition), characterized by hot and humid summers and mild, relatively dry winters [
14]. Both cities have a long-standing tradition in tourism, with well-established infrastructure, and face challenges related to climate seasonality, coastal urbanization, and environmental sustainability.
It is also important to consider the differences in historical urban development and spatial configuration among these cities. Rio de Janeiro and Salvador hold historical significance as former capitals of Brazil, with intense territorial growth and complex patterns of unregulated urban expansion [
14]. João Pessoa presents a more compact urban structure and lower population density [
20,
21]. The city is also experiencing both intensive and extensive recent urban growth, which underscores the need to generate knowledge that informs sustainable urban and tourism planning strategies. These distinctions directly affect how climatic conditions interact with the urban environment and influence tourism dynamics in each location.
2.2. Dataset
Hourly meteorological data for air temperature (Ta, °C), relative humidity (RH, %), wind speed (v, m/s), global radiation (G, kJ/m
2), and precipitation (pr, mm) were obtained from the Banco de Dados Meteorológicos para Ensino e Pesquisa (Meteorological Database for Teaching and Research—BDMEP), maintained by the Instituto Nacional de Meteorologia (National Institute of Meteorology—INMET) [
22], covering the period from 1 January 2014, to 31 December 2024.
For each city, one official station was used: A320 (João Pessoa), A401 (Salvador), and A652 (Rio de Janeiro). These stations belong to the INMET operational network and follow the World Meteorological Organization (WMO) guidelines for mesoscale monitoring [
23]. These stations offer standardized data that represent broader urban atmospheric conditions, which are suitable for comparative climate–tourism analyses. The data, originally recorded at 00:00 UTC, were converted to local time (UTC−3).
All datasets were subjected to preliminary quality control procedures, including the removal of missing values, outlier detection based on physical ranges, and consistency checks across variables (e.g., temperature–humidity coherence). Global radiation data were converted into W/m2 to be compatible with the RayMan model requirements. Although the 11-year period from 2014 to 2024 represents a relatively short time span for traditional climatology (based on 30-year averages), this timeframe is commonly adopted in studies focusing on climate–tourism interactions and is sufficient to capture seasonal patterns, interannual variability, and the influence of extreme events relevant to tourism planning and management.
2.3. Methodological Procedure
The methodological procedure consisted of four main steps: data collection, quality control and unit conversion, PET [
4,
24,
25] calculation using the RayMan model [
26] (version Pro 1.2), and classification of climatic suitability through CTIS [
1,
27].
The data were organized, processed, and analyzed using the Python 3.13 environment as a basis for generating precipitation intensity charts and climographs to characterize seasonal rainfall patterns. In parallel, PET was calculated using the RayMan model to estimate human thermal perception at different times of the day and periods of the year.
The CTIS categories and their corresponding thresholds are presented in
Table 1. They were applied to evaluate multiple climate-related tourism indicators. PET values were used specifically to classify the thermal comfort, heat stress, and cold stress categories. Other components, such as sunshine (based on cloud cover), precipitation, wind, fog, and sultriness, were assessed independently using their respective thresholds [
27]. Each day’s classification results in a set of parallel indicators that together provide a multi-dimensional profile of climatic suitability for tourism.
The application of CTIS indicators followed the original thresholds [
1,
27], without further customization. Although the climatic diversity in Brazil may suggest local adaptations, the standard PET categories and associated thresholds were retained to ensure methodological comparability with international studies. The classification was applied uniformly across the three cities based on daily and hourly data to generate climatological suitability profiles for tourism activities.
PET values were calculated for each hour of the day, based on hourly meteorological data (temperature, humidity, wind speed, and radiation) and later summarized on a monthly and seasonal basis. PET simulations were conducted in RayMan, using the default settings for human and environmental parameters, which are appropriate for outdoor tourism contexts in warm climates.
Also, PET was interpreted according to established bioclimatic thresholds: thermal comfort is defined as PET between 23 °C and 29 °C; heat stress occurs when the PET exceeds 35 °C; and cold stress is associated with PET values below 8 °C. These thresholds were applied uniformly across the three cities to ensure comparability. In terms of tourism relevance, PET values in the comfort range (23–29 °C) are optimal for most urban and cultural tourism activities, such as walking tours, sightseeing, and city events. Sun-and-beach tourism may remain viable at slightly higher PET levels (up to 33–35 °C), provided that appropriate shading and cooling mechanisms are available. However, persistent exposure to heat stress conditions can negatively affect the visitor experience and health, especially during peak midday hours.
The comparative analysis among the tourist destinations was based on an exploratory examination of climate and thermal comfort data, considering the city of João Pessoa as the primary location (focus city) and Salvador and Rio de Janeiro as secondary locations (reference cities). The comparison assessed seasonal patterns of human thermal comfort, frequency of thermal discomfort, hourly variability, precipitation regimes, and the occurrence of heavy rainfall events. The objective was to identify convergences and divergences among the destinations in terms of climate risks, attractiveness potential throughout the year, and challenges related to the sustainable management of tourism in coastal areas.
The discussion of the results in the context of sustainable tourism considered aspects such as visitor thermal comfort, risks associated with climate seasonality (e.g., heavy rainfall and heatwaves), pressure on urban and natural infrastructure, and mitigation and adaptation strategies adopted in each context. Since this methodological procedure is limited to historical observational data and does not include climate projections, the discussion was complemented by references to regional climate scenarios and international assessments in order to contextualize current vulnerabilities and future planning strategies.
3. Results
This section presents the results of the climatological and bioclimatic analysis for the three cities. The findings are organized in the following sequence: (i) general climatic profiles based on temperature and precipitation data; (ii) analysis of thermal comfort using PET indices; and (iii) assessment of tourism suitability through CTIS indicators. The climate diagrams (climographs) for João Pessoa, Salvador, and Rio de Janeiro, (
Figure 2) for the period from 1 January 2014, to 31 December 2024, illustrate distinct seasonal patterns of temperature and precipitation across the cities.
Although all locations show relatively stable average temperatures throughout the year, consistent with tropical and subtropical climates, João Pessoa, classified as an Af tropical rainforest climate, characterized by high rainfall evenly distributed throughout the year, stands out for its narrower thermal amplitude and more uniform temperature distribution. In contrast, Salvador presents an Am climate (tropical monsoon climate), marked by a short dry season and heavy seasonal rainfall; and Rio de Janeiro fits the Aw type (tropical savanna climate), which has a pronounced dry winter and a wet summer, with slightly greater seasonal temperature variation, particularly during the austral summer months. These distinctions are aligned with differences in precipitation patterns and degrees of seasonality that influence thermal dynamics across the three cities.
Regarding precipitation, João Pessoa presents a well-defined rainy season between April and July, with peak rainfall typically occurring in May and June. This seasonal pattern is primarily driven by the influence of Easterly Wave Disturbances (EWDs), which are the dominant rainfall-generating systems in the eastern part of the Brazilian Northeast. Salvador follows a similar but slightly more extended wet season, reflecting a transitional climatic zone influenced by both EWDs and, to a lesser extent, the South Atlantic Convergence Zone (SACZ) which is a synoptic system associated with convection and heavy rainfall in southeastern Brazil [
14]; and Rio de Janeiro has its highest rainfall during the austral summer months (December to March), mainly due to the strong influence of the SACZ.
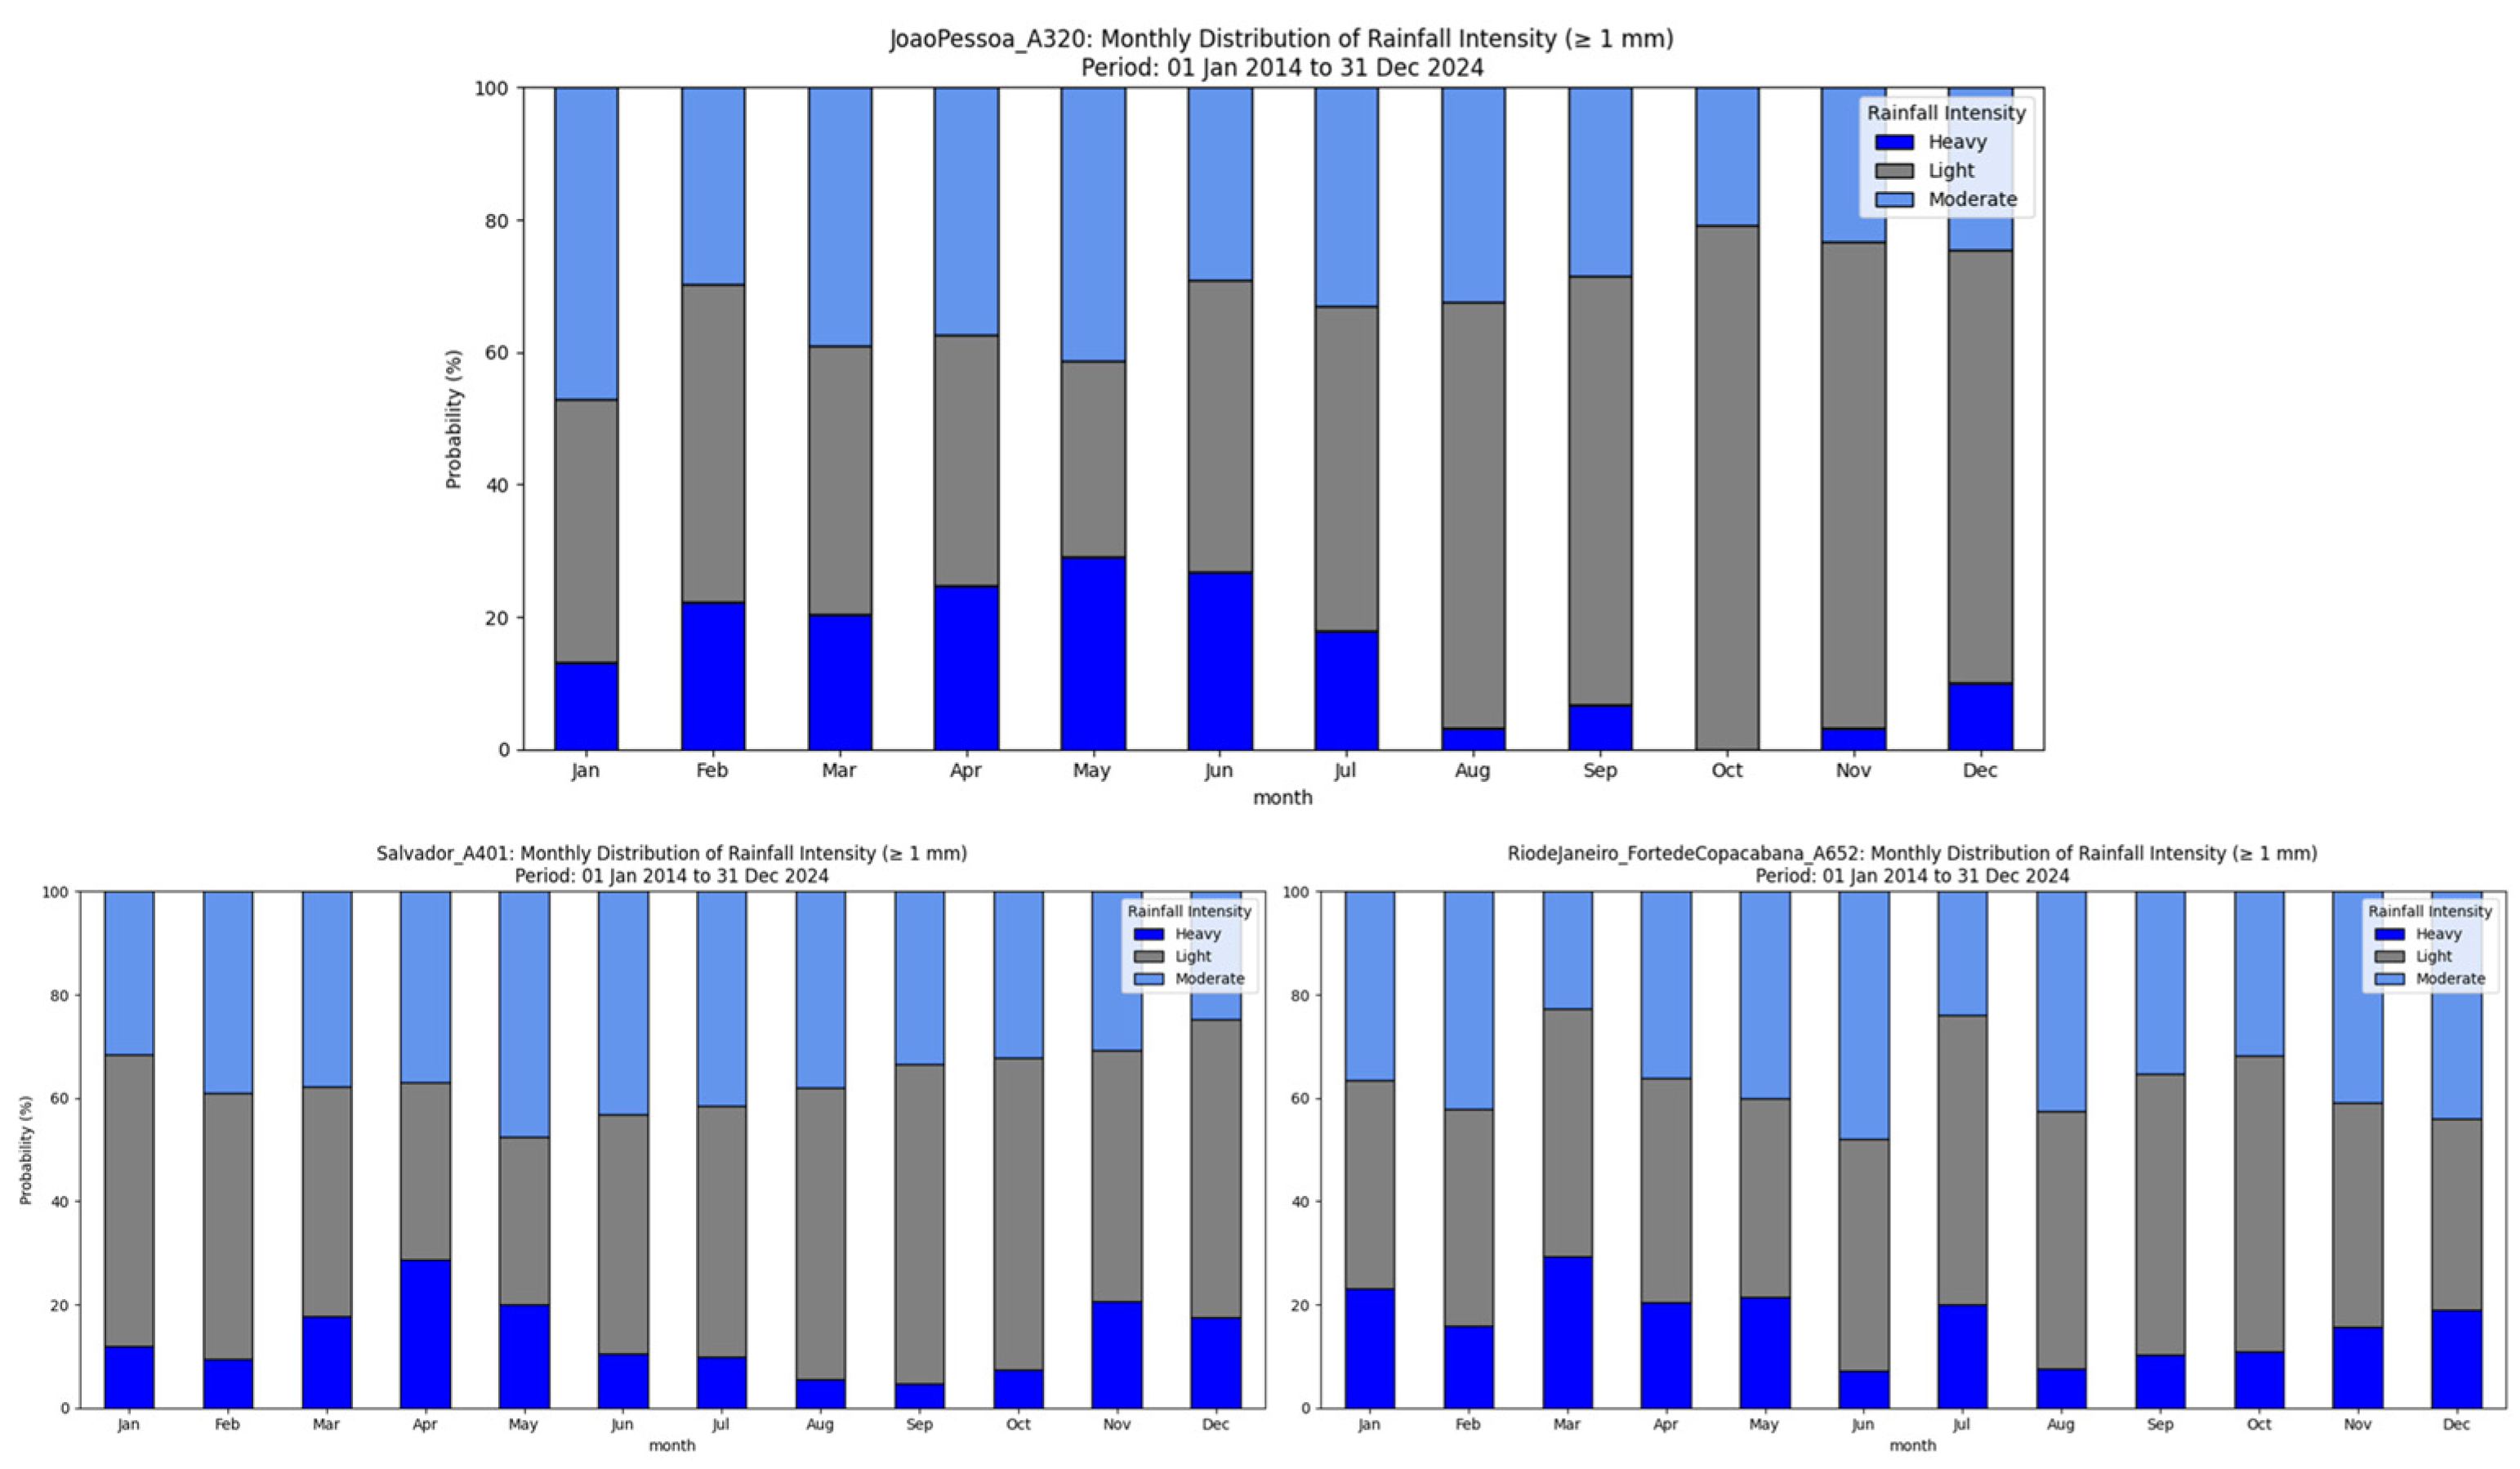
The monthly distribution of rainfall intensity (
Figure 3) reinforces the climatic distinctiveness of João Pessoa when compared to Salvador and Rio de Janeiro. In João Pessoa, the months from April to July not only exhibit the highest frequency of rainy days but also a greater proportion of moderate and heavy rainfall events, particularly in May and June, reflecting the influence of EWD systems.
In João Pessoa, the peak months of May and June register an average of 7 to 9 days of heavy rainfall (≥20 mm/day) per month, representing approximately 25–30% of the days in these months. Moderate rainfall events (5–20 mm/day) occur on 8 to 10 days per month during the wettest season, while light rainfall (1–5 mm/day) is more evenly distributed throughout the year. The rainfall intensity thresholds used—light (1–5 mm), moderate (5–20 mm), and heavy (>20 mm)—are adapted from the precipitation classification criteria defined by the WMO [
23].
Salvador demonstrates a more evenly distributed rainfall intensity throughout the year, with a predominance of light-to-moderate rain, consistent with its transitional climatic regime. Rio de Janeiro presents more rainfall events during the austral summer (December to March) and is characterized by a higher frequency of light-intensity precipitation, with fewer months dominated by heavier rainfall. These results show that João Pessoa, despite experiencing a shorter rainy season, tends to concentrate rainfall in more intense episodes, which has important implications for urban drainage systems and tourism planning.
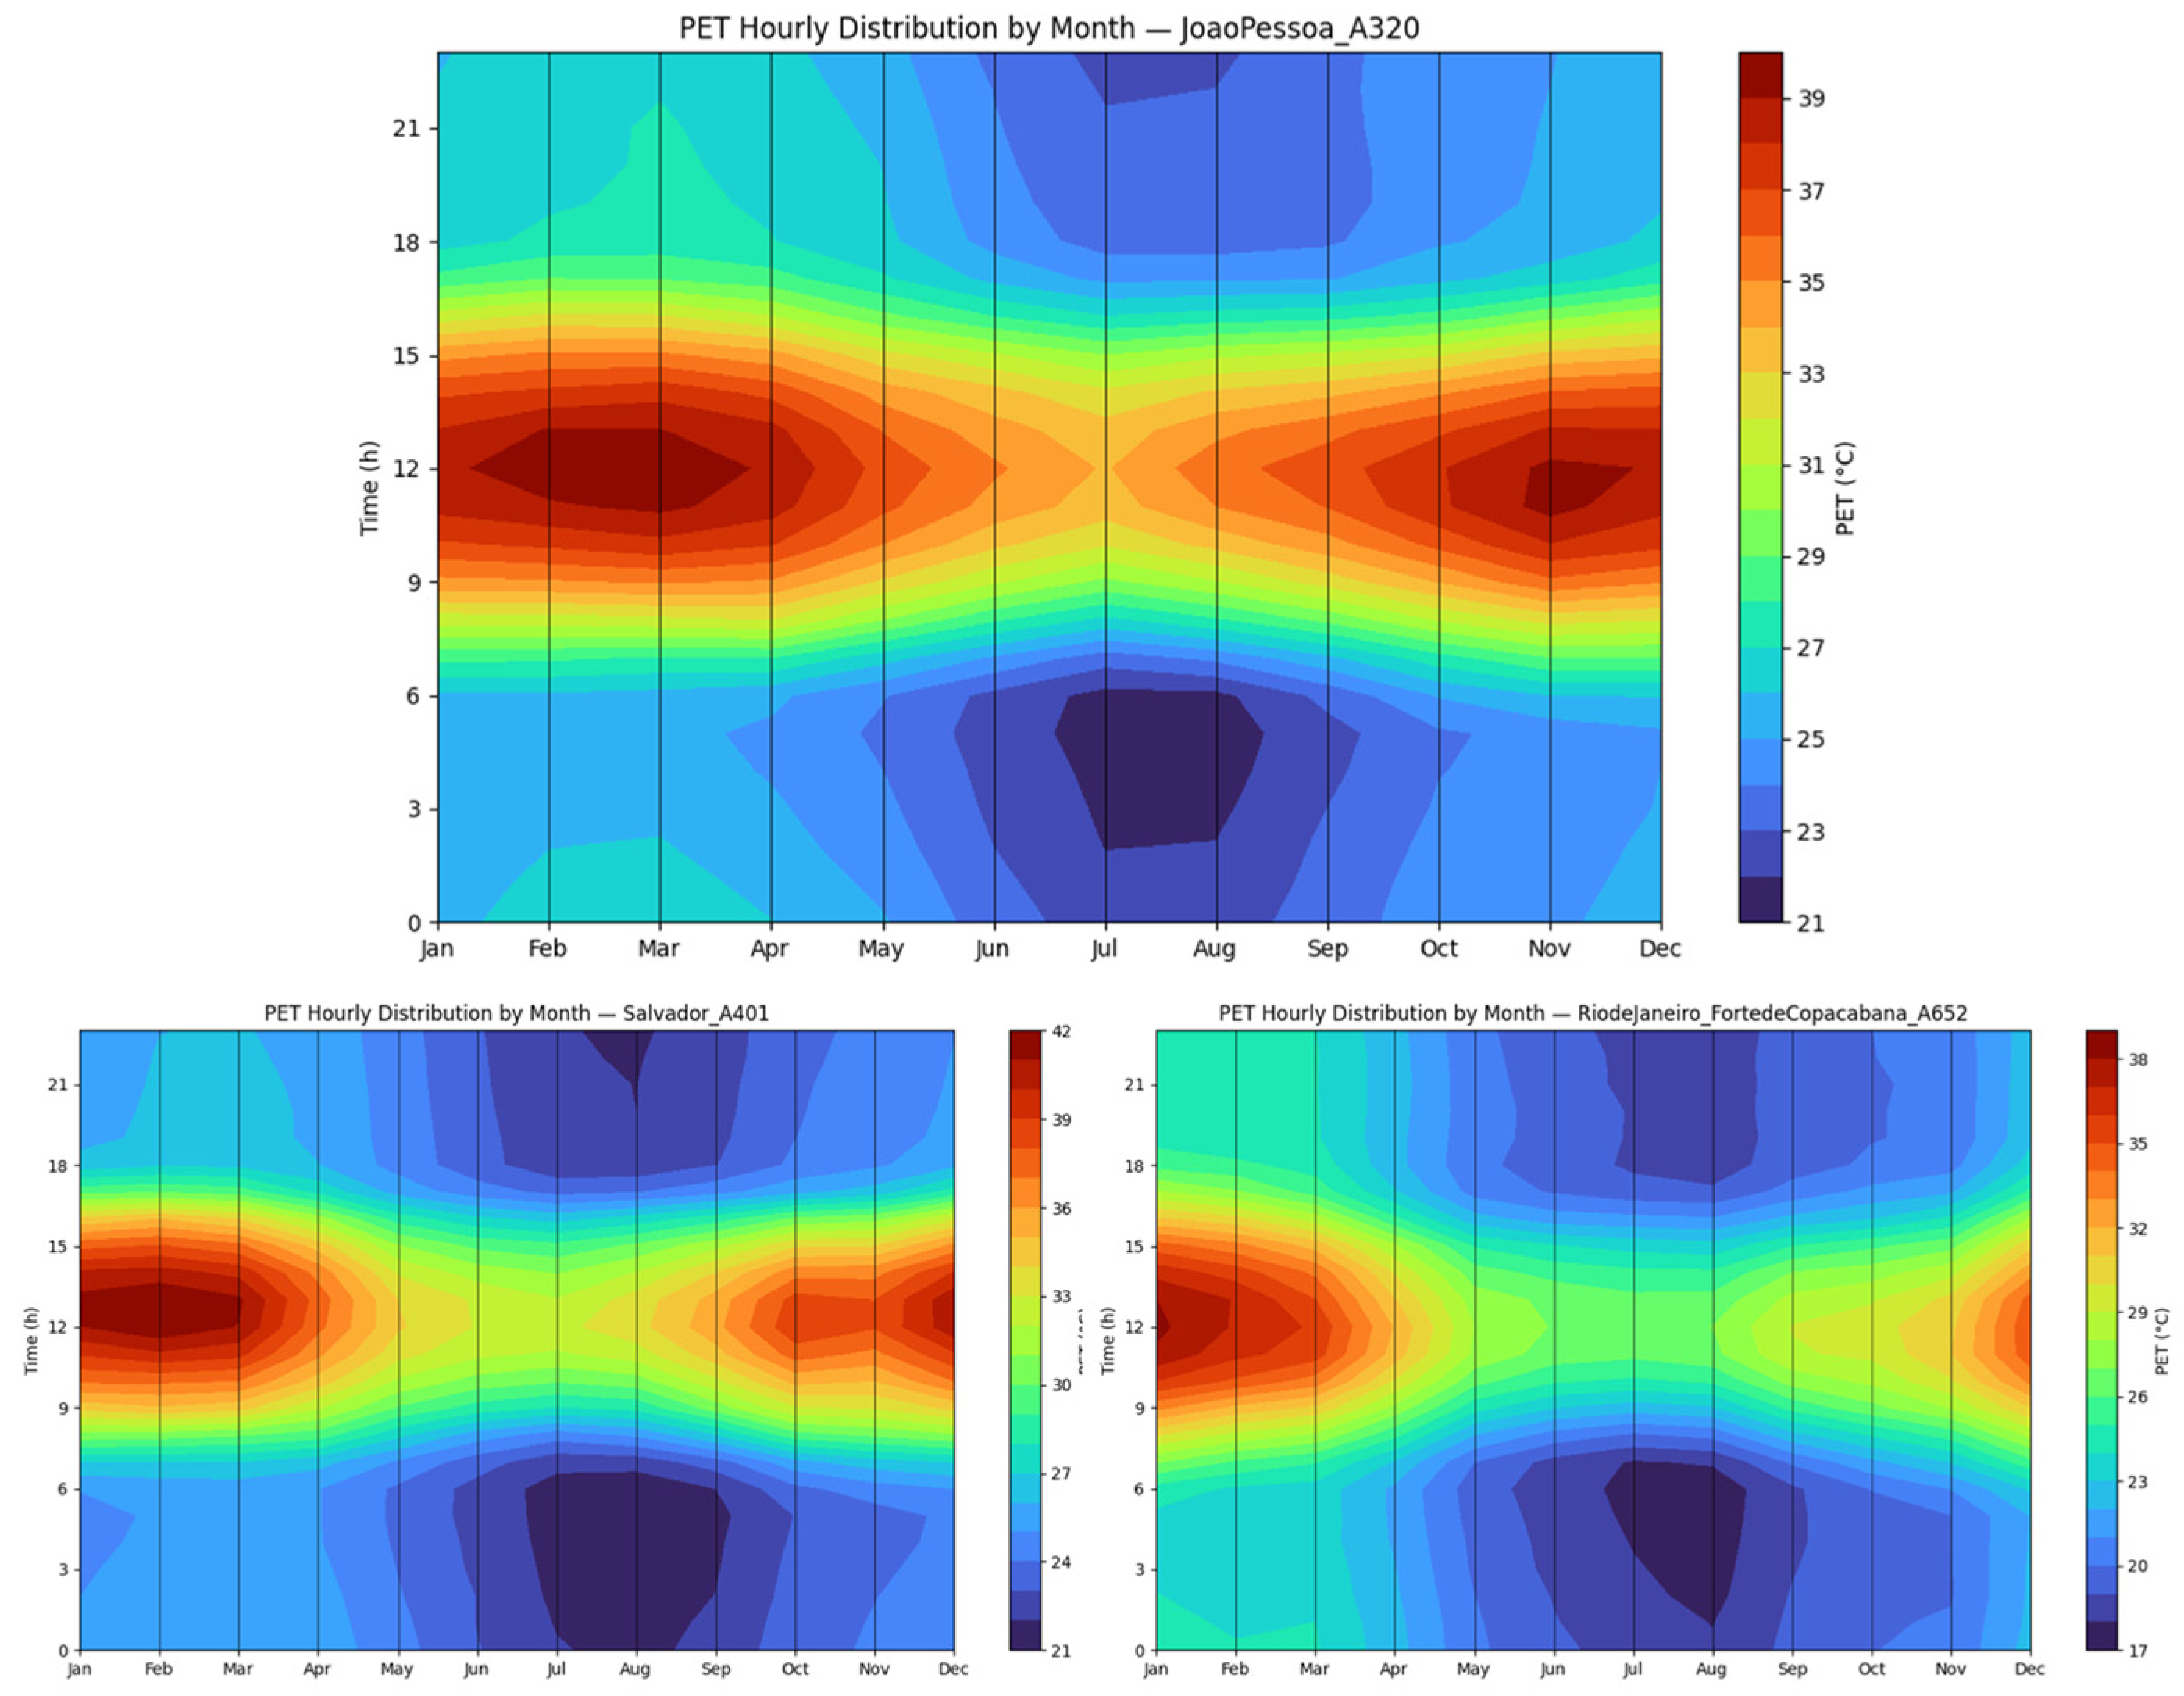
However, precipitation alone does not fully explain tourists’ climate perception and comfort. Analyzing both the monthly PET distributions (
Figure 4) and the hourly distribution of PET (
Figure 5) offers a better understanding of the thermal comfort in these cities, particularly in the context of outdoor tourism activities.
The analysis of PET conditions in João Pessoa, when considering both monthly and hourly distributions, reveals a thermal profile that is favorable for outdoor tourism. For most of the year, particularly between October and April, PET values remain predominantly within the 23–29 °C range, indicating comfortable thermal conditions. During the rainy season (May to July), PET values shift toward the 18–23 °C range, as increased cloud cover and rainfall contribute to a temporary cooling effect, enhancing thermal comfort despite lower solar radiation.
This seasonal moderation is further supported by the hourly PET distribution, which shows that João Pessoa maintains moderate PET levels even during peak heating hours, typically between 10:00 and 15:00. From January to April and again from October to December, maximum PET values generally fall within the 31–35 °C range, high, yet not extreme. During the rainiest months, early mornings and evenings consistently register PET values below 25 °C, providing additional windows of thermal comfort throughout the day.
When compared to Salvador and Rio de Janeiro, João Pessoa demonstrates lower thermal variability, both between months and across daily cycles. While Rio de Janeiro frequently records PET values above 35 °C between December and March, often extending throughout the afternoon, João Pessoa rarely exceeds this threshold. Salvador, although slightly less extreme than Rio, still presents higher PET peaks and longer durations of thermal stress between March and May. To better understand the other factors related to climate suitability,
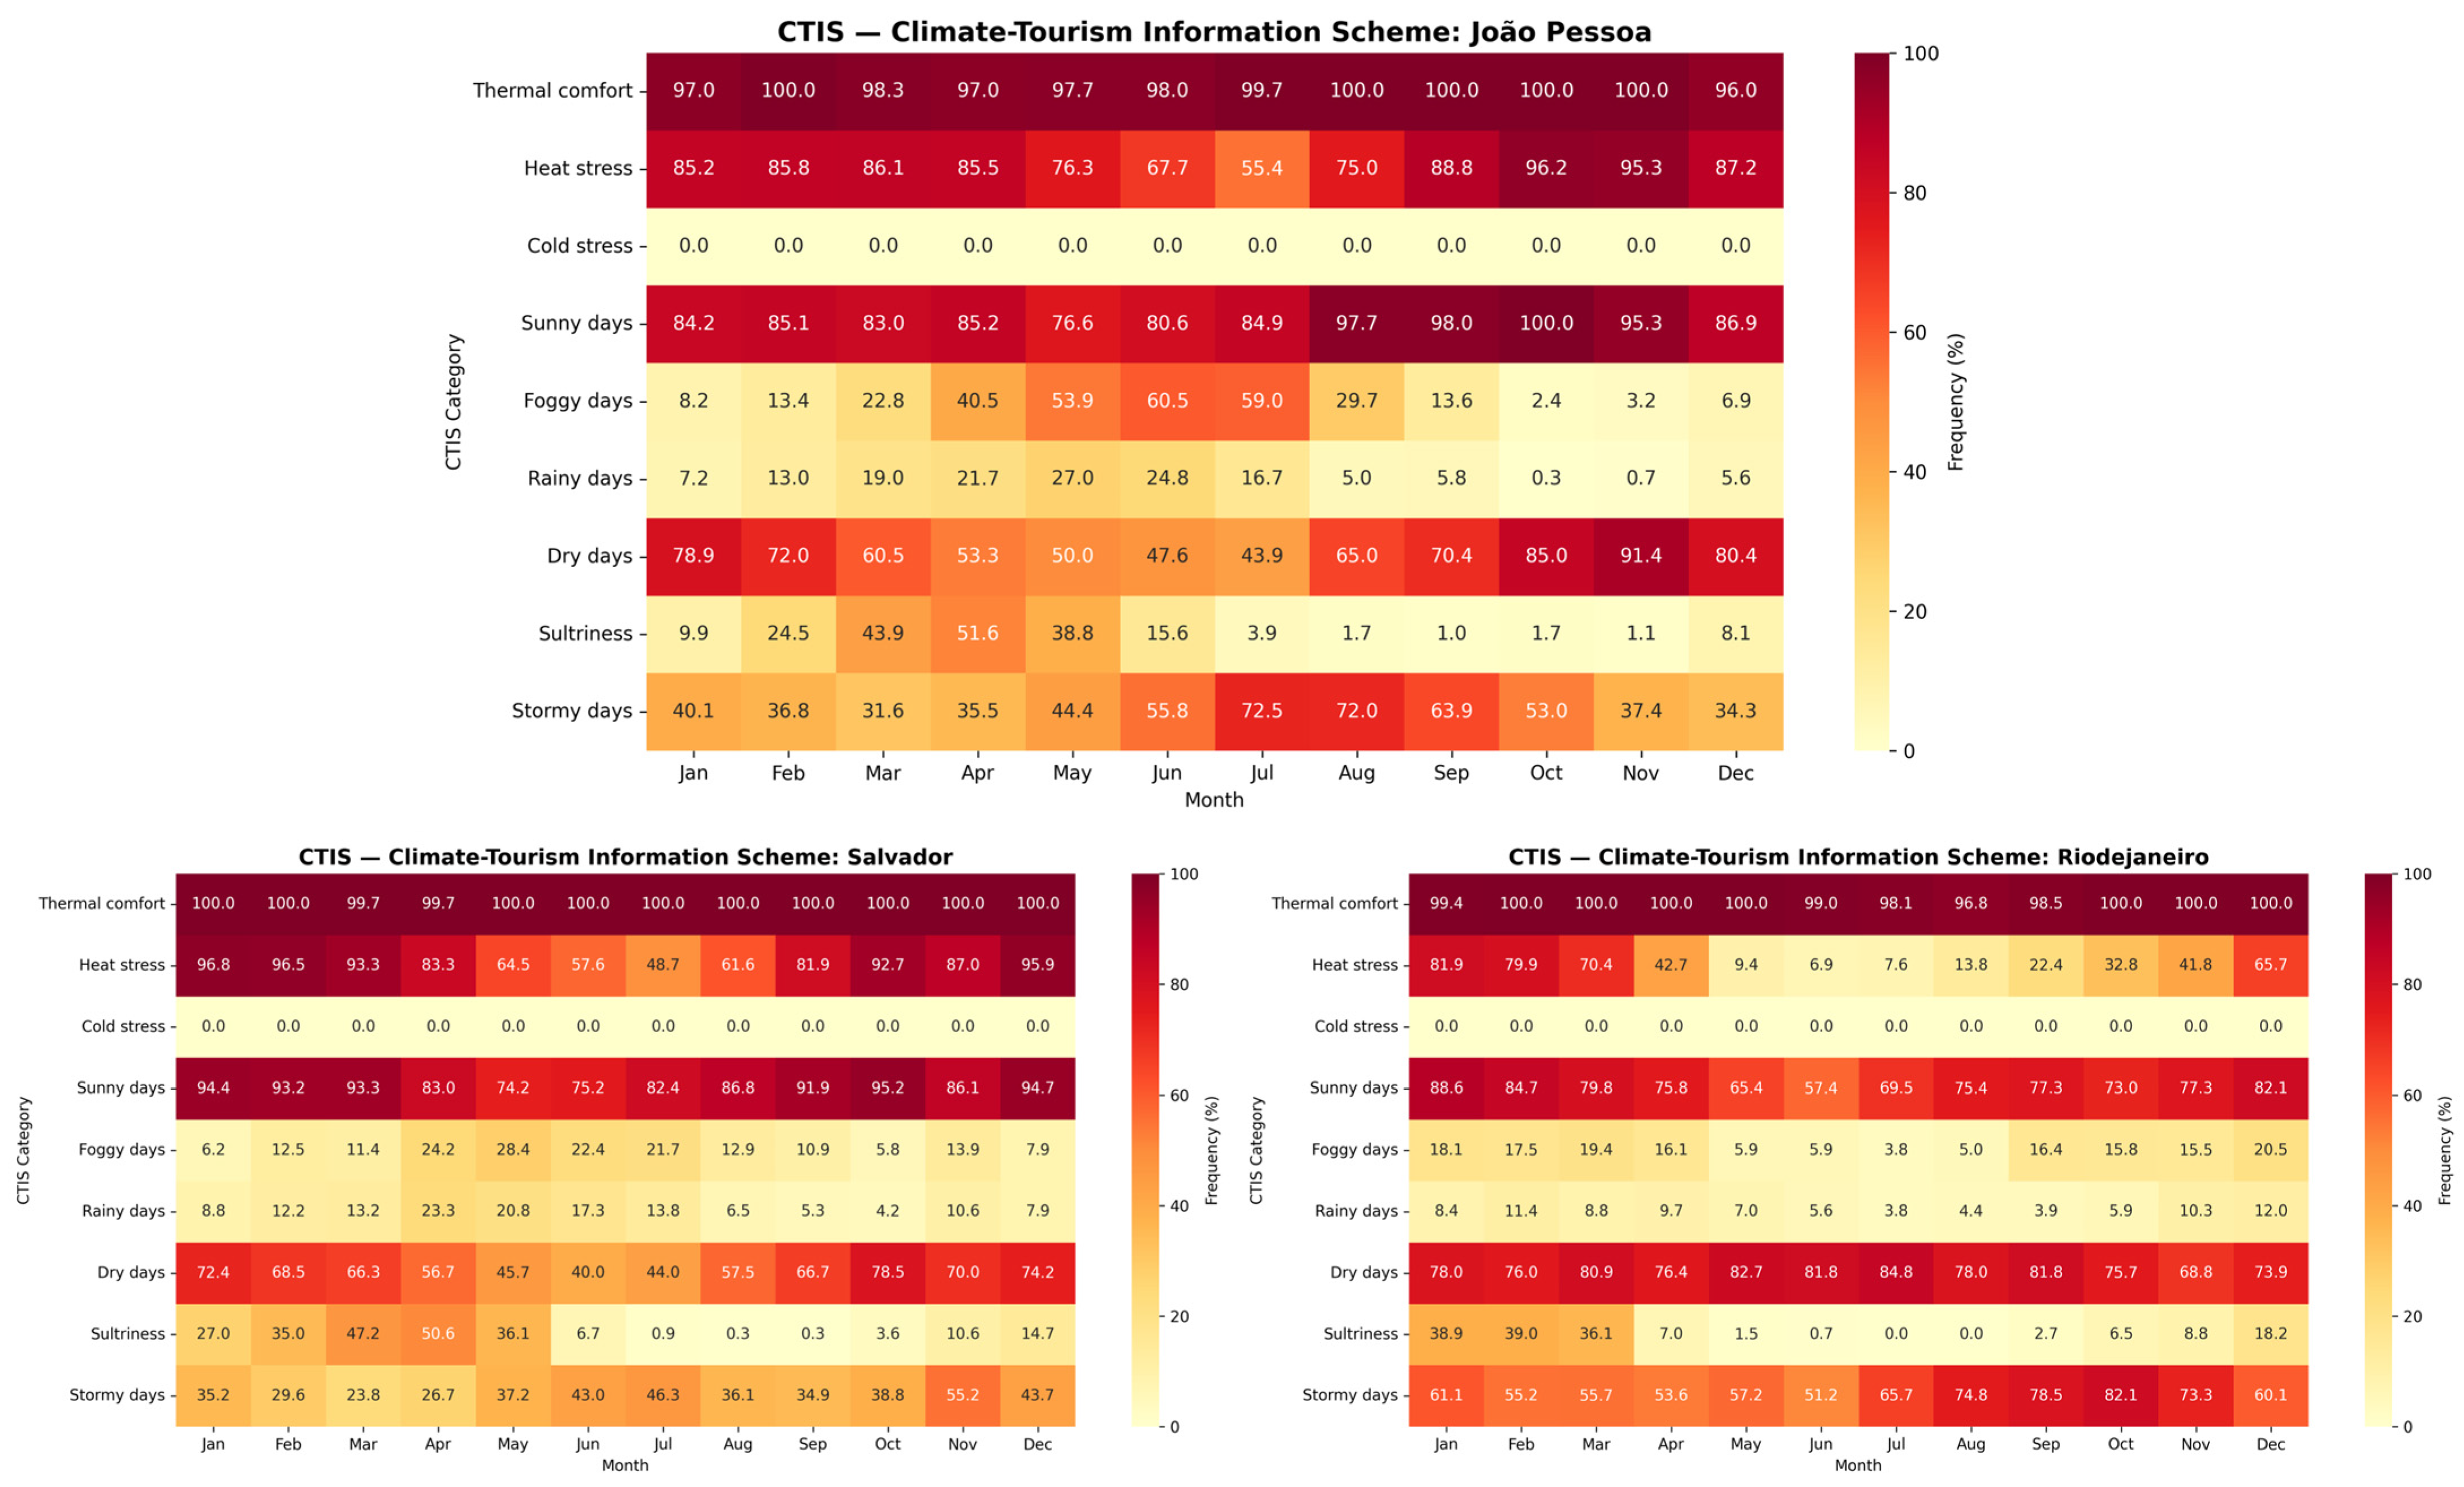
Figure 6 shows the CTIS graphs for the three cities, integrating multiple variables, such as thermal comfort, heat and cold stress, sunshine duration, rainfall, humidity, and storm frequency.
João Pessoa offers highly favorable climatic conditions for tourism year-round, with only minor weather-related disruptions during the mid-year rainy season. It exhibits high thermal comfort rates throughout the year, consistently above 95%, peaking at 100% between September and October. Heat stress remains relatively high year-round, with values exceeding 85% from January to April and reaching minimum values (~55%) in July. Sunny days show consistently high frequencies (above 80%) throughout the year, peaking at 100% in September and October. The number of foggy days and rainy days is low during most months but exhibits a modest rise between April and July, corresponding with the rainy season. The number of dry days decreases notably from April to July, reaching minimum values (~44% in July), and then sharply increases again from August onward. Sultriness shows moderate values early in the year (up to ~50% between March and May) but remains very low from June to November. Stormy days present a seasonal increase, reaching a peak of 72% in July and August, before declining toward the end of the year.
Salvador offers highly favorable climatic conditions for tourism year-round, with minor weather variability concentrated in the middle of the year. Thermal comfort rates in Salvador remain high throughout the entire year, consistently close to or at 100%. Heat stress is also prevalent, with values exceeding 90% from January to March, decreasing to around 50% by July, and gradually rising again from September onwards. Sunny days maintain very high frequencies (above 90%) from January to March but decrease slightly between May and July (around 74–75%), before recovering in the second half of the year. Rainy days show moderate and relatively stable values throughout the year, peaking at around 23% in April and remaining low in other months. Foggy days exhibit a modest increase during the rainy months, reaching a maximum of about 28% in May but overall remain low. Stormy days occur regularly, with frequencies ranging from 24% to 55%, reaching their peak in November.
Rio de Janeiro offers highly favorable climatic conditions for tourism, although visitors should be aware of increased wind activity during the winter season. Thermal comfort suitability remains extremely high throughout the entire year, consistently exceeding 95%, with maximum values during the cooler months from June to September. Heat stress is most pronounced from January to March, with values above 70%, and becomes negligible between May and September. Sunny days maintain high frequencies across the year, reaching their minimum (~57%) in June and peaking again towards December (~82%). Sultriness is notable from December to March, with values around 36–39%, and is virtually absent during the winter months. Stormy days, defined by wind gusts exceeding 8 m/s, show a distinct seasonal peak during the winter (May to October), likely associated with the passage of cold fronts rather than convective summer storms. Foggy days remain relatively low year-round, with slight increases in December.
In summary, the CTIS plots clearly differentiate the seasonal profiles of each location by quantifying the suitability of climatic components for tourism. João Pessoa maintains high thermal comfort and sunshine suitability throughout the year, with only a modest decrease during the mid-year rainy season, while stormy and foggy days remain relatively infrequent. Salvador exhibits exceptionally stable thermal comfort year-round, but with a more persistent presence of heat stress, particularly during the first semester, and moderate seasonal variation in sunshine and storminess.
Rio de Janeiro shows a stronger seasonal contrast, with high thermal comfort throughout the year, reduced heat stress and sultriness during the cooler months, and a marked increase in stormy conditions during winter. These climatic patterns highlight distinct tourism opportunities and seasonal considerations for each destination. While the CTIS framework offers a valuable and standardized approach to assessing climate-tourism suitability, its interpretation should consider contextual nuances, such as the equal weighting of variables and the cultural or regional variability in tourists’ expectations of comfort. These limitations do not diminish the comparative utility of the index but highlight the potential for complementary analyses using local knowledge and visitor profiles.
4. Discussion
This section interprets the main findings in relation to the literature on climate-sensitive tourism, focusing on how thermal comfort, rainfall seasonality, and atmospheric variability influence tourism dynamics and planning in coastal cities. Special attention is given to João Pessoa as an emerging destination facing both opportunities and vulnerabilities in the context of increasing climatic uncertainty.
These findings show that João Pessoa experiences a seasonal concentration of rainfall, primarily between May and July, although rainy days account for less than 30% of days per month even during the wettest periods. This pattern has important implications for urban drainage systems and tourism planning. Among these mechanisms, EWDs are the most directly linked to rainfall peaks during the wet season in João Pessoa, often producing intense and short-duration precipitation events that disrupt outdoor tourism activities with little advance warning. EWDs are typically detected by meteorological models only a few hours in advance, making short- and medium-term tourism planning particularly challenging due to the low predictability of rainfall events [
28].
Upper-Level Cyclonic Vortices (VCANs), while less frequent, can lead to prolonged rainfall episodes and cloudy conditions, particularly in the early rainy season. The Intertropical Convergence Zone (ITCZ) contributes to broader regional rainfall patterns, although its direct impact on João Pessoa is more limited. Land-sea breeze circulations, on the other hand, play a daily role in modulating convection along the coast, sometimes reinforcing EWD effects. These systems can also interact, for example, when a VCAN enhances upward motion already triggered by an EWD or sea breeze, leading to concatenated effects.
These limitations highlight a significant vulnerability in terms of climatic predictability, particularly for outdoor tourism segments (especially sun and beach) that rely on consistently dry conditions. Although sunny days remain relatively frequent even during the wet season, the unpredictability of rain events can still pose challenges for short-term tourism planning [
2,
3,
5].
João Pessoa consistently records higher PET values compared to both Salvador and Rio de Janeiro, particularly during the core daytime hours between 09:00 and 15:00 across all months of the year. The hourly PET distribution reveals that João Pessoa maintains PET levels predominantly within the 31–35 °C range for extended periods, including during the austral winter (June to August), when milder thermal conditions would typically be expected. In contrast, Rio de Janeiro and Salvador exhibit greater seasonal variability, with more frequent reductions in PET during the cooler months. João Pessoa shows less daily and seasonal fluctuation, sustaining elevated thermal loads both diurnally and annually. This behavior can be attributed to the combined effect of high relative humidity, intense solar radiation, and moderate to low wind speeds during midday hours, which collectively enhance the perception of heat even in the absence of extreme air temperatures. These microclimatic characteristics emphasize the persistent thermal stress experienced by residents and visitors throughout the year.
The CTIS values reinforce the patterns observed in the isolated climatic variables, indicating that João Pessoa presents exceptionally high suitability for thermal comfort throughout most of the year, with rates exceeding 95% in all months and peaking between September and October. This period also coincides with minimal sultriness, low incidence of stormy and foggy days, and a high frequency of dry and sunny days, establishing a highly favorable climatic window for tourism activities. Although a slight reduction in thermal comfort and dry day frequency occurs between May and July, suitability levels remain generally high, with rainy days peaking but still affecting less than 30% of the monthly days. These results highlight the relatively stable and tourism-friendly climate in João Pessoa, with only moderate climatic limitations during the mid-year rainy season [
3,
29].
In contrast, Salvador presents a more homogeneous thermal profile, with exceptionally high comfort levels maintained year-round and persistent heat stress, particularly from January to April. Rio de Janeiro also exhibits consistently high thermal comfort across all months but with marked seasonal variations in heat stress and sultriness, which peak between December and March. What distinguishes João Pessoa is the relative absence of extreme cold, stormy, or foggy days year-round and the concentration of moderate climatic discomfort within a narrow seasonal window during the middle of the year. This highlights the need for seasonally targeted tourism strategies, promoting off-peak tourism during transitional months (April and September) and encouraging diversification of tourist activities during the wetter months when slight reductions in comfort may occur. To consolidate these comparative insights,
Table 2 summarizes key climatic indicators affecting tourism across João Pessoa, Salvador, and Rio de Janeiro.
As shown in the results, the occurrence of high PET values during the dry season and periods of low rainfall in transition months may already indicate emerging thermal and hydric stress conditions. Although no trend analysis was conducted, these signals reinforce the importance of incorporating flexible tourism planning strategies, strengthening early warning systems, and diversifying tourism products to reduce the sector’s sensitivity to climate variability. Historical climate data offer a foundation for understanding patterns of tourism suitability, and these conditions are being increasingly altered by the impacts of climate change. Recent observations indicate a growing frequency and intensity of extreme events, particularly extreme rainfall and heatwaves [
29,
30]. Although this article does not explore future climate scenarios, the patterns observed suggest that climate variability may already be influencing the thermal comfort and attractiveness of coastal destinations, with the need for adaptation strategies.
In João Pessoa, for instance, although PET values have historically remained within moderate thresholds, recent years have witnessed an increase in short-duration but high-intensity thermal peaks, posing significant health risks for both residents and tourists. These temperature spikes are a relatively recent phenomenon, and studies specifically addressing their frequency, intensity, and impacts remain scarce [
14].
It remains uncertain whether these trends are following a linear progression or accelerating exponentially. Although future climate scenarios were not analyzed in this study, regional projections indicate an increase in the frequency of heatwaves, extreme rainfall events, and prolonged dry spells along the northeastern coast of Brazil over the coming decades [
29,
30]. Studies using downscaled climate models (e.g., CORDEX and INPE/ETA projections) suggest that cities like João Pessoa may face intensifying thermal and hydric stress conditions, particularly during the transition months [
31]. We are currently in a transitional phase of climate change, and future atmospheric patterns are difficult to quantify at detailed spatial scales. This uncertainty underscores the urgency of integrating climate adaptation strategies into tourism planning [
2,
3,
5]. These strategies should include environmental education campaigns, real-time safety information for visitors engaging in outdoor activities, and diversification of tourism products beyond the traditional sun-and-beach model by promoting cultural, ecological, and urban attractions that are less vulnerable to weather fluctuations.
5. Conclusions
This final section summarizes the main climatic findings from the comparative analysis and reflects on their implications for tourism sustainability and climate-sensitive planning, especially in the case of João Pessoa.
This study aimed to analyze how the climatic conditions influence sustainable tourism in João Pessoa in comparison with Salvador and Rio de Janeiro, with a specific focus on CTIS, PET, and rainfall patterns. The results showed that João Pessoa maintains a more stable and moderate thermal regime, with lower PET variability and fewer occurrences of extreme heat. However, consistently high PET values during daytime hours (9:00–15:00), even during the rainy season, may lead to thermal discomfort during outdoor activities. The city also exhibits a defined rainy season (April to July), with a higher frequency of moderate-to-heavy rainfall events than the other cities, often associated with low-predictability systems such as EWD.
The CTIS results reinforce these findings, confirming the city’s seasonal patterns of climatic suitability, with higher suitability during the dry season and reduced comfort in the wetter months due to increased precipitation and lower thermal comfort. Still, the city maintains low occurrences of stormy days year-round, which helps mitigate some of the risks typically associated with tropical destinations.
These findings highlight the high climatic suitability of João Pessoa for tourism during the dry season (October to March), while transitional months (April and September) could be strategically promoted for off-peak and niche tourism. Diversifying tourist offerings beyond sun-and-beach activities and improving real-time climate communication can help reduce the impact of weather fluctuations, especially during wetter months.
This study is based on historical observational data and does not incorporate climate projection models or scenario-based simulations. Therefore, the reflections on climate change presented herein are exploratory and not intended as predictive analyses. Future research should integrate climate projections, tourist flow data, and socio-economic indicators to evaluate the long-term sustainability of tourism in coastal areas. Including aspects of social vulnerability and urban infrastructure would also support a more holistic assessment of climate resilience in the tourism sector.


