Abstract
Brazil is increasingly affected by extreme weather events due to climate change, with pronounced regional differences in temperature and precipitation patterns. The southeast region is particularly vulnerable, frequently experiencing severe droughts and extreme heatwaves linked to atmospheric blocking events and intense rainfall episodes driven by the South Atlantic Convergence Zone (SACZ). These phenomena contribute to recurring climate-related disasters. The country’s heavy reliance on hydropower heightens its susceptibility to droughts, while growing evidence points to intensifying dry spells and wildfires across multiple regions, threatening agricultural output and food security. Urban areas, particularly, are experiencing more frequent and severe heatwaves, posing serious health risks to vulnerable populations. This study investigates the links between global teleconnection indices and synoptic-scale systems, specifically blocking events and SACZ activity, and their influence on Brazil’s extreme heat, drought conditions, and river flow variability over the past 30 to 40 years. By clarifying these interactions, the research aims to enhance understanding of how large-scale atmospheric dynamics shape climate extremes and to assess their broader implications for water resource management, energy production, and regional climate variability.
1. Introduction
Brazil stands out on the global stage for the increasing frequency and intensity of extreme weather events resulting from a changing climate. According to data from the Emergency Events Database (EM-DAT), the country ranks 40th in disaster-related fatalities and 17th in total damages, considering both natural and technological events from 1900 to 2024 [1]. These figures highlight Brazil’s vulnerability to ongoing climatic changes.
Due to its vast territorial extension, being the fifth largest country in the world, Brazil encompasses multiple climate zones [2], resulting in significant regional variations in the impacts of climate change on precipitation patterns. Cavalcanti [3] describes how synoptic systems modulate the spatial and temporal patterns of extreme rainfall, both deficits and excesses, across the region. The study highlights the role of mesoscale convective systems embedded within synoptic-scale circulations, influenced by large-scale climate variability, in producing droughts and extreme precipitation events in various regions of the continent. These events can, in turn, contribute to climate-related disasters such as flooding and landslides. In addition, severe droughts in Southern and Northeastern Brazil, for instance, have been documented in the literature and are well known for their socio-environmental impacts [4,5]. On one hand, such droughts frequently affect the agricultural and energy sectors [6], often associated with atmospheric blocking events [7]. On the other hand, episodes of the South Atlantic Convergence Zone (SACZ) are responsible for intense, persistent, and spatially well-distributed rainfall events, which may contribute to recurring hydrometeorological disasters such as flooding and landslides [8].
Furthermore, in 2023, for example, approximately 60.1% of Brazil’s electricity generation was derived from hydropower [9], with the southeast region holding the majority of the country’s storage capacity of hydroelectric reservoirs. This underscores the vulnerability of Brazil’s energy matrix to droughts that affect the southeast [6]. It should be noted that, since the Brazilian National Energy System is interconnected, droughts in one region affect hydropower plants located downstream throughout the system. As a result, reservoirs may reach critically low levels, leading to reduced hydropower generation. This, in turn, decreases the stored energy capacity across different energy subsystems and creates the need to dispatch alternative energy sources, such as thermal power plants, to meet the growing electricity demand. Such a shift not only increases generation costs but also contributes to higher greenhouse gas (GHG) emissions [10].
As for the south region, during the 2020 drought, the hydroelectric sector in the South Brazil Subsystem faced severe impacts as inflows to key reservoirs reached historic lows. The largest reservoirs, located in the Iguaçu and Uruguay river basins, experienced critical depletion, highlighting the severity of hydrological drought [5].
Moreover, several studies [4,6,11,12] indicate an intensification of drought processes not only in the southeast but also in the northeast and central-west regions. In the latter, there has been an unprecedented increase in wildfires in the last decade, with almost 30% of the Pantanal biome burned in 2020 alone [13]. The contribution of severe droughts to the increase in wildfires has been documented in many regions of the world [14,15,16]. Wildfires fuel a positive feedback loop, progressively drying out the environment. This process compromises agricultural productivity and threatens national food security. It is important to highlight that the number of wildfires in Brazil has been increasing since 2014, reaching 222,798 in 2020, the highest recorded during the 2011–2020 period. It is also important to emphasize that wildfires can directly affect both water quality and availability, particularly when they occur in forested areas that play a critical role in the protection of river basins [13].
Furthermore, the frequency and intensity of heatwaves are increasing in urban areas across several Brazilian cities [17]. These events disproportionately affect the most vulnerable and exposed populations, such as the elderly, outdoor workers, and individuals with pre-existing health conditions, leading to a higher incidence of heat-related illnesses and fatalities [18,19,20,21].
Given the complexity of the meteorological and climatic phenomena affecting Brazilian territory, it is crucial to consider the influence of global teleconnection patterns. As explained by Wallace and Gutzler [22], teleconnections are defined by significant simultaneous correlations between temporal fluctuations in meteorological parameters at widely separated points on Earth. These fluctuations help to better understand the variance and influence on regional surface climate and seasonal conditions. Various studies presented discussion of teleconnection patterns over South America climate [3,23,24,25,26], showing that large-scale phenomena, such as sea surface temperature anomalies in the Atlantic and Pacific Oceans, for instance, can significantly influence temperature, precipitation, and atmospheric circulation patterns in Brazil.
In this context, the main objective of this study is to investigate the correlations between various teleconnection patterns and associated indices and the variability patterns of synoptic-scale climate phenomena, specifically atmospheric blocking events and SACZ episodes, and quantify their impacts on extreme heatwaves, droughts, and river flow variability in Brazil for the past 30/40 years. By integrating these analyses, the study aims to enhance the understanding of how large-scale atmospheric circulation patterns influence extreme climate events in Brazil, offering insights into their implications for water resources, energy production, and regional climate variability.
2. Methods
2.1. Atmospheric and Oceanic Teleconnection Indices
We used a set of various atmospheric and ocean teleconnection indices to establish relationships between them and synoptic indices that impact Brazil. Other works have investigated the influence of teleconnection indices on synoptic phenomena like Feng et al. [27], which investigated the influence of the Atlantic Multidecadal Oscillations on droughts in North America. On the same matter, Kushnir et al. [28] evaluate the influence of tropical North Atlantic Sea Surface Temperatures (SSTs) on North America’s precipitation and even discuss the different influences from the tropical North Atlantic SST and ENSO. For the southern hemisphere, Cavalcanti [3] reviews the influences of the Pacific and Atlantic SST, the Pacific South America pattern, and indices like the North Atlantic Oscillation on South America’s precipitation. Grimm et al. [5] took a step further and not only evaluated the influence of a combination of the Atlantic Multidecadal Oscillation and Pacific Interdecadal Oscillation on the long-term behavior of water deficit in Brazil, but also discussed that the interdecadal oscillations combined with interannual oscillations like ENSO could worsen this process and lead to extreme drought events.
Most indices on the NOAA PSL website are briefly described in Table 1. Furthermore, two new developed Atlantic SST indices are presented, the Subtropical North Atlantic SST index (SNA), presented for the first time in this article, which encompasses four locations in the North Atlantic Ocean named SNA_N, SNA_NE, SNA_C and SNA_CE, and the BMC index, in the South Atlantic Ocean, first presented in Cataldi et al. [25] (Figure 1a). Data were acquired from NOAA OISST v2 [29] as SST daily anomalies calculated relative to a climatology of 1971–2000 and with a horizontal resolution of . These five locations have been monitored by the Climate Systems Monitoring and Modeling Laboratory of the Federal Fluminense University (LAMMOC-UFF) for the past years, since the temperatures of the Atlantic Ocean have been heating up consistently for the past years [30]. Teleconnection data from NOAA PSL spanned from January 1981 to December 2023, and NOAA OISST V2 data spanned from October 1981 to December 2023.

Table 1.
Brief description of teleconnection patterns and associated indices used in this work. The name column shows the names as they appear in the results. The data description and its availability can be found at https://psl.noaa.gov/data/climateindices/list/ (accessed on 10 March 2025).
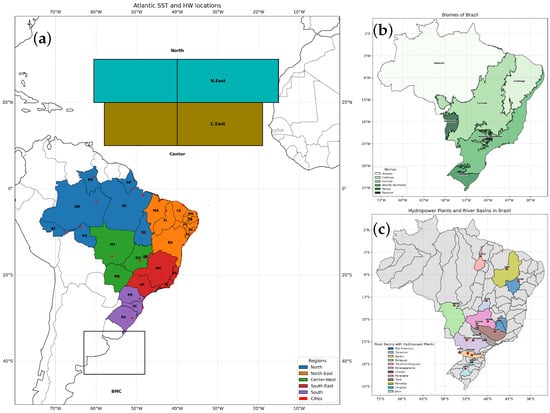
Figure 1.
(a) Map with the LAMMOC SST indices, SNA and BMC: North (SNA_N—60.55° W–15.1° W and 20° N–30° N), N.East (SNA_NE—40° W–15.1° W and 20° N–30° N), Center (SNA_C—58° W–19° W and 10° N–20° N), C.East (SNA_CE—40° W–19° W and 10° N–20° N), and BMC, named after the Brazil–Malvinas Confluence region (63° W–48° W and 33° S–43° S). Additionally, Brazil is colored according to its different regions. Red dots show the locations of the cities’ capitals used to calculate the Extreme Heatwave Index (XHW), and the states’ acronyms are also shown. (b) Location map of existing biomes in Brazil considered for the SPI calculation. (c) Brazilian map of the hydrographic basin and hydropower plants considered in this work.
2.2. Synoptic Indices
The SACZ evaluation methodology calculation was taken from Nielsen et al. [49]. Five areas (A, B, C, D, E) with 2° longitude wide, between 41° W and 43° W, and 2.5° latitude long, contained between 16° S and 28.5° S were determined considering the main position of the SACZ, as identified by Carvalho et al. [50,51]. The index calculation consists of using the daily averages of the following signature variables to calculate the SACZ index: zonal and meridional wind components at 200 and 850 hPa, vertical velocity omega and geopotential height at 500 hPa, horizontal wind divergence at 200 and 850 hPa, and relative vorticity at 200 hPa. The index is calculated for each region according to the average position of the SACZ in Southeast Brazil: AB, C, and DE. Table 2 describes the geographical limits of each region considered. The SACZ index was calculated using NCEP Reanalysis 2 data [52] from 1981 to 2023.

Table 2.
Geographical limits of each region for the South Atlantic Convergence Zone and atmospheric blockings, as well as the name in which they are found in the results.
The atmospheric blocking methodology calculation was taken from Cataldi [7]. Seven areas covering the central part of Brazil were defined based on observing the synoptic patterns identified here as atmospheric blockings and based on the 20-year experience of one of the authors as an operational weather forecaster. The areas are named and geographically located as in Table 2.
The atmospheric blocking index was calculated using ERA5 Reanalysis data [53,54] and used the vorticity at the 850 hPa and 500 hPa levels, as well as the geopotential anomaly at 500 hPa. The basis for calculating the geopotential anomaly was the period between 1981 and 2023. A blocking episode was considered whenever these atmospheric parameters had a positive value for three consecutive days, physically representing vorticity with a vertical structure at low and medium levels (at least between 850 and 500 hPa), and a descending air anomaly, represented by the positive geopotential anomaly. Whenever these positive values remained for over three days, the index was assigned a value of 1. This value was added over the month until one of the three parameters was no longer positive, returning the index value to zero. Thus, the number of days with blockings in each month of the year was calculated.
2.3. Hydrometeorological Indicators
The newly developed Extreme Heatwave Index (XHW) [55] was applied in this study due to its global applicability, covering the 26 state capitals and the Federal District of Brazil. Hence, the daily maximum of temperature at 2 m and hourly data of temperature at 2 m and relative humidity were used to calculate the index. The locations where XHW was calculated can be seen in Figure 1a and Table 3.

Table 3.
States’ names and acronyms and the city where the Extreme Heatwave Index (XHW) was calculated. The names found in the results are also shown. The location of the cities and states can be seen in Figure 1a.
To better understand the changes in rainfall patterns that lead to drier conditions in Brazil, we evaluated the correlation between the occurrence of atmospheric blockings and episodes of the SACZ with rainfall variability, particularly for droughts, in various biomes. The Standardized Precipitation Index (SPI) was used to characterize precipitation variability, presenting simple yet robust statistical insights into the distribution, duration, and frequency of rainfall surpluses (positive values) and droughts (negative values). The SPI values for 1, 6, and 12 months were calculated using rainfall data from the Brazilian Daily Weather Gridded Data (BR-DWGD) database [56], from 1981 to 2023. The BR-DWGD database incorporates observed rainfall data from more than 11,000 rain gauges and 1200 weather stations across Brazil, applying interpolation techniques to create a daily gridded meteorological dataset with spatial resolution of 0.1° × 0.1°. The dataset has been further validated for the SPI calculation [57]. The biomes distribution in Brazil can be seen in Figure 1b, and the SPI names in the results can be found in Table 4.

Table 4.
Biomes and horizons (in months) for the calculation of the Standardized Precipitation Index (SPI). The names found in the results are also shown. The biomes’ distribution in Brazil is shown in Figure 1b.
The natural flow data for the areas of the hydropower plants were provided by the National Electric System Operator (ONS), which commissioned studies on the natural flow series of the hydropower plants in the Brazilian basins. These series, covering the period from 1931 to 2024, were formalized by the National Electric Energy Agency (ANEEL) and are used in the planning and programming processes of the National Interconnected System (SIN). It should be noted that natural flow refers to the flow that would occur in a river section if there were no human interventions upstream, such as consumptive water use. Therefore, in this study, the natural flow was considered the observed flow, based on the hydropower plants.
Regarding the selection of plants, those of national relevance were chosen, meaning those that play crucial roles in energy production and the system’s operational security. In addition, the local importance of reservoirs was also considered, as they contribute to flood control and support multiple water uses, such as public water supply and livestock watering. Table 5 lists the hydropower plants analyzed in this study, specifying their names, abbreviations, and the river basins in which they are located. When considered together with Figure 1c, this information facilitates the understanding of their spatial distribution across the country.

Table 5.
River sub-basins and hydropower plants for the calculation of flow. The names found in the results are also shown. The basin and plant distributions are as follows in Figure 1c.
2.4. Statistical Framework
The Mann–Kendall test is a non-parametric statistical test used to detect trends in time series data without requiring the data to conform to any specific distribution. It is particularly useful for identifying monotonic trends in environmental and hydrological datasets. The test evaluates whether observations increase or decrease consistently over time and was applied using the Python library pymannkendall version 1.4.3. A significant result suggests the presence of a trend, while a non-significant result indicates no discernible trend. The Mann–Kendall test is robust against outliers and can handle missing values effectively [58].
Pearson’s correlation coefficient (r) is a statistical measure that evaluates the strength and direction of the linear relationship between two continuous variables. The coefficient ranges from −1 to +1, where values close to +1 (−1) indicate a strong positive (negative) linear relationship, and values around 0 suggest no linear correlation. Pearson’s r can be obtained through Equation (1). Pearson’s correlation assumes that the data follow a normal distribution and that the relationship between the variables is linear.
where
- n is the sample size;
- and are the individual sample points indexed with i;
- is the sample mean (analogously for ).
For this work, correlation matrices were produced to evaluate the influence of atmospheric and oceanic teleconnections on synoptic indices and of the synoptic indices on hydrometeorological indicators. Additionally, one- and two-month lag-correlations were also calculated between the main teleconnections and the synoptic indices to investigate a lag in their influence.
3. Results
3.1. Teleconnections, SACZ, and Blocking
The Mann–Kendall analysis tested significant trends in all time series and, together with correlations, provided a picture of how the relations are evolving over time. Figure 2 displays the distribution of teleconnection indices regarding their Tau strength, showing increasing or decreasing trends when p-value < 0.05 and no trends otherwise. The trend results show decreasing trends associated with Solar Flux (SF) and the Multivariate ENSO Index (MEI_V2). No significant trends were found in several indices associated with the Pacific Ocean SSTs, such as the Niños and ONI. On the other hand, we observe increasing trends in the Atlantic Ocean’s SSTs, such as the SNA and BMC indices. We also observe a strong increasing trend in the global air temperature index. Figure 3 displays the distribution of synoptic indices regarding their Tau strength, showing increasing or decreasing trends when p-value < 0.05 and no trends otherwise. We did not observe a clear trend in SACZ events for the synoptic indices, but we did notice an increase in atmospheric blockings as had also been reported qualitatively in [7].
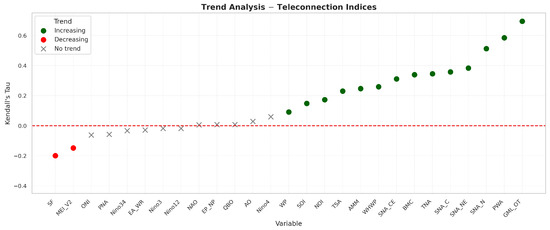
Figure 2.
Distribution of trend strength from Mann–Kendall analysis for the teleconnection indices evaluated. Increasing (decreasing) trends relate to Tau’s positive (negative) values and p-value < 0.05. Indices that show no trends are the ones with a p-value > 0.05.
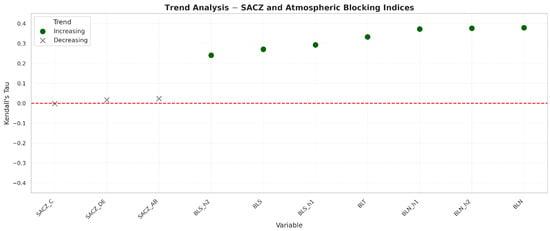
Figure 3.
Distribution of trend strength from Mann–Kendall analysis for the South Atlantic Convergence Zone (SACZ) and atmospheric blocking indices. Increasing (decreasing) trends relate to Tau’s positive (negative) values and p-value < 0.05. Indices that show no trends are the ones with a p-value > 0.05.
Correlations between teleconnection indices and SACZ and blocking events were analyzed, as well as the relationships between SACZ and blocking with streamflow, heatwaves, and the SPI, considering the wet period (October to April) from 1981 to 2023. The results are presented in correlation matrices.
Figure 4 displays the correlations between synoptic indices and teleconnection indices calculated without lag, allowing the identification of direct associations between the analyzed variables. At lag 0, blockings were most correlated with positive phases of all ENSO, WHWP, MEI_V2 and SNA, and BMC indices with values ranging from 0.37 to 0.58. Positive correlations with GML_OT stands out with a value of 0.7. SACZ on the other hand most correlated with negative phases of all ENSO and MEI_V2 indices with values ranging from −0.11 to −0.33. The SACZ AB position specifically correlated with the positive phase of BMC index with a value of 0.19.
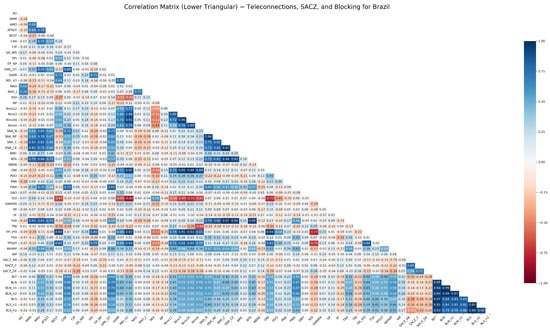
Figure 4.
Correlation matrix of SACZ, blocking events, and teleconnections in Brazil during the wet period (April to October), based on data from 1981 to 2023.
Subsequently, the correlations between the teleconnection indices, SACZ, and blockings were calculated, considering one- and two-month lags to evaluate the delayed effects of teleconnections on the synoptic indices. Figure 5 and Figure 6 display the values obtained for the 1-month and 2-month lags. For 1-lag and blockings, increased correlations were found with positive phases of all ENSO and MEI_V2 indices and decreases with positive phases of TNA, TSA, PWA, and GML_OT indices. Specifically for the south regions of blockings (BLS, BLS_h1 and BLS_h2), increases were found with positive phases of WHWP and SNA_CE indices. For the regions of AB and C of SACZ, increased correlation was found with the negative phase of MEI_V2 index, and decreased correlations with the negative phase of all ENSO and the positive phase of BMC index. For DE region, increases were found with the negative phases of Niño12 and Niño3 indices and the positive phase of BMC index.
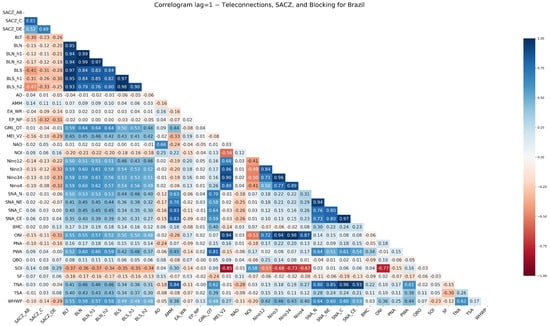
Figure 5.
Correlogram of the 1-month lag between SACZ, blocking events, and teleconnections in Brazil during the wet season (April to October), based on data from 1981 to 2023.
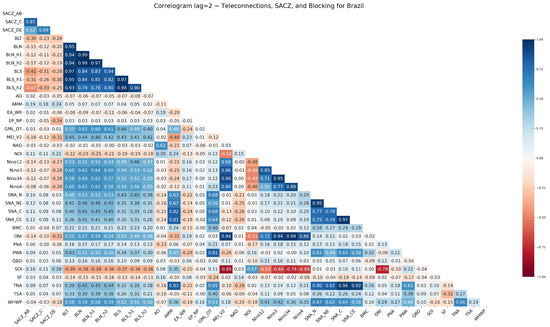
Figure 6.
Correlogram of the 2-month lag between SACZ, blocking events, and teleconnections in Brazil during the wet season (April to October), based on data from 1981 to 2023.
For 2-lag and blockings, further increase with WHWP index and decreases with TNA, TSA, PWA, and GML_OT continued. Additionally, an increase with the positive phase of Niño12 appears. For the total and north regions of blockings (BLT, BLN, BLN_h1, and BLN_h2), we observe an increase with the positive phase of Niño3, Niño34, and SNA_CE indices. On the other hand, for the south regions, we noticed a decrease with the positive phases of SNA_N, SNA_NE, and Niño34 indices. For SACZ, we observe an increase with the negative phase of MEI_V2, Niño3, Niño34, and Niño4 indices. Specifically, for the AB and C regions, we notice an increase with the positive phase of the SNA index. For the DE region, on the other hand, we notice a decrease with Niño12 index. These results serve as the foundation for the detailed analysis in Section 4, where the physical interpretations of the observed relationships are discussed, considering the associated atmospheric and oceanic mechanisms.
3.2. SACZ, Blockings, and Flow
Figure 7 displays the distribution of synoptic indices and river flow based on the strength of Kendall’s Tau coefficient, indicating increasing or decreasing trends when p < 0.05, and no significant trends otherwise. Among the synoptic indices, no consistent trend is observed for SACZ events; however, a notable increase in atmospheric blocking occurrences is evident.
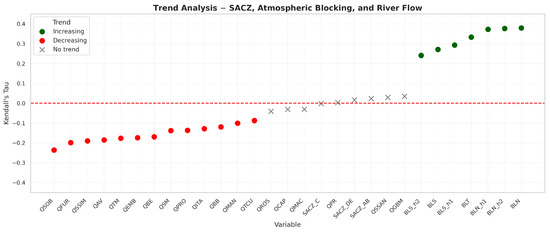
Figure 7.
Distribution of trend strength from Mann–Kendall analysis for the river flow, South Atlantic Convergence Zone (SACZ), and atmospheric blockings indices. Increasing (decreasing) trends relate to Tau’s positive (negative) values and p-value < 0.05. Indices that show no trends are the ones with a p-value > 0.05.
Atmospheric blocking contributes to temporally and spatially uneven precipitation and leads to higher evaporation losses. As a result, reduced water infiltration into the soil limits the amount available for both surface and subsurface runoff, ultimately leading to decreased river flow.
Therefore, another notable observation from the figure is the decreasing flow trend identified in most of the hydroelectric plants analyzed, with the exception of those located in the southern region of the country. This spatial pattern may indicate a southward shift in moisture transport, which could intensify drought conditions in the southeast and northeast regions.
Figure 8 illustrates the correlations between atmospheric variability and streamflow, where some significant associations suggest a link between atmospheric variability and the regional hydrological regime. For instance, SACZ events exhibited a positive correlation with streamflow in the central-southeast region, particularly within the Tietê, Grande, Paranaíba, São Francisco, Tocantins, and Paraguai river basins, while showing a negative correlation with streamflow in hydropower plants located in the southern region of the country.
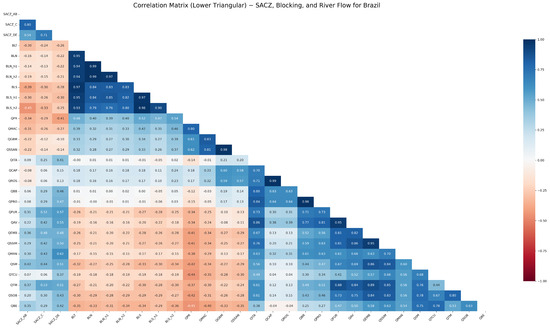
Figure 8.
Correlation matrix of SACZ, blocking events, and river flows in Brazil during the wet period (April to October), based on data from 1981 to 2023.
In contrast, atmospheric blocking events display an opposite pattern, being associated with reduced streamflow in the Grande, Paranaíba, Tocantins, and São Francisco rivers, while contributing to increased streamflow in the Jacuí, Uruguai, Iguaçu, and Paranapanema basins, all situated in the southern part of the country.
3.3. SACZ, Blockings, and SPI
Figure 9 displays the correlations between atmospheric variability and SPI values. Observed associations suggest a link between variability in the atmospheric systems and rainfall variability registered through the SPI. The correlation patterns between the SPI, SACZ, and blockings were stronger when observing SPI1, in comparison to SPI 6 and 12, understandably. The synoptic events evaluated here are short term events, therefore, their effects are greater in the SPI shorter time horizon. Even so, the correlation patterns observed for each biome remains similar across all evaluated time horizons. The SACZ events exhibited a positive correlation with SPI1 in Central Brazil, particularly in the Cerrado and Caatinga biomes, indicating their role in increasing precipitation in these areas. In contrast, a negative correlation was observed in the Pampa, suggesting that active SACZ episodes may be associated with reduced precipitation in Southern Brazil.
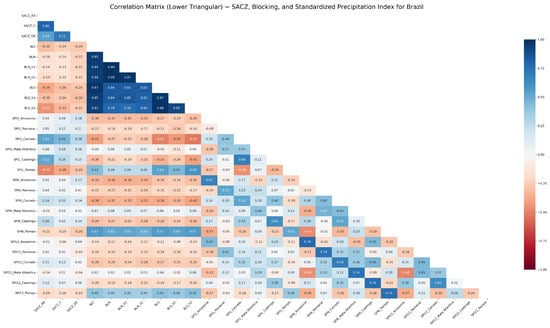
Figure 9.
Correlation matrix of SACZ, blocking events, and SPI index values in Brazil during the wet period (April to October), based on data from 1981 to 2023.
Blocking events showed an opposing pattern, negatively impacting SPI values in the Cerrado, Caatinga, Pantanal, and Amazon regions, reinforcing their influence on moisture reduction in these areas. In the Pampa biome, atmospheric blockings demonstrate to be positively correlated with the SPI, suggesting that the occurrence of such events may be linked to precipitation surpluses in South Brazil.
3.4. SACZ, Blockings, and Heatwaves
Figure 10 displays the distribution of extreme heatwaves regarding their Tau strength, showing increasing or decreasing trends when p-value < 0.05 and no trends otherwise. In addition to that, it should be noted that cities without recorded heatwave events were not included in the trend and correlation analyses.
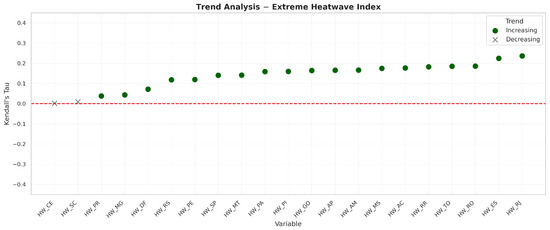
Figure 10.
Distribution of trend strength from Mann–Kendall analysis for Extreme Heatwave Index (XHW). Increasing (decreasing) trends relate to Tau’s positive (negative) values and p-value < 0.05. Indices that show no trends are the ones with a p-value > 0.05.
It is noteworthy that among the cities where heatwaves were observed, Fortaleza (HW_CE) and Florianópolis (HW_SC) were the only ones that did not exhibit a statistically significant increasing trend (p < 0.05) (Figure 10). All other Brazilian capitals showed an increasing trend, with particular emphasis on Rio de Janeiro (HW_RJ) and Vitória (HW_ES) in the southeast and the cities in the northern region of the country.
Figure 11 illustrates the correlation between heatwaves, SACZ, and blocking indices. Thus, SACZ exhibited statistically insignificant correlations, except in Rio de Janeiro (RJ), where a weak signal of 0.23 and 0.25 was observed. In contrast, blocking events showed significant positive correlations in specific regions, particularly in cities in the northeast and north of the country, reinforcing their influence on the intensification of extreme temperature events in these areas.
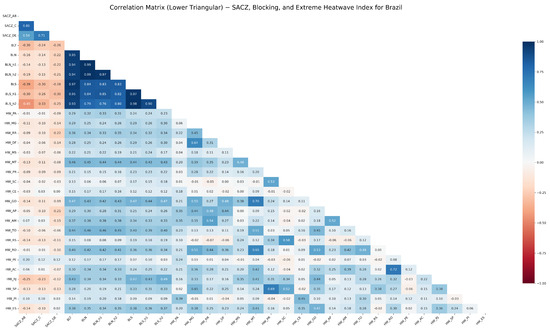
Figure 11.
Correlation matrix of SACZ, blocking events, and heatwaves in Brazil during the wet period (April to October), based on data from 1981 to 2023.
4. Discussion
4.1. Trend Evaluation
Trend analysis using the Mann–Kendall for all variables is shown in Figure 2, Figure 7, and Figure 10. The test indicated that the frequency or intensity of SACZ did not show statistically significant variation during the studied period, as the p-values were greater than 0.05, and the Tau coefficients were close to zero. Conversely, blocking events showed p-values close to zero, indicating a statistically significant increase in their frequency, as reported in [7]. This result reinforces the hypothesis that blocking events may reduce streamflow in the affected basins.
This behavior aligns with the values obtained for the streamflows of the evaluated power plants, where most basins showed a statistically significant downward trend, with p-values close to zero and negative Tau coefficients. Among the most significant declines, the Grande River basins (Furnas: −0.199; Água Vermelha: −0.185) and the São Francisco River basins (Sobradinho: −0.236; Três Marias: −0.176) stand out. These results may be related to drier periods, changes in land use, or the impact of atmospheric blocking events. It should also be noted that some basins did not show significant trends, such as those of the Uruguai, Jacuí, and Iguaçu Rivers, with p-values greater than 0.05. Thus, the results suggest that increased blocking events may reduce precipitation in the analyzed basins, contributing to the negative streamflow trend.
For the oceanic indices from the Atlantic and Pacific Oceans, increasing trends were observed in both the trend-inclusive and detrended series. It is important to note that practically all the indices related to the temperature of the Atlantic Ocean showed strong positive trends, which was not the case with some indices from the Pacific Ocean, such as the SST indices from the Niño regions. The Global Mean Land/Ocean Temperature notably showed a particularly strong association, with Tau coefficients around 0.7.
The results showed an increase in extreme heat events in most Brazilian cities, but did not show a significant trend in Florianópolis (SC), in the south and Fortaleza (CE), in the northeast. The analysis revealed that SPI values with higher significance are for the Pantanal biome, with a Tau value of around −0.3 for SPI6.
4.2. Teleconnections, SACZ, and Blocking
Initially, correlations between all teleconnection indices identified in this study and the synoptic patterns of blocking and SACZ were evaluated with no time lag (Lag 0). Subsequently, additional analyses were performed considering one-month (Lag 1) and two-month (Lag 2) time lags, focusing only on the teleconnection indices that showed the most significant initial correlations.
Correlations between SACZ and these oceanic indices often displayed an inverse relationship compared to those with blocking indices and were generally weaker. The highest correlations for the SACZ in its southern position (SACZ_DE) were observed with Western Hemisphere Warm Pool (). In contrast, blocking events exhibited stronger correlations, reaching a value of 0.7 between northern-located blocking and Global Mean Land/Ocean Temperature. These findings suggest that atmospheric blocking events are becoming increasingly frequent and intense in Central Brazil, closely mirroring the warming trend of the oceans.
For Lag 1, some correlations between teleconnection indices and SACZ or blocking events exhibited subtle variations. A slight decrease was observed in correlation values for the Global Mean Land/Ocean Temperature (GML_OT) and the Western Hemisphere Warm Pool (WHWP), with changes in only a few tenths. However, in the case of WHWP, correlations with blocking events (BLS, BLS_h1, and BLS_h2) increased. Conversely, specific indices showed an upward trend. For instance, the Arctic Oscillation (AO) exhibited slightly stronger correlations with blocking events (BLS and its subdivisions). Additionally, a change in the correlation sign was observed between AO and SACZ, although the magnitude of variation remained minor. The Multivariate ENSO Index (MEI_V2) also experienced a slight increase in correlations with SACZ and blocking events, such as in the case of BLT, where the correlation rose from 0.42 to 0.45.
The Southern Oscillation Index (SOI) similarly strengthened its correlations while maintaining its negative sign, as seen in its relationship with blocking events (BLT), where the correlation shifted from to . The Niño indices (Niño 1 + 2, Niño 3, Niño 3.4, and Niño 4) showed stronger correlations with blocking events, whereas the SNA_CE index exhibited a significant increase, particularly with BLS, BLS_h1, and BLS_h2. For Lag 2, the previously observed trends persisted or intensified. The correlation of GML_OT with blocking events continued to decline. As in the one-month lag scenario, WHWP maintained an increasing correlation with blocking events but not with SACZ. Meanwhile, the Atlantic North (SNA_N) index further weakened its correlation with blocking events, while showing a slight increase in its association with SACZ.
Correlation values for AO continued to rise across all SACZ and blocking configurations. Similarly, MEI_V2 sustained its upward trend in correlations. SOI exhibited a more pronounced increase, with variations reaching up to 0.13. The Niño indices also maintained their stronger correlations with blocking events. These findings indicate that as temporal lags are introduced, certain relationships between teleconnection indices and atmospheric patterns (SACZ and blocking events) become more pronounced. While some indices show declining correlations with blocking events, others, including AO, SOI, and the Niño indices, exhibit increasing correlations, suggesting a possible cumulative effect over time.
The correlation patterns identified in this study reveal a predominantly negative association between SACZ activity and positive phases of ENSO, particularly El Niño events, reinforcing the inverse relationship already highlighted in several previous studies. Ambrizzi et al. [24] and Cavalcanti [3] described how ENSO modifies the Walker and Hadley circulations, displacing the SACZ’s position and reducing its intensity during El Niño years. Reboita et al. [2] further clarify this mechanism, showing that such displacement results from changes in the upper-level divergence and low-level convergence patterns, weakening the moisture convergence over Southeast Brazil. Grimm et al. [5] add that the interaction between interannual (ENSO) and interdecadal (AMO, PDO) oscillations can amplify these effects, leading to multi-year droughts in SACZ-affected regions. On the same matter, Garreaud et al. [59] indicate the influence of ENSO variability in the temperature and rainfall in South America and Brazil in addition to other decadal and interannual variability such as the PDO and Antarctic Oscillation (AAO).
The negative correlations found between SACZ activity and ENSO indices, particularly with the Niño 3 and Niño 3.4 regions, are fully consistent with these previous findings and emphasize the sensitivity of SACZ dynamics to Pacific variability. These results suggest that years dominated by the negative phase of ENSO (La Niña conditions) may favor a more active SACZ, increasing precipitation over Central and Southeastern Brazil, while positive phases (El Niño years) are likely to suppress SACZ activity, contributing to drought conditions. These results are further supported by the understanding of broader climatic mechanisms that modulate SACZ variability. Several studies have shown that SST anomalies in the tropical South Atlantic Ocean can influence the position and intensity of the SACZ, potentially enhancing or suppressing precipitation over Central and Southeastern Brazil Rodrigues et al. [60] and Silva et al. [61]. These SST anomalies also favor the development of atmospheric blocking patterns, which can lead to persistent dry or wet spells in the region Nobre et al. [62]. Moreover, large-scale atmospheric circulations, such as the Walker and Hadley cells, play a crucial role in controlling moisture transport and convective activity over South America, influencing the occurrence of droughts and floods (Marengo et al. [63]). Together, these mechanisms provide a physical basis for the statistical associations observed in this study, reinforcing the relevance of both Pacific and Atlantic drivers in shaping SACZ variability and its impacts on Brazilian climate.
Although the time series evaluated (∼40 years) may be considered short regarding low-frequency phenomena and multidecadal variability, Enfield et al. [31] discuss the significant influence of ENSO on the Atlantic Ocean’s variability with maximum periods of 8–12 years. Knight et al. [64], on the other hand, using a 1400 time range, identified the AMO as a unforced quasi-periodic cycle of climate variability, which enables shorter time ranges to be used to evaluate synoptic correlations as conducted in the present work.
4.3. SACZ, Blockings, and Flow
The trend analysis indicated increased atmospheric blocking events, accompanied by decreased river flow across most of the observed basins. This suggests that the major reservoirs in the country’s central, southeast, and northeast regions are already experiencing reduced storage capacity due to current climatic conditions and are increasingly vulnerable to extreme events.
The analysis of streamflows, in turn, revealed a positive correlation between the SACZ and the flows of most of the basins studied. The highest correlations were observed in the Paraguay River (0.62—Manso power plant), the Tietê River (0.55 and 0.57—Água Vermelha and Furnas power plants, respectively), the Tocantins River (0.51—Serra da Mesa power plant), and the São Francisco River (0.53—Três Marias power plant). These results indicate that SACZ tends to increase streamflows in the central-southeast region of the country, promoting higher humidity levels in these areas.
However, SACZ showed a negative correlation with the power plants’ flow in the southeast and south of the country. Nevertheless, the correlations were not strong, with the highest recorded value being around −0.4 for the Passo Real power plant on the Jacuí River.
A positive correlation was observed regarding atmospheric blocking events with the streamflows in the Jacuí, Uruguai, Iguaçu, and Paranapanema river basins. The Jacuí and Uruguai river basins were particularly noteworthy, where the correlations reached around 0.5. Thus, blocking events exhibited a nearly opposite pattern to SACZ in the south region: As their frequency or intensity increases, the streamflows in these basins also tend to rise. This could be related to blocking events reinforcing moisture flows from the Amazon to the south, southeast, and central-west regions, favoring precipitation and increasing streamflows.
In contrast, blocking events negatively correlated with streamflows in the Grande, Paranaíba, Alto Paraguai, Alto Tocantins, São Francisco, Parnaíba, and Tocantins river basins. The highest values were recorded for the Boa Esperança, Sobradinho, Tucuruí, and Serra da Mesa power plants, with correlations close to -0.4. This suggests that blocking events may be diverting moisture, reducing precipitation, and intensifying drought periods in the southeast and northeast regions.
These findings are supported by Getirana, Libonati, and Cataldi [6], who investigated the water crisis in Brazil. The authors highlight that in 2021, unusually dry conditions in the south-central region led to significant reductions in water availability in rivers, lakes, soils, and aquifers compared to the 20-year seasonal average. As a result, major reservoirs dropped to below 20% of their total capacity.
The Drought Monitor [11], coordinated by the Brazilian National Water and Sanitation Agency (ANA), further illustrates the progression of drought conditions across the country over the past decade. The tool enables spatial tracking of drought severity, helping to identify the most affected regions.
In 2021, the same period analyzed by Getirana et al. [6], the Drought Monitor reported the persistence of intense drought in parts of the southeast region. In the south, below average rainfall contributed to the expansion of moderate and extreme drought in all three states, with notable severity in Paraná.
By 2023, the final year of our analysis period, the Drought Monitor showed a worsening of drought conditions in the northeast, southeast, and north regions, driven by negative rainfall anomalies. Many parts of the country experienced the spread of moderate to severe drought. In contrast, the south region remained relatively unaffected by drought during this time.
4.4. SACZ, Blockings, and Heatwaves
The correlations between SACZs and heatwaves tend to be negative across most of Brazil; however, since their magnitudes are close to zero, they can be considered statistically insignificant. This is because the SACZ is not associated with significant temperature gradients, resulting in little to no impact on the occurrence of heatwaves. Furthermore, as observed in [17], SACZ episodes tend to be more closely associated with negative phases of ENSO. In contrast, the heatwave index are generally associate with positive ENSO events, similarly to atmospheric blocking, which was also observed in the present study. Moreover, other factors such as the heat island effect well described by Oke [65] associated with increased urbanization, as well as changes in land use and land cover as documented in Pivello et al. [13] and Marengo et al. [16], may be contributing to disturbances in the correlation analysis, given that these are regional factors that also intensify heatwave events. Therefore, it is also essential to consider through urban land cover data, in future analysis, these effects in on hydrometeorological patterns and feedback processes, to better understand the potential discrepancies in heatwaves and SACZ indices and explore these interactions in detail.
Thus, atmospheric blockings show statistically significant positive correlations with heatwaves. For example, in the north region, Palmas (TO) stands out with a correlation of 0.46, while Manaus (AM) approaches a value of 0.38. These cities respond more effectively to blockings located in the north. Rio de Janeiro (RJ), in the southeast, and Goiania (GO), in the central-west, exhibit a correlation of 0.49 and 0.47, respectively, due to southern-located blockings. In the south, Curitiba (PR) is the most responsive to southern-located blockings with a correlation of 0.23. In the northeast, the values are generally low, with Teresina (PI) showing the highest correlation (0.20) for northern-located blocking. When evaluating these correlations, the importance in considering this spatial analysis is clear, as the location of atmospheric blockings implies different correlations with heatwaves across Brazil.
Hence, based on the observed trends and correlations between synoptic indices and heatwaves, it is suggested that the increase in blocking indices may be contributing to more frequent occurrences of extreme heatwave events. Moreover, other factors may be responsible for maintaining these events even in the absence of blocking systems, particularly during SACZ episodes, which may help explain the increasing frequency of extreme heatwaves across the territory.
4.5. SACZ, Blockings, and SPI
The Standardized Precipitation Index (SPI) was used to characterize precipitation variability in the Brazilian biomes, and the correlation between SACZ, atmospheric blockings, and SPI 1, 6, and 12 was investigated. The analysis revealed the correlation values are more expressive where SPI1 is regarded, with SPI6 and SPI12 showing similar, yet lower, correlation values.
SACZ showed a positive correlation to SPI values in the Cerrado and Caatinga biomes, in Central–Northeastern Brazil, with the highest correlations occurring when SACZ is active in AB position (SPI1: 0.53—Cerrado and 0.52—Caatinga). Conversely, in the Pampa biome, in the south, a strong negative correlation was observed, with the lowest value of −0.49 to SPI1, when SACZ-AB is active. Across all other biomes, the correlation values are low to statistically insignificant in all analyzed SPI timescales. The observed pattern indicates that SACZ occurrences tend to create precipitation surpluses in Central and Northeastern Brazil, inhibiting rainfall in the south, particularly when SACZ-AB events happen.
Analyzing atmospheric blocking events, the correlation to the SPI exhibits a strong pattern in all evaluated time scales and regions, emphasizing SPI1 and SPI6. A significant positive influence was observed in the Pampa biome across all atmospheric blocking positions and in all evaluated time scales, particularly SPI 1 (0.59) and SPI6 (0.57), suggesting that blockings, regardless of their position, incur rainfall surpluses in South Brazil. Blockings also show a consistent negative influence in Cerrado, Caatinga, Pantanal, and Amazonia (central, northern, and northeastern regions). In Cerrado and Caatinga, the highest correlation values were observed on SPI1 (−0.53 and −0.41, respectively), whilst Amazonia and Pantanal recorded lower, yet significant, correlation values. These observations suggest atmospheric blockings have an inhibiting effect on precipitation, creating drier conditions, which are concerning for wildfire hazard, in Central Brazil and also in Southern Amazonia [12]. The Mata Atlantica biome, occurring along the Atlantic Coast of Brazil, exhibited weak to no correlation between the hydrometeorological indexes investigated. This biome, located near Brazil’s coastal regions, often experiences precipitation even during atmospheric blocking events. This is primarily due to the influence of the South Atlantic Subtropical High (SASH), which can intensify moisture transport towards the continent under such conditions. As a result, persistent rainfall may occur in this biome despite synoptic conditions that typically inhibit precipitation [2].
As discussed by Runge et al. [66], correlation and regression methods still are the most commonly used tools for analyzing relationships in the Earth system analysis data. We justify the use of these techniques to obtain an initial understanding of how different teleconnection patterns and atmospheric systems can interact. While we acknowledge that correlation alone does not imply causation and may not account for potential confounding factors, it sets the stage for a more comprehensive and multivariate analysis between these interactions.
5. Conclusions
This study quantified the influence of two key synoptic systems, atmospheric blocking events and the South Atlantic Convergence Zone (SACZ), on Brazil’s hydrometeorological dynamics. Atmospheric blocking events were found to exert a predominantly negative impact on the country’s hydrological regime, except for the southern region, where their influence was positive. Blocking events were strongly associated with heatwave indices, drought conditions as measured by the SPI, and reductions in natural streamflow. This is particularly important because water shortages can have widespread impacts in Brazil, especially in the agricultural and energy sectors. Reduced water availability can lead to decreased agricultural productivity, contributing commodity prices and negatively affecting country’s gross domestic product (GDP). Another significant consequence is the disruptions in hydropower generation, which causes an increase in electricity prices, as hydropower accounts for more than 50% of the Brazilian energy matrix and directly impacts the cost of living of the population. Furthermore, it is important to note that consecutive drought events may lead several municipalities to face the risk of imminent water rationing. A critical and concerning finding of this study is the positive correlation identified between the increased frequency of atmospheric blocking events and nearly all teleconnection patterns, particularly those associated with the newly developed Subtropical North Atlantic (SNA) index. This region has shown a significant warming trend in sea surface temperatures, as confirmed by trend analysis. Such warming is likely driven by anthropogenic climate change, raising concerns about a persistent scenario of elevated ocean temperatures and, consequently, a potential increase in the frequency of atmospheric blocking events in the coming decades. Notably, the SNA index also exhibited a positive correlation with the positive phase of ENSO, suggesting that Atlantic and Pacific warming may intensify water scarcity and increase the frequency and severity of heatwaves across much of Brazil. The southern region, however, may experience opposite conditions. According to the results, these adverse impacts might be partially mitigated only during La Niña events (the cold phase of ENSO). In contrast, the SACZ exhibited a predominantly positive influence on the hydrological regime of most river basins in Brazil, except those in the southern region. The negative correlation between SACZ activity and the majority of ENSO indices underscores the importance of La Niña in supporting SACZ occurrence, which in turn plays a key role in maintaining rainfall regularity, particularly in the southeast and central-west regions. We acknowledge not having exhausted this subject since more conclusions can be drawn from different analyses, such as spatial correlation between synoptic phenomena and large-scale fields and the use of SST composite maps related to droughts and heatwaves.
Furthermore, to advance the understanding of the physical and synoptic mechanisms underlying the observed correlations, future studies should consider applying causal inference methods, such as Granger causality analysis. While these methods come with their own challenges in application and interpretation, they offer valuable potential for identifying cause-and-effect relationships within complex climate systems.
Author Contributions
Conceptualization, M.C.; methodology, A.G., L.S., L.d.F.A., P.E.C., and V.L.V.G.; software, A.G., L.S., L.d.F.A., M.C., P.E.C., and V.L.V.G.; formal analysis, A.G., L.S., L.d.F.A., M.C., P.E.C., and V.L.V.G.; resources, M.C.; data curation, A.G., L.S., L.d.F.A., P.E.C., and V.L.V.G.; writing—original draft preparation, A.G., L.S., L.d.F.A., M.C., P.E.C., and V.L.V.G.; writing—review and editing, A.G., L.S., L.d.F.A., M.C., P.E.C., and V.L.V.G.; visualization, L.S., L.d.F.A., P.E.C., and V.L.V.G.; supervision, M.C.; funding acquisition, M.C. All authors have read and agreed to the published version of the manuscript.
Funding
This research was funded by the Conselho Nacional de Desenvolvimento Científico e Tecnológico (CNPq) grant number 406871/2022-1.
Institutional Review Board Statement
Not applicable.
Informed Consent Statement
Not applicable.
Data Availability Statement
NCEP-NCAR Reanalysis 1 and 2 data provided by the NOAA PSL, Boulder, Colorado, USA, from their website at https://psl.noaa.gov (accessed on 10 March 2025). NOAA OI SST V2 High Resolution Dataset data provided by the NOAA PSL, Boulder, Colorado, USA, from their website at https://psl.noaa.gov (accessed on 13 March 2025). ECMWF-ERA5 Reanalysis data are available at https://cds.climate.copernicus.eu/datasets/reanalysis-era5-pressure-levels?tab=overview (accessed on 25 February 2025). BR-DWGD database is freely available at https://github.com/AlexandreCandidoXavier/BR-DWGD/tree/main or https://sites.google.com/site/alexandrecandidoxavierufes/brazilian-daily-weather-gridded-data (accessed on 2 March 2025).
Acknowledgments
The authors would like to thank the Brazilian National Council for Scientific and Technological Development (CNPq).
Conflicts of Interest
The authors declare no conflicts of interest.
References
- Delforge, D.; Wathelet, V.; Below, R.; Sofia, C.L.; Tonnelier, M.; van Loenhout, J.A.; Speybroeck, N. EM-DAT: The Emergency Events Database. Preprint 2023. [Google Scholar] [CrossRef]
- Reboita, M.S.; Gan, M.A.; Rocha, R.P.d.; Ambrizzi, T. Regimes de precipitação na América do Sul: Uma revisão bibliográfica. Rev. Bras. Meteorol. 2010, 25, 185–204. [Google Scholar] [CrossRef]
- Cavalcanti, I.F.A. Large scale and synoptic features associated with extreme precipitation over South America: A review and case studies for the first decade of the 21st century. Atmos. Res. 2012, 118, 27–40. [Google Scholar] [CrossRef]
- Marengo, J.A.; Torres, R.R.; Alves, L.M. Drought in Northeast Brazil—Past, present, and future. Theor. Appl. Climatol. 2017, 129, 1189–1200. [Google Scholar] [CrossRef]
- Grimm, A.; Scortegagna Almeida, A.; Beneti, C.; Leite, E. The combined effect of climate oscillations in producing extremes: The 2020 drought in southern Brazil. RBRH 2020, 25, e48. [Google Scholar] [CrossRef]
- Getirana, A.; Libonati, R.; Cataldi, M. Brazil is in water crisis—It needs a drought plan. Nature 2021, 600, 218–220. [Google Scholar] [CrossRef]
- Cataldi, M. Creation and Assessment of an Index for Atmospheric Blockings in Brazil’s Central Region. Adv. Hydrol. Meteorol. 2024, 1. [Google Scholar] [CrossRef]
- da Fonseca Aguiar, L.; Cataldi, M. Social and environmental vulnerability in Southeast Brazil associated with the South Atlantic Convergence Zone. Nat. Hazards 2021, 109, 2423–2437. [Google Scholar] [CrossRef]
- Empresa de Pesquisa Energética. Summary report of the National Energy Balance 2024: Base year 2023; EPE: Rio de Janeiro, Brazil, 2024. Available online: https://www.epe.gov.br/sites-pt/publicacoes-dados-abertos/publicacoes/PublicacoesArquivos/publicacao-819/topico-715/BEN_S%C3%ADntese_2024_PT.pdf (accessed on 28 November 2022).
- Vasquez-Arroyo, E.; da Silva, F.; Santos, A.; Cordeiro, D.; Marengo, J.A.; Lucena, A.F.P. Climate impacts in the Brazilian energy security: Analysis of observed events and adaptation options. Sustain. Debate 2020, 11, 157–176. Available online: https://doaj.org/article/c85c186b133a4800b485294a05c1abde (accessed on 8 May 2025). [CrossRef]
- Agência Nacional de Águas e Saneamento Básico (ANA). Monitor de Secas—Mapa Interativo. 2025. Available online: http://monitordesecas.ana.gov.br/ (accessed on 28 March 2025).
- European Geosciences Union (EGU). Standard Precipitation Index (SPI) Applied to Socioeconomic Pathway Scenarios (SSPs) as a Tool to Map the Distribution of Droughts and Potential Fire Hazard Areas in Brazil in the Face of Climate Change; EGU General Assembly: Vienna, Austria, 2024. [Google Scholar] [CrossRef]
- Pivello, V.R.; Vieira, I.; Christianini, A.V.; Ribeiro, D.B.; da Silva Menezes, L.; Berlinck, C.N.; Melo, F.P.; Marengo, J.A.; Tornquist, C.G.; Tomas, W.M.; et al. Understanding Brazil’s catastrophic fires: Causes, consequences and policy needed to prevent future tragedies. Perspect. Ecol. Conserv. 2021, 19, 233–255. [Google Scholar] [CrossRef]
- Richardson, D.; Black, A.; Irving, D.; Matear, R.; Monselesan, D.; Risbey, J.; Squire, D.; Tozer, C. Global increase in wildfire potential from compound fire weather and drought. npj Clim. Atmos. Sci. 2022, 5, 23. [Google Scholar] [CrossRef]
- de Oliveira-Júnior, J.F.; Mendes, D.; Correia Filho, W.L.F.; da Silva Junior, C.A.; de Gois, G.; da Rosa Ferraz Jardim, A.M.; da Silva, M.V.; Lyra, G.B.; Teodoro, P.E.; Pimentel, L.C.G.; et al. Fire foci in South America: Impact and causes, fire hazard and future scenarios. J. South Am. Earth Sci. 2021, 112, 103623. [Google Scholar] [CrossRef]
- Marengo, J.A.; Souza, C.M.; Thonicke, K.; Burton, C.; Halladay, K.; Betts, R.A.; Alves, L.M.; Soares, W.R. Changes in Climate and Land Use Over the Amazon Region: Current and Future Variability and Trends. Front. Earth Sci. 2018, 6, 228. [Google Scholar] [CrossRef]
- Galves, V.L.; Cataldi, M.; Alcoforado Sphaier, L.; da Fonseca Aguiar, L. Temporal Evolution and Intensification of Extreme Heatwaves in Brazil’s capitals: Insights from the XHW Index (1950–2024). In Proceedings of the EGU General Assembly 2025, Vienna, Austria, 27 April–2 May 2025. EGU25-12454. [Google Scholar] [CrossRef]
- Foroni, M.; Salvioli, G.; Rielli, R.; Goldoni, C.A.; Orlandi, G.; Sajani, S.Z.; Guerzoni, A.; Maccaferri, C.; Daya, G.; Mussi, C. A Retrospective Study on Heat-Related Mortality in an Elderly Population During the 2003 Heat Wave in Modena, Italy: The Argento Project. J. Gerontol. Ser. A Biol. Sci. Med. Sci. 2007, 62, 647–651. [Google Scholar] [CrossRef]
- Palinkas, L.A.; Hurlburt, M.S.; Fernandez, C.; De Leon, J.; Yu, K.; Salinas, E.; Garcia, E.; Johnston, J.; Rahman, M.M.; Silva, S.J. Vulnerable, Resilient, or Both? A Qualitative Study of Adaptation Resources and Behaviors to Heat Waves and Health Outcomes of Low-Income Residents of Urban Heat Islands. Int. J. Environ. Res. Public Health 2022, 19, 11090. [Google Scholar] [CrossRef]
- Ebi, K.L.; Vanos, J.; Baldwin, J.W.; Bell, J.E.; Hondula, D.M.; Errett, N.A.; Hayes, K.; Reid, C.E.; Saha, S.; Spector, J. Extreme Weather and Climate Change: Population Health and Health System Implications. Annu. Rev. Public Health 2021, 42, 293–315. [Google Scholar] [CrossRef]
- Pörtner, H.O.; Roberts, D.; Adams, H.; Adelekan, I.; Adler, C.; Adrian, R.; Aldunce, P.; Ali, E.; Ara Begum, R.; Bednar-Friedl, B.; et al. Technical Summary. In Climate Change 2022: Impacts, Adaptation and Vulnerability. Contribution of Working Group II to the Sixth Assessment Report of the Intergovernmental Panel on Climate Change; Pörtner, H.O., Roberts, D., Poloczanska, E., Mintenbeck, K., Tignor, M., Alegría, A., Craig, M., Langsdorf, S., Löschke, S., Möller, V., et al., Eds.; Cambridge University Press: Cambridge, UK; New York, NY, USA, 2022; pp. 37–118. [Google Scholar] [CrossRef]
- Wallace, J.M.; Gutzler, D.S. Teleconnections in the Geopotential Height Field during the Northern Hemisphere Winter. Mon. Weather. Rev. 1981, 109, 784–812. [Google Scholar] [CrossRef]
- Pezzi, L.; Cavalcanti, I. The relative importance of ENSO and Tropical Atlantic sea surface temperature anomalies for seasonal precipitation over South America. Clim. Dyn. 2001, 17, 205–212. [Google Scholar] [CrossRef]
- Ambrizzi, T.; de Souza, E.B.; Pulwarty, R.S. The Hadley and Walker Regional Circulations and Associated ENSO Impacts on South American Seasonal Rainfall. In The Hadley Circulation: Present, Past and Future; Diaz, H.F., Bradley, R.S., Eds.; Springer: Dordrecht, The Netherlands, 2004; pp. 203–235. [Google Scholar] [CrossRef]
- Cataldi, M.; Assad, L.; Torres-Junior, A.R.; Alves, J.L.D. Estudo da influência das anomalias da tsm do atlântico sul extratropical na região da confluência brasil malvinas no regime hidrometeorológico de verão do sul e sudeste do brasil. Rev. Bras. Meteorol. 2010, 25, 513–524. [Google Scholar] [CrossRef]
- Reboita, M.; Ambrizzi, T.; Machado Crespo, N.; Dutra, L.; Ferreira, G.; Rehbein, A.; Drumond, A.; Rocha, R.; Souza, C. Impacts of teleconnection patterns on South America climate. Ann. N. Y. Acad. Sci. 2021, 1504, 116–153. [Google Scholar] [CrossRef]
- Feng, S.; Hu, Q.; Oglesby, R.J. Influence of Atlantic sea surface temperatures on persistent drought in North America. Clim. Dyn. 2011, 37, 569–586. [Google Scholar] [CrossRef]
- Kushnir, Y.; Seager, R.; Ting, M.; Naik, N.; Nakamura, J. Mechanisms of Tropical Atlantic SST Influence on North American Precipitation Variability. J. Clim. 2010, 23, 5610–5628. [Google Scholar] [CrossRef]
- Huang, B.; Liu, C.; Banzon, V.; Freeman, E.; Graham, G.; Hankins, B.; Smith, T.; Zhang, H.M. Improvements of the Daily Optimum Interpolation Sea Surface Temperature (DOISST) Version 2.1. J. Clim. 2021, 34, 2923–2939. [Google Scholar] [CrossRef]
- Kuhlbrodt, T.; Swaminathan, R.; Ceppi, P.; Wilder, T. A Glimpse into the Future: The 2023 Ocean Temperature and Sea Ice Extremes in the Context of Longer-Term Climate Change. Bull. Am. Meteorol. Soc. 2024, 105, E474–E485. [Google Scholar] [CrossRef]
- Enfield, D.; Mestas-Nunez, A.; Mayer, D.; Cid-Serrano, L. How ubiquitous is the dipole relationship in the tropical Atlantic Sea Surface Temperatures? J. Geophys. Res. 1999, 104, 7841–7848. [Google Scholar] [CrossRef]
- Wang, C.; Enfield, D. The Tropical Western Hemisphere Warm Pool. Geophys. Res. Lett. 2001, 28, 1635–1638. [Google Scholar] [CrossRef]
- Schwing, F.; Murphree, T.; Green, P. The Northern Oscillation Index (NOI): A new climate index for the northeast Pacific. Prog. Oceanogr. 2002, 53, 115–139. [Google Scholar] [CrossRef]
- Trenberth, K.; Hurrell, J. Decadal Atmosphere-Ocean Variations in the Pacific. Clim. Dyn. 1994, 9, 303–319. [Google Scholar] [CrossRef]
- Hoerling, M.; Eischeid, J.; Perlwitz, J. Regional Precipitation Trends: Distinguishing Natural Variability from Anthropogenic Forcing. J. Clim. 2010, 23, 2131–2145. [Google Scholar] [CrossRef]
- Chiang, J.; Vimont, D. Analogous Pacific and Atlantic Meridional Modes of Tropical Atmosphere–Ocean Variability. J. Clim. 2004, 17, 4143–4158. [Google Scholar] [CrossRef]
- Christy, J.R.; Spencer, R.W.; Braswell, W.D. MSU Tropospheric Temperatures: Dataset Construction and Radiosonde Comparisons. J. Atmos. Ocean. Technol. 2000, 17, 1153–1170. [Google Scholar] [CrossRef]
- Hansen, J.; Ruedy, R.; Sato, M.; Reynolds, R. Global surface air temperature in 1995: Return to pre-Pinatubo level. Geophys. Res. Lett. 1996, 23, 1665–1668. [Google Scholar] [CrossRef]
- Hansen, J.; Ruedy, R.; Glascoe, J.; Sato, M. GISS analysis of surface temperature change. J. Geophys. Res. 1999, 104, 30997–31022. [Google Scholar] [CrossRef]
- Hansen, J.; Sato, M.; Glascoe, J.; Ruedy, R. A common-sense climate index: Is climate changing noticeably? Proc. Natl. Acad. Sci. USA 1998, 95, 4113–4120. [Google Scholar] [CrossRef]
- Hansen, J.; Ruedy, R.; Sato, M.; Imhoff, M.; Lawrence, W.; Easterling, D.; Peterson, T.; Karl, T. A closer look at United States and global surface temperature change. J. Geophys. Res. Atmos. 2001, 106, 23947–23963. [Google Scholar] [CrossRef]
- IPCC. Climate Change 2001: The Scientific Basis. Contribution of Working Group I to the Third Assessment Report of the Intergovernmental Panel on Climate Change; Houghton, J.T., Ding, Y., Griggs, D.J., Noguer, M., der Linden, P.J.v., Dai, X., Maskell, K., Johnson, C.A., Eds.; Cambridge University Press: Cambridge, UK; New York, NY, USA, 2001; Volume 1, 881p. [Google Scholar]
- Council, N.R. Reconciling Observations of Global Temperature Change; Houghton, J.T., Ding, Y., Griggs, D.J., Noguer, M., der Linden, P.J.v., Dai, X., Maskell, K., Johnson, C.A., Eds.; The National Academies Press: Washington, DC, USA, 2000. [Google Scholar] [CrossRef]
- Peterson, T.C.; Vose, R.S. An Overview of the Global Historical Climatology Network Temperature Database. Bull. Am. Meteorol. Soc. 1997, 78, 2837–2850. [Google Scholar] [CrossRef]
- Hadley Centre for Climate Prediction and Research. Hadley Centre Global Sea Ice and Sea Surface Temperature (HadISST). Research Data Archive at the National Center for Atmospheric Research, Computational and Information Systems Laboratory. 2000. Available online: https://rda.ucar.edu/datasets/d277003/ (accessed on 26 March 2025).
- Reynolds, R.W.; Rayner, N.A.; Smith, T.M.; Stokes, D.C.; Wang, W. An Improved In Situ and Satellite SST Analysis for Climate. J. Clim. 2002, 15, 1609–1625. [Google Scholar] [CrossRef]
- Reynolds, R.W.; Smith, T.M. Improved Global Sea Surface Temperature Analyses Using Optimum Interpolation. J. Clim. 1994, 7, 929–948. [Google Scholar] [CrossRef]
- Smith, T.M.; Reynolds, R.W.; Livezey, R.E.; Stokes, D.C. Reconstruction of Historical Sea Surface Temperatures Using Empirical Orthogonal Functions. J. Clim. 1996, 9, 1403–1420. [Google Scholar] [CrossRef]
- Nielsen, D.M.; Belem, A.; Marton, E.; Cataldi, M. Dynamics-based regression models for the South Atlantic Convergence Zone. Clim. Dyn. 2019, 52, 5527–5553. [Google Scholar] [CrossRef]
- Carvalho, L.M.V.; Jones, C.; Liebmann, B. Extreme Precipitation Events in Southeastern South America and Large-Scale Convective Patterns in the South Atlantic Convergence Zone. J. Clim. 2002, 15, 2377–2394. [Google Scholar] [CrossRef]
- Carvalho, L.M.V.; Jones, C.; Liebmann, B. The South Atlantic Convergence Zone: Intensity, Form, Persistence, and Relationships with Intraseasonal to Interannual Activity and Extreme Rainfall. J. Clim. 2004, 17, 88–108. [Google Scholar] [CrossRef]
- Kalnay, E.; Kanamitsu, M.; Kistler, R.; Collins, W.; Deaven, D.; Gandin, L.; Iredell, M.; Saha, S.; White, G.; Woollen, J.; et al. The NCEP/NCAR 40-Year Reanalysis Project. Bull. Am. Meteorol. Soc. 1996, 77, 437–470. [Google Scholar] [CrossRef]
- Hersbach, H.; Bell, B.; Berrisford, P.; Biavati, G.; Horányi, A.; Muñoz Sabater, J.; Nicolas, J.; Peubey, C.; Radu, R.; Rozum, I.; et al. ERA5 Hourly Data on Pressure Levels from 1940 to Present. Copernicus Climate Change Service (C3S) Climate Data Store (CDS). 2023. Available online: https://cds.climate.copernicus.eu/datasets/reanalysis-era5-pressure-levels?tab=overview (accessed on 10 November 2024).
- Hersbach, H.; Bell, B.; Berrisford, P.; Hirahara, S.; Horányi, A.; Muñoz-Sabater, J.; Nicolas, J.; Peubey, C.; Radu, R.; Schepers, D.; et al. The ERA5 global reanalysis. Q. J. R. Meteorol. Soc. 2020, 146, 1999–2049. [Google Scholar] [CrossRef]
- Cataldi, M.; Galves, V.L.V.; Sphaier, L.A.; Garnés-Morales, G.; Gallardo, V.; Párraga, L.M.; Montávez, J.P.; Jimenez-Guerrero, P. Development of a New Generalizable, Multivariate, and Physical-Body-Response-Based Extreme Heatwave Index. Atmosphere 2024, 15, 1541. [Google Scholar] [CrossRef]
- Xavier, A.C.; Scanlon, B.R.; King, C.W.; Alves, A.I. New improved Brazilian daily weather gridded data (1961–2020). Int. J. Climatol. 2022, 42, 8390–8404. [Google Scholar] [CrossRef]
- Tomasella, J.; Cunha, A.P.M.; Simões, P.A.; Zeri, M. Assessment of trends, variability and impacts of droughts across Brazil over the period 1980–2019. Nat. Hazards 2023, 116, 2173–2190. [Google Scholar] [CrossRef]
- Wang, F.; Shao, W.; Yu, H.; Kan, G.; He, X.; Zhang, D.; Ren, M.; Wang, G. Re-evaluation of the Power of the Mann–Kendall Test for Detecting Monotonic Trends in Hydrometeorological Time Series. Front. Earth Sci. 2020, 8, 14. [Google Scholar] [CrossRef]
- Garreaud, R.D.; Vuille, M.; Compagnucci, R.; Marengo, J. Present-day South American climate. Palaeogeogr. Palaeoclimatol. Palaeoecol. 2009, 281, 180–195. [Google Scholar] [CrossRef]
- Leyba, I.M.; Solman, S.A.; Saraceno, M.; Martinez, J.A.; Dominguez, F. The South Atlantic Ocean as a moisture source region and its relation with precipitation in South America. Clim. Dyn. 2023, 61, 1741–1756. [Google Scholar] [CrossRef]
- Silva, G.A.; Ambrizzi, T.; Reboita, M.S.; Carvalho, L.M. Teleconnections between tropical Atlantic SST and SACZ variability. Int. J. Climatol. 2021, 41, 2339–2355. [Google Scholar] [CrossRef]
- Nobre, C.A.; Sellers, P.J.; Shukla, J. Amazon deforestation and regional climate change. Geophys. Res. Lett. 2006, 33, L11709. [Google Scholar] [CrossRef]
- Marengo, J.A.; Tomasella, J.; Alves, L.M.; Soares, W.R.; Rodriguez, D.A. Recent extremes of drought and flooding in Amazonia: Vulnerabilities and human adaptation. Wiley Interdiscip. Rev. Clim. Change 2012, 3, 659–681. [Google Scholar] [CrossRef]
- Knight, J.R.; Allan, R.J.; Folland, C.K.; Vellinga, M.; Mann, M.E. A signature of persistent natural thermohaline circulation cycles in observed climate. Geophys. Res. Lett. 2005, 32, L20708. [Google Scholar] [CrossRef]
- Oke, T.R. The energetic basis of the urban heat island. Q. J. R. Meteorol. Soc. 1982, 108, 1–24. [Google Scholar] [CrossRef]
- Runge, J.; Bathiany, S.; Bollt, E.; Camps-Valls, G.; Coumou, D.; Deyle, E.; Glymour, C.; Kretschmer, M.; Mahecha, M.; Muñoz, J.; et al. Inferring causation from time series in Earth system sciences. Nat. Commun. 2019, 10, 2553. [Google Scholar] [CrossRef]
Disclaimer/Publisher’s Note: The statements, opinions and data contained in all publications are solely those of the individual author(s) and contributor(s) and not of MDPI and/or the editor(s). MDPI and/or the editor(s) disclaim responsibility for any injury to people or property resulting from any ideas, methods, instructions or products referred to in the content. |
© 2025 by the authors. Licensee MDPI, Basel, Switzerland. This article is an open access article distributed under the terms and conditions of the Creative Commons Attribution (CC BY) license (https://creativecommons.org/licenses/by/4.0/).